Article

An XGBoost-Based Intrusion Detection Framework with Interpretability Analysis for IoT Networks

School of Computer Science and Engineering, University of Electronic Science and Technology of China, Chengdu 611731, China
*
Author to whom correspondence should be addressed.
Appl. Sci. 2026, 16(2), 980; https://doi.org/10.3390/app16020980
Submission received: 8 December 2025 / Revised: 14 January 2026 / Accepted: 16 January 2026 / Published: 18 January 2026

Abstract

With the rapid development of the Internet of Things (IoT) and Industrial IoT (IIoT), Network Intrusion Detection Systems (NIDSs) play a critical role in securing modern networked environments. Despite advances in multi-class intrusion detection, existing approaches face challenges from high-dimensional heterogeneous traffic data, severe class imbalance, and limited interpretability of high-performance “black-box” models. To address these issues, this study presents an XGBoost-based NIDSs integrating optimized strategies for feature dimensionality reduction and class balancing, alongside SHAP-based interpretability analysis. Feature reduction is investigated by comparing selection methods that preserve original features with generation methods that create transformed features, aiming to balance detection performance and computational efficiency. Class balancing techniques are evaluated to improve minority-class detection, particularly reducing false negatives for rare attack types. SHAP analysis reveals the model’s decision process and key feature contributions. The experimental results demonstrate that the method enhances multi-class detection performance while providing interpretability and computational efficiency, highlighting its potential for practical deployment in IoT security scenarios.

1. Introduction

The rapid expansion of the Internet of Things (IoT) has significantly transformed domains such as critical infrastructure, healthcare, and industrial control systems (ICSs) [1]. As billions of heterogeneous devices become interconnected, the resulting complexity and resource constraints introduce substantial security risks, making IoT environments frequent targets for cyber threats including Denial-of-Service (DoS) attacks, malware, and man-in-the-middle (MITM) attacks [2]. To counter these threats, Intrusion Detection Systems (IDSs) have been widely adopted as a fundamental security mechanism to monitor system or network activities and detect potential malicious behaviors. Depending on the data source and monitoring scope, IDSs can be broadly classified into host-based IDSs (HIDSs), which analyze host-level logs or system activities, and network-based IDSs (NIDSs), which inspect network traffic flows to identify suspicious patterns [3]. Given the distributed nature, heterogeneous devices, and limited computational resources of IoT environments, NIDSs are generally more suitable than HIDSs for providing scalable and non-intrusive security protection. In this context, Network Intrusion Detection Systems (NIDSs) serve as an essential component of IoT security by continuously analyzing network traffic to identify malicious activities. Traditional NIDS, typically categorized as misuse-based, anomaly-based, or hybrid approaches, provide complementary detection capabilities but often suffer from limited detection accuracy, particularly against emerging or zero-day attacks.
To address these limitations, artificial intelligence techniques, particularly machine learning (ML) and deep learning (DL), have been increasingly incorporated into NIDSs to support the automated extraction of behavioral patterns from large-scale data. Despite their advantages, the performance of such models depends heavily on the quality and representativeness of the underlying datasets. Classical datasets such as KDD Cup 99 [4] and NSL-KDD [5] have become outdated and no longer reflect modern IoT attack behaviors. To bridge this gap, the ToN-IoT dataset [6] was introduced. It integrates telemetry from IoT devices, Linux and Windows hosts, system logs, and network traffic, thereby covering diverse attack types such as DoS, DDoS, ransomware, MITM, and XSS. Although ToN-IoT provides a more realistic benchmark, high-dimensional redundant features and severe class imbalance still pose significant challenges. These issues increase computational cost, bias models toward majority-class predictions, and contribute to frequent missed detections of rare but critical attacks. Moreover, many existing ML- and DL-based NIDSs focus primarily on performance improvements while providing limited insight into model decisions, resulting in insufficient transparency for practical security analysis.
These challenges have motivated extensive research on dimensionality reduction and class imbalance mitigation. Methods such as Principal Component Analysis (PCA) [7] and meta-heuristic algorithms, including Genetic Algorithms (GA) [8] are commonly applied to remove redundant features, while oversampling techniques such as SMOTE [9] are widely used to enhance the representation of minority classes. However, feature extraction methods such as Principal Component Analysis (PCA) transform original attributes into new components, which may alter the interpretability of the resulting feature space. Meta-heuristic feature selection approaches, including Genetic Algorithms (GA), often introduce considerable computational overhead, limiting their practicality in large-scale IoT environments. Furthermore, simple oversampling techniques may provide limited improvement in highly imbalanced multi-class scenarios, where enhancing minority-class performance can come with trade-offs in majority-class detection. These limitations hinder the applicability of existing methods in modern IoT intrusion detection.
To address the aforementioned limitations, this study proposes a comprehensive and explainable XGBoost-based intrusion detection framework. The framework is distinctively designed not merely as an application of existing tools, but as a systematic pipeline for multi-objective optimization, integrating semantically-aware feature engineering, security-centric class balancing, and in-depth, domain-validated interpretability. It is tailored to achieve robust and transparent multi-class intrusion detection on the ToN-IoT dataset, with a focused aim of reducing critical false negatives for minority-class attacks.
The main contributions of this work are as follows:
  • A Deployment-Oriented Comparative Framework for Feature Dimensionality Reduction. While many studies apply dimensionality reduction, few systematically contrast the implications of feature selection (preserving original semantics and sparsity) versus feature extraction (creating transformed, dense features) for IoT NIDSs. This study provides an empirical analysis that reveals a key practical insight: for tree-based models like XGBoost, feature selection offers a superior trade-off, maintaining high accuracy while ensuring lower computational overhead and inherent interpretability—a crucial advantage for resource-constrained IoT environments.
  • A Security-First Evaluation of Class-Balancing Strategies for Minority Threat Mitigation. To address the severe class imbalance across attack categories in ToN-IoT, this study conducts a systematic comparison of multiple class-balancing techniques, including SMOTE, ROS, Borderline-SMOTE, ADASYN, and SMOTE-Tomek. Moving beyond aggregate performance metrics, the evaluation explicitly emphasizes minority-class detection capability, with a particular focus on reducing false negatives for rare but high-risk attacks. The results demonstrate that the selected balancing strategy achieves superior minority-class recall while preserving overall detection accuracy, thereby effectively mitigating missed detections of critical yet infrequent threats and providing actionable guidance for security-oriented strategy selection.
  • A Deep, Attack-Specific Interpretability Analysis Validated Against Domain Knowledge. Transcending generic feature importance rankings, this work introduces a semantic validation protocol using SHAP. We conduct class-specific explanatory analysis, grouping attacks by their inherent behavioral logic (e.g., volumetric, protocol-state-based). This approach verifies that the model’s decision logic aligns with known attack mechanisms, thereby bridging the gap between model explanations and cybersecurity domain expertise and transforming XAI from a visualization tool into a means for model auditing and trust substantiation.
The structure of this paper is as follows. Section 2 reviews related work, focusing on three key aspects for IoT NIDS: feature dimensionality reduction, class imbalance mitigation, and model interpretability. A notable gap in current research is its predominant focus on performance optimization through complex models, often at the expense of interpretability. This lack of transparency hinders practical adoption, as security analysts cannot verify the model’s decisions, thereby undermining trust and impeding deployment in environments requiring accountability. To address this, Section 3 details the methodology of our proposed framework, encompassing the ToN-IoT dataset, data preprocessing, feature engineering, class balancing, XGBoost model construction, and SHAP-based interpretability analysis. Subsequently, Section 4 presents the experimental setup and results, including evaluation metrics and comparative analyses of binary and multi-class detection performance across different dimensionality reduction and balancing strategies. Finally, Section 5 concludes with key findings, limitations, and future research directions.

2. Related Work

The concept of an intrusion detection system (IDSs) was first introduced by Anderson in 1980 [10], aiming to continuously monitor system or network activities to detect and report security threats. As networks have grown and attacks diversified, IDS designs have evolved into two main categories: host-based (HIDSs) and network-based (NIDSs). HIDSs inspect host logs or system calls to identify malicious activity, whereas NIDSs analyze network traffic flows to provide broader protection. NIDSs offer wider coverage, greater deployment flexibility, and lower resource consumption than HIDS, making it more suitable for IoT and other high-traffic environments. Therefore, this study focuses on NIDS methods.
Depending on their detection logic, existing NIDSs approaches fall into three categories: misuse-based, anomaly-based, and hybrid detection [11]. However, building an effective IoT-oriented NIDSs is fundamentally constrained by three key challenges: the computational burden imposed by high-dimensional traffic data, the risk of minority attack under-detection caused by severe class imbalance, and the trust deficit arising from the opaque decision-making of high-performance yet complex models. This section provides a systematic review and critical analysis of the prevailing technical approaches developed to address these challenges.

2.1. Feature Selection and Feature Extraction for Dimensionality Reduction

High-dimensional traffic features constitute a major bottleneck affecting both performance and deployability of IoT-oriented network intrusion detection systems (NIDSs) [12]. To address this challenge, dimensionality reduction techniques are widely adopted and can be broadly divided into feature selection and feature extraction. Feature selection aims to identify a subset of the most discriminative features while preserving their original semantic meaning and interpretability [13]. Depending on the evaluation criteria, existing methods fall into two major categories. The first category relies on statistical metrics that are independent of downstream classifiers and directly assess the association between features and target classes. For example, Amusaidi et al. [14] proposed a mutual-information-based filtering method combined with support vector machines, achieving high accuracy and reduced model complexity on datasets such as KDD Cup 99. Similarly, Moustafa et al. [15] employed correlation analysis to construct a multivariate anomaly detection mechanism that significantly improved detection performance. Building upon these supervised filter-based techniques, the Minimum Redundancy Maximum Relevance (MRMR) algorithm [16] has recently demonstrated strong performance in Industrial IoT (IIoT) scenarios, achieving near-perfect accuracy with a small set of core features, thereby significantly reducing model complexity while maintaining high precision. Disha et al. [17] used Gini impurity–based random forest ranking to select features on the ToN-IoT dataset, but their study did not fully consider the computational cost of the selection process. The second category integrates feature selection into the classifier training loop by using model performance as the evaluation objective. Representative approaches include heuristic searches such as genetic algorithms [18,19] and particle swarm optimization [20], which can reduce error rates at the expense of considerable computational overhead, limiting their suitability for resource-constrained IoT environments. To enhance efficiency in resource-limited nodes, variants like the Improved Dynamic Sticky Binary PSO (IDSBPSO) [21] have been introduced to specifically lower processing costs and shorten prediction timeframes.
Unlike feature selection, feature extraction transforms the original high-dimensional input into a new, compact feature space through mathematical mapping [22]. Both linear and nonlinear methods have been explored for NIDSs. Principal Component Analysis (PCA), a classical linear technique, has been widely applied—for instance, Xu et al. [23] used PCA to reduce the dimensionality of the KDD99 dataset, enhancing the performance of SVM-based classifiers. More recently, Aboluhammadi et al. [24] validated the effectiveness of PCA on modern datasets such as UNSW-NB15 [25]. Nonlinear methods based on neural-network autoencoders (AEs) have gained traction due to their strong representation capability. Khan et al. [26] adopted deep stacked AEs to model temporal patterns, while Zhou et al. [27] and Popoola et al. [28] introduced variational LSTM and bidirectional LSTM autoencoder variants to better handle imbalance and high dimensionality. However, AE-based techniques typically incur higher computational cost than statistical methods such as PCA. As demonstrated by Li et al. [29], this is primarily due to the high computational complexity derived from their deep neural network (DNN) architectures and iterative optimization processes. To alleviate this limitation, several studies have explored lightweight designs and structural optimization strategies for autoencoder-based feature extraction. For instance, Dao et al. [30] proposed a network pruning algorithm specifically designed to construct lightweight AE structures for efficient feature extraction. Furthermore, D’Angelo et al. [31] developed an integrated autoencoder architecture that combines convolutional and recurrent neural networks to automatically extract spatial and temporal features.
Overall, feature selection and feature extraction constitute two complementary pathways to cope with high dimensionality: the former retains original feature semantics, whereas the latter constructs new low-dimensional representations. Prior studies have revealed a critical trade-off between these paradigms: while feature extraction methods often achieve superior detection performance under aggressive dimensionality reduction, feature selection becomes increasingly advantageous as the feature count grows, offering significantly reduced training and inference time. Together, these approaches provide essential support for building efficient and lightweight IoT intrusion detection systems.

2.2. Learning with Imbalanced Traffic for Minority Attack Detection

Severe class imbalance—where normal traffic and various attack categories appear with highly unequal frequencies—remains a primary cause of low recall for critical minority attacks such as MITM and ransomware. From an algorithmic perspective, cost-sensitive learning adjusts the model’s decision bias by assigning different misclassification penalties to different classes. On the data level, resampling remains a straightforward solution. Among them, SMOTE [32] is widely used for balancing class distributions through synthetic oversampling of minority classes via linear interpolation. However, SMOTE may introduce limited-diversity or even noisy samples in highly imbalanced multi-class settings, which can improve minority recall at the cost of degrading majority-class accuracy.
To overcome limitations of single-method strategies, hybrid approaches have emerged. For example, Belarbi et al. [33] demonstrated that combining SMOTE with Random Under-Sampling (RUS) can effectively stabilize the F1-score for underrepresented attacks in the CICIDS2017 dataset. For instance, Chalichalamala et al. [34] introduced the Logistic Regression Ensemble Classifier (LREC), which integrates AdaBoost and Random Forest while utilizing ADASYN to handle severe imbalance. Their ensemble approach demonstrated effective performance on imbalanced IoT benchmarks like BoT-IoT and ToN-IoT, highlighting the value of combining algorithm-level and data-level strategies.
Recent research has also pivoted toward generative architectures to synthesize higher-quality minority data. Liu et al. [35] proposed a multi-stage data augmentation framework based on Variational Autoencoders (VAE) and Conditional VAEs (CVAE), highlighting that CVAEs can generate synthetic samples that better align with the original data distribution, contributing to an improvement in the Macro-F1-score of GRU-based models by 5.32%. Furthermore, Kandhro et al. [36] presented a Generative Adversarial Network (GAN) based framework designed to collaboratively train on multiple datasets. By leveraging cross-domain knowledge to capture latent data patterns that traditional resampling methods often overlook, this approach significantly enhanced the detection rates of rare attacks, such as BruteForce and specific DoS variants.
Collectively, these studies show that no single balancing strategy can reliably improve minority-class detection without compromising overall accuracy. A more refined sampling scheme is required—one that aligns with the optimized feature space and the characteristics of the selected classifier.

2.3. High-Performance Modeling and Decision Explainability in NIDS

To counter increasingly sophisticated and unknown threats, the research community has progressively adopted more complex models. This evolution has seen a shift from traditional machine learning algorithms, such as decision trees [37] and logistic regression [38], to deep learning–based approaches. For instance, Saba et al. [39] utilized Convolutional Neural Networks (CNNs) for holistic traffic analysis, achieving a remarkable 99.51% accuracy on the NID dataset. Alalmaie et al. [40] integrated pre-trained autoencoders with an attention-based CNN-BiLSTM architecture to effectively model global contextual dependencies and temporal interactions. Beyond independent flow-level analysis, Lo et al. [41] introduced E-GraphSAGE, a Graph Neural Network (GNN) framework designed to extract topological patterns for identifying distributed IoT attacks that traditional models frequently miss. From a deployment perspective, Gyamfi et al. [42] proposed a distributed framework combining lightweight on-device OI-SVDD detection with deeper server-side AS-ELM analysis. To stabilize detection performance across diverse traffic patterns, ensemble-based strategies have emerged, such as the DIS-IoT stacking ensemble developed by Lazzarini et al. [43], which aggregates multiple deep learning architectures. To address the persistent challenge of zero-day threats, Soltani et al. [44] developed DOC++, a deep novelty-based framework capable of clustering previously unseen attack behaviors to support adaptable security monitoring.
Despite significant performance gains achieved by advanced NIDSs models, most of these approaches remain inherently opaque, operating as black-box systems with limited interpretability. This lack of transparency poses a critical challenge for Security Operations Centers (SOC), where analysts require clear reasoning behind alerts to support incident response, forensic investigation, and regulatory compliance. Consequently, the growing reliance on complex models has exposed a fundamental gap between detection accuracy and explainability, motivating increasing research interest in interpretable and explainable intrusion detection systems.
To bridge this “semantic gap” between performance and transparency, recent research has integrated Explainable AI (XAI) techniques to provide human-understandable justifications for model predictions. For instance, Arreche et al. [45] introduced the E-XAI framework, which systematically evaluates the quality of SHAP and LIME based on six algorithm-centric metrics, including stability, robustness, and computational efficiency. Dasari et al. [46] proposed the XAINIDS framework, utilizing a stacked ensemble of Extra Trees and XGBoost while applying LIME and SHAP to reveal the specific contributions of port alive duration and packet counts in identifying overflows. Furthermore, Nugraha et al. [47] developed a versatile framework that couples ANOVA with global SHAP scores for a two-stage feature reduction, ensuring the consistency of explanations through SHAP-LIME cross-validation in 5G control-plane detection. Additionally, Kalakoti et al. [48] employed an LSTM model for alert prioritization and benchmarked four XAI methods—SHAP, LIME, Integrated Gradients, and DeepLIFT—against domain expertise from SOC analysts to validate the reliability of feature attributions.
Despite these advancements, a notable gap remains in the literature. While existing studies often evaluate XAI methods primarily through technical reliability metrics—such as faithfulness, sensitivity, and stability—less attention has been paid to the semantic validation of attack-specific behavioral logic. In particular, many works emphasize whether an explainer is technically consistent but do not explicitly examine whether the resulting explanations align with the intrinsic domain knowledge of different attack categories. Motivated by this limitation, this work moves beyond global or class-agnostic feature rankings to analyze class-specific feature dependency patterns, aiming to assess whether model decision mechanisms are consistent with the technical nature of diverse cyber threats.

3. Experimental Methodology

3.1. Overall Framework

This paper proposes an intrusion detection method tailored for IoT network traffic. The core idea is to construct a highly discriminative, low-redundancy, and explainable feature space by optimizing data representation and class structure. We assume that different attack types in IoT environments exhibit distinguishable patterns in statistical behavior, protocol usage, and connection states, whereas normal traffic maintains relatively stable distribution characteristics. Based on this assumption, we design a collaborative detection framework that integrates one-hot feature encoding, systematic feature dimensionality reduction, class-balancing strategies, an XGBoost-based multiclass model, and SHAP-based interpretability analysis, enabling accurate and explainable multi-class intrusion identification.
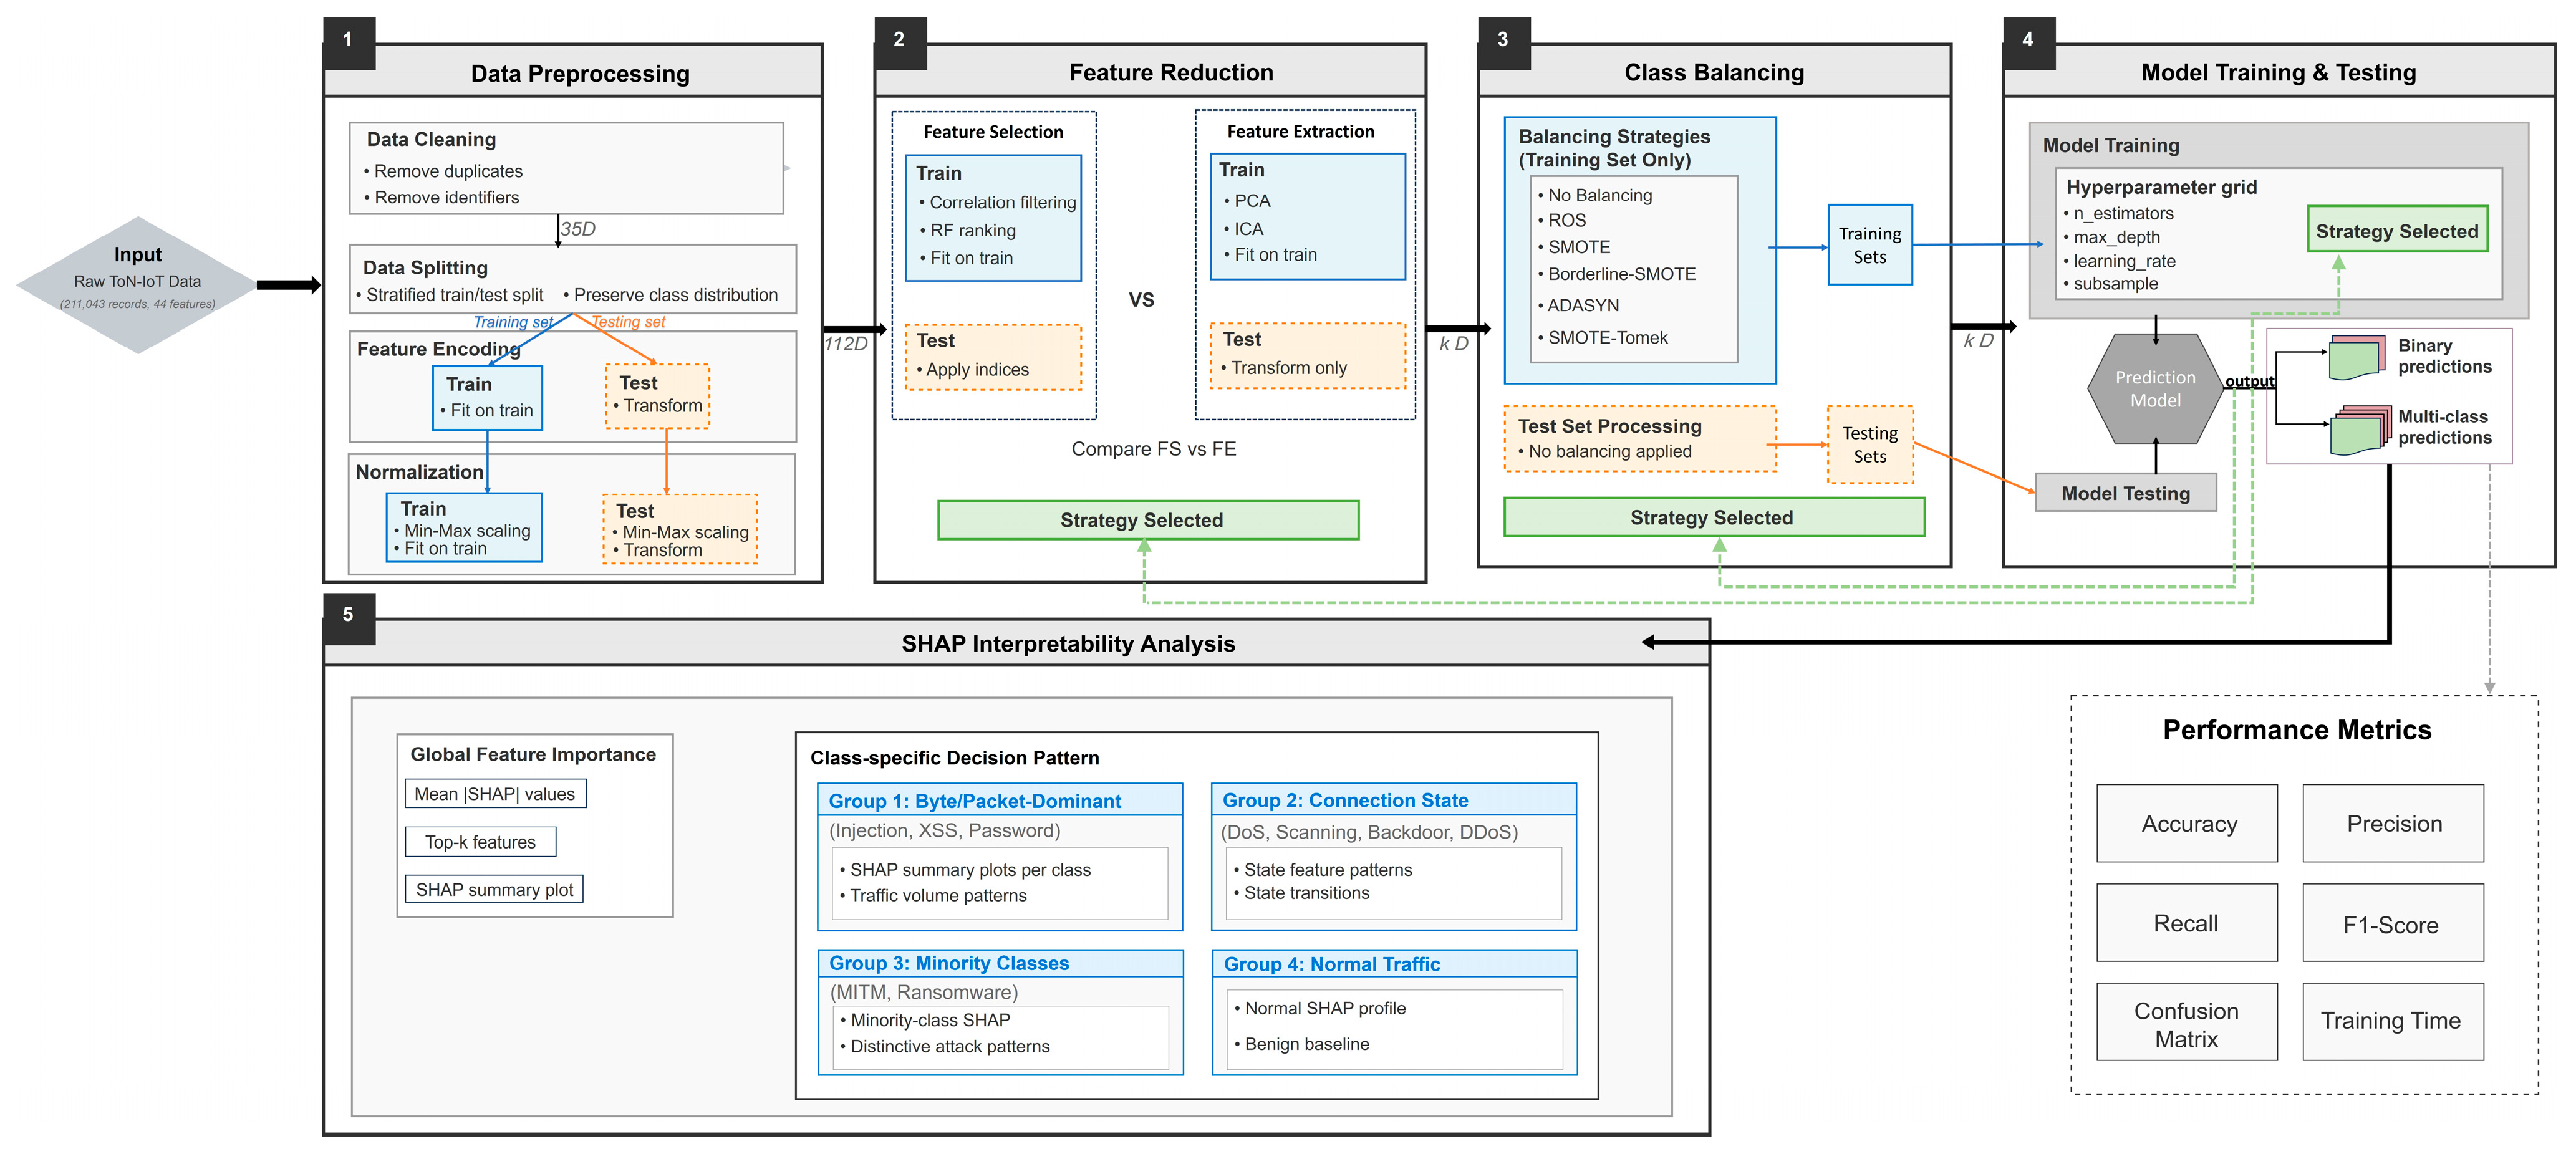
The overall workflow of the proposed framework is illustrated in Figure 1, and the intrusion detection method consists of five stages: data preprocessing and feature encoding, feature dimensionality reduction, class balancing, model training, and model evaluation with interpretability analysis. First, the raw network traffic data are cleaned and deduplicated, and categorical features are transformed via One-Hot encoding and normalized to form a unified feature space. Next, systematic feature dimensionality reduction experiments are conducted, employing feature selection and feature generation methods to construct a low-redundancy, high-discriminative feature representation. Subsequently, various class balancing strategies are evaluated on the reduced feature set to mitigate the impact of imbalanced data distributions on model performance. Based on the optimized features and balanced data from the preceding stages, an XGBoost multi-class classifier is trained to identify both normal traffic and multiple types of attacks. Finally, multi-class and binary classification performance evaluations, along with SHAP interpretability analysis, are conducted to reveal the model’s decision mechanisms and key feature contributions, providing end-to-end interpretability from feature engineering to prediction outcomes. Through this staged design, the framework systematically optimizes feature representation and class balancing, significantly enhancing the detection of minority-class attacks while improving the model’s interpretability and practical applicability.

3.2. Dataset Description

The ToN-IoT dataset used in this study was developed by UNSW Canberra, Australia [6], to provide a testing platform for AI-based network security research. The dataset simulates a three-layer IoT/IIoT network architecture consisting of edge, fog, and cloud layers, collecting heterogeneous data including network traffic, OS logs (Windows/Linux), and IoT service telemetry. The dataset is provided in both raw network traffic (PCAP) and feature-extracted CSV formats. In this study, only the network traffic portion (train_test_network.csv) is used, containing 211,043 network connection records, each with 44 dimensions, including 42 feature attributes and 2 label attributes (label for binary classification and type for multi-class classification).
As shown in Table 1, the dataset classifies network flows into normal traffic and nine attack subtypes: Scanning, Denial-of-Service (DoS), Distributed DoS (DDoS), Ransomware, Backdoor, Injection, Cross-Site Scripting (XSS), Password Cracking, and Man-in-the-Middle (MITM). Each category contains the following number of samples: Normal traffic with 50,000 samples, and each attack category with 20,000 samples, except MITM with 1043 samples.
As shown in Table 2, the features encompass connection information (e.g., protocol type, service type, connection state, duration, and bytes), statistical metrics (e.g., number of packets, total IP bytes), DNS-related attributes (e.g., query name, class, type, and response code), SSL session information (e.g., version, cipher suite, session flags, and certificate details), HTTP protocol details (e.g., request method, version, status code, URI, request/response body lengths, user agent, and MIME types), and violation or anomaly indicators (e.g., anomaly name, additional information, and notice flag). The two label columns are used for binary (label) and multi-class (type) classification tasks.

3.3. Data Preprocessing

During the data cleaning stage, to prevent potential overfitting caused by highly unique features, source and destination IP addresses (src_ip, dst_ip), source and destination ports (src_port, dst_port), DNS query strings (dns_query), HTTP URIs (http_uri), HTTP user agents (http_user_agent), and SSL certificate information (ssl_subject, ssl_issuer) were removed. After excluding these identifiable attributes, the feature set was reduced from the original 44 columns to 35, including 33 modeling features and 2 label attributes (label and type). In addition, duplicate connection records in the raw dataset were removed to reduce computational overhead and prevent the model from learning redundant patterns.
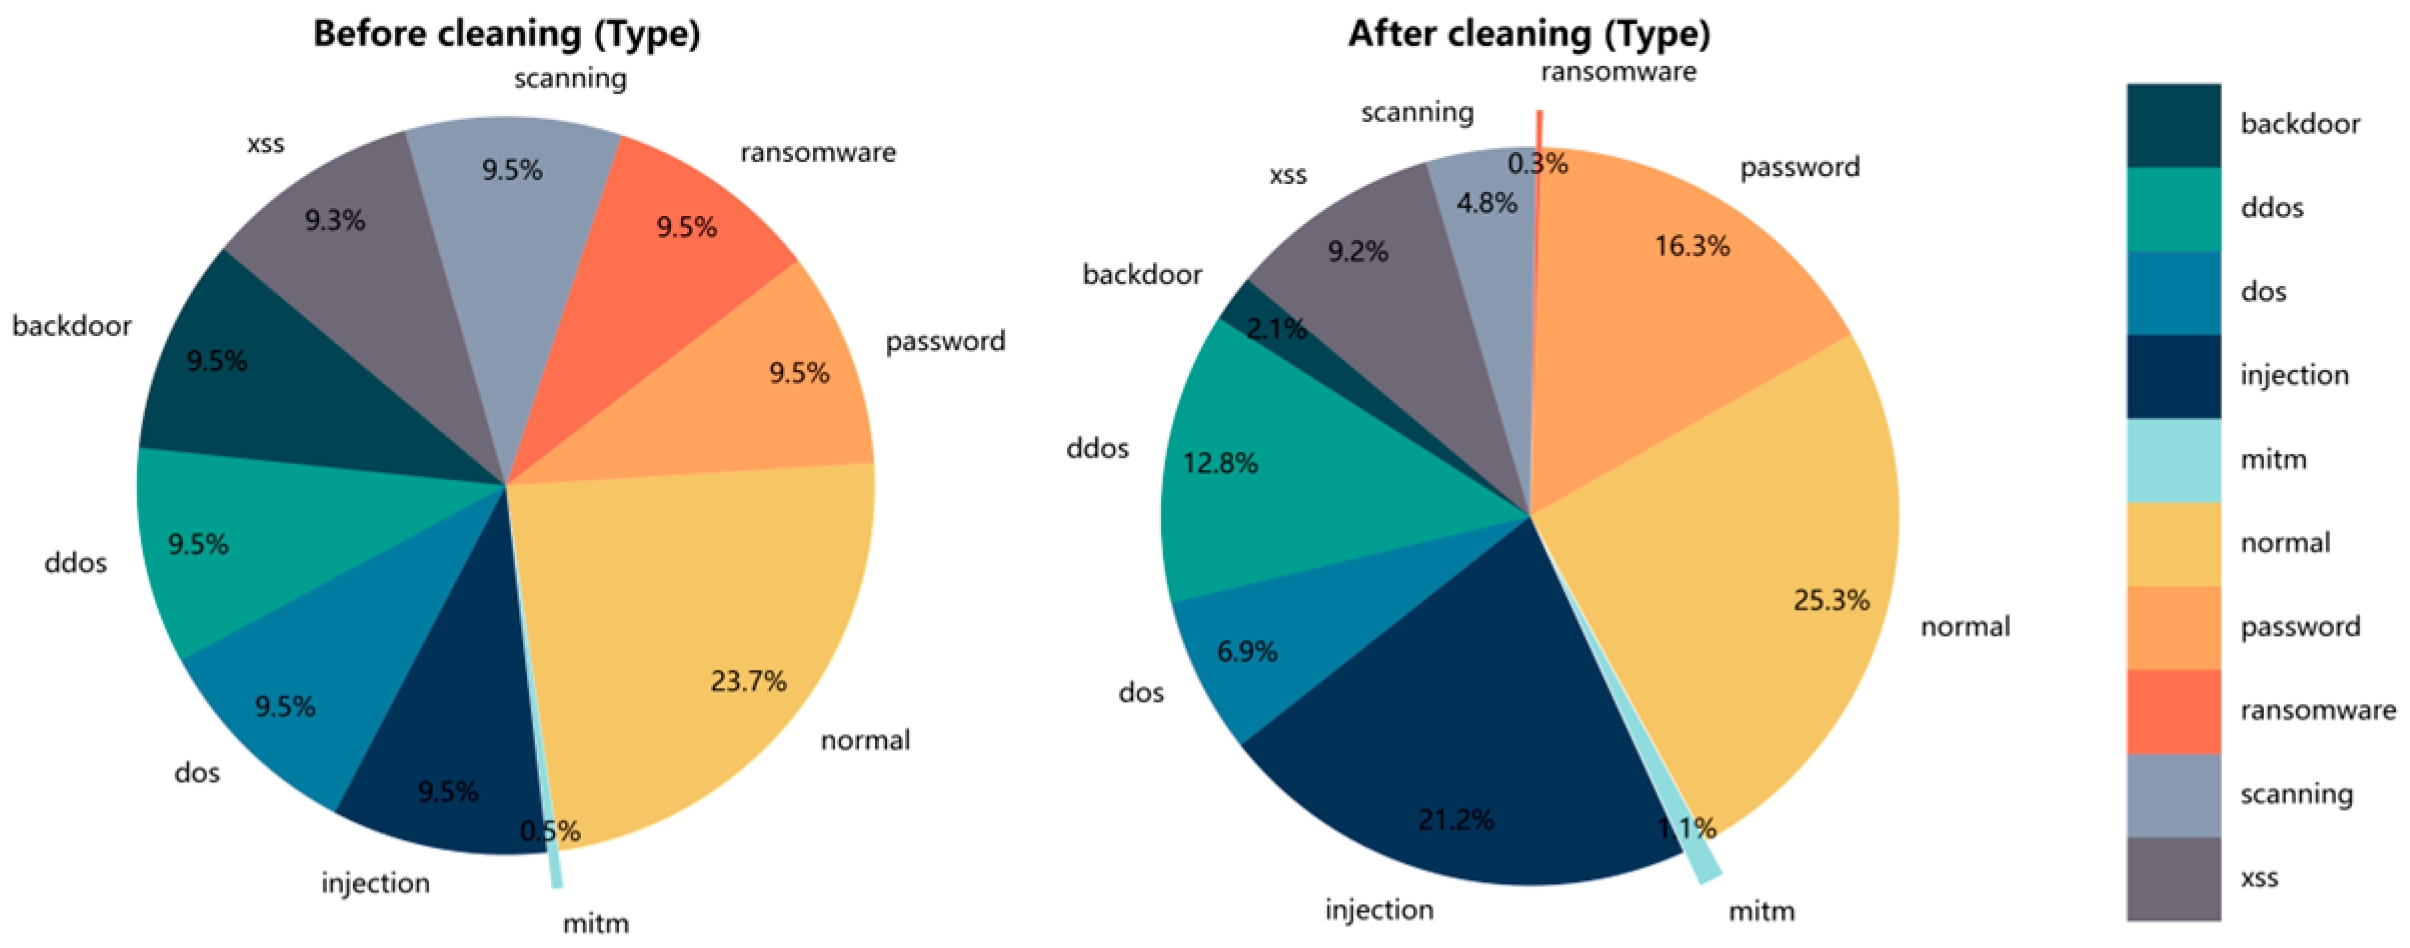
Outliers in numerical features were identified using the interquartile range (IQR) method; however, the original value distributions were preserved to retain potentially informative attack behavior. As illustrated in Figure 2, the class distribution changed substantially after data cleaning. In the raw dataset, normal traffic accounted for 23.7% of all connections, while each major attack category (including ransomware) contributed around 9.5%, with only the MITM class being a clear minority at just 0.49%. After removing identifiable attributes and duplicate records, normal and several attack types such as injection and password became more dominant (e.g., injection increased to 21.2% and password to 16.3%), whereas backdoor and scanning were heavily reduced and ransomware dropped to only 0.3% of the cleaned dataset. This shift highlights that ransomware evolves into an extreme minority class, reinforcing the need for dedicated class-imbalance handling in subsequent modeling.
During the data splitting stage, stratified sampling based on the type column was employed to divide the cleaned dataset into training and testing sets (70%/30%), ensuring consistent class proportions across both sets. Splitting was performed prior to feature encoding to prevent data leakage. As summarized in Table 3, the resulting training set contained 65,573 samples, and the testing set contained 28,103 samples, each with 33 features after excluding label columns.
In the feature encoding stage, all 19 categorical features were uniformly encoded using One-Hot encoding to generate binary feature representations. Although label encoding can reduce dimensionality, it maps categories to integers and may introduce misleading ordinal relationships, which is inappropriate for unordered categorical features (e.g., encoding tcp, udp, icmp as 0, 1, 2 could imply an unintended order). To avoid misinterpretation of categorical structures and enhance the representation accuracy, One-Hot encoding was applied to all categorical features. The encoder was fit on the training set and only used to transform the testing set to prevent leakage of encoding parameters. After encoding, the feature dimension increased from 33 to 112 (14 numerical features + 98 One-Hot binary features).
Subsequently, all features were normalized using Min-Max scaling to transform them into the [0,1] range, which enhances consistency in feature importance interpretation, improves compatibility with other models, and stabilizes the feature selection process. The normalization formula is:
X n o r m = X X m i n X m a x X m i n
where X m i n and X m a x represent the minimum and maximum values of each feature in the training set. The scaler was fit on the training set and applied to the testing set to prevent leakage of normalization parameters. After normalization, feature values in the training set ranged within [0,1], while the testing set could slightly exceed this range due to distribution differences, reflecting the model’s generalization ability in real-world scenarios.
Algorithm 1 outlines the data preprocessing pipeline for network intrusion detection. It removes identifier features and duplicate instances, then splits the dataset into training and test sets using stratified sampling (70%/30%). Categorical features are encoded using One-Hot encoding with the encoder fitted only on the training set. All features are normalized to [0,1] using Min-Max scaling, with the scaler fitted only on the training set. The algorithm outputs normalized training and test feature matrices along with their corresponding labels.
Algorithm 1 Data Preprocessing in phase 1.
Input: RawDataset (original network traffic data)
Output: X_train_normalized, X_test_normalized, y_train, y_test (preprocessed training and test datasets)
1. Load Data:
   Array ← RawDataset
2. Remove Identifier Features:
   In [Array] remove identifier features (IP addresses, ports, query strings, URIs, etc.)
3. Remove Duplicate Instances:
   In [Array] remove duplicate rows
4. Train-Test Split:
   X_train, X_test, y_train, y_test ← Train_test_split [Array] (stratified, 70%/30%)
5. Feature Encoding:
   a. Identify categorical and numeric features
   b. For categorical features: apply One-Hot encoding
     –Fit encoder on X_train only
     –Transform both X_train and X_test
   c. Concatenate encoded categorical features with numeric features
   → X_train_encoded, X_test_encoded
6. Min-Max Normalization:
   a. Fit MinMaxScaler on X_train_encoded only
   b. Transform X_train_encoded and X_test_encoded
   → X_train_normalized, X_test_normalized
7. Return X_train_normalized, X_test_normalized, y_train, y_test

3.4. Feature Engineering

After one-hot encoding, the ToN-IoT network traffic features expand to 112 dimensions, including 14 numerical attributes and 98 binary indicators. Such a high-dimensional representation inevitably introduces redundant or highly correlated features, which may increase the risk of overfitting and degrade the interpretability of the learned model.
To address this issue, we investigate two complementary categories of feature engineering methods: (i) feature selection, which preserves the original feature semantics by identifying the most informative subset of raw features, and (ii) feature extraction, which generates compact representations through linear or non-linear transformations.

3.4.1. Feature Selection

The feature selection branch aims to derive a compact and discriminative subset of the original feature space by removing redundant, noisy, or weakly relevant attributes that may hinder model generalization. To achieve this, we employ two complementary mechanisms: (i) correlation-based filtering to eliminate features exhibiting strong linear dependency or negligible association with the target, and (ii) Random Forest-based feature importance ranking to capture nonlinear interactions and model-driven feature importance. Together, these strategies enable a more expressive and computationally efficient representation for downstream intrusion classification [49].
  • Correlation-based filtering
Correlation-based filtering is a statistical and model-independent technique used to remove redundant features. For any pair of features x i and x j , their linear relationship is measured using the Pearson correlation coefficient:
ρ i j = c o v ( x i ,   x j ) σ x i σ x j
where c o v ( , ) denotes covariance and σ x i , σ x j represent the standard deviations of the two features. When the absolute correlation ρ i j exceeds a predefined threshold, the pair is regarded as highly redundant. In such cases, one feature from the pair is removed.
This filtering procedure iterates over all feature pairs and eliminates one feature from each strongly correlated pair. The method reduces dimensionality while retaining the original semantic meaning of the remaining attributes. The selected feature subset can then serve as a refined input representation or be compared against alternative selection and extraction strategies in the experimental analysis.
  • Random Forest-based feature importance ranking
Random Forest-based feature importance ranking [49] is an embedded feature selection method [50]. It trains a Random Forest ensemble on the feature set F = { f 1 , , f p } and assigns an importance score I ( f k ) to each feature based on the ensemble’s internal structure. The score is computed as:
I f k = 1 T t = 1 T n N k t p n Δ I n
where T is the number of trees, N k ( t ) denotes the set of split nodes using feature f k in tree t , p n is the proportion of samples reaching node n , and Δ I n is the impurity decrease at that node. Features are then ranked by their scores, and the top- k features are selected. This approach requires only a single training pass, incurring moderate computational cost. By leveraging the Random Forest’s ability to model nonlinear dependencies and interactions, the method effectively identifies a compact subset of features that jointly support the detection task.
Algorithm 2 outlines our feature selection approach, which implements correlation-based and RF-importance methods for identifying optimal feature subsets. These complementary selection paradigms enable comparative analysis of feature selection strategies, with experimental evaluation guiding the selection of the most discriminative features for intrusion detection.
Algorithm 2 Feature Selection in phase 2.
Input: X_train_p1, X_test_p1 (normalized features, D dimensions), y_train
Output: Performance comparison results, optimal_method, optimal_k
1. Initialize: Array_train ← X_train_p1, Array_test ← X_test_p1
2. Define target dimensions: K = [10, 15, 20, 25, 30, 40, 50, 60, 70]
Part 1: Correlation-based Selection (Least Redundant)
3. Precompute correlation-based ranking:
   a. Compute correlation matrix on Array_train
   b. For each feature, compute redundancy score (sum of correlations with others)
   c. Rank features by redundancy (ascending: lower = less redundant)
   → corr_ranking (feature indices sorted by least redundancy)
Part 2: RF-importance-based Selection
4. Precompute RF-importance ranking:
   a. Train Random Forest on Array_train (once)
   b. Compute feature importance scores
   c. Rank features by importance (descending)
   → rf_ranking (feature indices sorted by importance)
5. For each k in K:
   a. Method 1–Correlation selection:
     –Select top-k features from corr_ranking
     –Generate X_train_corr, X_test_corr with k selected features
     –Train XGBoost and evaluate performance
     –Store results
   b. Method 2–RF-importance selection:
     –Select top-k features from rf_ranking
     –Generate X_train_rf, X_test_rf with k selected features
     –Train XGBoost and evaluate performance
     –Store results
6. Comparative evaluation:
 –Compare Correlation vs RF-importance across all k values
 –Select optimal (method, k) based on performance metrics
   → optimal_method, optimal_k
7. Return results, optimal_method, optimal_k

3.4.2. Feature Extraction

While feature selection directly retains a subset of the original attributes, feature extraction constructs new variables as combinations of existing features in order to obtain a more compact and structured representation of the data. In this work, we consider two complementary unsupervised extraction techniques: (i) Principal Component Analysis (PCA), which seeks orthogonal directions that capture the maximum variance of the input, and (ii) Independent Component Analysis (ICA), which aims to recover statistically independent latent sources underlying the observed mixtures. Both methods transform the original feature space into a lower-dimensional latent space that can be used as an alternative representation in the subsequent intrusion detection experiments.
  • Principal Component Analysis (PCA)
Principal Component Analysis [51] is a linear feature extraction method that projects the original feature vector onto a set of orthogonal directions capturing the main variance of the data. Let x R p be the standardized feature vector and Σ its covariance matrix. PCA computes the eigenvalues λ k and eigenvectors u k of Σ :
Σ u k = λ k u k
with eigenvalues ordered as λ 1 λ 2 λ p . The feature vector is then projected onto the leading eigenvectors:
z = U d x
where U d = [ u 1 , , u d ] . The resulting vector z provides a lower-dimensional representation that preserves most of the original variance while discarding directions dominated by noise. Because each principal component is a linear combination of the original attributes, PCA can uncover dominant patterns in network traffic and reveal major sources of variation across different connection types.
  • Independent Component Analysis (ICA)
Independent Component Analysis [52] is a linear feature extraction method that aims to recover statistically independent latent sources from observed data. It assumes that the feature vector x R p is formed by a linear mixture of hidden signals s :
x = A s
where A is an unknown mixing matrix. ICA estimates an unmixing matrix W through:
z = W x
so that the components of z become as independent and non-Gaussian as possible. Independence is typically encouraged by maximizing a contrast function related to non-Gaussianity, such as kurtosis or negentropy.
Unlike PCA, which produces uncorrelated but not necessarily independent components, ICA attempts to separate latent sources that may correspond to distinct traffic behaviors or attack patterns. The resulting components provide an alternative feature space that can be examined for its impact on intrusion detection performance.
Algorithm 3 outlines our feature extraction approach, which implements PCA and ICA methods for constructing transformed feature representations. These unsupervised techniques project the original high-dimensional features into compact latent spaces, enabling comparative analysis of different transformation paradigms for intrusion detection.
Algorithm 3 Feature Extraction in phase 2.
Input: X_train_p1, X_test_p1 (normalized features, 112D), y_train, y_test
Output: Performance comparison results, optimal_method, optimal_k
1. Initialize: Array_train ← X_train_p1, Array_test ← X_test_p1
2. Define target dimensions: K = [10, 15, 20, 25, 30, 40, 50, 60, 70]
Part 1: PCA Transformation
3. For each k in K:
   a. Set PCA components: n_components = k
   b. Fit PCA on Array_train
   c. Transform Array_train and Array_test
   d. Generate X_train_p2, X_test_p2 with k PCA components
   e. Train XGBoost and evaluate performance
   f. Store results and runtime
Part 2: ICA Transformation
4. For each k in K:
   a. Set ICA components: n_components = k
   b. Fit ICA on Array_train
   c. Transform Array_train and Array_test
   d. Generate X_train_p2, X_test_p2 with k ICA components
   e. Train XGBoost and evaluate performance
   f. Store results and runtime
5. Comparative evaluation:
 –Compare PCA vs ICA across all k values
 –Select optimal (method, k) based on performance
   → optimal_method, optimal_k
6. Return results, optimal_method, optimal_k
In summary, the feature engineering stage in our framework combines complementary perspectives on the ToN-IoT feature space. Correlation-based filtering and recursive feature elimination with Random Forests operate directly on the original attributes, removing redundancy and highlighting those features that are most informative for intrusion characterization while preserving their semantic meaning. In parallel, PCA and ICA construct alternative latent representations that emphasize dominant variance directions and statistically independent components, respectively, enabling us to explore whether structural properties of the data can be captured more effectively in a transformed space. By considering both selection- and extraction-based strategies, the proposed framework provides a flexible basis for subsequent comparative experiments on intrusion detection performance and interpretability.

3.5. Class Balancing

The ToN-IoT dataset exhibits a highly skewed class distribution. A few attack categories, such as ransomware and man-in-the-middle (MITM), are severely under-represented compared to majority classes like normal traffic or injection attacks. Training a classifier on such imbalanced data may bias the decision boundary toward majority classes, resulting in poor detection of rare but security-critical intrusions. To address this challenge, we explore several over-sampling strategies applied only to the training set, while the test set remains in its original, imbalanced form to provide a realistic evaluation scenario. All methods share the same feature representation and data split; they differ solely in how synthetic or replicated samples are generated for minority classes.

3.5.1. Random OverSampling (ROS)

Random OverSampling (ROS) is a basic baseline method for class balancing. It increases the number of minority-class instances by randomly duplicating existing samples until the class reaches its target size. Formally, for each minority class c with n c original samples and target size n ~ c , ROS repeatedly draws samples from the empirical distribution of that class and appends them to the training set until n ~ c instances are obtained. This method is computationally inexpensive and preserves the original feature distribution of minority classes. However, it may increase the risk of overfitting, since no new information is introduced beyond duplicating existing examples.

3.5.2. Synthetic Minority Over-Sampling Technique (SMOTE)

The Synthetic Minority Over-sampling Technique (SMOTE) [32] generates new minority-class samples by interpolating between existing instances rather than simply duplicating them. For a given minority sample x i , SMOTE identifies one of its k -nearest minority neighbors x n n and constructs a synthetic point on the line segment between the two:
x n e w = x i + λ ( x n n x i )
where λ U ( 0 ,   1 ) is a random interpolation factor. By repeatedly selecting neighbors and interpolation coefficients, SMOTE populates the local minority-class region with synthetic samples that remain within the convex hull of observed data. This approach increases sample diversity and mitigates overfitting more effectively than simple duplication.

3.5.3. SMOTE–Tomek Links

SMOTE–Tomek Links [53] is a hybrid method that combines over-sampling with boundary cleaning. The procedure first applies SMOTE to generate synthetic minority samples, increasing the representation of rare classes. It then detects Tomek links, which are pairs of nearest neighbors from different classes that are each other’s closest point in the feature space. These pairs typically occur in overlapping or noisy regions near the decision boundary. By removing one or both samples in each Tomek link—most often the majority-class instance—the method reduces boundary noise while preserving minority structure. As a result, SMOTE–Tomek produces a more balanced and better separated training set for subsequent learning.

3.5.4. Borderline-SMOTE

Borderline-SMOTE [54] extends the SMOTE strategy by concentrating sample generation on minority instances that lie close to the decision boundary. The method first examines the neighborhood of each minority sample and identifies those whose nearest neighbors are mainly majority-class points. These “borderline” samples are considered at high risk of misclassification. Synthetic samples are then created by interpolating between the borderline instances and their minority neighbors, following the same interpolation rule as in SMOTE. By allocating over-sampling effort to these ambiguous regions, Borderline-SMOTE strengthens the minority representation near class boundaries and helps the classifier learn a more reliable decision surface.

3.5.5. Adaptive Synthetic Sampling (ADASYN)

Adaptive Synthetic Sampling (ADASYN) [55] extends SMOTE by adapting the allocation of synthetic samples to the local learning difficulty around each minority instance. For a given minority sample x i , ADASYN first computes a difficulty ratio r i , defined as the proportion of majority-class samples within its k -nearest neighbors. A higher r i indicates that x i lies in a region with substantial class overlap and is therefore harder to learn. The number of synthetic samples to be generated for x i is then made proportional to r i , resulting in denser augmentation in minority regions that are sparse or highly contaminated by majority-class points. By adaptively focusing over-sampling on these difficult areas, ADASYN directs the classifier’s attention to regions where misclassification is most likely and promotes a more discriminative decision boundary.
Algorithm 4 follows a theoretically sound and experimentally standard class balancing procedure. It is correctly positioned after feature reduction, avoids data leakage, employs a conservative median-based oversampling strategy, and enables fair comparative evaluation of resampling methods without introducing methodological bias.
Algorithm 4 Class Balancing in phase 3.
Input: X_train_p2, y_train (selected features, k dimensions), X_test_p2, y_test
Output: Performance comparison results, optimal_method
1. Initialize: Array_train ← X_train_p2, Array_test ← X_test_p2
2. Compute class distribution statistics:
   a. Count samples per class in Array_train
   b. Calculate median sample count across all classes
   → median_target
3. Define candidate balancing methods:
   Methods = [
      ‘No Balancing’,
      ‘SMOTE’,
      ‘ROS’,
      ‘Borderline-SMOTE’,
      ‘ADASYN’,
      ‘SMOTE-Tomek’
   ]
4. For each method in Methods:
   a. If method == ‘No Balancing’:
    –X_train_bal ← Array_train
    –y_train_bal ← y_train
   b. Else (oversampling methods):
    –Define sampling_target: upsample minority classes to median_target
    –Apply method with method-specific parameters
    –Apply balancing: (X_train_bal, y_train_bal) ← method.fit_resample(Array_train, y_train)
   c. Train XGBoost on (X_train_bal, y_train_bal)
   d. Evaluate on (Array_test, y_test)
   e. Compute metrics: accuracy, macro-F1, per-class F1 (focus on minority classes)
   f. Store results and balancing time
5. Comparative evaluation:
 –Compare all methods based on:
    * Macro-F1 score
    * Minority class performance (Ransomware, MITM)
    * Overall accuracy
 –Select optimal method based on performance metrics
   → optimal_method
6. Return results, optimal_method
In summary, the class balancing stage in our framework spans a progression of over-sampling strategies with increasing modeling sophistication. Random OverSampling serves as a simple baseline that preserves the empirical minority distribution but introduces the risk of overfitting due to exact duplication. SMOTE improves upon this by interpolating between minority instances to generate synthetic samples and enrich local neighborhoods. Its extensions—SMOTE–Tomek, Borderline-SMOTE, and ADASYN—further refine this idea by focusing on where synthetic samples should be generated and how boundary noise should be handled: SMOTE–Tomek couples synthetic over-sampling with the removal of ambiguous Tomek links, Borderline-SMOTE concentrates generation near decision boundaries, and ADASYN adaptively allocates more samples to difficult or highly overlapped regions. Applied exclusively to the training data while preserving the original test distribution, these complementary techniques allow a systematic assessment of how different balancing mechanisms affect the detection of rare but security-critical intrusion categories.

3.6. Model Construction

3.6.1. Conceptual Rationale for XGBoost in IoT NIDS

For the core detection component, we employ the XGBoost algorithm. Its selection is principled, driven by a convergence of model attributes and the specific demands of IoT intrusion detection systems (NIDSs). Our framework prioritizes a model capable of delivering high accuracy, computational efficiency, and amenability to post-hoc interpretability, all critical for practical security deployment.
The alignment between XGBoost’s design and IoT NIDS requirements is grounded in several key considerations. First, the gradient-boosting framework excels at modeling intricate, non-linear decision boundaries, which is essential for distinguishing subtle and diverse attack signatures from normal network traffic within high-dimensional feature spaces. Second, XGBoost’s objective function incorporates L1 (γ) and L2 (λ) regularization terms, providing a direct and principled mechanism to control model complexity. This is vital for preventing overfitting on the potentially noisy and redundant features prevalent in IoT network data, thereby enhancing generalization to novel attacks. Third, as a tree-based ensemble, XGBoost’s additive structure is inherently compatible with exact explanation methods like SHAP’s TreeExplainer. This compatibility is central to our objective of providing transparent, post-hoc explanations for security analysts, a requirement often unmet by deeper alternatives. The efficient computation of SHAP values via TreeExplainer is a direct benefit of this architectural choice. Finally, the algorithm’s support for parallel processing, efficient handling of sparse data, and scalability aligns with the practical constraints of processing large-scale IoT network traffic logs, supporting feasible deployment.
Therefore, XGBoost is conceptually positioned not merely as a high-performance classifier, but as a flexible framework. Within it, strategic hyperparameter adjustments can be directly mapped to desired behavioral outcomes, balancing detection accuracy, robustness against overfitting, computational cost, and the transparency of its decisions for security analysis.

3.6.2. Theoretical Foundation and Formulation

XGBoost is a gradient-boosting–based ensemble learning algorithm that iteratively trains multiple decision trees and combines them to form a strong classifier. Its optimization objective aims to minimize both prediction error and model complexity, and is formally defined as:
L θ = i = 1 n l y i ,   y i ^ + k = 1 K Ω f k
where l ( ) denotes the loss function (multiclass log loss in this study). The regularization term Ω ( f k ) is given by:
Ω ( f k ) = γ T + 1 2 λ w 2
where T is the number of leaf nodes, w is the leaf weight vector, and γ and λ are regularization coefficients.
To optimize the objective efficiently, XGBoost uses forward stagewise boosting and applies a second-order Taylor expansion to the loss at iteration t :
L t i = 1 n l y i ,   y ^ i t 1 + g i f t x i + 1 2 h i f t 2 x i + Ω f t
where g i and h i are the first- and second-order gradients of the loss with respect to the previous prediction y ^ i ( t 1 ) . This leads to an optimal weight for leaf j :
w j * = i I j g i i I j h i + λ
The quality of a candidate node split is measured by the gain in objective reduction:
G a i n = 1 2 i I L g i 2 i I L h i + λ + i I R g i 2 i I R h i + λ i I g i 2 i I h i + λ
During tree construction, XGBoost employs a greedy search algorithm to select the feature and split point that maximize this gain criterion. The overall prediction is then produced by summing the contributions of all individual trees.
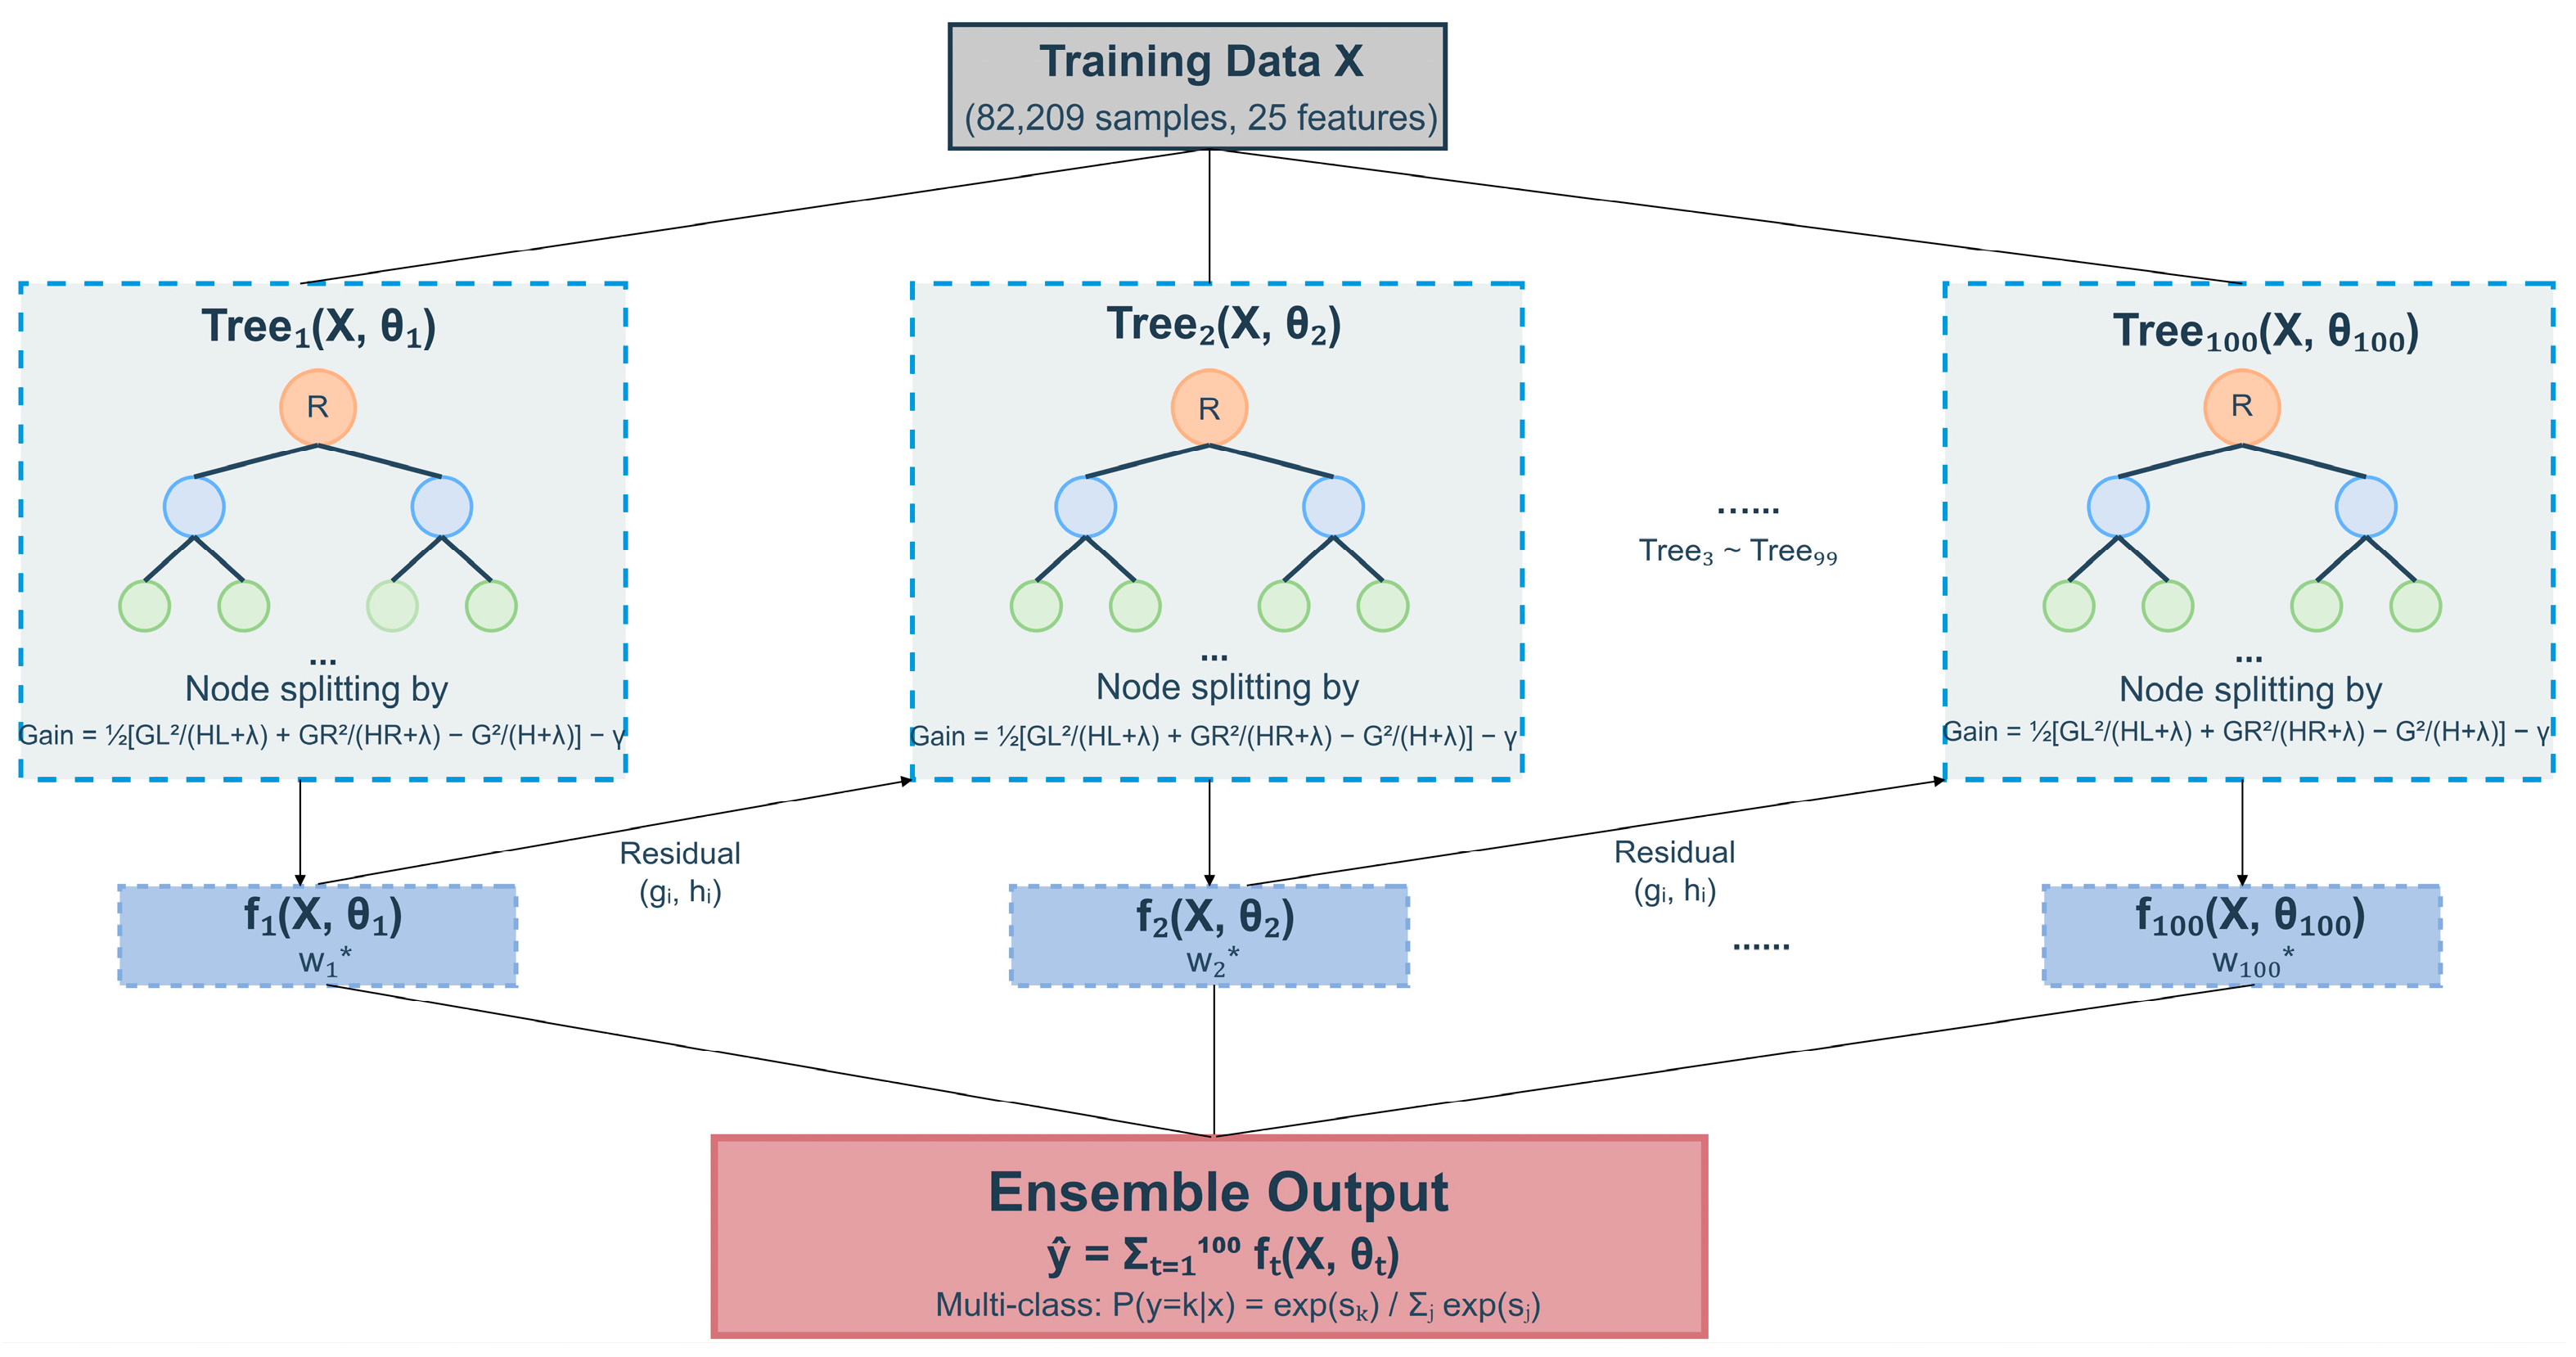
Figure 3 illustrates the workflow of the XGBoost multiclass classification model used in this study. The training procedure follows a sequential boosting process. It begins by initializing all predictions to zero. At each iteration, the algorithm computes the first- and second-order gradients based on the current predictions and uses them to grow a decision tree from the root. During node expansion, the algorithm examines candidate features and split points, selecting the one that maximizes the split gain. Tree growth stops when the gain becomes insufficient or the maximum depth is reached. After the tree is constructed, the optimal weight of each leaf is computed from the gradients of the samples assigned to it, and the tree’s contribution is added to the model using a predefined learning rate.

3.6.3. Hyperparameter Optimization Strategy and Conceptual Analysis

The theoretical formulation of XGBoost provides clear levers—through hyperparameters—to tailor its behavior to our specific intrusion detection problem. Our optimization strategy, formalized in Algorithm 5, is designed to navigate the fundamental trade-off between model capacity (to learn complex attack patterns) and generalization (to avoid overfitting on imbalanced network data). The selection of candidate hyperparameters is guided by their conceptual role:
  • Number of Trees (n_estimators) & Learning Rate (learning_rate): This combination controls the boosting process’s capacity and conservatism. A lower learning rate with more trees typically yields a more robust model but at increased computational cost. We explore configurations to find the point of diminishing returns.
  • Maximum Depth (max_depth): This parameter directly limits the complexity of individual trees, influencing the model’s ability to capture feature interactions. A moderate depth is sought to model the non-linear relationships within our reduced feature space without memorizing noise.
  • Subsampling Ratios (subsample, colsample_bytree): These parameters introduce randomness by training each tree on a random subset of data or features. Conceptually, this acts as an ensemble method within the boosting sequence, reducing variance and improving robustness—a particularly valuable trait for handling class imbalance and preventing overfitting.
Algorithm 5 outlines our model detection approach, which implements XGBoost-based multi-class classification with hyperparameter optimization for intrusion detection. The algorithm systematically explores candidate hyperparameter configurations including tree count, depth, learning rate, and subsampling ratios, evaluating each configuration.
Algorithm 5 Model Training & Testing in phase 4.
Input: X_train_bal, y_train_bal (balanced training data), X_test, y_test
Output: Trained model, performance metrics, optimal_hyperparameters
1. Initialize: Array_train ← X_train_bal, Array_test ← X_test
2. Define candidate hyperparameter configurations:
   Configs = [
      {n_estimators, max_depth, learning_rate, subsample, colsample_bytree},
            ]
3. For each configuration in Configs:
   a. Initialize XGBoost classifier with configuration
   b. Train model on Array_train
   c. Predict on Array_test
   d. Compute performance metrics:
     * Multi-class: accuracy, macro-F1, macro-precision, macro-recall
     * Per-class: precision, recall, F1-score
     * Training time
   e. Store results
4. Select optimal configuration:
 –Compare configurations based on macro-F1 and training time
 –Select configuration with best performance-efficiency trade-off
   → optimal_hyperparameters
5. Train final model with optimal_hyperparameters
6. Generate evaluation outputs:
   a. Confusion matrix (multi-class)
   b. Performance summary tables (overall and per-class metrics)
7. Return trained_model, performance_metrics, optimal_hyperparameters
XGBoost refines the model iteratively by optimizing the gradient-based objective, which progressively improves the classifier’s ability to distinguish different attack categories. The training incorporates subsample-based instance sampling and feature sampling to introduce randomness and reduce dependency on individual samples or features, thereby improving generalization. For the final multiclass prediction, the outputs of all trees for each class are aggregated and then normalized through a softmax function to obtain the final probability distribution, enabling effective detection of multiple attack types.

3.7. SHAP Interpretability Analysis

To enhance the transparency and interpretability of the model, this study employs SHAP (SHapley Additive exPlanations) to analyze the decision-making mechanism of the XGBoost model. SHAP is grounded in the Shapley value theory from cooperative game theory and provides fair and consistent quantitative assessments of the contribution of each feature to the model’s predictions.

3.7.1. SHAP Algorithm Principles

SHAP values satisfy four axioms: efficiency, symmetry, dummy, and additivity. This framework assigns a SHAP value to each feature for every individual sample. This value represents the feature’s marginal contribution to the model’s output for that specific prediction. For multi-class classification tasks, SHAP calculates feature contributions separately for each class. This approach clarifies the model’s decision rationale for distinguishing different attack categories.
For tree-based models like XGBoost, the TreeExplainer is adopted for efficient computation. TreeExplainer leverages the additive structure of decision trees to calculate SHAP values. It achieves this by recursively traversing the paths of the tree ensemble. This method avoids the substantial computational cost associated with perturbing the input feature space, as required by many other interpretability techniques. Specifically, TreeExplainer analyzes the splitting conditions and sample distribution at each node. It then directly computes the contribution of each feature along the tree paths. Consequently, it efficiently obtains precise SHAP values without requiring multiple model evaluations, significantly reducing computational complexity.

3.7.2. SHAP Analysis Procedure

The SHAP analysis procedure consists of three main steps: data preparation, interpreter construction, and feature importance evaluation.
In the data preparation phase, two distinct datasets are constructed. First, a representative background dataset is created using stratified sampling from the training set according to class proportions. This dataset provides a reference distribution for calculating expected predictions, and ensuring each class is adequately represented within it prevents bias in the subsequent SHAP value computation. Simultaneously, an explanation dataset is built via stratified sampling from the test set. This ensures that the analysis encompasses sufficient representative samples from each attack category, allowing for class-wise interpretability.
Subsequently, a TreeExplainer is instantiated using the trained XGBoost model and the prepared background dataset. This explainer then calculates the SHAP values for all features pertaining to each sample in the explanation dataset. For the multi-class classification task, SHAP computes feature contributions separately for each target class, resulting in a multi-dimensional feature importance matrix that elucidates the distinct reasoning patterns for different attacks.
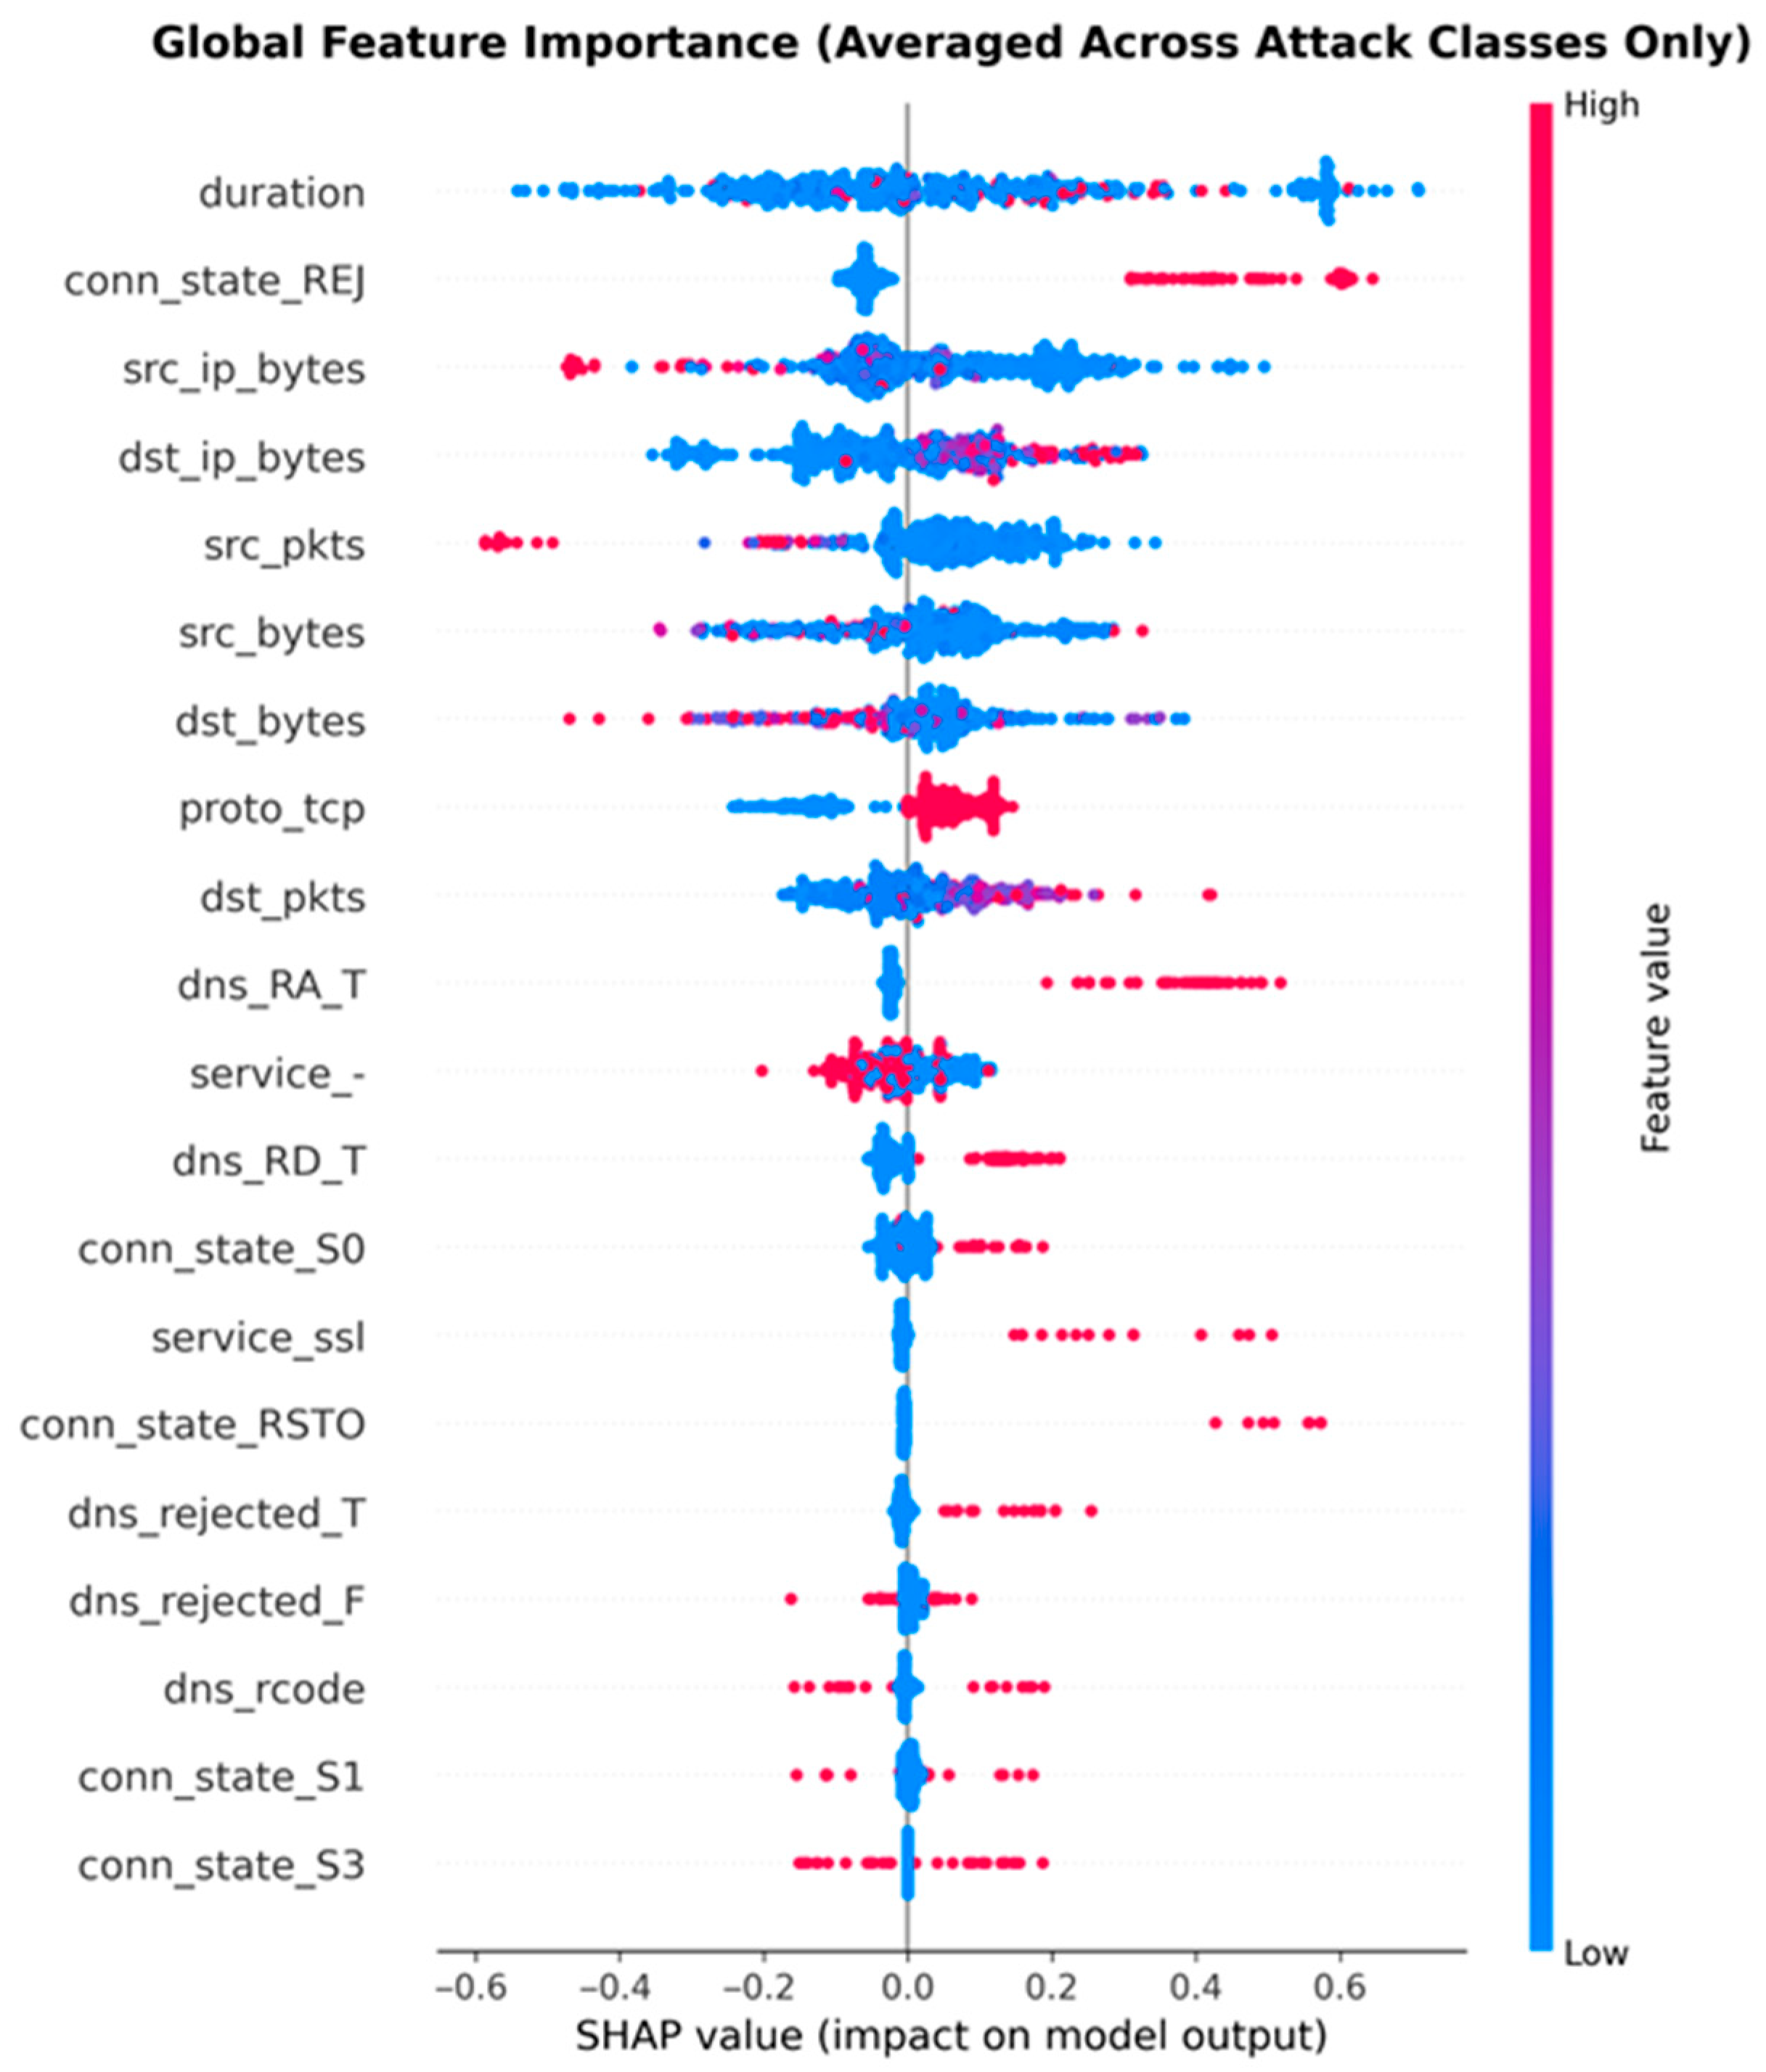
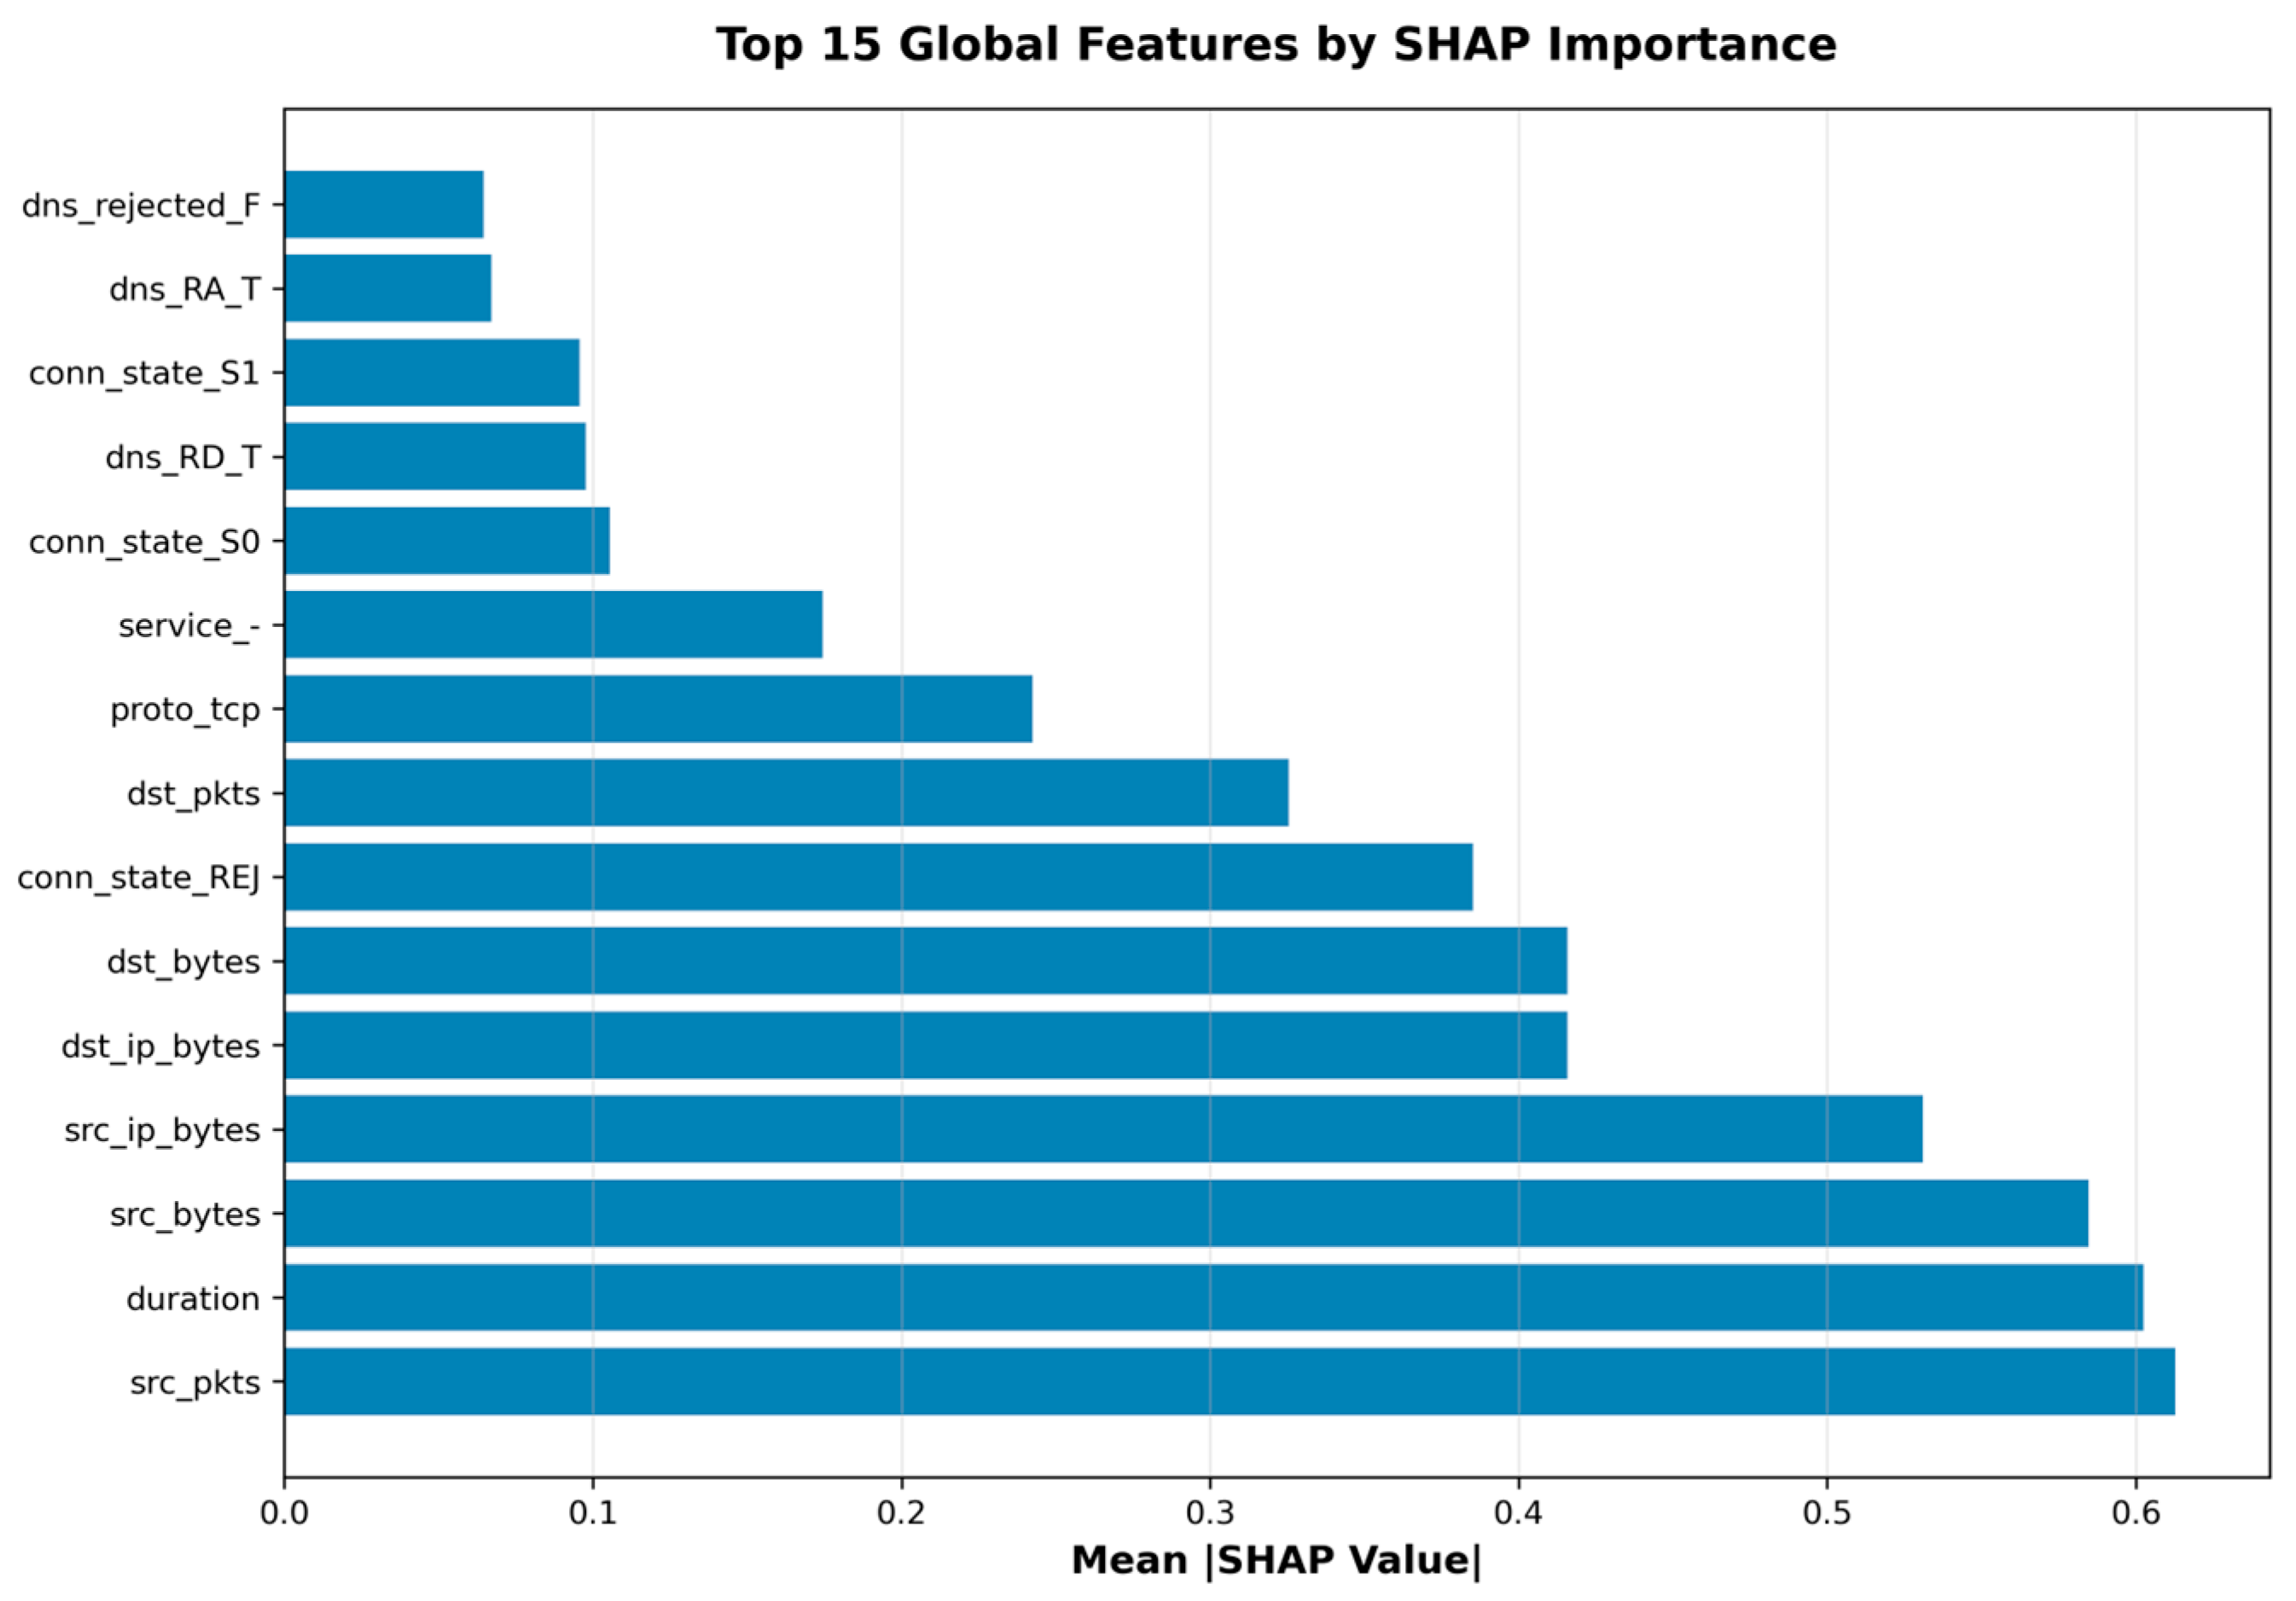
The global importance of each feature is derived from the mean absolute value of its SHAP contributions across all samples. To compute this, the SHAP value for the feature is obtained for each sample; a positive value indicates that the feature pushes the prediction toward an attack class, whereas a negative value supports the normal class prediction. The absolute values of these sample-level contributions are then averaged across the entire explanation dataset. Formally, the importance score I j for feature j is given by:
I j = 1 N i = 1 N ϕ j i
where ϕ j ( i ) is the SHAP value of feature j for the i -th sample, N is the total number of samples in the explanation set, and ∣⋅∣ denotes the absolute value. This metric, known as the mean absolute SHAP value, provides a robust measure of the feature’s overall impact on the model’s predictions.
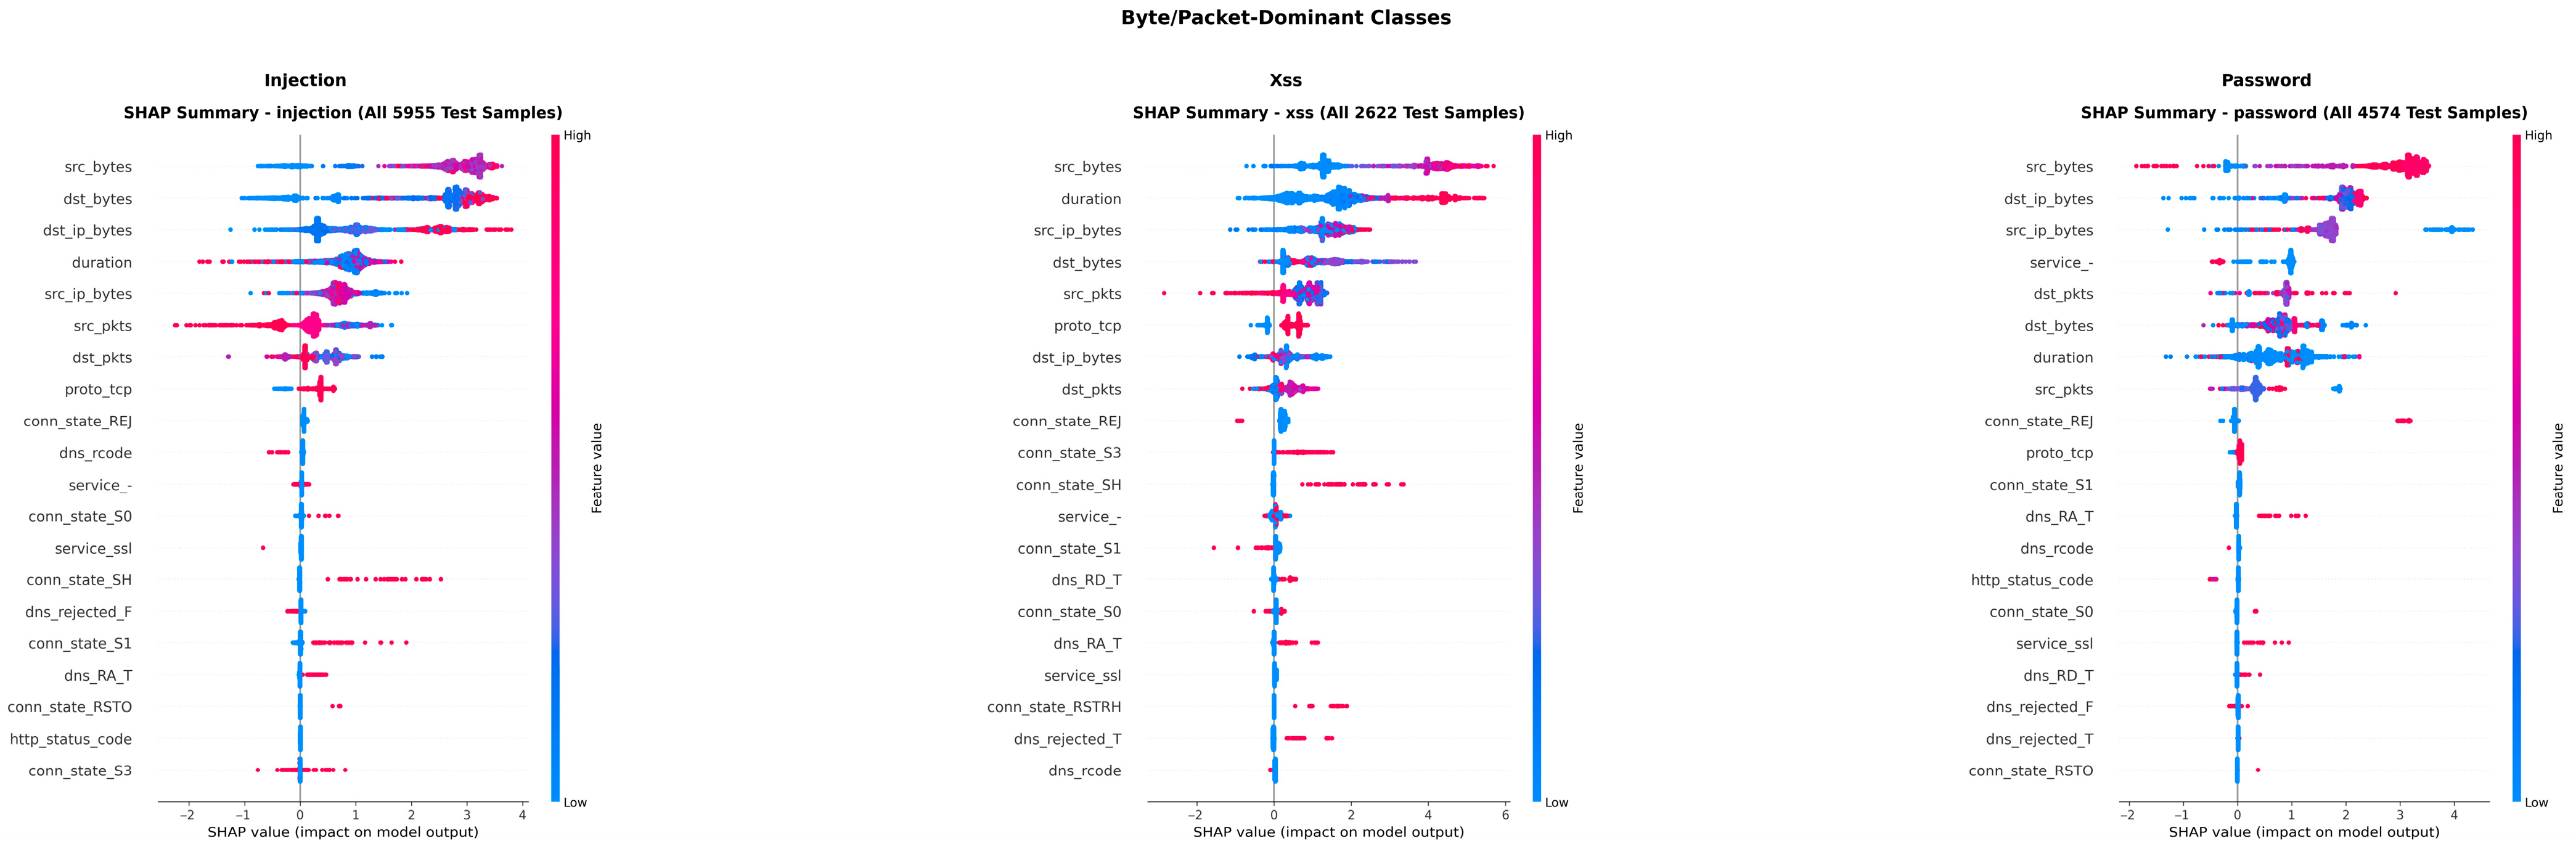
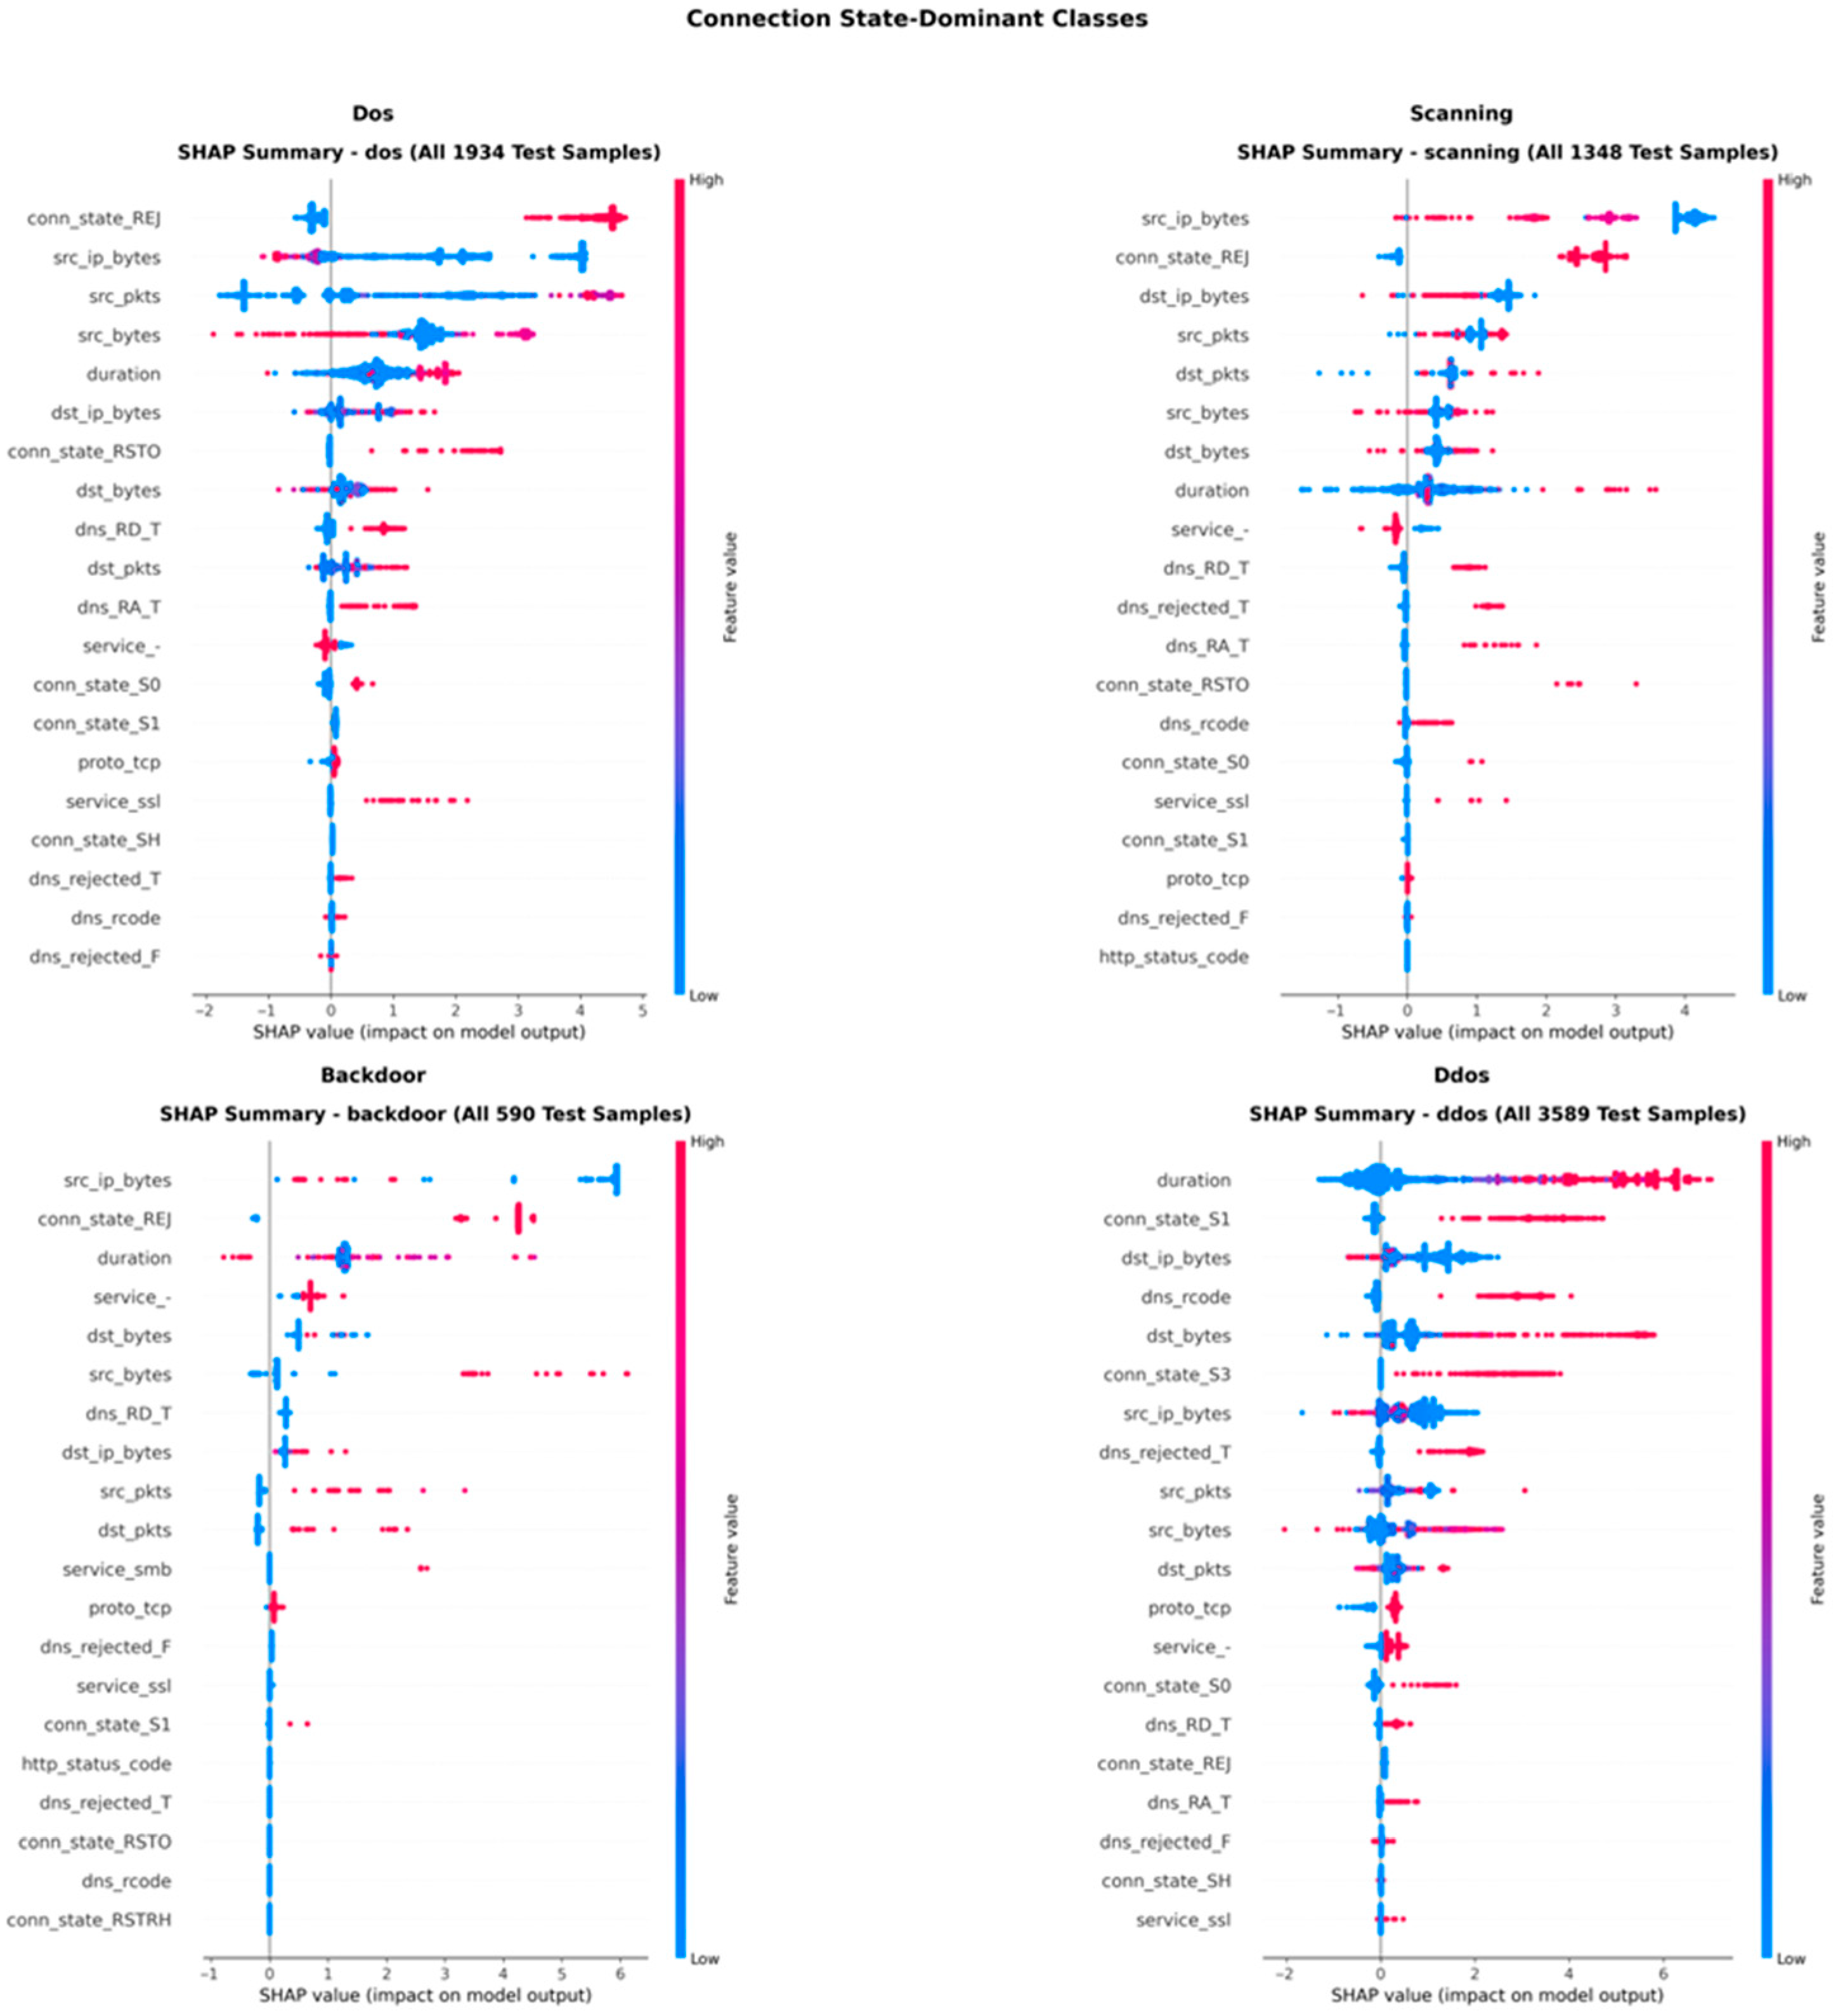
Algorithm 6 outlines our SHAP interpretability analysis approach, which employs TreeExplainer to provide post-hoc explanations for XGBoost predictions in intrusion detection. The algorithm implements a two-tier analysis framework: global feature importance analysis aggregates SHAP values across all attack classes to identify universally discriminative features; class-specific analysis reveals distinct feature patterns for individual attack categories.
Algorithm 6 SHAP Interpretability Analysis in phase 5.
Input: trained_model, X_train_bal, y_train_bal, X_test, y_test, feature_names
Output: SHAP explanations, visualization plots, feature importance rankings
1. Initialize: Model ← trained_model, Features ← feature_names
Part 1: Prepare Background and Explanation Datasets
2. Background dataset preparation:
   a. Sample stratified subset from X_train_bal (fixed size, balanced distribution)
   → X_background
3. Explanation datasets preparation:
   a. Global analysis: Balanced sample from X_test (equal samples per class)
     → X_explain_global
   b. Class-specific analysis: For each class, extract all test samples of that class
     → X_explain_class (one dataset per class)
Part 2: SHAP Value Computation
4. Initialize SHAP TreeExplainer:
   a. Create explainer with Model and X_background
   → explainer
5. For each explanation dataset:
   a. Compute SHAP values: shap_values ← explainer.shap_values(X_explain)
       // Multi-class output: list of arrays, each shape (n_samples, n_features) per class
Part 3: Global Feature Importance Analysis
6. Aggregate SHAP values for global importance:
   a. Extract SHAP values for attack classes only (exclude ‘normal’ class)
   b. Compute mean absolute SHAP values per feature across attack classes
   c. Rank features by global importance
   → global_feature_ranking
7. Generate global SHAP summary plot:
   a. Visualize feature importance and value distributions
   → global_shap_plot
Part 4: Class-specific Feature Importance Analysis
8. For each class:
   a. Extract class-specific SHAP values from all test samples of that class
   b. Compute mean absolute SHAP values per feature for this class
   c. Rank features by class-specific importance
   d. Generate class-specific SHAP summary plot
   → class_feature_rankings, class_shap_plots
9. Return SHAP_explanations, feature_rankings, visualization_plots
In summary, this comprehensive interpretability framework enables security analysts to understand model decisions, validate detection logic, and identify potential improvements for rare attack detection.

4. Results and Analysis

Based on the methodology described in Section 3, we present the experimental results.

4.1. Experimental Setup

Table 4 summarizes the computing platform used in this study, including the hardware configuration, operating system, and key software components required to implement and evaluate the proposed NIDS framework.

4.2. Evaluation Metrics

The proposed anomaly detection framework is evaluated using the following standard metrics:
Accuracy measures the proportion of correctly classified samples:
Accuracy = T P + T N T P + T N + F P + F N
Precision indicates the proportion of correctly identified anomalies among all samples predicted as anomalies:
Precision = T P T P + F P
Recall (True Positive Rate) represents the fraction of actual anomalies correctly identified:
Recall = T P T P + F N
F1-Score provides the harmonic mean of precision and recall:
F 1 = 2 × Precision × Recall Precision + Recall

4.3. Feature Dimensionality Reduction Comparison Results

This section presents a comparative evaluation of four dimensionality reduction strategies—supervised RF-importance, unsupervised PCA and ICA, and correlation-based feature selection—applied to the intrusion detection task. We assess each method along two primary axes: (1) its impact on macro-averaged F1 score across varying target dimensions k , and (2) its associated computational costs in terms of feature-rule learning and model training time. The goal is to identify the operational trade-offs between detection performance and efficiency.

4.3.1. Performance of Dimensionality Reduction Under Varying Target Dimensions

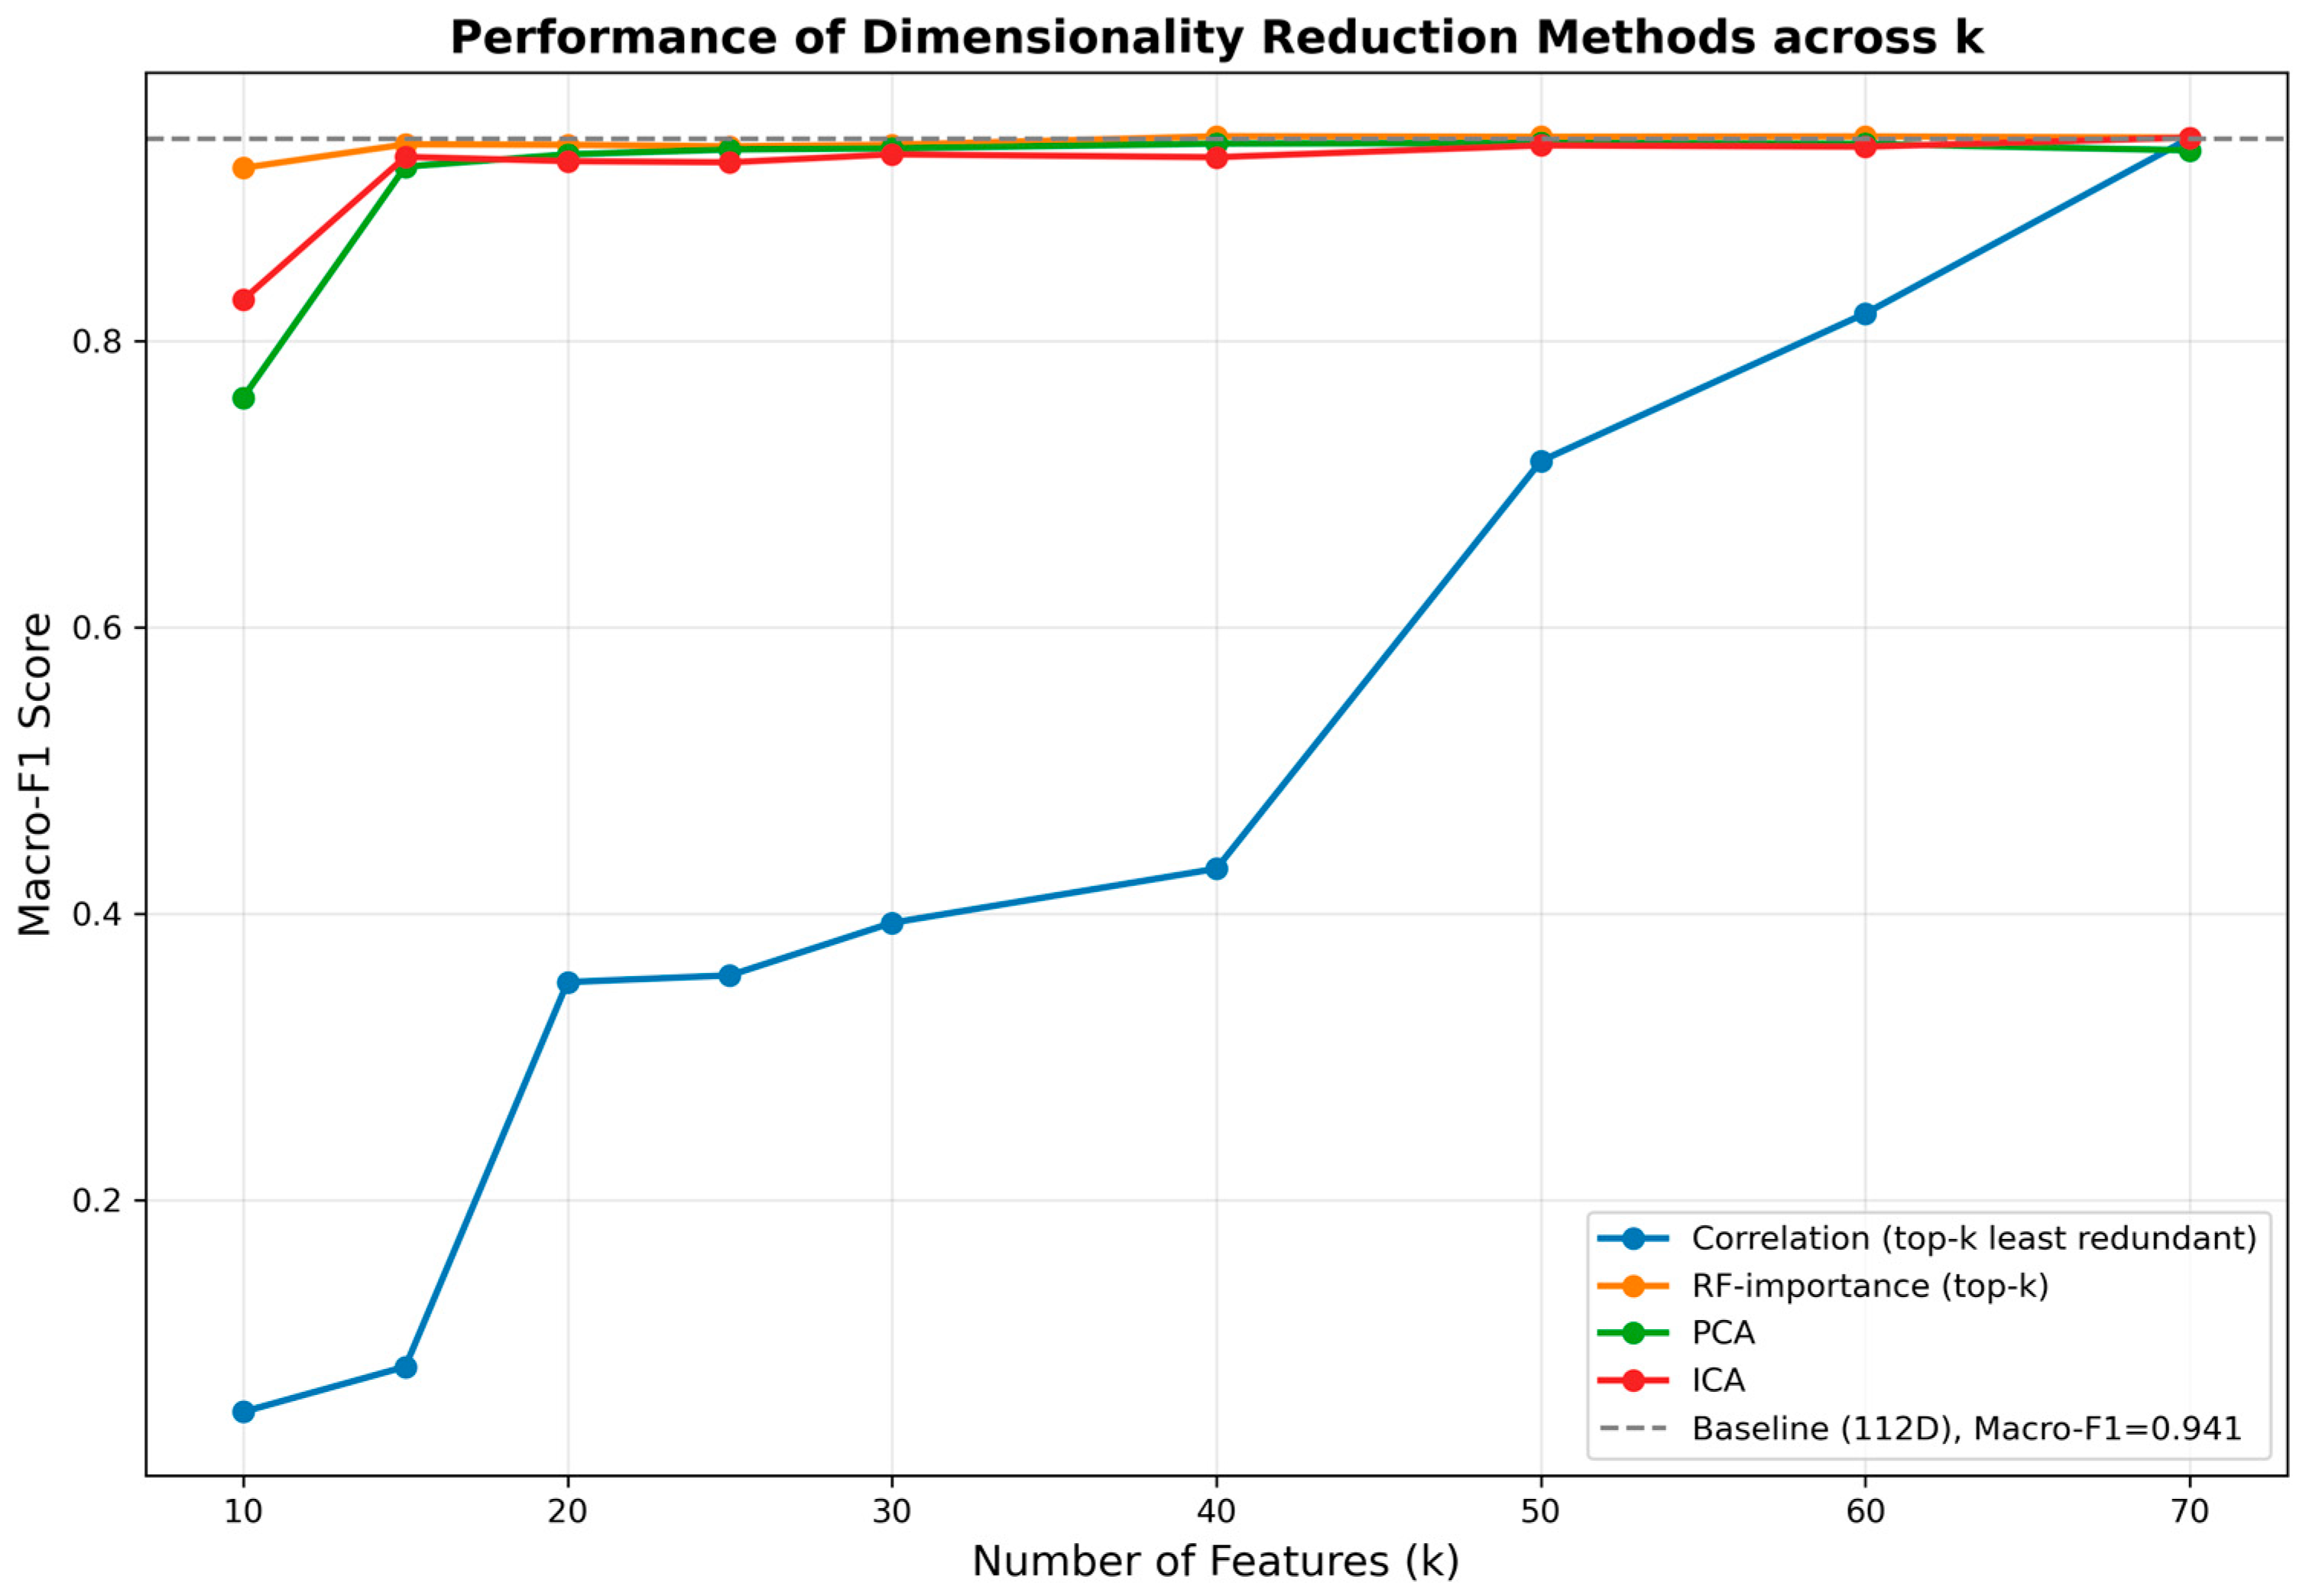
Figure 4 plots the macro-averaged F1-score against the target dimensionality k for the four reduction strategies, alongside the 112-dimensional baseline. All curves rise quickly as k grows, approaching the baseline performance once k reaches the 20–40 interval. Specifically, the supervised RF-importance method already attains a Macro-F1 ≈ 0.94 at k = 20 and essentially matches the 112-D baseline by k = 40 . The unsupervised extraction methods, PCA and ICA, achieve comparable performance for k 25 . This demonstrates that most information relevant to the intrusion-detection task can be preserved in a substantially lower-dimensional representation without noticeable degradation in overall detection accuracy.
The differences among the strategies become more pronounced under aggressive dimensionality reduction (e.g., k = 10 ). Here, RF-importance remains competitive, while PCA and ICA suffer a clear—though recoverable—drop in performance. The purely correlation-based least-redundant selection, by contrast, performs poorly at low k and only becomes comparable to the other methods when k approaches 70. These trends reflect the underlying principles of each approach: supervised RF-importance directly ranks features by their discriminative power, so even small feature subsets retain high informativeness. Unsupervised PCA and ICA preserve global variance or statistical independence, which may not align perfectly with class boundaries and thus require more dimensions to capture all discriminative patterns. The correlation-based method focuses on reducing feature redundancy rather than enhancing class separability, which explains its weaker performance when the number of selected features is severely limited.

4.3.2. Computational Cost of Feature Engineering

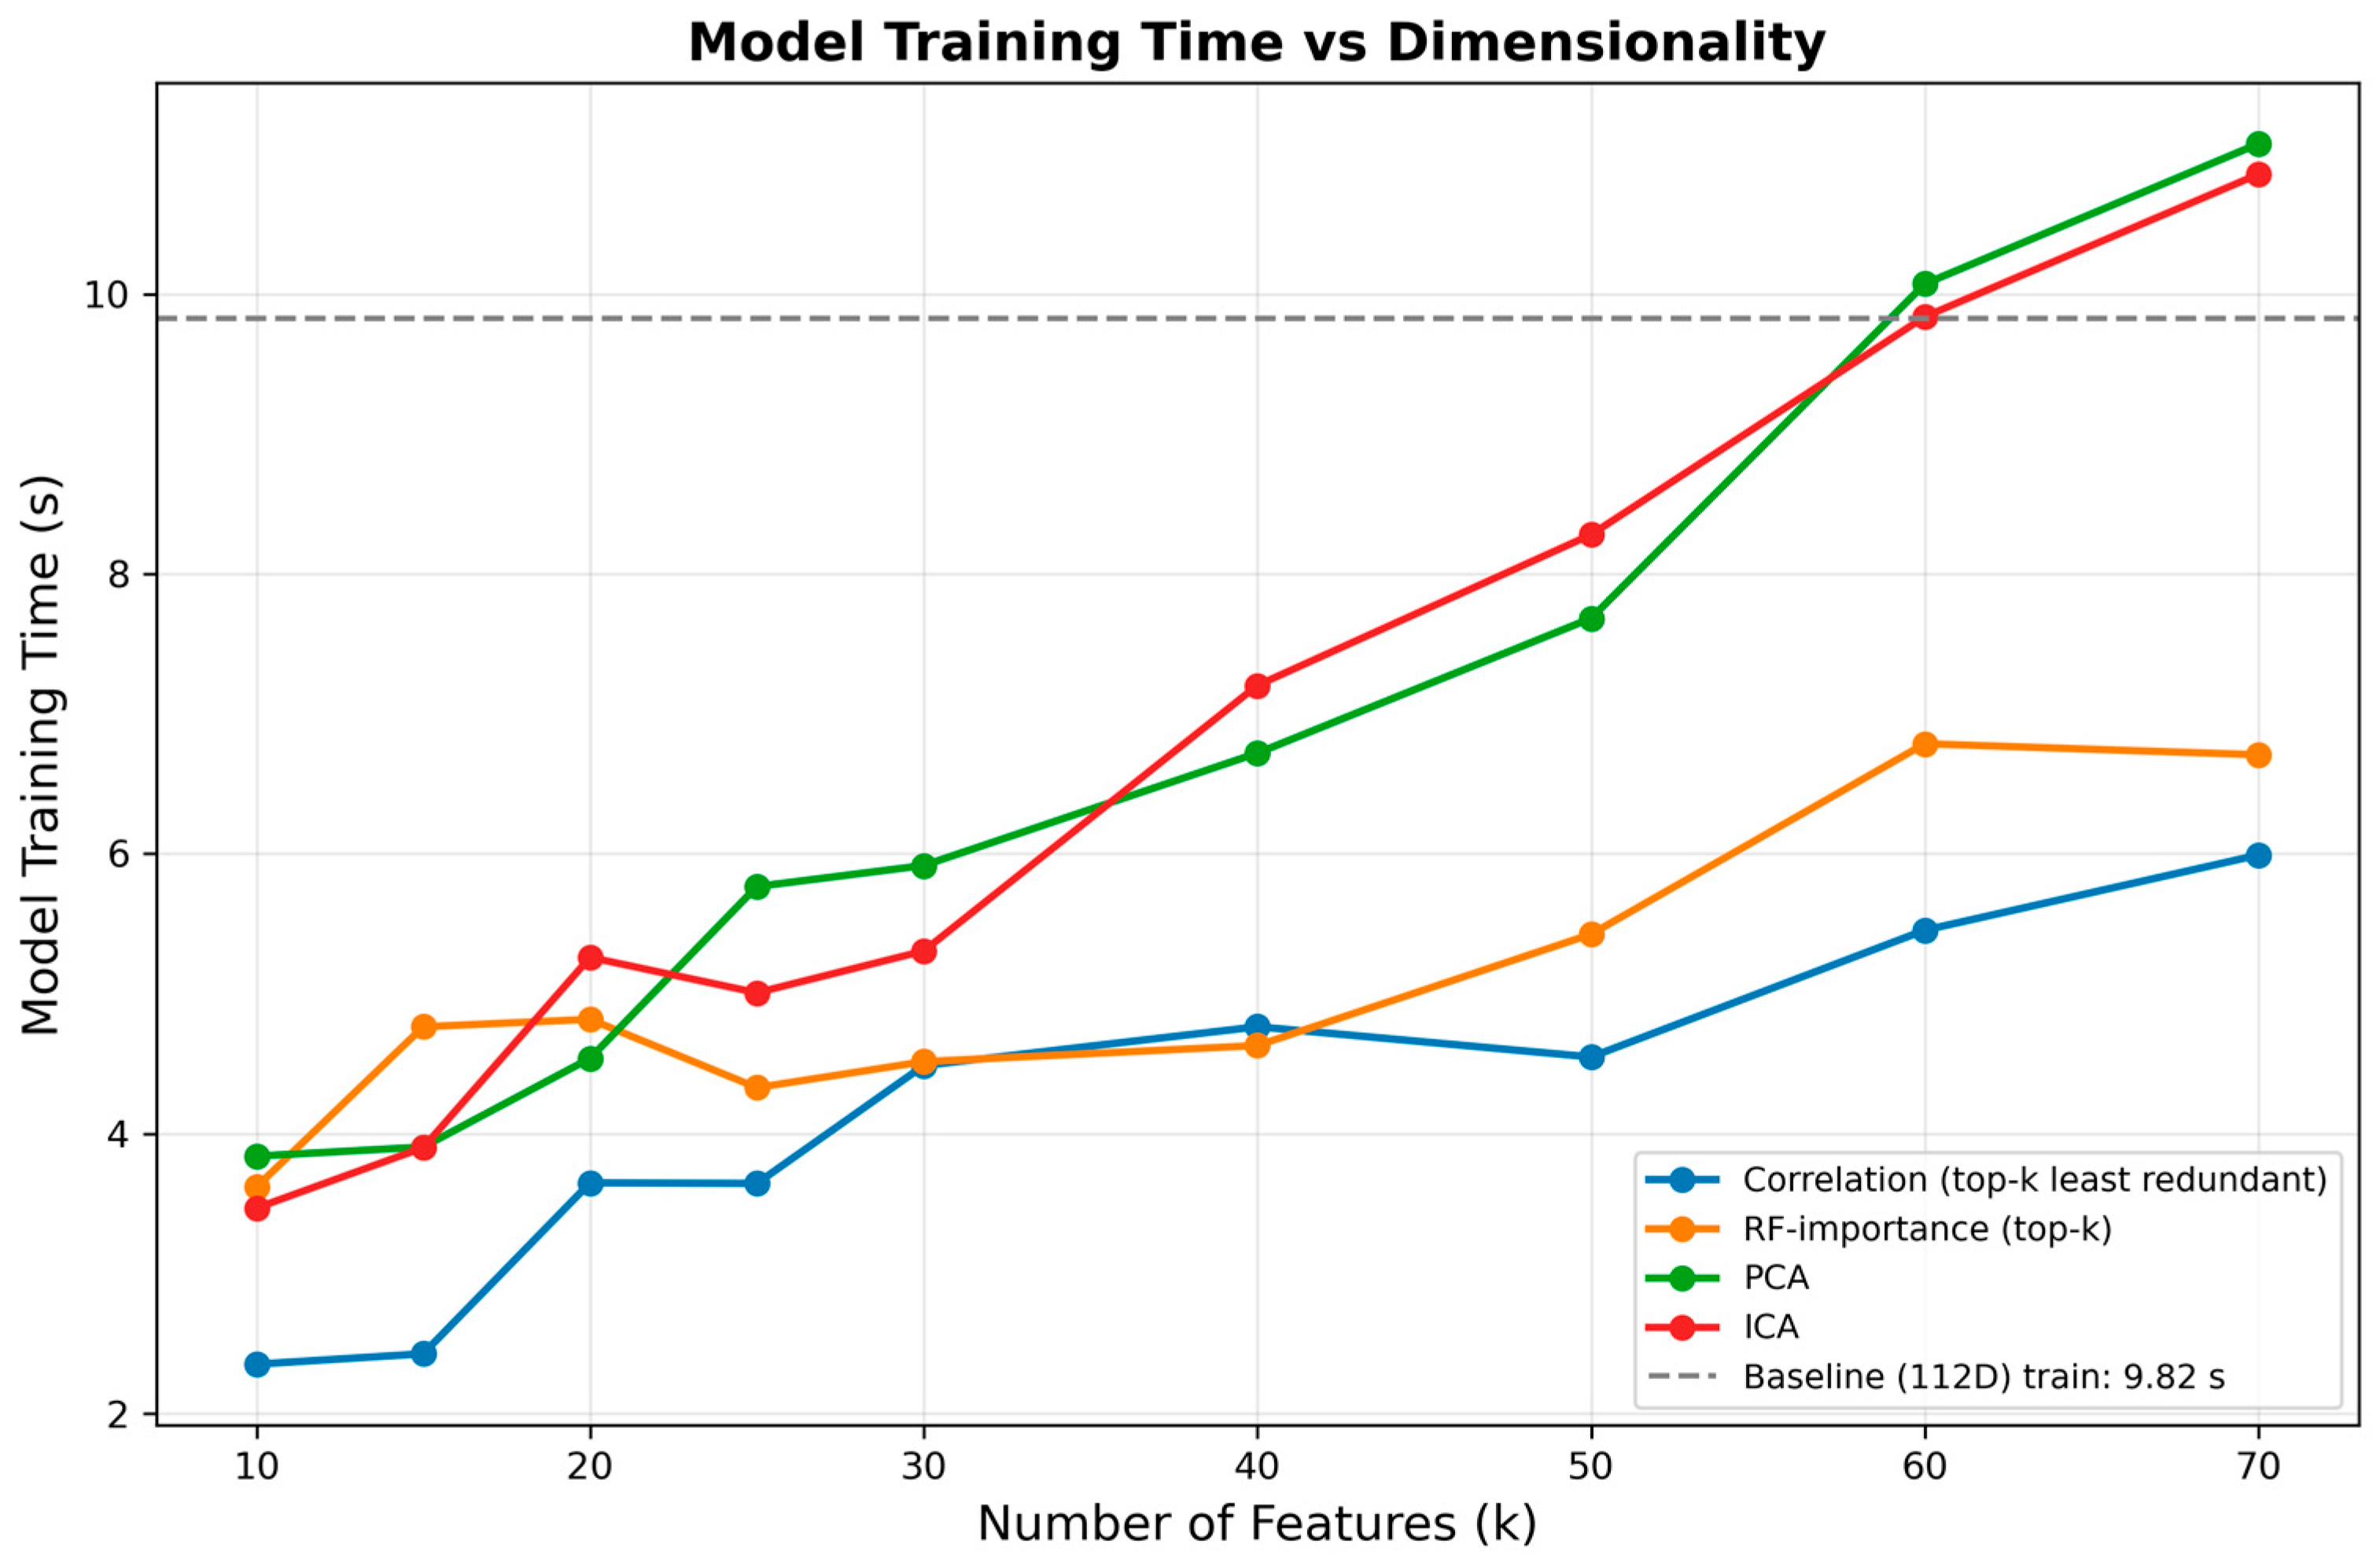
Table 5 reports the decomposition of feature-rule learning time and model-training time across target dimensions k , alongside the 112-dimensional baseline. For rule learning, correlation-based selection and PCA incur small and nearly constant costs: the former requires a single computation of the 112 × 112 correlation matrix, and the latter performs one SVD on the full feature space. Consequently, their rule-learning time is essentially independent of k . RF-importance introduces a one-off random forest training phase, resulting in a higher—yet still moderate—overhead. By contrast, ICA exhibits a pronounced increase in rule-learning time as k grows, owing to the iterative optimisation and larger matrix operations required to estimate additional independent components.
As illustrated in Figure 5, the model-training times clearly demonstrate the benefits of dimensionality reduction. In the low- to mid-range of k (approximately 10–30), all four strategies train the XGBoost detector substantially faster than the 112-dimensional baseline while achieving comparable macro-level performance. As k increases towards 60–70, the training times for PCA and ICA gradually rise and eventually approach or slightly exceed the baseline. This pattern can be attributed to the fundamental difference in how features are constructed. As k increases, the computational benefit of simply having fewer dimensions diminishes. More critically, PCA and ICA produce dense, transformed features—each new component is a linear combination of all original features. Consequently, a tree-based model must evaluate these complex, composite features at every potential split, which incurs significant computational overhead. In contrast, feature selection methods (correlation and RF-importance) preserve a sparse representation by retaining only a subset of the original features. Thus, even at higher k , the model processes the same native features as the baseline, leading to training costs that remain at or below the 112-dimensional level.
Overall, moderate target dimensions (e.g., k 25 –40) offer a practical compromise, retaining nearly the same detection performance as the full feature set while reducing offline training cost and clearly highlighting the differing computational characteristics of supervised feature selection versus unsupervised feature extraction.

4.4. Class Balancing Strategy Comparison Results

Based on the optimal trade-off identified in Section 4.3 (k = 25 via RF-based selection), we adopt this configuration for subsequent experiments. Crucially, this supervised selection preserves the original features’ semantics, a prerequisite for the model-interpretability analysis conducted later in Section 4.7. Here, we evaluate how various class-balancing strategies affect detection performance within this fixed 25-dimensional feature space. All models are assessed on the original, imbalanced test set to reflect realistic deployment conditions.
To address the severe skew in Table 3—where majority categories such as normal, password and injection contain tens of thousands of training instances, while rare attacks like ransomware and mitm are under-represented by nearly two orders of magnitude—we employ a median-based oversampling policy. Specifically, only classes whose training size falls below the global median are resampled, and each such class is increased to the median count; classes above the median are left unchanged. This design narrows the gap between frequent and rare attacks without inflating minority classes to match the largest majority class, which would introduce an unrealistic number of synthetic samples. Within this setting, we compare a “No Balancing” baseline against five basic oversampling strategies applied individually: Random OverSampling (ROS), Synthetic Minority Over-sampling Technique (SMOTE), SMOTE–Tomek Links, Borderline-SMOTE, and ADASYN.
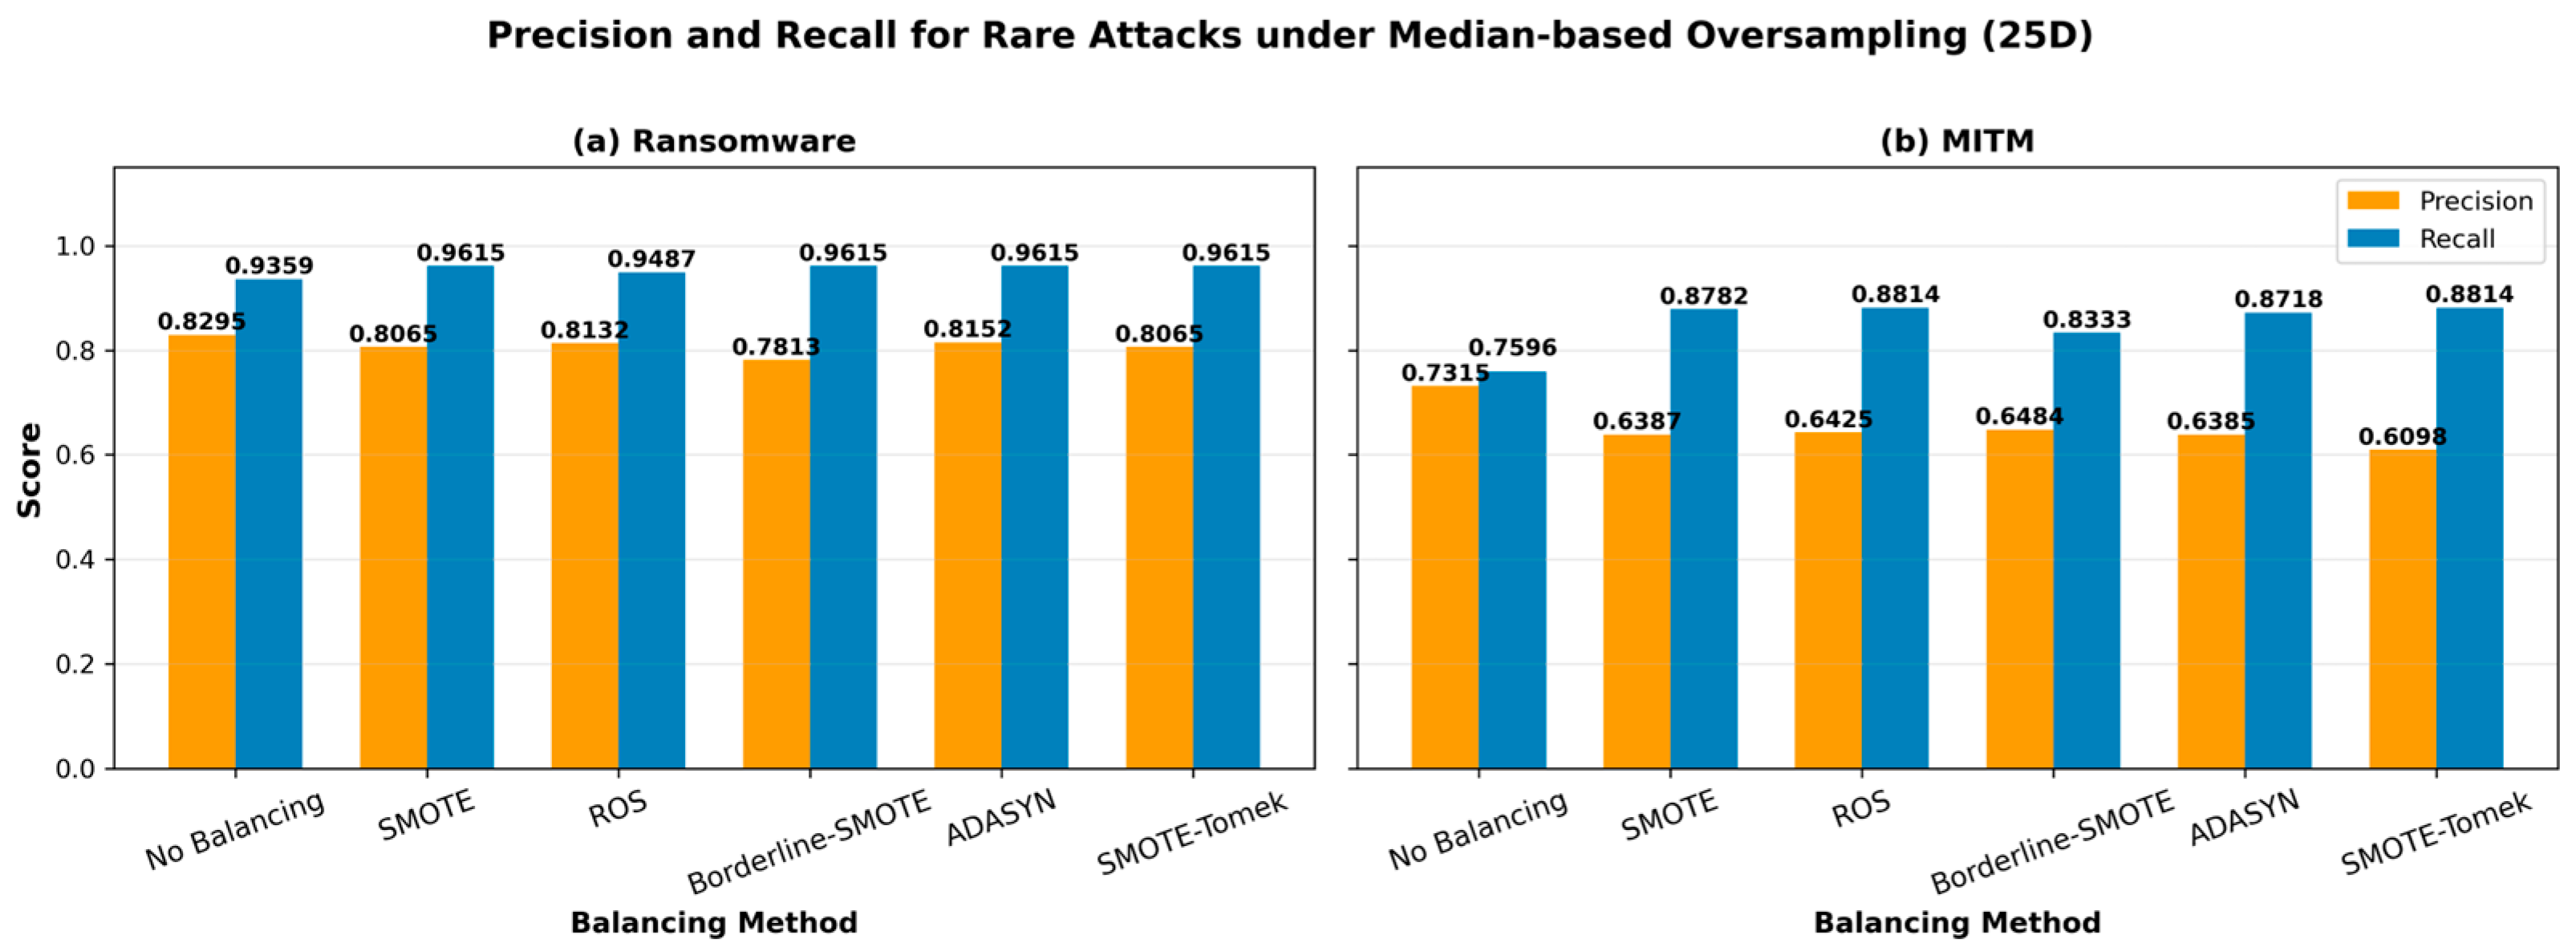
Table 6 presents the precision, recall, and F1-score for the rare attack classes ransomware and mitm, comparing the performance under each median-based oversampling strategy against the unbalanced baseline. For ransomware, the baseline already attains a high F1 score, and the oversampling methods largely preserve this level: median-based ROS, SMOTE and SMOTE–Tomek maintain F1 values comparable to the baseline, while ADASYN yields a small improvement. For mitm, the differences are more visible. ROS, SMOTE and ADASYN all deliver higher F1 than the baseline by substantially improving recall at a moderate precision cost, whereas SMOTE–Tomek and particularly Borderline-SMOTE incur a clearer F1 reduction due to a sharper drop in precision. Overall, the table shows that median-based oversampling does not dramatically change macro-level performance, but can noticeably reshape the error allocation for rare attacks.
The precision–recall behavior behind these trends is illustrated in Figure 6, which compares ransomware and MITM precision and recall across the five oversampling strategies and the baseline. For ransomware, all median-based oversampling methods push recall close to saturation while only moderately reducing precision, so that their precision–recall profiles cluster around a similar high-F1 region; Borderline-SMOTE trades slightly more precision for recall than the other methods, but the differences remain relatively small. For MITM, the trade-off is more pronounced: all five strategies clearly increase recall relative to the unbalanced baseline, moving the classifier towards more complete coverage of this rare attack, while accepting a noticeable decrease in precision. Among them, SMOTE–Tomek exhibits the strongest precision loss, whereas ROS, SMOTE, Borderline-SMOTE and ADASYN occupy a more moderate part of the precision–recall frontier, offering various options depending on how much false-alarm overhead can be tolerated.
In summary, these findings demonstrate that under a median-based resampling policy, standard oversampling techniques function primarily as recall amplifiers for rare attack classes—most notably mitm—rather than as tools for boosting aggregate accuracy metrics. This behavior directly serves core security imperatives: in intrusion detection, minimizing missed detections of high-impact, low-frequency attacks is often more critical than suppressing false positives. Consequently, instead of proclaiming a single optimal technique, our study maps out a practical precision–recall trade-off frontier across the five methods examined (ROS, SMOTE, SMOTE–Tomek, Borderline-SMOTE, and ADASYN). Security practitioners can navigate this frontier by selecting a strategy that aligns with their operational tolerance for increased false alarms in exchange for enhanced detection coverage of critical minority threats.

4.5. Model Performance Optimization Results

This section studies how the design of the XGBoost classifier influences detection performance under the fixed input configuration. We focus on several key hyperparameters—tree depth, number of trees, learning rate, and sampling fractions—and examine how different settings affect the balance between macro-level accuracy and training cost. To conduct this hyperparameter exploration in a controlled setting, we adopt a fixed class balancing strategy. Based on the analysis in Section 4.4, which demonstrated that median-based oversampling techniques primarily function as recall amplifiers for rare attack classes, we select ADASYN as the balancing method for these experiments, as it aligns with our overall objective of minimizing missed detections of critical minority threats. It is important to note that this selection is made for the purpose of unified performance evaluation and does not imply that ADASYN is universally optimal. With the feature representation (25D RF-selected features) and class balancing strategy (median-based ADASYN) fixed, we systematically vary XGBoost hyperparameters to identify configurations that achieve the best balance between detection accuracy and computational efficiency.
Table 7 presents the macro-averaged F1 score and training time for a selected set of XGBoost hyperparameter configurations. Among these, the model with 100 trees, a maximum depth of 6, and a learning rate of 0.3 achieves the highest macro F1 (0.9403) while maintaining a moderate training duration (6.47 s). The configuration with 100 trees, depth 8, and learning rate 0.3 attains a slightly lower macro F1 (0.9397) with longer training time (7.54 s). Reducing model capacity—either by decreasing the number of trees to 50 or by limiting the tree depth to 3—lowers the macro F1 score (to 0.9356 and 0.9283, respectively) with only modest savings in training time, indicating that overly simplified models fail to capture the complex decision boundaries essential for multi-class intrusion detection. In contrast, expanding model capacity does not yield consistent improvements: doubling the number of trees to 200 (with learning rate lowered to 0.1) produces a lower macro F1 (0.9374) at nearly double the computational cost (12.03 s vs. 6.47 s); and disabling subsampling offers no accuracy advantage (macro F1 = 0.9386) over the same configuration with subsampling enabled. Taken together, these results demonstrate that the configuration with 100 trees, depth 6, learning rate 0.3, and subsampling provides the most favorable balance between macro-level detection performance and computational efficiency among the candidates evaluated.
In summary, the configuration with 100 trees, depth 6, learning rate 0.3, and subsample 0.8 provides the most favorable balance between macro-level accuracy and computational cost among the candidates tested. More complex settings mainly add computational overhead without improving detection performance, whereas simpler models sacrifice noticeable accuracy for only limited efficiency gains. Therefore, we adopt this configuration as the default XGBoost classifier in all subsequent experiments.

4.6. Final Detection Performance Evaluation

This section evaluates the final detection performance of the XGBoost classifier on the ToN-IoT dataset. The evaluation is conducted from two perspectives: binary classification, which focuses on the fundamental task of separating normal traffic from attacks, and multi-class classification, which distinguishes between normal traffic and multiple attack categories. The assessment provides comprehensive metrics and visualizations to demonstrate the model’s effectiveness in intrusion detection. The model is trained using the optimized configuration identified in previous experimental sections and evaluated on the original imbalanced test set to reflect realistic deployment conditions.

4.6.1. Binary Classification Performance

Having established the optimized model configuration, we now evaluate its detection performance. We begin with the core task: distinguishing normal from attack traffic in a binary detection task. This order of evaluation is motivated by three principal considerations: binary detection represents the fundamental, practical function of an intrusion detection system, directly determining its ability to flag malicious activity; it removes the confounding effect of inter-class imbalance, providing a clearer assessment of the model’s capacity to separate normal and anomalous traffic; and multi-class recognition can be viewed as a fine-grained extension of this binary task, making the binary results a necessary baseline for interpreting the detailed multi-class performance. Consequently, we first present the binary anomaly detection results, followed by an analysis of the model’s fine-grained, multi-class classification capability.
As shown in Figure 7, the confusion matrix illustrates the classification performance of the model in distinguishing benign (normal) traffic from attack traffic. The results indicate that the model achieves high accuracy in the binary anomaly detection task, with the counts on the diagonal (correct classifications) substantially exceeding those off the diagonal (misclassifications). Specifically, 7036 benign samples are correctly identified, with only 65 false positives; meanwhile, 20,961 attack samples are successfully detected, with only 41 false negatives. The overall accuracy reaches 99.62%, with a recall of 99.80%, while maintaining a very low false positive rate (0.92%) and false negative rate (0.20%). These metrics demonstrate that the model reliably separates normal from anomalous behavior, meeting the core requirements of an intrusion detection system—high recall and low false positive rate—and underscoring its strong potential for practical deployment.
In Table 8, we evaluate the binary anomaly-detection performance of the proposed method against existing approaches on the ToN-IoT dataset.
In the experimental comparison, the proposed method demonstrates strong overall results. It achieves an accuracy of 99.62%, comparable to the 99.6% reported by Lazzarini et al. and higher than other works; a precision of 99.69%, which, while slightly lower than the 100% obtained by Lo et al., is markedly higher than the 90.55% reported by Kumar et al.; a recall of 99.80%, slightly below the 99.98% of Kumar et al. but surpassing the 99.4% of Lazzarini et al., while avoiding the extreme precision-recall imbalance seen in Kumar et al.’s approach; and an F1 score of 99.75%, which reaches the highest level among all compared methods. Overall, the proposed method attains a more balanced performance between precision and recall than existing alternatives, confirming its effectiveness and practical utility for network intrusion detection.

4.6.2. Multi-Class Classification Performance

Building on the strong performance in binary anomaly detection, we further evaluate the model’s capability for fine-grained classification of specific attack types. While the binary task confirms that the model can reliably separate normal from attack traffic, the multiclass task extends this by distinguishing nine detailed attack categories—backdoor, DDoS, DoS, injection, MITM, password, ransomware, scanning, and XSS. This multiclass evaluation not only demonstrates that the model’s binary detection proficiency generalizes to finer distinctions, but also reveals its per-class recognition accuracy and misclassification patterns. The results offer practical performance references for attack-type identification in real-world deployment.
Table 9 presents the per-class performance metrics (Precision, Recall, and F1-Score) for each of the ten classes. The model achieves strong performance across most attack categories, with F1-scores exceeding 0.95 for the majority of classes. Specifically, backdoor, ddos, injection, normal, password, scanning, and xss all attain F1-scores above 0.95, demonstrating the model’s capability to accurately identify these attack types. Among the minority classes, ransomware achieves a competitive F1-score of 0.8824 with high recall (0.9615), indicating effective detection of this rare but critical threat. The mitm class shows relatively weaker performance compared to other attack types, with an F1-score of 0.7371. This lower performance stems primarily from reduced precision (0.6385), while maintaining a relatively high recall (0.8718). However, this precision-recall trade-off aligns with the core security imperative established in our earlier analysis: in intrusion detection, minimizing missed detections of critical threats is often more critical than suppressing false positives. The model’s high recall for mitm (0.8718) ensures that most mitm attacks are detected, even if some false alarms occur, which is an acceptable trade-off for maintaining comprehensive threat coverage.
Figure 8 shows the confusion matrix, which reveals the classification patterns and error distributions across the ten classes. The overall classification accuracy reaches 97.50%, with a macro-averaged F1-score of 0.9403 and a weighted F1-score of 0.9756, indicating robust multi-class classification performance across the diverse attack landscape. The diagonal elements dominate the matrix, with most classes achieving correct classification rates above 95%. Notably, backdoor achieves perfect classification (100.00%), with all 590 test samples correctly identified. Normal traffic and password attacks also show excellent performance, with correct classification rates of 99.08% and 98.14%, respectively.
Overall, the multi-class classification results demonstrate that the model not only maintains high accuracy in distinguishing normal traffic from attacks, but also achieves fine-grained identification of specific attack types with strong performance across most categories, providing a solid foundation for practical intrusion detection deployment.

4.7. Interpretability Analysis Results (SHAP)

While the previous sections have demonstrated the model’s strong detection performance, understanding why the model makes specific classification decisions is equally important for building trust and improving system reliability. Most existing research in network intrusion detection focuses primarily on achieving high accuracy metrics, often overlooking post-hoc interpretability analysis that can reveal the underlying decision-making mechanisms. This gap limits practitioners’ ability to understand model behavior and gain insights into attack characteristics.
To address this, we employ SHAP (SHapley Additive exPlanations) for a two-stage interpretability analysis. Beyond merely listing important features, we aim to answer a more fundamental question: Does the model develop distinct, semantically meaningful “strategies” for recognizing different types of network threats? We first identify global decision drivers, then dissect class-specific feature dependencies. The results reveal a coherent taxonomy of detection strategies, demonstrating that the model’s internal logic aligns with the technical nature of various attacks, thereby enhancing trust in its outputs.

4.7.1. Global Feature Importance Analysis

To understand which features the model relies on most across all decisions, we first examine global feature importance. The SHAP analysis follows a standard paradigm: a fixed background dataset of 500 samples is sampled from the balanced training set using stratified sampling, serving as a unified baseline for all SHAP calculations. For global analysis, a balanced explanation dataset is constructed by randomly selecting 50 samples per class from the test set, ensuring fair representation of all classes to observe overall patterns. Using SHAP (SHapley Additive exPlanations), we analyze the average feature contributions across all classes and samples to identify the global driving factors of model decisions.
Figure 9 presents a SHAP summary plot illustrating how feature values influence the model’s predictions. Each point represents a single sample. Its horizontal position indicates the SHAP value (contribution to the output), while its color corresponds to the original feature value—red for values above the median and blue for values below the median in the explanation dataset.
The plot highlights nonlinear relationships between features and their SHAP contributions. For key quantitative features such as duration, src_pkts, and src_bytes, SHAP values are widely distributed across both positive and negative ranges. This spread indicates that the influence of these features depends on context rather than following a simple linear trend. For example, src_pkts shows a negative correlation with SHAP values, where lower feature values tend to have higher positive SHAP values, pushing predictions toward attack classes, while higher values are associated with lower or negative SHAP values. Similarly, duration exhibits a weak positive correlation, but both high and low values can correspond to either positive or negative SHAP values, reflecting its context-dependent impact.
Categorical features show clearer directional patterns. The presence of states such as conn_state_REJ generally contributes positively to attack predictions, with red dots clustered on the positive SHAP side, whereas their absence clusters near zero or slightly negative impact. In contrast, features like src_ip_bytes exhibit an inverse tendency: higher feature values are associated with negative SHAP values, while lower values show positive SHAP values, suggesting that lower src_ip_bytes values are more indicative of attack patterns. dst_ip_bytes follows a more conventional pattern, with high values contributing positively to attack predictions and low values contributing negatively.
Figure 10 quantifies the global importance of the top 15 features through their mean absolute SHAP values. The results show a clear hierarchy of feature importance, with network traffic statistics features dominating the rankings. src_pkts ranks highest, followed closely by duration and src_bytes, with these three features showing similar importance levels. This is followed by src_ip_bytes, dst_ip_bytes, and dst_bytes, forming a group of byte and packet count features that collectively drive most of the model’s global decision-making. Connection state features (conn_state_REJ) and protocol features (proto_tcp) appear in the lower ranks but still contribute meaningfully. The importance distribution is highly skewed, with the top few features accounting for the majority of the model’s global impact, while lower-ranked features show progressively smaller contributions. This indicates that a small subset of traffic statistics features drives most of the model’s decisions across all classes.
The analysis reveals that basic network traffic statistics (packet counts, duration, byte counts) are the primary global driving factors, rather than application-layer content features. This finding aligns with network intrusion detection domain knowledge: attack traffic typically exhibits anomalies in traffic patterns (e.g., unusual packet transmission volumes, abnormal connection durations). These statistical features are more globally decisive than payload content features, validating the effectiveness of preserving these basic statistical features in feature engineering and providing important insights into the model’s decision mechanism for distinguishing normal from anomalous traffic.

4.7.2. Class-Specific Feature Importance

While global feature importance reveals the overall feature contributions across all classes, it may mask class-specific decision patterns. Different attack types often exhibit distinct network behaviors, leading the model to rely on different feature subsets for accurate classification. To uncover these class-specific patterns, we perform SHAP analysis for each attack type using all test samples of that class as the explanation dataset, while maintaining the same fixed background dataset (500 stratified samples from the balanced training set) as established in Section 4.7.1. This approach ensures consistent baseline comparisons while revealing how the model adapts its feature usage across different attack categories, highlighting the heterogeneity of network intrusion patterns.
  • Group 1: Byte/Packet-Dominant Classes
Injection, XSS, and Password attacks exhibit similar feature dependency patterns, with byte and packet count features dominating their decision processes.
As shown in Figure 11, the three attack types exhibit a consistent reliance on byte- and packet-related features. In each case, high values of src_bytes and dst_bytes (represented by red dots) produce strong positive SHAP values, driving predictions toward the corresponding attack class. This pattern aligns with the nature of these application-layer attacks: injection, XSS, and password attacks typically involve transmitting substantial payloads (SQL injection code, JavaScript scripts, or password dictionaries) within HTTP requests, resulting in high byte volumes. For dst_ip_bytes, high values are indicative for injection and password attacks, while XSS shows a different pattern. However, packet count features (src_pkts, dst_pkts) exhibit more complex relationships: for all three classes, low src_pkts values are more indicative of these attacks, while dst_pkts shows varying patterns across classes. This inverse relationship between packet counts and byte volumes reflects the typical HTTP POST request pattern—fewer but larger packets containing substantial payload data—which is characteristic of these application-layer attacks.
For injection attacks, src_bytes and dst_bytes are the most influential features, with elevated byte counts yielding particularly high positive SHAP contributions. This is consistent with SQL injection attacks, which often involve embedding malicious SQL code within HTTP request bodies, resulting in high byte transmission. XSS attacks follow a similar trend, where src_bytes and duration are the top discriminators. The importance of duration for XSS attacks aligns particularly with stored XSS attacks, which often require sustained malicious scripts to remain active on a compromised page, leading to longer-lived connections associated with the attack session. Password attacks also depend heavily on byte-volume features, most notably src_bytes and dst_ip_bytes. Additionally, the service_- feature (indicating unknown services) shows that low values (representing known services) yield positive SHAP contributions for password attacks, reflecting that brute-force attempts predominantly target well-defined, specific services (e.g., SSH, FTP, HTTP), which is consistent with the attack’s service-specific nature.
The consistent positive relationship between high byte feature values (src_bytes, dst_bytes) and positive SHAP contributions across these three classes indicates that each attack type produces distinctive traffic volumes. The inverse relationship observed for src_pkts (where low values are more indicative) aligns with the application-layer attack pattern: these attacks typically manifest as HTTP POST requests containing large payloads in fewer packets, rather than high-frequency packet transmission. This pattern distinguishes them from network-layer attacks (e.g., DoS) that generate high packet counts. The model effectively recognizes these nuanced patterns through quantitative network features, demonstrating alignment between the learned feature dependencies and the underlying attack mechanisms.
  • Group 2: Connection State-Dominant Classes
DoS, Scanning, Backdoor, and DDoS attacks demonstrate a different pattern where connection state features play a prominent role alongside byte/packet features.
As shown in Figure 12, connection-state features play a prominent role in classifying these attack types.
DoS attacks are primarily identified by a high conn_state_REJ value, which produces a strong positive SHAP contribution—indicating that rejected connections are a key behavioral signature. This aligns with the nature of DoS attacks, which overwhelm target systems with excessive connection attempts, leading to connection rejections. Notably, src_pkts shows a positive relationship for DoS: high packet counts contribute positively to its detection, reflecting the high-volume packet flooding characteristic of DoS attacks. Additionally, src_ip_bytes exhibits an inverse relationship (low values are more indicative). This is consistent with the prevalence of small-packet floods (e.g., SYN/ACK floods) in many DoS attacks, which generate high packet counts (src_pkts) but low per-packet byte volume.
Scanning attacks show a similar dependence on conn_state_REJ and src_ip_bytes, where high src_ip_bytes values are strongly indicative. This pattern aligns with scanning behavior: port scanning and network reconnaissance generate numerous connection attempts, many of which are rejected, while the scanning source typically generates substantial source IP byte volumes. Here, service_- displays a clear directional pattern: low values (known services) contribute positively to scanning detection, while high values (unknown services) show negative contributions. This suggests that scanning activities are more likely to target well-known, standard service ports for reconnaissance, rather than obscure or custom ports.
Backdoor attacks produce the most distinct feature impact: high src_ip_bytes values yield exceptionally large positive SHAP values, making this the most discriminative indicator for this class. This reflects the operational pattern of backdoors, which often involve establishing persistent connections and transmitting command-and-control traffic, resulting in high source IP byte volumes.
DDoS attacks are characterized mainly by duration and conn_state_S1, with the presence of S1-state connections strongly suggesting DDoS activity. The importance of conn_state_S1 (half-open connections) aligns with SYN flood attacks, a common DDoS technique that exploits the TCP three-way handshake by sending SYN packets without completing connections, leaving numerous connections in the S1 (SYN-sent) state. The prolonged duration reflects the sustained nature of DDoS attacks. Notably, dst_ip_bytes shows an inverse relationship (low values are more indicative), which may reflect the asymmetric nature of DDoS attacks where attackers send many small packets to overwhelm targets.
The consistent importance of connection-state features across these classes highlights that the model recognizes protocol-level behavioral patterns, rather than relying solely on traffic volume. The distinct connection state signatures (REJ for DoS/scanning/backdoor, S1 for DDoS) demonstrate that the model effectively captures the underlying attack mechanisms at the network protocol level.
  • Group 3: Minority Classes
MITM and Ransomware attacks, despite having limited test samples, exhibit unique feature patterns that distinguish them from other attack types.
As shown in Figure 13, the two minority attack classes exhibit distinct feature patterns that reflect their underlying attack mechanisms.
MITM attacks are primarily identified by src_pkts, service_ssl, and dst_bytes. The strong positive SHAP contribution of service_ssl (high values yield positive SHAP values) is consistent with the fact that MITM attacks frequently occur within encrypted communications or interact with SSL/TLS sessions. The model therefore appears to leverage SSL-related traffic as a contextual indicator for this attack type. For src_pkts, high values contribute positively to detection, which may reflect the additional packet forwarding or occasional packet injection associated with attacker-in-the-middle positioning. In contrast, dst_bytes exhibits a distinct inverse pattern: low values yield positive SHAP contributions, while high values are associated with negative contributions. This may be related to the traffic interception or disruption that can occur during MITM activities, potentially reducing the amount of data successfully reaching the intended destination compared to normal high-throughput encrypted sessions.
Ransomware attacks display the most distinctive signature, where duration is the dominant feature with exceptionally strong positive SHAP contributions. Notably, these ransomware samples typically exhibit duration values that fall below the median of the background dataset (represented by blue dots), yet they occupy a distinctive, prolonged range that distinguishes them from very long benign sessions. This pattern precisely matches the prolonged but finite encryption and command-and-control phases of a ransomware attack. Additionally, proto_tcp shows strong positive impacts when its value is high, indicating that ransomware generates substantial TCP-based packet activity during its operation, consistent with the network communication patterns required for data exfiltration or command-and-control activities.
The unique feature dependencies observed in these minority classes underscore the value of class-specific analysis. Such distinct decision patterns—particularly the SSL-focused pattern for MITM attacks and the duration-based signature for ransomware—would likely be obscured in global feature importance calculations, demonstrating that the model effectively captures attack-specific behavioral signatures.
  • Group 4: Normal Traffic
As shown in Figure 14, normal network traffic is characterized by distinct feature patterns that differentiate it from attack classes. The most discriminative features for normal traffic are conn_state_S0 and proto_tcp. High values of conn_state_S0 yield positive SHAP contributions, indicating that established connections (S0 state) are typical of normal traffic. Notably, proto_tcp exhibits an inverse relationship: low values (non-TCP protocols) are more indicative of normal traffic, with high TCP values showing weaker positive contributions compared to non-TCP. This pattern demonstrates that the model effectively distinguishes benign traffic by recognizing typical network behavior characteristics—established connection states and protocol-level patterns.
Class-specific SHAP analysis reveals distinct feature patterns across attack categories. Injection, XSS, and password attacks are primarily characterized by high byte volumes coupled with lower packet counts, with src_bytes consistently influential. In contrast, DoS, scanning, backdoor, and DDoS attacks show stronger dependence on connection states—notably conn_state_REJ for DoS/scanning and conn_state_S1 for DDoS. Minority classes exhibit unique signatures: ransomware is identified by prolonged duration and high packet activity, while MITM attacks associate with service_ssl, high src_pkts, and an inverse pattern on dst_bytes (where low values are indicative), reflecting their focus on intercepting and potentially disrupting encrypted traffic.
However, this analysis also reveals an important limitation: individual features often exhibit conflicting patterns across different classes. For instance, high src_pkts values are associated with DoS, MITM, and scanning attacks, while low src_pkts values are associated with XSS, injection, password, and ransomware attacks. Similarly, features such as duration and src_bytes show opposing relationships across different attack categories. This demonstrates that single features cannot independently determine class membership; instead, the model relies on feature combinations and contextual relationships. The XGBoost classifier effectively leverages these multi-feature interactions to achieve accurate classification, as evidenced by the high overall performance metrics.


5. Conclusions and Future Work

This study presents a network intrusion detection method based on XGBoost, evaluated on the ToN-IoT dataset. We examine how feature engineering, dimensionality reduction, class balancing strategies, and hyperparameter optimization improve detection performance. The method achieves strong results in both binary and multi-class classification, with F1-scores comparable to or better than existing approaches on ToN-IoT. Additionally, we use SHAP to interpret the model’s decisions, showing that it relies on network traffic statistics and exhibits distinct feature dependency patterns for different attack types—consistent with known attack principles.
Despite these results, several limitations remain. First, validation is confined to the ToN-IoT dataset; generalization to other datasets and network environments requires further testing. Second, the feature engineering and selection pipeline, while systematic, still relies on domain expertise for the initial design and evaluation of candidate techniques. Third, while our framework demonstrates computational efficiency in offline training, its performance under strict real-time detection constraints (e.g., on edge devices with limited memory and processing power) has not been empirically validated in a deployment setting.
Based on these limitations, our future work should focus on the following directions: First, validating the method across multiple public datasets to assess robustness and transferability. Second, exploring efficient online learning and incremental update mechanisms to improve real-time detection and reduce computational overhead. Third, integrating deep learning methods to capture temporal and contextual features, which may improve performance on minority classes. Fourth, developing end-to-end automated pipelines for feature engineering and model selection to decrease reliance on domain knowledge and enhance applicability across diverse network environments. Furthermore, to advance the evaluation of generalization capability in real-world scenarios, future work will explore rigorous session-based or device-based data splitting strategies on datasets with richer metadata. This will allow for a more robust assessment of model performance on completely unseen network entities and operational environments.

Author Contributions

Conceptualization, Y.H.; methodology, Y.H.; software, Y.H.; validation, Y.H.; formal analysis, Y.H.; investigation, Y.H.; writing—original draft preparation, Y.H.; writing—review and editing, K.X., L.L. and L.C.; visualization, Y.H.; supervision, K.X.; resources, K.X.; data curation, Y.H.; project administration, K.X.; funding acquisition, K.X. All authors have read and agreed to the published version of the manuscript.

Funding

This research received no external funding.

Institutional Review Board Statement

Not applicable.

Informed Consent Statement

Not applicable.

Data Availability Statement

The TON_IoT datasets used in this study are publicly available online at: https://research.unsw.edu.au/projects/toniot-datasets, accessed on 10 October 2025.

Acknowledgments

The authors would like to thank the University of Electronic Science and Technology of China (UESTC) for supporting this research. We also appreciate the constructive comments from the reviewers. During the preparation of this work, the authors used ChatGPT (OpenAI, version GPT-4) for the purpose of language translation and proofreading to improve the clarity and fluency of the manuscript. The authors have thoroughly reviewed, edited, and verified the content, and take full responsibility for all information presented in this publication.

Conflicts of Interest

The authors declare no conflict of interest.

References

  1. Zhang, Y.; Li, P.; Wang, X. Intrusion detection for IoT based on improved genetic algorithm and deep belief network. IEEE Access 2019, 7, 31711–31722. [Google Scholar] [CrossRef]
  2. Kasongo, S.M. An advanced intrusion detection system for IIoT based on GA and tree based algorithms. IEEE Access 2021, 9, 113199–113212. [Google Scholar] [CrossRef]
  3. Verwoerd, T.; Hunt, R. Intrusion detection techniques and approaches. Comput. Commun. 2002, 25, 1356–1365. [Google Scholar] [CrossRef]
  4. Bay, S.D.; Kibler, D.; Pazzani, M.J.; Smyth, P. The UCI KDD archive of large data sets for data mining research and experimentation. ACM SIGKDD Explor. Newsl. 2000, 2, 81–85. [Google Scholar] [CrossRef]
  5. NSL-KDD | Datasets | Research | Canadian Institute for Cybersecurity |UNB. Available online: https://www.unb.ca/cic/datasets/nsl.html (accessed on 10 October 2025).
  6. Moustafa, N. A new distributed architecture for evaluating AI-based security systems at the edge: Network TON_IoT datasets. Sustain. Cities Soc. 2021, 72, 102994. [Google Scholar] [CrossRef]
  7. Liu, G.; Yi, Z.; Yang, S. A hierarchical intrusion detection model based on the PCA neural networks. Neurocomputing 2007, 70, 1561–1568. [Google Scholar] [CrossRef]
  8. Ding, S.; Xu, X.; Zhu, H.; Wang, J.; Jin, F. Studies on optimization algorithms for some artificial neural networks based on genetic algorithm (GA). J. Comput. 2011, 6, 939–946. [Google Scholar] [CrossRef]
  9. Zhang, H.; Huang, L.; Wu, C.Q.; Li, Z. An effective convolutional neural network based on SMOTE and Gaussian mixture model for intrusion detection in imbalanced dataset. Comput. Netw. 2020, 177, 107315. [Google Scholar] [CrossRef]
  10. Anderson, J.P. Computer Security Threat Monitoring and Surveillance; Technical Report; James P. Anderson Company: Fort Washington, PA, USA, 1980. [Google Scholar]
  11. Axelsson, S. Intrusion Detection Systems: A Survey and Taxonomy. Ph.D. Thesis, Chalmers University of Technology, Goteborg, Sweden, 2000. [Google Scholar]
  12. Tama, B.A.; Comuzzi, M.; Rhee, K.H. TSE-IDS: A two-stage classifier ensemble for intelligent anomaly-based intrusion detection system. IEEE Access 2019, 7, 94497–94507. [Google Scholar] [CrossRef]
  13. Hall, M.A. Correlation-Based Feature Selection for Machine Learning. Ph.D. Thesis, The University of Waikato, Hamilton, New Zealand, 1999. [Google Scholar]
  14. Ambusaidi, M.A.; He, X.; Nanda, P.; Tan, Z. Building an intrusion detection system using a filter-based feature selection algorithm. IEEE Trans. Comput. 2016, 65, 2986–2998. [Google Scholar] [CrossRef]
  15. Moustafa, N.; Turnbull, B.; Choo, K.K.R. An ensemble intrusion detection technique based on proposed statistical flow features for protecting network traffic of internet of things. IEEE Internet Things J. 2018, 6, 4815–4830. [Google Scholar] [CrossRef]
  16. Houkan, A.; Sahoo, A.K.; Gochhayat, S.P.; Sahoo, P.K.; Liu, H.; Khalid, S.G.; Jain, P. Enhancing security in industrial IoT networks: Machine learning solutions for feature selection and reduction. IEEE Access 2024, 12, 160864–160883. [Google Scholar] [CrossRef]
  17. Disha, R.A.; Waheed, S. Performance analysis of machine learning models for intrusion detection system using Gini Impurity-based Weighted Random Forest (GIWRF) feature selection technique. Cybersecurity 2022, 5, 1. [Google Scholar] [CrossRef]
  18. Aslahi-Shahri, B.M.; Rahmani, R.; Chizari, M.; Maralani, A.; Eslami, M.; Golkar, M.J.; Ebrahimi, A. A hybrid method consisting of GA and SVM for intrusion detection system. Neural Comput. Appl. 2016, 27, 1669–1676. [Google Scholar] [CrossRef]
  19. Khammassi, C.; Krichen, S. A GA-LR wrapper approach for feature selection in network intrusion detection. Comput. Secur. 2017, 70, 255–277. [Google Scholar] [CrossRef]
  20. Liu, J.; Yang, D.; Lian, M.; Li, M. Research on intrusion detection based on particle swarm optimization in IoT. IEEE Access 2021, 9, 38254–38268. [Google Scholar] [CrossRef]
  21. Sarwar, A.; Alnajim, A.M.; Marwat, S.N.K.; Ahmed, S.; Alyahya, S.; Khan, W.U. Enhanced anomaly detection system for iot based on improved dynamic SBPSO. Sensors 2022, 22, 4926. [Google Scholar] [CrossRef] [PubMed]
  22. Yan, B.; Han, G. Effective feature extraction via stacked sparse autoencoder to improve intrusion detection system. IEEE Access 2018, 6, 41238–41248. [Google Scholar] [CrossRef]
  23. Xu, X.; Wang, X. An adaptive Network Intrusion Detection Method Based on PCA and Support Vector Machines. In Proceedings of the International Conference on Advanced Data Mining and Applications, Berlin/Heidelberg, Germany, 22–24 July 2025; Springer: Berlin/Heidelberg, Germany, 2005; pp. 696–703. [Google Scholar]
  24. Abdulhammed, R.; Faezipour, M.; Musafer, H.; Abuzneid, A. Efficient Network Intrusion Detection Using PCA-Based Dimensionality Reduction of Features. In Proceedings of the 2019 International Symposium on Networks, Computers and Communications (ISNCC), Istanbul, Turkey, 18–20 June 2019; IEEE: New York, NY, USA, 2019; pp. 1–6. [Google Scholar]
  25. Moustafa, N.; Slay, J. UNSW-NB15: A Comprehensive Data Set for Network Intrusion Detection Systems. In Proceedings of the 2015 Military Communications and Information Systems Conference (MilCIS), Canberra, Australia, 10–12 November 2015. [Google Scholar]
  26. Khan, F.A.; Gumaei, A.; Derhab, A.; Hussain, A. A novel two-stage deep learning model for efficient network intrusion detection. IEEE Access 2019, 7, 30373–30385. [Google Scholar] [CrossRef]
  27. Zhou, X.; Hu, Y.; Liang, W.; Ma, J.; Jin, Q. Variational LSTM enhanced anomaly detection for industrial big data. IEEE Trans. Ind. Inform. 2020, 17, 3469–3477. [Google Scholar] [CrossRef]
  28. Popoola, S.I.; Adebisi, B.; Hammoudeh, M.; Gui, G.; Gacanin, H. Hybrid deep learning for botnet attack detection in the internet-of-things networks. IEEE Internet Things J. 2020, 8, 4944–4956. [Google Scholar] [CrossRef]
  29. Li, J.; Othman, M.S.; Chen, H.; Yusuf, L.M. Optimizing IoT intrusion detection system: Feature selection versus feature extraction in machine learning. J. Big Data 2024, 11, 36. [Google Scholar] [CrossRef]
  30. Dao, T.N.; Lee, H.J. Stacked autoencoder-based probabilistic feature extraction for on-device network intrusion detection. IEEE Internet Things J. 2021, 9, 14438–14451. [Google Scholar] [CrossRef]
  31. D’Angelo, G.; Palmieri, F. Network traffic classification using deep convolutional recurrent autoencoder neural networks for spatial–temporal features extraction. J. Netw. Comput. Appl. 2021, 173, 102890. [Google Scholar] [CrossRef]
  32. Chawla, N.V.; Bowyer, K.W.; Hall, L.O.; Kegelmeyer, W.P. SMOTE: Synthetic minority over-sampling technique. J. Artif. Intell. Res. 2002, 16, 321–357. [Google Scholar] [CrossRef]
  33. Belarbi, O.; Khan, A.; Carnelli, P.; Spyridopoulos, T. An Intrusion Detection System Based on Deep Belief Networks. In Proceedings of the International Conference on Science of Cyber Security, Shimane, Japan, 10–12 August 2022; Springer International Publishing: Cham, Switzerland, 2022; pp. 377–392. [Google Scholar]
  34. Chalichalamala, S.; Govindan, N.; Kasarapu, R. Logistic regression ensemble classifier for intrusion detection system in internet of things. Sensors 2023, 23, 9583. [Google Scholar] [CrossRef]
  35. Liu, C.; Antypenko, R.; Sushko, I.; Zakharchenko, O. Intrusion detection system after data augmentation schemes based on the VAE and CVAE. IEEE Trans. Reliab. 2022, 71, 1000–1010. [Google Scholar] [CrossRef]
  36. Kandhro, I.A.; Alanazi, S.M.; Ali, F.; Kehar, A.; Fatima, K.; Uddin, M.; Karuppayah, S. Detection of real-time malicious intrusions and attacks in IoT empowered cybersecurity infrastructures. IEEE Access 2023, 11, 9136–9148. [Google Scholar] [CrossRef]
  37. Quinlan, J.R. Induction of decision trees. Mach. Learn. 1986, 1, 81–106. [Google Scholar] [CrossRef]
  38. Hosmer, D.W.; Lemeshow, S.; Sturdivant, R.X. Applied Logistic Regression; John Wiley & Sons: Hoboken, NJ, USA, 2013. [Google Scholar]
  39. Saba, T.; Rehman, A.; Sadad, T.; Kolivand, H.; Bahaj, S.A. Anomaly-based intrusion detection system for IoT networks through deep learning model. Comput. Electr. Eng. 2022, 99, 107810. [Google Scholar] [CrossRef]
  40. Alalmaie, A.; Nanda, P.; He, X. Zero Trust Network Intrusion Detection System (NIDS) Using Auto Encoder for Attention-Based CNN-BiLSTM. In Proceedings of the 2023 Australasian Computer Science Week, Melbourne, Australia, 31 January–3 February 2023; pp. 1–9. [Google Scholar]
  41. Lo, W.W.; Layeghy, S.; Sarhan, M.; Gallagher, M.; Portmann, M. E-graphsage: A graph neural network based intrusion detection system for iot. arXiv 2021, arXiv:2103.16329. [Google Scholar]
  42. Gyamfi, E.; Jurcut, A.D. Novel online network intrusion detection system for industrial IoT based on OI-SVDD and AS-ELM. IEEE Internet Things J. 2022, 10, 3827–3839. [Google Scholar] [CrossRef]
  43. Lazzarini, R.; Tianfield, H.; Charissis, V. A stacking ensemble of deep learning models for IoT intrusion detection. Knowl.-Based Syst. 2023, 279, 110941. [Google Scholar] [CrossRef]
  44. Soltani, M.; Ousat, B.; Siavoshani, M.J.; Jahangir, A.H. An adaptable deep learning-based intrusion detection system to zero-day attacks. J. Inf. Secur. Appl. 2023, 76, 103516. [Google Scholar] [CrossRef]
  45. Arreche, O.; Guntur, T.R.; Roberts, J.W.; Abdallah, M. E-xai: Evaluating black-box explainable ai frameworks for network intrusion detection. IEEE Access 2024, 12, 23954–23988. [Google Scholar] [CrossRef]
  46. Dasari, A.K.; Bisawas, S.K.; Purkayastha, B. Enhanced Network Intrusion Detection Systems With Explainable Artificial Intelligence for Network Security. Int. J. Commun. Syst. 2025, 38, e70209. [Google Scholar] [CrossRef]
  47. Nugraha, B.; Jnanashree, A.V.; Bauschert, T. A versatile XAI-based framework for efficient and explainable intrusion detection systems. Ann. Telecommun. 2025, 80, 1095–1120. [Google Scholar] [CrossRef]
  48. Kalakoti, R.; Vaarandi, R.; Bahsi, H.; Nõmm, S. Evaluating explainable AI for deep learning-based network intrusion detection system alert classification. arXiv 2025, arXiv:2506.07882. [Google Scholar] [CrossRef]
  49. Breiman, L. Random forests. Mach. Learn. 2001, 45, 5–32. [Google Scholar] [CrossRef]
  50. Guyon, I.; Elisseeff, A. An introduction to variable and feature selection. J. Mach. Learn. Res. 2003, 3, 1157–1182. [Google Scholar]
  51. Wold, S.; Esbensen, K.; Geladi, P. Principal component analysis. Chemom. Intell. Lab. Syst. 1987, 2, 37–52. [Google Scholar] [CrossRef]
  52. Comon, P. Independent component analysis, a new concept? Signal Process. 1994, 36, 287–314. [Google Scholar] [CrossRef]
  53. Batista, G.E.; Prati, R.C.; Monard, M.C. A study of the behavior of several methods for balancing machine learning training data. ACM SIGKDD Explor. Newsl. 2004, 6, 20–29. [Google Scholar] [CrossRef]
  54. Han, H.; Wang, W.Y.; Mao, B.H. Borderline-SMOTE: A new over-sampling method in imbalanced data sets learning. In Proceedings of the International Conference on Intelligent Computing, Hefei, China, 23–26 August 2005; Springer: Berlin/Heidelberg, Germany, 2005; pp. 878–887. [Google Scholar]
  55. He, H.; Bai, Y.; Garcia, E.A.; Li, S. ADASYN: Adaptive synthetic sampling approach for imbalanced learning. In Proceedings of the 2008 IEEE International Joint Conference on Neural Networks (IEEE World Congress on Computational Intelligence), Hong Kong, China, 1–8 June 2008; IEEE: New York, NY, USA, 2008; pp. 1322–1328. [Google Scholar]
  56. Gad, A.R.; Haggag, M.; Nashat, A.A.; Barakat, T.M. A distributed intrusion detection system using machine learning for IoT based on ToN-IoT dataset. Int. J. Adv. Comput. Sci. Appl. 2022, 13, 548–563. [Google Scholar] [CrossRef]
  57. Kumar, P.; Gupta, G.P.; Tripathi, R. An ensemble learning and fog-cloud architecture-driven cyber-attack detection framework for IoMT networks. Comput. Commun. 2021, 166, 110–124. [Google Scholar] [CrossRef]
Figure 1. Network Intrusion Detection System Framework.
Applsci 16 00980 g001
Figure 2. Class distribution of ToN-IoT network traffic before and after data cleaning.
Applsci 16 00980 g002
Figure 3. XGBoost Ensemble Learning Architecture. The asterisk (*) denotes the optimal leaf weight (e.g., w*).
Applsci 16 00980 g003
Figure 4. Macro-F1 performance of dimensionality reduction strategies across target dimensions.
Applsci 16 00980 g004
Figure 5. Model training time versus feature dimensionalities.
Applsci 16 00980 g005
Figure 6. Precision and recall for ransomware and MITM under different median-based oversampling strategies on the 25-dimensional RF-selected feature space. (a) Ransomware, where most strategies maintain high recall with moderate precision loss; (b) MITM, illustrating a clear trade-off where oversampling strategies generally increase recall at the cost of precision.
Applsci 16 00980 g006
Figure 7. Binary Classification Confusion Matrix: Benign vs Attack.
Applsci 16 00980 g007
Figure 8. Multi-class Classification Confusion Matrix.
Applsci 16 00980 g008
Figure 9. SHAP summary plot for global feature importance.
Applsci 16 00980 g009
Figure 10. Top 15 features by global SHAP importance.
Applsci 16 00980 g010
Figure 11. SHAP summary plots for byte/packet-dominant attack classes.
Applsci 16 00980 g011
Figure 12. SHAP summary plots for connection state-dominant attack classes.
Applsci 16 00980 g012
Figure 13. SHAP summary plots for minority attack classes.
Applsci 16 00980 g013
Figure 14. SHAP summary plot for normal traffic.
Applsci 16 00980 g014
Table 1. Class Distribution of ToN-IoT Network Dataset.
Attack CategoryNumber of InstancesDescription
Normal Traffic500,000Common non-malicious activities
Password Attack20,000Obtaining login credentials via sniffing or brute-force methods
Ransomware Attack20,000Encrypting server data and demanding ransom for the decryption key
Scanning Attack20,000Unauthorized or malicious systematic scanning of networks or systems to identify vulnerabilities, open ports, or potential entry points
XSS Attack20,000Injecting malicious content into web applications to target end users
Man-in-the-Middle (MITM) Attack1043Intercepting and monitoring communications between the target and other hosts
Backdoor Attack20,000Exploiting hidden or unpublicized vulnerabilities to gain unauthorized access to systems, networks, or applications
Denial-of-Service (DoS) Attack20,000Intentionally overloading node resources (e.g., sensors or systems) to block data access
Distributed Denial-of-Service (DDoS) Attack20,000Similar to DoS attacks, but originating from multiple distributed sources
Injection Attack20,000Inserting malicious content into the system via SQL or command injection
Table 2. Feature Description of ToN-IoT Dataset.
No.Feature NameData TypeDescriptionFeature Group
1src_ipobjectSource IP addressConnection
2src_portint64Source TCP/UDP portConnection
3dst_ipobjectDestination IP addressConnection
4dst_portint64Destination TCP/UDP portConnection
5protoobjectTransport layer protocolConnection
6serviceobjectService type (e.g., DNS, HTTP, SSL)Connection
7durationfloat64Connection durationConnection
8src_bytesint64Bytes sent from sourceConnection
9dst_bytesint64Bytes sent to destinationConnection
10conn_stateobjectConnection state (e.g., S0, S1, REJ)Connection
11missed_bytesint64Number of missing bytesConnection
12src_pktsint64Number of packets from sourceStatistical
13src_ip_bytesint64Total IP bytes from sourceStatistical
14dst_pktsint64Number of packets to destinationStatistical
15dst_ip_bytesint64Total IP bytes to destinationStatistical
16dns_queryobjectDNS query nameDNS
17dns_qclassint64DNS query classDNS
18dns_qtypeint64DNS query typeDNS
19dns_rcodeint64DNS response codeDNS
20dns_AAobjectAuthoritative answer flagDNS
21dns_RDobjectRecursion desired flagDNS
22dns_RAobjectRecursion available flagDNS
23dns_rejectedobjectDNS request rejectedDNS
24ssl_versionobjectSSL version offered by serverSSL
25ssl_cipherobjectSSL cipher suite chosenSSL
26ssl_resumedobjectSSL session resumed flagSSL
27ssl_establishedobjectSSL connection established flagSSL
28ssl_subjectobjectX.509 certificate subjectSSL
29ssl_issuerobjectSSL certificate issuerSSL
30http_trans_depthobjectHTTP pipelined depthHTTP
31http_methodobjectHTTP request method (GET/POST/HEAD)HTTP
32http_uriobjectHTTP request URIHTTP
33http_versionobjectHTTP version (e.g., 1.1)HTTP
34http_request_body_lenint64Length of HTTP request bodyHTTP
35http_response_body_lenint64Length of HTTP response bodyHTTP
36http_status_codeint64HTTP response status codeHTTP
37http_user_agentobjectUser-Agent headerHTTP
38http_orig_mime_typesobjectSource MIME typesHTTP
39http_resp_mime_typesobjectResponse MIME typesHTTP
40weird_nameobjectName of protocol anomalyViolation
41weird_addlobjectAdditional information of protocol anomalyViolation
42weird_noticeobjectIndicates if anomaly was turned into noticeViolation
43labelint64Binary class label (0 = Normal, 1 = Attack)Label
44typeobjectMulti-class label (e.g., DoS, DDoS, Backdoor)Label
Table 3. Class distribution of the ToN-IoT network traffic dataset (training and testing sets).
SetAttack CategoryInstances
TrainNormal16,570
Password10,674
Ransomware182
Scanning3145
XSS6118
MITM727
Backdoor1376
DoS4514
DDoS8373
Injection13,894
TestNormal7101
Password4574
Ransomware78
Scanning1348
XSS2622
MITM312
Backdoor590
DoS1934
DDoS3589
Injection5955
Table 4. Hardware and software specifications of the implementation environment.
HardwareDescription
Computing platformLocal Windows Machine
ProcessorAMD64 Family 25 Model 80 (8 physical cores, 16 logical cores)
RAM32 GB
SoftwareDescription
Operating systemWindows 10 (10.0.26100)
Python3.9.13
Other packagesPandas(1.5.3), NumPy(1.22.3), Scikit-learn(1.6.1), Matplotlib(3.5.3), SciPy(1.7.3), XGBoost(2.1.4), SHAP(0.48.0), Imbalanced-learn(0.12.4), and Joblib(1.4.2)
Table 5. Feature rule-learning time and model-training time under different target dimensionalities.
MethodkRule Learning Time (s)Model Training Time (s)
Baseline (112D)1120.009.82
Correlation100.142.35
250.143.65
400.144.76
700.145.99
RF-importance101.543.62
251.544.33
401.544.63
701.546.71
PCA100.133.84
250.135.77
400.136.72
700.1611.07
ICA101.583.47
252.595.01
405.607.20
7018.2610.85
Table 6. Minority-class performance for ransomware and MITM under different oversampling strategies.
Attack TypeOversampling MethodPrecisionRecallF1-Score
RansomwareNo Balancing (baseline)0.82960.93590.8795
SMOTE0.80650.96150.8772
ROS0.81320.94870.8757
Borderline-SMOTE0.78130.96150.8621
ADASYN0.81520.96150.8824
SMOTE-Tomek0.80650.96150.8772
MITMNo Balancing (baseline)0.73150.75960.7453
SMOTE0.63870.87820.7395
ROS0.64250.88140.7432
Borderline-SMOTE0.64840.83330.7293
ADASYN0.63850.87180.7371
SMOTE-Tomek0.60980.88140.7208
Table 7. Comparison of XGBoost hyperparameter configurations.
ConfigurationMacro-F1Training Time (s)
100 trees, depth 6, lr 0.3, subsample 0.80.94036.47
50 trees, depth 6, lr 0.3, subsample 0.80.93562.89
200 trees, depth 6, lr 0.1, subsample 0.80.937412.03
100 trees, depth 3, lr 0.3, subsample 0.80.92834.99
100 trees, depth 8, lr 0.3, subsample 0.80.93977.54
100 trees, depth 6, lr 0.3, subsample 1.00.93864.88
Table 8. Performance Comparison of Binary Classification Methods on ToN-IoT Dataset.
MethodsAccuracyPrecisionRecallF1-Score
Gad et al. [56]0.9830.9840.9670.975
Lazzarini et al. [43]0.9960.9940.9940.994
Lo et al. [41]0.978710.97860.99
Chalichalamala et al. [34]0.98880.98990.98770.9877
Kumar et al. [57]0.96350.90550.99980.9503
Our method0.99620.99690.99800.9975
Table 9. Per-class Performance Metrics for Multi-class Classification.
ClassPrecisionRecallF1-Score
backdoor0.96881.00000.9842
ddos0.98480.97550.9801
dos0.97470.93640.9552
injection0.98360.96960.9766
mitm0.63850.87180.7371
normal0.99420.99080.9925
password0.99910.98140.9902
ransomware0.81520.96150.8824
scanning0.92940.97630.9522
xss0.93720.96760.9521
Disclaimer/Publisher’s Note: The statements, opinions and data contained in all publications are solely those of the individual author(s) and contributor(s) and not of MDPI and/or the editor(s). MDPI and/or the editor(s) disclaim responsibility for any injury to people or property resulting from any ideas, methods, instructions or products referred to in the content.