Article

Modeling and Analysis of the Hydraulic–Thermal Coupling System for the Barrier Fluid System in Subsea Boosting Pumps

by
Weizheng An
1,†,
Zhiling Chen
2,†,
Liya Zhu
1,*,
Ruizhi Li
2,* and
Qiyue Zhang
2
1
China National Offshore Oil Corporation, Beijing 102206, China
2
School of Astronautics, Beihang University, Beijing 102206, China
*
Authors to whom correspondence should be addressed.
These authors contributed equally to this work.
Appl. Sci. 2026, 16(2), 691; https://doi.org/10.3390/app16020691
Submission received: 1 December 2025 / Revised: 4 January 2026 / Accepted: 6 January 2026 / Published: 9 January 2026
(This article belongs to the Section Applied Industrial Technologies)

Abstract

The barrier fluid system in subsea boosting pumps primarily serves to seal and cool the pumps, representing a critical auxiliary system in subsea oil and gas development. Throughout their entire service life, these pumps experience both steady-state and transient operating conditions, making the monitoring of key parameters in the barrier fluid system essential. However, existing sensor configurations are relatively limited, hindering comprehensive monitoring of various components of the system, which constrains performance evaluation and optimal design. To address the sealing and cooling requirements of subsea boosting pumps, this paper establishes a system-level simulation model of the barrier fluid system based on the AMESim 2021.1 platform. The model captures the flow and pressure relationships among different components and incorporates the pump’s cooling circuit to investigate the thermal management efficiency of the barrier fluid system. Furthermore, integrated control algorithms enable automatic valve operation. The model’s accuracy is validated against measured data, and it can be used for parametric optimization to improve design and enhance overall system performance. Based on the analysis results, the model can identify optimal parameters for the subsea boosting pump barrier fluid system, providing a theoretical foundation for preventing potential issues in subsea boosting operations.

1. Introduction

Subsea oil and gas development represents a critical area of research within the energy sector [1]. As a core component ensuring efficient oil and gas transportation, the operational stability of subsea multiphase boosting pumps directly impacts the reliability of the entire production system [2]. Any abnormality in the barrier fluid system of a subsea boosting pump can lead to reduced sealing performance and inadequate cooling efficiency, severely affecting the normal operation of the equipment [3]. The barrier fluid system serves a dual function: it prevents production fluid leakage through hydraulic sealing and maintains stable pump temperature through circulating cooling [4]. The barrier fluid is confined within a sealed chamber, establishing a controllable fluid barrier between the internal components and the external environment. This medium typically comprises a specially formulated synthetic oil-based or water–glycol-based solution, characterised by superior dielectric strength and stable thermophysical properties [5]. Its primary mechanism involves dynamically sustaining barrier fluid pressure at a level consistently exceeding that of the surrounding environment, thereby precluding reverse ingress of seawater or production fluids. Furthermore, the barrier fluid provides lubrication for bearings and mechanical seals, facilitates heat dissipation, and ensures electrical insulation. However, research on abnormal consumption of the barrier fluid system remains relatively limited. Traditional experimental methods face challenges in fully replicating actual operating conditions due to the high costs and risks associated with deep-sea environments, creating an urgent need to address this research gap through high-fidelity simulation methods [6,7].
Recent advancements in multi-physics coupling simulation technology have provided new solutions for analyzing complex engineering systems. AMESim, as a multi-domain system simulation platform, has been widely applied in energy, aerospace, and marine engineering due to its excellence in hydraulic, thermodynamic, and control system modeling [8,9,10,11]. For example, Wang et al. used AMESim to dynamically model the hydraulic control system of deep-water riser tensioners, verifying its reliability in hydraulic control [12]; Jia et al. further applied it to analyze the thermal efficiency of linear Joule engine generators, demonstrating its suitability for thermal-hydraulic coupling problems [13]. These studies provide a solid theoretical foundation for building a barrier fluid system model using AMESim.
Optimizing the sealing performance and cooling efficiency of the barrier fluid system is a key focus. Research on sealing leakage rates and heat transfer characteristics of cooling coils has made progress. Liu et al. experimentally measured the impact of different pressure conditions on mechanical seal leakage, establishing the relationship between leakage rate and pressure difference [14]; the heat transfer performance of deep-sea cooling pipelines was analyzed through numerical simulations [15]. However, existing studies often focus on single physical fields (such as pure hydraulics or heat transfer), lacking systematic analysis of multi-field coupling characteristics (hydraulic–thermal-control). Moreover, research on the dynamic responses of barrier fluid systems under complex conditions (such as sudden shutdown of the booster pump and valve actuation) remains insufficient.
This study aims to develop a multi-physics coupling simulation model of the barrier fluid system for subsea boosting pumps based on the AMESim platform. The model’s accuracy will be validated by comparing results with engineering measurement data under steady-state conditions, followed by an investigation of the system’s dynamic characteristics under complex operational scenarios. The research first establishes coupled hydraulic–thermal equations for the barrier fluid system through theoretical analysis, and employs AMESim’s modular modeling approach to achieve parametric modeling of core components (e.g., BPU, umbilical cable, and cooling circuit). Subsequently, on-site data will be used to calibrate the model, ensuring it accurately reflects the pressure, flow, and temperature distribution within the barrier fluid system. Finally, by simulating extreme conditions such as sudden shutdown of the booster pump and valve actuation, the study seeks to reveal the system’s dynamic response mechanisms and propose targeted optimization strategies. The outcomes are expected to provide a theoretical basis for fault diagnosis in barrier fluid systems and offer technical support for the future optimized design and intelligent control of deep-sea boosting pumps.

2. System Simulation Model

This study constructs a hydraulic–thermal coupled simulation model of the subsea booster pump barrier fluid system on the AMESim platform, designing the overall model, leakage model, cooling circuit model, and valve control strategy.

2.1. Overall Model Design

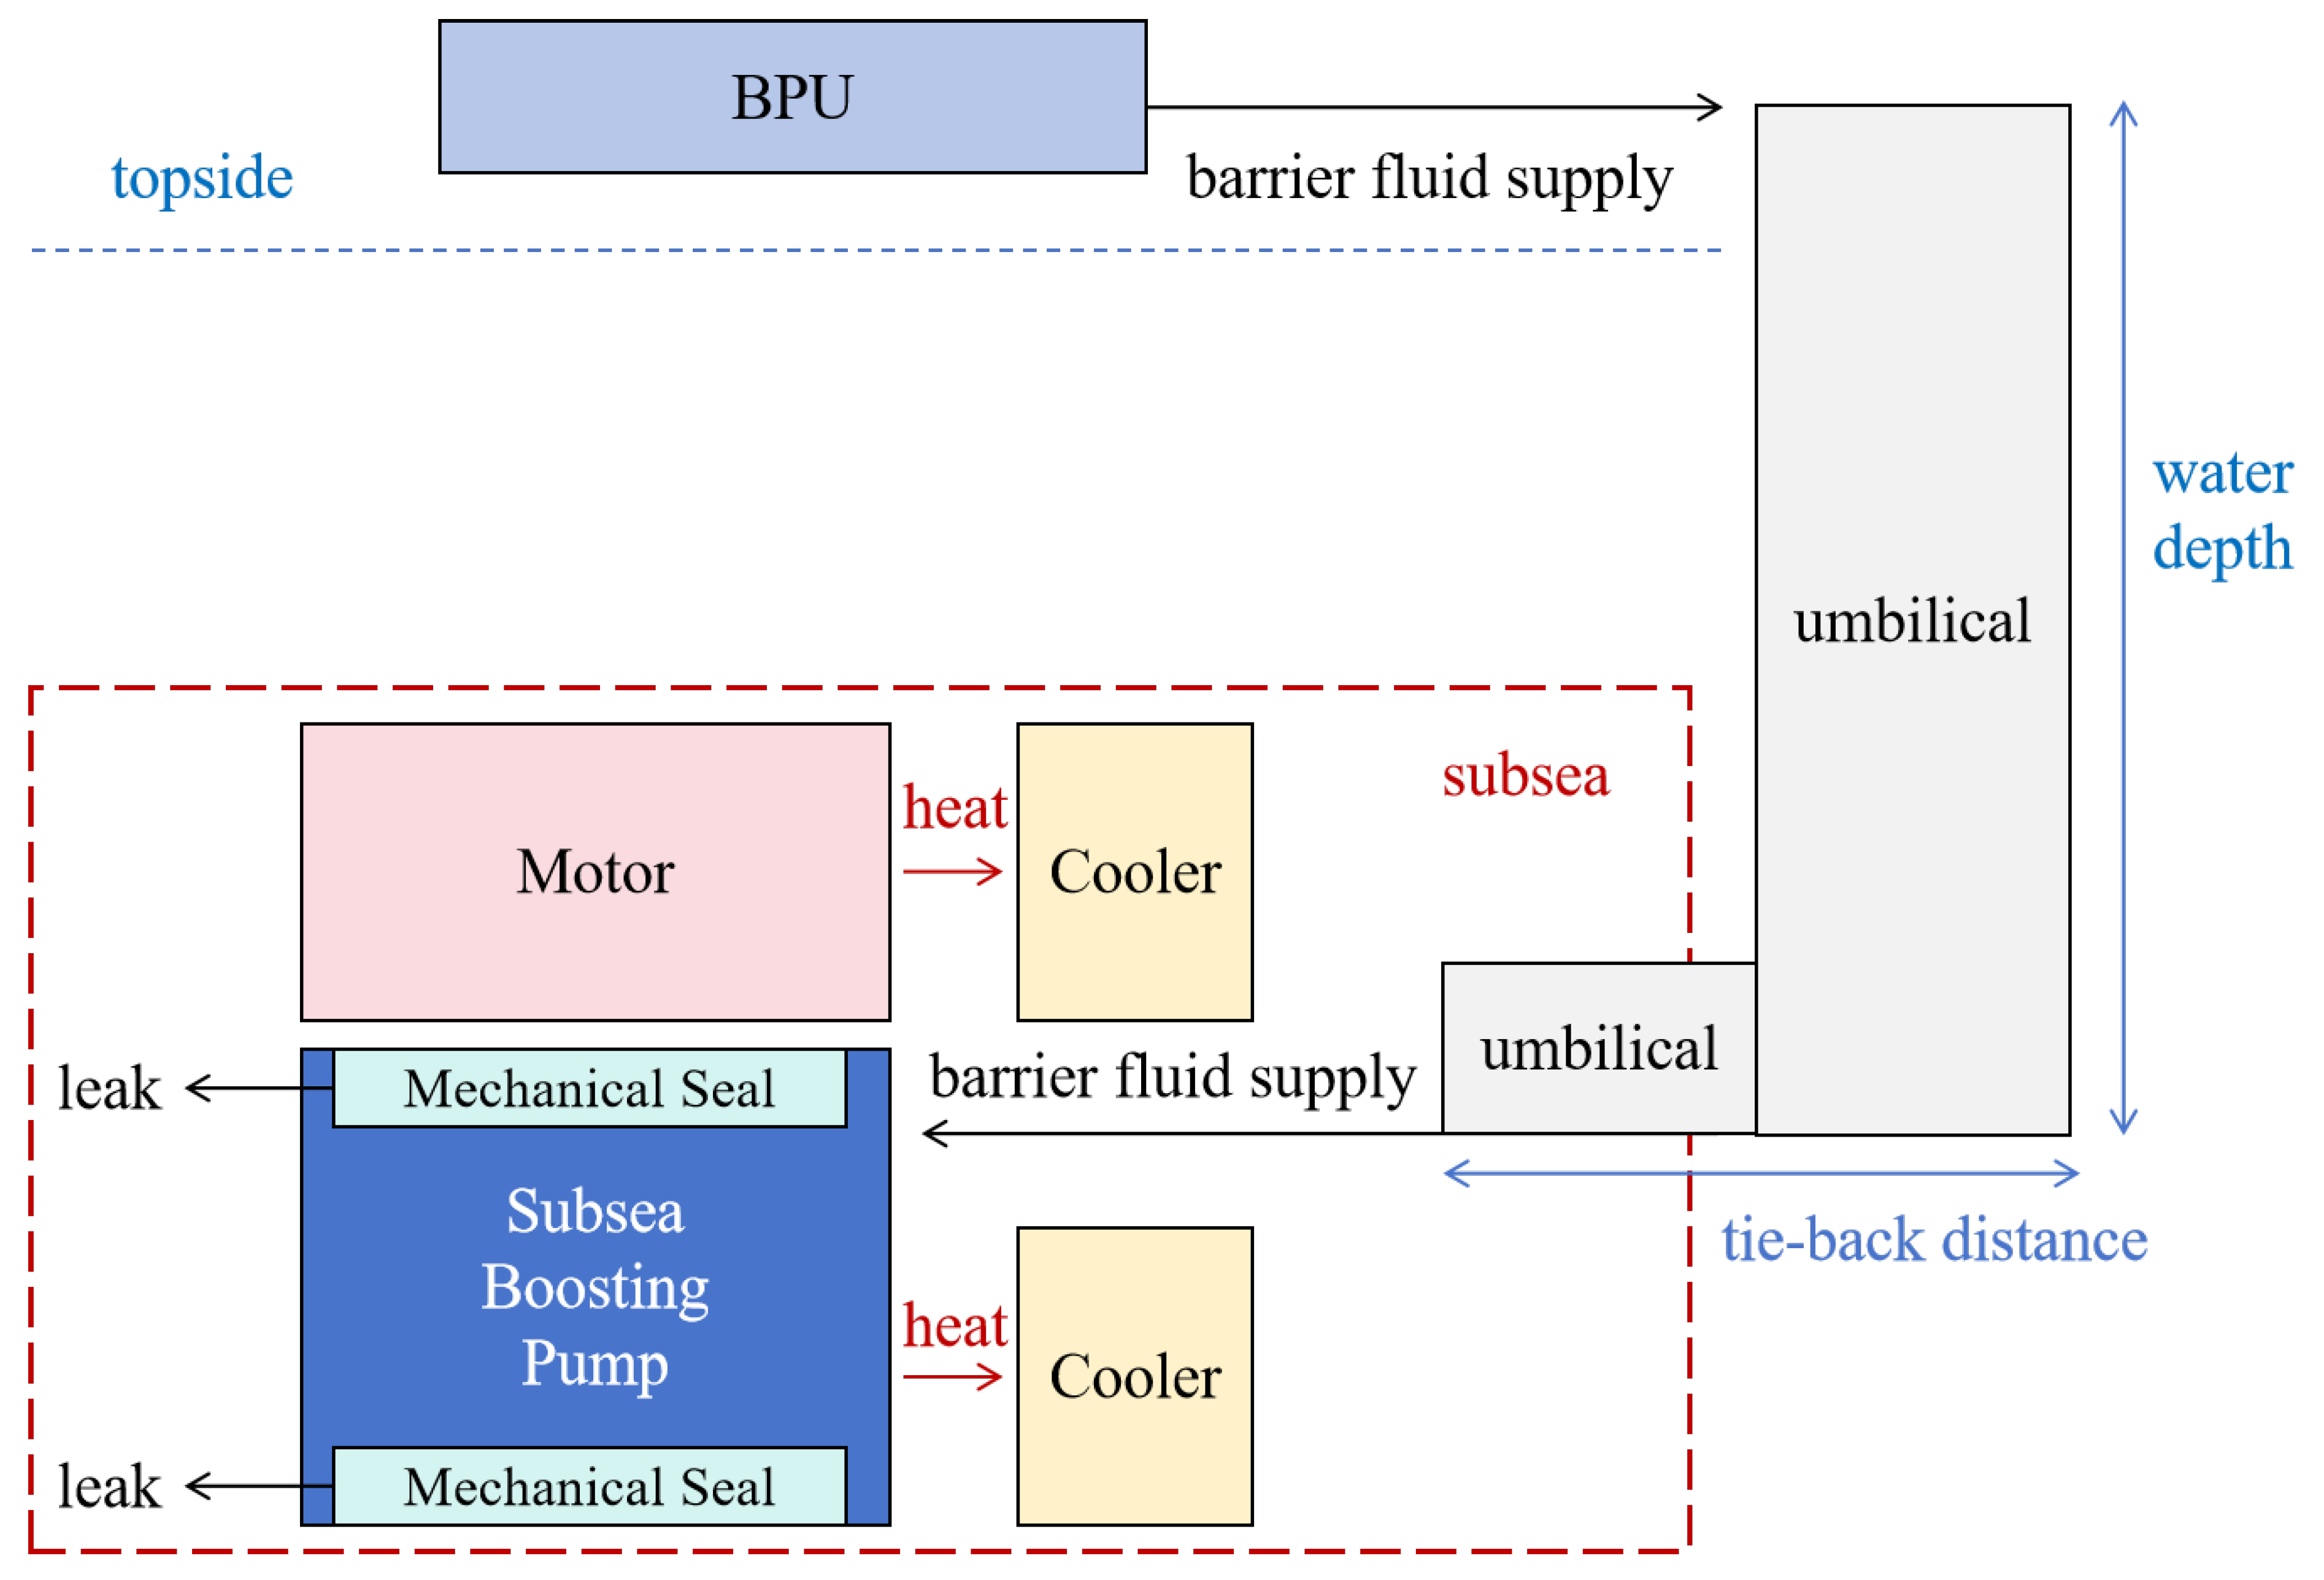
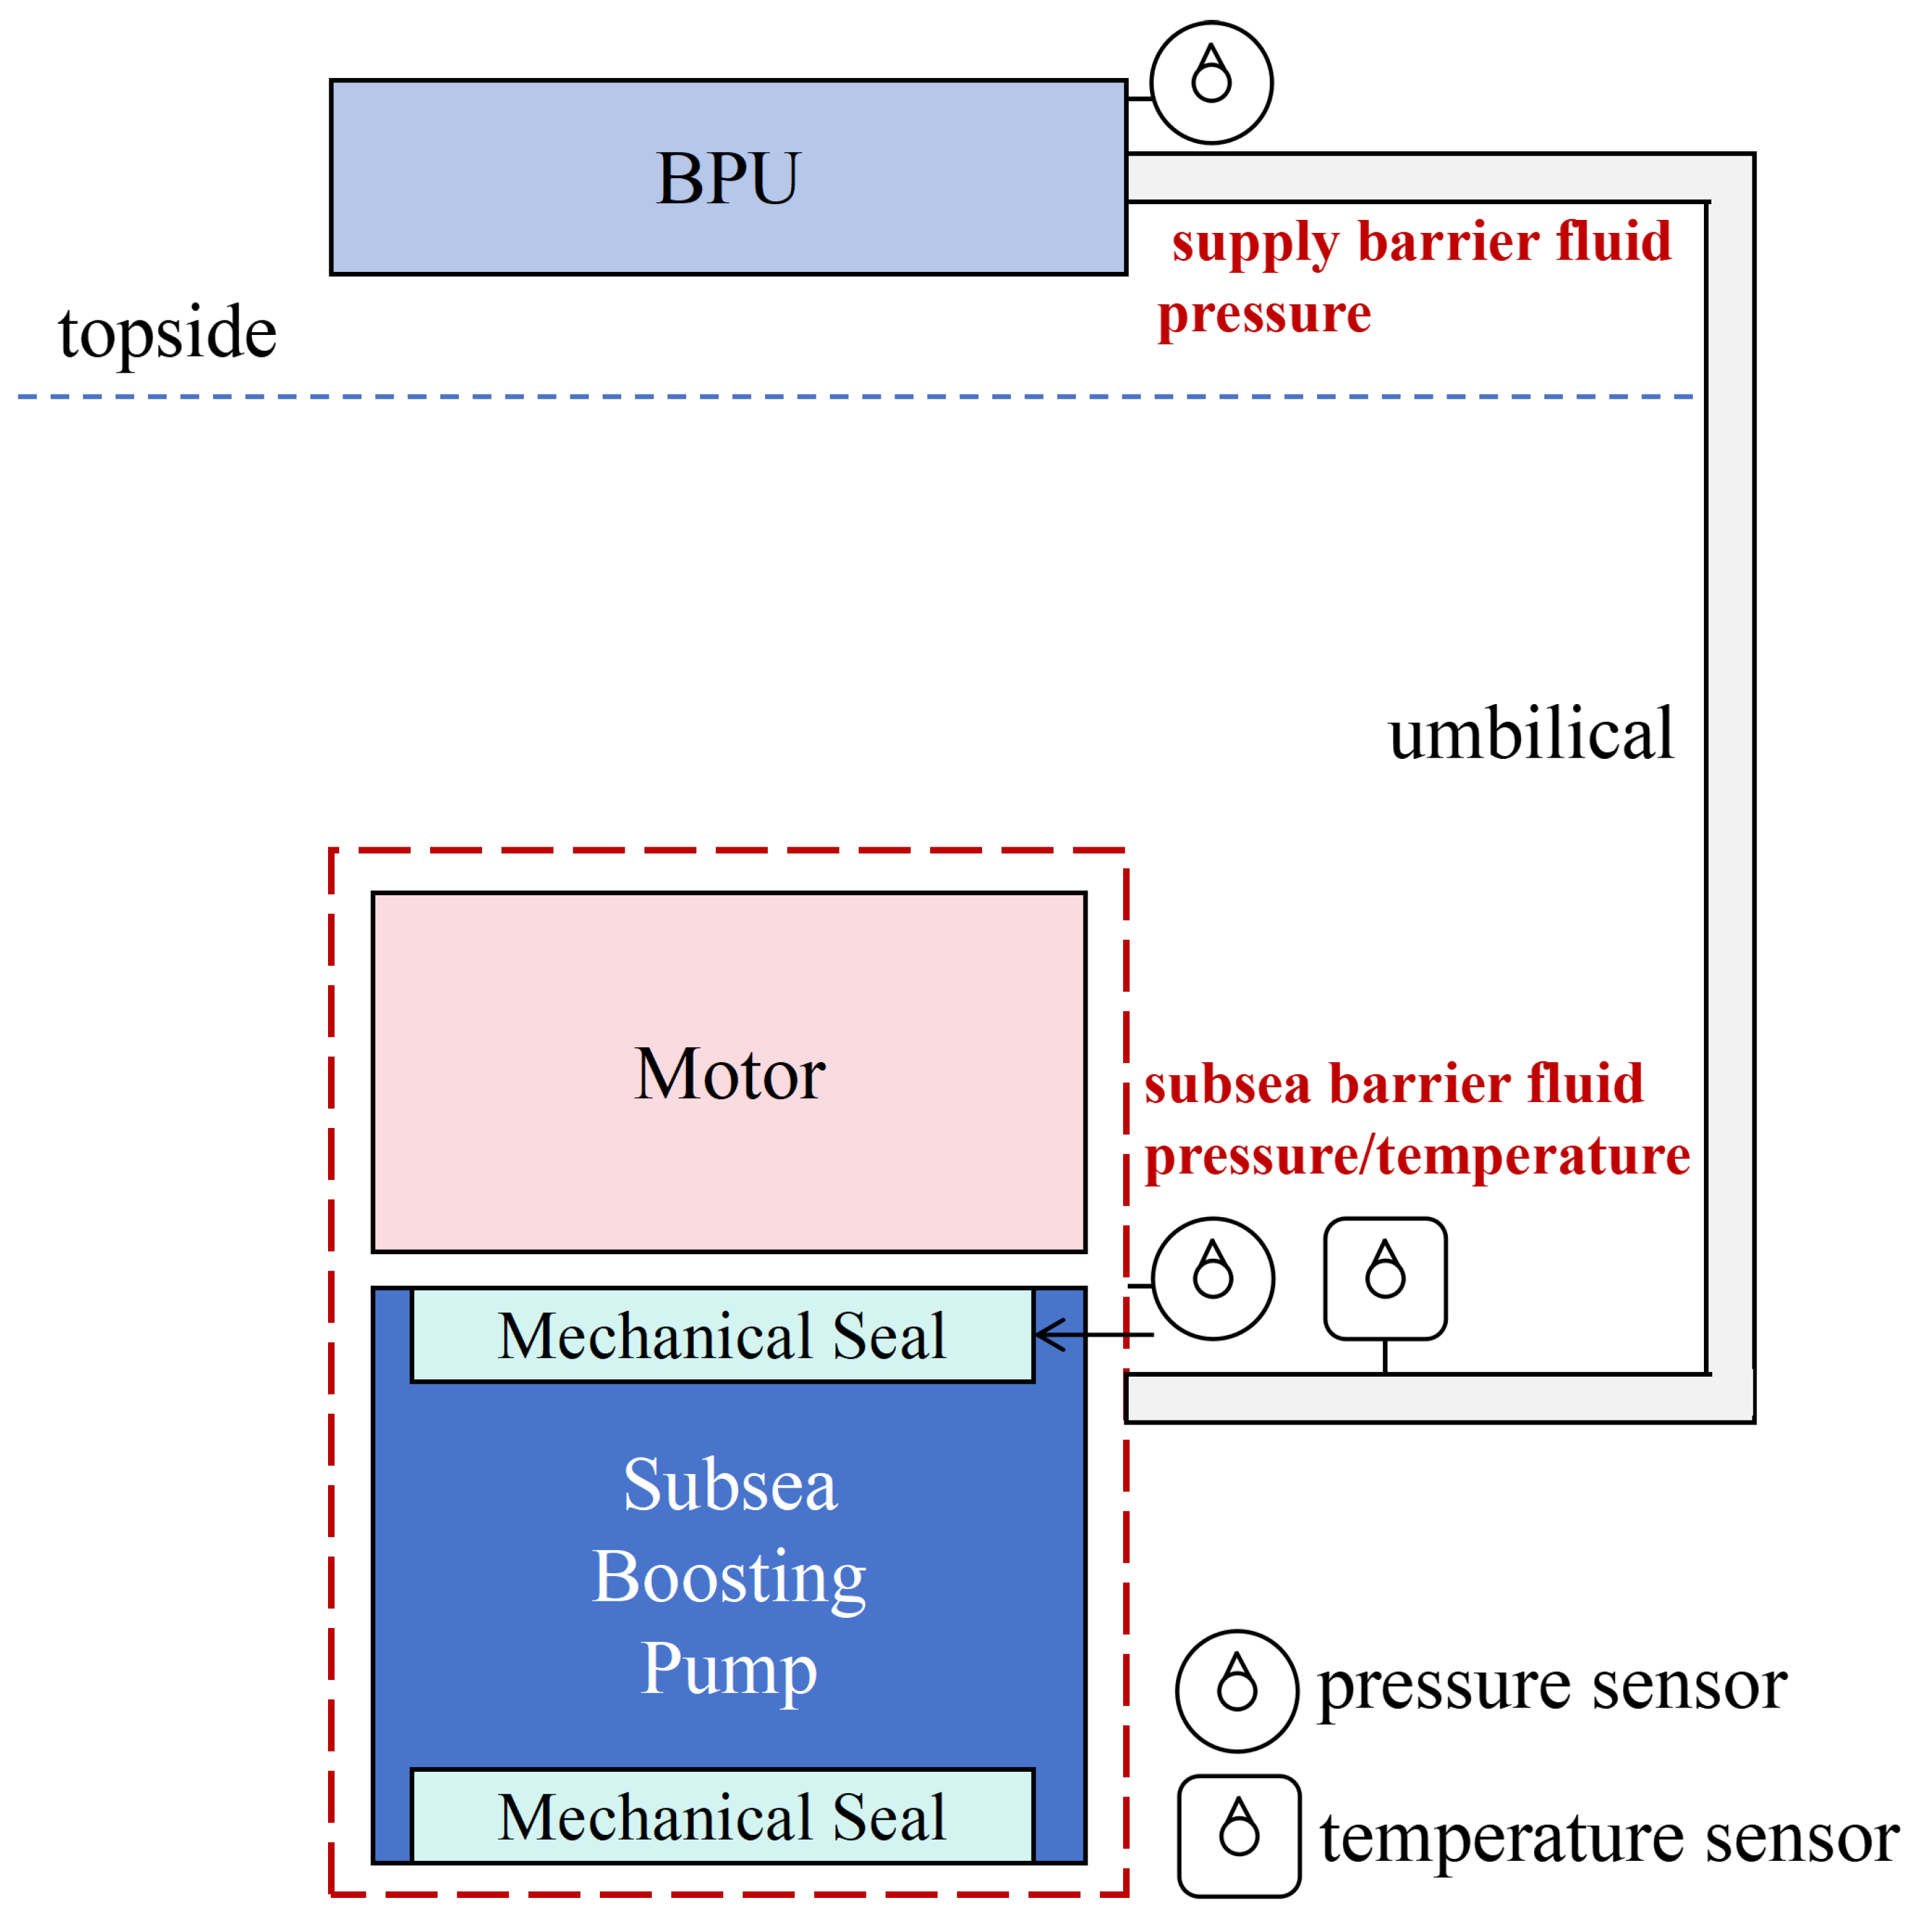
The model is based on the barrier fluid system of an actual subsea booster pump used in the oilfield as its prototype, as illustrated in Figure 1, using a modular approach to build a complete system architecture comprising the BPU (Booster Power Unit), umbilical cable supply system, and cooling circulation loop. The BPU module simulates the barrier fluid supply source, the umbilical cable module characterizes long-distance hydraulic supply properties, and the cooling loop replicates the heat exchange process between the barrier fluid and seawater. To balance computational accuracy and efficiency, the model simplifies the actual system as follows: (1) Retains key hydraulic nodes, considering only the tank, supply pump, valves, accumulator, filter, and pipelines in the BPU supply path, while ignoring minor flow channels. (2) Simplifies the umbilical cable into vertical and horizontal straight pipes based on the deployment depth and orientation of the booster pump; all pipelines in the barrier fluid system are simplified as circular straight pipes. (3) Uses a lumped parameter method for heat transfer, simplifying complex 3D heat conduction into a 1D thermal network.

2.2. Leakage Model

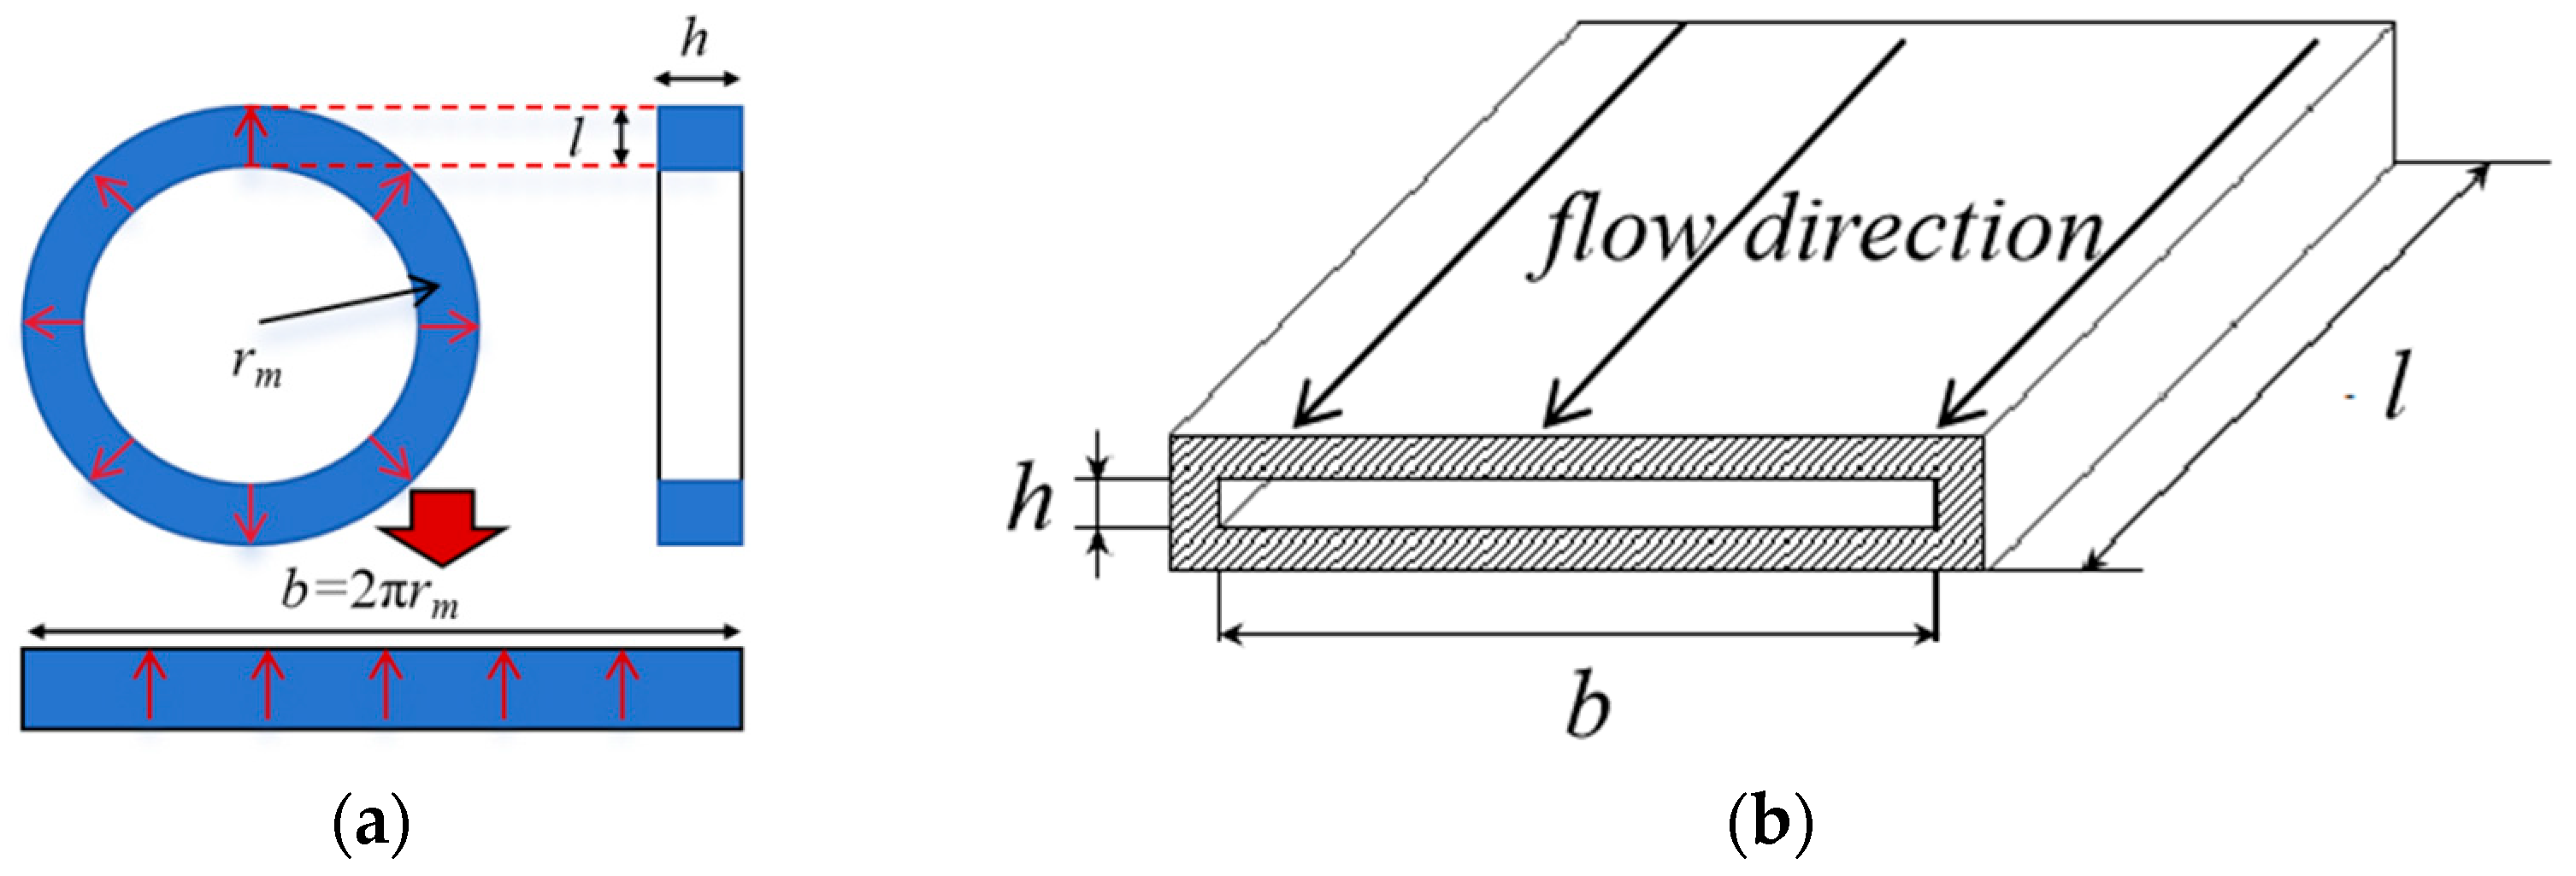
To address the abnormal barrier fluid consumption issue, a dynamic leakage model was developed based on fluid mechanics theory and implemented using AMESim’s Thermal Hydraulic library. The leakage model is illustrated in Figure 2, assuming the leakage channel as a rectangular plane where the barrier fluid leaks from the high-pressure side to the low-pressure side in parallel laminar flow [16].
The leakage rate through the seal gap is calculated using a modified parallel-plate laminar flow equation:
Q l e a k = b h 3 P C Q 12 μ L
where b is the leakage channel thickness (equal to the average perimeter of the seal end face); h is the leakage channel width; L is the leakage channel length; μ is the dynamic viscosity coefficient of the fluid; ΔP is the pressure difference across the leakage channel; CQ is the leakage correction coefficient (accounting for factors such as end face flatness, installation parallelism, surface waviness, operating conditions, and medium type), ranging from 1.6 to 2.4; h represents the liquid film thickness of the seal, dynamically adjusted within 2~3 μm to reflect wear conditions.

2.3. Cooling Circuit

The heat transfer characteristics of the cooling circuit are simulated using a coupled thermal resistance-capacitance network. A segmented lumped parameter method is employed to discretize heat exchangers, pipelines, and other components into thermodynamic units. The density, pressure, enthalpy, and temperature of each unit satisfy Equations (2)–(7) [17]:
d ρ d t = 1 V d m d t ρ d V d t
d p d t = β T 1 ρ d ρ d t + α d T d t
d h d t = C p d T d t + 1 α T ρ d p d t
d T d t = Q ˙ + d m h i h d m i ρ C p V + α T ρ C p d p d t
α = 1 ρ ρ T p
β T = ρ ρ p T 1
where α is the isobaric thermal expansion coefficient of the barrier fluid, βT is the isothermal bulk modulus of the barrier fluid, ρ is the density of the barrier fluid, m is the mass of the barrier fluid, V is the volume of the hydraulic chamber containing barrier fluid, and p is the pressure of the barrier fluid. The model connects components using the Thermal Hydraulic library in AEMSim platform and employs adaptive time steps to ensure computational stability.

2.4. Valve Control Strategy

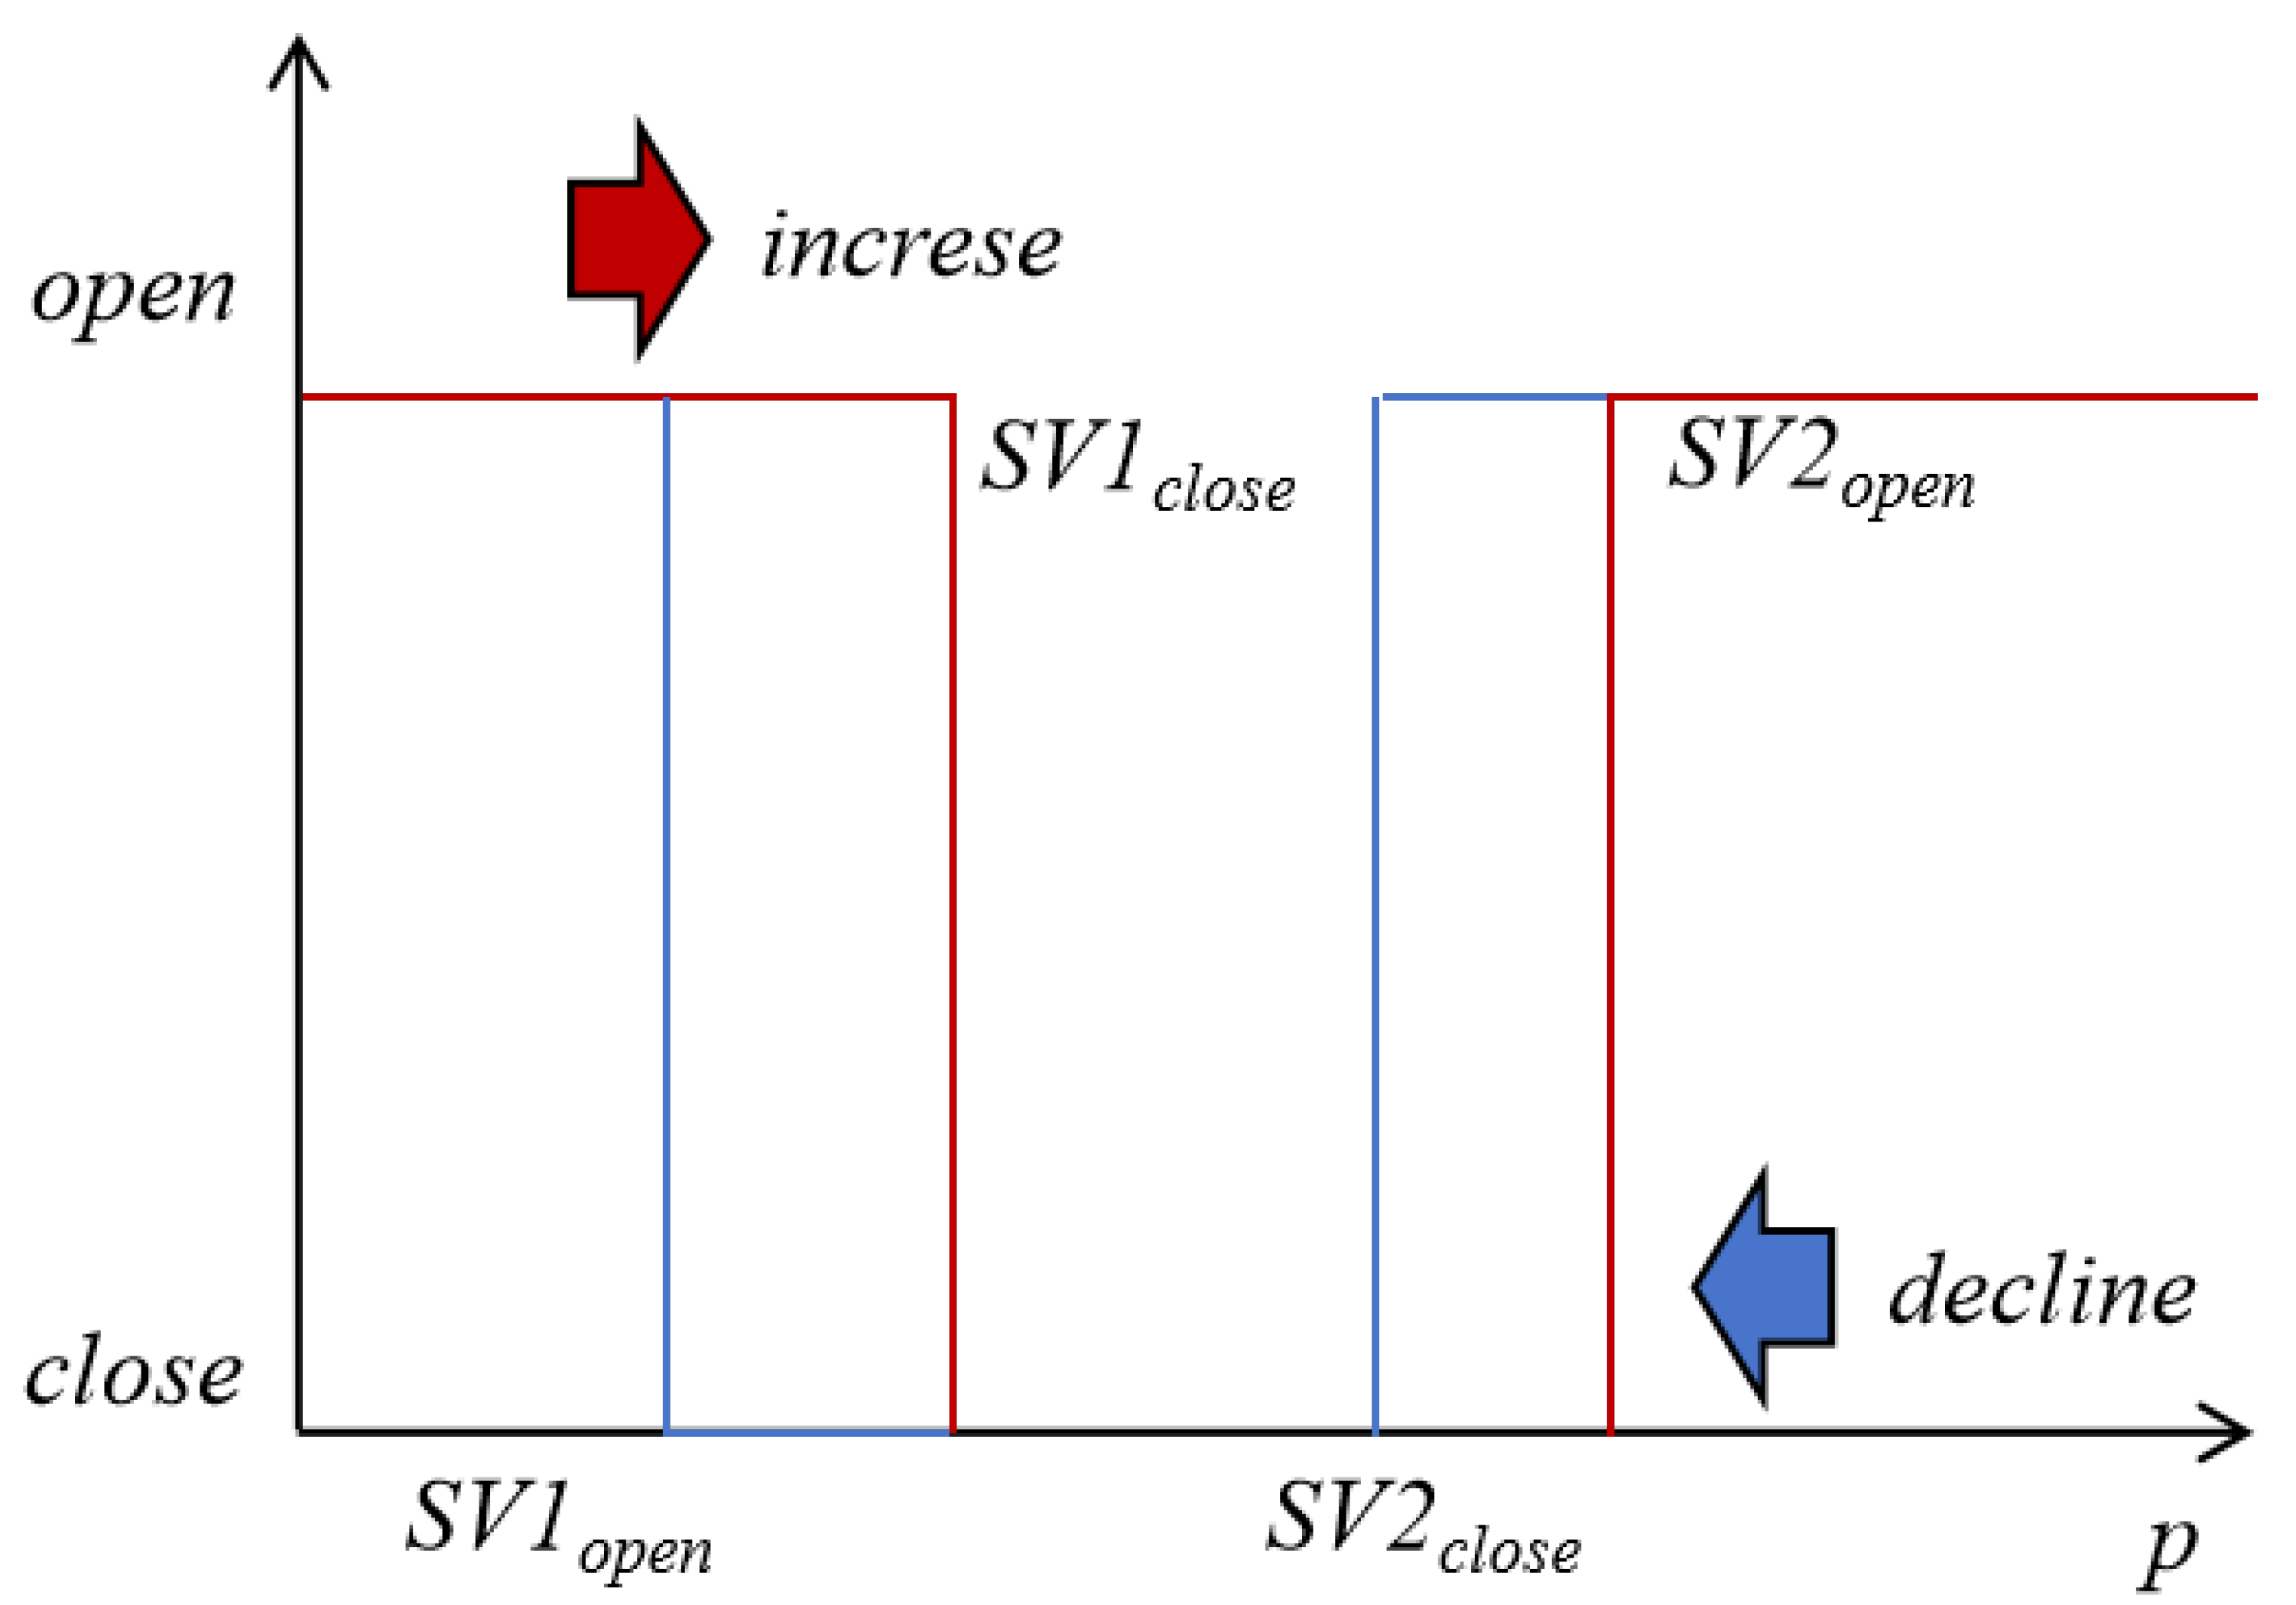
A control algorithm for the BPU solenoid valve was designed to regulate barrier fluid supply: (1) Pressure sensors are installed on the subsea booster pump to detect inlet working fluid pressure, outlet working fluid pressure, and subsea barrier fluid supply pressure, determining the upstream supply pressure setpoint. (2) A pressure sensor is placed at the BPU outlet to monitor outlet pressure. The supply valve is opened to rapidly increase barrier fluid supply pressure, while the relief valve is opened to rapidly decrease it, maintaining pressure balance. (3) The rate of pressure change at the BPU outlet is introduced as a pressure state signal to determine whether the pressure is rising or falling. The hysteresis curve for valve control is shown in Figure 3.

2.5. Friction LOSS of the Pipe

The friction losses of the barrier fluid during its flow mainly come from the umbilical cable and the pipeline. The loss of the umbilical cable and the pipeline is described using a model of a frictional circular pipe. When calculating the velocity v of the pipe, the friction factor ff can be introduced, as follows [18]:
v = 2 d P ρ L g sin θ L ρ f f
where d is the diameter of the pipe, ΔP is the pressure difference at both ends of the pipeline, ρ is the density of the barrier fluid, L is the length of the pipe, g is the acceleration of gravity, θ is the inclination angle of the pipeline relative to the horizontal plane, ff is the friction factor of the pipe.
According to Nikuradse’s theory, the friction factor is related to the Reynolds number Re and the relative roughness [19]. In the laminar flow state, the friction factor decreases sharply as the Reynolds number increases; in the turbulent flow state, the friction factor increases slightly with the Reynolds number, and the larger the relative roughness, the greater the friction factor. The definition of the Reynolds number is as follows:
Re = ρ v d μ
where ρ is the density of the barrier fluid, v is the velocity of the barrier fluid, d is the characteristic length (it is the diameter of the circular pipe), μ is the dynamic viscosity.
The relative roughness is related to the material. Usually, the materials used in the petroleum system are stainless steel, and the value of the relative roughness is approximately 10−6.

3. Results and Discussion

3.1. Model Verification

The steady-state condition of the barrier fluid system refers to the normal and stable operation of the subsea booster pump. Barrier fluid leaks into the working fluid through the mechanical seal gap, while the subsea accumulator, umbilical cable, and BPU sequentially replenish the barrier fluid. Initially, the subsea booster pump is off, and the subsea facilities are in thermal equilibrium with seawater. The temperature of the barrier fluid within whole subsea facilities matches the seawater temperature at that depth (12.41 °C at 330 m depth and 6.74 °C at 600 m depth) [20]. After stable operation begins, the barrier fluid temperature rises due to heat generated by components such as the motor, bearings, seals, and couplings. High-temperature barrier fluid exchanges heat with seawater in the cooling coil before re-entering the pump. At equilibrium, the temperature, pressure, and flow parameters of the pump and barrier fluid system stabilize.
The verification was conducted using the on-site data from the subsea booster pump of a certain oilfield project in the South China Sea during its normal operation. The project belongs to China National Offshore Oil Corporation. Its designed depth is 330 m. Using the on-site detection data from 25 November 2025, as shown in Table 1, the revolution speed of the subsea booster pump during normal operation is 2863 r/min, the pressure at the inlet of the booster pump is 1.58 MPa, and the pressure at the outlet is 5.10 MPa. Using these data as the input for the AMESim system simulation established in Section 2, the supply barrier fluid pressure and the subsea barrier fluid pressure as shown in Table 2 can be obtained and compared with the on-site data. The on-site data was measured using pressure sensors and temperature sensors, and the arrangement of them is shown in Figure 4. Due to commercial confidentiality, the precise parameter values of the test results are not suitable for presentation. Let P1 represent the pressure of the supply barrier fluid measured on-site, P2 represent the pressure of the subsea barrier fluid measured on-site, and T2 represent the temperature of the subsea barrier fluid measured on-site. Then, the simulation results are 0.944P1, 0.969P2, and 0.901T2, with relative errors of −5.6%, −3.1%, and −9.1% respectively. Within the range of error, the accuracy of the model can be verified. The relatively low simulation results may be due to the neglect of the increase in thermal resistance caused by pipeline fouling and the low cooling effect, thereby underestimating the actual temperature and pressure of the system.

3.2. Steady-State Simulation Analysis

To evaluate the model’s capability to simulate steady-state conditions for arbitrary designs, results for a 600 m design depth are provided (Table 3). The system starts from thermal equilibrium with seawater (6.74 °C at 600 m depth). As the pump starts, the barrier fluid system gradually heats up, and the temperature difference between the cooling coil and seawater increases until heat exchange balances the heat generated by components. BPU upstream and downstream supply pressure refer to the pressure of the barrier fluid in the upstream and downstream of the supply valve of the BPU, respectively. The subsea barrier fluid is selected as the barrier fluid pressure at the supply point of the booster pump. The pressure difference in the mechanical seal represents the pressure difference between the barrier fluid at this point and the working medium at the inlet of the booster pump. The inlet temperatures of the upper and lower cooling coils indicate the highest temperature reached by the barrier fluid after absorbing heat, while the flow rate of the cooling coils shows the operating condition of the impeller that drives the barrier fluid.
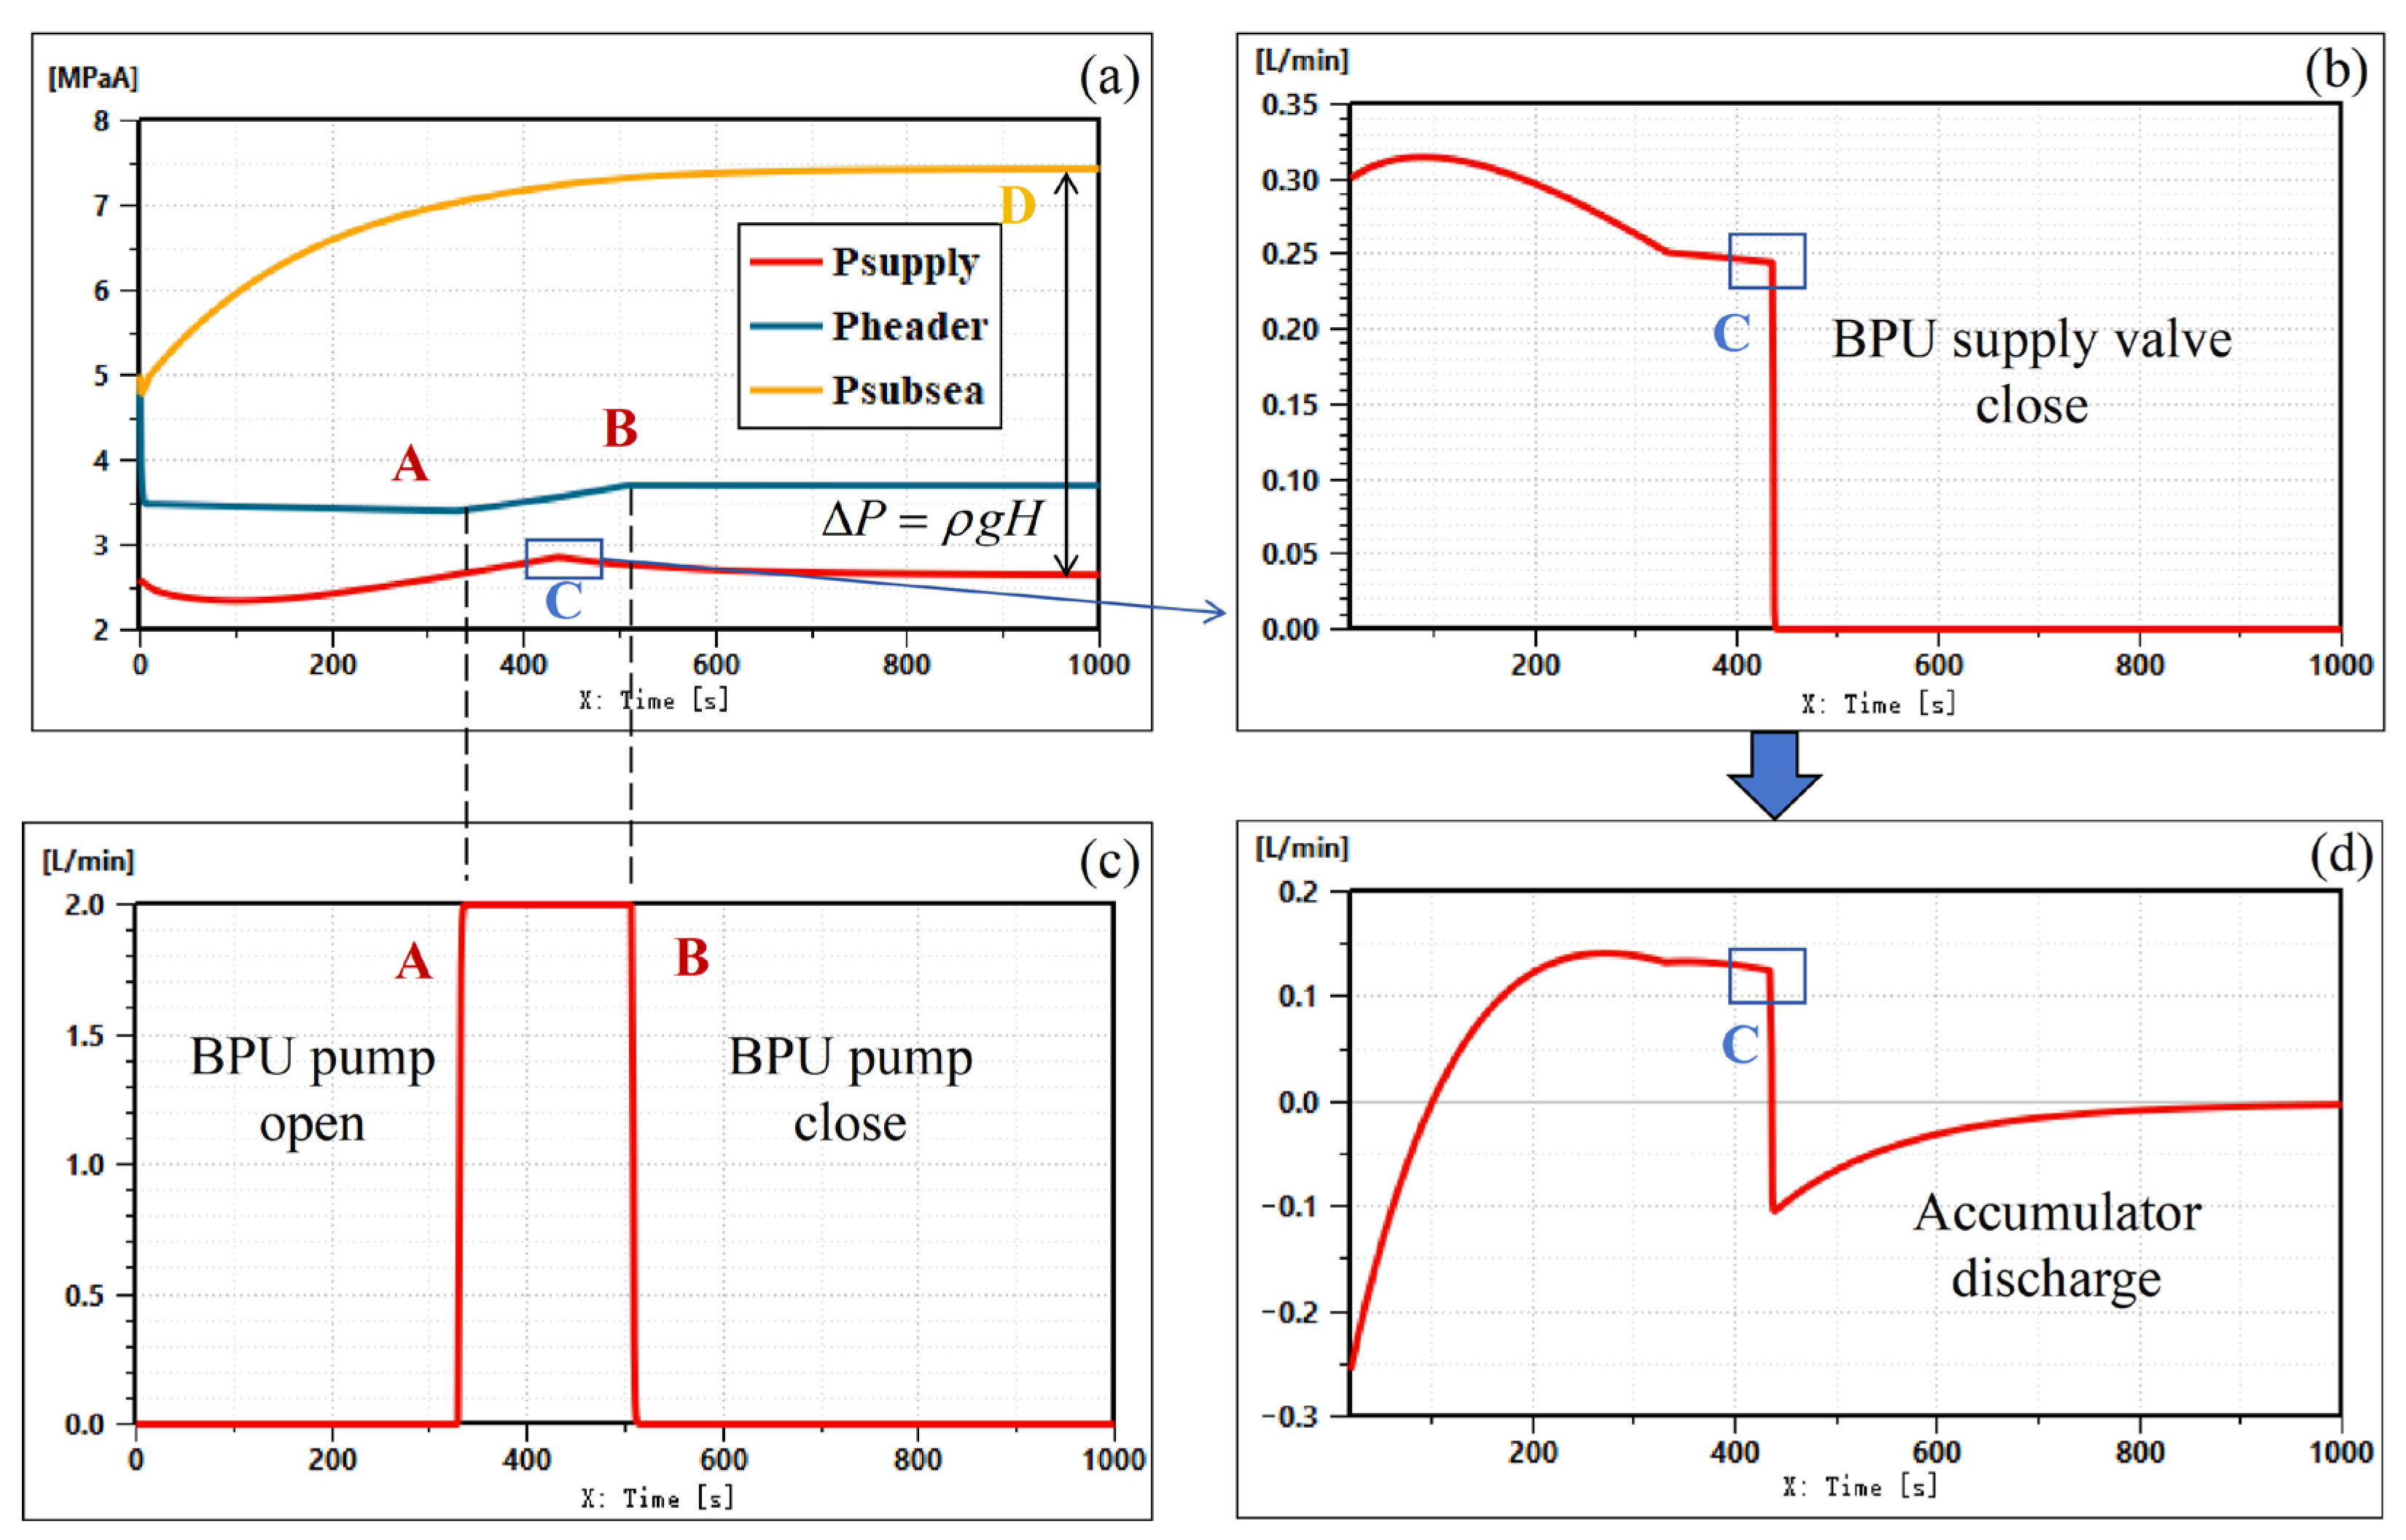
Figure 5 illustrates the pressure variation process of the barrier fluid system above and below water. Figure 5a shows the BPU supply pressure (BPU outlet pressure), BPU upstream pressure (post-pump pressure), and subsea barrier fluid supply pressure (pump inlet pressure). Due to components like solenoid valves, orifices, and check valves in the BPU, a pressure drop exists between the BPU upstream and supply pressures. Initially, the BPU pump is off, and the supply valve is open. The upstream pressure gradually decreases as it is transmitted to the supply side via the accumulator. When the upstream pressure drops to point A (below the setpoint of 3.40 MPa), the BPU pump turns on (supply flow: 2 L/min), raising the upstream pressure. At point B (above 3.70 MPa), the pump turns off, and the pressure begins to drop again. The supply pressure rises due to upstream replenishment until point C (above the setpoint), when the supply valve closes, and the downstream accumulator takes over supply. The accumulator inlet flow (Figure 5d) switches from positive to negative at point C, mitigating pressure fluctuations caused by valve closure.
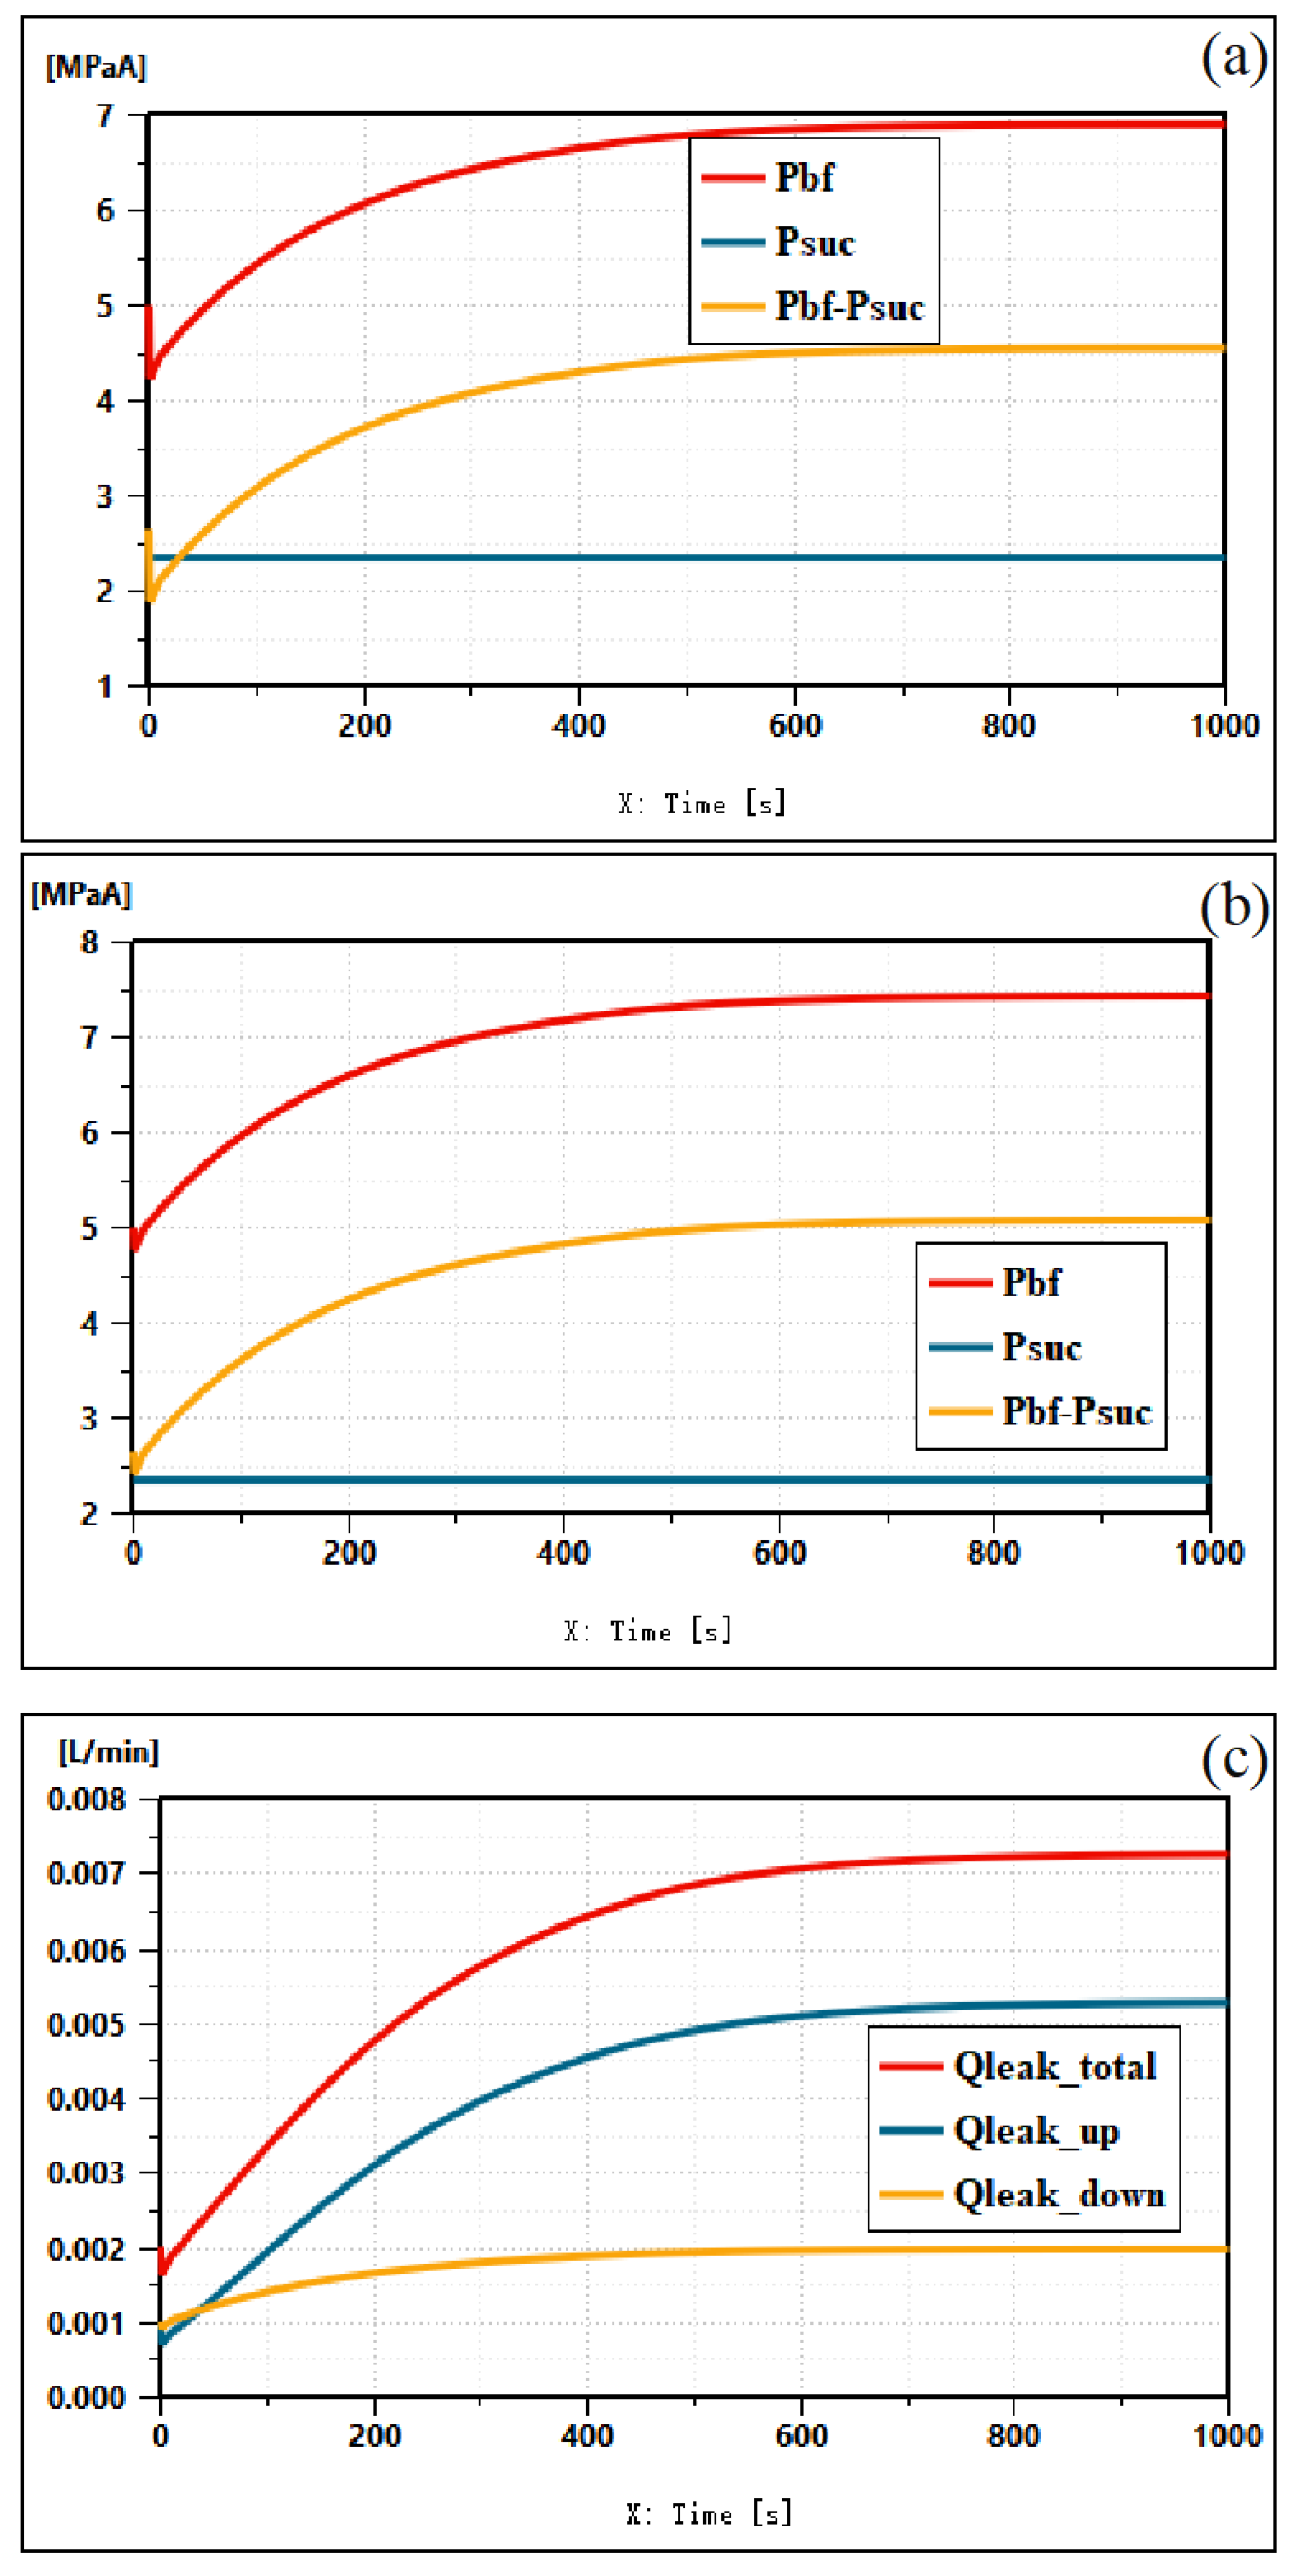
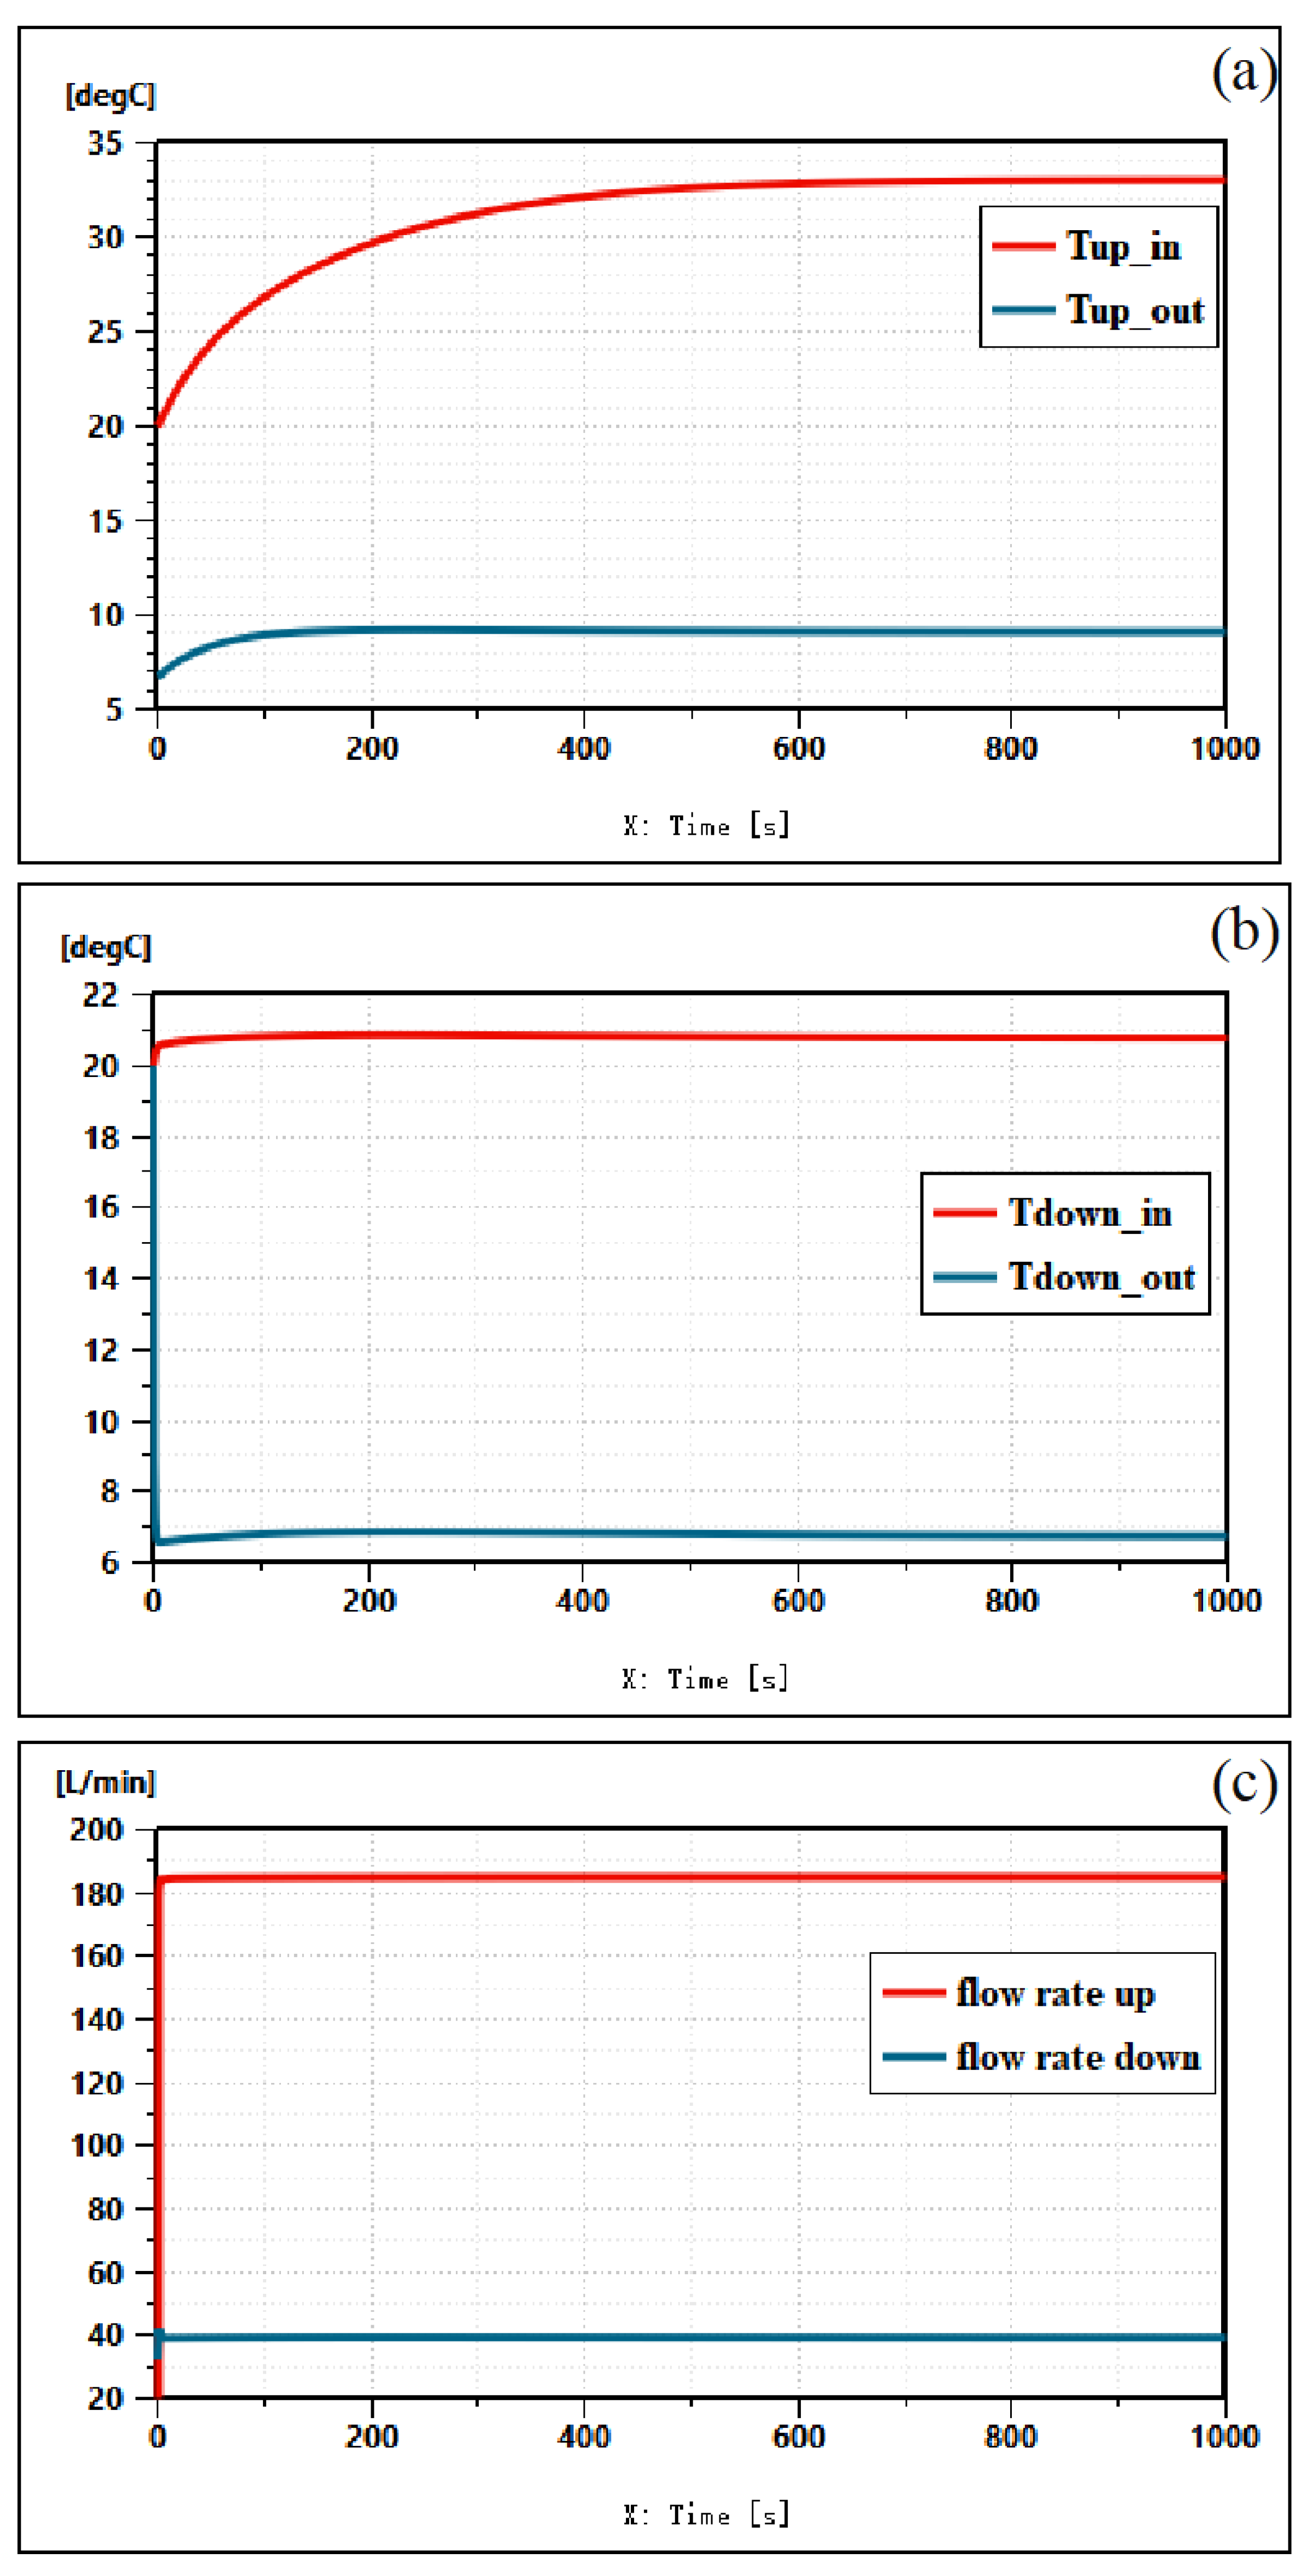
Figure 6 and Figure 7 depict the pressure difference, leakage rate, temperature, and flow rate at the mechanical seals and cooling coils over time. Figure 6a shows the pressure difference between the barrier fluid and working fluid at the upper shaft seal, Figure 6b shows the same for the lower shaft seal, and Figure 6c displays the leakage rates at both seals. Due to higher flow resistance near the motor and couplings, the upper seal exhibits lower pressure differences and leakage rates. The total leakage rate (0.007 L/min) falls within the range reported by Kjellnes (0.0063–0.0158 L/min) [4], validating the model. Figure 7a,b show the inlet and outlet temperatures of the upper and lower cooling coils, respectively, while Figure 7c displays their flow rates. The upper coil, with more heat-generating components (motor, couplings, and more bearings), has significantly higher flow rates than the lower coil.
Interestingly, at the mechanical seal at the upper end of the pump shaft, the pressure difference between the barrier fluid and the process fluid at the pump inlet is smaller, but the leakage rate is actually greater. This is because the upper end of the pump shaft has a higher heat generation, resulting in a higher overall temperature of the barrier fluid. The viscosity and temperature of the barrier fluid are usually negatively correlated. Therefore, the higher the temperature of the barrier fluid, the lower its viscosity. According to formula (1), a decrease in viscosity will increase the leakage rate of the barrier fluid. Under conditions where the pressure difference does not change significantly, the significant increase in viscosity due to temperature causes a significant increase in the sealing leakage rate, which is very unfavorable for mechanical seals. From the steady-state simulation results, it can be seen that when the subsea booster pump barrier fluid system is in operation, the mechanical seal at the upper end of the pump shaft should be given special attention to prevent its damage.

3.3. Transient Simulation Analysis

The most common transient condition in the subsea booster pump barrier fluid system is the sudden shutdown of the subsea booster pump and valve actuation. When the subsea booster pump experiences an abrupt shutdown, the discharged fluid from the outlet flows back and communicates with the inlet, causing the inlet pressure to rapidly increase until it equilibrates with the outlet pressure. This results in a swift rise in the inlet pressure acting on the mechanical seal, which can easily lead to a negative pressure differential between the barrier fluid and the inlet working fluid. As for valve actuation, it induces pressure fluctuations within the system. To enable rapid replenishment of the barrier fluid and mitigate pressure oscillations, it is essential to appropriately design the pre-charge pressure of the accumulator.
In engineering practice, the pre-charge pressure of the accumulator is related to the minimum operating pressure (Pmin) of the accumulator. Typically, the pre-charge pressure is set within the range of 0.25 Pmin to Pmin. Within this range, the performance of the accumulator varies significantly. To determine the optimal pre-charge pressure for the accumulator downstream of the Booster Pump Unit (BPU), this study varies the pre-charge pressure from 2.0 MPa to 3.5 MPa (where Pmin is approximately 3.2 MPa) and conducts transient simulations of the barrier fluid system during the transient process from startup to shutdown of the subsea booster pump.
The simulation assumes a barrier fluid system at a water depth of 500 m, with the subsea booster pump operating at a rotational speed of 4500 r/min. After startup, the inlet pressure is 2.35 MPa, and the outlet pressure is 6.65 MPa. The pump undergoes an abrupt shutdown at t = 1000 s. The results of the transient simulation are illustrated in the accompanying Figure 8, Figure 9, Figure 10, Figure 11 and Figure 12.
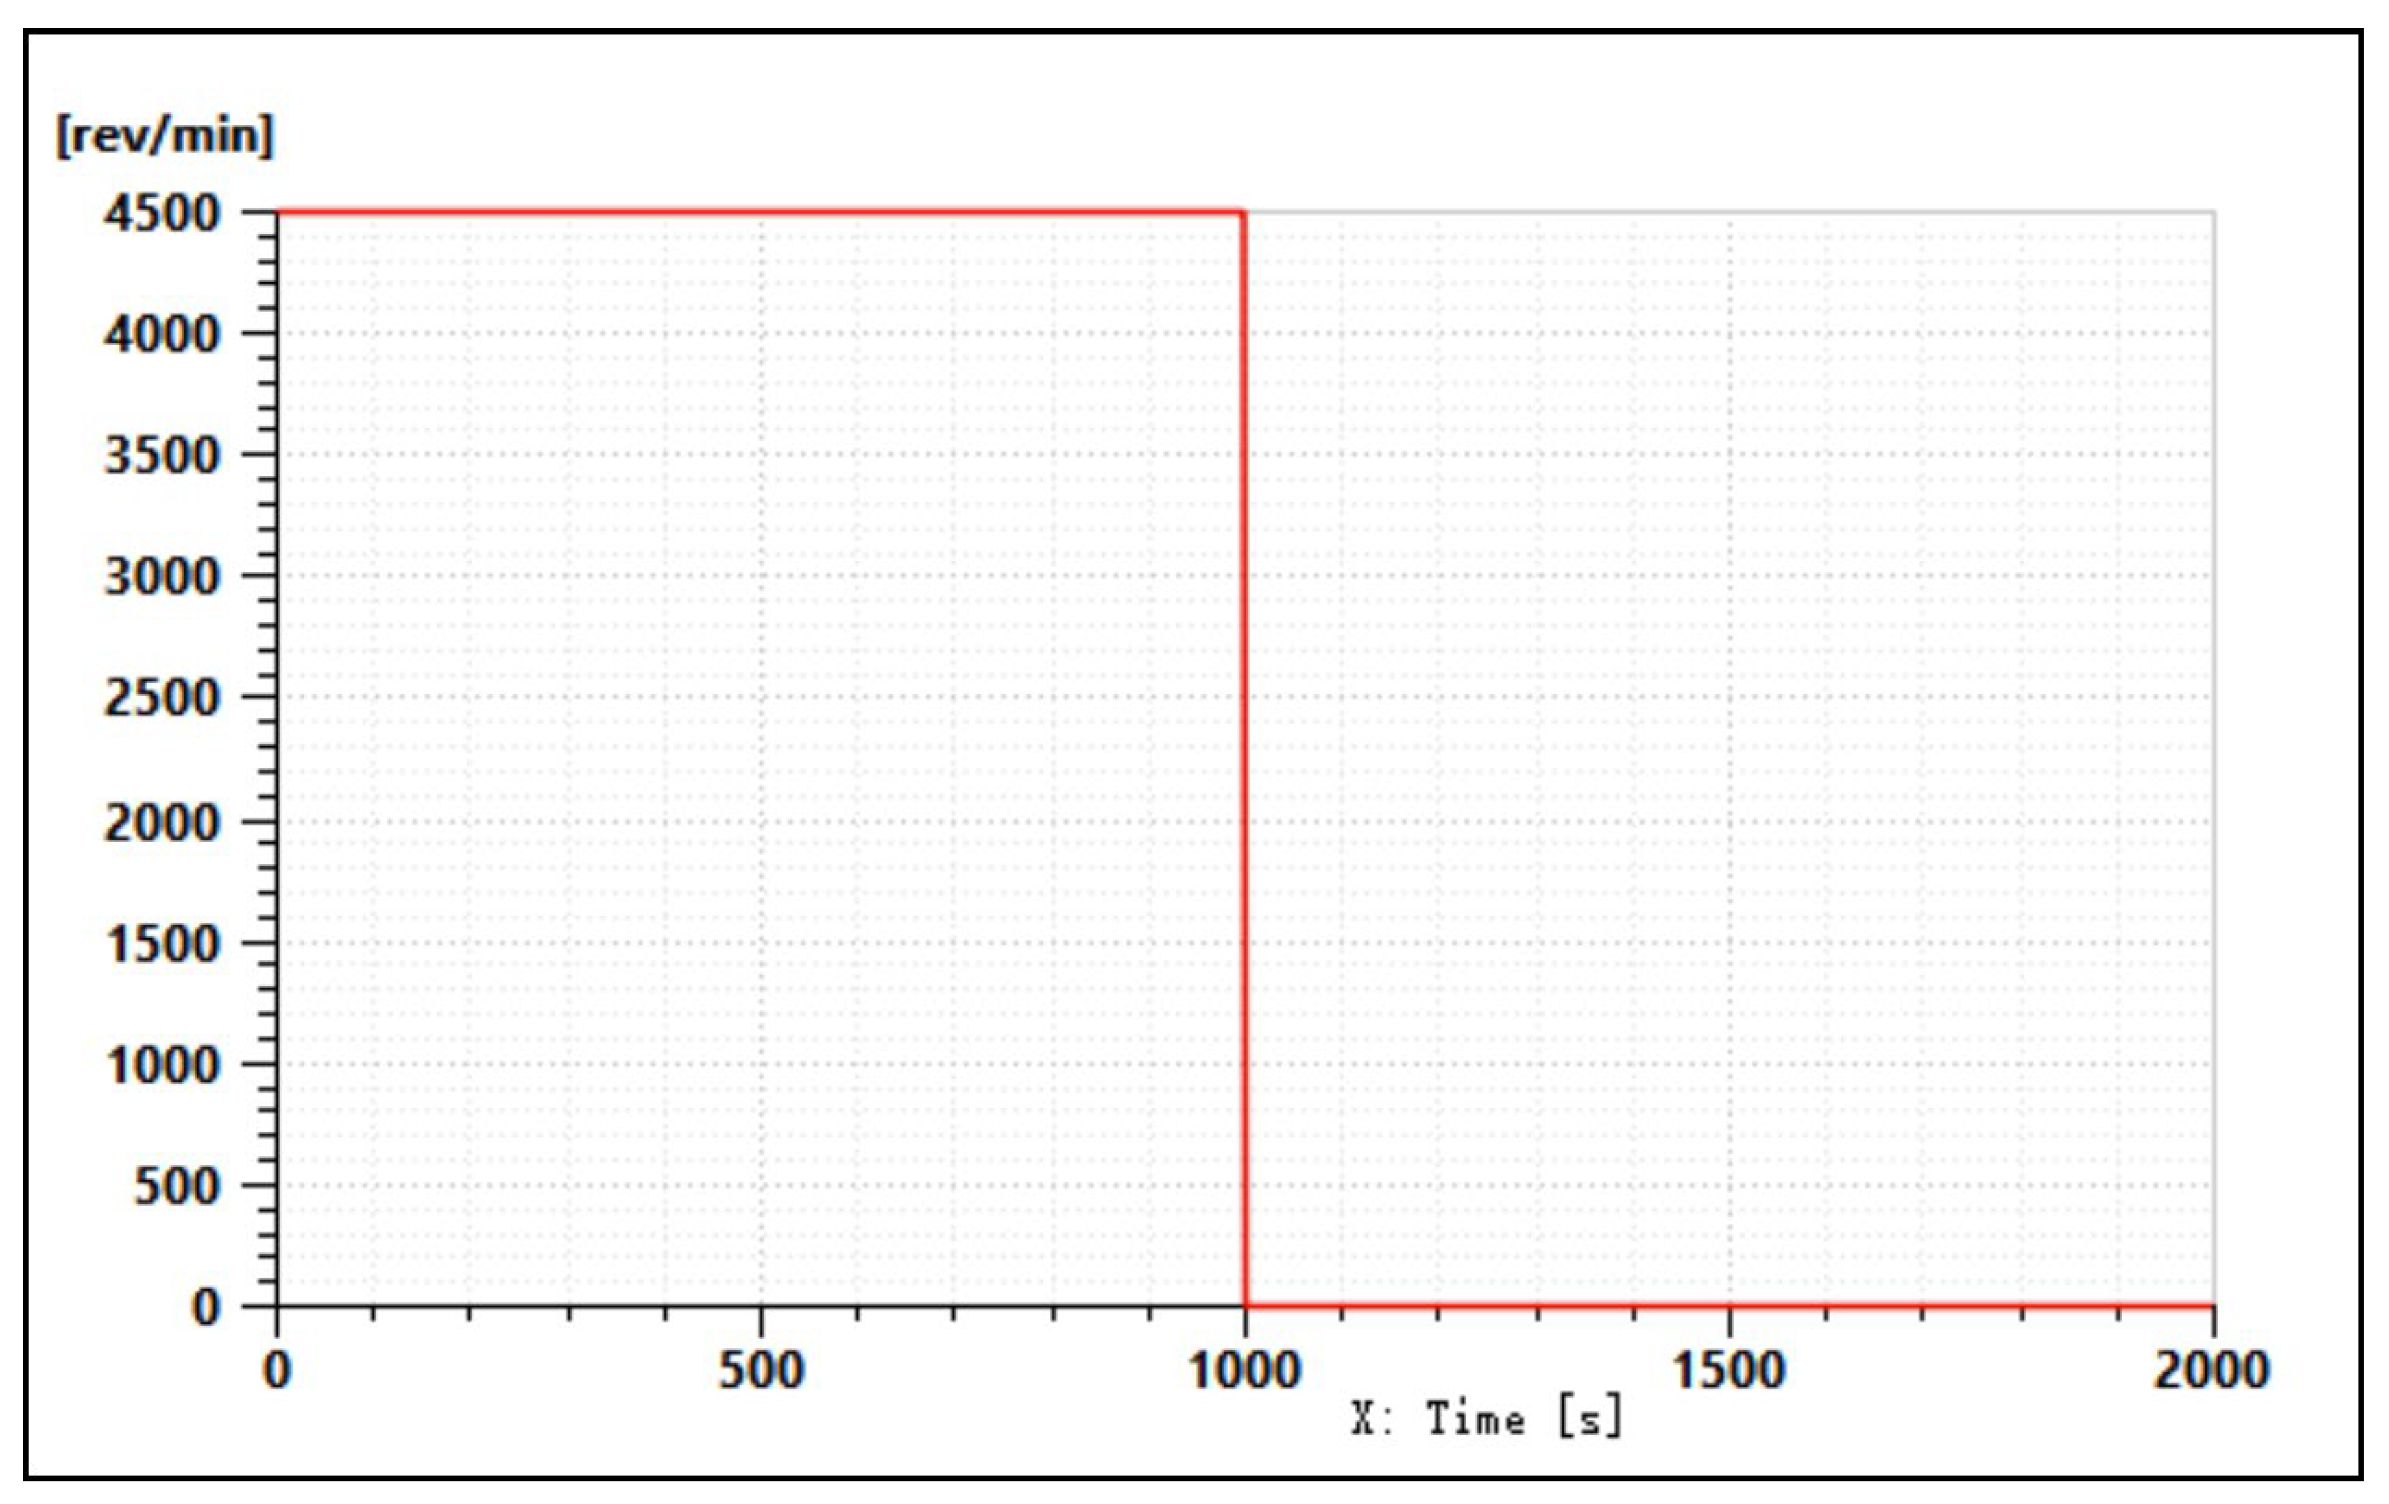
As shown in Figure 8, the subsea booster pump initiates operation at t = 0 s, with its rotational speed increasing to 4500 r/min. It subsequently maintains this operational speed until t = 1000 s, when the pump is deactivated and the rotational speed drops to zero. Due to the heat generated during the shutdown and idle operation of the booster pump being much less than that during normal operation, in the simulation model, it can be approximately assumed that the rotational speed of the booster pump has dropped to 0 at this point. At this time, the heat-generating components no longer generate heat.
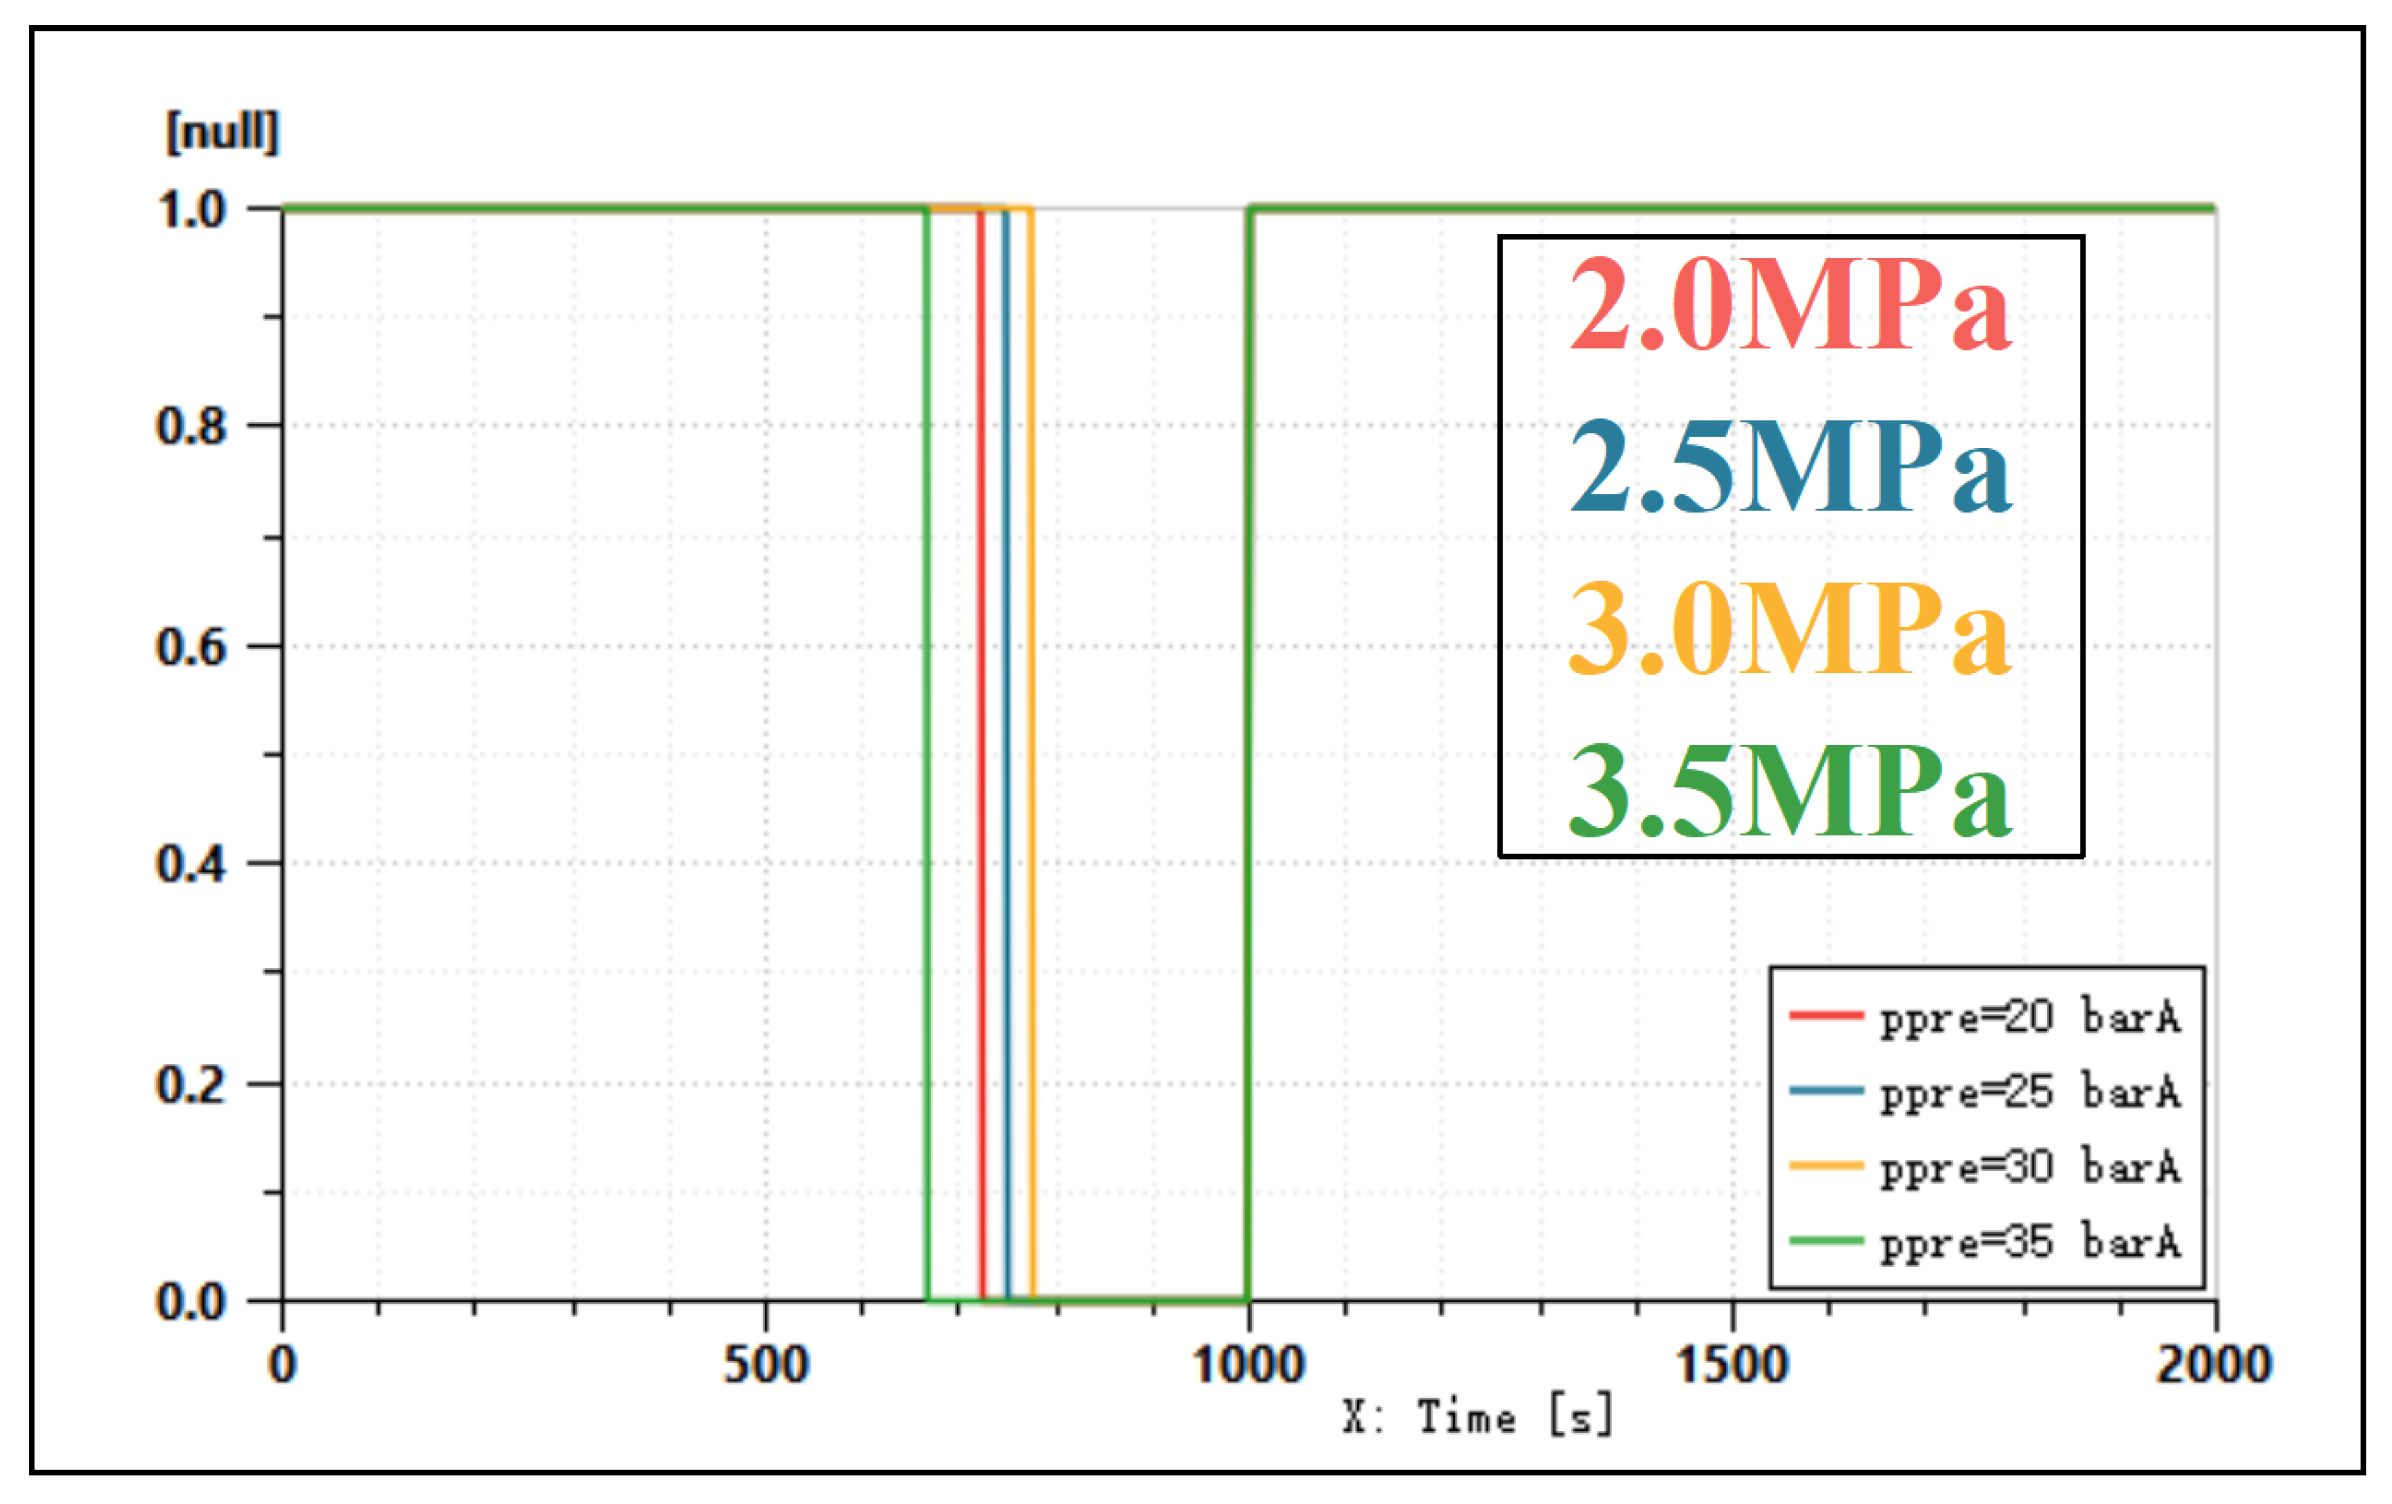
Figure 9 shows the operational status of the BPU supply valve under different accumulator pre-charge pressures. When the pre-charge pressure is lower than the minimum operating pressure (Pmin), an increase in pre-charge pressure results in a faster rate of fluid absorption by the accumulator from the upstream BPU supply during the pump startup phase. Consequently, the rate of barrier fluid supplied to the downstream system increases more slowly, leading to a delayed valve closure time. Conversely, when the pre-charge pressure exceeds Pmin, the accumulator is not yet operational, allowing the barrier fluid to be supplied downstream at the maximum rate, which results in the earliest valve closure time. Following the shutdown of the subsea booster pump at t = 1000 s, all valves open to facilitate rapid pressure replenishment to the subsea system. In conclusion, an appropriate pre-charging pressure of 2.5 MPa for the upstream accumulator is the most suitable, as it can prevent the supply valve from frequently activating.
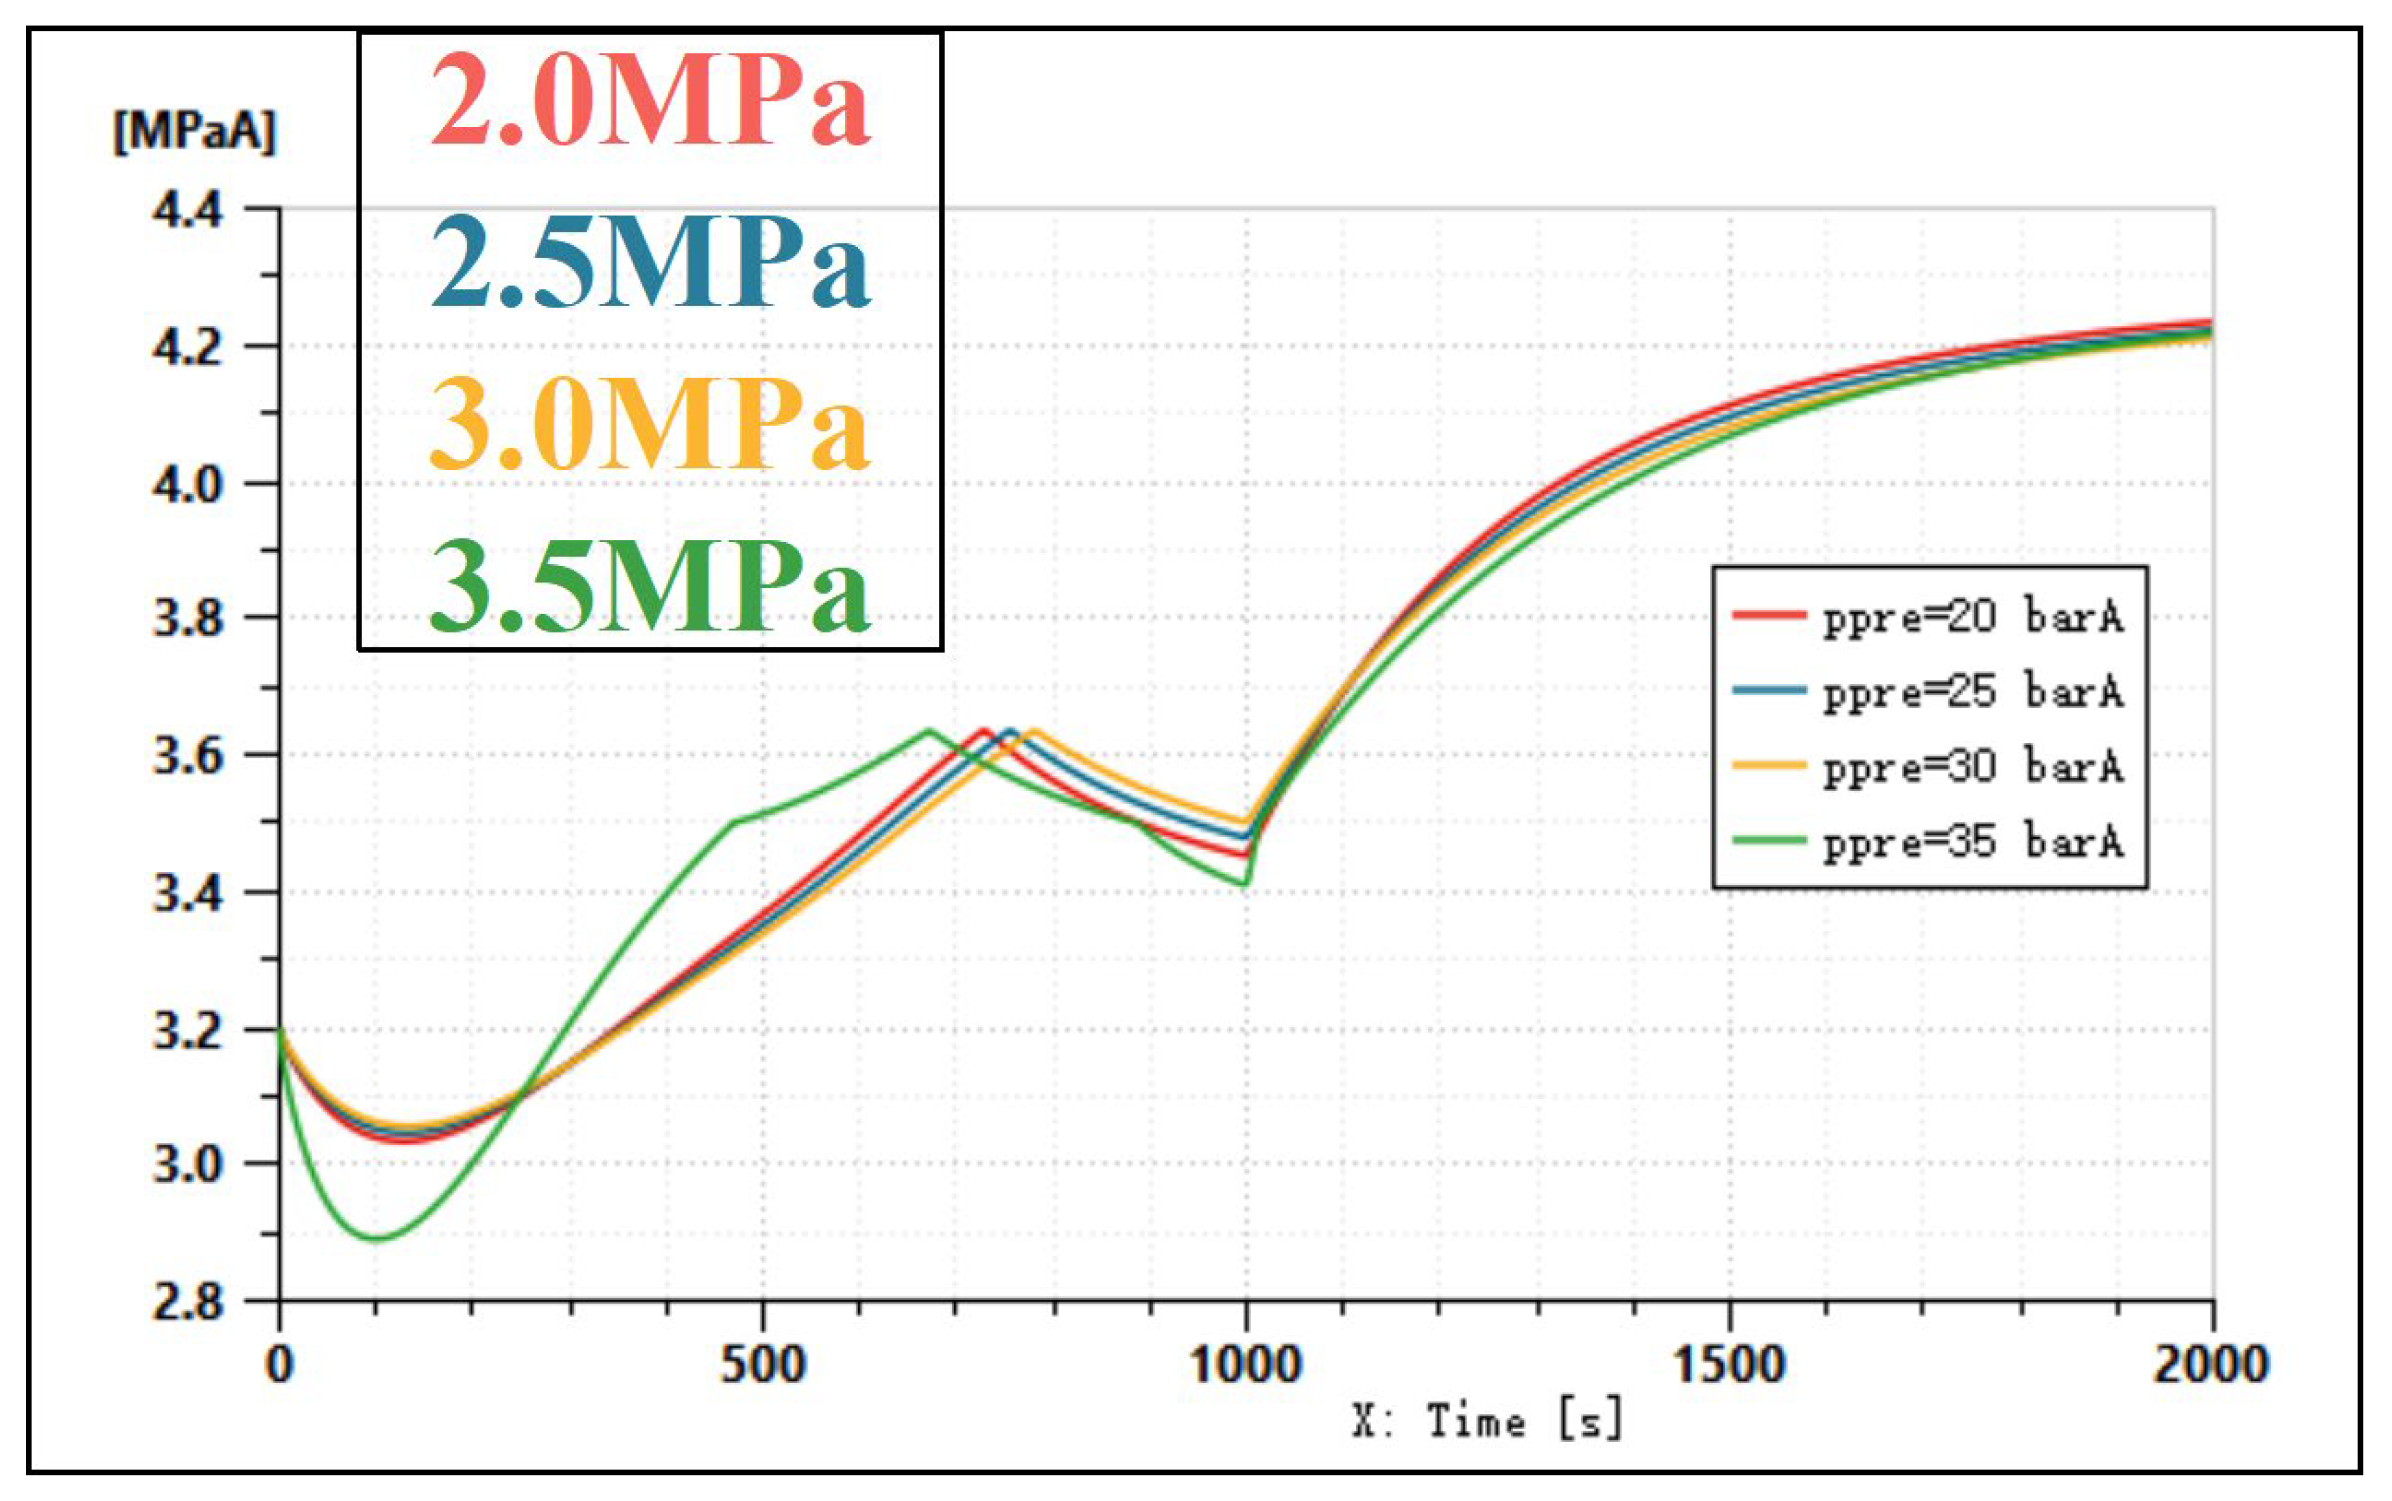
The variation trend of the barrier fluid pressure downstream of the BPU is depicted in Figure 10. The supply valve closes approximately between 600 s and 700 s. Prior to valve closure, the change in barrier fluid pressure downstream of the BPU aligns with the rate at which the BPU supplies barrier fluid to the subsea system. After valve closure, for accumulators with a pre-charge pressure lower than the minimum operating pressure (Pmin), a higher pre-charge pressure results in a faster fluid supply rate from the accumulator. Consequently, the rate of pressure decline downstream of the BPU slows accordingly. In contrast, for accumulators with a pre-charge pressure higher than Pmin, insufficient fluid is absorbed during the charging phase due to the accumulator not being operational. This leads to an inadequate fluid volume during the discharge phase, making it suboptimal for barrier fluid supply. Following the shutdown of the booster pump, the downstream pressure of the BPU is rapidly replenished upon the opening of the valves. In conclusion, an appropriate pre-charging pressure of 2.5 MPa for the downstream accumulator is the most suitable. It can replenish the barrier fluid most quickly after the supply valve is closed and the pump stops, thereby maintaining pressure stability.
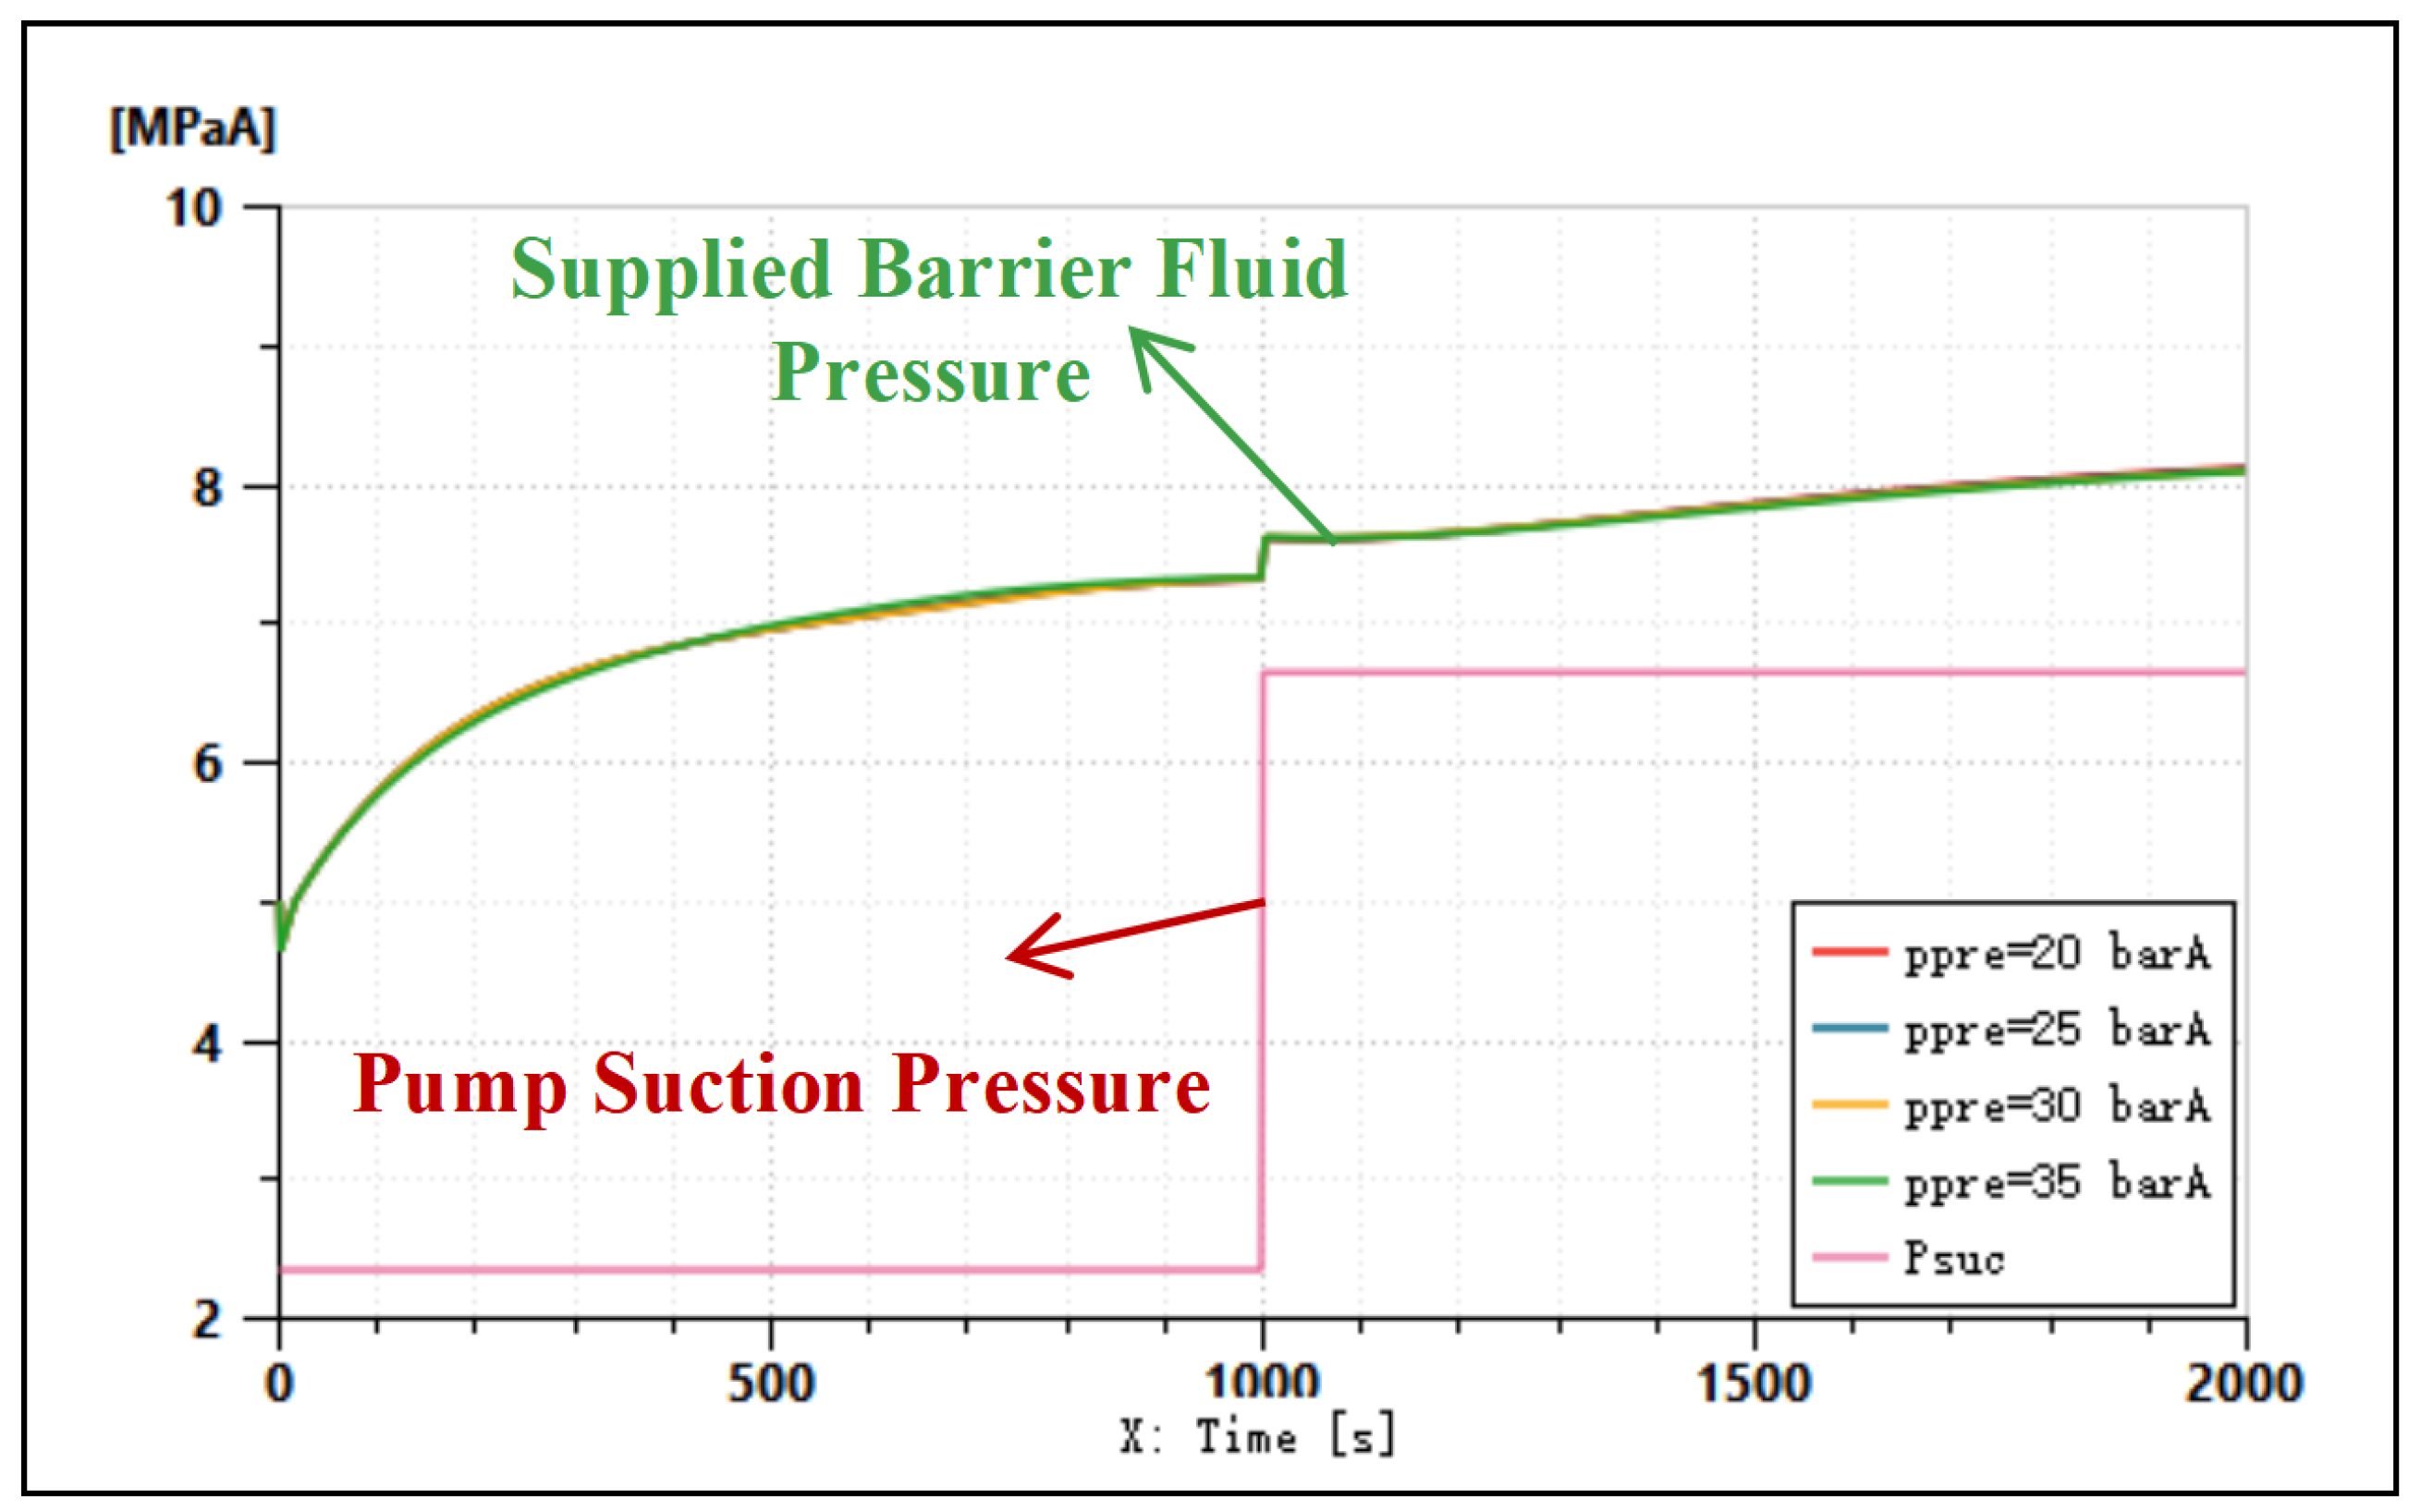
As shown in Figure 11, the variations in the subsea supplied barrier fluid pressure and the pump inlet working fluid pressure are illustrated. Under the current design parameters, the barrier fluid supply effectively adapts to abrupt changes in the pump inlet pressure, thereby maintaining a positive pressure differential relative to the working fluid.
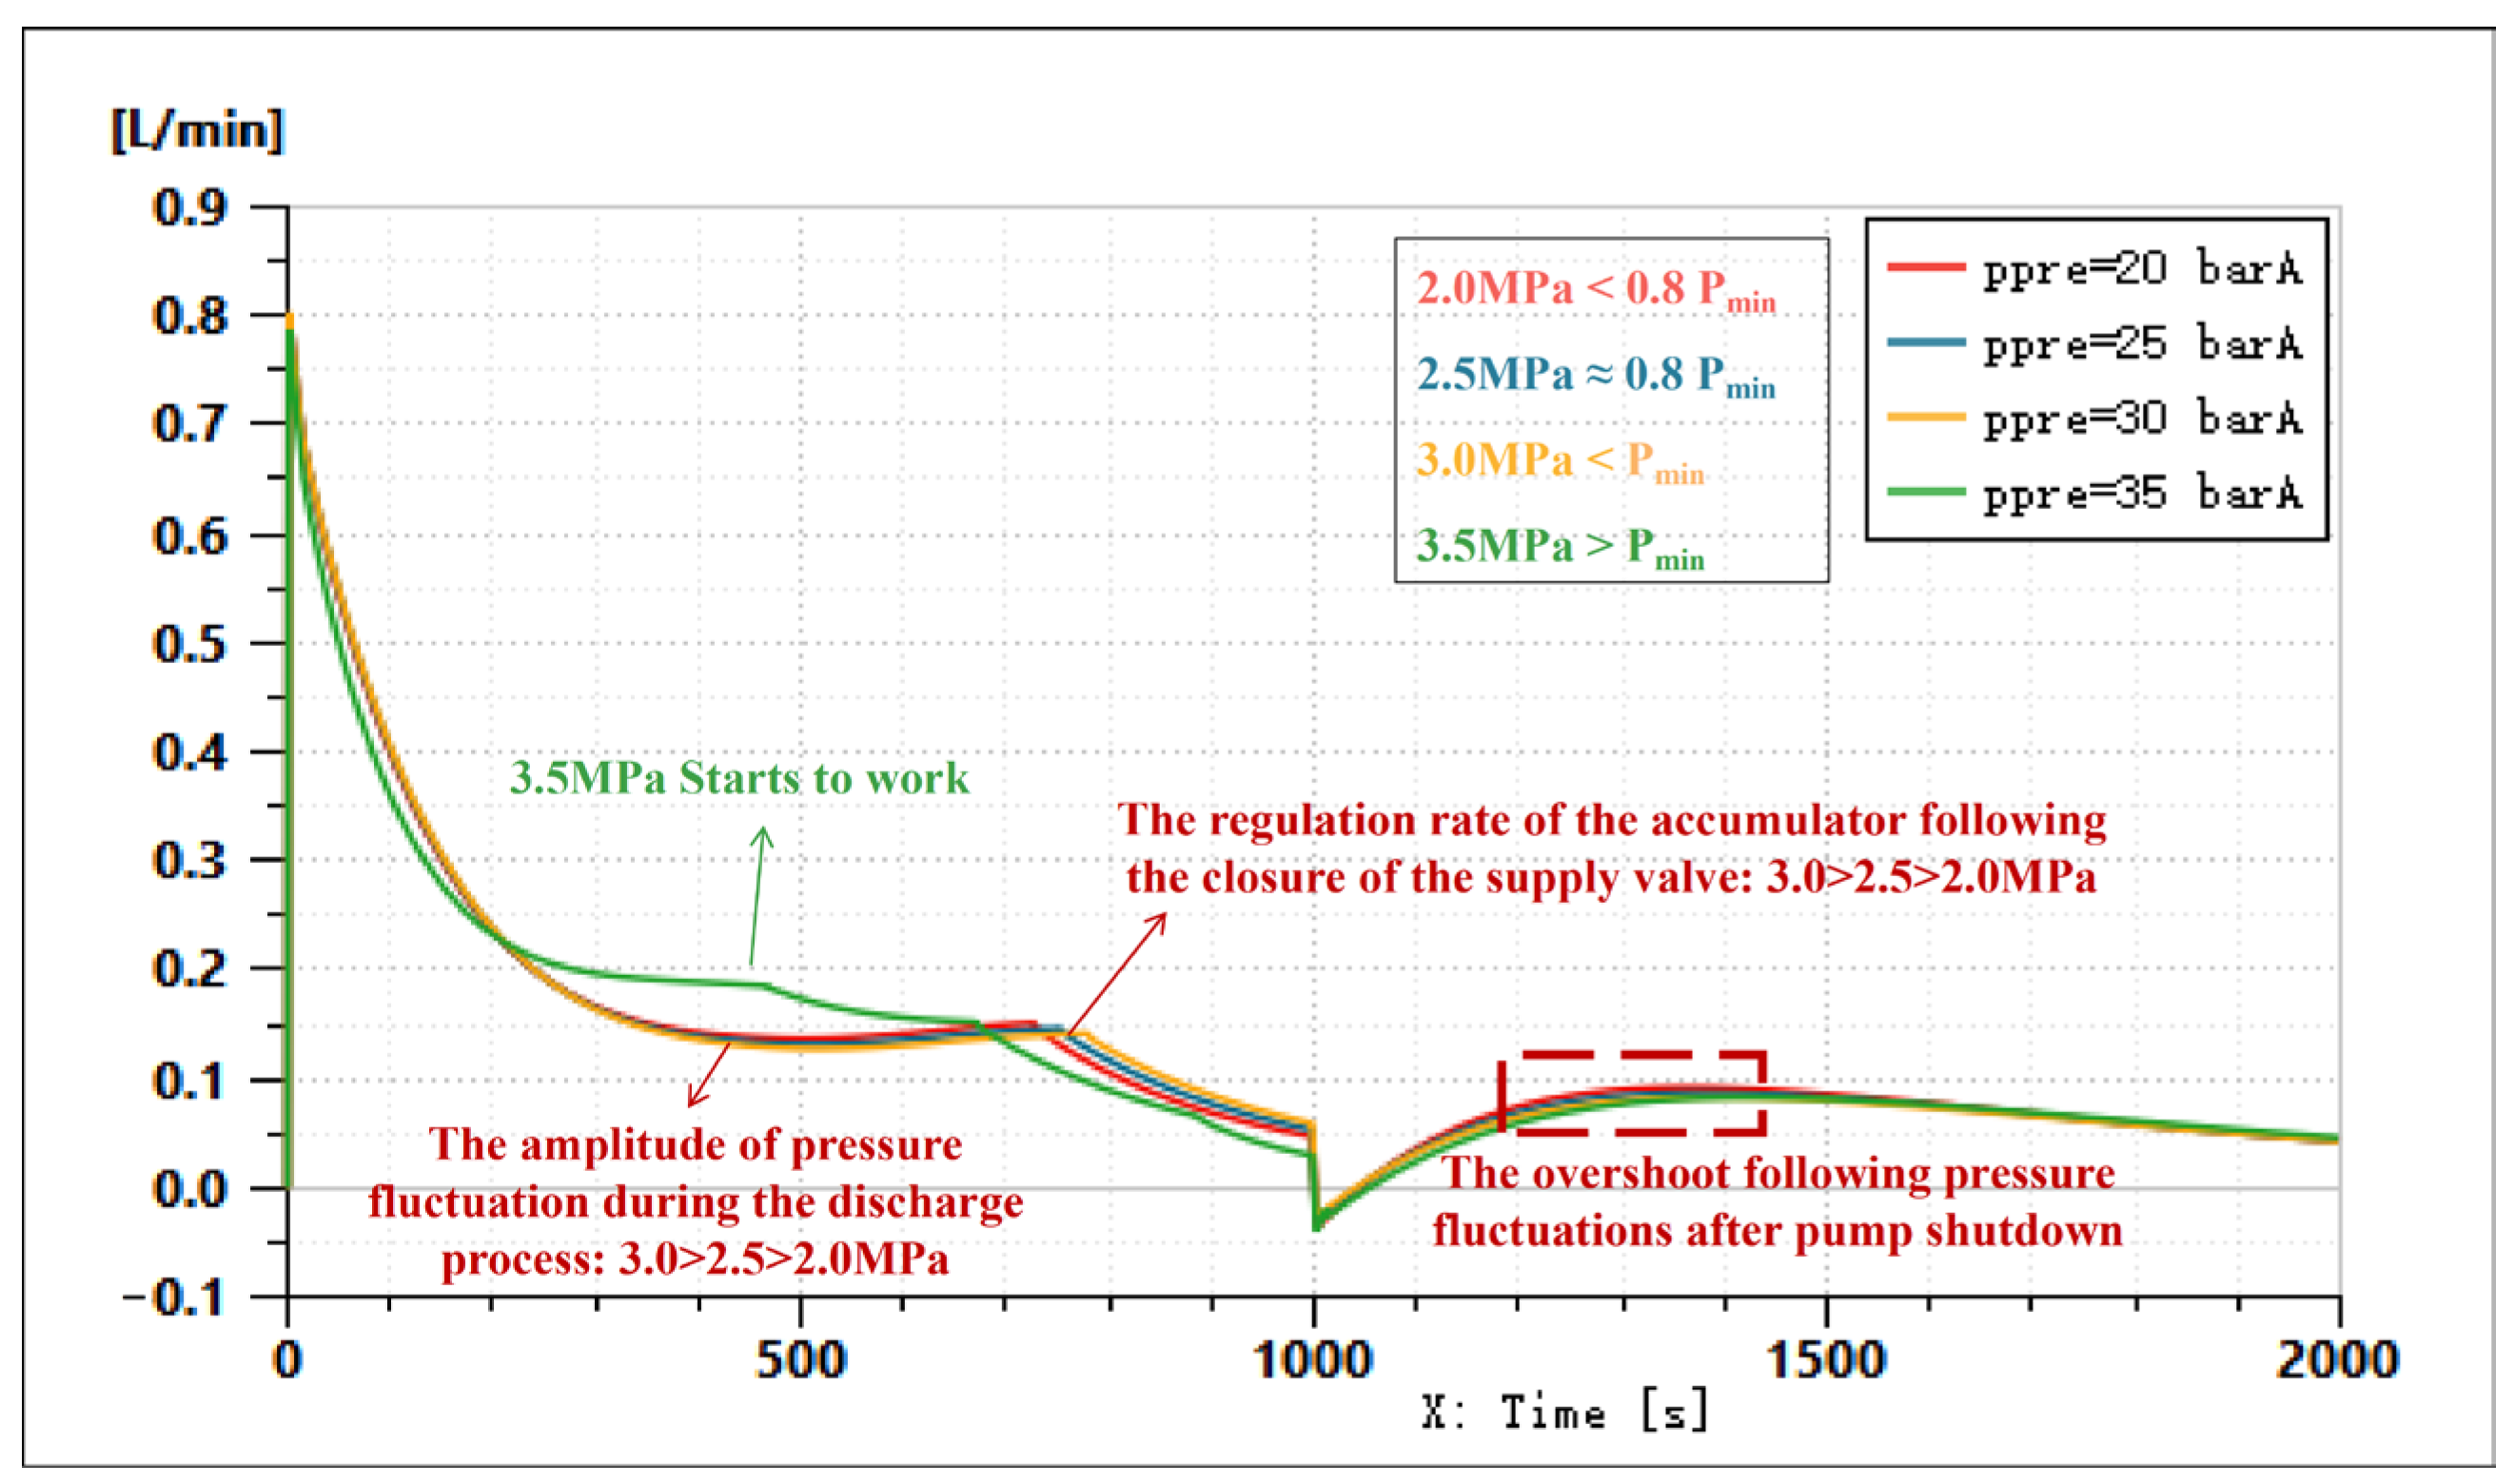
As illustrated in Figure 12, the barrier fluid supply flow rate of the BPU under different accumulator pre-charge pressures is presented. When the pre-charge pressure exceeds the minimum operating pressure (Pmin) downstream of the BPU, delayed activation of the accumulator introduces significant pressure fluctuations, which adversely affect system stability. Conversely, when the pre-charge pressure is lower than Pmin, a reduction in pre-charge pressure results in smaller amplitude pressure fluctuations during regulation but slower response speeds.
The performance characteristics of different pre-charged pressure accumulator systems are shown in Table 4. Based on the comprehensive analysis above, an intermediate pre-charge pressure—specifically, an optimal value of 2.5 MPa, which is approximately 0.8 times Pmin—should be selected to balance these competing factors.

4. Conclusions

This study presents a simulation model of the subsea booster pump barrier fluid system, developed using the AMESim platform. The model accurately reproduces the system’s responses under both steady-state and transient conditions, thereby enabling the identification of optimal operational parameters. By integrating hydraulic and thermal behaviors, it provides valuable insights into the effects of component parameters on sealing performance, cooling efficiency, and automatic control functions. Through simulations of challenging scenarios—such as sudden pump shutdown and rapid valve actuation—the model effectively elucidates system behavior under extreme conditions.
The proposed model facilitates fault diagnosis and design optimization while offering theoretical guidance for future deep-sea booster pump applications. Consequently, it contributes to mitigating operational risks and enhancing overall system reliability. Future research will focus on refining model parameters through validation against experimental data and developing intelligent control algorithms to better accommodate complex operating environments.
Comparisons with on-site data have validated the model’s accuracy. The major advantage of this work is its ability to evaluate and optimize a complex system, such as the subsea booster pump barrier fluid system, via AMESim-based simulation. This approach not only substantially reduces the costs associated with on-site testing but also provides effective guidance for system design.
Based on the steady-state and transient simulations, the following conclusions can be drawn to inform field practice:
(1)
The mechanical seal at the upper end of the subsea booster pump exhibits higher temperatures and greater leakage rates than its lower-end counterpart; accordingly, it warrants particular attention during maintenance.
(2)
Under steady-state operation, temperature exerts a more pronounced influence on barrier fluid seal leakage than pressure differential. Therefore, temperature management should be prioritised in barrier fluid system design.
(3)
To balance valve actuation frequency, supply rate following valve closure, and pressure overshoot after pump shutdown, the accumulator pre-charge pressure should be set to an appropriate value—typically around 0.8 times the minimum operating pressure.

Author Contributions

Conceptualization, Z.C. and R.L.; methodology, Z.C. and L.Z.; software, Z.C. and R.L.; validation, Z.C., W.A. and L.Z.; formal analysis, Z.C.; investigation, Q.Z.; resources, W.A.; data curation, W.A.; writing—original draft preparation, Z.C.; writing—review and editing, R.L.; visualization, Z.C.; supervision, W.A.; project administration, W.A.; funding acquisition, W.A. All authors have read and agreed to the published version of the manuscript.

Funding

This research was funded by the technological project of China National Offshore Oil Corporation (China) Limited, “Research on Key Technologies of subsea Pressurization System and Verification of subsea Multiphase Pump Principles (Project Number: KJZH-2024-2402)” and the major project of the National Ministry of Industry and Information Technology, “Development of 1500 m Subsea Oil Extraction Terminal and Control System (Project Number: 2023GXB01)”.

Institutional Review Board Statement

Not applicable.

Informed Consent Statement

Not applicable.

Data Availability Statement

The original contributions presented in this study are included in the article; further inquiries can be directed to the corresponding authors.

Acknowledgments

The authors would like to thank the editor and the anonymous reviewers for their constructive comments and suggestions that helped improve the quality of this manuscript.

Conflicts of Interest

Author Weizheng An and Liya Zhu were employed by the company China National Offshore Oil Corporation. The remaining authors declare that the re-search was con-ducted in the absence of any commercial or financial relationships that could be construed as a potential conflict of interest.

References

  1. Abdelaty, I.F. Technology Focus: Subsea Systems (August 2024). J. Pet. Technol. 2024, 76, 65–66. [Google Scholar] [CrossRef]
  2. Horn, A.M.; Rahman, T.; Pasqualino, I.; Duan, M.; Kang, Z.; Andersen, M.R.; Konno, Y.; Shim, C.; Teixeira, A.; Oterkus, S.; et al. Committee V. 8: Subsea technology. In Proceedings of the International Ship and Offshore Structures Congress, Vancouver, BC, Canada, 11–15 September 2022. [Google Scholar]
  3. Cunha, L.S.; Felix, T.; Meuter, P.; Bourne, M.; Fletcher, N.; Vasconcellos, J.H.; Hollingsaeter, T.F. Development and Qualification of a High Differential Pressure Subsea Pump. In Proceedings of the Offshore Technology Conference Brasil, Rio de Janeiro, Brazil, 29–31 October 2013. [Google Scholar]
  4. Kjellnes, H.F.L.; Jenssen, T.W.; Almqvist, J.; Solberg, P.; Russenes, C.F. Development of Novel Pressure Control for Subsea Pumps and Compressors. In Proceedings of the Offshore Technology Conference, Houston, TX, USA, 6–9 May 2019. [Google Scholar]
  5. Hjelmeland, M.; Reimers, O.; Hey, C.; Broussard, D. Qualification and development of the world’s first high pressure subsea boosting system for the Jack and St. Malo Field Development. In Proceedings of the Offshore Technology Conference, Houston, TX, USA, 1–4 May 2017. [Google Scholar]
  6. Montini, M.; Nuvolati, C.; Polonini, E.; Ponteggia, L.; Berretta, P.; Perrina, M.; Particelli, L. Troubleshooting and Optimization of a Deep-Water Multiphase Pump and of its Upstream Production Network: A Case Study. In Proceedings of the ISAVFT 20th International Conference on Multiphase Production Technology, Nice, France, 26–28 June 2023. [Google Scholar]
  7. Knudsen, H.R.; Bibet, P.J.; Ekeberg, I.; Marthinussen, S.A.; Kjellnes, H.F.; Torbergsen, E.A. Qualification of the HighBoost Multiphase Pump for Heavy Oil Applications. In Proceedings of the Offshore Technology Conference, Houston, TX, USA, 30 April 2018. [Google Scholar]
  8. Zhou, S.; Liu, Z.; Li, M.; Liu, D.; Wang, C.; Li, H. A Study on Fractional-Order Adaptive Super-Twisting Sliding Mode Control for an Excavator Working Device. Appl. Sci. 2025, 15, 12581. [Google Scholar] [CrossRef]
  9. Kim, M.; Yoo, S.; Yoon, D.; Jin, C.; Won, S.; Lee, J. Numerical analysis of the vehicle damping performance of a magnetorheological damper with an additional flow energy path. Appl. Sci. 2024, 14, 10575. [Google Scholar] [CrossRef]
  10. Zhou, Q.; Shi, K.; Xu, K.; Du, G.; Gao, K. Optimized Multi-Motor Power Control Strategy for Distributed Permanent Magnet Direct Drive Belt Conveyors. Appl. Sci. 2024, 14, 8343. [Google Scholar] [CrossRef]
  11. Ling, Y.; Wang, X.; Tang, J. Dynamic Simulation Model and Performance Optimization of a Pressurized Pulsed Water Jet Device. Appl. Sci. 2024, 14, 6788. [Google Scholar] [CrossRef]
  12. Wang, J.; Jin, X.; Liu, X.; Liu, P.; Chai, J.; He, Z. Numerical investigation on synchronous control of anti-recoil displacement tension of riser for a TLP. Ocean. Eng. 2024, 304, 117801. [Google Scholar] [CrossRef]
  13. Jia, B.; Wu, D.; Smallbone, A.; Lawrence, C.; Roskilly, A.P. Design, modelling and validation of a linear Joule Engine generator designed for renewable energy sources. Energy Convers. Manag. 2018, 165, 25–34. [Google Scholar] [CrossRef]
  14. Liu, S.; Ben-Abdelwahed, A.; Sommier, A.; Reungoat, D.; Darnis, P. Experimental investigation of leakage flow measurement and surface morphology in small-scale liquid mechanical seals. Flow Meas. Instrum. 2025, 106, 7. [Google Scholar] [CrossRef]
  15. Liu, Y.; Zhuang, Z.; Zhou, Y.; Zhao, S.; Wang, D.; Liu, H. Heat transfer performance analysis of seawater heat exchange pipelines in deep seawater closed cooling air conditioning system. Appl. Therm. Eng. 2022, 212, 118582. [Google Scholar] [CrossRef]
  16. Manring, N.D.; Fales, R.C. Hydraulic Control Systems; John Wiley & Sons: Hoboken, NJ, USA, 2019. [Google Scholar]
  17. Binder, R.C. Fluid Mechanics, 3rd ed.; Prentice-Hall, Inc.: Hoboken, NJ, USA, 1956. [Google Scholar]
  18. Idelchik, I.E. Handbook of hydraulic resistance. J. Press. Vessel. Technol. 1987, 109, 260–261. [Google Scholar] [CrossRef]
  19. Li, S.; Huai, W. United formula for the friction factor in the turbulent region of pipe flow. PLoS ONE 2016, 11, e0154408. [Google Scholar] [CrossRef] [PubMed]
  20. Abraham, J.P.; Baringer, M.; Bindoff, N.L.; Boyer, T.; Cheng, L.J.; Church, J.A.; Conroy, J.L.; Domingues, C.M.; Fasullo, J.T.; Gilson, J.; et al. A review of global ocean temperature observations: Implications for ocean heat content estimates and climate change. Rev. Geophys. 2013, 51, 450–483. [Google Scholar] [CrossRef]
Figure 1. The diagram of the barrier fluid system.
Applsci 16 00691 g001
Figure 2. Dynamic leakage model based on AMESim. (a) Mechanical seal leakage channel; (b) leakage calculation model. The red arrow indicates the direction of the flow of the barrier fluid.
Applsci 16 00691 g002
Figure 3. The valve control hysteresis curve. SV1 refers to the supply solenoid valve and SV2 refers to the relief solenoid valve. The red and blue lines represent the switching state variations of the two valves during the pressure increase and decrease processes, respectively.
Applsci 16 00691 g003
Figure 4. Schematic diagram of the pressure sensor layout for on-site testing.
Applsci 16 00691 g004
Figure 5. Schematic of steady-state pressure control process. (a) Barrier fluid pressure of BPU outlet, upstream, subsea; (b) Working condition of BPU supply valve; (c) Working condition of BPU pump; (d) Flow rate of accumulator in BPU downstream. Points A and B denote the moments at which the BPU pump is opened and closed, respectively; point C indicates the moment at which the BPU supply pump is closed; and point D represents the moment at which the pressure stabilizes. The arrows indicate the characteristic features of (b,d) at moment C.
Applsci 16 00691 g005
Figure 6. Pressure differences and leakage rates at mechanical seals. (a) Pressure differences at the upper shaft seal; (b) pressure differences at the lower shaft seal; (c) leakage rates at both mechanical seals.
Applsci 16 00691 g006
Figure 7. Temperature and flow rates at cooling coils. (a) Upper cooling coil temperature; (b) lower cooling coil temperature; (c) flow rates at upper and lower cooling coil, respectively.
Applsci 16 00691 g007
Figure 8. Sensitivity analysis of the pre-charge pressure parameters of the accumulator: The operational status of the subsea booster pump.
Applsci 16 00691 g008
Figure 9. Sensitivity analysis of the pre-charge pressure parameters of the accumulator: The operational status of the supply valve of BPU.
Applsci 16 00691 g009
Figure 10. Sensitivity analysis of the pre-charge pressure parameters of the accumulator: The pressure of the barrier fluid in the downstream of BPU.
Applsci 16 00691 g010
Figure 11. Sensitivity analysis of the pre-charge pressure parameters of the accumulator: The variation curves of supplied barrier fluid pressure and pump suction pressure.
Applsci 16 00691 g011
Figure 12. Sensitivity analysis of the pre-charge pressure parameters of the accumulator: the variation curves of supplied flow rate of the accumulator.
Applsci 16 00691 g012
Table 1. Verification experiment setup.
ParameterValue
InputDesign Depth [m]330
Pump Revolution Speed [r/min]2863
Suction Process Pressure [MPa] 1.58
Discharge Process Pressure [MPa] 5.10
Table 2. Comparison of AMESim simulation and on-site data. (Due to commercial confidentiality, the data is presented in the form of variables.)
ParameterOn-site DataSimulation DataRelative Error
Supply Barrier Fluid PressureP10.944P1−5.6%
Subsea Barrier Fluid PressureP20.969P2−3.1%
Subsea Barrier Fluid TemperatureT20.901T2−9.9%
Table 3. Steady-state AMESim simulation data for 600 m design depth.
ParameterAMESim Simulation Data
InputDesign Depth [m]600
Pump Speed [r/min]4500
Suction Process Pressure [MPa] 2.35
DischargeProcess Pressure [MPa] 6.65
OutputBPU Upstream Supply Pressure, Pheader [MPa] 3.70
BPU Downstream Supply Pressure [MPa]2.65
Subsea Barrier Fluid Supply Pressure [MPa]7.43
Upper Shaft Seal barrier fluid-process fluid Pressure Difference [MPa]4.55
Lower Shaft Seal barrier fluid-process fluid Pressure Difference [MPa]5.08
Total Seal Leakage Rate [L/min]0.01
Upper Cooling Coil Inlet Temperature [°C]33.03
Lower Cooling Coil Inlet Temperature [°C]20.77
Upper Cooling Coil Total Flow Rate [L/min]185.04
Lower Cooling Coil Total Flow Rate [L/min]39.32
Table 4. Transient AMESim simulation results for 600 m design depth.
Precharge Pressure (MPa)Supply Valve of BPU ActivationSupply Speed After Pump ShutdownPressure Overshoot After Pump Shutdown
2.0quite frequentquite fastquite high
2.5least frequentfastestlowest
3.0quite frequentquite fastquite high
3.5most frequentslowesthighest
Disclaimer/Publisher’s Note: The statements, opinions and data contained in all publications are solely those of the individual author(s) and contributor(s) and not of MDPI and/or the editor(s). MDPI and/or the editor(s) disclaim responsibility for any injury to people or property resulting from any ideas, methods, instructions or products referred to in the content.