1. Introduction
Lead–acid batteries present ‘mature’ technology. Nevertheless, their degradation behavior remains highly relevant in industrial backup power systems, telecommunications, power-grid control, emergency infrastructure, and other applications where reliability is more important than gravimetric energy density. Conventional aging mechanisms such as positive-grid corrosion, sulfation, water loss, acid stratification, and thermal acceleration are well documented. However, industrial failures sometimes occur in ways that cannot be explained solely by normal cycling or long-term service aging.
The present article focuses on one such atypical failure mode: rapid corrosive degradation of industrial flooded lead–acid batteries accompanied by the formation of loose, non-passivating products on positive terminals and bridges. The case is analytically important because the batteries investigated differed in manufacturer, nominal capacity, operational target, and service time, yet failed within the same period and in the same building context. This suggests the presence of a shared influence but does not distinguish environmental exposure from common operating, maintenance-related, or contamination-related factors. One of objectives is to identify the corrosion products formed during this premature degradation and to discuss whether sulfide-containing species, especially PbS related to external H2S exposure, may participate in the observed corrosion pathway. The study combines Raman spectroscopy, XRD, SEM, and electrochemical measurements of lead and lead-alloy electrodes in sulfuric acid.
This work is a companion study to Part I of this series, but addresses a distinct battery population, experimental dataset, and scientific question. Part I investigated field-aged VRLA batteries withdrawn from distributed medium-voltage grid-management systems and focused on State-of-Health assessment using capacity testing, open-circuit voltage, and electrochemical impedance spectroscopy. In contrast, the present study examines prematurely failed flooded OPzS batteries from a separate field case and focuses on the chemical composition and morphology of their corrosion products using Raman spectroscopy, XRD, and SEM, complemented by electrochemical measurements on lead-based alloys. The independent contribution of this work is therefore the identification and interpretation of an atypical sulfide-associated corrosion pattern in prematurely failed flooded batteries, rather than the assessment of aging and State of Health addressed in Part I.
2. Background: Corrosion and Sulfide-Related Degradation in Lead–Acid Batteries
While the typical lead–acid battery aging mechanisms are present independently from battery design and working conditions, there may be some processes that are not only rarely found, but also much more damaging. One of them is lead (II) sulfide formation, described further below.
The presence of lead (II) sulfide (PbS), regarding lead–acid batteries, is first of all considered in terms of the reductive properties of said compound, allowing for convenient conversion of lead (IV) oxide to lead (II) sulfate in various recycling processes [
1,
2]. When it comes to the exploitation of the cells, its formation and presence within the cell are correlated with subsequent evolution of gaseous H
2S, treated as a toxicological [
3] and health and safety problem [
4] rather than an electrochemical one. For example, the
post mortem analysis of the batteries after their failure incidents proved that the overcharge conditions applied to the battery, e.g., in the case of the electronic rectifier and voltage regulator breakdown [
5], reported for the industrial UPS system resulted in overcurrent and increase in the temperature above 60 °C. These conditions resulted in chemical corrosion of copper elements of the system with products identified later as copper sulfide. The accident conditions were, therefore, simulated in an experimental setup allowing, through a special thermal insulation layer, self-heating of the battery to almost 100 °C with current of 33 A and voltage increase to almost 3 V per cell of nominal capacity of 160 Ah. These concentrations were identified to be high enough to cause the sulfide corrosion of copper elements enclosed in the same jar but, on the other hand, to be small enough not to be toxicologically dangerous in terms of human presence nearby. The same conclusion is, as well, confirmed by safety equipment suppliers [
6] stating that while their more advanced gas analyzers deliver information on the presence of H
2S in the atmosphere of charging stations, the dangers related to it are of lesser importance than the ones related to explosive hydrogen–air mixtures. On the other hand, the electrochemical investigations of the reference system described in the paper cited above [
5] deliver only indirect proof of the electrochemical mechanism of H
2S generation, linking it to the reduction of H
2SO
4 occurring in high-current and high-temperature conditions on both lead and platinum electrodes. A more detailed study was delivered by Vanasse et al. [
7], who has proven that this kind of reaction can be observed in significantly less harsh operational conditions of the lead–acid battery. One of the first conclusions delivered here claims that third substances, such as expanders, used in the process of the formation of the porous plate material can be excluded from the H
2S source list. The authors, using a specially designed experimental setup, prove that even highly purified lead (99.999%) subjected to negative potential versus another pure lead electrode delivers relatively high concentrations of H
2S (300–550 ppm) in the resulting hydrogen stream. This observation was made at ‘reasonable’ operational temperature of the system (40 °C) and with potential differences either equal to or only slightly higher than the float charge voltage of the single lead–acid cell (2.25–2.65 V). These results were astonishing even for the authors who performed the investigation more thoroughly, finding that this atypical course of the reaction is present only if a freshly prepared solution of sulfuric acid is used as an electrolyte. Moreover, the observed concentration of the hydrogen sulfide reaches zero, which is claimed to be related to the decomposition of unspecified impurities initially present in the acid in a relatively quick manner. In addition to this, the authors suggest that negligible concentration of H
2S present in exhaust gases evolving from the normally operating lead–acid battery is the result of the secondary reaction of this compound with lead dioxide present on the positive plate of the cell. The same reaction which is claimed as applicable in cell recycling processes mentioned above [
1].
An opinion contradictive to the one discussed above is presented by Jones et al. [
8] who, analyzing the composition of the hydrogen-bearing gas, liberated from the negative plate compartments of various cells, differing in composition and performance, observed that the concentration of the hydrogen sulfide in this mixture cannot be correlated with the ‘quality’ of the plate material (understood here as the inverse of the self-discharge rate of the cell, and thus, correlated with the purity of the lead used). Alternatively, they linked its presence to reactivity of the lignosulfate mixture used as the expander in this particular plate composition, and, on the other hand, to the catalytic activity of carbonaceous additives to the plate acting as the catalyst [
9] of the oxidation processes of H
2S, and in consequence, reducing its emission from the working cell under investigation.
Despite the above, lead (II) sulfide can also form in dry cells stored in unsuitable conditions—for example, in rooms where hydrogen sulfide is present, even in trace amounts. It is worth noting that the microbiological literature [
10,
11] describes the phenomenon of hydrogen sulfide formation as a result of bacterial activity on building materials containing gypsum (plasterboard, gypsum plasters and some paints). However, there are no studies on the impact of such bacteria on the failure rate of lead–acid cells. Moreover, rubber components vulcanized using elemental sulfur can also be a source of sulfur and its compounds including PbS.
3. Case Description and Methods
Corrosion products of three batteries of two different leading producers (first and second battery—5OPzS type, manufacturer A; third battery—6OPzS type, manufacturer B) were tested. Said batteries were exploited in different rooms of one building, and were maintained using the same procedures, except the electrolyte and distilled water sources.
The quality and purity of distilled or deionized water used for the batteries’ maintenance were certified to comply with the respective normative documents for filling and topping up vented lead–acid batteries (such as OPzS, GroE, and OGi cells). These were in the first row [
12] (represented in Poland by their national version [
13]) with a subsidiary role of [
14].
It is worth stressing that batteries withdrawn from two separate substations were (due to the organizational structure of the operating company) supplied with water from two independent manufacturing companies. This implies that (as the observed corrosion mechanisms were similar) they should not be correlated with an accidental (not permanent) decrease in water quality. While the third battery failed after around two years of usage, the first and second batteries were being used only for a few months. All said batteries failed at the same time, shortly after building renovations. Despite using different lead alloys, both battery types exhibited the same, atypical, rapid failure mechanism related to corrosive degradation of the positive terminals and bridges, resulting in the appearance of substantial loose products not forming a passivation layer, which were not protecting the metal from further degradation.
The batteries examined were prematurely withdrawn from the backup strings located in an undisclosed high-voltage transmission/transformer plant in Poland. The control building of the station contained all four separate battery backup strings together, of which two were faulty. All batteries (despite the atypical corrosion behavior observed) still passed the capacity test described below. Therefore, the units with the most advanced corrosion signs (2 from the 220 V string and 1 from the 48 V one) were selected for a deeper examination in the laboratory. It is worth stressing that in high-voltage transmission and transformer substations, stationary auxiliary DC battery systems provide the uninterruptible power backbone essential for fail-safe grid protection and deterministic fault clearing during total AC station blackouts. Substation architecture conventionally bifurcates auxiliary DC distribution into two distinct voltage standards: a nominal 220 V DC system and a dedicated 48 V DC system. The primary 220 V DC bus powers critical numerical protection relays, digital bay controllers, circuit breaker trip and close coils, emergency lighting, and motorized disconnector drives. This high-voltage DC level is specifically engineered to deliver substantial short-duration pulse currents required to actuate heavy inductive trip mechanisms without unacceptable bus voltage drops. Conversely, the 48 V DC bus is reserved exclusively for station telecommunications, including SCADA communication gateways, optical multiplexers, fiber-optic transceivers, and teleprotection inter-tripping channels. Galvanically segregating the telecom supply from the main 220 V protection bus isolates sensitive digital communication hardware from severe high-energy inductive switching transients, common-mode noise, and potential ground faults.
Therefore, in both cases, due to the strict internal regulations of the system operator to ensure maximum operational reliability and early fault detection, substation OPzS battery installations were maintained in strict accordance with the testing and maintenance frameworks defined by the standards in [
14,
15]. Definitive verification of State of Health is conducted via standardized constant-current capacity discharge tests (typically at the 10 h rate down to a cutoff voltage of 1.80 V/cell). The standards mandate an initial acceptance test upon commissioning and periodic performance tests throughout the battery’s operational lifecycle (every 2 years). Despite this, these included routine monthly and quarterly inspections with precise recording of individual cell float voltages, as well as pilot cell temperatures, together with the inspection of the electrolyte specific gravity (nominally 1.240 ± 0.010 kg/L at reference temperature, corrected for thermal expansion). The battery rooms were kept in the temperature range from 18 to 27 °C with the standard 0.25 mV/°C temperature compensation applied automatically to the 2.23–2.24 V/cell floating voltage. As the battery was constantly (despite the performance tests) kept in a float-charged 100% SoC, the premature corrosion of the battery tabs but not the grids became the subject of research interest described in the paper.
The composition of the slurry containing corrosion products was analyzed by means of Raman spectroscopy (excitation wavelength—780 nm, exposition time—30 s, diffraction grating—1200 gr/mm), XRD (Cu Kα radiation source, low-background [711] Si crystal, 0.02° step, 1 s per step) and SEM (10 kV, SE/ETD and EDS). In case of EDS experiments, quantitative data reliability was achieved by measuring four to six scans performed on the randomly chosen fragments of sample. A similar, but limited to three to five repetitions, procedure was used for the Raman spectra collection.
All electrochemical measurements were conducted using the three-electrode system. The reference electrode used was a mercury–mercurous sulfate (MSE) one, and the counter electrode was Pt mesh. The working electrode was made of various materials, including pure (99.99%) lead, alongside Pb-Sb (4%) and Pb-Sb (2%)-Se (0.025%) alloys. Three CV scans were conducted within −1.5 to 2.0 V vs. reference range, with a 20 mV/s scan rate. For corrosion studies, LSV scans were performed from −1.2 to 0.0 V vs. reference electrode, with a scan rate of 20 mV/s. For EIS the frequency range used was 200 kHz–1 mHz with 10 mV amplitude and 10 points per decade. If not stated otherwise, the EIS measurements were conducted in OCV.
4. Results and Discussion
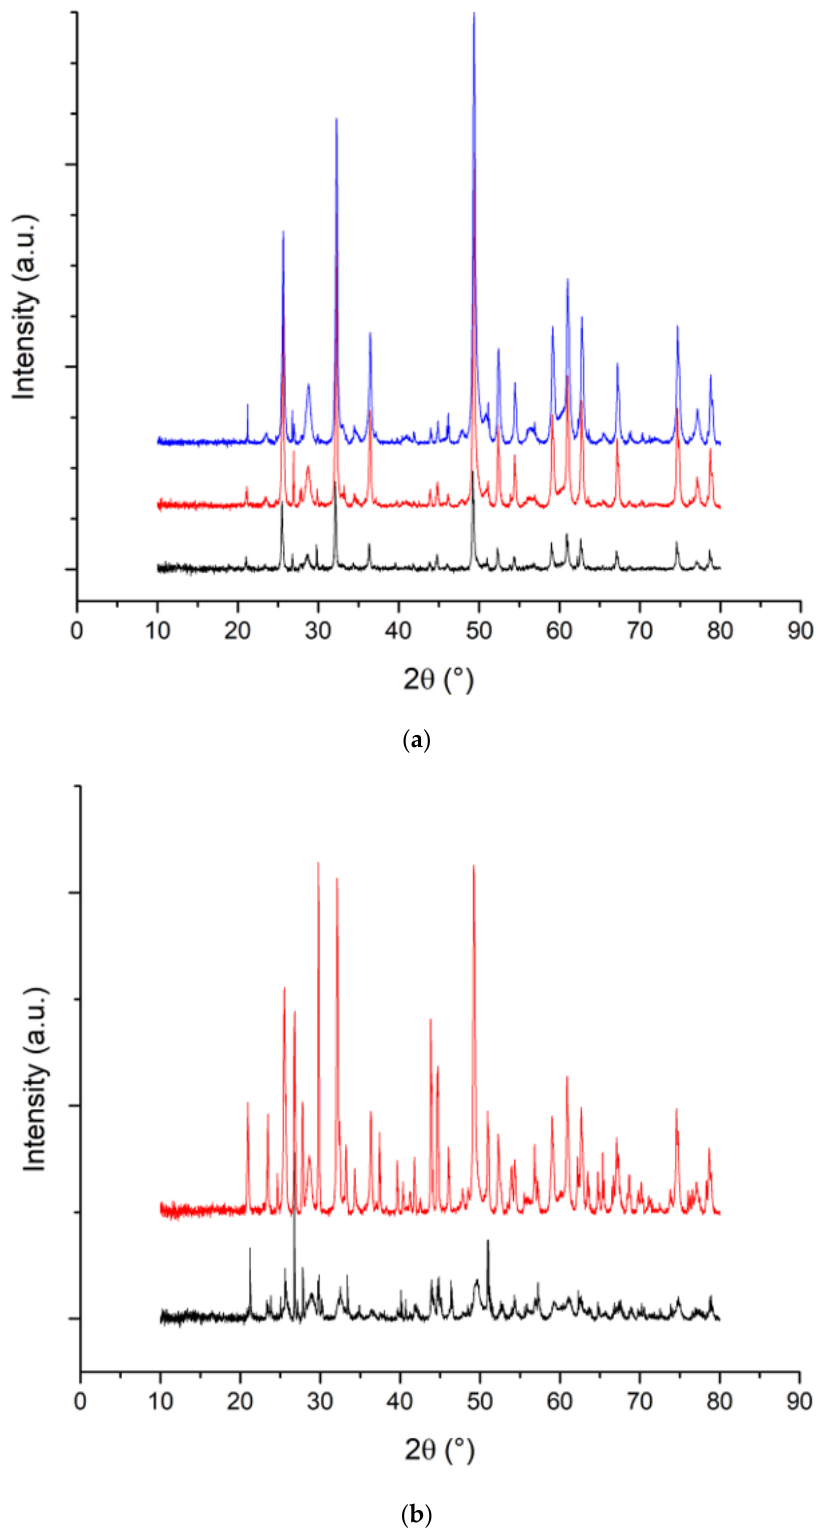
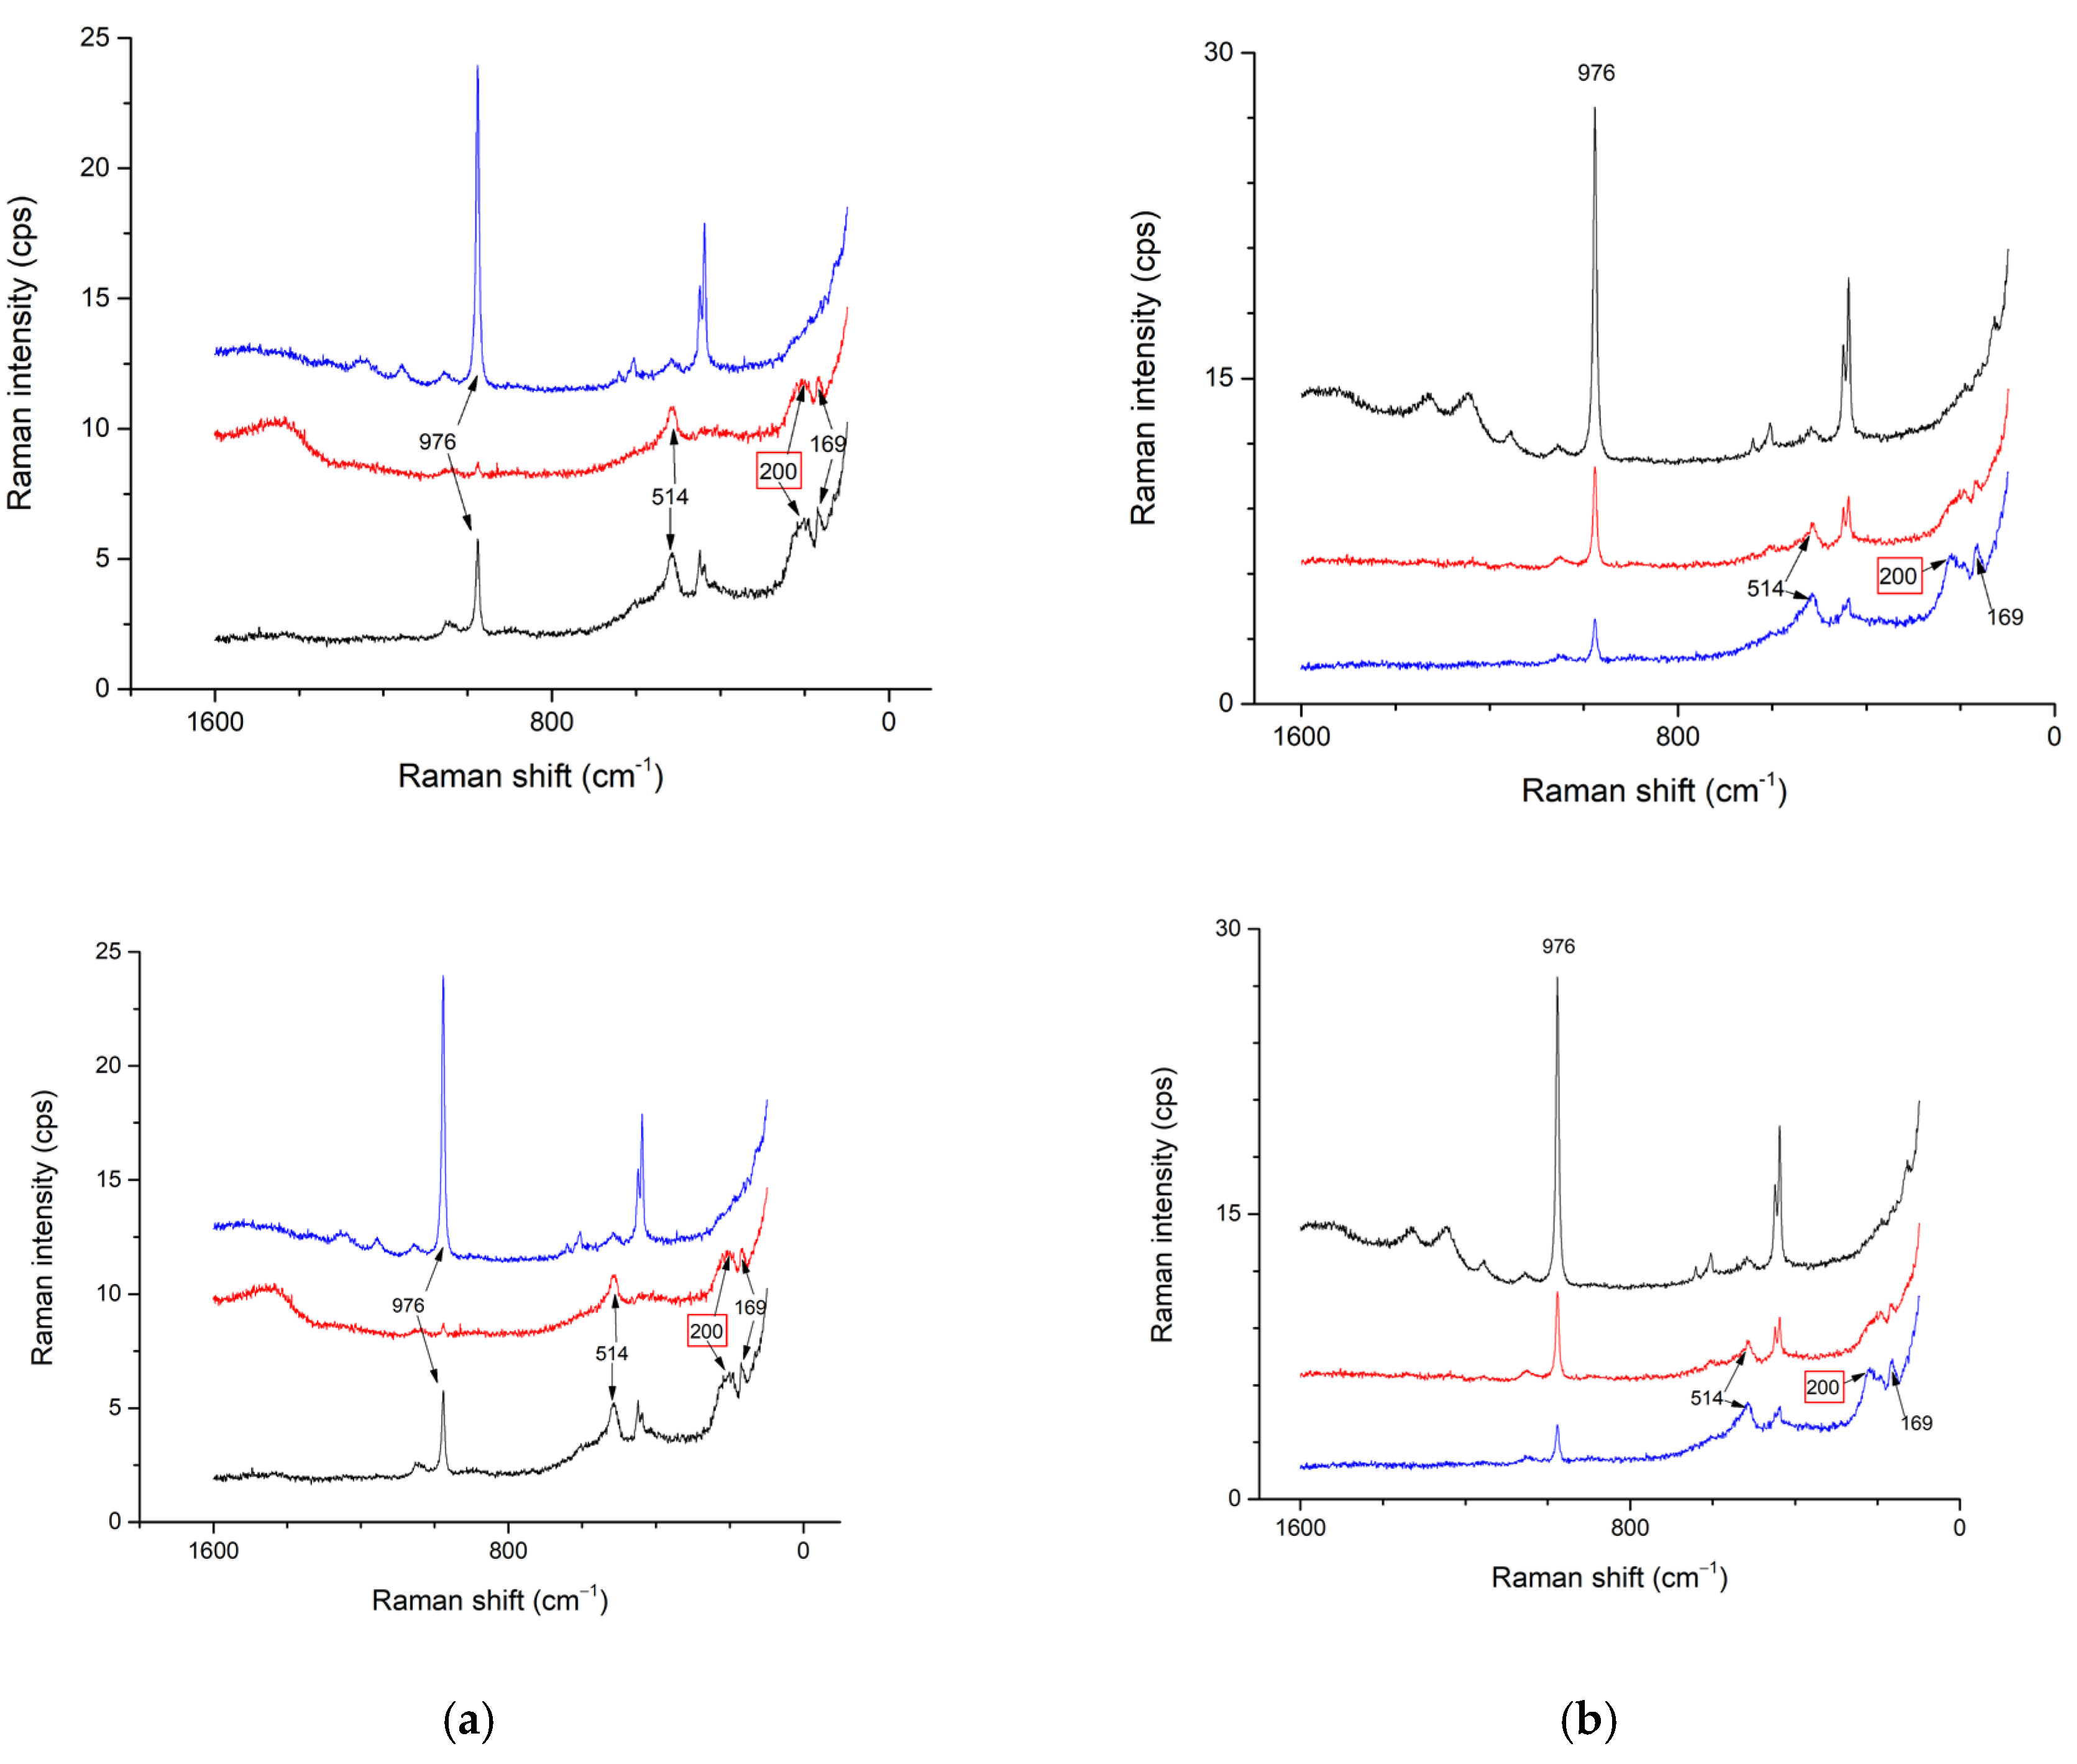
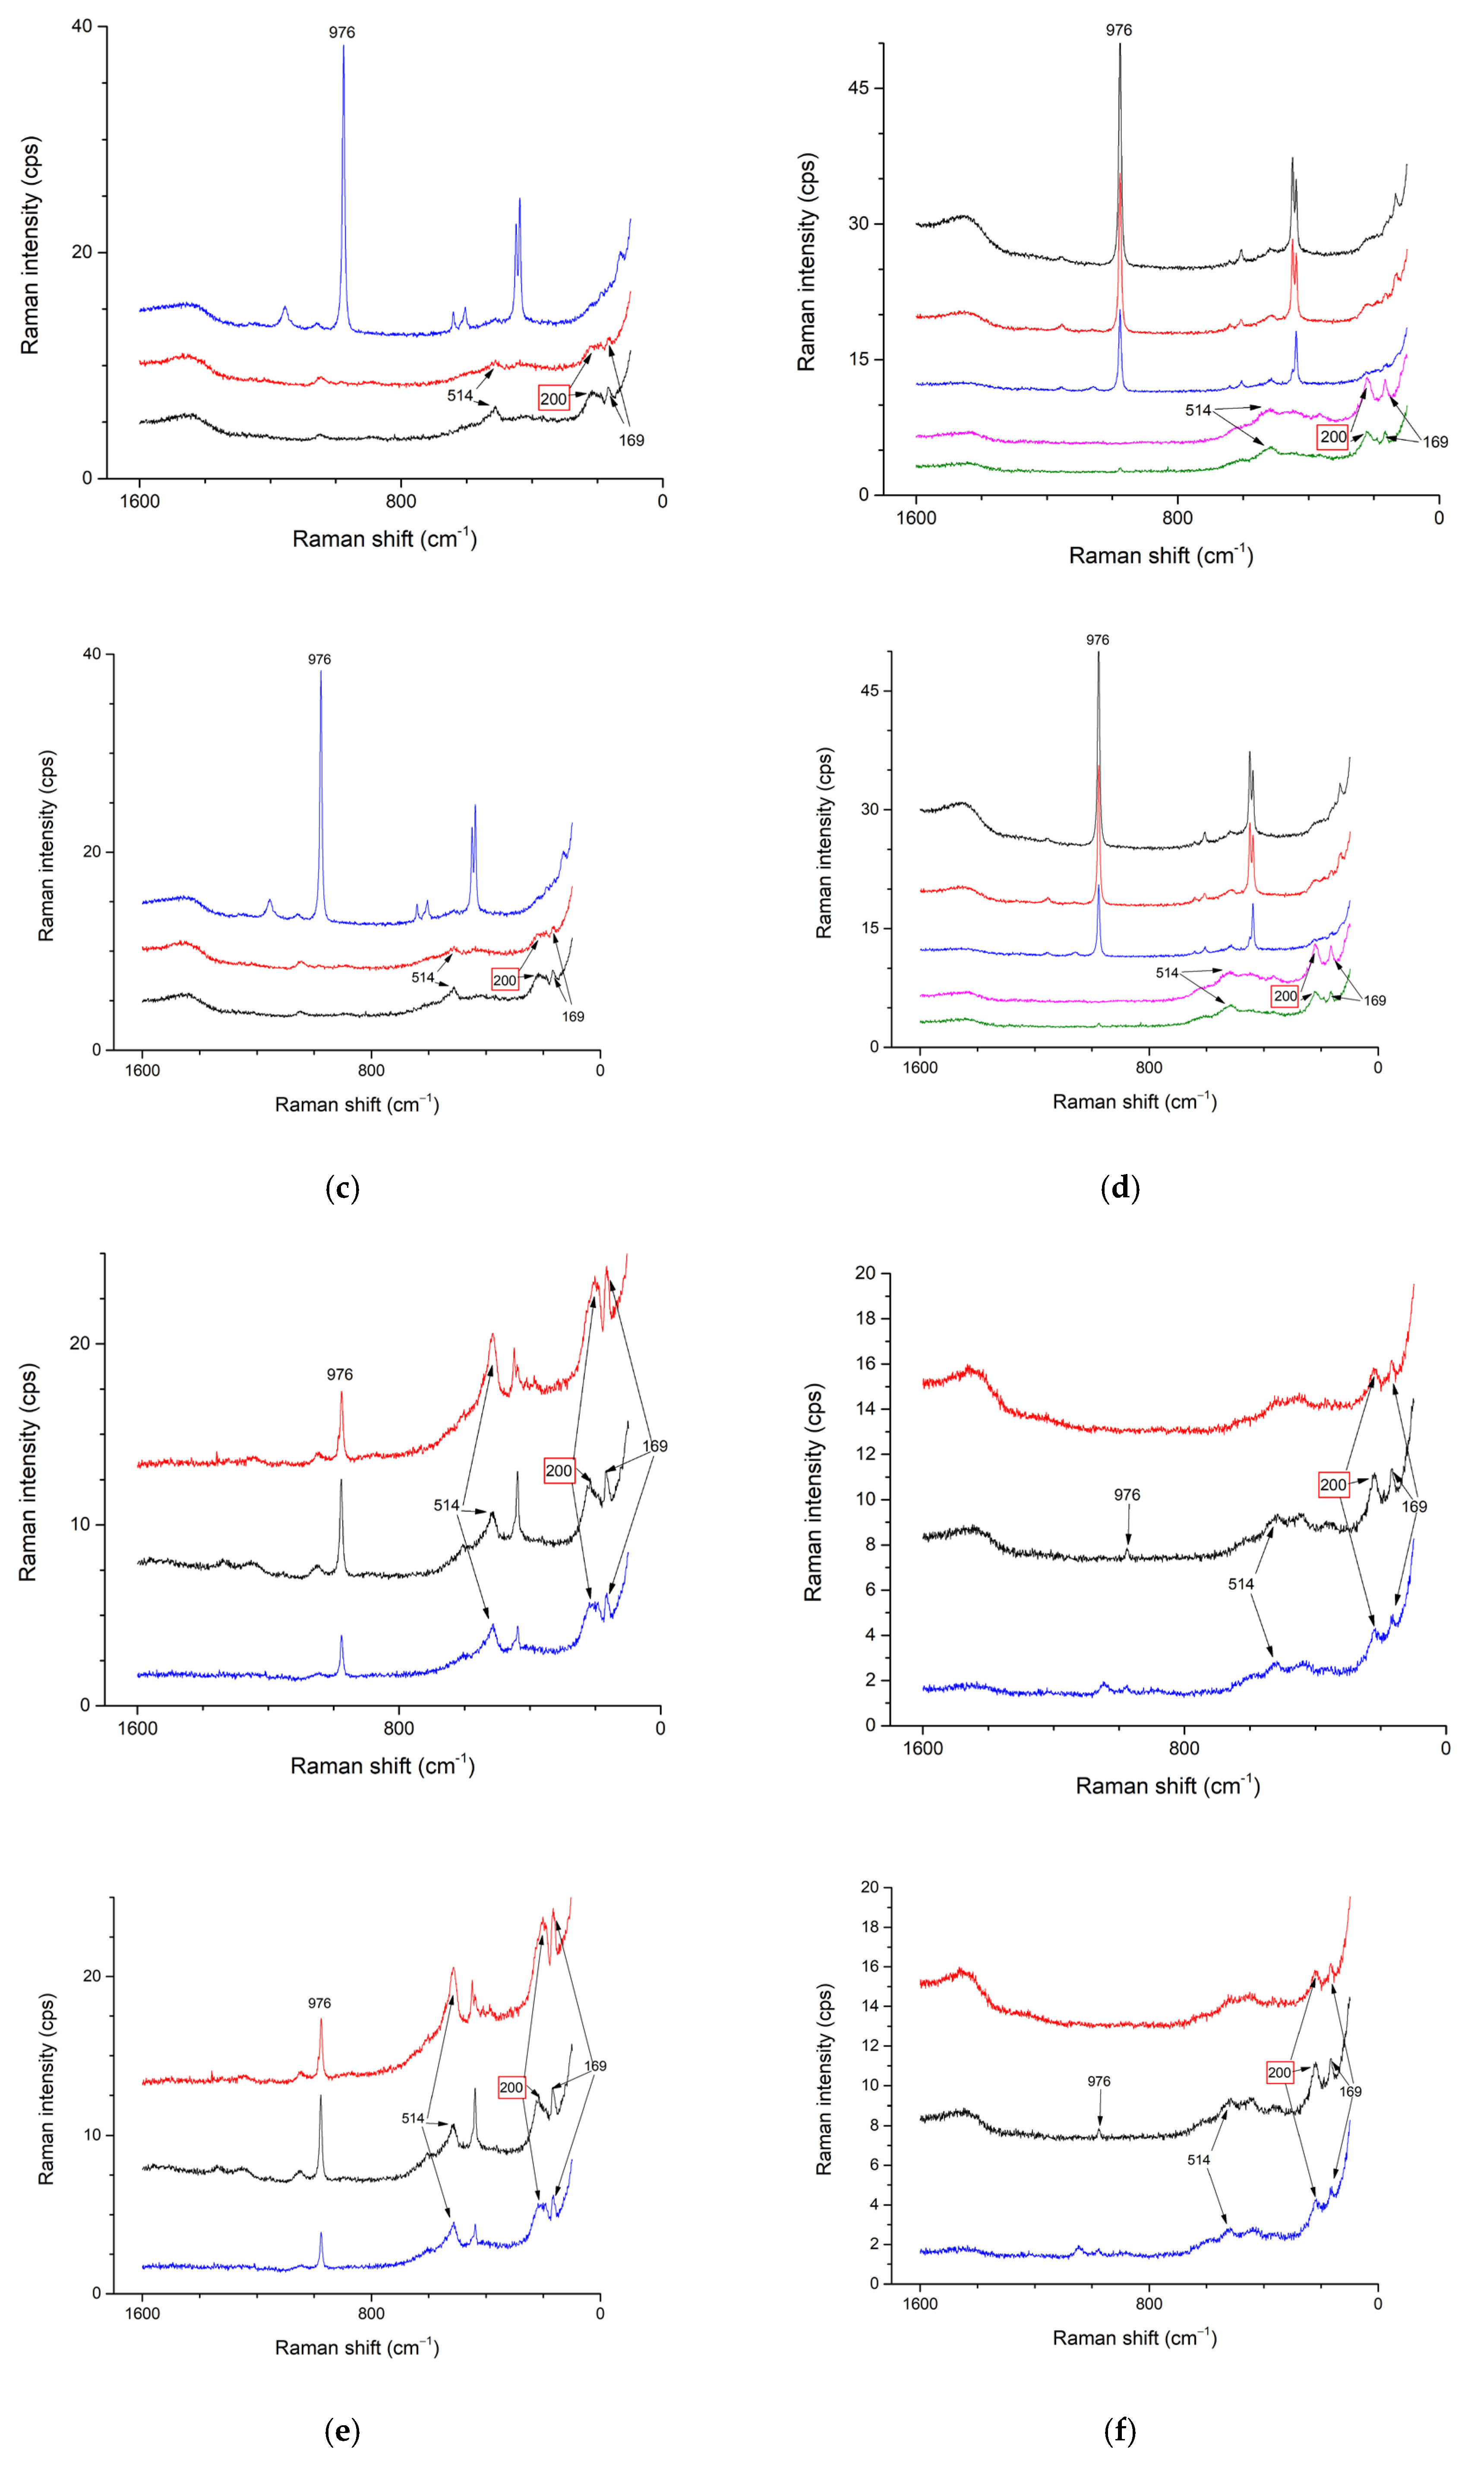
All spectra shown in
Figure 1 consisted mainly of PbSO
4, α- PbO
2 and β-PbO
2. These are normally occurring products of lead–acid battery operation and corrosion. Moreover, every specimen and all but one spectrum contained trace amounts of PbS, which is not typically found in LABs.
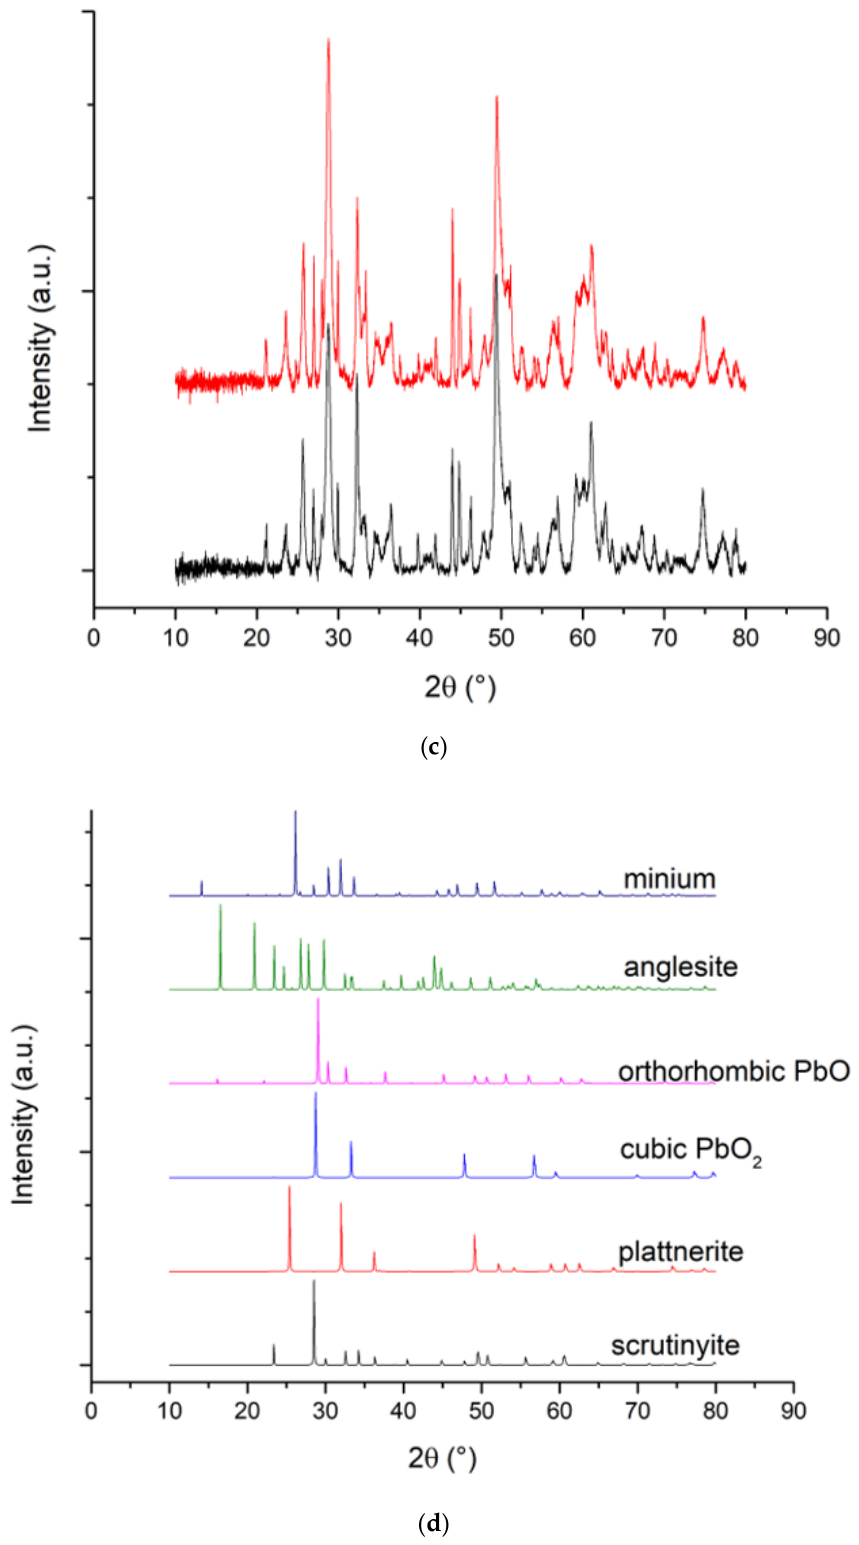
For diffraction patterns shown in
Figure 2, semi-quantitative phase analysis was conducted. The results are shown in
Table 1.
Every diffraction pattern showed the same lead compounds present in examined specimens: α- and β-PbO2, cubic PbO2, PbO, PbSO4 and Pb3O4. These are all possible and somewhat expected products of lead corrosion in a LAB environment. Absence of lead sulfide can be due to differences between Raman spectroscopy and XRD analysis principles—if PbS does not present sufficiently large crystalline structures, it will not be observed in XRD analysis, and Raman spectra show only trace amounts of this compound. Therefore, XPS analysis of the corrosion products is to be performed in a follow-up study to verify the tentative Raman assignment and to distinguish sulfide sulfur from oxidized surface sulfur species.
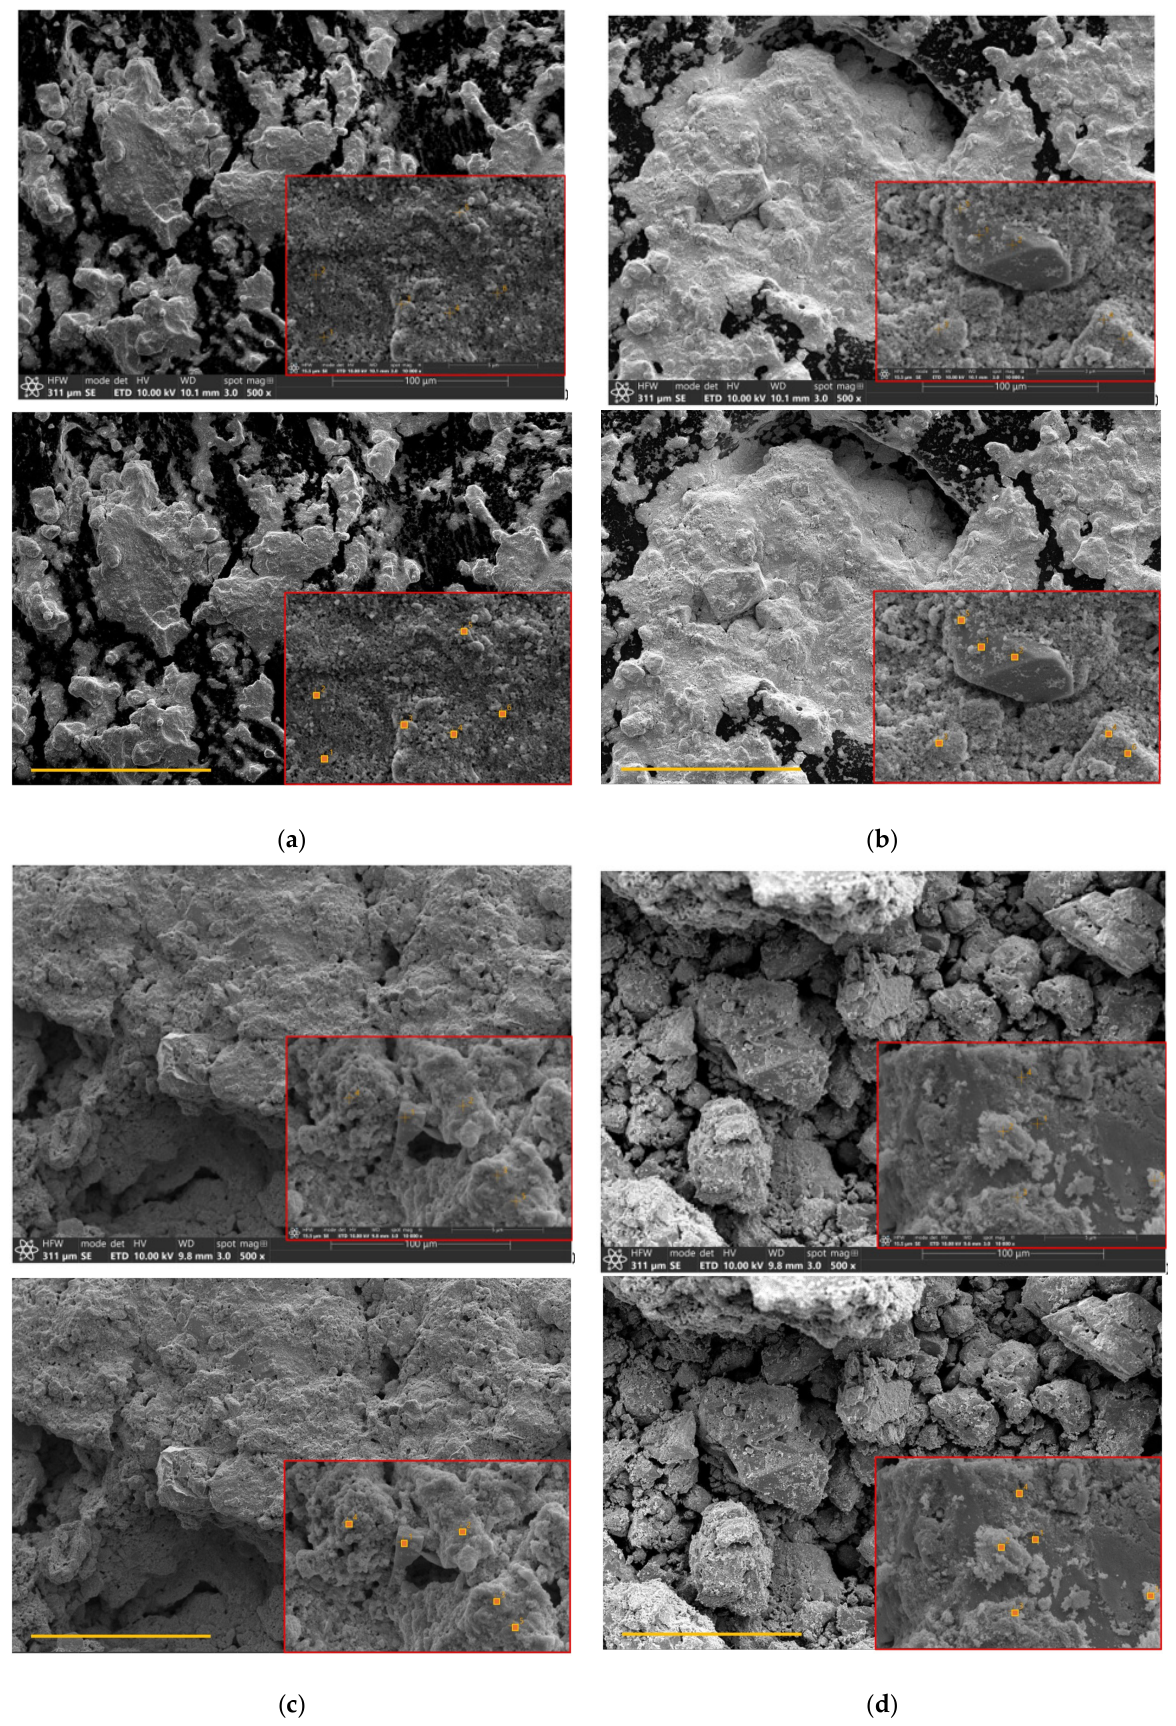
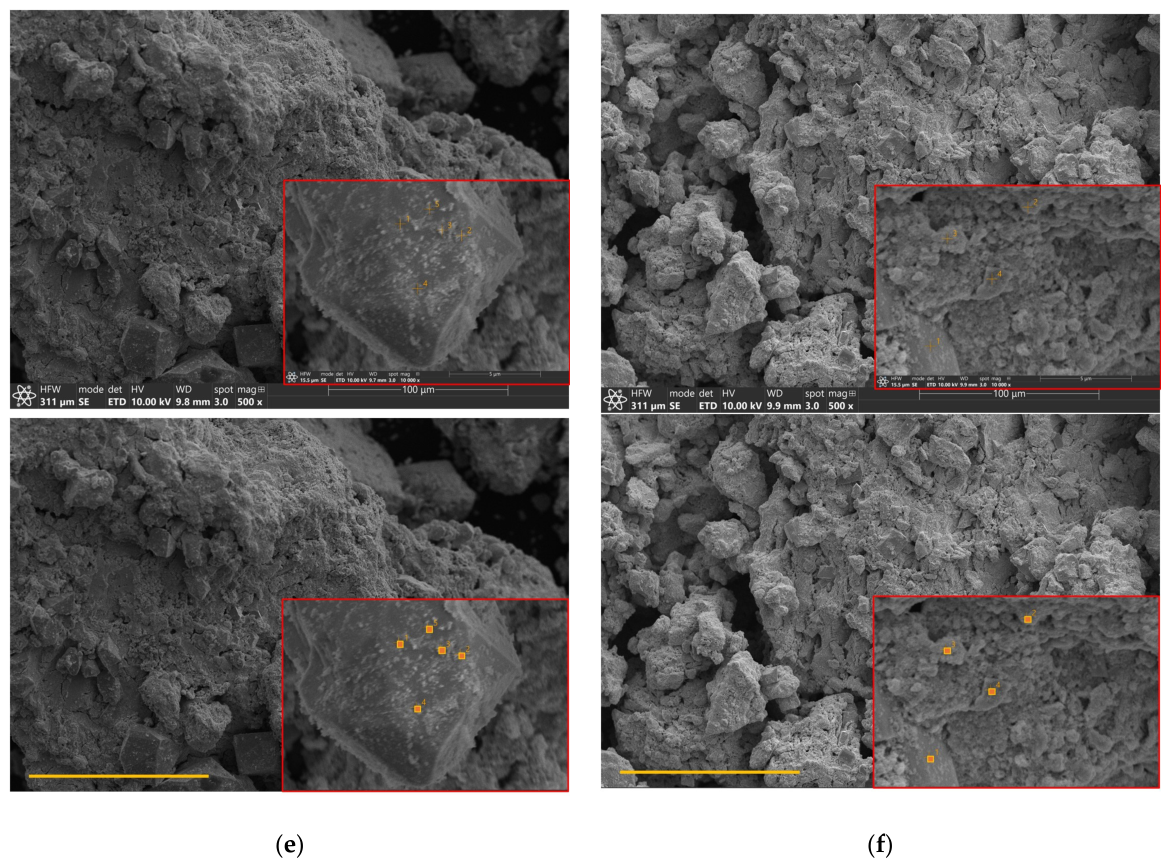
SEM images (
Figure 3) show different structures of specimens gathered from electrolyte and terminals. Specimens gathered from battery bridges exhibited a structure somewhat similar to those from electrolyte. All specimens have a rather loose structure, which may be due to rapid corrosion, as the dense corrosion product layer (usually observed on LABs) behaves as a passive layer, inhibiting further corrosion.
EDS measurements (
Table 2) showed amounts of lead, oxygen and sulfur like those from XRD and Raman analysis. In all samples, in most points there were carbon present, but due to lack of any carbon compounds found in any other technique, it was assumed that this result is from the use of carbon tape to provide electrical contact between the measured sample and the mounting plate.
The electrochemical measurements were performed on freshly cast and annealed model electrodes rather than on corroded components removed from the failed batteries. Consequently, the CV and EIS results are used only to establish the reference passivation behavior of the investigated Pb-based alloys in sulfuric acid and are not interpreted as a direct electrochemical characterization of the field corrosion products.
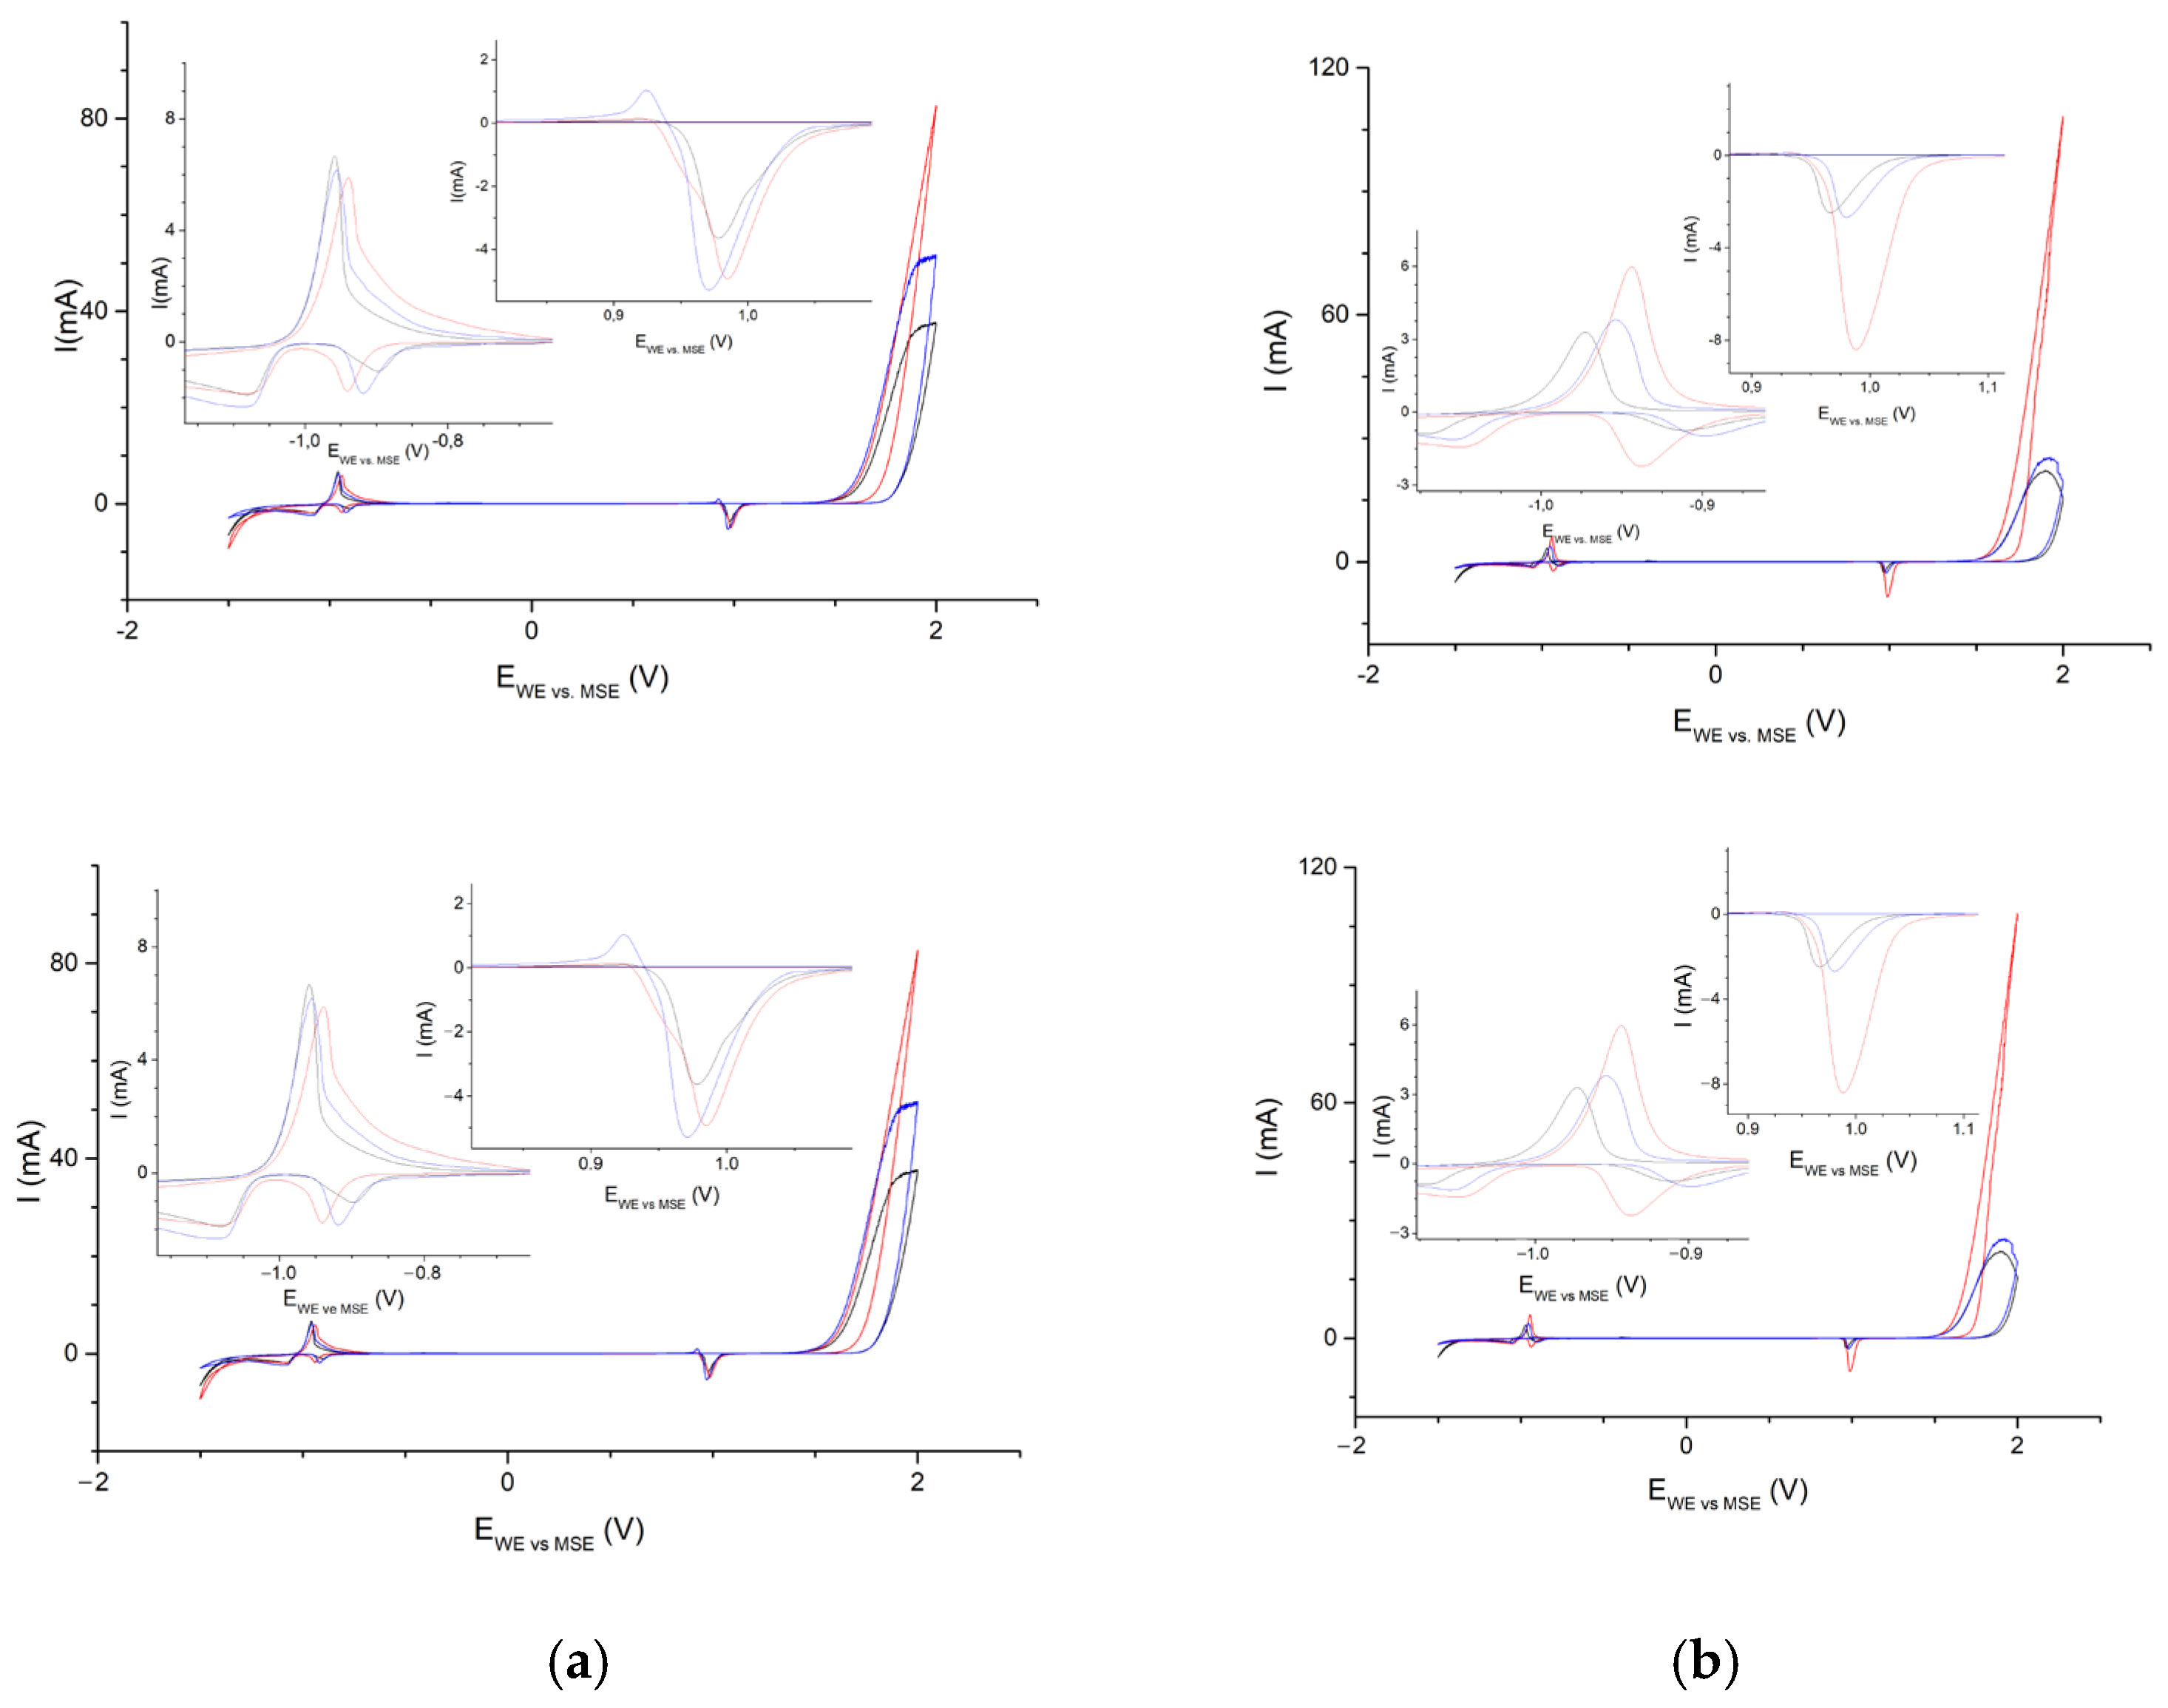
To understand these results, one should first overlook the general electrochemical features of lead and its battery-applied alloys (e.g., Pb-Sb and Pb-Sb-Se ones). The initial studies performed by means of cyclic voltammetry (
Figure 4) clearly reveal the presence of two redox pairs located around −1 V and between +1 V and +2 V (vs. MSE) which can be attributed to Pb
0 ↔ Pb
2+ and Pb
2+ ↔ Pb
4+ redox pairs respectively. A more detailed insight (see insets in the same figure) proves that both these processes are of a more complicated nature. While the low-voltage oxidation peak reveals only a significant asymmetry, its reduction counterpart, while remaining in the range of the potential shifts attributed to the reversibility of the process, clearly splits into two separate sub-processes attributed to reduction of PbO and PbSO
4 compounds, being present in parallel as the lead corrosion products in this potential range [
24]. Moreover, the recrystallization of the electrode material occurring upon annealing not only changes the relative heights of the respective peaks registered for all three materials investigated, but also proves that annealing enhances the differences in reaction kinetics originating from the composition of the alloys. Contrastively, the high-voltage redox pair is strongly irreversible, both in terms of the potential shift between oxidation and reduction, and in terms of the parallel-occurring reaction of gaseous oxygen evolution. The previously observed correlation between annealing of the studied materials and the development of differences between them is further supported by comparing the relative heights of their reduction peaks. Another interesting observation is related to the so-called excursion peak [
25]—an interesting phenomenon of the flow of the positive current in the reverse chronovoltammetric half-scan. As can be observed from the comparison of both high-voltage inserts in
Figure 4, it vanishes significantly upon the material annealing.
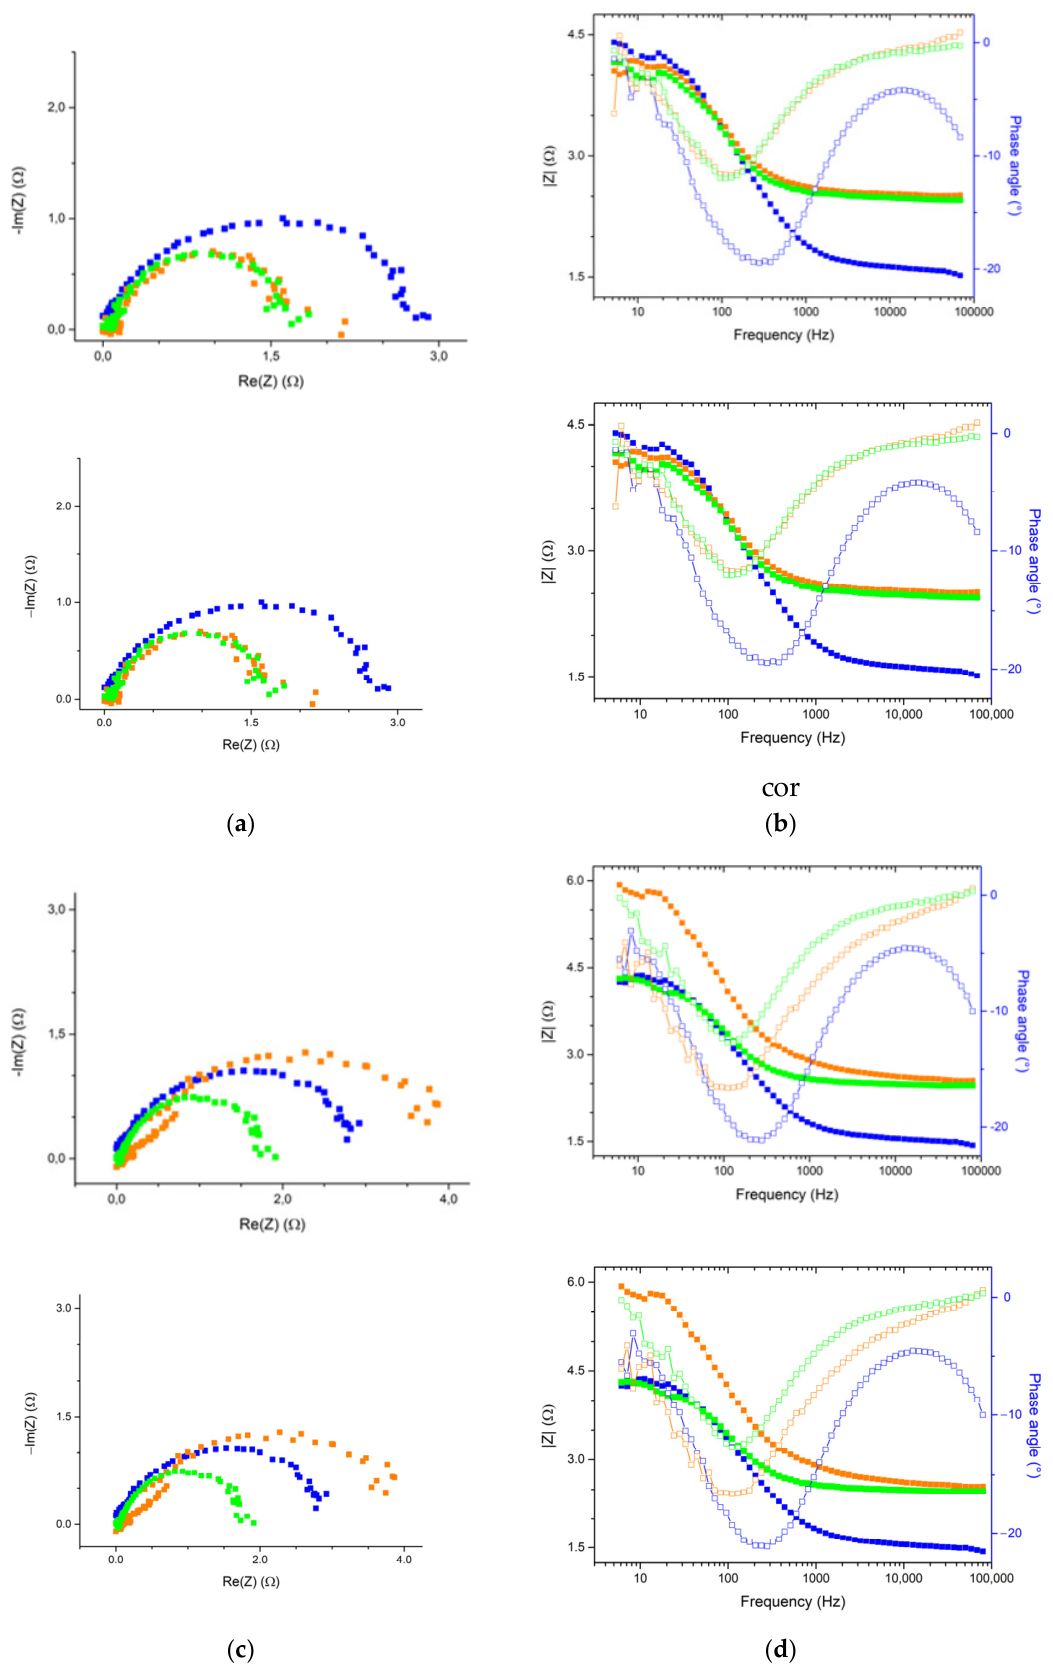
A complementary image of the same materials can be extracted from impedance spectroscopy experiments performed at potentials chosen on the basis of the CV scans discussed above. Spectra gathered at 1.7 V vs. MSE, thus at a potential high enough to promote not only formation of PbO
2 (active material of the fully charged positive plate of LAB), but also parallel oxygen evolution, characteristic of battery overcharging, not normal cycling. In this case (
Figure 5) the electrochemical resistivity of the system is low (in the range of 1.5 to 4 Ω, see
Table 3) and no passive layer is observed on the surface of the electrodes. Intensive corrosion leading to the formation of loose easily flaking deposits of lead (IV) dioxide can also be observed in this area.
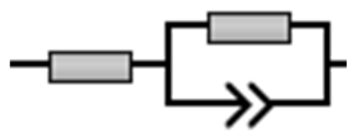
The equivalent circuit used for analysis of the EIS is shown in
Figure 6.
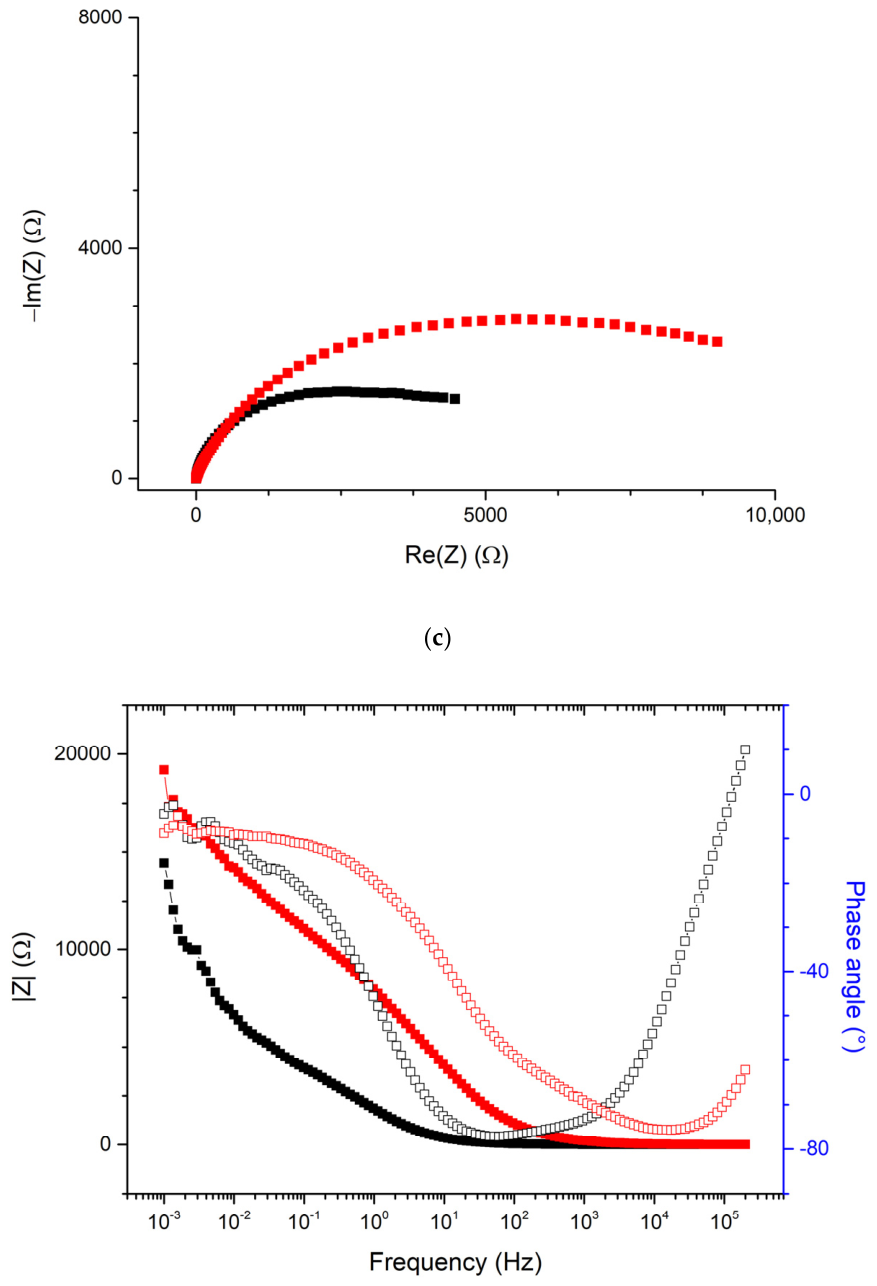
To confirm the corrosion-enhancing properties of S
2− ions, CV, LSV and EIS measurements in 5 M H
2SO
4 with and without presence of 0.01 M of Na
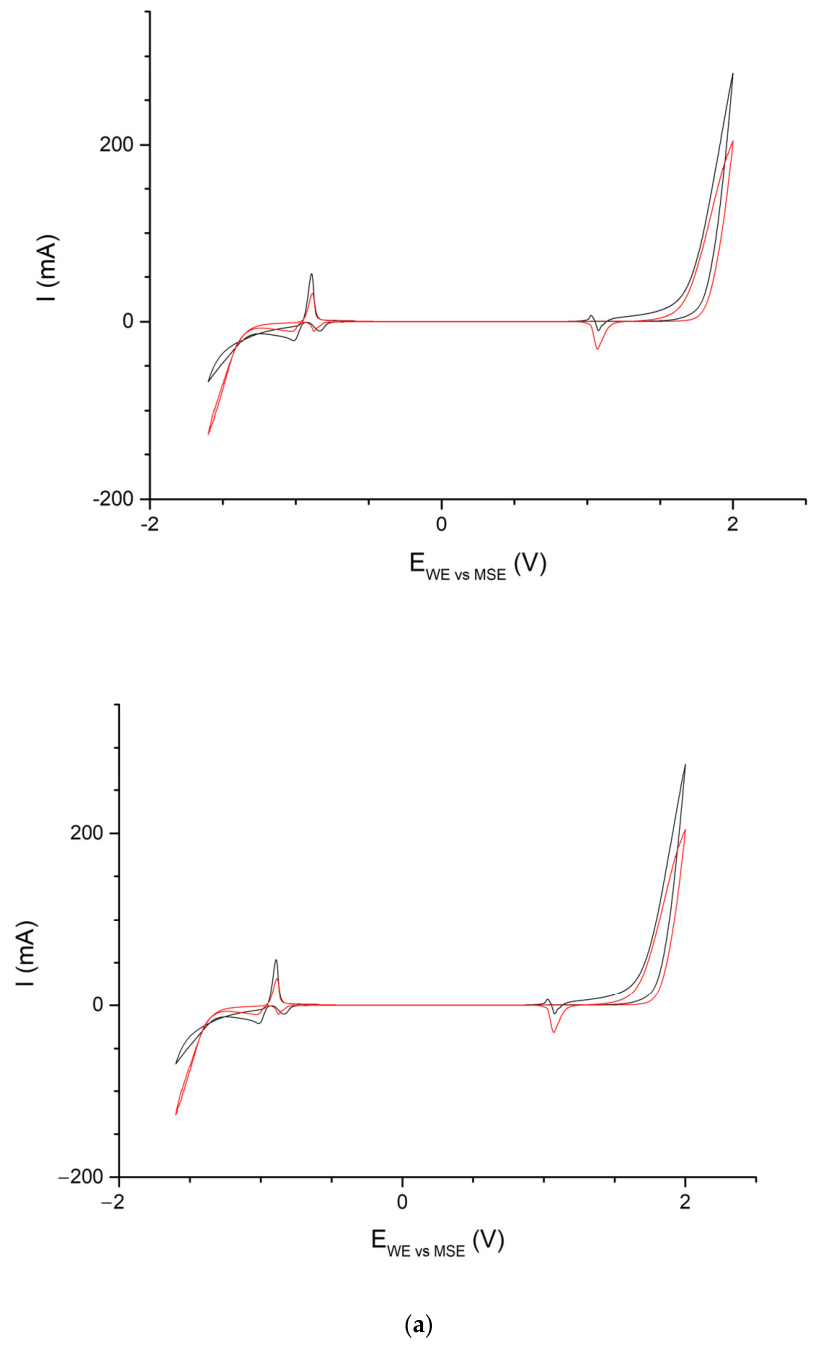
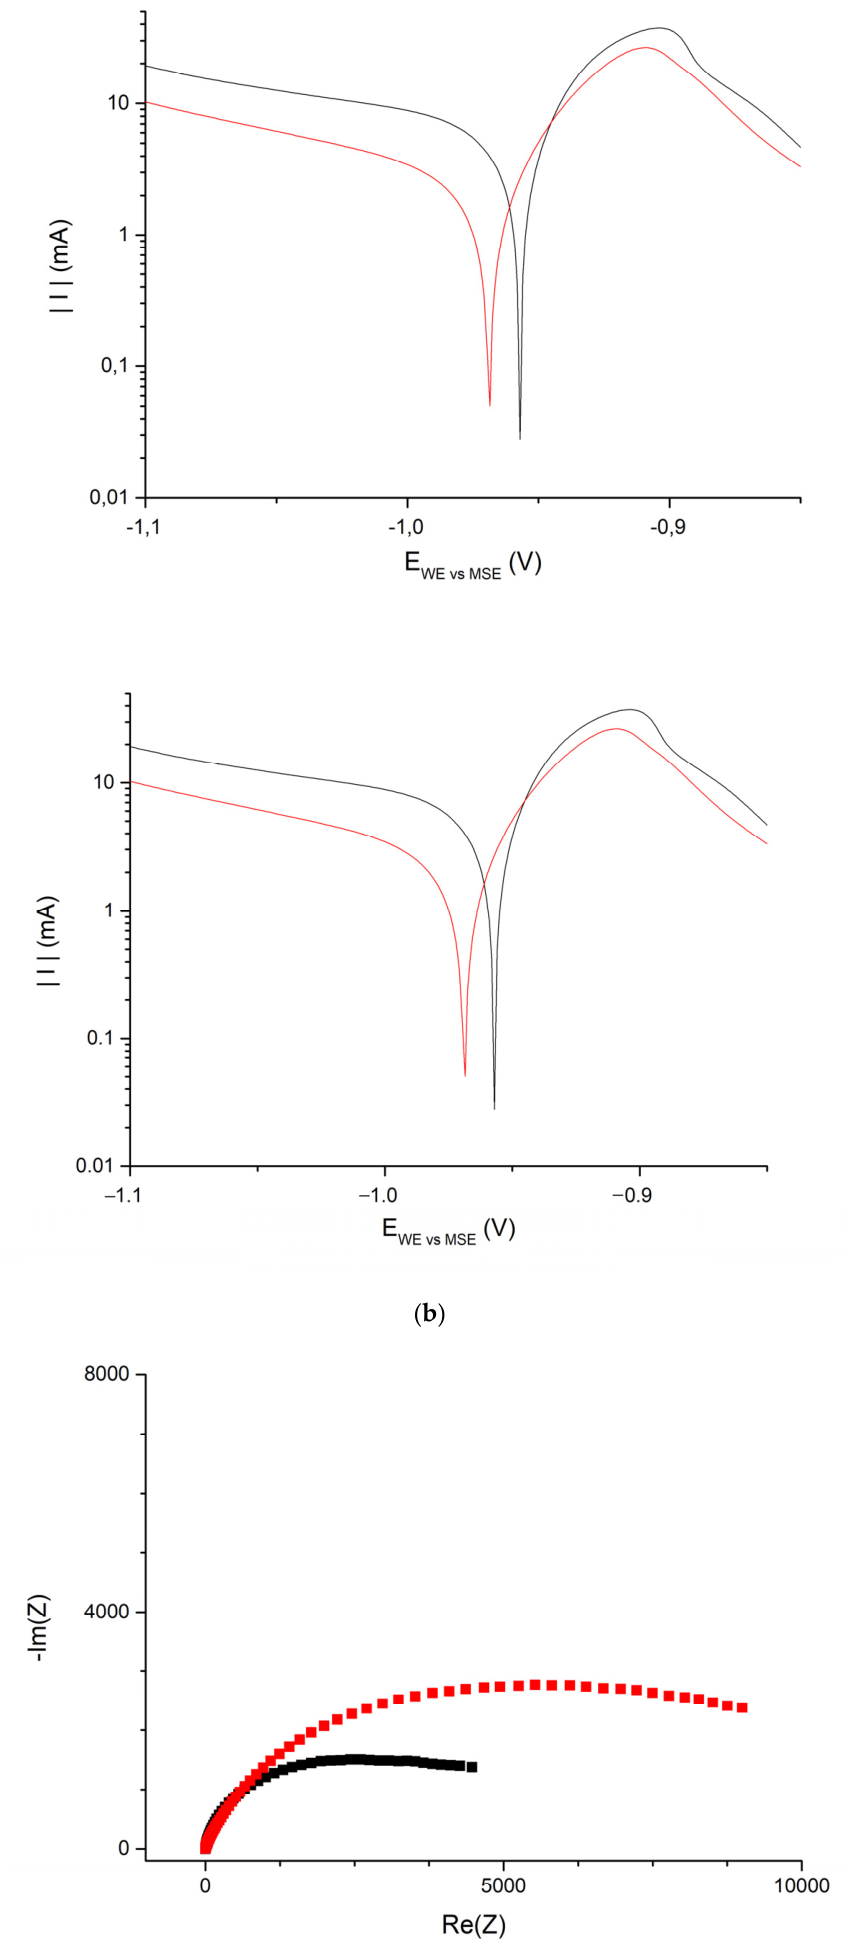
2S were conducted. The results are shown in
Figure 7, and
Table 4 and
Table 5.
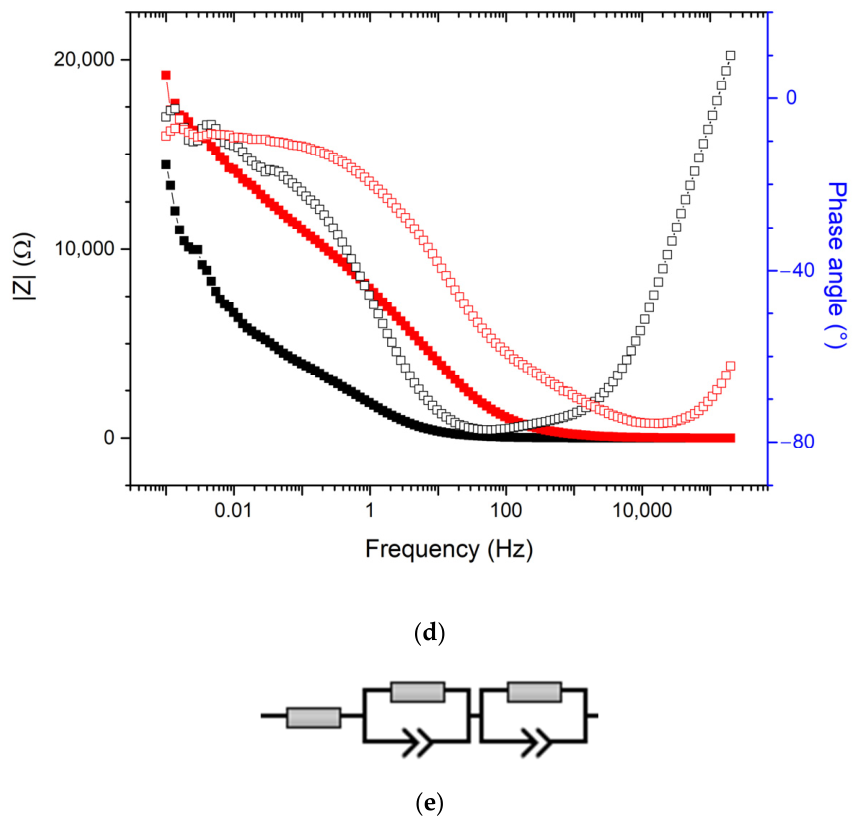
As one can see, the presence of S
2− ions caused higher current of Pb
0-to-Pb
2+ oxidation. This suggests that in the sulfide-containing solution, the lead was more prone to corrosion. Furthermore, a so-called Lead Excursion Peak can be observed for this solution. This oxidation peak occurring during the reverse scan is correlated to the high corrosion rate of the lead electrode [
25]. These conclusions are in line with values of corrosion current calculated from LSV, 3.50 mA for pure acid vs. 7.97 mA for a sulfide-contaminated one. While electrolyte and charge transfer resistances for both solutions are similar, the resistance of the passive layer is two times higher for pure acid. The lower Q parameter of CPE also indicates more uniform, and possibly tighter, layer formation in the solution.
5. Conclusions
The premature degradation investigated in this case study differed from ordinary lead–acid battery aging, as it was characterized by the formation of abundant loose corrosion products on the positive terminals and bridges within a short operational period. The same failure pattern appeared in batteries of different manufacturers and service histories, which supports the interpretation that a common local environmental factor was involved.
Raman spectroscopy indicated the presence of α-PbO2 (typically formed between passive layer and electrode) and β-PbO2, PbSO4, and trace PbS in the analyzed corrosion products. XRD confirmed the dominance of crystalline lead oxides, lead sulfate, and minium, while PbS was not resolved as a significant crystalline phase. This discrepancy is not contradictory: the Raman signal may originate from trace, poorly crystalline, nanocrystalline, or surface-localized PbS that remains below the XRD detection limit. Thus, further studies including XPS are to be conducted.
SEM observations showed loose, non-passivating corrosion products. Together with the electrochemical behavior of Pb, Pb-Sb, and Pb-Sb-Se electrodes in sulfuric acid, this supports the conclusion that the observed products are not consistent with a simple protective corrosion layer formed during normal service.
Therefore, the intensive local corrosion of the positive terminals and plate bridges and the formation of loose corrosion products cannot be attributed solely to normal aging during routine cycling. Overcharging represents one possible mechanism capable of producing strongly oxidizing conditions and loss of passivation. As the electrical system in which the batteries worked would fail in case of any significant overvoltage, and thus overcharging of the directly galvanically connected battery string (system is permanently powered by the rectifier delivered by the same set of connections, as well as the float charge for the batteries), this possibility was excluded. Moreover, while the available data exclude the occurrence of the thermal excursions, reasons such as acid mist, electrolyte contamination, internally generated or externally delivered H2S, and decomposition of the sulfur-containing battery components were considered as possible contributing factors. Still, the presence of trace PbS in the corrosion products indicates that sulfur-containing species participated in the degradation process and therefore provides a basis for considering a sulfide-associated corrosion pathway alongside conventional operational failure mechanisms. The localized nature of the destructive corrosion and the absence of evidence for conditions that would clearly promote substantial PbS formation within the batteries are consistent with, but do not prove, an external source of sulfur-containing species. Atmospheric H2S migrating into the batteries therefore remains one plausible explanation; however, no direct measurements of H2S in the building atmosphere or controlled exposure experiments were available to confirm this hypothesis.
Author Contributions
Conceptualization, M.S.S., J.K. and P.B.; methodology, M.S.S., J.K., P.M. and P.B.; validation, M.S.S. and P.B.; formal analysis, M.S.S., P.B., P.M. and J.K.; investigation, J.K., P.A.R., P.M., P.B., A.Z., G.Z.Ż., A.K.-M. and W.P. (Wojciech Pudełko); resources, M.S.S., P.B. and P.M.; writing—original draft preparation, M.S.S., J.K., P.A.R., P.B., P.M., A.K.-M. and G.Z.Ż.; writing—review and editing, J.K., A.Z., W.P. (Wojciech Pudełko), A.P. (Aleksander Pizoń), A.P. (Aleksander Piasecki) and W.P. (Wiktor Piekarski); visualization, W.P. (Wiktor Piekarski), A.P. (Aleksander Piasecki) and A.P. (Aleksander Pizoń); supervision, M.S.S., P.B. and P.M.; project administration, M.S.S. and P.B.; funding acquisition, M.S.S. and P.B. All authors have read and agreed to the published version of the manuscript.
Funding
This research was funded by Warsaw University of Technology statutory research funds.
Institutional Review Board Statement
Not applicable.
Informed Consent Statement
Not applicable.
Data Availability Statement
The raw data supporting the conclusions of this article will be made available by the authors on request.
Conflicts of Interest
Author Piotr Moszczyński was employed by the company Bater Sp. z o.o. The remaining authors declare that the research was conducted in the absence of any commercial or financial relationships that could be construed as potential conflicts of interest. The funders had no role in the design of the study; in the collection, analyses, or interpretation of data; in the writing of the manuscript; or in the decision to publish the results.
Abbreviations
The following abbreviations are used in this manuscript:
| CPE | Constant Phase Element |
| CV | Cyclic Voltammetry |
| EDS | Energy Dispersion Spectroscopy |
| EIS | Electrochemical Impedance Spectroscopy |
| ETD | Everhart–Thornley Detector |
| LAB | Lead–Acid Battery |
| LSV | Linear Sweep Voltammetry |
| MSE | Mercury–Mercurous Sulfate Electrode |
| OCV | Open-Circuit Voltage |
| SCADA | Supervisory Control And Data Acquisition |
| SE | Secondary Electron |
| SEM | Scanning Electron Microscopy |
| SoC | State of Charge |
| VRLA | Valve-Regulated Lead–Acid battery |
| XPS | X-Ray Photoelectron Spectroscopy |
| XRD | X-Ray Diffraction |
References
- Xiong, Y. Recycling of Lead Pastes from Spent Lead Acid Batteries: Thermodynamic Constraints for Desulphurization. Recycling 2022, 7, 45. [Google Scholar] [CrossRef] [Scilit]
- Liu, K.; Tan, Q.; Liu, L.; Li, J. From Lead Paste to High-Value Nanolead Sulfide Products: A New Application of Mechanochemistry in the Recycling of Spent Lead–Acid Batteries. ACS Sustain. Chem. Eng. 2020, 8, 3547–3552. [Google Scholar] [CrossRef] [Scilit]
- Morgos, J.; Hrudkay, K.; Simcak, M.; Skorvaga, J. Safety system for monitoring of the dangerous gases in electromobility laboratory. In Proceedings of the 2022 ELEKTRO (ELEKTRO), Krakow, Poland, 23–26 May 2022; pp. 1–5. [Google Scholar] [CrossRef] [Scilit]
- Pablo, P.; Henry, E.; Luis, N. Measurement and Remote Monitoring of Hydrogen Sulfide Gas Generated by Batteries Using IoT. In Proceedings of the 2021 IEEE CHILEAN Conference on Electrical, Electronics Engineering, Information and Communication Technologies (CHILECON), Valparaíso, Chile, 6–9 December 2021; pp. 1–6. [Google Scholar] [CrossRef] [Scilit]
- Robinson, R.S.; Tarascon, J.M.; O’Sullivan, T. Hydrogen sulfide and sulfur dioxide evolution from a valve-regulated lead-acid battery. In Proceedings of Intelec 93: 15th International Telecommunications Energy Conference; IEEE: Piscataway, NJ, USA, 1993; pp. 440–443. [Google Scholar] [CrossRef] [Scilit]
- Smart GasDetection Technologies. Atmospheric Hazards Associated with Lead Acid Battery Charging Stations. Available online: https://medem.co.uk/hydrogen-detection-for-battery-charging-areas/ (accessed on 10 July 2026).
- Vanasse, H.A. Hydrogen sulfide in VRLA cells. In Twenty-Third International Telecommunications Energy Conference. INTELEC 2001; IEEE: Piscataway, NJ, USA, 2001; pp. 245–251. [Google Scholar] [CrossRef] [Scilit]
- Jones, W.E.M. Quantifying secondary reactions in VRLA batteries. What purity standards and other factors are necessary to prevent negative plate discharge? In INTELEC. Twenty-Second International Telecommunications Energy Conference (Cat. No.00CH37131); IEEE: Piscataway, NJ, USA, 2000; pp. 447–452. [Google Scholar] [CrossRef] [Scilit]
- Coskun, I.; Tollefson, E.L. Oxidation of low concentrations of hydrogen sulfide over activated carbon. Can. J. Chem. Eng. 1980, 58, 72–76. [Google Scholar] [CrossRef] [Scilit]
- Hooper, D.G.; Shane, J.; Straus, D.C.; Kilburn, K.H.; Bolton, V.; Sutton, J.S.; Guilford, F.T. Isolation of Sulfur Reducing and Oxidizing Bacteria Found in Contaminated Drywall. Int. J. Mol. Sci. 2010, 11, 647–655. [Google Scholar] [CrossRef] [Scilit]
- Xu, Q.; Townsend, T.; Bitton, G. Inhibition of hydrogen sulfide generation from disposed gypsum drywall using chemical inhibitors. J. Hazard. Mater. 2011, 191, 204–211. [Google Scholar] [CrossRef] [Scilit]
- IEC 62877-2; Electrolyte and Water for Vented Lead Acid Accumulators–Part 2: Requirements for Water. International Electrotechnical Commission: Geneva, Switzerland, 2016. Available online: https://webstore.iec.ch/en/publication/24094 (accessed on 10 July 2026).
- PN-EN 62877-2; Elektrolit i Woda dla Otwartych Akumulatorów Kwasowo-Ołowiowych—Część 2: Wymagania Dotyczące Wody. Polski Komitet Normalizacyjny: Warsaw, Poland, 2016. Available online: https://sklep.pkn.pl/pn-en-62877-2-2016-08e.html (accessed on 10 July 2026).
- IEEE 450-2020; IEEE Recommended Practice for Maintenance, Testing, and Replacement of Vented Lead-Acid Batteries for Stationary Applications. IEEE: New York, NY, USA, 2020. Available online: https://standards.ieee.org/ieee/450/6772/ (accessed on 10 July 2026).
- EN 60896-11; Baterie Ołowiowe Stacjonarne—Część 11: Typy Otwarte—Ogólne Wymagania i Metody Badań. Polski Komitet Normalizacyjny: Warsaw, Poland, 2007. Available online: https://sklep.pkn.pl/pn-en-60896-11-2007p.html (accessed on 10 July 2026).
- Burgio, L.; Clark, R.J.H.; Firth, S. Raman spectroscopy as a means for the identification of plattnerite (PbO2), of lead pigments and of their degradation products. Analyst 2001, 126, 222–227. [Google Scholar] [CrossRef] [Scilit]
- Baranov, A.V.; Bogdanov, K.V.; Ushakova, E.V.; Cherevkov, S.A.; Fedorov, A.V.; Tscharntke, S. Comparative analysis of Raman spectra of PbS macro- and nanocrystals. Opt. Spectrosc. 2010, 109, 268–271. [Google Scholar] [CrossRef] [Scilit]
- Batonneau, Y.; Brémard, C.; Laureyns, J.; Merlin, J.C. Microscopic and imaging Raman scattering study of PbS and its photo-oxidation products. J. Raman Spectrosc. 2000, 31, 1113–1119. [Google Scholar] [CrossRef] [Scilit]
- Costantini, I.; Lottici, P.P.; Bersani, D.; Pontiroli, D.; Casoli, A.; Castro, K.; Madariaga, J.M. Darkening of lead- and iron-based pigments on late Gothic Italian wall paintings: Energy dispersive X-ray fluorescence, μ-Raman, and powder X-ray diffraction analyses for diagnosis: Presence of β-PbO2 (plattnerite) and α-PbO2 (scrutinyite). J. Raman Spectrosc. 2020, 51, 680–692. [Google Scholar] [CrossRef] [Scilit]
- Spedding, D.J. Some investigations into hydrogen sulphide adsorption by lead. Corros. Sci. 1976, 16, 903–908. [Google Scholar] [CrossRef]
- Švadlena, J.; Prošek, T.; Strachotová, K.C.; Kouřil, M. Chemical Removal of Lead Corrosion Products. Materials 2020, 13, 5672. [Google Scholar] [CrossRef] [Scilit]
- Shapter, J.; Brooker, M.; Skinner, W. Observation of the oxidation of galena using Raman spectroscopy. Int. J. Miner. Process. 2000, 60, 199–211. [Google Scholar] [CrossRef] [Scilit]
- Gražulis, S.; Chateigner, D.; Downs, R.T.; Yokochi, A.F.T.; Quirós, M.; Lutterotti, L.; Manakova, E.; Butkus, J.; Moeck, P.; Le Bail, A. Crystallography Open Database—An open-access collection of crystal structures. J. Appl. Crystallogr. 2009, 42, 726–729. [Google Scholar] [CrossRef] [Scilit]
- Kuhn, A.T. The Electrochemistry of Lead; Academic Press: New York, NY, USA, 1979; Available online: https://www.amazon.co.uk/Electrochemistry-Lead-T-Kuhn/dp/0124283500 (accessed on 10 July 2026).
- Lach, J.; Czerwiński, A. The Anodic Excursion Peak as a Rapid Way of Measuring the Corrosion of Lead Alloys. Int. J. Electrochem. Sci. 2016, 11, 9355–9368. [Google Scholar] [CrossRef] [Scilit]
- Boukamp, B.A. Guidance to solid state electrochemical impedance spectroscopy. Electrochim. Acta 2025, 537, 146892. [Google Scholar] [CrossRef] [Scilit]
Figure 1.
Raman spectra obtained for various places of specimens gathered from: (
a) first battery electrolyte; (
b) first battery bridge; (
c) first battery terminal; (
d) second battery terminal; (
e) third battery electrolyte; (
f) third battery bridge. Every spectrum exhibits peaks corresponding to α-PbO
2 (~169 cm
−1) and β-PbO
2 (~514 cm
−1), PbSO
4 (~976 cm
−1), and PbS (~200–190 cm
−1, framed red) [
16,
17,
18,
19,
20,
21,
22]. Red, blue, black, (for (
d) also pink and green) curves are various places within one specimen.
Figure 1.
Raman spectra obtained for various places of specimens gathered from: (
a) first battery electrolyte; (
b) first battery bridge; (
c) first battery terminal; (
d) second battery terminal; (
e) third battery electrolyte; (
f) third battery bridge. Every spectrum exhibits peaks corresponding to α-PbO
2 (~169 cm
−1) and β-PbO
2 (~514 cm
−1), PbSO
4 (~976 cm
−1), and PbS (~200–190 cm
−1, framed red) [
16,
17,
18,
19,
20,
21,
22]. Red, blue, black, (for (
d) also pink and green) curves are various places within one specimen.
Figure 2.
Diffraction patterns of specimens gathered from: (a) first battery (electrolyte, bridge, terminal), (b) second battery (electrolyte, terminal), (c) third battery (electrolyte, bridge); (d) diffraction patterns of pure lead compounds.
Figure 2.
Diffraction patterns of specimens gathered from: (a) first battery (electrolyte, bridge, terminal), (b) second battery (electrolyte, terminal), (c) third battery (electrolyte, bridge); (d) diffraction patterns of pure lead compounds.
Figure 3.
SEM micrographs (main plot—500×, inserts—10,000×, with EDS measurement points marked by orange squares; yellow bar—for main plots 100 µm, for inserts 5 µm) of specimens gathered from: (a) first battery electrolyte; (b) first battery bridge; (c) first battery terminal; (d) second battery electrolyte; (e) second battery terminal; (f) third battery bridge.
Figure 3.
SEM micrographs (main plot—500×, inserts—10,000×, with EDS measurement points marked by orange squares; yellow bar—for main plots 100 µm, for inserts 5 µm) of specimens gathered from: (a) first battery electrolyte; (b) first battery bridge; (c) first battery terminal; (d) second battery electrolyte; (e) second battery terminal; (f) third battery bridge.
Figure 4.
Voltammograms (20 mV/s, 3rd scan) of freshly cast (a) and recrystallized (b) electrodes in 4 M H2SO4. Red line—pure (99.99%) Pb, black line—Pb-Sb (4%), blue line—Pb-Sb (2%)-Se (0.025%).
Figure 4.
Voltammograms (20 mV/s, 3rd scan) of freshly cast (a) and recrystallized (b) electrodes in 4 M H2SO4. Red line—pure (99.99%) Pb, black line—Pb-Sb (4%), blue line—Pb-Sb (2%)-Se (0.025%).
Figure 5.
Impedance spectra of electrodes made with: pure Pb (orange dots), Pb-Sb (4%) (blue dots), Pb-Sb (2%)-Se (0.025%) (green dots). (a) Nyquist representation, freshly cast electrodes; (b) Bode representation, freshly cast electrodes; (c) Nyquist representation, annealed electrodes; (d) Bode representation, annealed electrodes. For plots (b,d): full squares—magnitude, open squares—phase angle. Nyquist plots presented here are normalized by subtraction of electrolyte resistance.
Figure 5.
Impedance spectra of electrodes made with: pure Pb (orange dots), Pb-Sb (4%) (blue dots), Pb-Sb (2%)-Se (0.025%) (green dots). (a) Nyquist representation, freshly cast electrodes; (b) Bode representation, freshly cast electrodes; (c) Nyquist representation, annealed electrodes; (d) Bode representation, annealed electrodes. For plots (b,d): full squares—magnitude, open squares—phase angle. Nyquist plots presented here are normalized by subtraction of electrolyte resistance.
Figure 6.
Equivalent circuit used in analysis of the data gathered at 1.7 V vs. MSE.
Figure 6.
Equivalent circuit used in analysis of the data gathered at 1.7 V vs. MSE.
Figure 7.
Red curves and squares mark measurements done in pure 5 M H
2SO
4, while black in 5 M H
2SO
4, 0.01 M Na
2S. (
a) CV voltammograms; (
b) LSV curves; (
c) EIS spectra–Nyquist representation; (
d) EIS spectra–Bode representation: full squares—magnitude, open squares—phase angle; (
e) equivalent circuit used for EIS analysis. The wide low-frequency part of the spectra is correlated with dispersion of CPE parameters in the electrode [
26].
Figure 7.
Red curves and squares mark measurements done in pure 5 M H
2SO
4, while black in 5 M H
2SO
4, 0.01 M Na
2S. (
a) CV voltammograms; (
b) LSV curves; (
c) EIS spectra–Nyquist representation; (
d) EIS spectra–Bode representation: full squares—magnitude, open squares—phase angle; (
e) equivalent circuit used for EIS analysis. The wide low-frequency part of the spectra is correlated with dispersion of CPE parameters in the electrode [
26].
Table 1.
Semi-quantitative phase analysis of specimens gathered from various parts of the batteries (E—specimen gathered from electrolyte, B—specimen gathered from bridge, T—specimen gathered from terminal).
Table 1.
Semi-quantitative phase analysis of specimens gathered from various parts of the batteries (E—specimen gathered from electrolyte, B—specimen gathered from bridge, T—specimen gathered from terminal).
| Crystalline Phase (According to [23]) | Space Group Number | Unit Cell Parameters, Ǻ | Phase Contents, % |
|---|
First
Battery | Second Battery | Third
Battery |
|---|
| E | B | T | E | T | E | B |
|---|
α-PbO2, scrutinyite (orthorhombic)
(COD9009091) | 60 | a = 4.947
b = 5.951
c = 5.497 | 8.0 | 10.1 | 11.3 | 10.0 | 6.4 | 24.7 | 21.4 |
| β-PbO2, plattnerite (tetragonal) (COD9007543) | 136 | a = 4.957
c = 3.387 | 51.2 | 54.2 | 52.0 | 6.2 | 27.4 | 16.9 | 13.6 |
| PbO2 (cubic) (COD1010382) | 201 | a = 5.380 | 3.8 | 4.7 | 5.4 | 5.4 | 3.5 | 14.1 | 16.2 |
| PbO, (orthorhombic) (COD9008960) | 57 | a = 5.891
b = 4.775
c = 5.589 | 3.4 | 5.5 | 6.6 | 8.0 | 2.0 | 13.1 | 14.9 |
| PbSO4, anglesite (orthorhombic) (COD1010950) | 62 | a = 8.450
b = 5.380
c = 6.930 | 26.3 | 18.4 | 17.3 | 61.8 | 56.6 | 26.9 | 23.6 |
| Pb3O4, minium (tetragonal) (COD9012287) | 117 | a = 8.860
c = 6.660 | 7.3 | 7.1 | 7.4 | 8.5 | 4.1 | 4.4 | 5.9 |
Table 2.
EDS analysis of specimens gathered from: (a) first battery electrolyte; (b) first battery bridge; (c) first battery terminal; (d) second battery electrolyte; (e) second battery terminal; (f) third battery bridge.
Table 2.
EDS analysis of specimens gathered from: (a) first battery electrolyte; (b) first battery bridge; (c) first battery terminal; (d) second battery electrolyte; (e) second battery terminal; (f) third battery bridge.
| Sample (Point) | Atomic % (Atomic % Error) |
|---|
| C | O | S | Pb |
|---|
| a (1) | 7.4 (0.4) | 66.0 (1.0) | 6.9 (0.1) | 19.7 (0.4) |
| a (2) | 5.2 (0.4) | 63.4 (1.0) | 15.5 (0.1) | 15.8 (0.4) |
| a (3) | 9.8 (0.4) | 63.7 (1.2) | 0.9 (0.0) | 25.6 (0.4) |
| a (4) | 8.8 (0.4) | 62.7 (1.2) | 3.5 (0.1) | 25.0 (0.5) |
| a (5) | 8.3 (0.4) | 66.3 (1.1) | 4.3 (0.1) | 21.1 (0.4) |
| a (6) | 7.3 (0.4) | 55.1 (1.3) | 0.4 (0.0) | 37.2 (0.4) |
| b (1) | 5.0 (0.4) | 62.8 (0.9) | 16.8 (0.0) | 15.5 (0.4) |
| b (2) | 5.4 (0.4) | 62.1 (0.9) | 17.2 (0.1) | 15.3 (0.4) |
| b (3) | 10.6 (0.4) | 62.0 (1.1) | 3.2 (0.1) | 24.2 (0.4) |
| b (4) | 10.7 (0.4) | 56.8 (1.1) | 7.3 (0.1) | 25.3 (0.5) |
| b (5) | 10.8 (0.4) | 62.7 (1.1) | 5.1 (0.1) | 21.3 (0.4) |
| b (6) | 7.8 (0.5) | 51.8 (1.3) | 6.6 (0.0) | 33.9 (0.6) |
| c (1) | 3.0 (0.3) | 47.5 (1.1) | 21.4 (0.0) | 28.0 (0.7) |
| c (2) | 10.7 (0.4) | 61.9 (1.2) | 4.3 (0.1) | 23.1 (0.4) |
| c (3) | 6.6 (0.5) | 60.8 (1.1) | 15.0 (0.1) | 17.6 (0.4) |
| c (4) | 9.6 (0.5) | 58.7 (1.3) | 2.4 (0.1) | 29.2 (0.5) |
| c (5) | 5.5 (0.4) | 70.0 (0.9) | 11.3 (0.1) | 13.2 (0.3) |
| d (1) | 4.2 (0.3) | 64.1 (1.0) | 12.5 (0.1) | 19.2 (0.3) |
| d (2) | 10.1 (0.5) | 58.3 (1.3) | 1.9 (0.1) | 29.8 (0.6) |
| d (3) | 10.8 (0.4) | 62.8 (1.2) | 2.1 (0.1) | 24.3 (0.5) |
| d (4) | 11.2 (0.5) | 54.2 (1.5) | 0.0 (0.0) | 34.6 (0.5) |
| d (5) | 11.6 (0.4) | 64.1 (1.2) | 2.0 (0.1) | 22.3 (0.4) |
| e (1) | - | 61.0 (1.2) | 20.0 (0.0) | 19.0 (0.5) |
| e (2) | 9.1 (0.3) * | 57.6 (1.1) | 15.4 (1.1) | 18.0 (0.5) |
| e (3) | 9.2 (0.5) | 64.0 (1.3) | 4.6 (0.1) | 22.2 (0.5) |
| e (4) | 7.4 (0.5) | 56.6 (1.1) | 18.1 (0.1) | 17.9 (0.5) |
| e (5) | 5.3 (0.5) | 53.7 (1.2) | 22.2 (0.0) | 18.7 (0.5) |
| f (1) | 5.4 (0.5) | 60.1 (1.1) | 19.2 (0.1) | 15.3 (0.5) |
| f (2) | 10.5 (1.0) | 55.7 (2.9) | 11.3 (0.1) | 22.6 (1.3) |
| f (3) | 9.3 (0.5) | 59.8 (1.3) | 0.0 (0.0) | 30.8 (0.4) |
| f (4) | 2.7 (0.6) | 22.0 (1.6) | 21.7 (0.1) | 53.6 (1.2) |
Table 3.
EIS analysis values.
Table 3.
EIS analysis values.
| | Value (Relative Error) |
|---|
| | Rel (Ω) | Rct (Ω) | Qct (mF·sα −1) | αct |
|---|
| Fresh Pb | 2.52 (0.42%) | 1.70 (2.0%) | 2.57 (12%) | 0.85 (2.2%) |
| Fresh Pb-Sb | 1.57 (0.67%) | 2.90 (1.6%) | 2.10 (9.0%) | 0.76 (1.6%) |
| Fresh Pb-Sb-Se | 2.48 (0.20%) | 1.63 (1.0%) | 2.17 (6.0%) | 0.89 (1.0%) |
| Annealed Pb | 2.56 (0.61%) | 4.13 (2.5%) | 4.09 (10%) | 0.70 (2.1%) |
| Annealed Pb-Sb | 1.50 (0.77%) | 3.04 (1.9%) | 2.20 (10%) | 0.76 (1.8%) |
| Annealed Pb-Sb-Se | 2.49 (0.17%) | 1.79 (0.82%) | 2.21 (4.9%) | 0.87 (0.84%) |
Table 4.
Stern fit parameters.
Table 4.
Stern fit parameters.
| | Ecorr (mV vs. MSE) | Icorr (mA) | βa (mV) | βc (mV) |
|---|
| Pure acid | −969 | 3.50 | 57 | 292 |
| Acid with sulfides | −957 | 7.97 | 54 | 500 |
Table 5.
EIS analysis results.
Table 5.
EIS analysis results.
| | Value (Relative Error) |
|---|
| Rel (Ω) | Rct (kΩ) | Qct (µF·sα −1) | αct | Rpass (kΩ) | Qpass (µF·sα −1) | αpass |
|---|
| Pure acid | 0.289 (22%) | 2.14 (29%) | 5.06
(4.1%) | 0.831 (3.2%) | 7.43
(11%) | 13.9
(6.5%) | 0.812 (6.6%) |
| Acid with sulfides | 0.457 (1.7%) | 2.05 (2.6%) | 88.8 (0.63%) | 0.900 (0.38%) | 3.52
(1.5%) | 433
(3.9%) | 0.788 (0.43%) |
| Disclaimer/Publisher’s Note: The statements, opinions and data contained in all publications are solely those of the individual author(s) and contributor(s) and not of MDPI and/or the editor(s). MDPI and/or the editor(s) disclaim responsibility for any injury to people or property resulting from any ideas, methods, instructions or products referred to in the content. |




 ,
,