Article

Morphometric Characterization of Northeastern Donkeys from the Brazilian Semi-Arid Region: A First Step Toward Conservation

by
Antônia Géssica Beatriz de Araújo Noronha
1,
Chiara Albano de Araújo Oliveira
2,
Robson Mateus Freitas Silveira
3,*,
Daniel Caetano Sales
1,
Natanael Silva Félix
1,
Amanda Victória Amaral Moreira
1,
Flávia Beatriz Carvalho Cordeiro
1,
Camilly Louise Ramos de Jesus
1,
Arthur Fernandes Bettencourt
4 and
Débora Andréa Evangelista Façanha
5
1
Universidade Federal Rural do Semi-Árido, Mossoró 59625-900, Rio Grande do Norte, Brazil
2
Universidade Federal da Bahia, Salvador 40110-909, Bahia, Brazil
3
Universidade de São Paulo, Piracicaba 13418-900, São Paulo, Brazil
4
Universidade Federal de Santa Maria, Santa Maria 97105-900, Rio Grande do Sul, Brazil
5
Universidade da Integração Internacional da Lusofonia Afro-Brasileira, Redenção 62790-000, Ceará, Brazil
*
Author to whom correspondence should be addressed.
Appl. Sci. 2026, 16(18), 9089; https://doi.org/10.3390/app16189089 (registering DOI)
Submission received: 27 June 2026 / Revised: 10 September 2026 / Accepted: 11 September 2026 / Published: 13 September 2026
(This article belongs to the Special Issue Breeding, Genetics, and Genomics of Livestock Species)

Abstract

The Northeastern Donkey represents an important animal genetic resource adapted to the semi-arid conditions of Brazil, being recognized for its hardiness and ability to survive under challenging environmental conditions. However, the progressive reduction in the use of these animals in productive activities has contributed to population decline and increased concerns regarding the loss of genetic diversity. In this context, the present study aimed to characterize the morphometric variability of a Northeastern Donkey population from the Brazilian semi-arid region. A total of 51 adult donkeys were evaluated using linear and circumference measurements obtained with a measuring tape and a hippometer. Data were analyzed using principal component analysis (PCA), hierarchical and non-hierarchical cluster analyses (k-means), analysis of variance, and canonical discriminant analysis. A descriptive three-component PCA solution summarized body circumference and overall body size, limb robustness, and animal stature and linear body dimensions, explaining 74.49% of the total variance; however, parallel analysis supported only two components, so the three-axis interpretation remains exploratory. Cluster analysis identified three morphostructural profiles corresponding to small-, intermediate-, and large-sized animals. Classification consistency was subsequently assessed using canonical discriminant analysis, which achieved 98.0% apparent classification accuracy and 88.2% accuracy under leave-one-out cross-validation. The small and large profiles occurred exclusively in Santa Quitéria and Aquiraz, respectively, indicating potential facility-related influences. The results demonstrate phenotypic variability within the evaluated sample and contribute to a better understanding of the morphological diversity of the Northeastern Donkey. Furthermore, the identification of distinct morphostructural profiles provides valuable information for conservation initiatives, population characterization, and the sustainable management of this threatened local genetic resource.

1. Introduction

The donkey (Equus asinus) is one of the oldest animal species domesticated by humans and has played an important role in human societies for more than 5000 years [1,2,3]. The global donkey population is estimated at approximately 46 million animals, with around 6.7 million distributed throughout the Americas. Brazil hosts one of the largest donkey populations in South America, with most animals concentrated in the Northeastern region [4,5,6]. It is estimated that nearly 90% of the Brazilian donkey population is located in the Northeast, although these numbers may be underestimated because free-ranging animals are not included in official livestock surveys [4,7]. In addition to their contribution to rural livelihoods, donkeys have played a prominent historical and cultural role in northeastern Brazil, where they traditionally transported water, food, and construction materials and became recurrently represented in regional literature, music, and visual arts [8].
Donkeys possess several characteristics that make them particularly valuable in semi-arid environments, including strength, hardiness, and tolerance to high temperatures and limited feed availability. In addition, they exhibit physiological and health characteristics that differ from those of horses, allowing them to thrive under challenging environmental conditions [7]. The Northeastern donkey ecotype is generally characterized by small body size, high rusticity, and remarkable adaptation to the environmental conditions of the Caatinga biome, where it is widely distributed throughout the semi-arid region [9,10]. These characteristics are believed to result from long-term natural selection and largely uncontrolled breeding processes that favored the maintenance of adaptive traits essential for survival in harsh environments [10,11]. In donkeys, biometric traits change substantially during growth [12]. Moreover, body conformation within local populations may reflect differences in nutritional status, animal use, and environmental and husbandry conditions [13]. Therefore, information on the geographical and management origin of the animals is essential for interpreting morphometric variation and distinguishing potentially inherent morphological differences from environmentally influenced phenotypic variation.
Despite their historical importance, the role of donkeys in rural production systems has declined substantially over recent decades. In Brazil, agricultural mechanization and the replacement of animal traction by motorized vehicles have considerably reduced the use of donkeys as working animals [14,15,16]. The resulting loss of their traditional function has contributed to widespread abandonment, while the more recent expansion of the extractive donkey-skin trade has further intensified population decline and raised concerns regarding animal welfare and biosecurity [17]. Together, these processes threaten the long-term persistence of local donkey populations and have intensified discussions regarding the conservation of this genetic resource [16,17,18].
The establishment and recognition of livestock breeds involve both biological and sociocultural components. According to the FAO, a breed may be distinguished by identifiable external characteristics or by geographical and cultural separation that has resulted in the acceptance of a distinct population identity. Traditional populations are generally shaped by a common production environment, patterns of use, restricted gene flow, and natural or low-intensity selection. They may subsequently become standardized breeds when breeder organizations establish recognized phenotypic descriptors and implement pedigree and performance-recording systems [19]. In donkeys, geographic isolation, adaptation to local environments, and natural and breeder-directed selection have contributed to the development of morphologically and genetically differentiated populations worldwide [20,21].
Brazil harbors three local donkey genetic groups—the Pêga, Northeastern, and Brazilian donkeys—which exhibit distinct geographical and historical patterns of formation [20,22]. Formal breed status in Brazil is associated with the existence of a breeder organization and a genealogical registration system regulated by the Ministry of Agriculture and Livestock. Under this institutional framework, the Pêga is the only Brazilian donkey group formally recognized as a breed, with an established breed standard and genealogical records, whereas the Northeastern and Brazilian donkeys are classified as local ecotypes [20,22]. The Northeastern Donkey developed primarily through natural selection and geographic isolation under the semi-arid conditions of northeastern Brazil, without sustained breeder-directed selection for morphological standardization [23]. Although a breeders’ association and a germplasm conservation program previously sought to implement genealogical recording and obtain official breed recognition, these initiatives were not consolidated, and the population remains classified as an ecotype [23].
Multivariate morphometric approaches, including principal component, cluster, and discriminant analyses, have been applied to characterize donkey populations, summarize correlated body measurements, identify traits with greater discriminatory value, and evaluate morphological separation among populations [24,25]. These approaches provide a useful framework for exploring phenotypic structure when formal morphological standards and comprehensive genetic information are limited.
Given the limited information available regarding the morphological diversity of the Northeastern Donkey, this study aimed to characterize the morphometric variability of a donkey population from the Brazilian semi-arid region and to identify distinct morphostructural profiles that may contribute to future conservation and characterization strategies for this threatened local genetic resource.

2. Materials and Methods

2.1. Study Population and Study Area

At each facility, a list of the Northeastern Donkeys available for the study was prepared, and the order of the animals was randomized using Microsoft Excel before eligibility assessment and sampling. This procedure was intended to reduce selection bias within each facility rather than to obtain a probabilistically representative sample of the entire Northeastern Donkey ecotype. A total of 59 animals were initially considered. Eligibility was subsequently assessed based on the available health records and the animals’ health status at the time of sampling. Eight animals were excluded because they presented conditions that could compromise animal welfare, safe handling, standardized positioning, or morphometric assessment, including pediculosis, ocular discharge, scoliosis, and papilloma.
The final analytical sample comprised 51 Northeastern Donkeys (Equus asinus), including 27 females and 24 intact males; no geldings were included. Age was estimated by dental examination based on the eruption and wear patterns of the incisors, following the donkey-specific criteria described by Muylle et al. [26]. The distribution and estimated age of the animals according to study location and sex category are presented in Table 1.
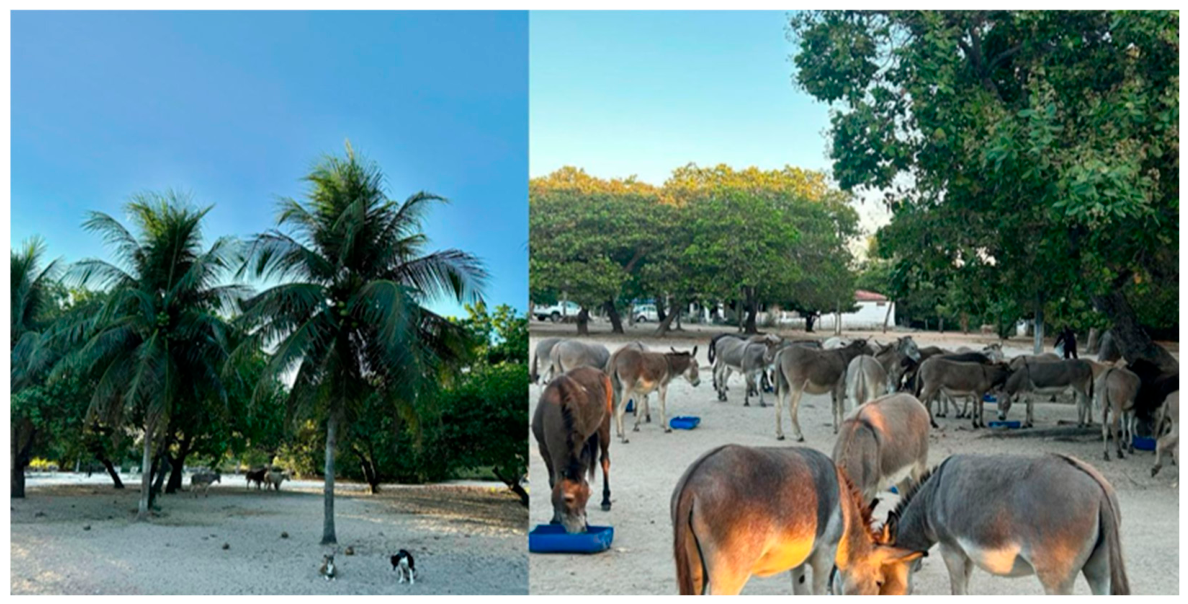
Thirty-two animals, comprising 12 females and 20 intact males, were housed in the municipality of Santa Quitéria, Ceará, Brazil. These animals had been rescued by the Ceará State Traffic Department (DETRAN-CE) and were maintained at Paula Rodrigues Farm (4°19′55″ S, 40°09′24″ W), located within the Caatinga biome (Figure 1).
Rescued animals were subjected to continuous veterinary and zootechnical management, including feeding, vaccination, health monitoring, and routine welfare practices. Animals were maintained under appropriate management conditions and regularly monitored for health and welfare status.
The remaining 19 animals, comprising 15 females and four intact males, were housed in the municipality of Aquiraz, Ceará, Brazil (3°54′36″ S, 38°23′24″ W) (Figure 2). These animals were housed at Lar dos Pancinhas, an animal sanctuary dedicated to the rescue and rehabilitation of equids affected by abandonment and mistreatment. The institution shelters approximately 89 large animals, including donkeys, mules, and horses.
Management at the sanctuary was non-productive and welfare-oriented, consisting primarily of hay, concentrate feed, and fruit supplementation, together with regular veterinary assistance and continuous sanitary control. Animals were maintained in fenced semi-extensive systems that allowed social interaction and the expression of natural behaviors.
Although the animals’ housing and management conditions at the time of evaluation were documented, complete individual information regarding their geographical origin before rescue, previous use, nutritional history, health care, and environmental and management conditions during growth was unavailable. Therefore, the study locations represent the facilities in which the animals were housed at the time of evaluation and should not necessarily be interpreted as their places of birth or rearing. This lack of pre-rescue information prevented direct assessment of the possible contribution of environmental and management conditions during growth to the observed morphometric variation.
Because the animals were sampled from two rescue-based facilities, the resulting sample should be considered facility-based and not a probabilistic representation of the entire Northeastern Donkey ecotype.

2.2. Linear and Circumference Measurements

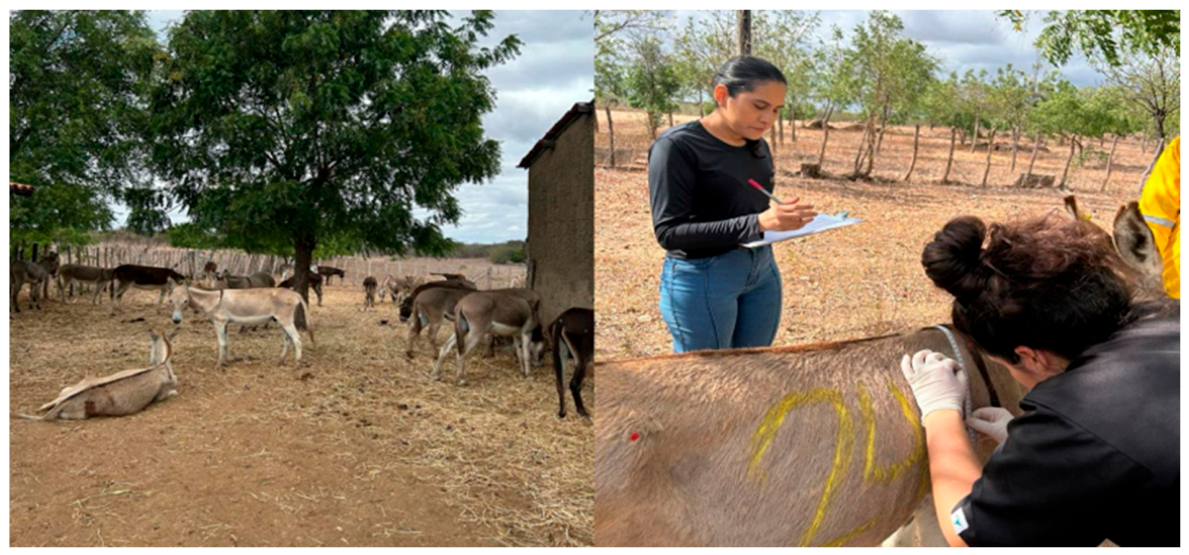
Morphometric measurements were obtained according to the anatomical landmarks and procedures described by Berardinis et al. [27], using a measuring tape and a Hauptner hippometer. Before measurement, the animals were positioned on a flat surface in a natural standing posture, with the limbs properly aligned and the head maintained in a neutral position.
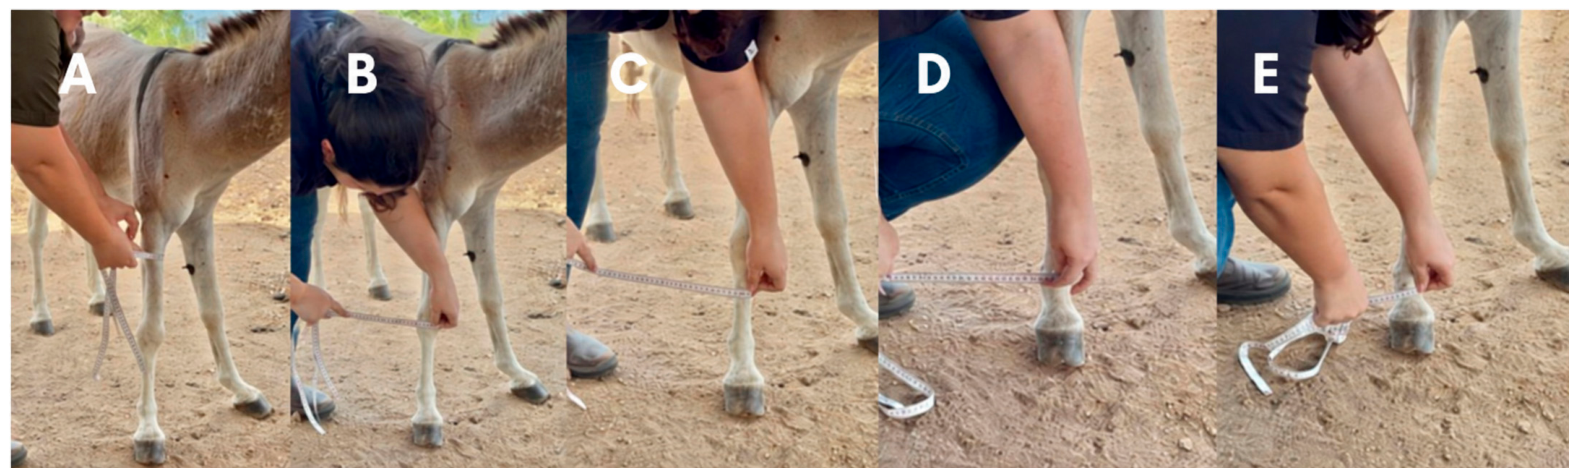
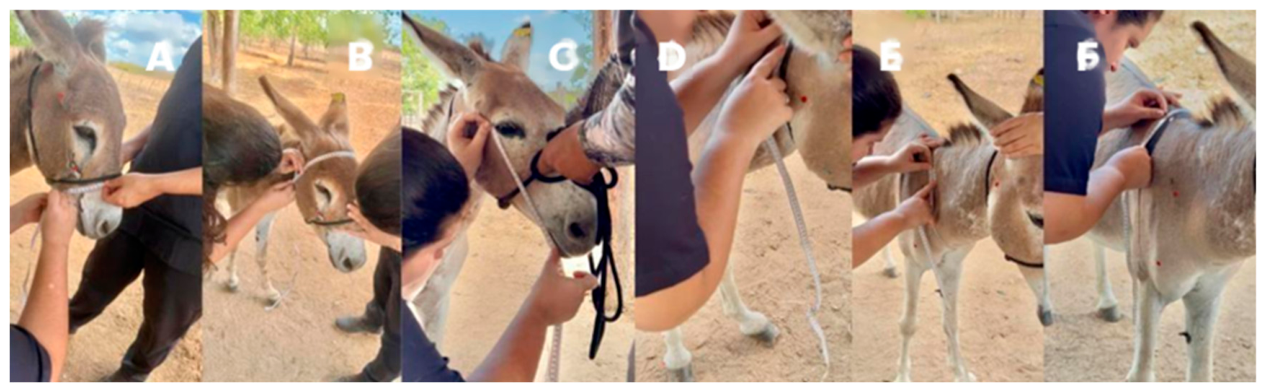
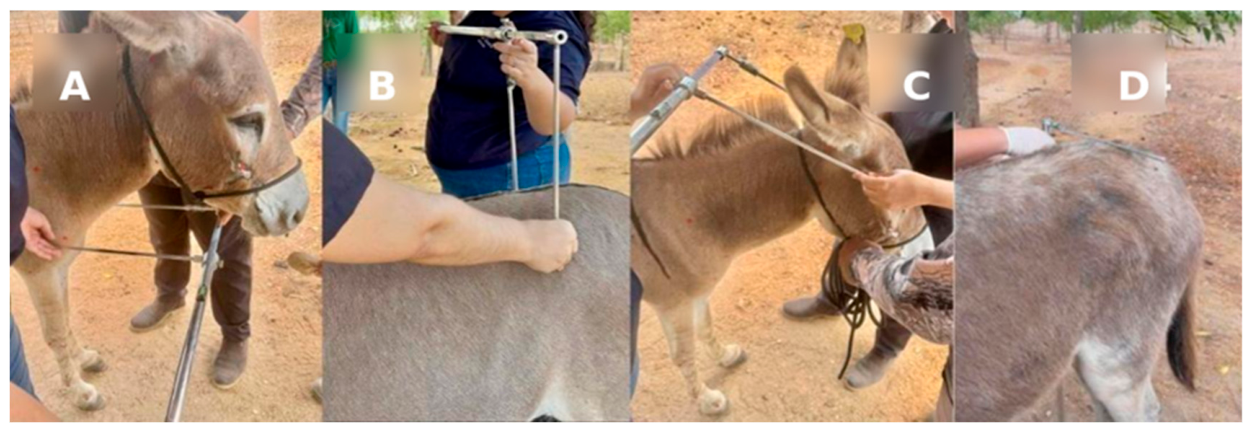
The following measurements were recorded: rump width, withers height, rump height, distance from the eye corner to the lip commissure, chest width, ear width, forehead width, thoracic circumference, muzzle circumference, forehead circumference, cranial and caudal neck circumferences, forearm circumference, knee circumference, cannon bone circumference, fetlock circumference, and pastern circumference (Figure 3, Figure 4 and Figure 5). Each measurement was independently performed by two evaluators, and the mean of the two records was used for statistical analysis.
Body condition score (BCS) was assessed by visual inspection and palpation using the donkey-specific five-point scoring system presented by Raspa et al. [28], based on the Donkey Sanctuary system described by Burden [29]. No further modifications to the scoring system were introduced in the present study. The assessment covered the neck and shoulders, withers, ribs and abdomen, back and loin, and hindquarters, including the vertebral column, flank, tuber coxae, rump, and tuber ischii. Each region was examined separately for muscle and fat deposition; however, no separate numerical regional scores were assigned. Instead, the regional findings were jointly integrated into a single global BCS ranging from 1 (poor) to 5 (obese), with scores 2, 3, and 4 representing moderate, ideal, and fat body condition, respectively. Half-point scores were permitted when an animal displayed characteristics intermediate between two consecutive categories. Two previously trained and calibrated evaluators independently assessed each animal. When their initial scores differed, the animal was jointly reassessed and a consensus score was assigned. The complete anatomical criteria distinguishing each score are provided in Supplementary Table S1. Before measurement, each animal was identified and positioned individually on a flat, firm, and level surface. Animals remained in a natural standing position, with the head held in a neutral position, the body weight distributed as evenly as possible among the four limbs, and the forelimbs and hindlimbs positioned vertically and parallel to each other. Measurements were preferentially obtained from the left side of the animal. Linear measurements were recorded using a Hauptner hippometer, whereas circumference measurements were obtained using a flexible, non-elastic measuring tape. The measuring tape was maintained in close contact with the body surface without compressing the skin or underlying soft tissues. All measurements were recorded in centimeters.
Withers height was measured vertically from the ground to the highest point of the withers. Rump height was measured vertically from the ground to the highest point of the sacral region. Chest width was measured as the horizontal distance between the lateral margins of the scapulohumeral regions. Rump width was measured as the horizontal distance between the most lateral points of the coxal tuberosities. Forehead width was measured between the most lateral points of the frontal region, and ear width was measured at the widest portion of the ear. The eye corner–labial commissure distance was measured in a straight line from the lateral canthus of the eye to the ipsilateral labial commissure.
Thoracic circumference was measured immediately caudal to the withers, passing the tape around the thorax close to the caudal border of the scapula. Muzzle circumference was measured around the widest portion of the muzzle. Forehead circumference was obtained by positioning the tape around the frontal region of the head at the predefined anatomical level. Cranial neck circumference was measured around the cranial portion of the neck, immediately caudal to the head, whereas caudal neck circumference was measured around the base of the neck, immediately cranial to the shoulders.
Forearm circumference was measured at the widest portion of the antebrachium. Knee circumference was measured around the carpal joint at its widest point. Cannon bone circumference was measured around the midpoint of the metacarpal region. Fetlock circumference was measured around the metacarpophalangeal joint at its widest point, and pastern circumference was measured around the midpoint of the proximal phalanx [27].

2.3. Statistical Analyses

The 17 continuous linear and circumference morphometric variables were standardized using z-scores (mean = 0 and standard deviation = 1) before cluster analysis.

2.3.1. Principal Component Analysis (PCA)

Principal component analysis (PCA), using principal-component extraction from the correlation matrix, was performed on the 17 continuous linear and circumference morphometric variables to summarize morphological variation in the evaluated sample. Principal-component extraction summarizes total standardized variance rather than fitting a common-factor model. Body condition score (BCS) and estimated age were excluded from component extraction because BCS is an ordinal measure and age is not a morphometric trait. The Kaiser–Meyer–Olkin (KMO) index was 0.81, and Bartlett’s test of sphericity was significant (χ2(136) = 800.95, p < 0.001), supporting the presence of correlations suitable for dimension reduction; these diagnostics do not remove the limitations imposed by the small sample size.
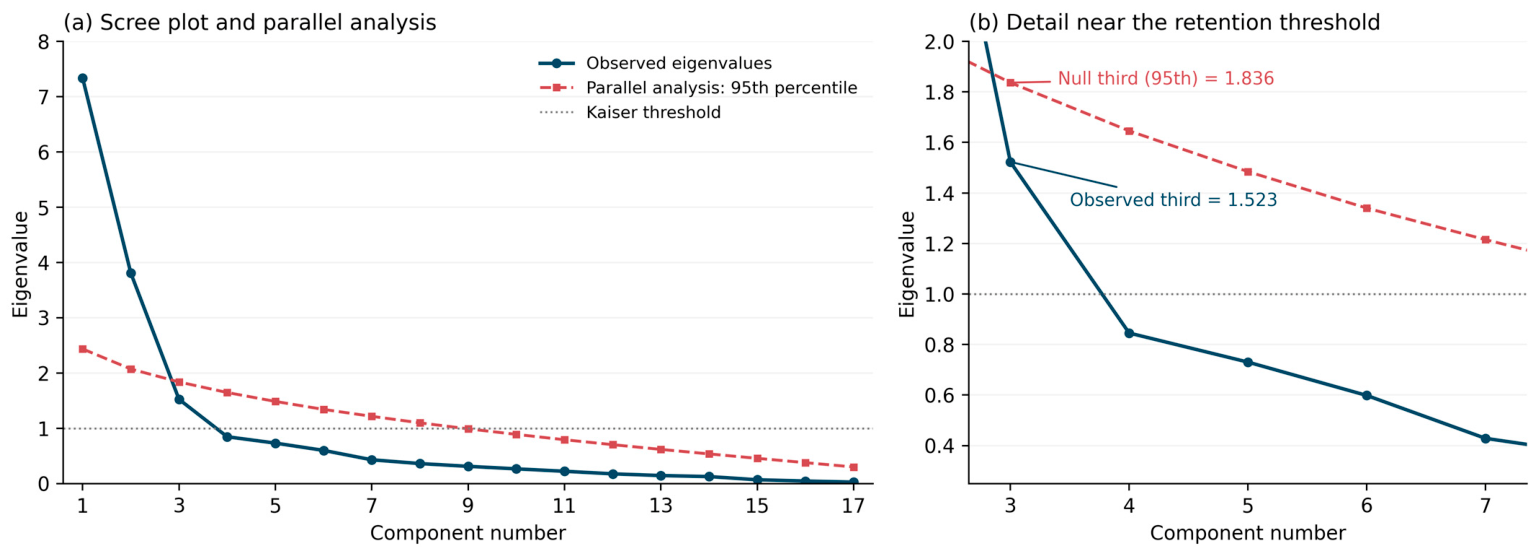
The Kaiser criterion (eigenvalues > 1) initially indicated a three-component solution accounting for 74.49% of the total variance. Retention was additionally assessed using a scree plot and parallel analysis with 10,000 simulated datasets, each containing 51 observations and 17 independent standard-normal variables. Each observed correlation-matrix eigenvalue was compared with the 95th percentile of the corresponding ordered simulated eigenvalues. A sensitivity analysis independently permuted observations within each morphometric variable 10,000 times, preserving its marginal distribution. The three-component solution was rotated using orthogonal Varimax rotation with Kaiser normalization and interpreted from the rotated loadings and extraction communalities. Because parallel analysis supported only two components, the three-component solution was retained solely as an exploratory descriptive representation, rather than as an established three-dimensional structure (Appendix A, Figure A1).

2.3.2. Hierarchical Cluster Analysis

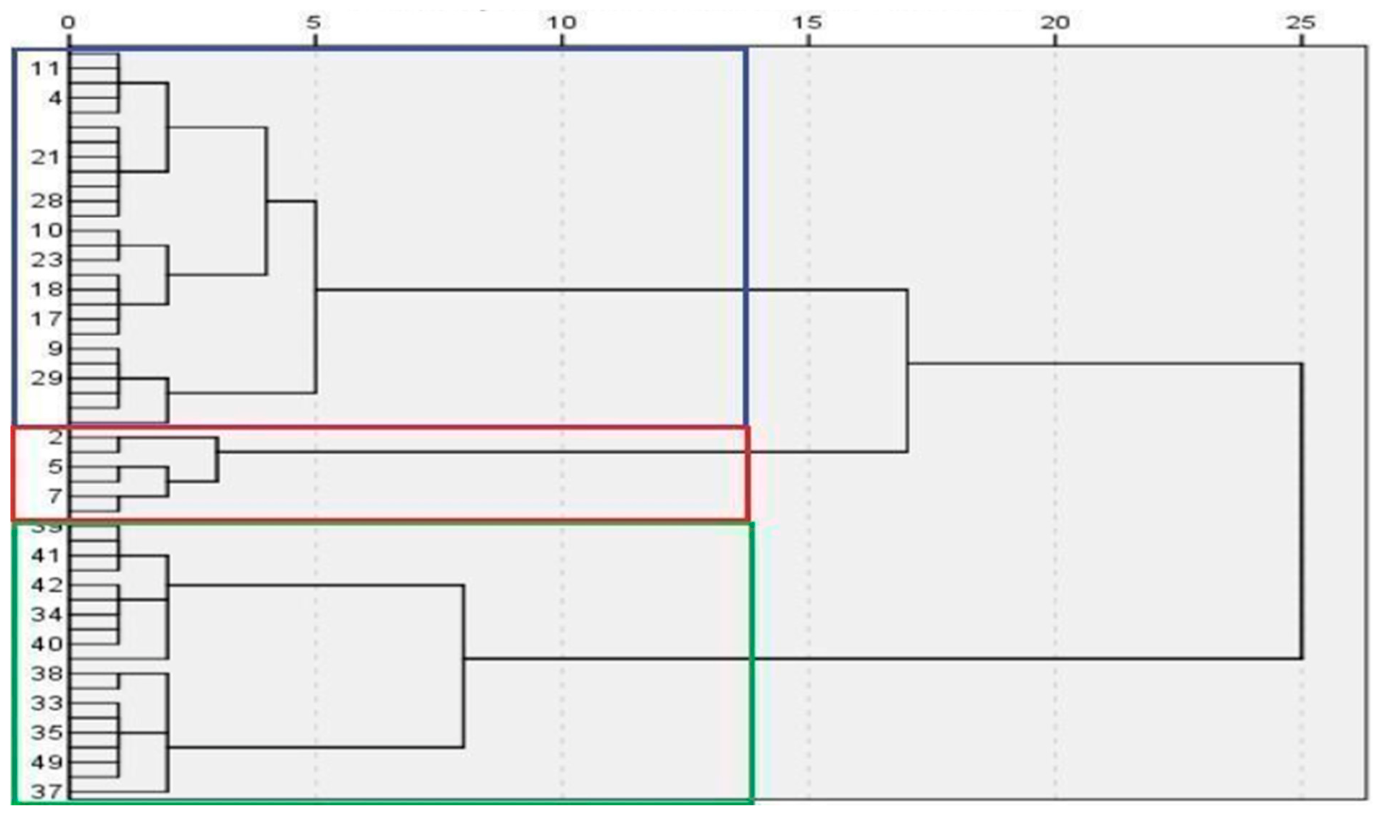
The 17 continuous linear and circumference morphometric variables were standardized using z-scores and included in the cluster analyses. Estimated age and body condition score were not included in cluster formation. Agglomerative hierarchical clustering (bottom-up approach) was performed using Ward’s linkage method and Euclidean distance as the measure of dissimilarity. The resulting dendrogram was examined to evaluate similarity among individuals and the separation of the resulting groups. Based on the dendrogram structure, a three-cluster solution was selected.

2.3.3. K-Means Cluster Analysis

After defining the number of groups through hierarchical clustering, a non-hierarchical k-means cluster analysis was performed using k = 3. The analysis was based exclusively on the 17 standardized linear and circumference morphometric variables. Initial centroids were derived from the hierarchical clustering solution. The algorithm iteratively reallocated individuals among clusters to minimize within-cluster variation, resulting in the final three-cluster solution.
The component-retention decision was separate from the cluster analysis: component scores were not used as clustering inputs.

2.3.4. Comparison Among Morphostructural Profiles

After cluster formation, differences in estimated age, body condition score (BCS), and morphometric measurements among the identified morphostructural profiles were evaluated. Estimated age and morphometric measurements were treated as quantitative variables, whereas BCS was treated as an ordinal variable. For quantitative variables, normality of residuals was assessed using the Shapiro–Wilk test, and homogeneity of variances among groups was evaluated using Levene’s test. Variables meeting the assumptions of normality and homogeneity of variances were analyzed using one-way analysis of variance (ANOVA), followed by Tukey’s post hoc test when significant differences were detected. Variables that did not meet these assumptions were analyzed using the Kruskal–Wallis test, followed by Dunn’s pairwise post hoc test with Bonferroni adjustment when significant differences were detected. Because BCS was treated as an ordinal variable, differences among profiles were evaluated using the Kruskal–Wallis test followed, when significant, by Dunn’s post hoc test with Bonferroni adjustment. Statistical significance was declared at p < 0.05. Estimated age and BCS were not used to define cluster membership and were evaluated only for subsequent characterization of the identified profiles. Because the morphometric groups were derived from the same morphometric variables subsequently compared among profiles, inferential comparisons of these measurements were interpreted descriptively and not as independent validation of the clustering solution.

2.3.5. Distribution of Sex and Study Facility Across Morphostructural Profiles

The distribution of sex among the identified morphostructural profiles was evaluated using the Fisher–Freeman–Halton exact test for the 2 × 3 contingency table, because of the relatively small frequencies in some cells. The distribution of the three morphostructural profiles by study facility was summarized as animal counts and percentages within each facility. Facility was not used to define cluster membership. These summaries were interpreted descriptively, without attributing causality to facility or management.

2.3.6. Canonical Discriminant Analysis

Canonical discriminant analysis was performed using a stepwise method to assess the separation and classification consistency of the morphostructural profiles identified by cluster analysis. The predefined clusters were used as the categorical grouping variable, whereas the morphometric measurements were entered as candidate predictor variables. The stepwise procedure selected the variables that contributed most strongly to group discrimination. Classification performance was evaluated using both the original classification matrix and leave-one-out cross-validation (LOOCV). In the cross-validation procedure, each individual was classified using discriminant functions estimated from all remaining observations, providing a more conservative assessment of classification performance.

3. Results

3.1. Principal Component Analysis

The first three unrotated components had eigenvalues of 7.33, 3.81, and 1.52 and together accounted for 74.49% of the total standardized variance (Table 2). After Varimax rotation, rotated components RC1, RC2, and RC3 accounted for 30.49%, 24.69%, and 19.30% of the total variance, respectively. Parallel analysis supported two components, which together explained 65.53% of the total variance. The third observed eigenvalue (1.523) was below its 95th-percentile reference value (1.836); the permutation analysis yielded the same retention decision (third reference value = 1.833). The scree plot and parallel-analysis thresholds are provided in Appendix A (Figure A1).
Most variables presented moderate to high communalities, indicating that they were adequately represented by the retained components. Variables related to body size and circumference exhibited particularly high communalities, including thoracic circumference (0.92), caudal neck circumference (0.87), cranial neck circumference (0.82), and rump width (0.81), suggesting that the three retained components explained a substantial proportion of the variation in these measurements. In contrast, forehead width showed a relatively low communality (0.35), indicating that a larger proportion of its variability was not captured by the retained components.
Each rotated component grouped variables with related characteristics, reflecting distinct dimensions of body conformation. RC1 exhibited high loadings for thoracic circumference (0.94), caudal neck circumference (0.93), cranial neck circumference (0.90), rump width (0.88), and chest width (0.82). Therefore, this rotated component was interpreted as representing body circumference and overall body size.
RC2 was mainly associated with limb measurements, showing high loadings for knee circumference (0.92), pastern circumference (0.88), cannon circumference (0.86), and fetlock circumference (0.76), indicating a component related to limb robustness.
RC3 grouped primarily linear body measurements, with high loadings for rump height (0.80), eye corner–labial commissure length (0.80), withers height (0.74), and ear width (0.71). This rotated component was interpreted as representing animal stature and linear body dimensions.
The three-component rotated solution provided a descriptive representation of body circumference and overall body size, limb robustness, and animal stature and linear body dimensions. However, parallel analysis supported only two retained components, indicating limited evidence for an additional dimension beyond sampling variation. The interpretation of the three rotated axes is therefore exploratory and requires confirmation in larger independent samples. The third unrotated eigenvalue should not be equated with RC3, because rotation combines the retained component axes.

3.2. Morphostructural Profiles of the Northeastern Donkey

Hierarchical cluster analysis based on morphological distances produced a dendrogram indicating the formation of three well-defined groups (Figure 6). A high degree of separation was observed among these groups, suggesting that individuals within each cluster were more similar to one another than to individuals belonging to other clusters.
Based on this result, k-means clustering was performed with k = 3, refining the classification of animals into three morphostructural profiles. Cluster 1 contained 30 animals, Cluster 2 contained 10 animals, and Cluster 3 contained 11 animals.
The three profiles exhibited distinct morphometric characteristics (Table 3 and Table 4). Overall, animals assigned to Cluster 3 showed the highest values for body size-related measurements and body condition score, whereas Cluster 2 comprised animals with the lowest morphometric measurements and body condition scores. Cluster 1 displayed intermediate values for most of the evaluated traits.
These findings indicate the presence of three morphologically distinct groups within the evaluated Northeastern Donkey population, corresponding to large-, intermediate-, and small-sized animals. The hierarchical dendrogram further supports this classification by showing a clear separation among the three profiles, highlighting the morphological variability present in the studied population.
In particular, measurements reflecting overall body size and body circumferences showed pronounced differences among clusters, with several traits exhibiting p < 0.001 (Table 3 and Table 4).
For example, mean withers height was approximately 104.8 cm in Cluster 3, significantly higher than that observed in Cluster 2 (approximately 96.6 cm). Similarly, mean thoracic circumference was greater in Cluster 3 (129.2 cm) than in Cluster 2 (104.3 cm), representing a difference of approximately 25 cm between the two profiles.
Furthermore, Cluster 3 exhibited greater neck circumferences, including a mean caudal neck circumference of approximately 91 cm, and greater forearm circumference (approximately 23.1 cm) compared with the other profiles (p < 0.05). Body condition score also differed significantly among profiles (Kruskal–Wallis H(2) = 20.42, p < 0.001), with Cluster 3 showing a mean value of 5.0, significantly higher than those observed in Clusters 1 (3.32) and 2 (2.55). Because BCS was not used to define cluster membership, these differences represent descriptive characteristics of the identified morphostructural profiles.
Overall, animals assigned to Cluster 3 exhibited the greatest values for several linear and circumference morphometric measurements, whereas Cluster 2 generally showed the lowest values. Cluster 1 displayed intermediate morphometric characteristics. The higher BCS observed in Cluster 3 also indicates that differences in circumference measurements may reflect, at least in part, differences in body condition in addition to structural body size.
Some traits, however, did not differ significantly among profiles. Ear width (approximately 6.4–6.7 cm across groups) and knee circumference (approximately 21 cm) remained statistically similar (p > 0.05), indicating that these measurements contributed relatively little to the differentiation among the identified profiles.
Cluster 2 therefore represented the relatively small-sized morphostructural profile, whereas Cluster 3 represented the relatively large-sized profile, particularly based on differences in height and body circumferences. Cluster 1 generally exhibited intermediate values and, for several traits, did not differ significantly from one of the other profiles. Taken together, these quantitative differences characterize the three relative morphostructural profiles identified within the evaluated sample.
Sex distribution did not differ significantly among the three morphostructural profiles. Cluster 1 comprised 16 females and 14 males, Cluster 2 comprised 3 females and 7 males, and Cluster 3 comprised 8 females and 3 males. The Fisher–Freeman–Halton exact test did not detect an association between sex and cluster membership (p = 0.156); however, the small sample and unequal sex composition limit the ability to exclude a contribution of sex to the observed morphometric patterns.
The distribution of profiles differed markedly between study facilities (Table 3B). Of the 32 animals from Santa Quitéria, 22 (68.75%) belonged to the intermediate profile (Cluster 1), 10 (31.25%) to the small profile (Cluster 2), and none to the large profile (Cluster 3). Of the 19 animals from Aquiraz, eight (42.11%) belonged to the intermediate profile, none to the small profile, and 11 (57.89%) to the large profile. Thus, the intermediate profile occurred at both facilities, whereas the small and large profiles were confined to Santa Quitéria and Aquiraz, respectively.

3.3. Canonical Discriminant Analysis

The stepwise canonical discriminant analysis showed good separation among the three morphostructural profiles and high classification consistency. Overall, 98.0% of the original grouped cases were correctly classified. Leave-one-out cross-validation resulted in an overall classification accuracy of 88.2%, indicating that the discrimination among profiles remained relatively stable when each individual was classified using discriminant functions estimated from all remaining observations.
In the original classification, of the 51 evaluated animals, 50 were assigned to their respective clusters. Only one misclassification occurred, in which an individual belonging to Cluster 2 was classified as a member of Cluster 1. No classification errors were observed for Clusters 1 and 3, where 100% of individuals were correctly identified by the discriminant model. These results indicate strong agreement between the discriminant classification and the cluster-derived morphostructural profiles in the original classification.
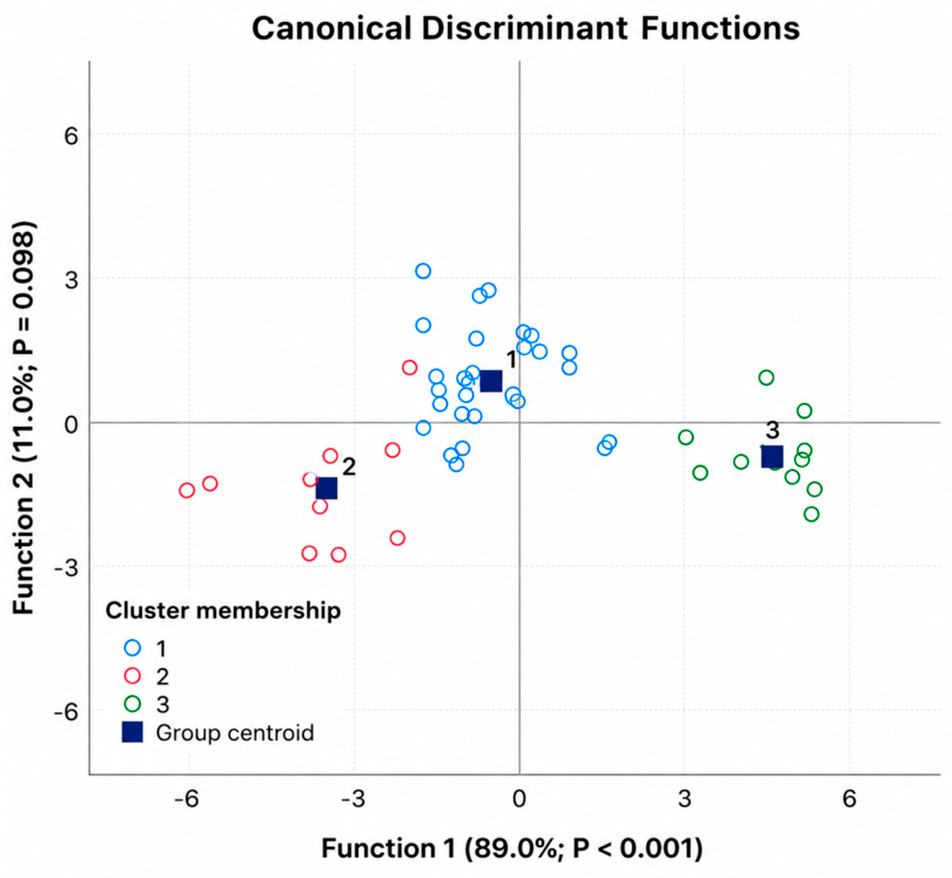
The score plot of the first two canonical functions (Figure 7) was consistent with these findings, showing a clear visual separation among the three morphostructural profiles in the canonical discriminant space. The group centroids were clearly separated in the discriminant plot, indicating that the linear combinations of the selected morphometric variables differentiated the three profiles within the evaluated sample. Nevertheless, because the discriminant analysis was performed on groups previously derived from the same morphometric dataset, these results should be interpreted as evidence of internal classification consistency rather than independent validation of the identified profiles.
Thus, discriminant analysis indicated that the differences captured by the linear and circumference morphometric measurements provided substantial discrimination among the three morphostructural profiles identified within the evaluated sample. Moreover, examination of the canonical coefficients indicated which variables contributed most strongly to group discrimination, complementing the cluster analysis by identifying the morphometric traits most relevant to the separation among profiles.
Taken together, these results support the internal classification consistency of the identified clusters and provide additional evidence for the morphometric differentiation among the three morphostructural profiles within the evaluated sample. However, these findings should not be interpreted as evidence of fixed population-wide morphostructural categories.

4. Discussion

4.1. Biological Interpretation of the Morphostructural Profiles

Based on the multivariate analyses, the evaluated Northeastern Donkeys were distributed into three relative morphostructural profiles, characterized by comparatively small, intermediate, and large body dimensions. The small-sized profile exhibited the lowest mean withers height (≈96.6 cm), thoracic circumference (≈104.3 cm), and body condition score (≈2.55), whereas the intermediate profile showed moderate values for these traits. In contrast, animals assigned to the large-sized profile presented the greatest linear and circumference measurements and the highest body condition scores (≈5.0), indicating greater values for several body-size-related measurements together with higher apparent fat deposition.
The identification of distinct morphostructural profiles is consistent with findings in the Colombian Creole Donkey, in which morphometric variation among geographical subregions resulted in the formation of distinct hierarchical groups [30]. Conversely, the relatively greater heterogeneity observed in the present sample contrasts with the morphological uniformity reported for the Martina Franca donkey, a formally standardized breed subjected to systematic selection [27]. This contrast may reflect differences in population history and selection intensity, although the heterogeneous and incompletely documented origins of the animals evaluated here prevent causal attribution.
Body condition differed substantially among the identified morphostructural profiles, with animals in the large-sized profile showing the highest BCS values. Importantly, BCS was not used to define cluster membership and was evaluated only as an ordinal descriptive characteristic after cluster formation. Body condition scoring provides an indirect assessment of fat deposition and has been reported to be associated with stored body fat in equids [28]. Nevertheless, differences in body condition may also influence some circumference measurements because these measurements reflect not only skeletal dimensions but also muscle and adipose tissue. Therefore, the larger circumference measurements observed in the large-sized profile should not be interpreted exclusively as indicators of greater structural body size. The concentration of BCS values at the upper limit of the scale in this profile should also be considered when interpreting these differences.
Overall, the results demonstrate phenotypic heterogeneity within the evaluated sample. However, the identified clusters should be regarded as relative and exploratory morphostructural profiles rather than as fixed body-size classes representative of the entire Northeastern Donkey ecotype.

4.2. Interpretation of the Morphostructural Profiles

The identification of three morphostructural profiles in the Northeastern Donkey through hierarchical clustering and k-means analysis indicates substantial phenotypic variation within the evaluated sample. The separation observed in the dendrogram suggests that the measured morphometric variation contained sufficient structure to support the three-cluster solution within this sample.
From an evolutionary perspective, genetic adaptation may be understood as the accumulation of heritable changes that enhance the persistence of a population within a particular environment. Such changes may arise from natural processes acting across multiple generations, such as natural selection, or from human-mediated processes in which artificial selection promotes the fixation of desirable traits [31]. However, because neither genetic information nor historical selection processes were directly evaluated in the present study, the observed morphometric profiles cannot be interpreted as evidence of adaptive or genetically differentiated groups.
The organization of the clusters according to body size indicates phenotypic variation within the evaluated sample. Estimated age and BCS were not used to define cluster membership and were retained only for subsequent characterization of the identified profiles. The test of sex distribution did not detect an association with cluster membership, but this result does not establish that the profiles were independent of sex or facility composition. However, this analysis assessed only the distribution of sex across morphostructural profiles and was not designed to formally evaluate sex-related differences in individual morphometric traits; therefore, potential sexual dimorphism cannot be excluded. Variation in nutritional status, management practices, previous use, workload, and environmental exposure may nevertheless have contributed to the observed morphometric differences. However, these potential influences were not directly evaluated in the present study. Accordingly, differences in body size and body condition should not be interpreted as evidence of functional or productive superiority of any morphostructural profile, because productive performance, work capacity, and efficiency under environmentally restrictive conditions were not assessed.
The concentration of all small-profile animals in Santa Quitéria and all large-profile animals in Aquiraz indicates that the clustering pattern may partly reflect facility-associated characteristics. The facilities differed in age and sex composition and current management, while pre-rescue histories were incompletely documented. These intertwined characteristics cannot be separated in the present descriptive analysis, and the observed distribution does not establish a causal effect of facility or management. The profiles should consequently be interpreted within this facility-based sample rather than as ecotype-wide or genetically distinct groups.
The intermediate cluster, which included the largest proportion of animals, was the most frequently represented morphostructural profile in the evaluated sample. However, because the animals constituted a facility-based sample of rescued donkeys rather than a population-based random sample, this finding should not be interpreted as evidence that the intermediate profile predominates throughout the Northeastern Donkey ecotype.
The agreement between the clustering methods indicates that the three-cluster solution was internally consistent within the sample evaluated. However, these clusters should be interpreted cautiously. The study was based on a relatively small, facility-based sample of rescued animals with heterogeneous and incompletely documented geographical, nutritional, health, and management histories. Although estimated age and BCS were excluded from cluster formation, the marked concentration of the small and large profiles in different facilities limits separation of morphometric structure from facility-associated age, sex, management, and historical characteristics. Other unmeasured individual and environmental factors may also have contributed to the observed variation. In addition, because no molecular genetic data were available, it was not possible to determine whether the identified morphometric profiles reflect underlying genetic differentiation. Consequently, the clusters should be regarded as exploratory morphostructural profiles within the evaluated sample and not as evidence of population-wide phenotypic structure or distinct genetic groups within the Northeastern Donkey ecotype.
The absence of variability in body condition score within Cluster 3 likely reflects the limited resolution of the adopted five-point scoring system at its upper limit. Animals with different degrees of adiposity may have been assigned the maximum score, resulting in a ceiling effect. Therefore, although BCS was useful for characterizing the general body condition of the evaluated donkeys, greater discrimination among animals with high fat deposition may require more detailed scoring systems or objective methods for body fat assessment. In addition, although BCS was independently assessed by two trained and calibrated evaluators and disagreements were resolved through joint reassessment and consensus, inter-rater agreement was not quantitatively evaluated. Therefore, the reproducibility of BCS assignment between evaluators could not be formally assessed and should be considered a methodological limitation.
Future studies should evaluate larger and geographically representative populations, sample multiple facilities with better-balanced age and sex categories, document environmental and management histories, and integrate morphometric and molecular genetic information to determine whether the patterns observed here are reproducible across the ecotype.
From a conservation perspective, recognizing different morphological profiles may be useful for documenting the existing phenotypic diversity and informing future conservation initiatives. Rather than establishing rigid conformational categories from the present sample, these preliminary profiles highlight the importance of considering existing body variation when developing future characterization criteria. Hernández-Herrera et al. [30] emphasized that baseline studies based on morphological characterization represent an indispensable first step toward the development of conservation strategies for local animal genetic resources.

4.3. Assessment of Morphostructural Classification Consistency

Discriminant analysis indicated substantial separation among the morphostructural profiles previously identified by cluster analysis. The high original classification accuracy and the performance observed under leave-one-out cross-validation indicated good internal classification consistency. However, because discriminant analysis was performed on groups previously derived from the same morphometric dataset, these findings should not be interpreted as independent validation of the identified profiles.
These findings were consistent with the pattern previously observed in the multivariate analyses. Similar analytical approaches have been applied specifically to donkey populations. Kefena et al. [24] used principal component, cluster, stepwise discriminant, and canonical discriminant analyses to summarize morphometric variation, identify the measurements with the greatest discriminatory value, and evaluate separation among Ethiopian donkey populations. Likewise, Getachew et al. [25] used stepwise and canonical discriminant analyses to identify quantitative traits contributing to population differentiation and to visualize the distribution of donkeys in the canonical space. In the present study, discriminant analysis similarly complemented the exploratory clustering procedures by identifying the morphometric variables that contributed most strongly to the separation of the three morphostructural profiles.
The distribution of individuals in the discriminant space, illustrated by the score plot of the canonical functions (Figure 7), showed clear visual separation among the three morphostructural profiles in the original discriminant space. The positions of the group centroids further indicated that the profiles were differentiated by different combinations of the linear and circumference morphometric measurements evaluated. This pattern supports the internal consistency of the observed morphometric differentiation.
These findings are consistent with Egito et al. [32], who reported that populations belonging to the same breed but subjected to geographic isolation and distinct environmental conditions may accumulate genetic variation over time, particularly as a consequence of genetic drift. Nevertheless, no genetic data were evaluated in the present study, and the morphometric differences observed among profiles therefore cannot be attributed to genetic differentiation. Future molecular characterization could determine whether any component of the observed morphometric variation is associated with underlying genetic structure.
Although some similarity among individuals from different profiles is expected because morphometric traits vary continuously, the overall classification performance indicates substantial differentiation among the profiles within the evaluated sample. The lower accuracy obtained under leave-one-out cross-validation compared with the original classification further emphasizes that the discriminant results should be interpreted as an assessment of internal classification consistency rather than as independent validation.
The discriminant functions were based on the morphometric predictors selected by the stepwise procedure. BCS was not entered directly, but its association with circumference measurements may have contributed to the separation among profiles. Therefore, the canonical discriminant analysis provided additional evidence of internal classification consistency and morphometric differentiation among the identified profiles within the evaluated sample. These findings remain exploratory and should not be interpreted as evidence of fixed population-wide morphostructural categories.

4.4. Implications for Conservation and Breed Characterization

The results of this study provide baseline morphometric information potentially relevant to the conservation of the Northeastern Donkey, particularly by documenting the body variation observed within the evaluated sample. The presence of different morphostructural profiles suggests that future breed characterization and conservation initiatives should consider existing phenotypic variation rather than prematurely imposing a single conformational standard.
Given the ongoing reduction in population size, management decisions based on inappropriate selection criteria may accelerate the loss of genetic diversity. The information generated in this study may provide a preliminary phenotypic basis for future conservation programs and for the development of more representative characterization criteria. However, recommendations concerning breeder selection, mating strategies, or the establishment of conservation nuclei require additional evidence from larger, population-based samples and molecular genetic analyses.
By providing objective measurements for the characterization of the Northeastern Donkey, this study establishes a preliminary morphometric baseline that may support future efforts to characterize its phenotypic diversity and inform conservation research in the Brazilian semi-arid region.

5. Conclusions

The evaluated sample of 51 rescued Northeastern Donkeys showed substantial morphometric heterogeneity. Multivariate analyses identified three internally consistent clusters corresponding to relatively small-, intermediate-, and large-sized morphostructural profiles. These profiles differed primarily in linear and circumference body measurements and were also characterized by differences in body condition score, which was not used to define cluster membership.
These findings describe the range of morphometric variation present within the evaluated facility-based sample and should not be interpreted as evidence of population-wide phenotypic structure or genetically distinct groups within the Northeastern Donkey ecotype. Interpretation of the results is limited by the relatively small and non-probabilistic sample, the marked facility-specific distribution of the small and large profiles, the rescue origin of the animals, their heterogeneous and incompletely documented pre-rescue histories, and the absence of molecular genetic data.
Therefore, the identified clusters should be considered exploratory morphostructural profiles that provide a preliminary descriptive baseline for future investigations. Studies involving larger and geographically representative populations and integrating morphometric, environmental, genealogical, functional, and molecular genetic information are required before these findings can inform broader breed characterization, conservation planning, or the establishment of morphological standards.

Supplementary Materials

The following supporting information can be downloaded at: https://www.mdpi.com/article/10.3390/app16189089/s1. Table S1: Operational criteria for the donkey-specific five-point body condition scoring system used in the study.

Author Contributions

D.A.E.F.: conceptualization, methodology, supervision, project administration, and funding acquisition; R.M.F.S.: validation, formal analysis, and writing—original draft preparation; A.G.B.d.A.N.: formal analysis, investigation, and writing—original draft preparation; C.A.d.A.O., D.C.S., N.S.F., A.V.A.M., F.B.C.C., C.L.R.d.J. and A.F.B.: conceptualization, investigation and writing—review and editing. All authors have read and agreed to the published version of the manuscript.

Funding

This research received no external funding.

Institutional Review Board Statement

The study was approved by the Animal Ethics Committee of the Federal Rural University of the Semi-Arid Region (UFERSA), Brazil, under protocol no. 38/2025.

Informed Consent Statement

Not applicable.

Data Availability Statement

The datasets generated and analyzed during the current study are available from the corresponding author upon reasonable request.

Acknowledgments

During the preparation of this work, the authors used ChatGPT-5.6 to assist with language editing, preparation of analysis code, and verification of statistical reporting. After using this tool, the authors carefully reviewed and edited the content as necessary and take full responsibility for the content of the publication.

Conflicts of Interest

The authors declare no conflicts of interest.

Appendix A. Component-Retention Diagnostics

The scree plot is shown with 95th-percentile reference eigenvalues from 10,000 independent standard-normal datasets (51 observations × 17 variables). Parallel analysis supports two components. Retaining three components remains an exploratory descriptive choice, not a conclusion confirmed by parallel analysis.
Figure A1. Scree plot and parallel analysis for the 17 morphometric variables in 51 Northeastern donkeys. (a) All observed eigenvalues, the 95th-percentile simulated reference eigenvalues, and the Kaiser threshold of 1. (b) Detail near the retention threshold. The third observed eigenvalue (1.523) was below its reference value (1.836). Independent within-variable permutations confirmed the two-component retention decision (third reference eigenvalue = 1.833).
Applsci 16 09089 g0a1

References

  1. Beja-Pereira, A.; England, P.R.; Ferrand, N.; Jordan, S.; Bakhiet, A.O.; Abdalla, M.A.; Mashkour, M.; Jordana, J.; Taberlet, P.; Luikart, G. African origins of the domestic donkey. Science 2004, 304, 1781. [Google Scholar] [CrossRef] [Scilit] [PubMed]
  2. Blench, R. The history and spread of donkeys in Africa. In Technical Centre for Agricultural and Rural Cooperation; ACP-EU: Wageningen, The Netherlands, 2004. [Google Scholar]
  3. Zhu, Q.; Khan, M.Z.; Peng, Y.; Wang, C. A Comparative Review of Donkey Genetic Resources, Production Traits, and Industrial Utilization: Perspectives from China and Globally. Animals 2025, 15, 3372. [Google Scholar] [CrossRef] [Scilit] [PubMed]
  4. IBGE–Instituto Brasileiro de Geografia E Estatística. Censo Agropecuário 2017: Resultados da Pecuária; Rio de Janeiro, Brazil, 2017. Available online: https://censoagro2017.ibge.gov.br (accessed on 10 January 2026).
  5. FAO. FAOSTAT; FAO: Rome, Italy, 2014. [Google Scholar]
  6. FAO. FAOSTAT: Live Animals; FAO: Rome, Italy, 2019. [Google Scholar]
  7. Câmara, R.J.F. Perfil sanitário de asininos errantes do Nordeste brasileiro. In Tese (Doutorado em Ciência Animal); Universidade Federal de Minas Gerais: Belo Horizonte, Brazil, 2021. [Google Scholar]
  8. Lima, Y.F.; Tatemoto, P.; Santurtun, E.; Reeves, E.; Raw, Z. The human-animal relationship and its influence in our culture: The case of donkeys. Braz. J. Vet. Res. Anim. Sci. 2021, 58, e174255. [Google Scholar] [CrossRef] [Scilit]
  9. Messias, T.B.O.N.; Araújo, E.O.M.; Sant’ana, A.M.S.; Lucena, J.E.C.; Pacheco, M.T.B.; Queiroga, R.C.R.E. Challenges and perspectives for exploiting donkey milk in the Brazilian Northeast. Ciênc. Rural 2022, 52, e20210058. [Google Scholar] [CrossRef] [Scilit]
  10. Silva, A.R. Avaliação da Composição Nutricional e Bioatividade de Leite Asinino do Ecótipo Nordestino Obtido de Siferentes Fases de Lactação. Master’s Dissertation, Universidade Federal da Paraíba, João Pessoa, Brazil, 2021. [Google Scholar]
  11. Carneiro, G.F.; Lucena, J.E.C.; Barros, L.O. The current status and trends of the donkey industry in South America. J. Equine Vet. Sci. 2018, 65, 106–110. [Google Scholar] [CrossRef] [Scilit]
  12. Moreira, C.G.; Menezes, M.L.; Nunes, T.R.; Mota, T.P.; Balieiro, J.C.C.; Oliveira, C.A.A.; Brandi, R.A. Biometric parameters of adult and growing Pêga donkeys. Rev. Bras. Zoot. 2019, 48, e20180297. [Google Scholar] [CrossRef] [Scilit]
  13. Gichure, M.; Onono, J.; Wahome, R.; Gathura, P. Assessment of phenotypic characteristics and work suitability for working donkeys in the central highlands in Kenya. Vet. Med. Int. 2020, 2020, 8816983. [Google Scholar] [CrossRef] [Scilit] [PubMed]
  14. Salle, P.A.; Sousa, L.O.; Gomes, L.P.B.; Barbosa, V.V.; Medeiros, G.R.; Sousa, C.M.; Weller, M. Analysis of the population of equidae in semiarid region of Paraíba. J. Biotechnol. Biodivers. 2013, 4, 269–275. [Google Scholar] [CrossRef] [Scilit]
  15. Gameiro, M.B.P.; Rezende, V.T.; Zanella, A.J. Brazilian donkey slaughter and exports from 2002 to 2019. Braz. J. Vet. Res. Anim. Sci. 2021, 58, e174697. [Google Scholar] [CrossRef] [Scilit]
  16. Farias, S.S.; Silva, A.R.; Do Nascimento, R.C.M.; Parada Sarmiento, M.; Mariz, T.M.A.; Escodro, P.B. Donkey Slaughter in Brazil: A Regulated Production System or Extractive Model? Animals 2025, 15, 1529. [Google Scholar] [CrossRef] [Scilit] [PubMed]
  17. Tatemoto, P.; Fernandes, Y.; Santurtun, E.; Reeves, E.; Raw, Z. Donkey skin trade: Is it sustainable to slaughter donkeys for their skin? Braz. J. Vet. Res. Anim. Sci. 2021, 58, e174252. [Google Scholar] [CrossRef] [Scilit]
  18. Navas, V.; Jordana, J.; León, J.M.; Barba, C.; Delgado, J.V. A model to infer the demographic structure evolution of endangered donkey populations. Animal 2017, 11, 2129–2138. [Google Scholar] [CrossRef] [Scilit] [PubMed]
  19. FAO. Phenotypic Characterization of Animal Genetic Resources; FAO Animal Production and Health Guidelines No. 11; Food and Agriculture Organization of the United Nations: Rome, Italy, 2012. [Google Scholar]
  20. Alves, J.S.; Anjos, M.S.; Bastos, M.S.; Oliveira, L.S.M.; Oliveira, I.P.P.; Pinto, L.F.B.; Oliveira, C.A.A.; Costa, R.B.; Camargo, G.M.F. Variability analyses of the maternal lineage of horses and donkeys. Gene 2021, 769, 145231. [Google Scholar] [CrossRef] [Scilit] [PubMed]
  21. Lopes, M.S.; Azevedo, A.R.; Mendonça, D.; Rojer, H.; Cabral, V.; Ceraolo, F.; Brum, C.C.; Mendes, B.; Machado, A.C. Morphological and genetic characterization of the Graciosa donkey breed. J. Appl. Anim. Res. 2023, 51, 166–173. [Google Scholar] [CrossRef] [Scilit]
  22. Alves, J.S.; Oliveira, C.A.A.; Escodro, P.B.; Pinto, L.F.B.; Costa, R.B.; Camargo, G.M.F. Genetic origin of donkeys in Brazil. Trop. Anim. Health Prod. 2022, 54, 291. [Google Scholar] [CrossRef] [Scilit] [PubMed]
  23. Oliveira, C.A.A.; Lucena, J.E.C. Jumento nordestino. In Cavalos e Jumentos do Brasil: Raças e Ecótipos; Ribeiro, N.L., de Medeiros, G.R., Gomes, I.L.C., do Nascimento, G.V., dos Santos, S.C.C.G., Eds.; INSA: Campina Grande, Brazil, 2023; p. 463. [Google Scholar]
  24. Kefena, E.; Beja-Pereira, A.; Han, J.L.; Haile, A.; Mohammed, Y.K.; Dessie, T. Eco-geographical structuring and morphological diversities in Ethiopian donkey populations. Livest. Sci. 2011, 141, 232–241. [Google Scholar] [CrossRef] [Scilit]
  25. Getachew, T.B.; Kassa, A.H.; Megersa, A.G. Phenotypic characterization of donkey population in South Omo Zone, Southern Ethiopia. Heliyon 2023, 9, e18662. [Google Scholar] [CrossRef] [Scilit] [PubMed]
  26. Muylle, S.; Simoens, P.; Lauwers, H.; Van Loon, G. Age determination in Mini-Shetland ponies and donkeys. J. Vet. Med. Ser. A 1999, 46, 421–429. [Google Scholar] [CrossRef] [Scilit] [PubMed]
  27. Berardinis, A.; Bucci, R.; Amicis, I.; Del Signore, F.; Parrillo, I.M.; Vignoli, M.; Carluccio, A. Phenotypic characterization of the Martina Franca donkey: An endangered Italian breed. Animals 2024, 14, 1950. [Google Scholar] [CrossRef] [Scilit] [PubMed]
  28. Raspa, F.; Cavallarin, L.; McLean, A.K.; Bergero, D.; Valle, E. A Review of the Appropriate Nutrition Welfare Criteria of Dairy Donkeys: Nutritional Requirements, Farm Management Requirements and Animal-Based Indicators. Animals 2019, 9, 315. [Google Scholar] [CrossRef] [Scilit] [PubMed]
  29. Burden, F. Practical feeding and condition scoring for donkeys and mules. Equine Vet. Educ. 2012, 24, 589–596. [Google Scholar] [CrossRef] [Scilit]
  30. Hernández-Herrera, D.Y.; Carrillo-Gonzalez, D.F.; Montes-Vergara, D.E. Caracterización zoométrica y etnológica del asno criollo colombiano en Sucre, Colombia. Rev. UDCA Actual. Divulg. Cient. 2022, 25, 1–11. [Google Scholar] [CrossRef] [Scilit]
  31. Bridi, A.M. Adaptação e Aclimatação Animal; UEL: Londrina, Brazil, 2010. [Google Scholar]
  32. Egito, A.A.; Mariante, A.S.; Albuquerque, M.S.M. Programa brasileiro de conservação de recursos genéticos animais. Arch. Zootec. 2002, 51, 39–52. [Google Scholar]
Figure 1. Detran Farm, located in the municipality of Santa Quitéria, Ceará, Brazil.
Applsci 16 09089 g001
Figure 2. View of the facilities of Lar dos Pancinhas Shelter, located in Aquiraz, Ceará, Brazil. Source: personal archive.
Applsci 16 09089 g002
Figure 3. Morphometric measurements of Northeastern donkeys. Circumference measurements: (A) forearm circumference (thoracic limb); (B) knee circumference (thoracic limb); (C) cannon circumference (thoracic limb); (D) fetlock circumference (thoracic limb); and (E) pastern circumference (thoracic limb), obtained using a measuring tape. Images: author’s archive.
Applsci 16 09089 g003
Figure 4. Morphometric measurements of the head, neck, and trunk of Northeastern donkeys: (A) muzzle circumference; (B) forehead circumference; (C) distance between the eye corner and the labial commissure; (D) cranial neck circumference; (E) caudal neck circumference; and (F) thoracic circumference (heart girth). Images: author’s archive.
Applsci 16 09089 g004
Figure 5. Morphometric measurements of Northeastern donkeys. Linear measurements: (A) chest width; (B) rump width; (C) forehead width; and (D) rump height, measured using a Hauptner measuring stick (hipometer). Images: author’s archive.
Applsci 16 09089 g005
Figure 6. Dendrogram of the hierarchical cluster analysis of linear and circumference morphometric traits in Northeastern donkeys.
Applsci 16 09089 g006
Figure 7. Canonical discriminant score plot showing the distribution of morphostructural profiles and group centroids for Northeastern donkeys.
Applsci 16 09089 g007
Table 1. Distribution and estimated age of the evaluated Northeastern Donkeys according to study location and sex category.
Study LocationSex CategoryNumber of AnimalsEstimated Age Range (Years)Estimated Age, Mean ± SD (Years)
Santa QuitériaFemales123.0–15.08.46 ± 3.33
Males203.5–18.08.95 ± 3.94
AquirazFemales152.5–9.05.43 ± 2.36
Males44.0–5.04.75 ± 0.50
Table 2. Principal component analysis of the 17 morphometric traits: (A) variance explained before and after rotation; (B) Varimax-rotated component loadings and communalities.
(A) Variance Explained.
Unrotated ComponentInitial EigenvalueVariance (%)Cumulative (%)Rotated ComponentVariance After Rotation (%)Cumulative After Rotation (%)
17.3343.1443.14RC130.4930.49
23.8122.3965.53RC224.6955.18
31.528.9674.49RC319.3074.49
(B) Rotated component loadings and communalities.
Variable (cm)RC1RC2RC3Initial communalityExtraction communality
Withers height0.410.260.741.000.78
Rump height0.360.230.801.000.82
Eye corner–labial commissure length−0.080.320.801.000.75
Chest width0.820.24−0.141.000.76
Rump width0.88−0.040.151.000.81
Ear width−0.310.130.711.000.61
Forehead width−0.040.420.411.000.35
Thoracic circumference0.940.060.181.000.92
Muzzle circumference0.240.580.321.000.50
Forehead circumference0.400.410.501.000.58
Cranial neck circumference0.900.060.071.000.82
Caudal neck circumference0.930.05−0.011.000.87
Forearm circumference0.680.510.081.000.73
Knee circumference0.060.920.231.000.90
Cannon circumference0.220.860.301.000.88
Fetlock circumference0.150.760.451.000.79
Pastern circumference−0.030.880.071.000.79
Extraction: principal components from the correlation matrix. Rotation: Varimax with Kaiser normalization. Initial eigenvalues refer to the unrotated solution; RC1–RC3 denote the rotated components. Initial communalities are 1.00 because PCA analyzes total standardized variance. The three-component solution is descriptive and exploratory; parallel analysis supports two components.
Table 3. Descriptive characteristics of the three morphostructural profiles identified in Northeastern donkeys (A) and their distribution by study facility (B).
(A)
ClusterNRelative Morphostructural ProfileBCS *Age * (Years)
210Small2.55 b8.30 a
130Intermediate3.32 b8.12 a
311Large5.00 a4.95 b
(B) Distribution by study facility, n (% within facility).
Study facilitySmall—C2Intermediate—C1Large—C3Total
Santa Quitéria (Paula Rodrigues Farm)10 (31.25%)22 (68.75%)0 (0.00%)32 (100%)
Aquiraz (Lar dos Pancinhas)0 (0.00%)8 (42.11%)11 (57.89%)19 (100%)
Total10301151
* Estimated age and BCS were not used to define cluster membership and are presented only for descriptive characterization of the morphostructural profiles. Different superscript letters within the same variable indicate significant differences among clusters (p < 0.05). C1–C3 identify the original reported morphostructural profiles. Percentages use the total number of animals within each facility as the denominator.
Table 4. Comparison of morphometric measurements among the three morphostructural profiles identified in Northeastern donkeys.
Variables/ClustersMeanStandard DeviationMinimumMaximum
Withers height (cm)
Cluster 1102.27 a3.7995.00108.10
Cluster 296.61 b3.8688.40101.00
Cluster 3104.83 a4.8397.10113.40
Rump height (cm)
Cluster 1107.04 a3.2899.20112.10
Cluster 2101.98 b4.0795.30107.00
Cluster 3108.74 a3.51101.10114.60
Eye corner–labial commissure length (cm)
Cluster 123.35 b1.2120.9026.00
Cluster 222.18 a0.9321.0023.50
Cluster 323.03 ab0.8721.9024.30
Chest width (cm)
Cluster 122.40 b1.9419.2027.30
Cluster 219.93 c1.2517.6021.60
Cluster 324.82 a1.5321.6027.00
Rump width (cm)
Cluster 130.412.6123.3035.30
Cluster 227.452.3122.6031.30
Cluster 336.731.5834.8039.20
Ear width (cm)
Cluster 16.71 a0.685.408.00
Cluster 26.38 a0.435.706.90
Cluster 36.41 a0.575.707.30
Forehead width (cm)
Cluster 117.85 a0.7016.5019.40
Cluster 217.28 a0.7816.0018.00
Cluster 317.55 a1.1415.6019.40
Thoracic circumference (cm)
Cluster 1113.59 b4.70107.40125.50
Cluster 2104.32 c4.9296.90111.20
Cluster 3129.19 a4.67122.60137.60
Muzzle circumference (cm)
Cluster 146.37 a2.3840.3050.10
Cluster 244.07 b2.1939.7047.10
Cluster 347.32 a1.8044.3050.10
Forehead circumference (cm)
Cluster 171.75 a3.1664.6077.20
Cluster 268.09 b2.6164.1072.30
Cluster 374.03 a2.7567.3077.30
Cranial neck circumference (cm)
Cluster 158.76 b3.3353.6066.90
Cluster 253.61 c2.1950.8057.60
Cluster 369.56 a2.9665.4075.90
Caudal neck circumference (cm)
Cluster 177.26 b4.3070.3085.40
Cluster 269.69 c3.6962.2075.30
Cluster 391.10 a4.3583.3099.50
Forearm circumference (cm)
Cluster 121.76 b1.1319.8023.90
Cluster 220.15 c1.3118.1021.90
Cluster 323.10 a1.4120.6025.60
Knee circumference (cm)
Cluster 121.08 a1.0819.2023.00
Cluster 220.56 a1.1918.5022.10
Cluster 321.34 a0.7420.4023.10
Cannon circumference (cm)
Cluster 112.88 ab0.6011.4013.90
Cluster 212.36 b0.8610.9013.80
Cluster 313.10 a0.6212.2014.40
Fetlock circumference (cm)
Cluster 117.17 ab0.8315.8018.90
Cluster 216.46 b1.3213.7018.50
Cluster 317.50 a0.6716.9019.00
Pastern circumference (cm)
Cluster 112.49 a0.7311.5014.80
Cluster 212.35 a1.1910.4014.00
Cluster 312.57 a0.4212.1013.60
Note: Different superscript letters within the same variable indicate significant differences among clusters (p < 0.05).
Disclaimer/Publisher’s Note: The statements, opinions and data contained in all publications are solely those of the individual author(s) and contributor(s) and not of MDPI and/or the editor(s). MDPI and/or the editor(s) disclaim responsibility for any injury to people or property resulting from any ideas, methods, instructions or products referred to in the content.