1. Introduction
1.1. Introduction to Temperature Measurement Using an Infrared Thermal Camera
Temperature measurement using an infrared thermal camera is based on the detection of thermal radiation emitted by the surface of an observed object. Every object with a temperature above absolute zero emits electromagnetic radiation, a significant part of which lies in the infrared spectral range. The intensity and spectral distribution of this radiation depend mainly on the surface temperature, emissivity of the material, reflected radiation from the surroundings, and the transmission properties of the environment between the object and the camera.
According to the International Recommendation OIML R 141 [
1], an infrared thermal camera is defined as a thermographic instrument, i.e., an optoelectronic instrument designed for non-contact remote observation, measurement and registration of the space/space–time distribution of the radiation temperature of objects in the field of view of the instrument by forming a time sequence of thermograms (two-dimensional image, each element being attributed a color, or a color gradation, or a screen brightness level, which is determined in correspondence with a conventional radiation scale) and by determining the temperature1 of the object surface on the basis of the known emittance and influence parameters (ambient temperature, atmospheric transmission, observation distance, etc.).
Infrared thermal cameras are increasingly used not only for qualitative visualization of temperature fields, but also for quantitative temperature measurement. This trend requires appropriate metrological characterization and calibration, because the indicated temperature depends on the detector response, radiometric calibration, emissivity, environmental conditions and measurement geometry. König et al. [
2] presented the metrological characterization and calibration of thermographic cameras for quantitative temperature measurement, including non-uniformity, noise equivalent temperature difference, size-of-source effect and calibration uncertainty.
Infrared thermal cameras are widely used in many practical fields because they enable non-contact temperature measurement and provide a spatial temperature distribution of the observed scene. This is useful wherever direct contact measurement is difficult, unsafe, slow, or impossible.
In technical diagnostics, infrared thermal cameras are commonly used for preventive maintenance of electrical and mechanical systems. They can reveal overheated electrical connections, overloaded components, bearing defects, insulation failures, friction losses, and abnormal heat generation in machines. In civil engineering, they are used for detecting thermal bridges, heat losses, moisture problems, damaged insulation, and air leakage in buildings [
3,
4,
5,
6,
7].
In medicine and biology, infrared thermography can be used as a non-invasive tool for observing surface temperature changes in the human body. It may help identify abnormal thermal patterns associated with inflammation, circulatory disorders, fever screening, wound healing, or local tissue response. However, medical interpretation requires strict measurement conditions and should be used only as a supporting diagnostic method, not as a standalone diagnosis [
8,
9,
10,
11,
12,
13,
14,
15,
16,
17].
In industrial processes, infrared thermal cameras are used for monitoring temperature distribution during manufacturing, welding, casting, electronics production, material testing, and quality control. They are also useful in energy systems, for example for inspecting photovoltaic panels, batteries, power electronics, and heat exchangers [
18,
19,
20,
21].
Another important area is safety and rescue applications. Infrared thermal cameras are used by firefighters, search-and-rescue teams, and security systems to detect people, hotspots, fire sources, or overheated objects even in reduced visibility conditions [
22,
23,
24,
25].
These applications show that infrared thermal cameras are versatile measurement tools. At the same time, their accuracy depends strongly on measurement conditions, including emissivity, reflected radiation, ambient conditions, camera settings, and measurement distance. Therefore, experimental verification using a reference source such as a blackbody calibrator is important when reliable quantitative temperature measurement is required.
An infrared thermal camera does not measure temperature directly in the same way as a contact sensor. Instead, it measures the infrared radiation received by the detector and then converts this radiation into a temperature value using an internal calibration model. This conversion requires several assumptions and input parameters, especially the emissivity of the measured surface, ambient temperature, reflected apparent temperature, relative humidity, and measurement distance. Therefore, the accuracy of infrared temperature measurement depends not only on the camera sensor itself, but also on the measurement geometry and environmental conditions.
The theoretical basis of radiometric temperature measurement is related to blackbody radiation. An ideal blackbody is a theoretical object that absorbs all incident radiation and emits the maximum possible thermal radiation for a given temperature. The total emitted radiant power of an ideal blackbody is described by the Stefan–Boltzmann law:
where
M is the radiant exitance,
σ is the Stefan–Boltzmann constant, and
T is the absolute thermodynamic temperature. Real surfaces do not behave as ideal blackbodies. Their emitted radiation is lower and is described by the emissivity coefficient
ε, where 0 <
ε ≤ 1. For a real surface, the emitted radiation can be approximated as:
This means that an incorrect emissivity setting in the infrared thermal camera can lead directly to a temperature measurement error. For this reason, calibration and validation of an infrared thermal camera are typically performed using a reference source with well-defined radiative properties.
1.2. Possible Sources of Measurement Error
Although infrared temperature measurement is contactless and fast, several factors may influence its accuracy. One of the most important parameters is the emissivity of the measured surface. If the emissivity setting in the camera does not correspond to the real emissivity of the object, the calculated temperature may be significantly distorted. This is especially important for metallic, glossy, or reflective surfaces.
Another important factor is reflected radiation from the surroundings. The camera receives not only radiation emitted by the measured object, but also radiation reflected from its surface. This may be problematic when the object has low emissivity or when there are hot or cold sources in the surrounding environment. Incorrect compensation of reflected apparent temperature may therefore introduce additional measurement error.
The measurement may also be affected by ambient conditions, such as air temperature, humidity, and atmospheric absorption. Infrared radiation is partially absorbed and scattered by the atmosphere, especially when the measurement distance increases. Although this effect may be small at short laboratory distances, it can become relevant in more demanding measurement conditions.
Other sources of error include camera focus, detector noise, thermal drift of the camera, limited spatial resolution, non-uniformity of the observed surface, viewing angle, and finite response time of both the camera and the reference source. In addition, if the camera display reaches its upper measurement or display limit, the exact value may no longer be available and the data point must be excluded from numerical evaluation.
Several studies have shown that quantitative infrared thermography is strongly affected by emissivity and reflected radiation. Marinetti and Cesaratto [
26] proposed an emissivity estimation method for accurate quantitative thermography and discussed the differentiated influence of emissivity and surrounding temperature on measurement accuracy. Shen et al. [
27] further analysed the influence of surface emissivity on the accuracy of infrared thermal imaging under non-steady temperature field conditions. External factors such as ambient temperature, relative humidity, working distance and viewing angle were also investigated by Mazdeyasna et al. [
28], who showed that environmental control and the use of a stable external reference source can significantly improve temperature measurement reliability.
1.3. Influence of Measurement Distance
One of the practical problems in infrared temperature measurement is the selection of a suitable distance between the infrared thermal camera and the measured object. The distance affects the size of the measured area projected onto the camera detector. At very short distances, focusing limitations, optical geometry, non-uniform field coverage, and partial observation of the reference surface may influence the measured value. At larger distances, the measured spot covers a larger physical area, and the number of detector pixels representing the target may change. If the blackbody does not sufficiently fill the measurement area, the camera may also include surrounding regions in the evaluated temperature.
The measurement distance is therefore closely related to the field of view, spatial resolution, spot size, and optical properties of the infrared thermal camera. Even when the same blackbody reference temperature is used, the indicated temperature may vary with distance. This means that the camera-to-object distance can become a significant source of measurement uncertainty.
The influence of measurement distance has been identified as an important factor in infrared temperature measurement. Chrzanowski [
29] analysed the influence of the object–system distance on the accuracy of remote temperature measurement and showed that distance-related errors can be significant. Zhang et al. [
30] later proposed a method for reducing the influence of measuring distance on infrared thermal imager accuracy and experimentally verified it using a blackbody source at different distances. In another experimental study, Zhang et al. [
31] investigated the effects of measurement distance, measurement angle and working time using a blackbody furnace and an infrared thermal imager. These studies support the need to experimentally evaluate the camera-to-blackbody distance for the investigated measurement configuration.
For this reason, the selection of an appropriate measurement distance is an important part of infrared thermal camera validation. In the present study, the influence of distance between the infrared thermal camera and the blackbody calibrator is investigated experimentally. The objective is to determine how the measurement deviation changes with distance and to identify the distance at which the infrared thermal camera provides the smallest error with respect to the blackbody reference temperature.
1.4. Organization of Rest of the Paper
The rest of the paper is organized as follows.
Section 2 describes the blackbody reference source, the OIML R 141 verification framework, the experimental setup, the video-based data acquisition method and the evaluation metrics.
Section 3 presents the experimental results, including the influence of measurement distance, quasi-static measurement error, comparison with manual calibration, dynamic response and repeatability.
Section 4 discusses the main methodological contributions of the work.
Section 5 summarizes the conclusions and outlines possible directions for future research.
2. Materials and Methods
2.1. Blackbody as a Reference Source
A blackbody calibrator (
Figure 1) is commonly used as a reference source for infrared temperature measurements. In practice, it is not an ideal blackbody, but it is designed to approximate blackbody behaviour as closely as possible. It usually consists of a temperature-controlled radiating surface or cavity with high and known emissivity. The device maintains a defined reference temperature, which is displayed on its control unit and used as the reference value for comparison with the infrared thermal camera reading (
Figure 1).
The advantage of using a blackbody calibrator is that it provides a stable and reproducible thermal radiation source. Since its emissivity and temperature are known, it allows the measurement error of the infrared thermal camera to be evaluated under controlled conditions. During calibration or verification, the infrared thermal camera is aimed at the blackbody surface, and the temperature indicated by the infrared thermal camera is compared with the reference temperature of the blackbody. The difference between these two values represents the measurement deviation or error.
The temperature indicated by the controller display of the blackbody calibrator was used as the reference temperature in this study. This displayed value represents the temperature controlled by the internal regulation system of the calibrator and is intended by the manufacturer for the verification of infrared thermographic instruments. To support the reliability of this reference value, the calibrator was additionally checked using a contact thermometer inserted into the measurement port located in the upper part of the calibrator body. This port allows the temperature of the calibrator to be independently compared with the controller display indication. The observed difference between the contact thermometer reading and the blackbody controller indication was below ±0.5 °C. This value is consistent with the manufacturer-specified blackbody accuracy used in the uncertainty interpretation of the experiment.
It should be noted that the contact thermometer check verifies the temperature indication of the blackbody calibrator at the dedicated measurement port. It does not provide a full spatial mapping of the radiance temperature over the entire emitting aperture. However, the blackbody calibrator was used under stabilized laboratory conditions and within its specified operating range. The emitting aperture was assumed to provide a sufficiently uniform high-emissivity reference surface for the purpose of the comparative evaluation performed in this study.
2.2. Reference Standard and OIML R 141 Framework
The verification and calibration of thermographic instruments can be performed according to the International Recommendation OIML R 141, Edition 2008 [
1], which provides guidance for the metrological evaluation of such devices. The existence of such recommendations is important not only for official verification procedures, but also for companies and institutions using thermographic instruments in practical applications. These organizations should implement internal procedures for checking the performance of their instruments in order to maintain the reliability of temperature measurements over time [
1].
According to OIML R 141 [
1], the verification of a thermographic instrument includes the determination of selected metrological characteristics. These characteristics describe the accuracy, stability and response behaviour of the instrument under defined measurement conditions. Therefore, the verification process can be divided into several evaluation steps. In the process of verification, the following metrological characteristics of a thermographic instrument shall be determined:
- -
Spatial resolution;
- -
Field of view;
- -
Instantaneous field of view;
- -
Accuracy of radiation temperature measurement;
- -
Noise equivalent temperature difference;
- -
Number of damaged sensitive elements;
- -
Sensitivity to non-uniformity in the field;
- -
Influence of environmental conditions on the performance of the instrument; and
- -
Repeatability of the thermographic instrument readings.
In the following part of the study, attention is focused on the determination of the accuracy of radiation temperature measurement and the repeatability of the thermographic instrument readings. The measurement error is evaluated as the difference between the reference temperature provided by the blackbody source and the temperature indicated by the infrared thermal camera.
The repeatability of the thermographic instrument readings is evaluated by repeated observation of the indicated temperature at selected constant blackbody temperature levels. The aim of this evaluation is to determine the temporal stability of the temperature indication under defined measurement conditions.
The verification and calibration process of an infrared thermal camera should be performed in an indoor environment with an ambient temperature in the range of 20 °C to 25 °C and a relative humidity between 40% and 80%.
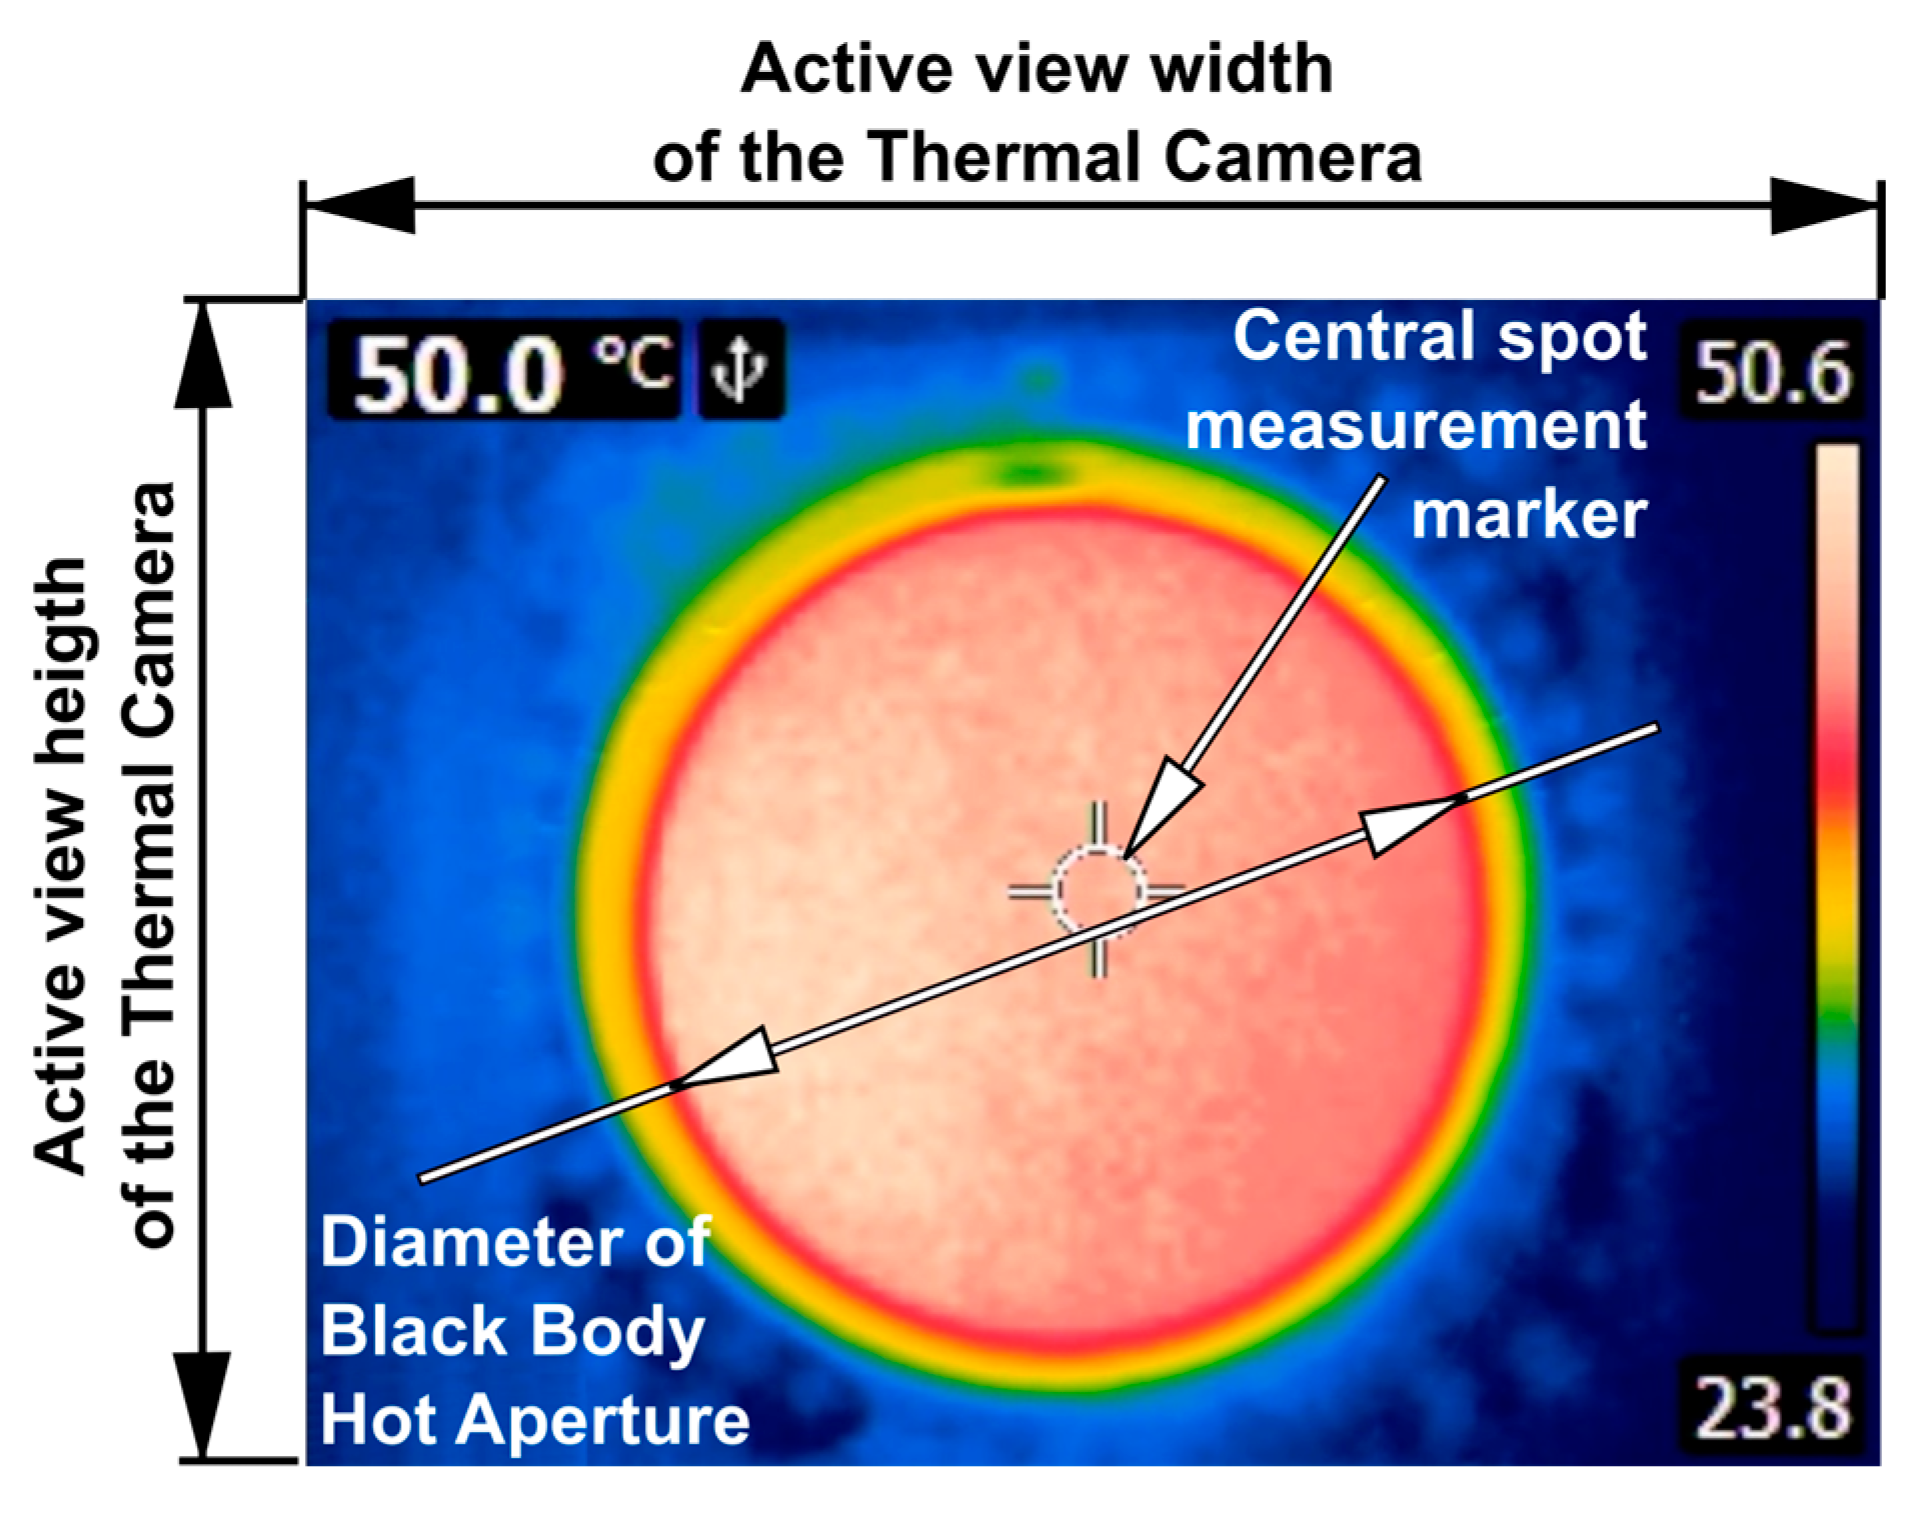
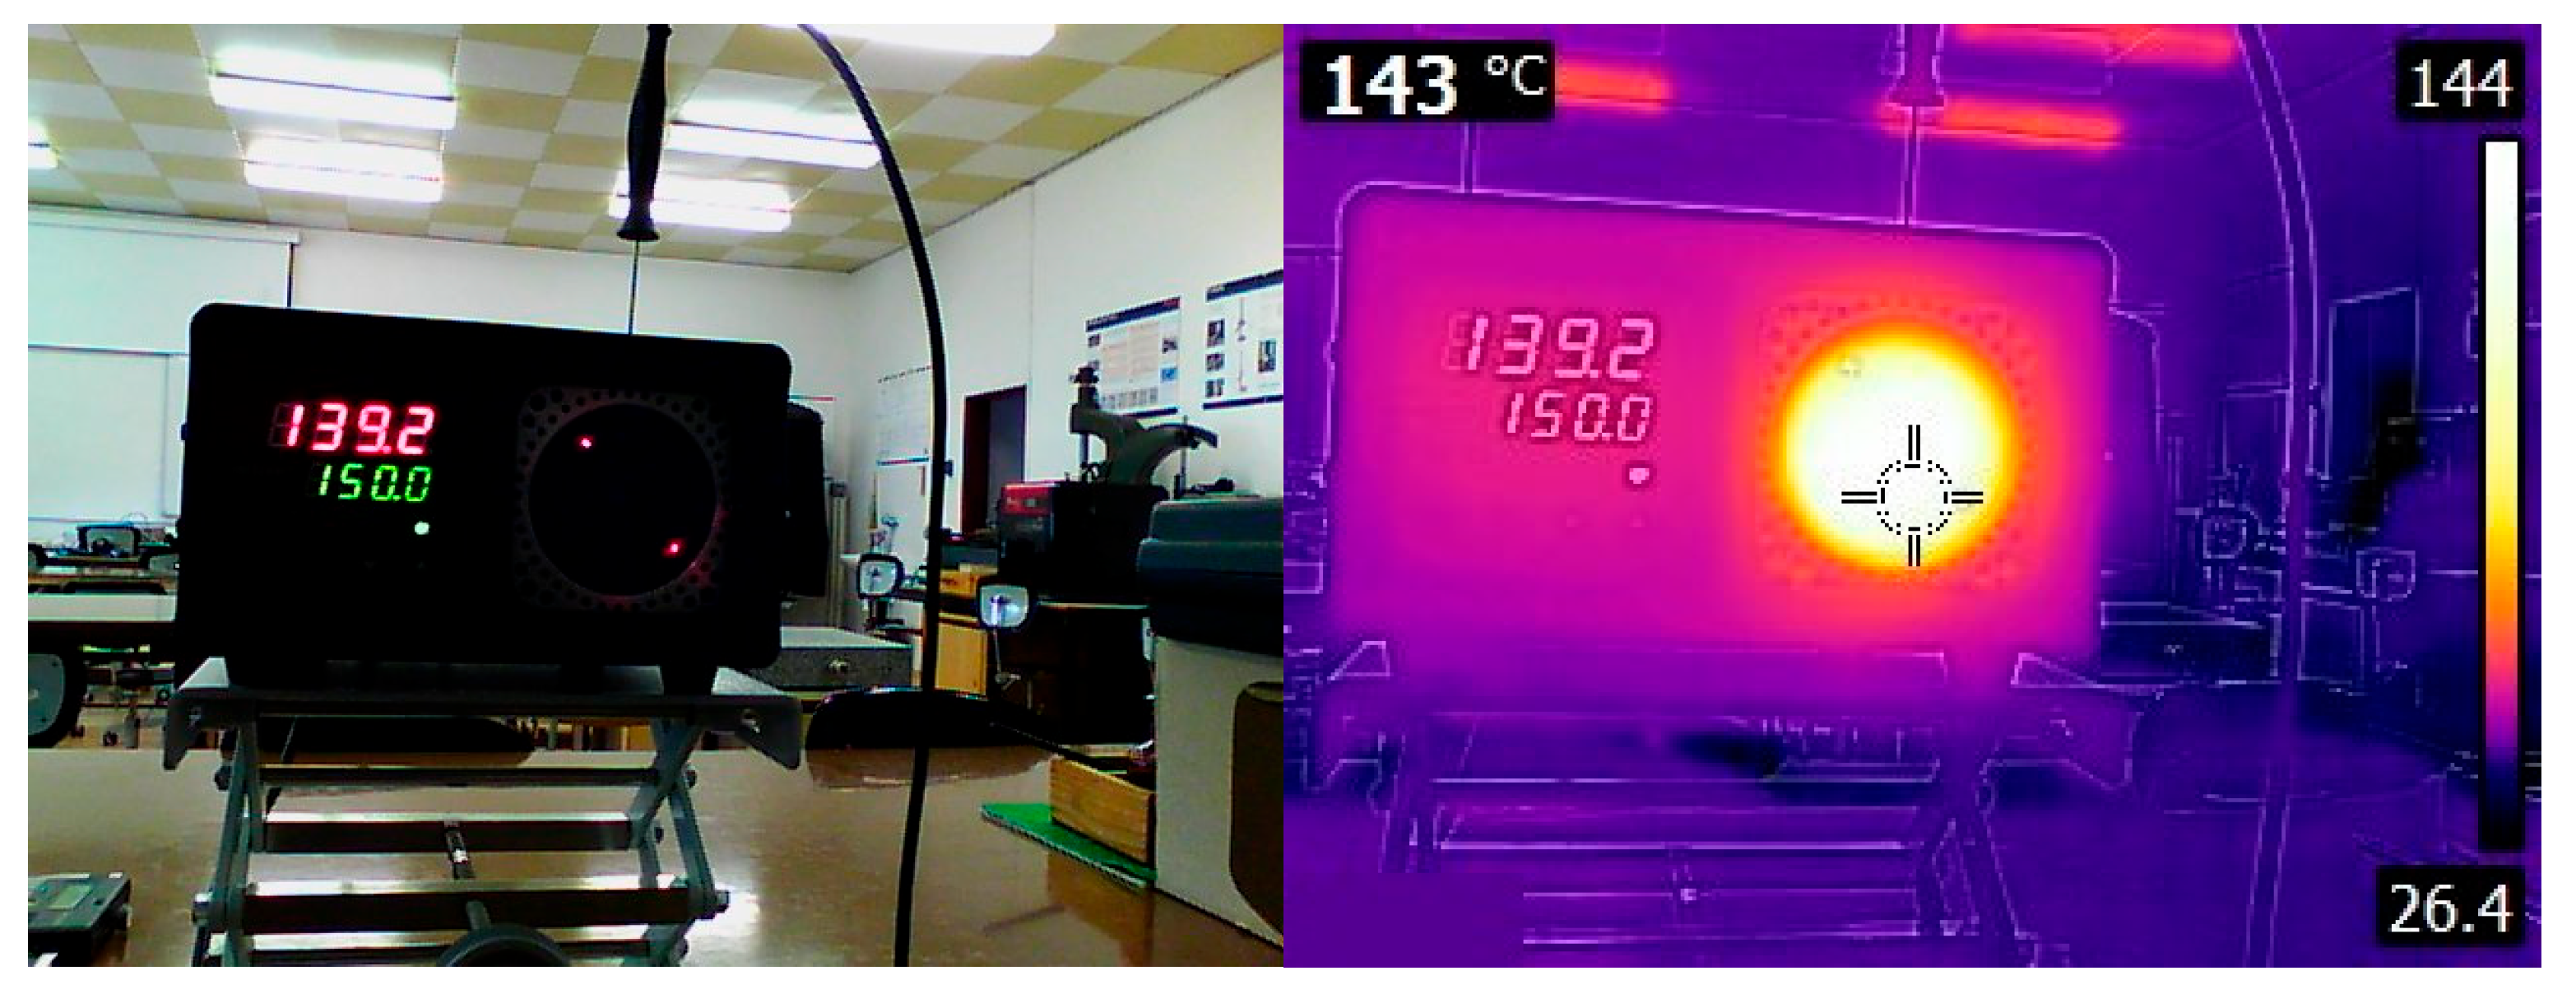
The measurement should be carried out at such a distance between the thermographic instrument and the reference radiator, i.e., the blackbody source, that at least 20% of the display area of the thermographic instrument is covered by the aperture of the reference radiator (
Figure 2). The emitting surface of the reference radiator should be positioned in the centre of the thermographic instrument display area.
For the investigated configuration of the infrared thermal camera and the blackbody reference source, this coverage condition was achieved at a mutual distance of 100 mm. However, this distance satisfies only the minimum geometrical coverage requirement and does not necessarily represent the optimal measurement configuration with respect to accuracy.
According to OIML R 141 [
1], the determination of the accuracy of radiation temperature measurement should be performed at no fewer than five temperature points within the operating temperature range of the thermographic instrument. These points should include the lowest and highest measurable values of the measurement range and three additional values distributed within the range. At least five repeated measurements should be carried out at each selected temperature point. The emissivity of the measured surface of the blackbody reference source must also be taken into account [
1].
The thermographic instrument can be considered compliant if the determined measurement error is lower than the maximum permissible error (MPE) specified by the manufacturer.
The values obtained from repeated measurements can also be used to determine the repeatability of the thermographic instrument readings. For this purpose, according to OIML R 141, a set of measurements should be performed at a selected temperature. The temperature indicated by the thermographic instrument should be recorded every 10 to 15 s over a period of 15 min. From the measured data, the mean temperature values are determined for three consecutive 5 min intervals. The difference between the lowest and highest of these mean values must not exceed the temperature repeatability specified in the instruction manual or in the certificate of the thermographic instrument [
1].
Since neither the blackbody calibrator nor the evaluated infrared thermal camera provides a function for continuous data acquisition, it was necessary to supplement the recommended procedure with a suitable data acquisition method. For this reason, a video-based recording and image-processing approach was proposed in this study. This method enables the temperature values displayed by both instruments to be extracted from video records and subsequently processed quantitatively. In this way, the evaluation process of the infrared thermal camera can be simplified and extended without requiring direct digital communication with the measuring instruments.
2.3. Experimental Setup
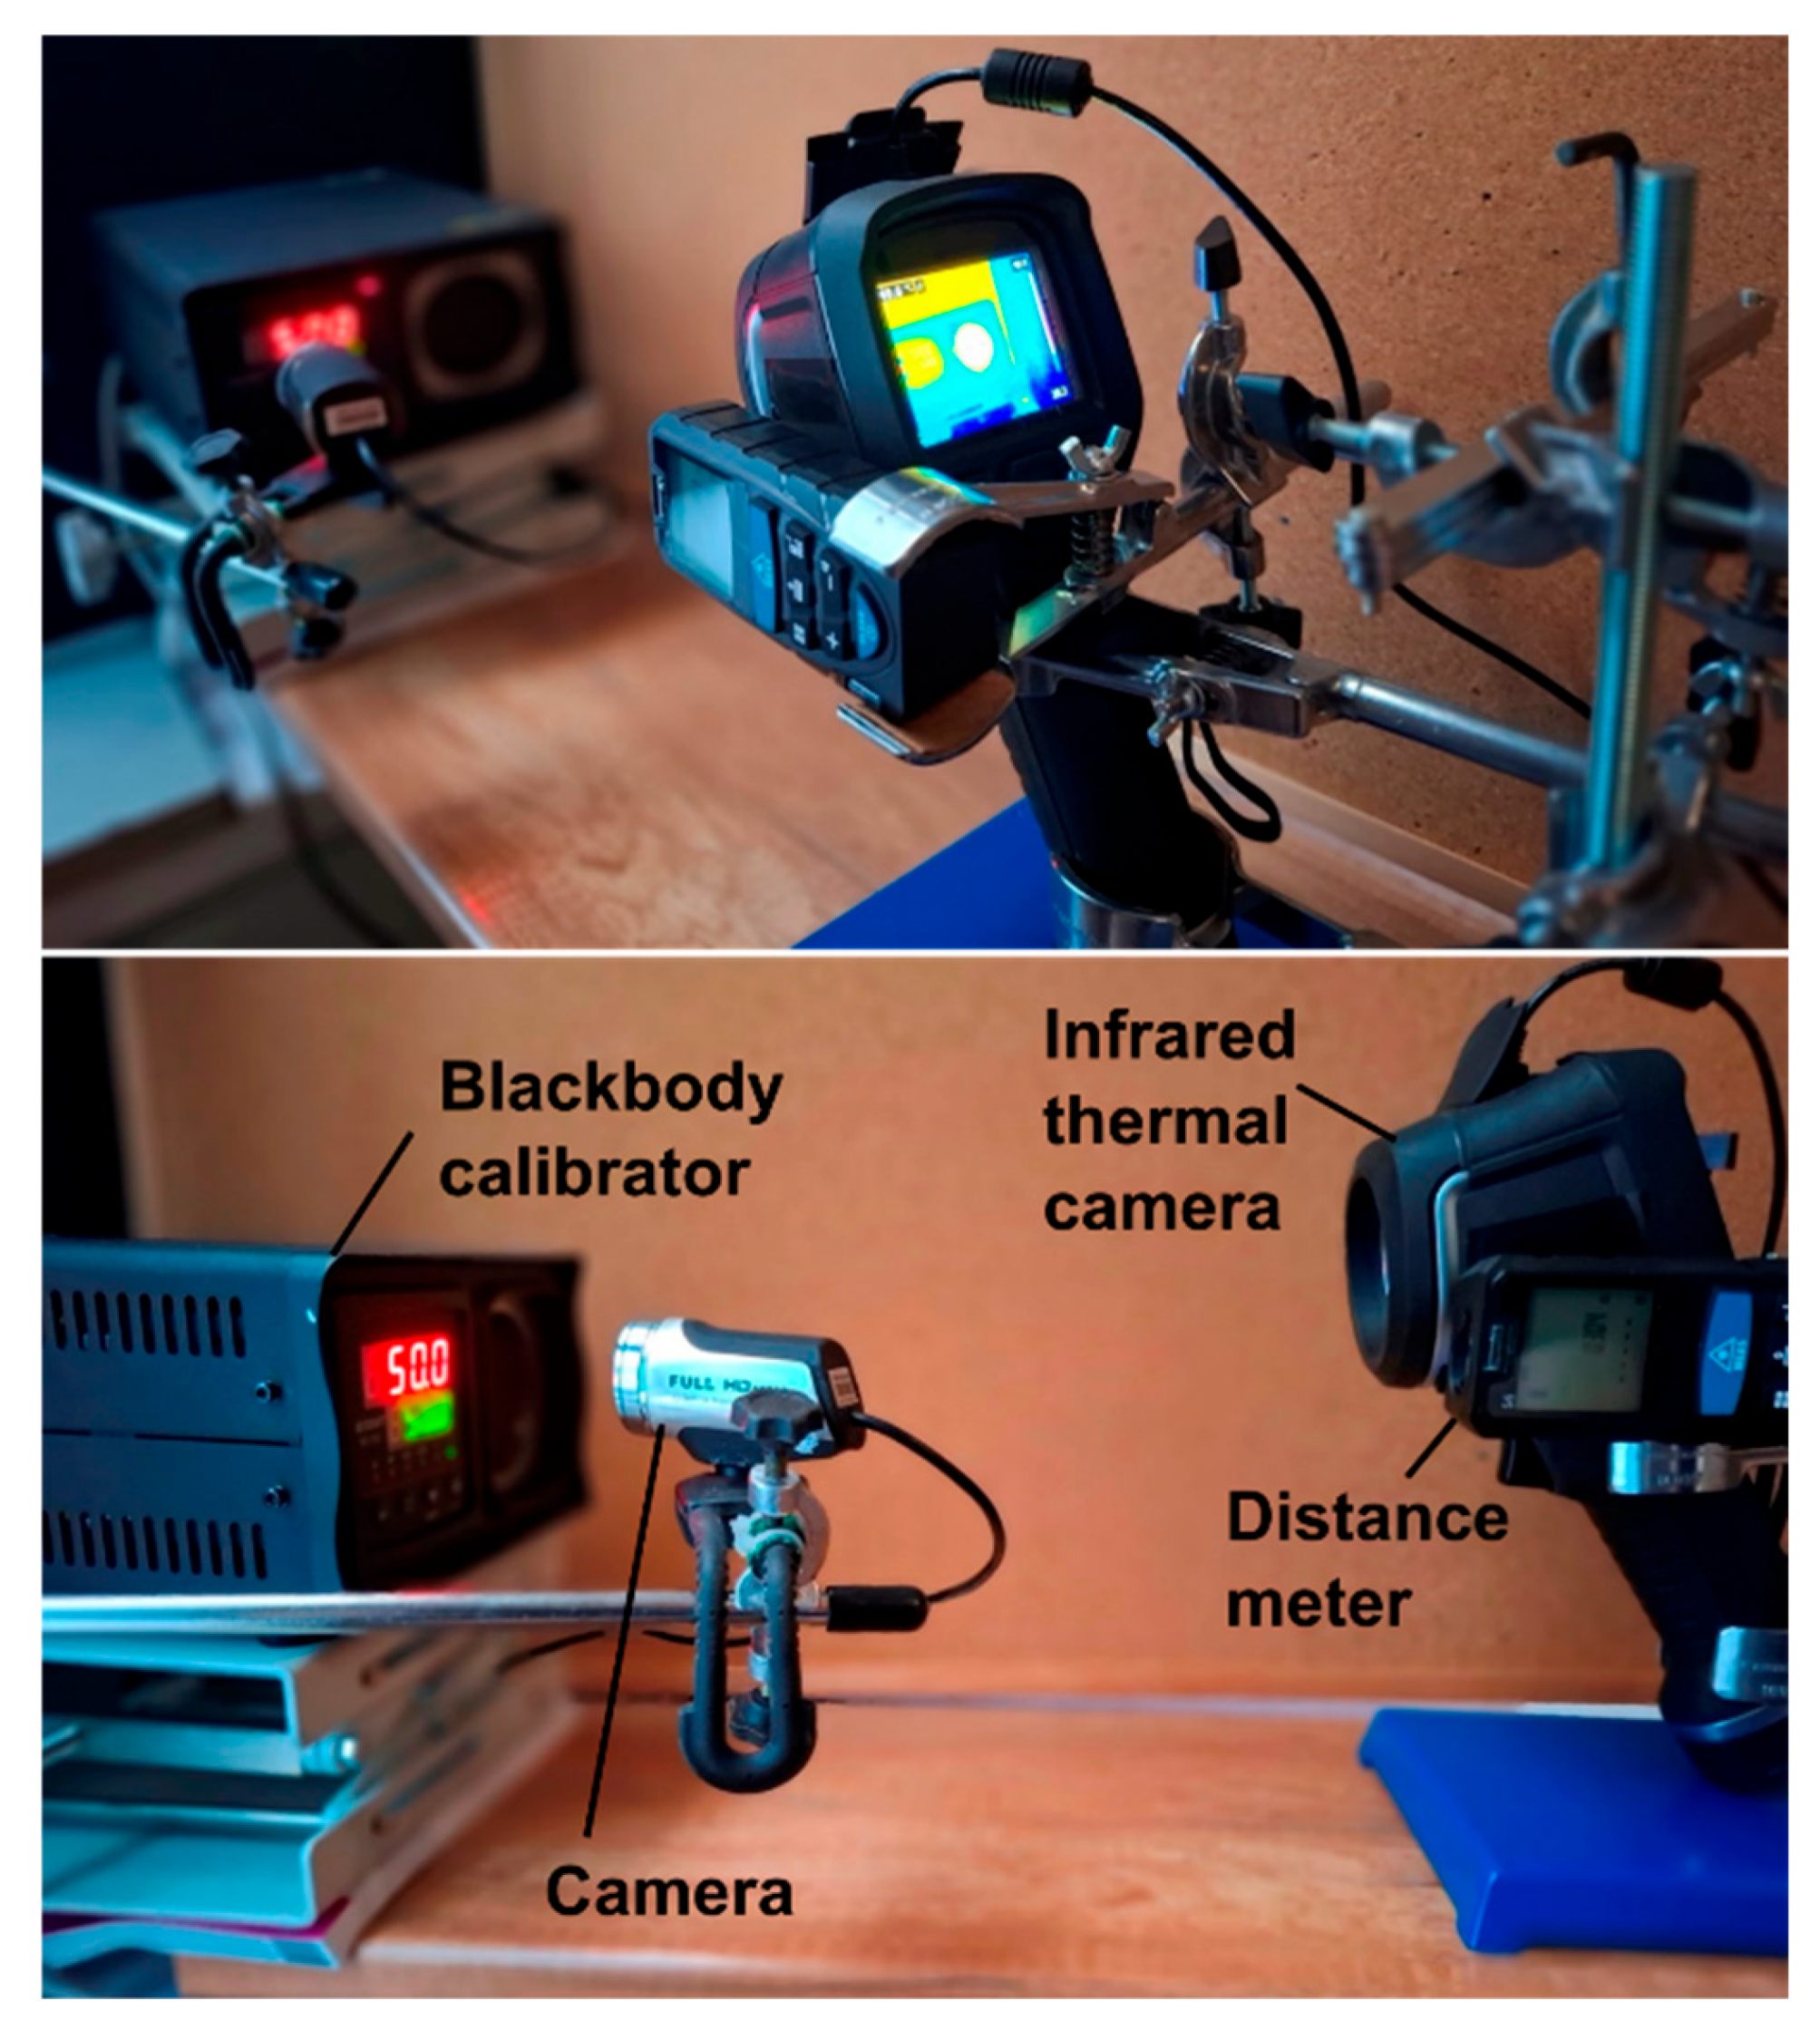
The experimental setup (
Figure 3) was designed to evaluate the measurement behaviour of an infrared thermal camera using a blackbody reference source. The blackbody calibrator was used as the reference radiation source, while the evaluated infrared thermal camera was positioned in front of the heated aperture of the blackbody. The camera was aimed at the centre of the emitting surface in order to ensure that the reference source was located in the central part of the camera field of view.
The evaluated infrared thermal camera was a commercial handheld long-wave infrared thermographic instrument, anonymized in this manuscript as Infrared Thermal Camera. The manufacturer and model designation were not disclosed in the manuscript because the purpose of the study was not to assess, promote or compare a specific commercial product, but to demonstrate a video-based methodology for experimental performance evaluation when direct digital data output is not available. To preserve reproducibility, all measurement-relevant technical parameters of the camera, including detector type, infrared resolution, spectral range, field of view, IFOV, measurement range, accuracy specification and radiometric compensation settings, are provided in
Table 1.
The verification was performed under indoor laboratory conditions. Experimental setup parameters are listed in
Table 1 and
Table 2. The arrangement followed the general geometrical requirement that the aperture of the reference radiator should cover a sufficient part of the thermographic instrument display area and should be positioned approximately in the centre of the image. For the investigated combination of the infrared thermal camera and blackbody source, the minimum geometrical coverage condition was achieved at a distance of 100 mm. However, this distance was treated only as the minimum distance satisfying the coverage requirement and not as the optimal distance for measurement accuracy.
The experimental work consisted of several measurement stages. In the first stage, manual measurements were performed in order to evaluate the influence of the distance between the blackbody source and the infrared thermal camera. The blackbody temperature was gradually set to ten selected temperature levels: 50 °C, 75 °C, 100 °C, 125 °C, 150 °C, 175 °C, 200 °C, 225 °C, 250 °C, and 275 °C. For each temperature level, measurements were carried out at different camera-to-blackbody distances: 100 mm, 200 mm, 300 mm, 600 mm, 900 mm, 1200 mm, 1500 mm, 1800 mm, 2100 mm, 2400 mm, 2700 mm, and 3000 mm. At each combination of temperature and distance, the system was allowed to stabilize, and ten repeated readings of the camera indication were manually recorded.
The experiments were performed in an air-conditioned indoor laboratory room, not in a clean-room environment. The ambient temperature was maintained at 22 ± 1 °C and the relative humidity was within 50 ± 10% during the measurements. The room was shaded and the illumination was kept low and stable in order to minimize reflections from the camera display and the blackbody surface. Direct solar radiation and strong external heat sources were excluded from the measurement area. No intentional airflow was directed towards the blackbody aperture or the infrared thermal camera. These conditions were selected to reduce the influence of environmental disturbances on both the blackbody reference source and the displayed temperature indication of the camera.
The radiometric compensation parameters of the evaluated infrared thermal camera were set before the experiments and kept constant or adjusted according to the measurement configuration. The emissivity setting of the infrared thermal camera was set to 0.95, corresponding to the manufacturer-specified emissivity coefficient of the blackbody reference source. This value was treated as the effective emissivity of the blackbody calibrator within the long-wave infrared spectral range of the camera. A separate spectral emissivity curve of the blackbody source was not available from the instrument documentation; therefore, the blackbody reference source was assumed to behave as a greybody source in the investigated spectral range.
The reflected apparent temperature compensation of the infrared thermal camera was set to 22 °C, corresponding approximately to the ambient laboratory temperature. The atmospheric temperature during the experiments was 22 ± 1 °C and the relative humidity was 50 ± 10% RH. The measurement distance compensation was also available in the camera menu; however, it could be entered only in integer metre values. Therefore, for each measurement configuration, the nearest available distance setting in metres was used. For the quasi-static, dynamic response and repeatability experiments performed at the physical distance of 900 mm, the distance compensation was set to 1 m.
The evaluated infrared thermal camera operates in the long-wave infrared spectral range of 7.5–13 µm. The full normalized spectral response curve of the camera was not available from the manufacturer documentation. Therefore, the spectral behaviour of the system was considered on the basis of the manufacturer-specified operating wavelength range. All results presented in this study therefore correspond to the displayed temperature indication of the complete thermographic instrument under the specified radiometric compensation settings.
The accuracy of the evaluated infrared thermal camera was considered according to the manufacturer’s specification, which defines the permissible measurement error as ±2 °C or ±2% of the reading, whichever is greater. In this study, this specification was used as the maximum permissible error (
MPE) for the graphical evaluation of the measured errors. The
MPE is commonly used as an acceptance limit in the assessment of measuring instruments and represents the maximum error permitted by the specification for the given measurement conditions. The corresponding
MPE limit expressed in degrees Celsius was calculated as:
where
T denotes the blackbody reference temperature used for graphical comparison. Therefore, the
MPE is equal to ±2 °C up to 100 °C and increases according to the ±2% criterion at higher temperatures.
For graphs expressed as relative temperature error, the same manufacturer specification was converted into relative form as
This means that the relative MPErel is higher than ±2% at lower temperatures, because the absolute component of ±2 °C dominates in this region. At temperatures of 100 °C and above, the relative MPErel is equal to ±2%. These MPErel limits were plotted in the corresponding graphs to indicate whether the evaluated infrared thermal camera remained within the manufacturer-declared accuracy limits.
It should be noted that the MPE and MPErel curves shown in the figures (as red double line) represent acceptance limits derived from the manufacturer’s declared accuracy specification, not experimentally measured data.
2.4. Video-Based Data Acquisition and Image Processing for Evaluation of Accuracy and Repeatability
A direct digital output would be the preferred solution for data acquisition if it were available. However, in the investigated configuration, neither a synchronized digital output of the blackbody controller display nor a direct digital output of the displayed camera temperature indication was available for continuous acquisition. Therefore, an external video-based acquisition method was used. This approach enabled simultaneous recording of the blackbody reference indication and the infrared thermal camera indication without modifying the instruments or requiring access to internal camera data, SDK functions or proprietary communication protocols.
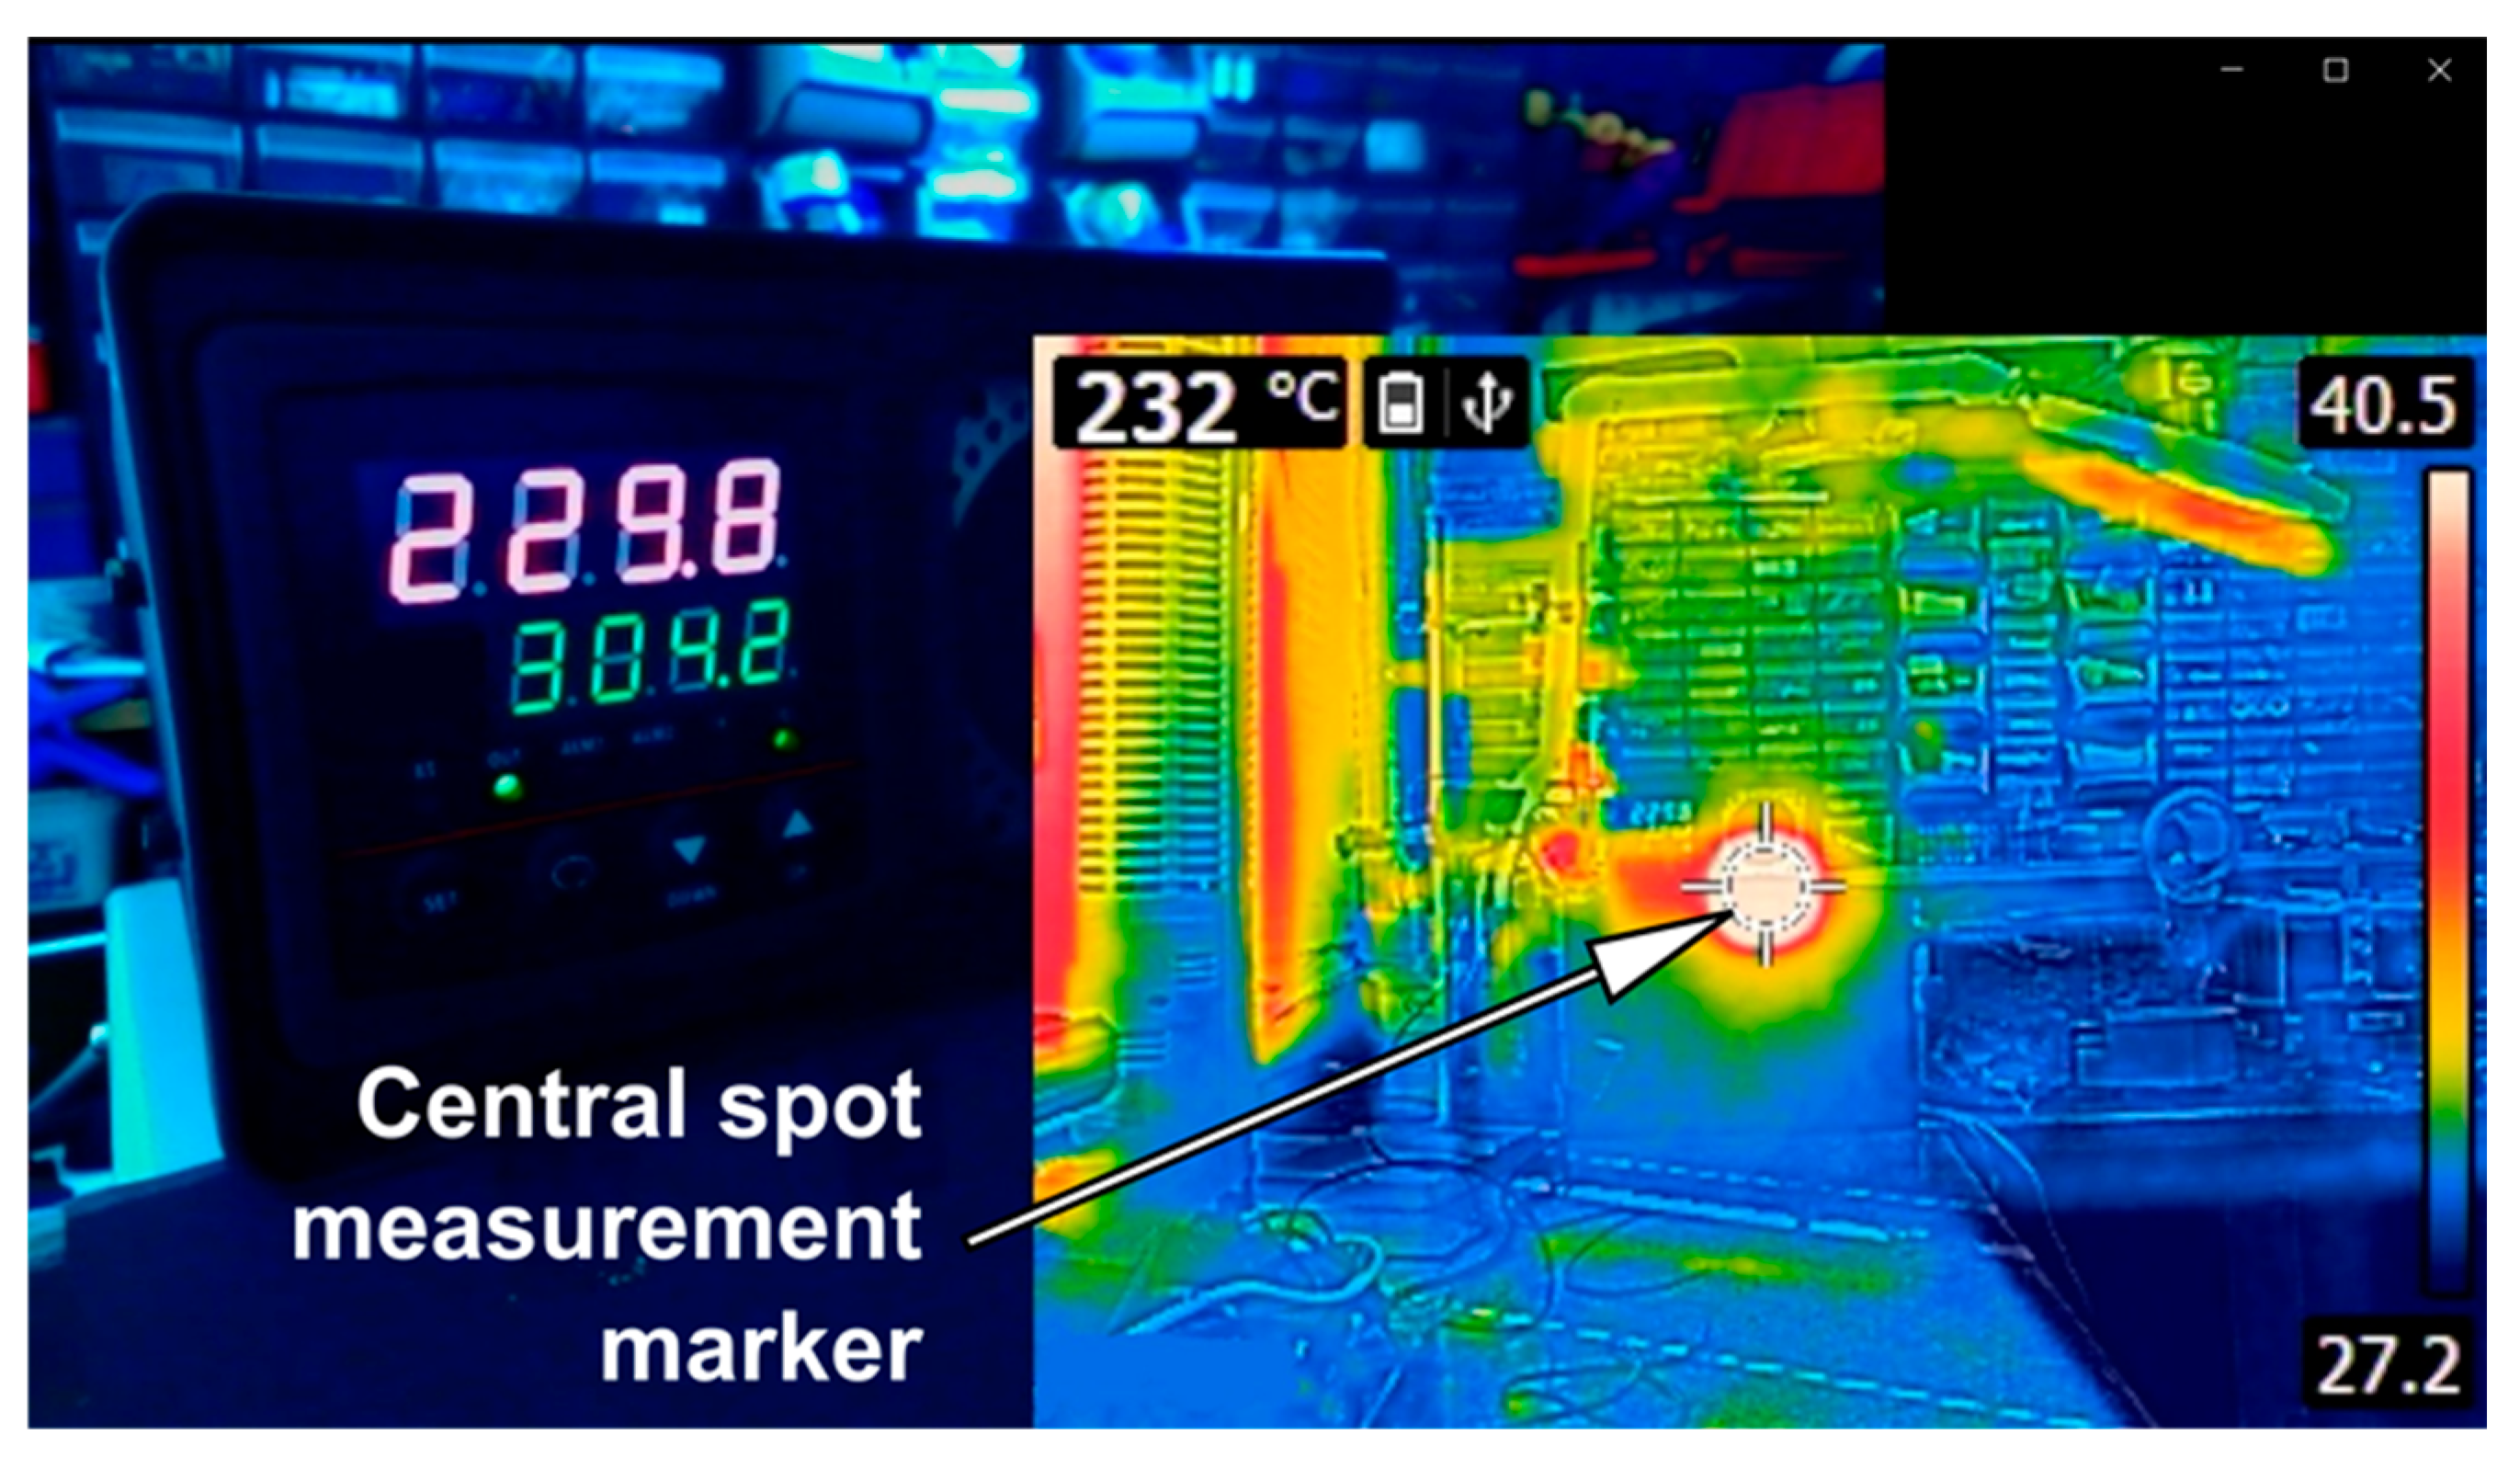
For the purpose of subsequent image-based evaluation, a combined video record (
Figure 4) was prepared. It consisted of a synchronized composition of the video recording of the blackbody calibrator display and the video output from the evaluated infrared thermal camera. This arrangement enabled simultaneous visual recording of the reference temperature and the temperature indicated by the thermographic instrument, which was necessary for subsequent extraction and comparison of both temperature values.
Calibration data were extracted from video recordings of the evaluated infrared thermal camera and the blackbody calibrator. The video was processed at a nominal sampling interval of 1 s. For each sampling instant, five neighbouring frames were analysed. These frames consisted of the central frame corresponding to the sampling instant, two preceding frames and two following frames. For a video frame rate of 30 fps, this corresponds to a short temporal window of approximately ±0.067 s around each sampling instant. This window was sufficiently short compared with the slow quasi-static heating rate and therefore did not noticeably distort the temperature-dependent error curve. For each of the five frames, the blackbody display and the infrared camera display were processed independently. The numerical values extracted from valid frames were first checked for readability and physical plausibility. Invalid readings, unreadable digits, out-of-range indications and inconsistent OCR results were rejected. The representative value for the given sampling instant was then calculated as the median of the valid numerical readings. The median was used instead of the arithmetic mean because it is less sensitive to isolated recognition artefacts caused by display flickering, incomplete digit visibility or reflections.
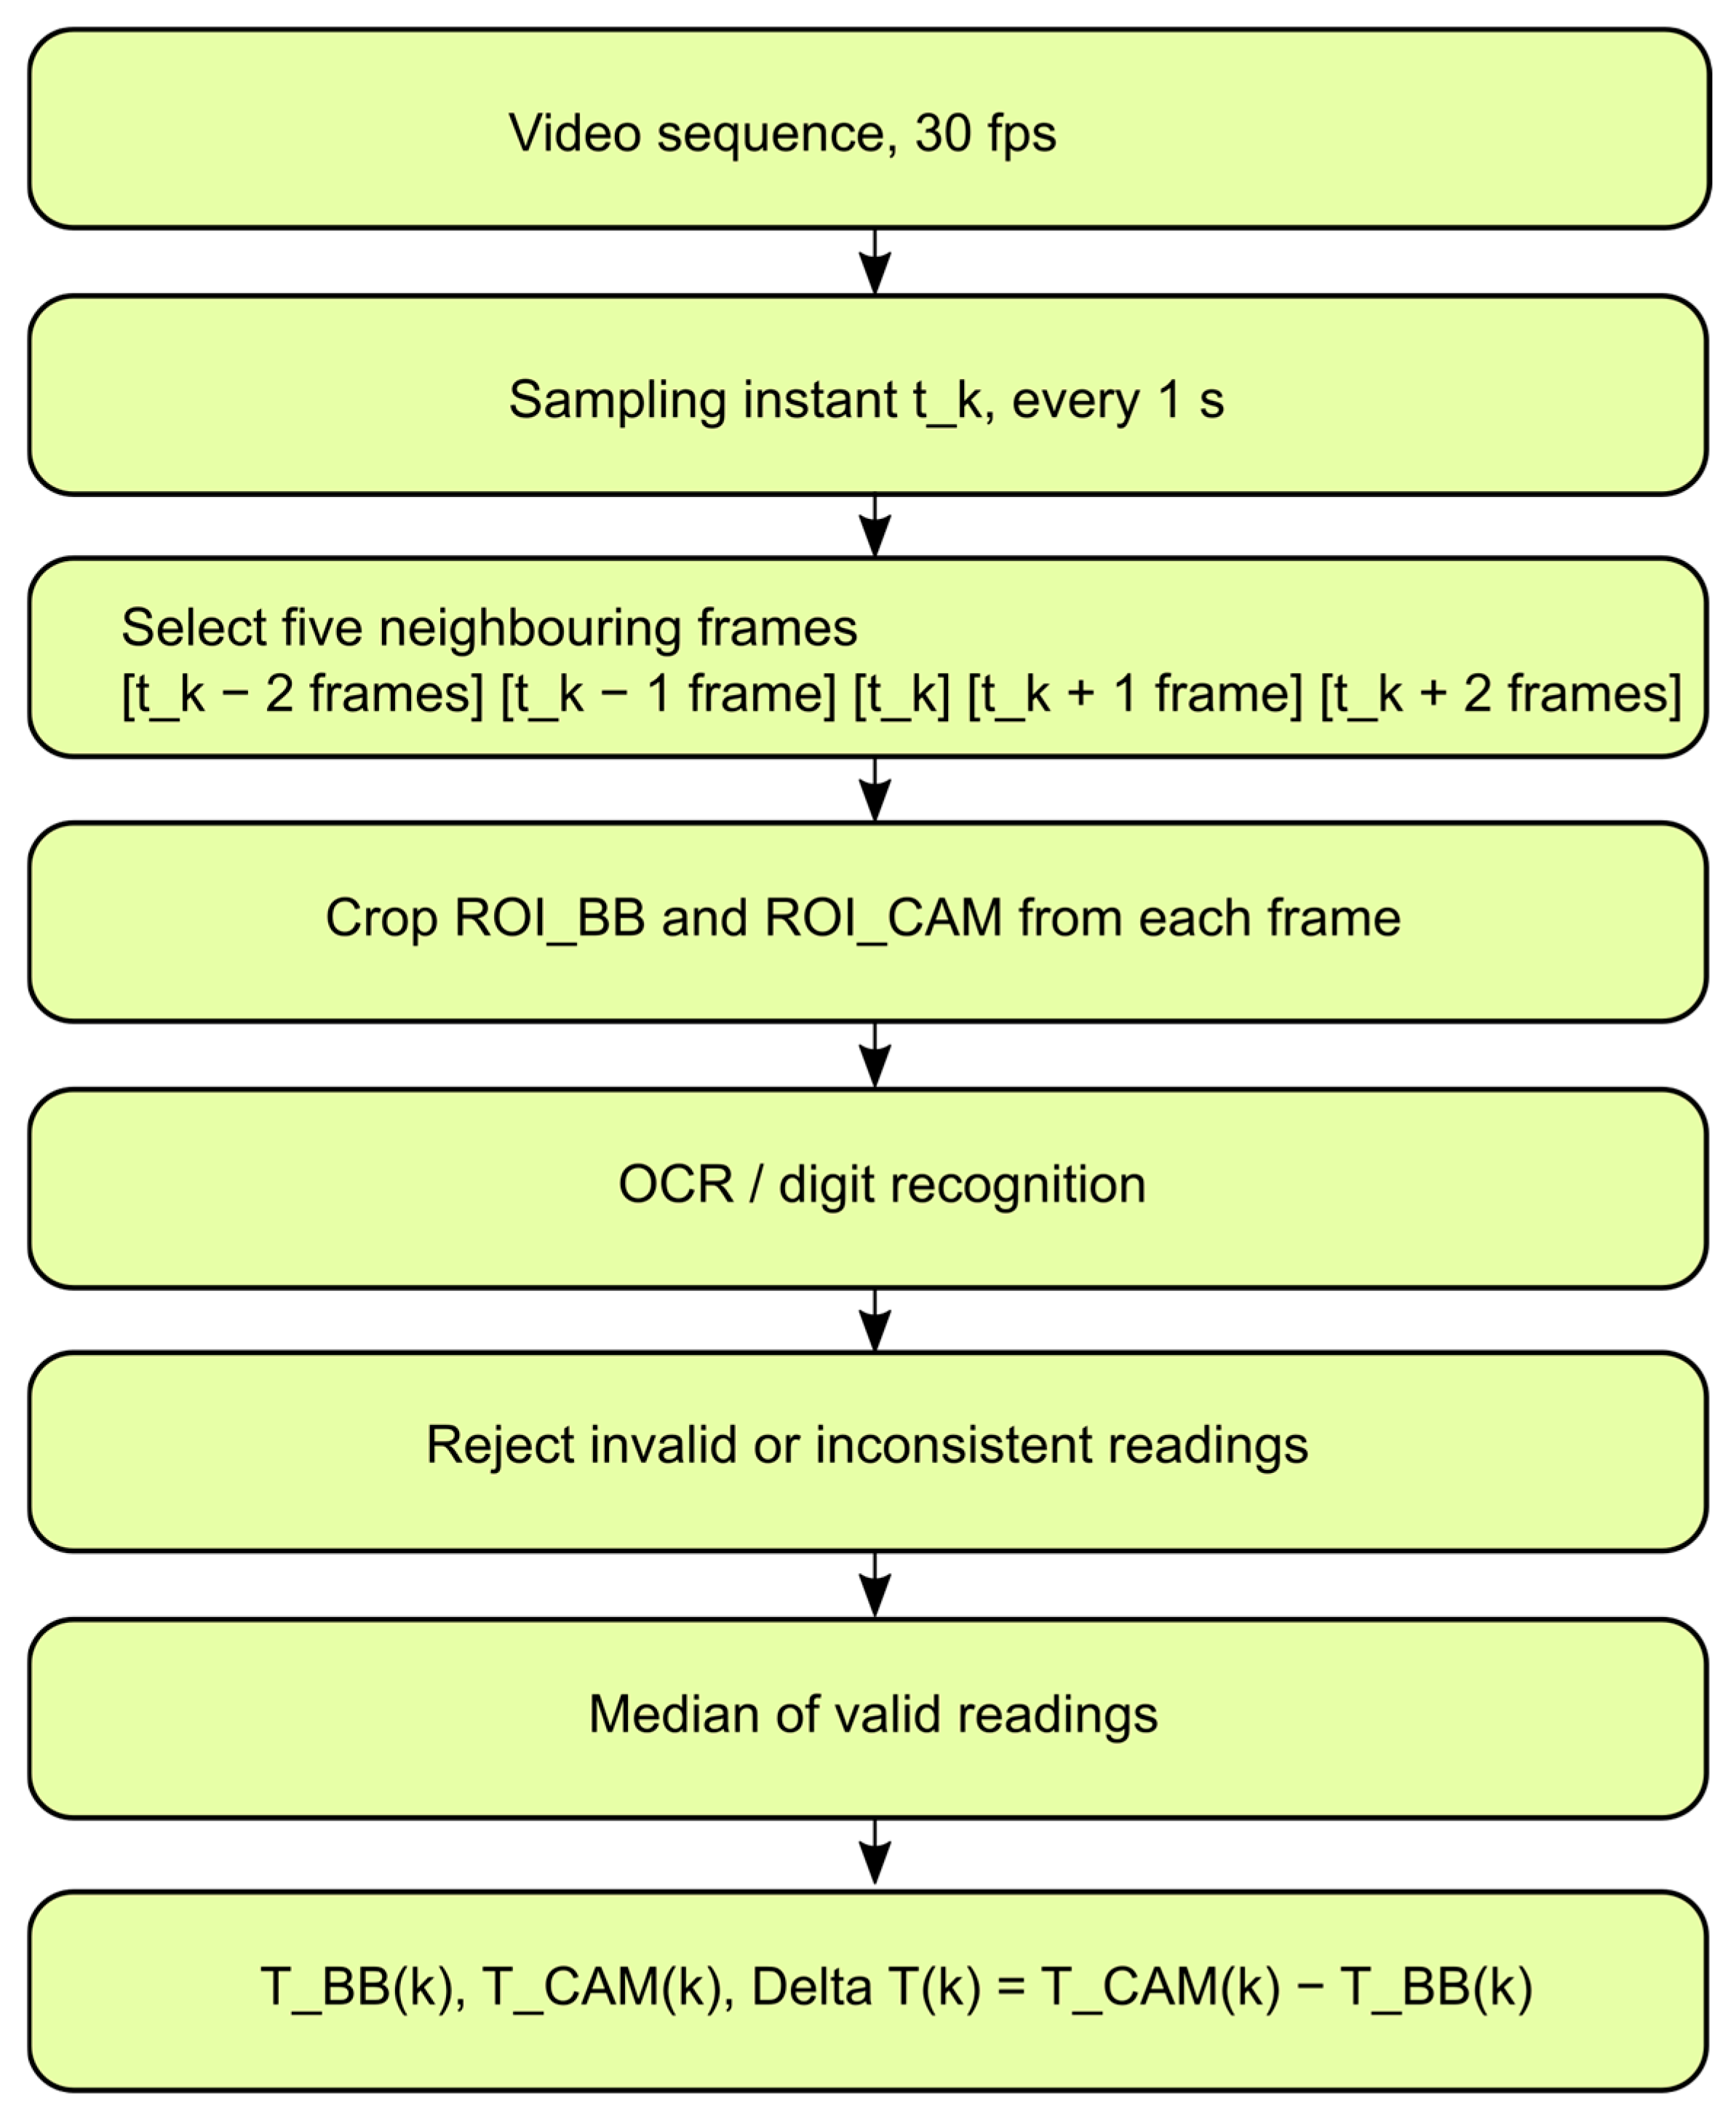
To clarify the robust extraction procedure, the multi-frame processing step is illustrated schematically in
Figure 5. The diagram shows how one representative temperature sample is obtained for a single 1 s sampling instant. Instead of relying on only one video frame, five neighbouring frames are analysed around the selected sampling time. The blackbody display and the infrared camera display are processed separately in each frame, invalid or inconsistent readings are rejected, and the representative temperature values are obtained as the median of the valid readings. This procedure increases the robustness of the video-based extraction against short-term recognition errors, display flickering and local image artefacts.
For every sampled frame, two fixed regions of interest were analyzed: the red digital display of the blackbody calibrator and the temperature readout displayed by the infrared thermal camera in the upper-left part of the screen (
Figure 4). After contrast enhancement and region-specific preprocessing, the displayed values were extracted using digit/text recognition. When the infrared thermal camera readout exceeded its directly displayed range and showed the symbol “>280”, the corresponding numeric value was treated as unavailable and the temperature difference was not computed. For all valid numeric samples, the difference between the infrared thermal camera reading and the Blackbody reference was calculated. The extracted data were stored in CSV format for subsequent analysis.
The detailed video-processing procedure (Algorithm 1) can be described in several steps.
The purpose of the procedure is to extract a time-resolved comparison between two temperature readings recorded in a calibration video, because direct digital data output from the instruments was not available. The video contains:
- (i)
The reference temperature displayed by the blackbody calibrator;
- (ii)
The temperature value displayed by the infrared thermal camera.
The final output is a dataset sampled at 1 s intervals. This dataset is used for the subsequent quantitative evaluation of the temperature deviation between the infrared thermal camera indication and the blackbody reference temperature.
- 2.
Video inspection and region selection
Before automated extraction, each video recording is visually inspected at several representative timestamps. This confirms that both numerical indicators are visible during the experiment and allows the relevant regions of interest to be defined.
Two fixed regions of interest are selected:
Using fixed regions of interest reduces the probability of false recognition from irrelevant parts of the image and ensures that the same image areas are processed throughout the entire video.
- 3.
Robust multi-frame sampling
The video is processed at a nominal sampling interval of 1 s. For each sampling instant, five neighbouring video frames are analysed. These frames consist of the central frame corresponding to the sampling instant, two preceding frames and two following frames. At a video frame rate of 30 fps, this corresponds to a short temporal window of approximately ±0.067 s around each sampling instant.
This multi-frame approach is used to reduce the influence of temporary recognition errors, display flickering, incomplete digit visibility, reflections or short-term image artefacts. The selected time window is short compared with the 1 s sampling interval and with the slow quasi-static heating process. Therefore, it improves the robustness of the extracted numerical values without introducing significant temporal smoothing of the temperature curve.
- 4.
Image preprocessing
For each selected frame, the two regions of interest are cropped and preprocessed before numerical recognition.
For the blackbody calibrator display, preprocessing is focused on improving the visibility of the digital digits. This includes contrast enhancement, background suppression, colour-based enhancement of the display digits, thresholding and optional image enlargement.
For the infrared thermal camera readout, preprocessing is focused on improving the readability of the displayed temperature text. This includes contrast enhancement, image enlargement and isolation of the text region.
These preprocessing steps improve the reliability of subsequent digit recognition or optical character recognition.
- 5.
Numeric extraction from individual frames
After preprocessing, the cropped regions are processed using digit recognition or optical character recognition.
From the blackbody calibrator display, the recognized text is converted into a numerical reference temperature candidate.
From the infrared thermal camera display, the recognized text is converted into a numerical camera temperature candidate, except in cases where the display shows an out-of-range indication, such as “>280”, instead of an exact numerical value.
This distinction is important because an out-of-range indication does not represent an exact temperature. It only states that the measured value exceeds the displayed measurement limit.
- 6.
Validation of candidate readings
For each sampling instant, the five extracted blackbody candidates and the five extracted camera candidates are checked for readability and physical plausibility. Unreadable values, non-numeric values and physically implausible values are rejected.
A minimum of three valid readings is required to calculate a representative value for a given sampling instant. If fewer than three valid readings are available for the blackbody display or the camera display, the corresponding value is marked as missing.
The representative blackbody temperature and the representative camera temperature are calculated as the median of the valid candidate readings. The median is used as a robust estimator because it reduces the influence of isolated recognition artefacts caused by display flickering, incomplete digit visibility, reflections or short-term OCR errors.
- 7.
Handling of out-of-range readings
If the infrared thermal camera display contains an out-of-range indication such as “>280”, the value is treated as non-numeric. The original displayed text is preserved as a qualitative indication, while the numerical camera temperature is set as missing.
Consequently, the temperature deviation is not calculated for that sampling instant. This prevents the introduction of false numerical precision and preserves the physical meaning of the displayed out-of-range information.
- 8.
Calculation of temperature deviation
Whenever both the blackbody reference temperature and the infrared thermal camera temperature are available as valid numerical values, the instantaneous temperature deviation is calculated as:
A positive value means that the infrared thermal camera indicates a higher temperature than the blackbody reference. A negative value means that the infrared thermal camera indicates a lower temperature.
- 9.
Cleaning and final validation of the dataset
After the initial extraction, the resulting time series is checked for missing values, invalid readings and isolated recognition artefacts. Samples for which the blackbody reference temperature, the camera temperature or the temperature deviation cannot be reliably determined are marked as invalid.
No statistical outlier removal is applied to the valid continuous temperature-error curve, because local variations in this curve are one of the investigated phenomena. Removing data points only because they deviate from a smoothed trend could suppress relevant local behaviour of the thermographic instrument.
Interpolation is not used for the calculation of MAE, RMSE and Bias. These statistical indicators are calculated only from valid extracted samples. Invalid samples and samples with out-of-range camera indications are excluded from the final statistical evaluation.
- 10.
Table structure and export
The resulting dataset is exported to CSV format. The table contains the sampling time, the representative blackbody reference temperature, the representative infrared camera temperature, the calculated temperature deviation, the original recognized text where relevant, and the sample status.
The sample status indicates whether the sample is valid, invalid due to extraction failure, or invalid due to an out-of-range camera indication. This structure allows the extracted data to be checked and reused for subsequent statistical evaluation and graphical visualization.
| Algorithm 1: Video-based extraction of thermal calibration data |
Input:
V - calibration video recording
d - camera-to-blackbody distance [mm]
dt - sampling interval, dt = 1 s
N - number of analysed frames around each sampling instant, N = 5
M = 2 frames before and 2 frames after the central frame;
n_min = 3 minimum number of valid readings required for a valid sample.
Output:
CSV table containing time, blackbody reference temperature,
infrared thermal camera temperature, temperature deviation and notes
1: for each sampling instant t_k = k · Δt do
2: Determine the central video frame index:
3: f_k = round(t_k · f_v)
4:
5: Initialize empty lists:
6: BB_candidates = []
7: CAM_candidates = []
8: Set CAM_out_of_range = false
9:
10: for j = −M to +M do
11: Select video frame with index:
12: f = f_k + j
13:
14: if frame f exists then
15: Crop ROI_BB from frame f
16: Crop ROI_CAM from frame f
17:
18: Extract numerical value BB_value from ROI_BB
19: Extract numerical value CAM_value from ROI_CAM
20:
21: if BB_value is readable and physically plausible then
22: Append BB_value to BB_candidates
23: end if
24:
25: if CAM_value indicates an out-of-range state then
26: Set CAM_out_of_range = true
27: else
28: if CAM_value is readable and physically plausible then
29: Append CAM_value to CAM_candidates
30: end if
31: end if
32: end if
33: end for
34:
35: if number of values in BB_candidates ≥ n_min then
36: Set T_BB(k) = median(BB_candidates)
37: else
38: Set T_BB(k) = missing
39: end if
40:
41: if CAM_out_of_range = true then
42: Set T_CAM(k) = missing
43: Set ΔT(k) = missing
44: Set sample status = “camera out of displayed range”
45: else
46: if number of values in CAM_candidates ≥ n_min then
47: Set T_CAM(k) = median(CAM_candidates)
48: else
49: Set T_CAM(k) = missing
50: end if
51:
52: if T_BB(k) is valid and T_CAM(k) is valid then
53: Set ΔT(k) = T_CAM(k) − T_BB(k)
54: Set sample status = “valid”
55: else
56: Set ΔT(k) = missing
57: Set sample status = “invalid extraction”
58: end if
59: end if
60: end for
61:
62: Remove samples with missing ΔT(k) from the final statistical evaluation.
63: Calculate MAE, RMSE and Bias from all valid samples. |
Note: ROI denotes Region of interest; BB denotes Blackbody; CAM denotes Infrared thermal camera.
The internal correction state of the evaluated infrared thermal camera was also considered. The camera was operated using its standard internal radiometric correction mode. The emissivity was set to 0.95 and the reflected apparent temperature was set to 22 °C. The measurement distance compensation was set to the nearest available integer value in metres, because the evaluated camera allowed for distance input only in whole metres. The displayed thermal image was recorded by an external video system; therefore, the evaluated temperature values correspond to the displayed temperature indication after the camera’s internal processing and correction.
The camera did not provide a digital log of internal NUC/FFC operations. Therefore, possible internal correction events could not be identified directly from camera metadata. Since raw radiometric detector data and internal event logs were not available, the possible influence of FFC/NUC operations, thermal drift compensation or internal range-related processing cannot be completely separated from the displayed temperature data. This possible influence is therefore considered as one of the limitations of the proposed display-based evaluation method.
The quasi-static continuous heating experiment was performed once at the selected camera-to-blackbody configuration. The purpose of this experiment was not to obtain an averaged calibration curve from repeated long-duration runs, but to acquire a dense temperature-dependent diagnostic error curve after the most suitable measurement configuration had been identified from the preliminary distance-dependent evaluation. Repeating the full five-hour quasi-static experiment several times would substantially increase the time and cost of the proposed verification procedure. Therefore, repeatability was evaluated separately under stable temperature conditions, while the long-duration quasi-static experiment was used to analyse the detailed shape of the displayed temperature error over the investigated temperature range.
No statistical outlier removal was applied to the continuous temperature-error curve, because local variations in the error curve were one of the investigated phenomena. Removing data points solely on the basis of their deviation from a smoothed trend could suppress relevant local behaviour of the thermographic instrument. The data were therefore retained in the analysis unless the video-based extraction produced an invalid reading, such as an unreadable display value, loss of the region of interest, or a non-physical value caused by image-processing failure. In such cases, the affected frame was excluded from the calculation.
2.5. Evaluation Metrics
The extracted temperature data were evaluated using several metrics describing the accuracy, systematic deviation, temporal stability and dynamic response of the infrared thermal camera. Only valid numerical readings were included in the calculations. Samples for which the camera display indicated an out-of-range value, such as “>280”, or samples with unreadable values were excluded from the statistical evaluation.
2.5.1. Temperature Deviation and Relative Error
According to the International Recommendation OIML R 141, the accuracy of an infrared thermal camera is verified by comparing the temperature indication of the thermographic instrument, i.e., the evaluated infrared thermal camera, with the reference temperature provided by the blackbody radiator. The accuracy is expressed as the temperature deviation, or more precisely as the measurement error [
1]:
where
TCAM,i is the temperature indicated by the infrared thermal camera and
TBB,i is the reference temperature of the blackbody calibrator. A positive deviation means that the camera indicates a higher temperature than the reference source, while a negative deviation means that the camera indicates a lower temperature.
The relative error was expressed as a percentage of the blackbody reference temperature:
This representation was used mainly for comparison with the manufacturer-declared maximum permissible error
MPErel. Since the manufacturer specifies the accuracy as maximum permissible error
MPE = ±2 °C or ±2% of the reading, the interpretation of the relative error must take into account both components of this specification. Maximum permissible error
MPE is an extreme value of measurement error, with respect to a known reference quantity value, permitted by specifications or regulations for a given measurement, measuring instrument, or measuring system [
32].
When expressed in relative form, the corresponding permissible limit can be written as
This is particularly important at lower temperatures, where the absolute component of ±2 °C may correspond to a relative value higher than 2%.
2.5.2. MAE, RMSE and Bias
The measured datasets can be considered experimental data affected by random variations and systematic effects. Therefore, they were evaluated using statistical indicators that describe both the magnitude and the sign of the measurement error. For this purpose, three basic indicators were selected: Mean Absolute Error (
MAE), Root Mean Square Error (
RMSE) and
Bias [
33,
34,
35].
To compare the overall accuracy at individual distances, the Mean Absolute Error (
MAE) was calculated. The
MAE is defined as
where
TCAM,i is the temperature measured by the infrared thermal camera,
TBB,i is the blackbody reference temperature, and
n is the number of valid measurement points.
The MAE expresses the average magnitude of the measurement error, regardless of whether the camera overestimates or underestimates the reference value. Therefore, lower MAE values indicate better overall accuracy.
The Root Mean Square Error (
RMSE) was calculated to evaluate the influence of larger local deviations. The
RMSE is defined as
Compared with MAE, the RMSE gives greater weight to larger errors because the individual deviations are squared before averaging. Therefore, RMSE is more sensitive to local peaks, abrupt deviations and unstable parts of the measurement curve.
In addition to
MAE and
RMSE, the
Bias (mean signed error) was calculated to evaluate the systematic component of the measurement error. The
Bias is defined as
Unlike MAE, the Bias preserves the sign of the error. A positive Bias means that the infrared thermal camera overestimates the blackbody temperature on average, while a negative Bias means that it underestimates it. A bias close to zero indicates that the average signed error is small. However, a low Bias does not necessarily mean high accuracy, because positive and negative errors may cancel each other.
2.5.3. Type A Uncertainty from Repeated Readings
Measurement uncertainty is a non-negative parameter characterizing the dispersion of the quantity values being attributed to a measurand, based on the information used. The parameter may be, for example, a standard deviation called standard measurement uncertainty (or a specified multiple of it), or the half-width of an interval, having a stated coverage probability. Measurement uncertainty comprises, in general, many components. Some of these may be evaluated by Type A evaluation of measurement uncertainty from the statistical distribution of the quantity values from series of measurements and can be characterized by standard deviations. The other components, which may be evaluated by Type B evaluation of measurement uncertainty, can also be characterized by standard deviations, evaluated from probability density functions based on experience or other information [
32,
36,
37,
38].
For repeated manual measurements, the dispersion of the indicated values was also evaluated. The experimental standard deviation was calculated as
where
TCAM,i are repeated readings and
is their arithmetic mean. When the uncertainty of the mean value was required, the Type A standard uncertainty was calculated as
This parameter was used to describe the reliability of the mean temperature value obtained from repeated measurements [
32,
36,
37,
38].
2.5.4. Dynamic Response Indicators
For the dynamic response tests, the transition curves were evaluated after the sudden uncovering of the blackbody source. The beginning of the response was defined as time t = 0, corresponding to the moment when the camera view of the blackbody was uncovered. The response was analysed using the time required for the displayed temperature to reach a defined fraction of its final value.
Step response time is the duration between the instant when an input quantity value of a measuring instrument or measuring system is subjected to an abrupt change between two specified constant quantity values and the instant when a corresponding indication settles within specified limits around its final steady value [
32].
2.5.5. Repeatability of Thermographic Instrument Readings
To evaluate the repeatability of the thermographic instrument readings, a video-based measurement procedure was applied at the previously selected measurement configuration with a camera-to-blackbody distance of 900 mm. For each selected blackbody temperature level (50, 75, 100, 125, 150, 175, 200, 225, 250, and 275 °C), a separate video record was acquired while the blackbody source was maintained at an approximately constant target temperature. In accordance with the repeatability assessment principle described in OIML R 141, the temperature indicated by the infrared thermal camera was sampled from the video record at regular time intervals of approximately 10–15 s over a total period of 15 min [
1].
The extracted data sequence for each temperature was then divided into three consecutive 5 min intervals. For each interval, the arithmetic mean of the indicated temperature was calculated. The repeatability was subsequently expressed as the difference between the maximum and minimum of these three mean values,
where
,
, and
are the mean temperatures in the first, second, and third 5 min intervals, respectively. This approach quantifies the temporal stability of the instrument indication over the observation period.
3. Results
3.1. Manual Measurement and Determination of Infrared Thermal Camera Accuracy at a Defined Distance and Constant Temperature
For the defined measurement range of the evaluated infrared thermal camera, a series of manual measurements was performed using the blackbody calibrator as the reference temperature source. The blackbody temperature was gradually set to selected temperature levels, and the indicated temperature of the infrared thermal camera was manually recorded at different camera-to-black-body distances.
The measurements were carried out at ten temperature levels: 50 °C, 75 °C, 100 °C, 125 °C, 150 °C, 175 °C, 200 °C, 225 °C, 250 °C, and 275 °C. For each temperature level, the distance between the infrared thermal camera and the blackbody source was gradually changed from 100 mm to 3000 mm, specifically: 100 mm, 200 mm, 300 mm, 600 mm, 900 mm, 1200 mm, 1500 mm, 1800 mm, 2100 mm, 2400 mm, 2700 mm, and 3000 mm.
For every combination of temperature and distance, the blackbody temperature was set and the system was allowed to reach a stabilized state. Subsequently, ten repeated readings of the infrared thermal camera indication were manually recorded in order to assess not only the measurement error, but also the short-term stability of the indicated values. The complete measurement process lasted approximately five hours.
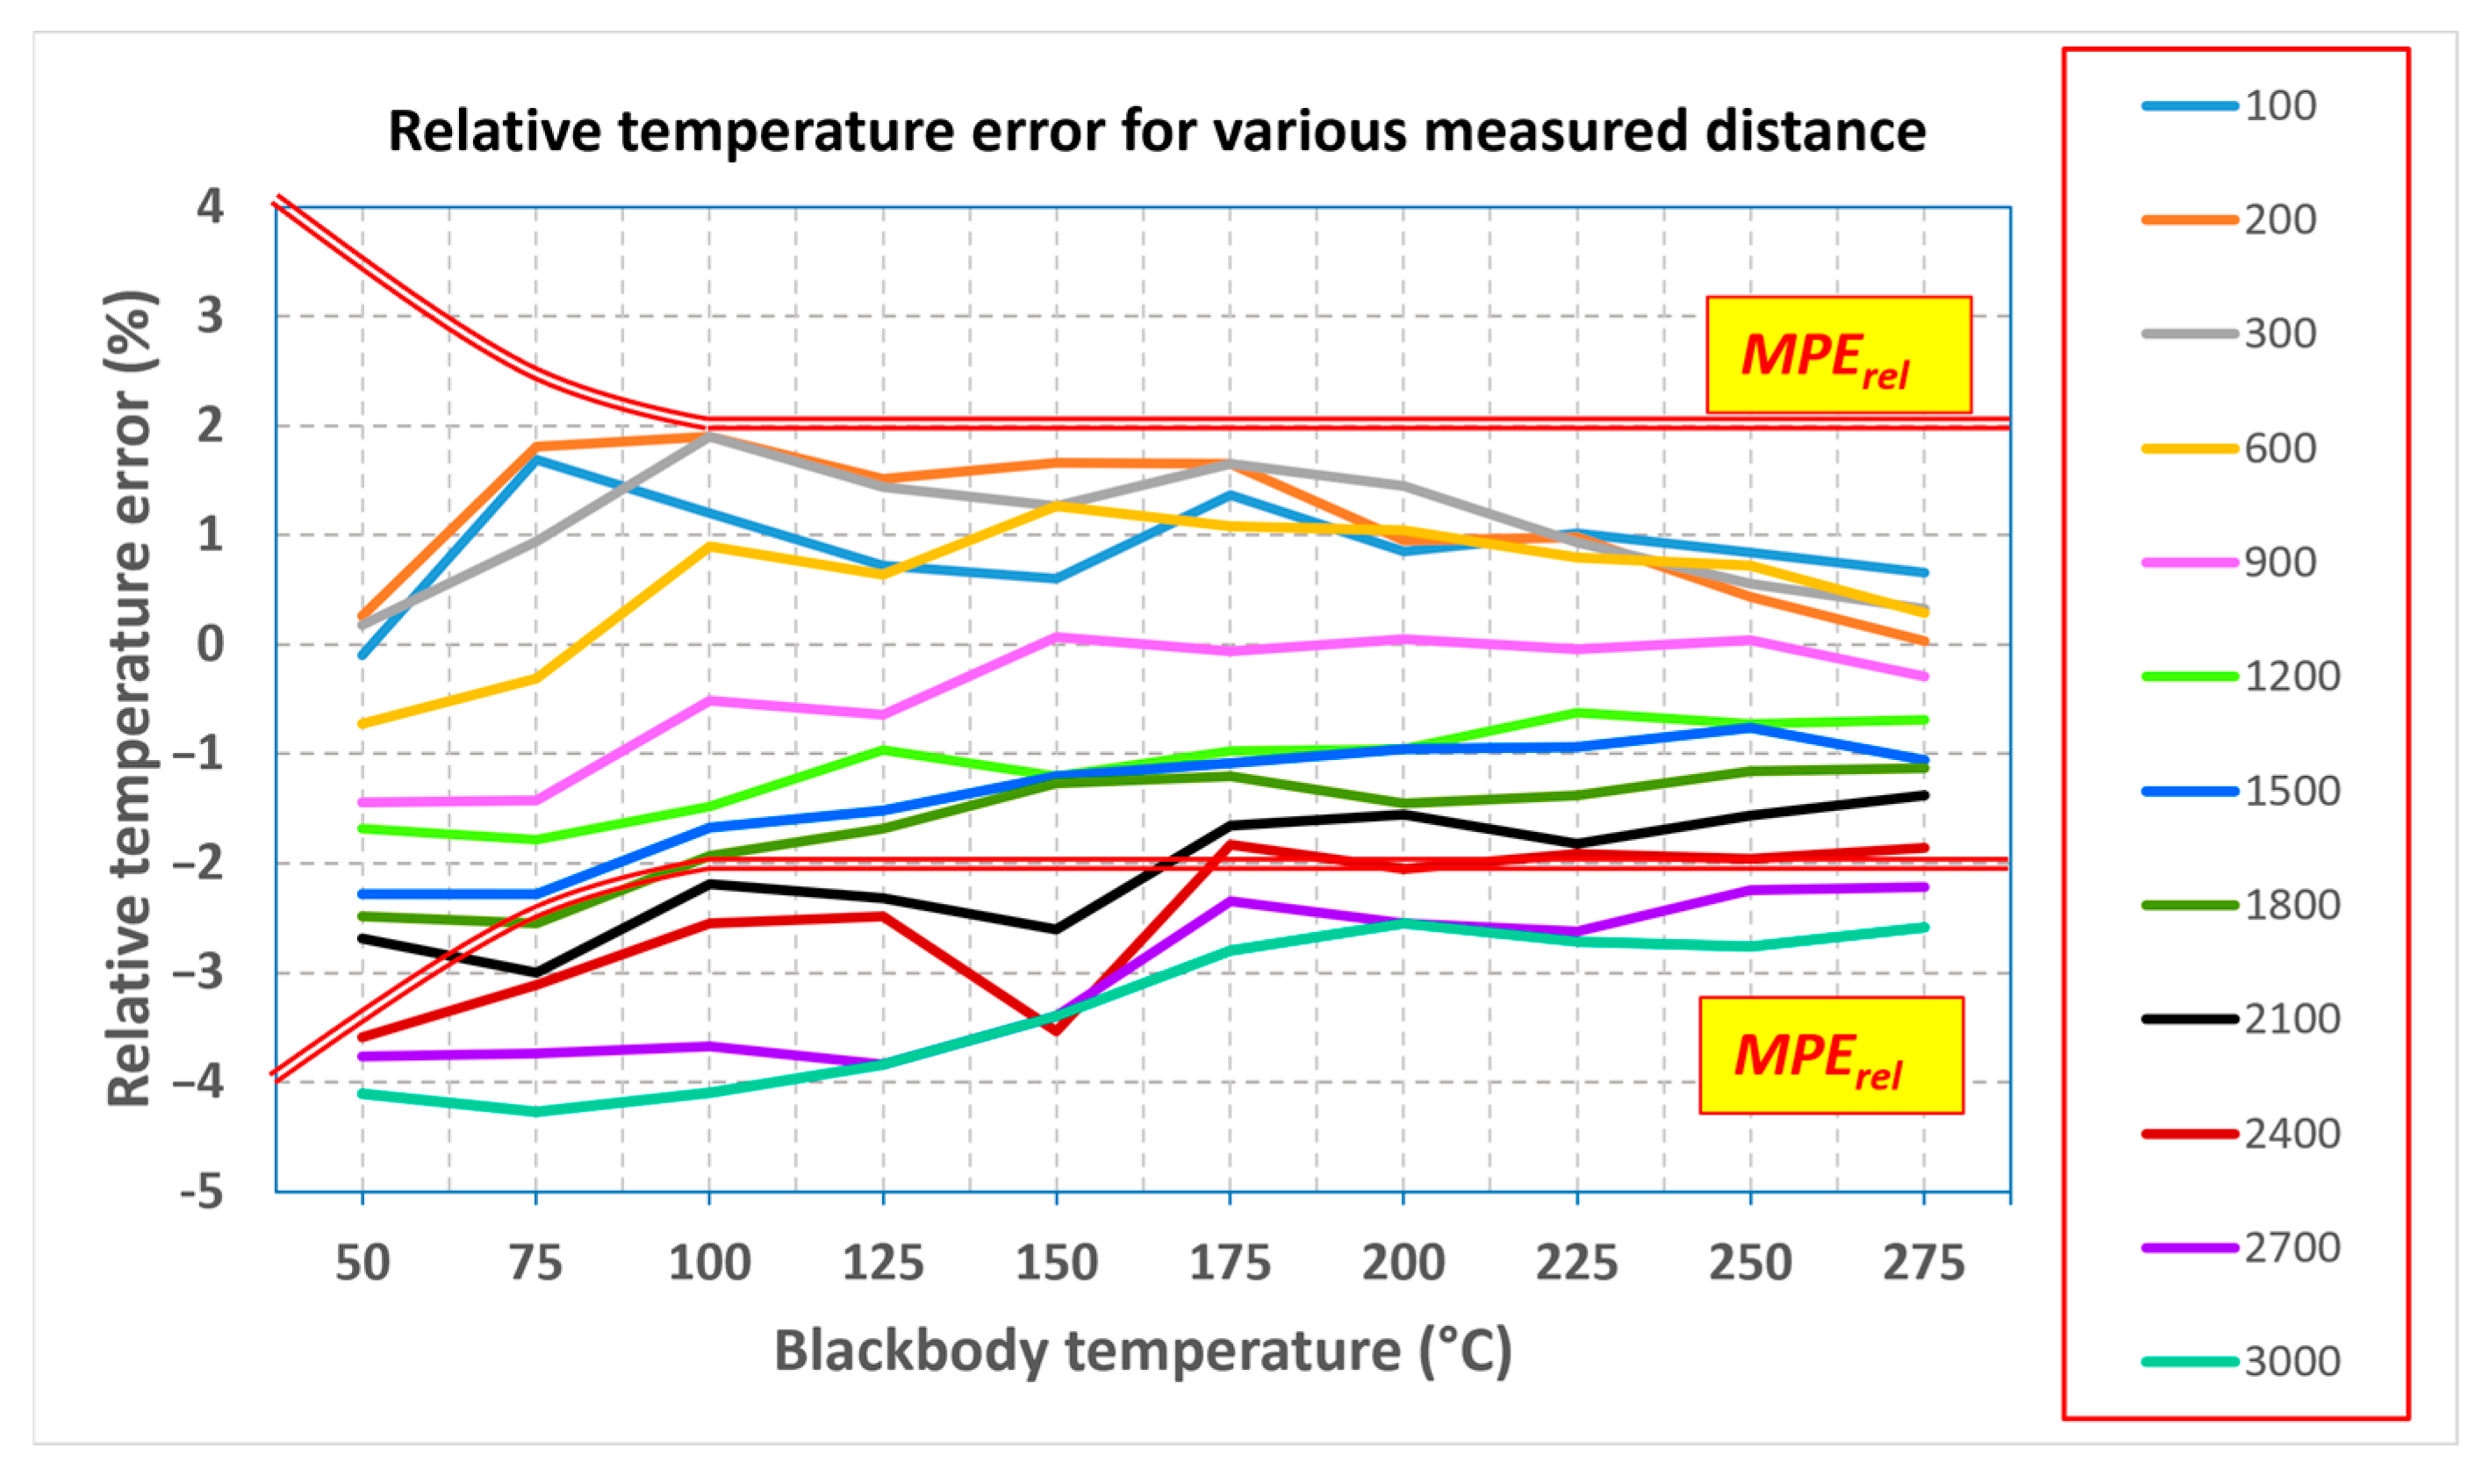
Based on these measurements, the relative measurement errors were calculated and expressed as percentages of the nominal blackbody temperature. The resulting graph provides important information about the relative error behaviour of the evaluated infrared thermal camera over the investigated temperature and distance ranges (
Figure 6). For measurement distances up to approximately 1500 mm, the relative errors of the infrared thermal camera remained below the maximum permissible error (
MPErel) specified by the manufacturer. After exceeding this distance, some relative error values were already outside the
MPErel limits.
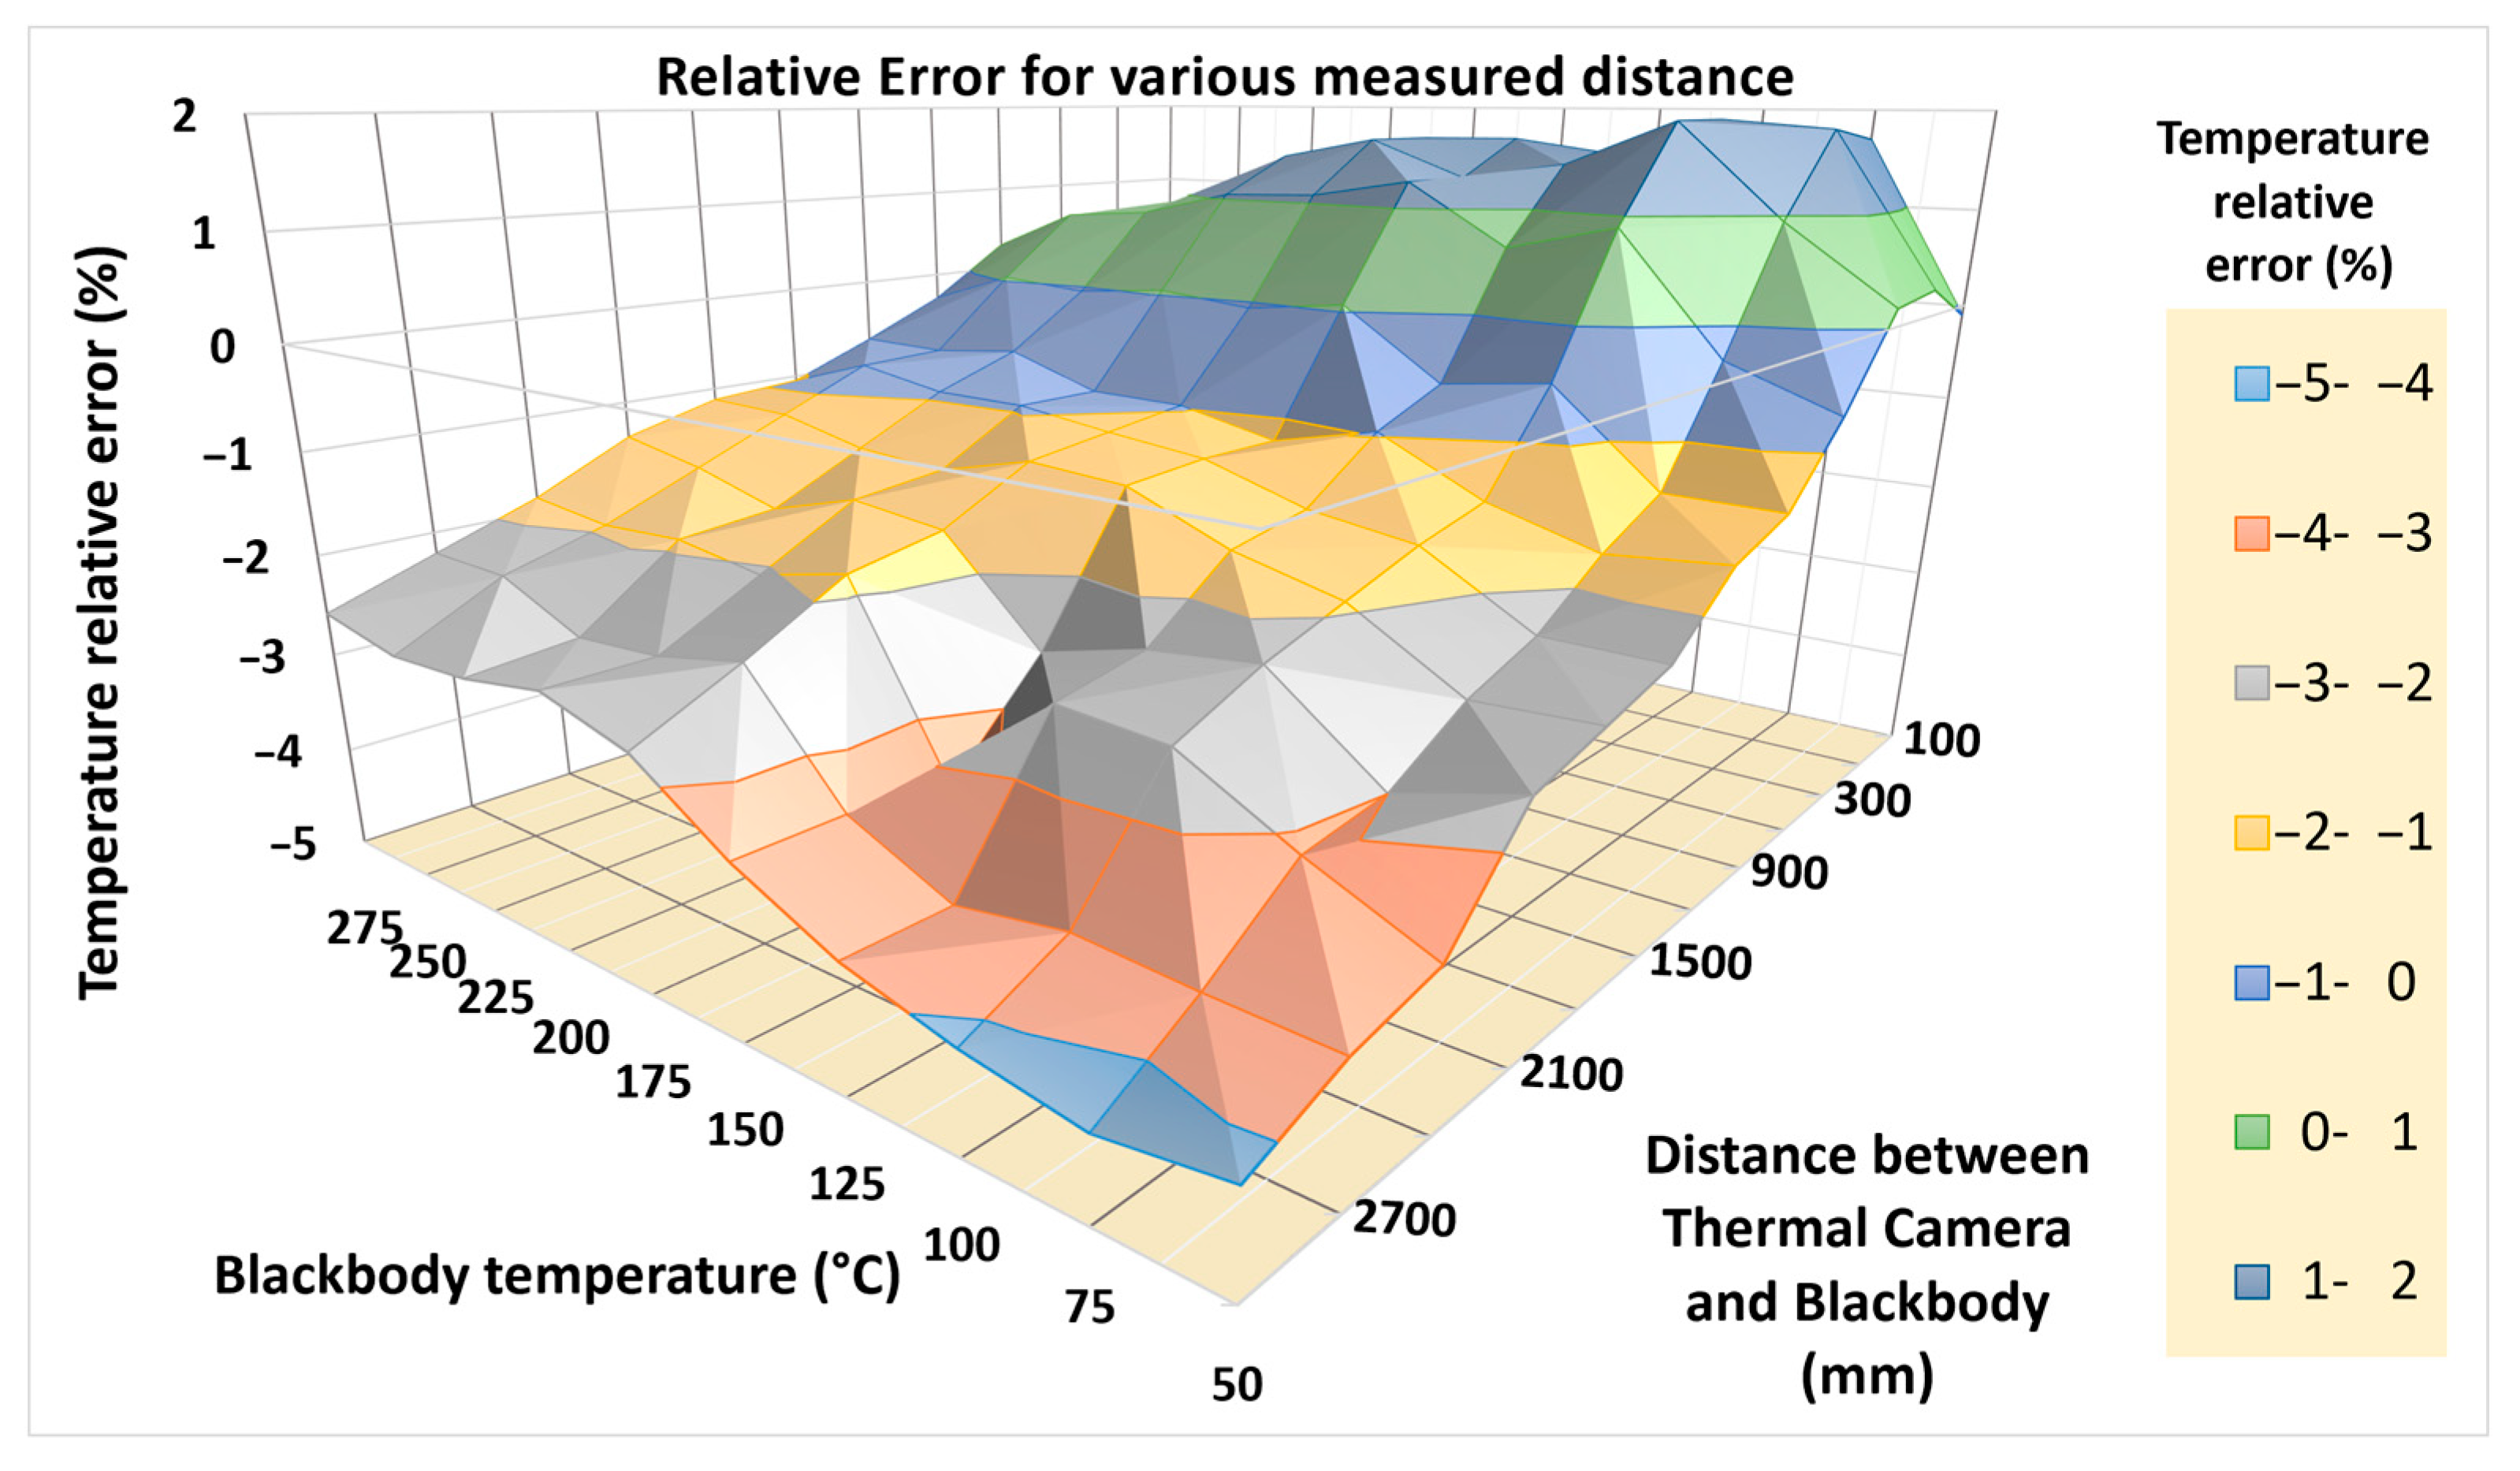
The three-dimensional representation (
Figure 7) of the results provides a clearer overview of this behaviour. It enables the simultaneous visualization of the influence of temperature and distance on the measurement error and forms a relative error map of the evaluated infrared thermal camera. This representation is useful for identifying regions in which the camera provides acceptable measurement accuracy and regions where the measurement conditions lead to increased deviations.
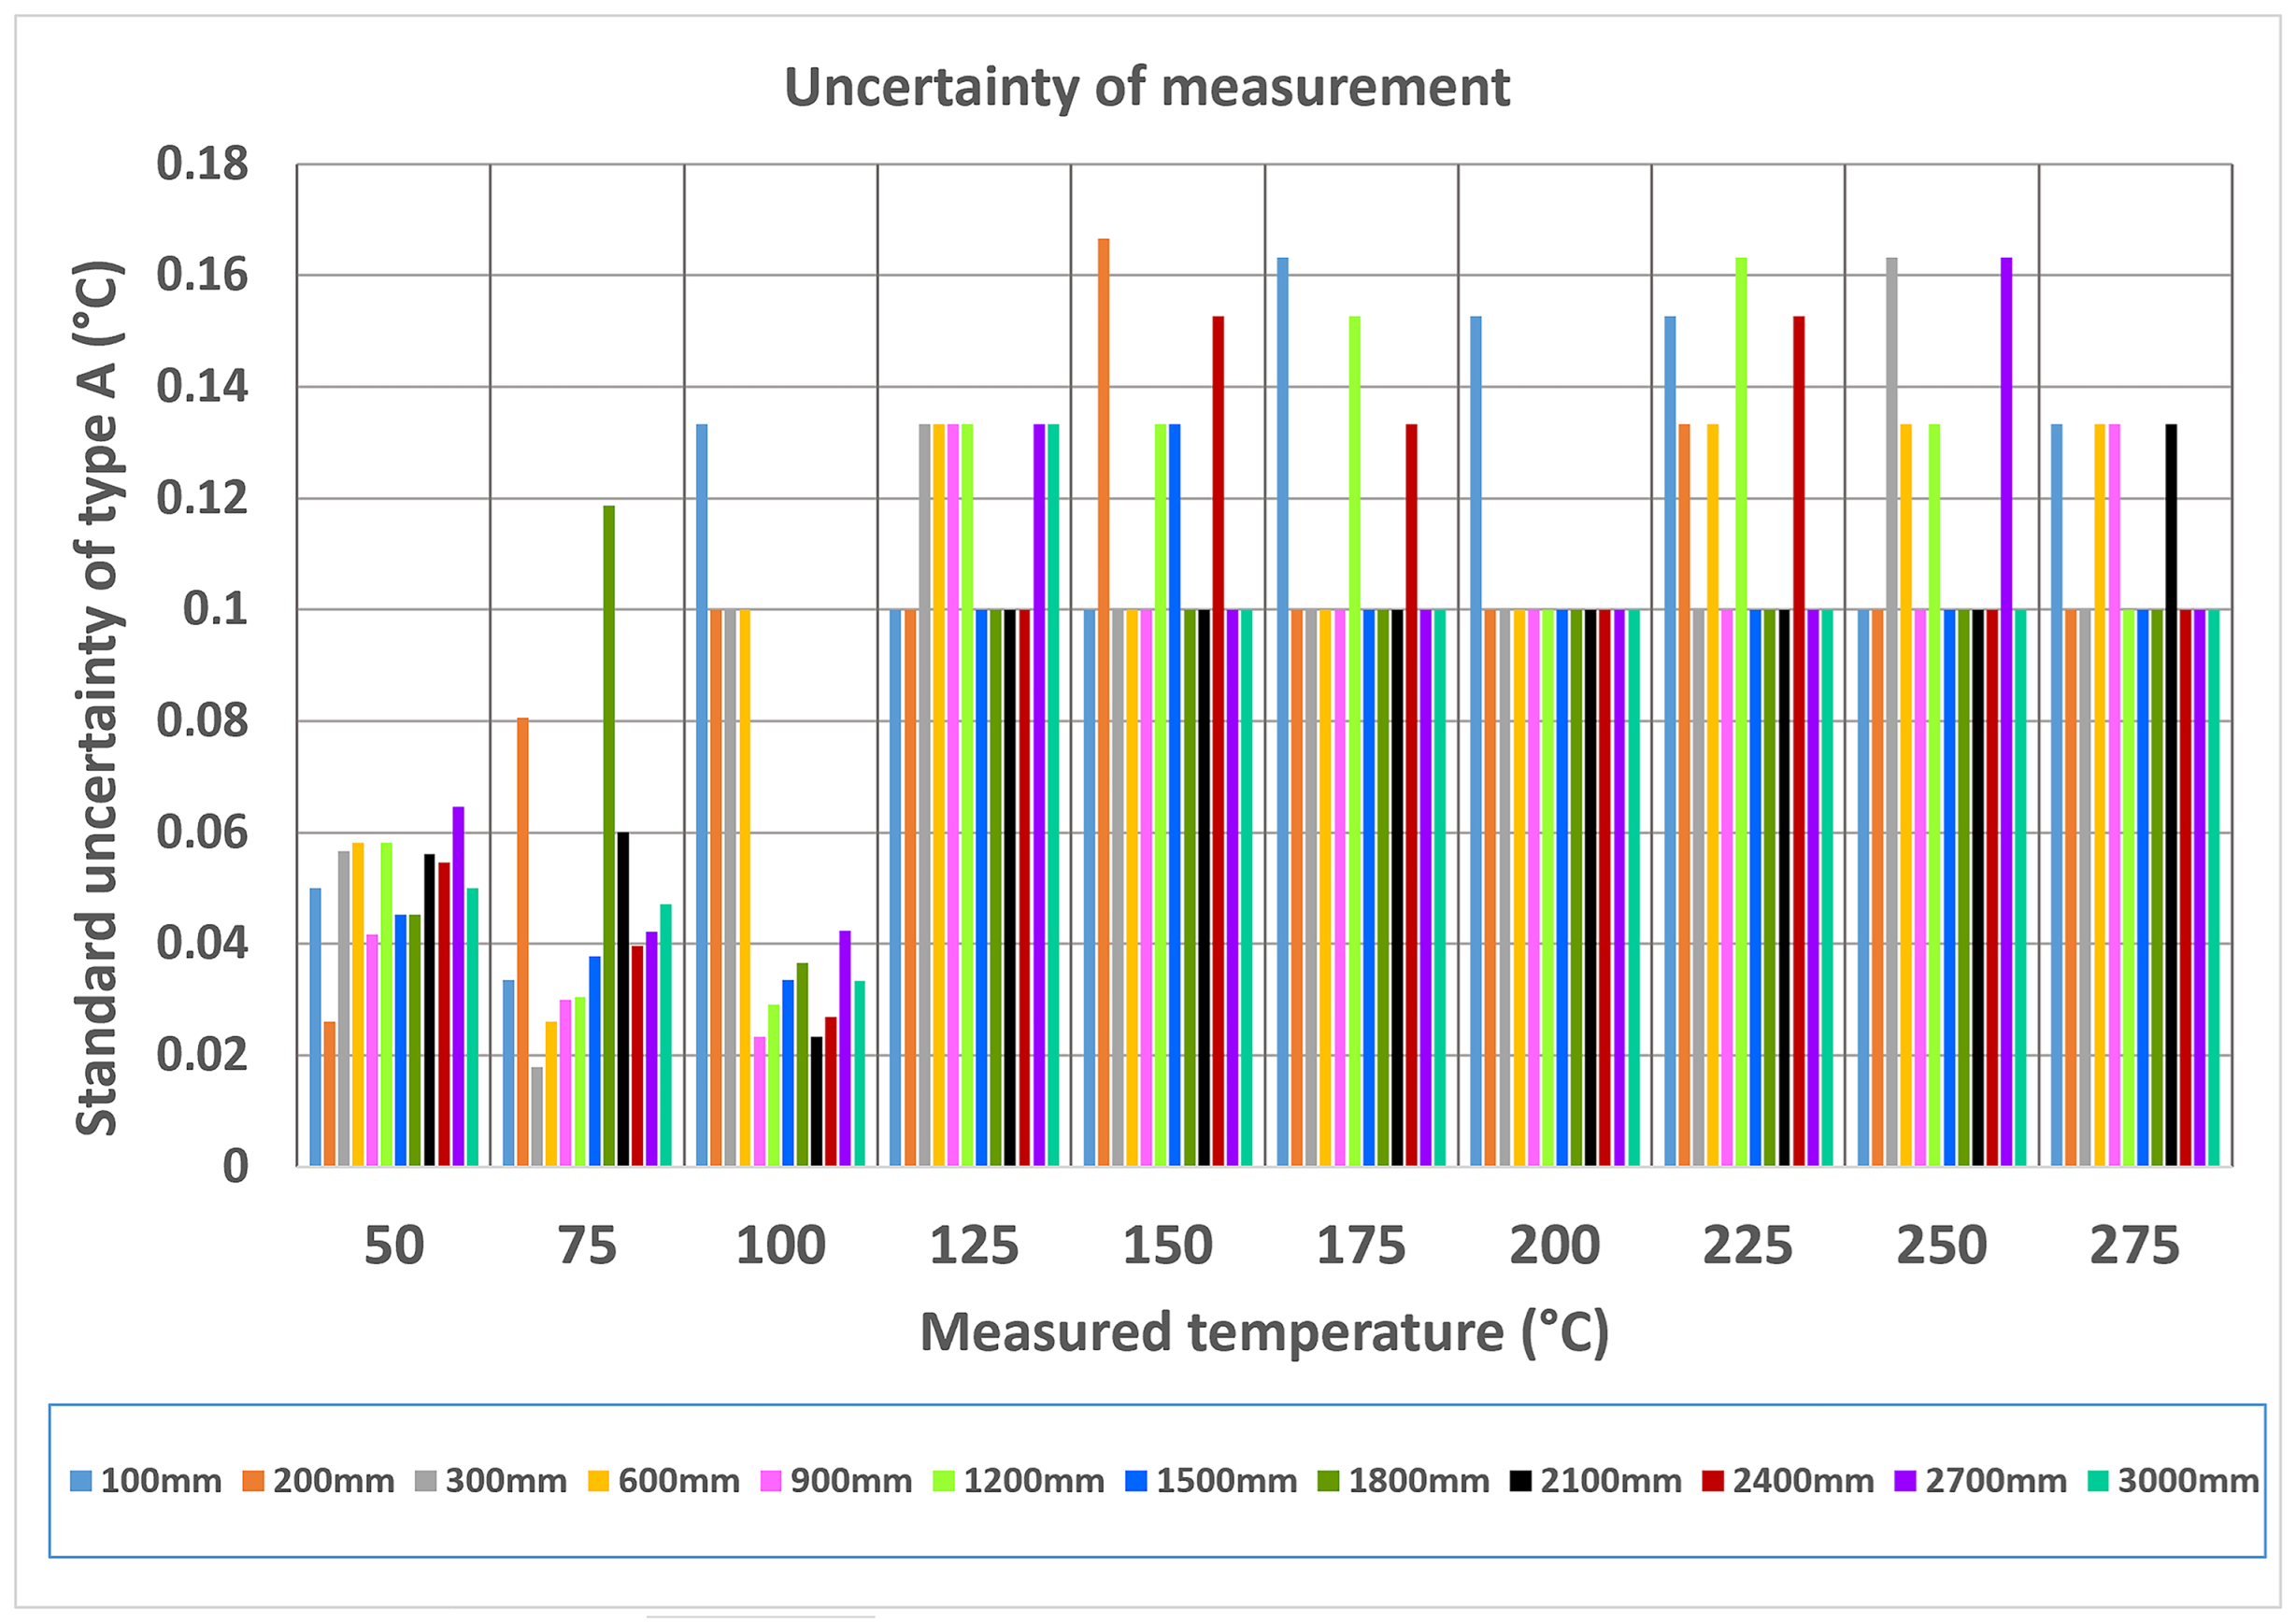
Based on the repeated measurements, the standard uncertainty was evaluated according to EAL-R2 using the Type A method (
Figure 8). For this purpose, the standard deviation of the repeated measurements was used. This overview of uncertainty values provides important information about the reliability of the obtained measurement results and indicates the degree of confidence that can be assigned to the measured temperature values.
The process of determining the relative errors was extremely time-consuming; however, it provided a comprehensive overview of the performance capabilities of the evaluated infrared thermal camera. Nevertheless, an important question arises as to whether an evaluation based only on the selected discrete temperature points is sufficient to fully describe the measurement behaviour of the instrument.
For this reason, the next step of the study focuses on a quasi-static measurement approach, in which the blackbody temperature is gradually increased and the temperature difference between the reference source and the infrared thermal camera indication is monitored continuously. This approach makes it possible to obtain a denser temperature-dependent error curve and to identify possible local deviations that may not be captured by conventional measurements performed only at selected temperature points.
3.2. Evaluation of the Influence of Measurement Distance
The manually recorded calibration data were first used to evaluate the influence of the distance between the blackbody source and the infrared thermal camera. For each investigated distance, three statistical indicators were calculated: Mean Absolute Error, Root Mean Square Error and Bias.
The
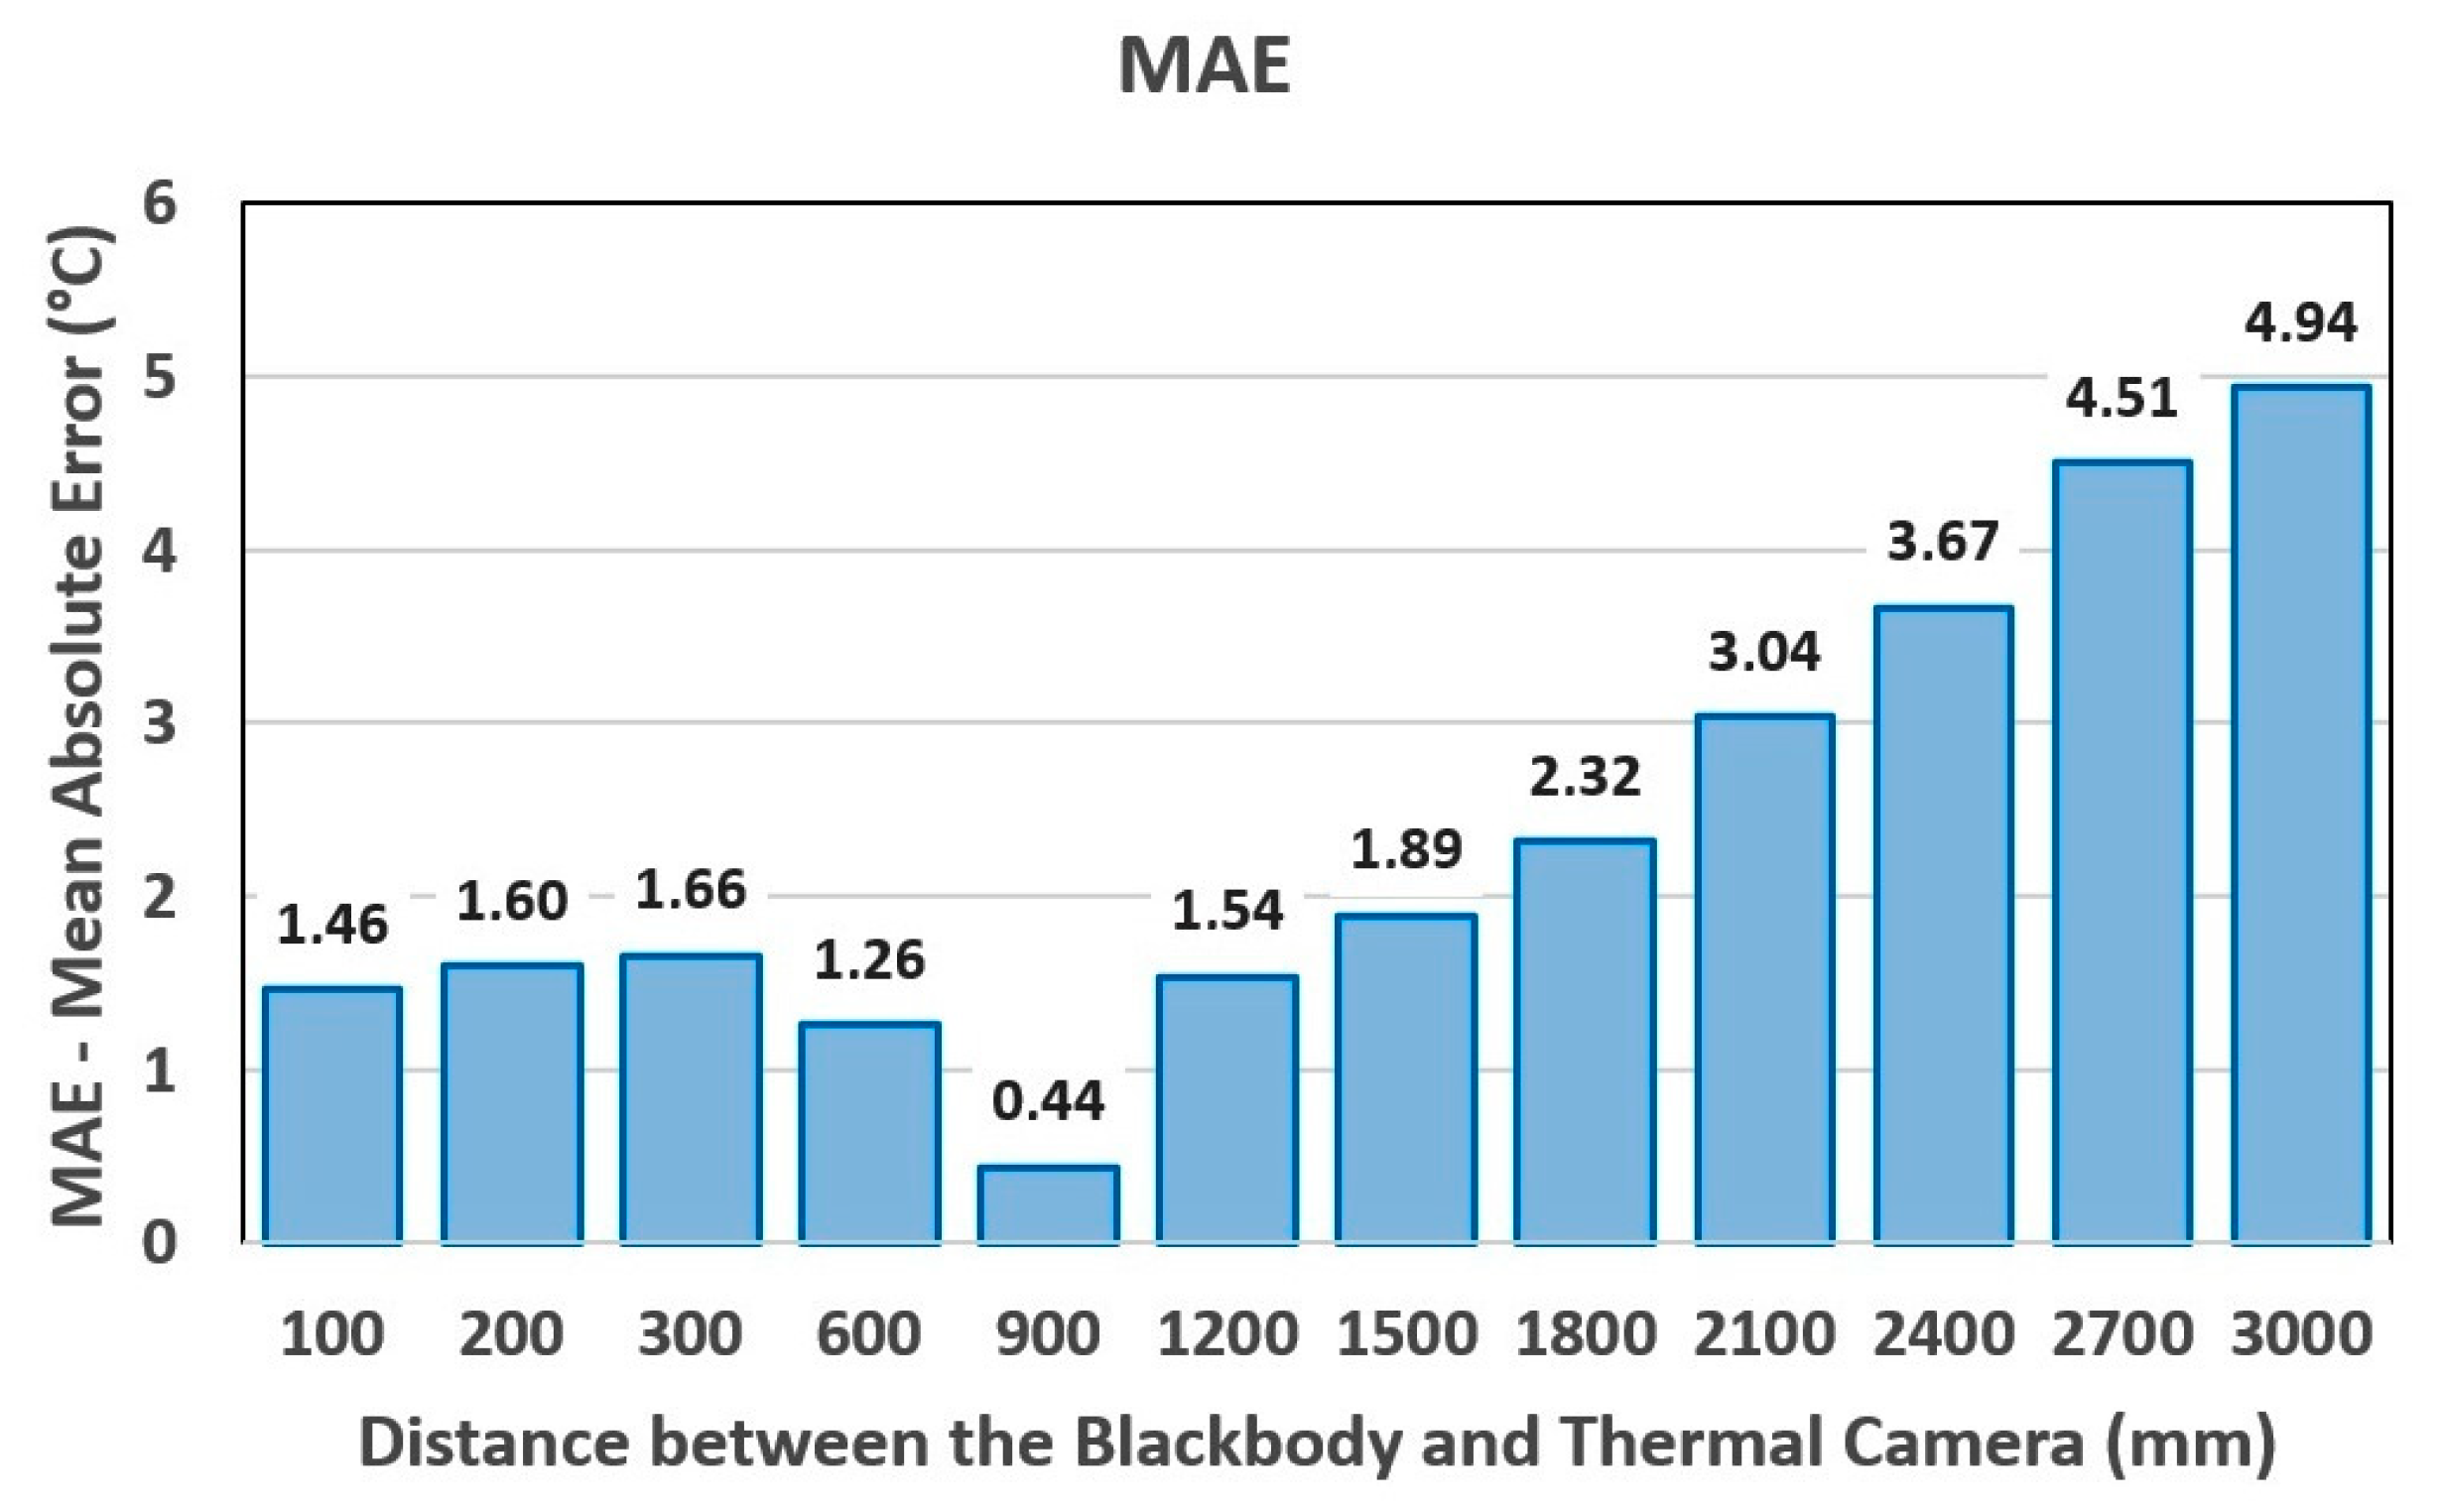
MAE results (
Figure 9) show a clear dependence of the measurement error on distance. The lowest
MAE was obtained at a distance of 900 mm, where the value reached only 0.44 °C. At shorter distances, the
MAE was higher, ranging from approximately 1.26 °C to 1.66 °C. At distances larger than 900 mm, the
MAE increased progressively, reaching 4.94 °C at 3000 mm. This indicates that the measurement accuracy deteriorates when the camera is placed too far from the blackbody source.
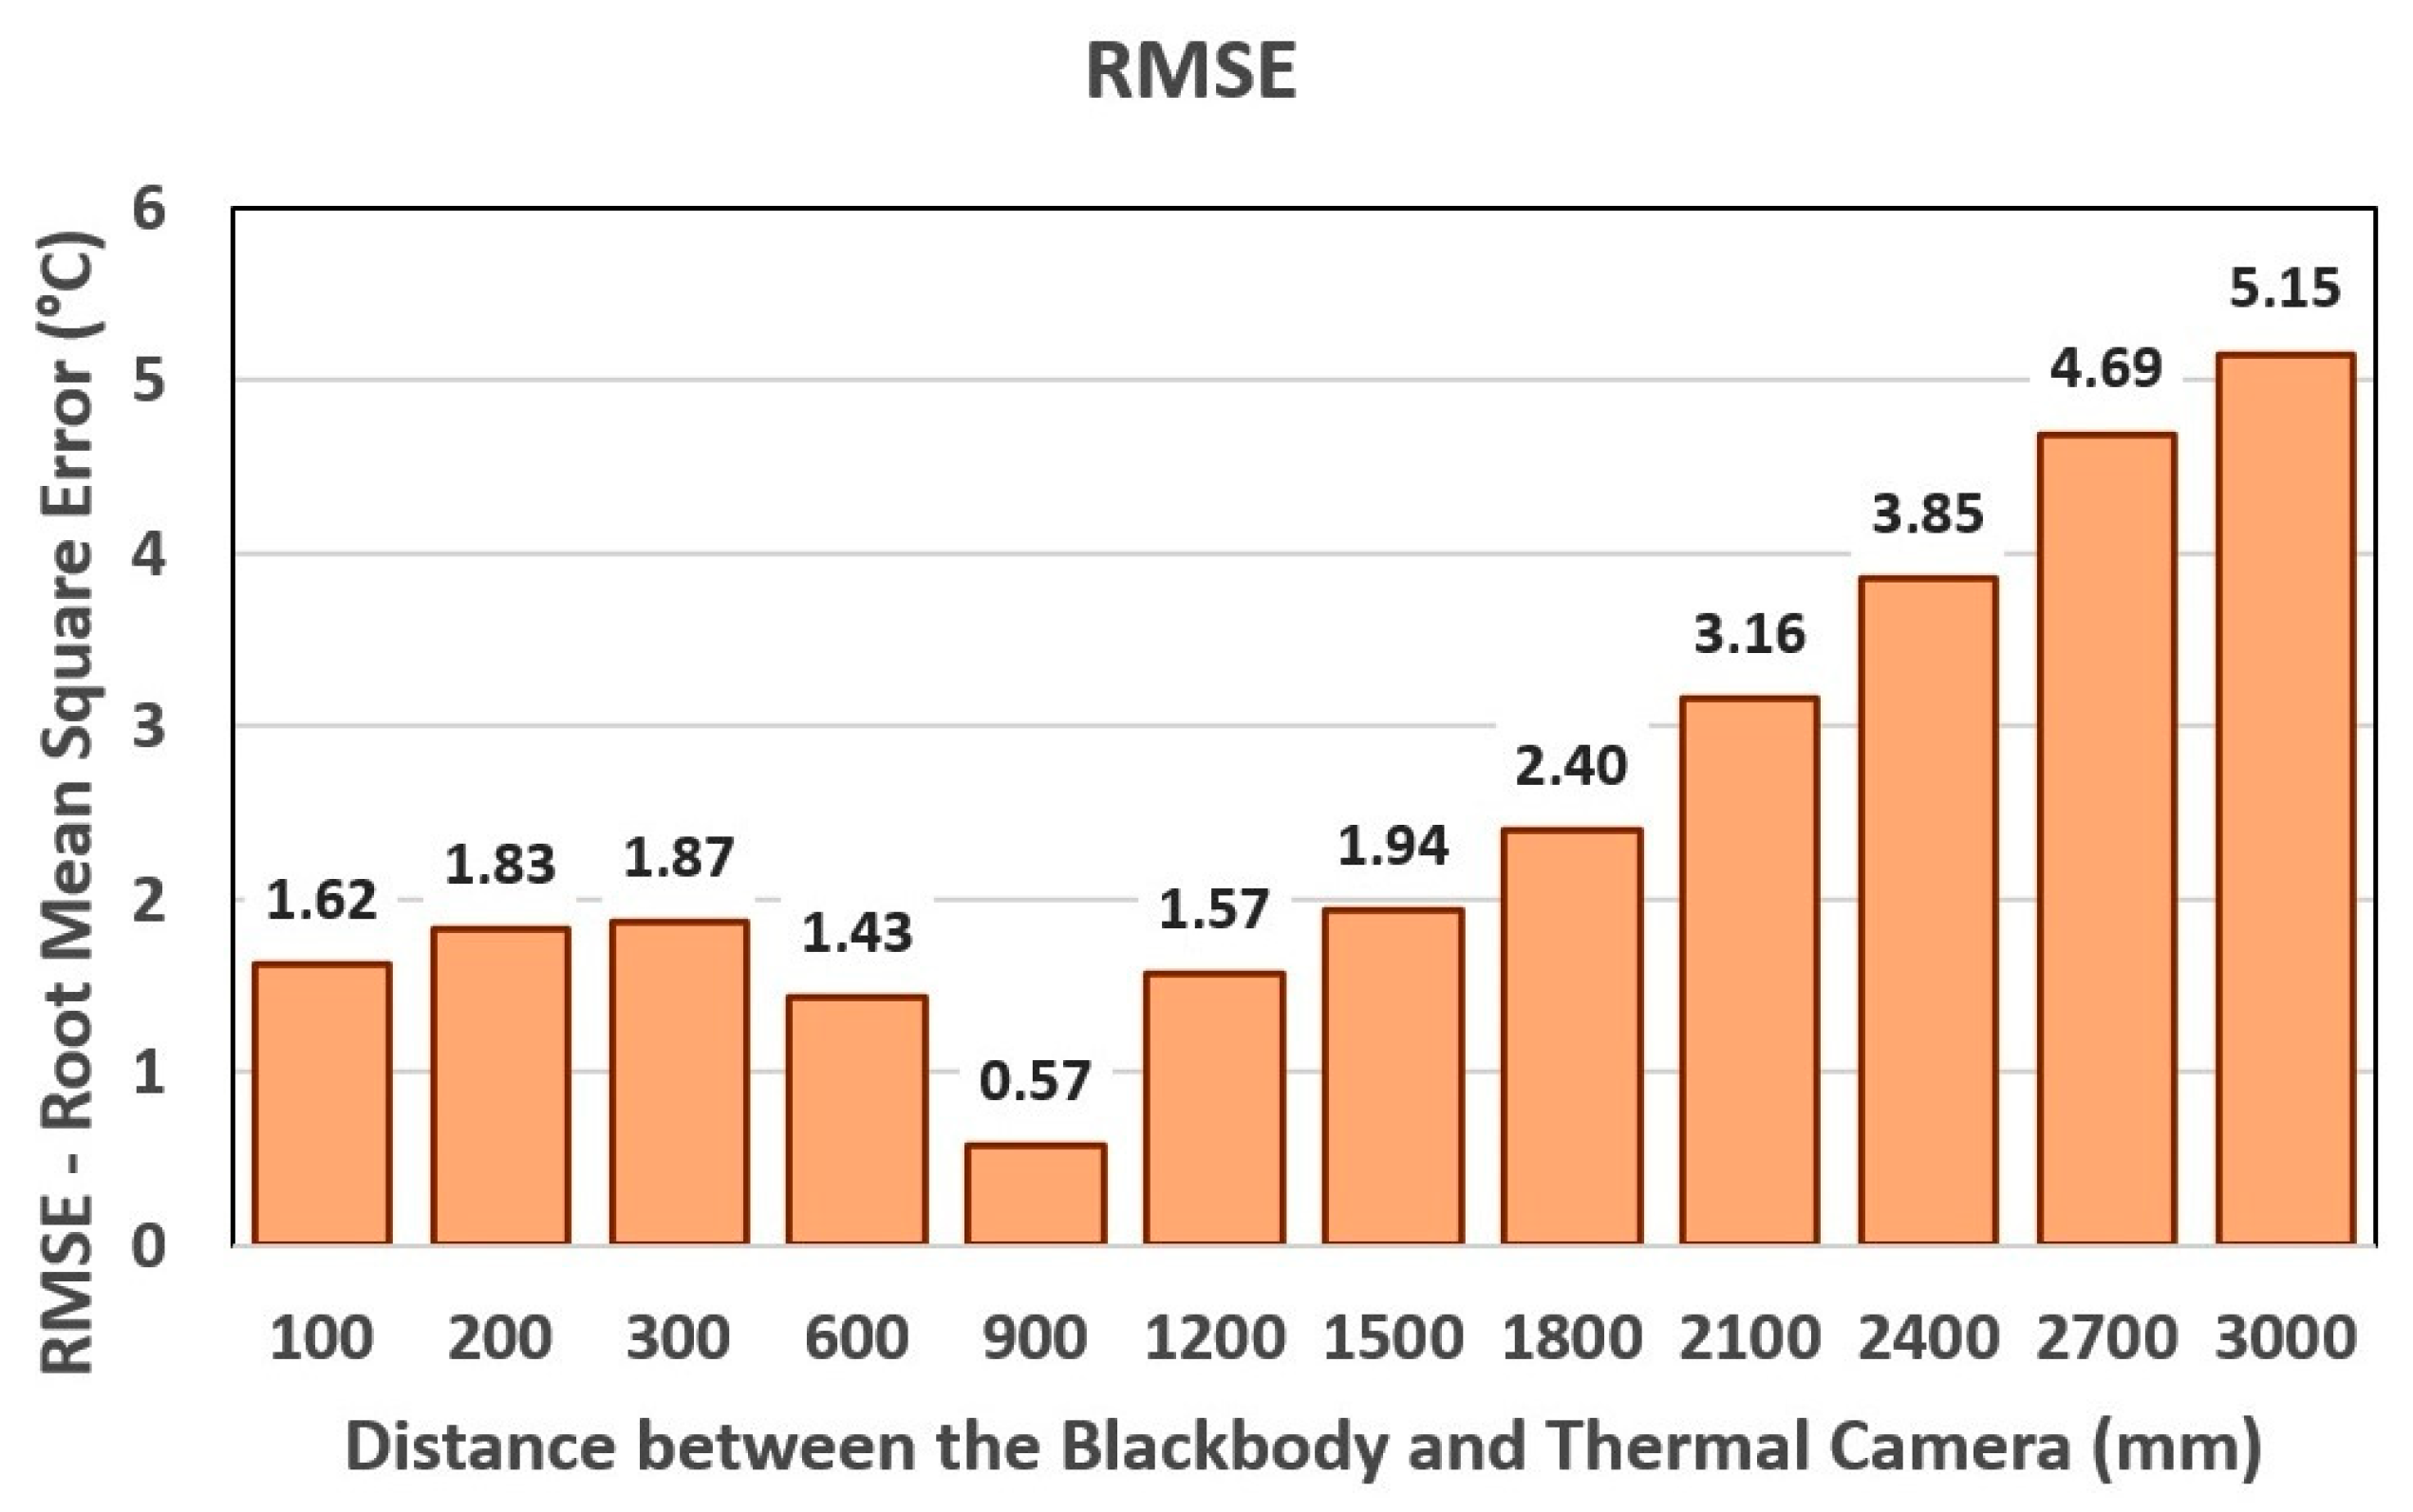
A similar trend was observed for the
RMSE (
Figure 10). The lowest
RMSE value was again obtained at 900 mm, with a value of 0.57 °C. Since
RMSE is more sensitive to larger local deviations than
MAE, this result confirms that the 900 mm distance provided not only the lowest average error, but also the most stable measurement behaviour. At larger distances, the
RMSE increased almost monotonically, indicating increasing deviation and reduced measurement stability.
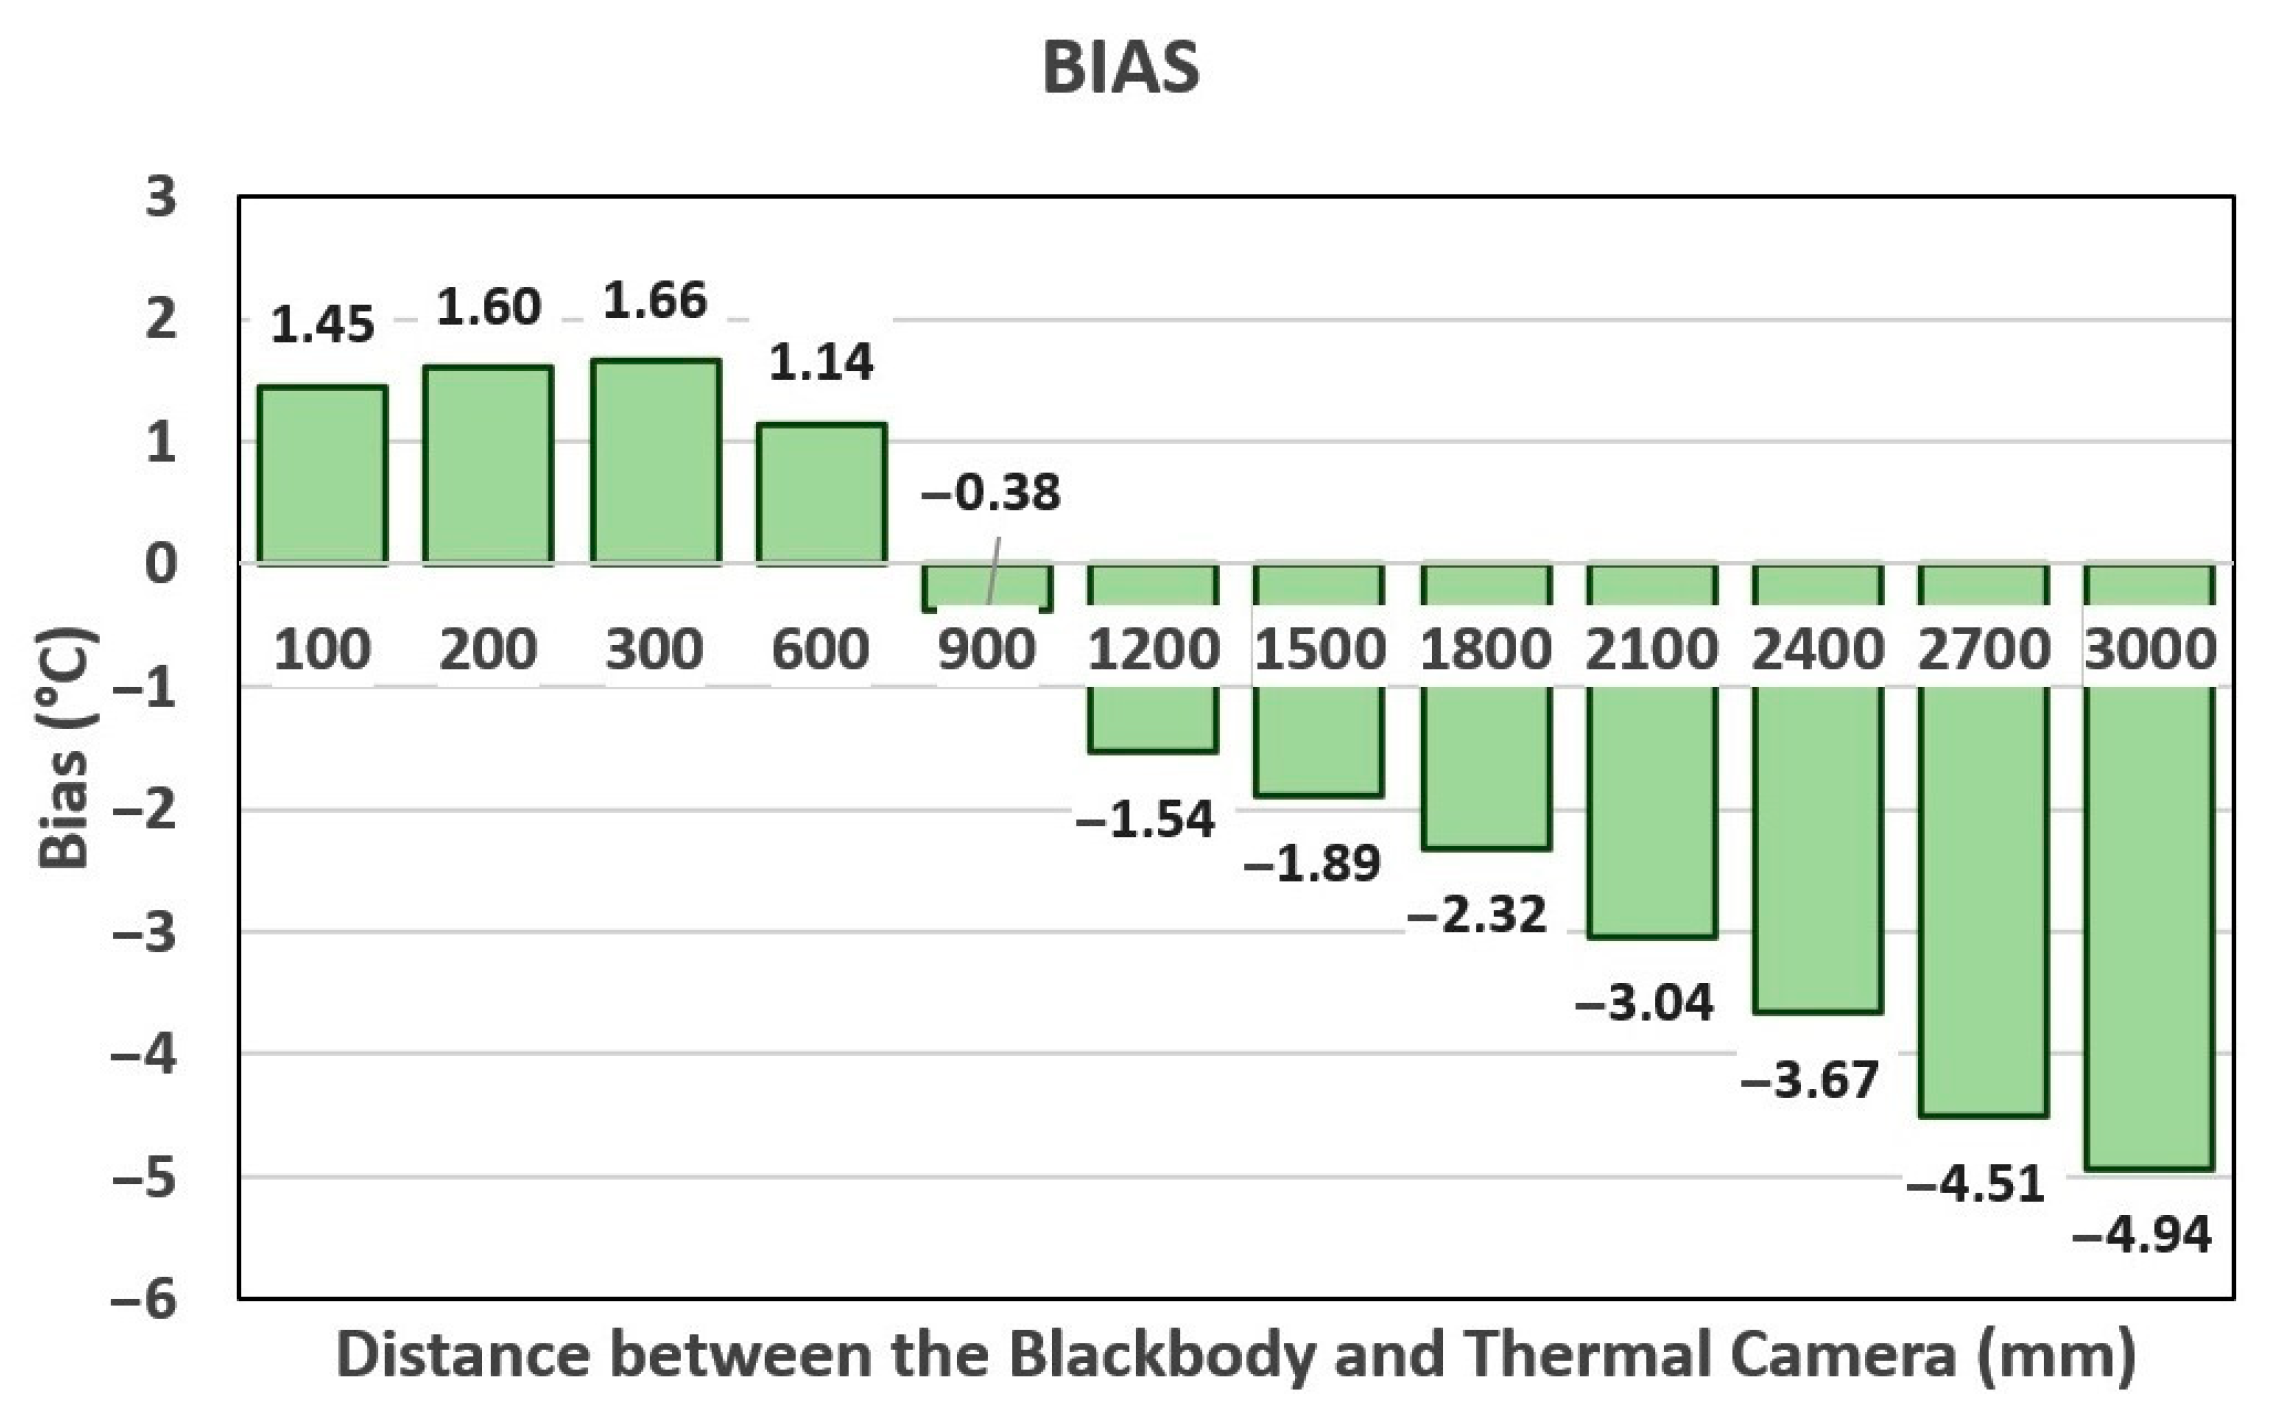
The
Bias evaluation (
Figure 11) provides additional information about the systematic component of the error. At short distances from 100 mm to 600 mm, the
Bias was positive, which means that the infrared thermal camera overestimated the blackbody temperature on average. At larger distances, the
Bias became negative and its magnitude increased with distance. This means that the camera increasingly underestimated the blackbody temperature when the distance was increased. The distance of 900 mm represents the transition region where the systematic error is closest to zero. At this distance, the
Bias was only −0.38 °C.
The combined evaluation of
MAE,
RMSE and
Bias identified 900 mm as the most suitable measurement configuration for the investigated camera–blackbody arrangement. However, this distance should not be interpreted as an intrinsic optimum of the infrared thermal camera alone. The observed behaviour results from the combined influence of the camera-to-blackbody distance, the angular size of the blackbody aperture, the number of pixels covering the target, the target size relative to the IFOV, and the possible size-of-source effect. At a distance of 900 mm, the blackbody aperture still covered approximately 9.7 IFOV-equivalent pixels across its diameter, corresponding to about 73 pixels over the circular target area (
Table 2). This provided a sufficient target size for stable temperature indication while avoiding the short-distance limitations associated with focusing and optical geometry. At larger distances, the reduced angular size and lower pixel coverage of the blackbody aperture may increase the influence of the surrounding background, edge effects and size-of-source effect, which can contribute to the observed increase in measurement error.
Based on these results, the distance of 900 mm was selected for further detailed analysis using the quasi-static video-based measurement method. This subsequent experiment was performed in order to obtain a denser temperature-dependent error curve at the measurement configuration that had shown the best performance in the preliminary manual evaluation.
3.3. Quasi-Static Continuous Blackbody Heating and Continuous Evaluation of Thermal Camera Measurement Error
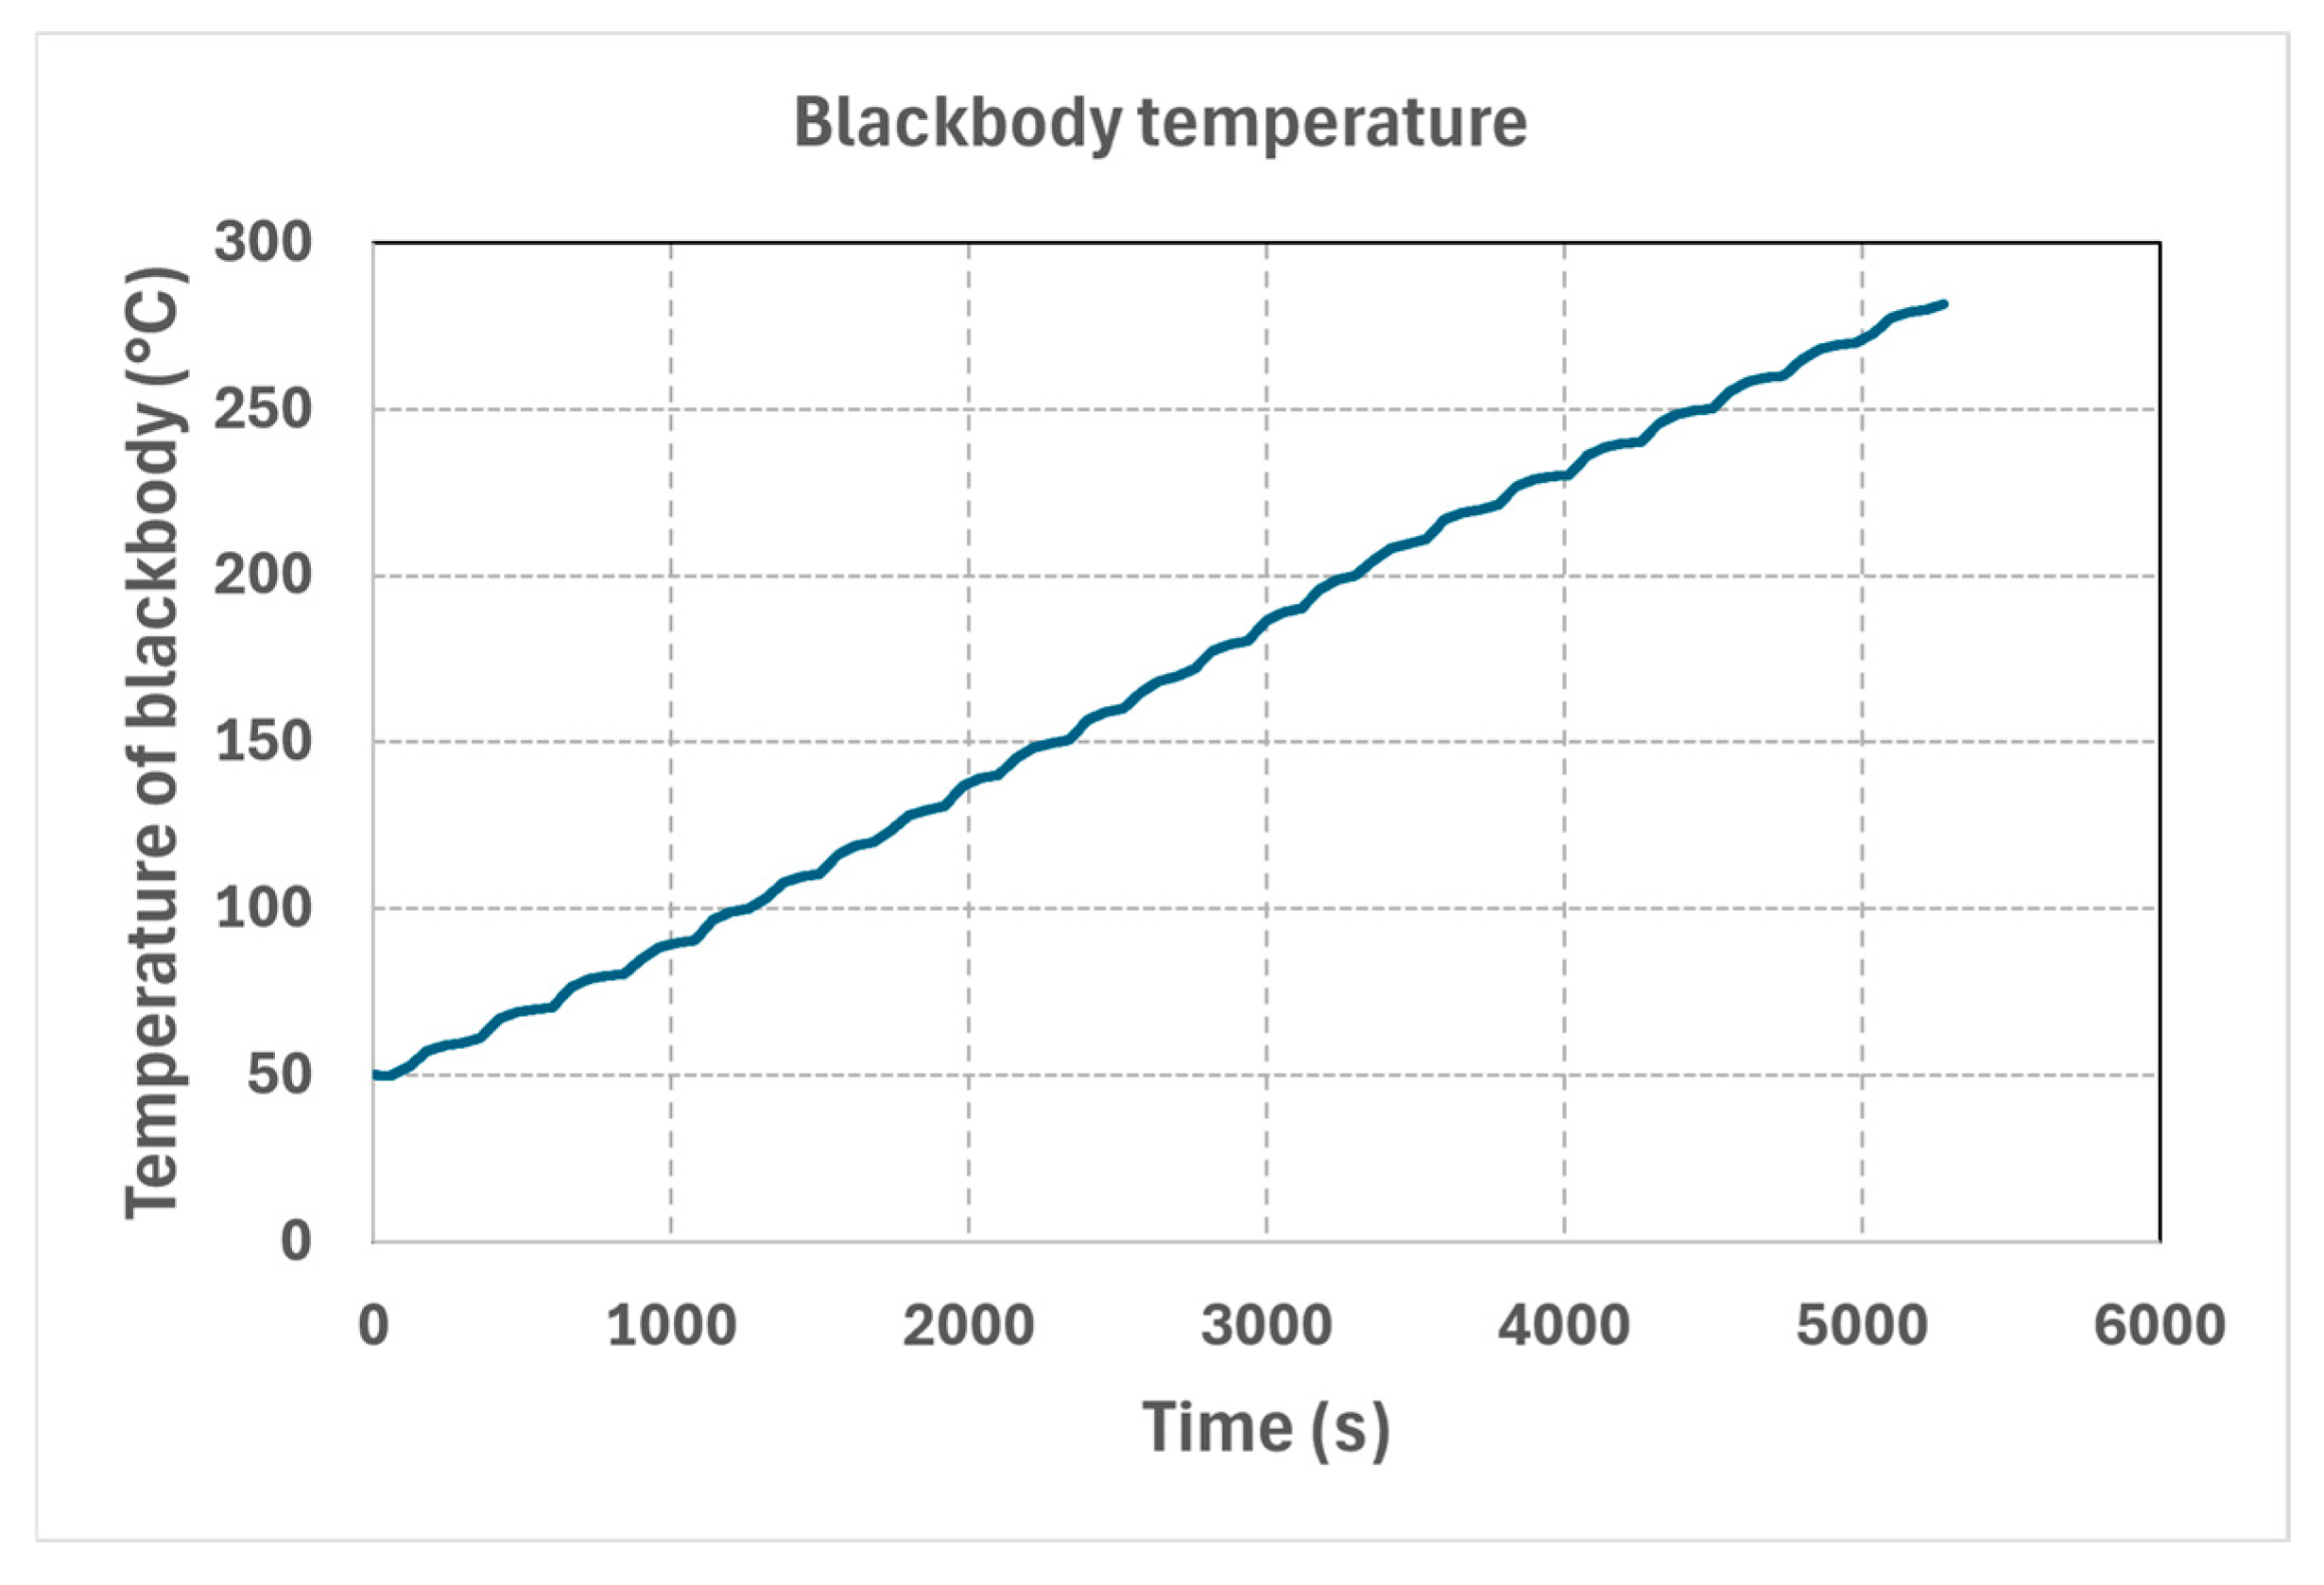
During the quasi-static experiment, the temperature of the heated blackbody surface was gradually increased at a very low rate in order to minimize the influence of dynamic effects associated with both the blackbody calibrator and the infrared thermal camera (
Figure 12). The aim was to ensure that the evaluated temperature deviations represented mainly the quasi-static measurement behaviour of the infrared thermal camera rather than transient effects caused by rapid temperature changes.
During this experiment, the blackbody temperature increased from approximately 50.0 °C to 281.6 °C over 5274 s. The average heating rate was therefore approximately 0.05 °C/s, corresponding to about 3 °C/min. This slow temperature ramp exposed the infrared thermal camera progressively to almost all temperatures within the investigated measurement range.
Since the controller display temperature of the blackbody calibrator was used as the reference value during continuous heating, a possible thermal lag between the internal temperature regulation point and the effective radiating aperture temperature must be considered. To reduce this effect, the continuous experiment was performed as a slow quasi-static heating process with an average heating rate of approximately 0.05 °C/s. Under these conditions, the temperature change was sufficiently slow to reduce transient differences between the indicated controller temperature and the effective aperture temperature. Nevertheless, a residual thermal lag of the blackbody source cannot be completely excluded and is considered as one of the uncertainty contributions of the reference quantity.
The measurement was performed at the selected camera-to-blackbody distance of 900 mm. This configuration was chosen on the basis of the previous statistical evaluation of the manual measurements, where it provided the lowest values of MAE and RMSE and a small systematic deviation. Therefore, it was considered the most suitable measurement configuration for the detailed quasi-static evaluation of the infrared thermal camera measurement error.
The calibration experiments were evaluated by comparing the temperature indicated by the infrared thermal camera with the reference temperature displayed by the blackbody calibrator. Since direct digital data output from the instruments was not available, all temperature values were extracted from video recordings of the experiment. To reduce errors caused by display flickering, incomplete digit visibility, reflections and short-term image artefacts, the final dataset was obtained using a robust video-processing approach based on multiple frames around each sampling instant.
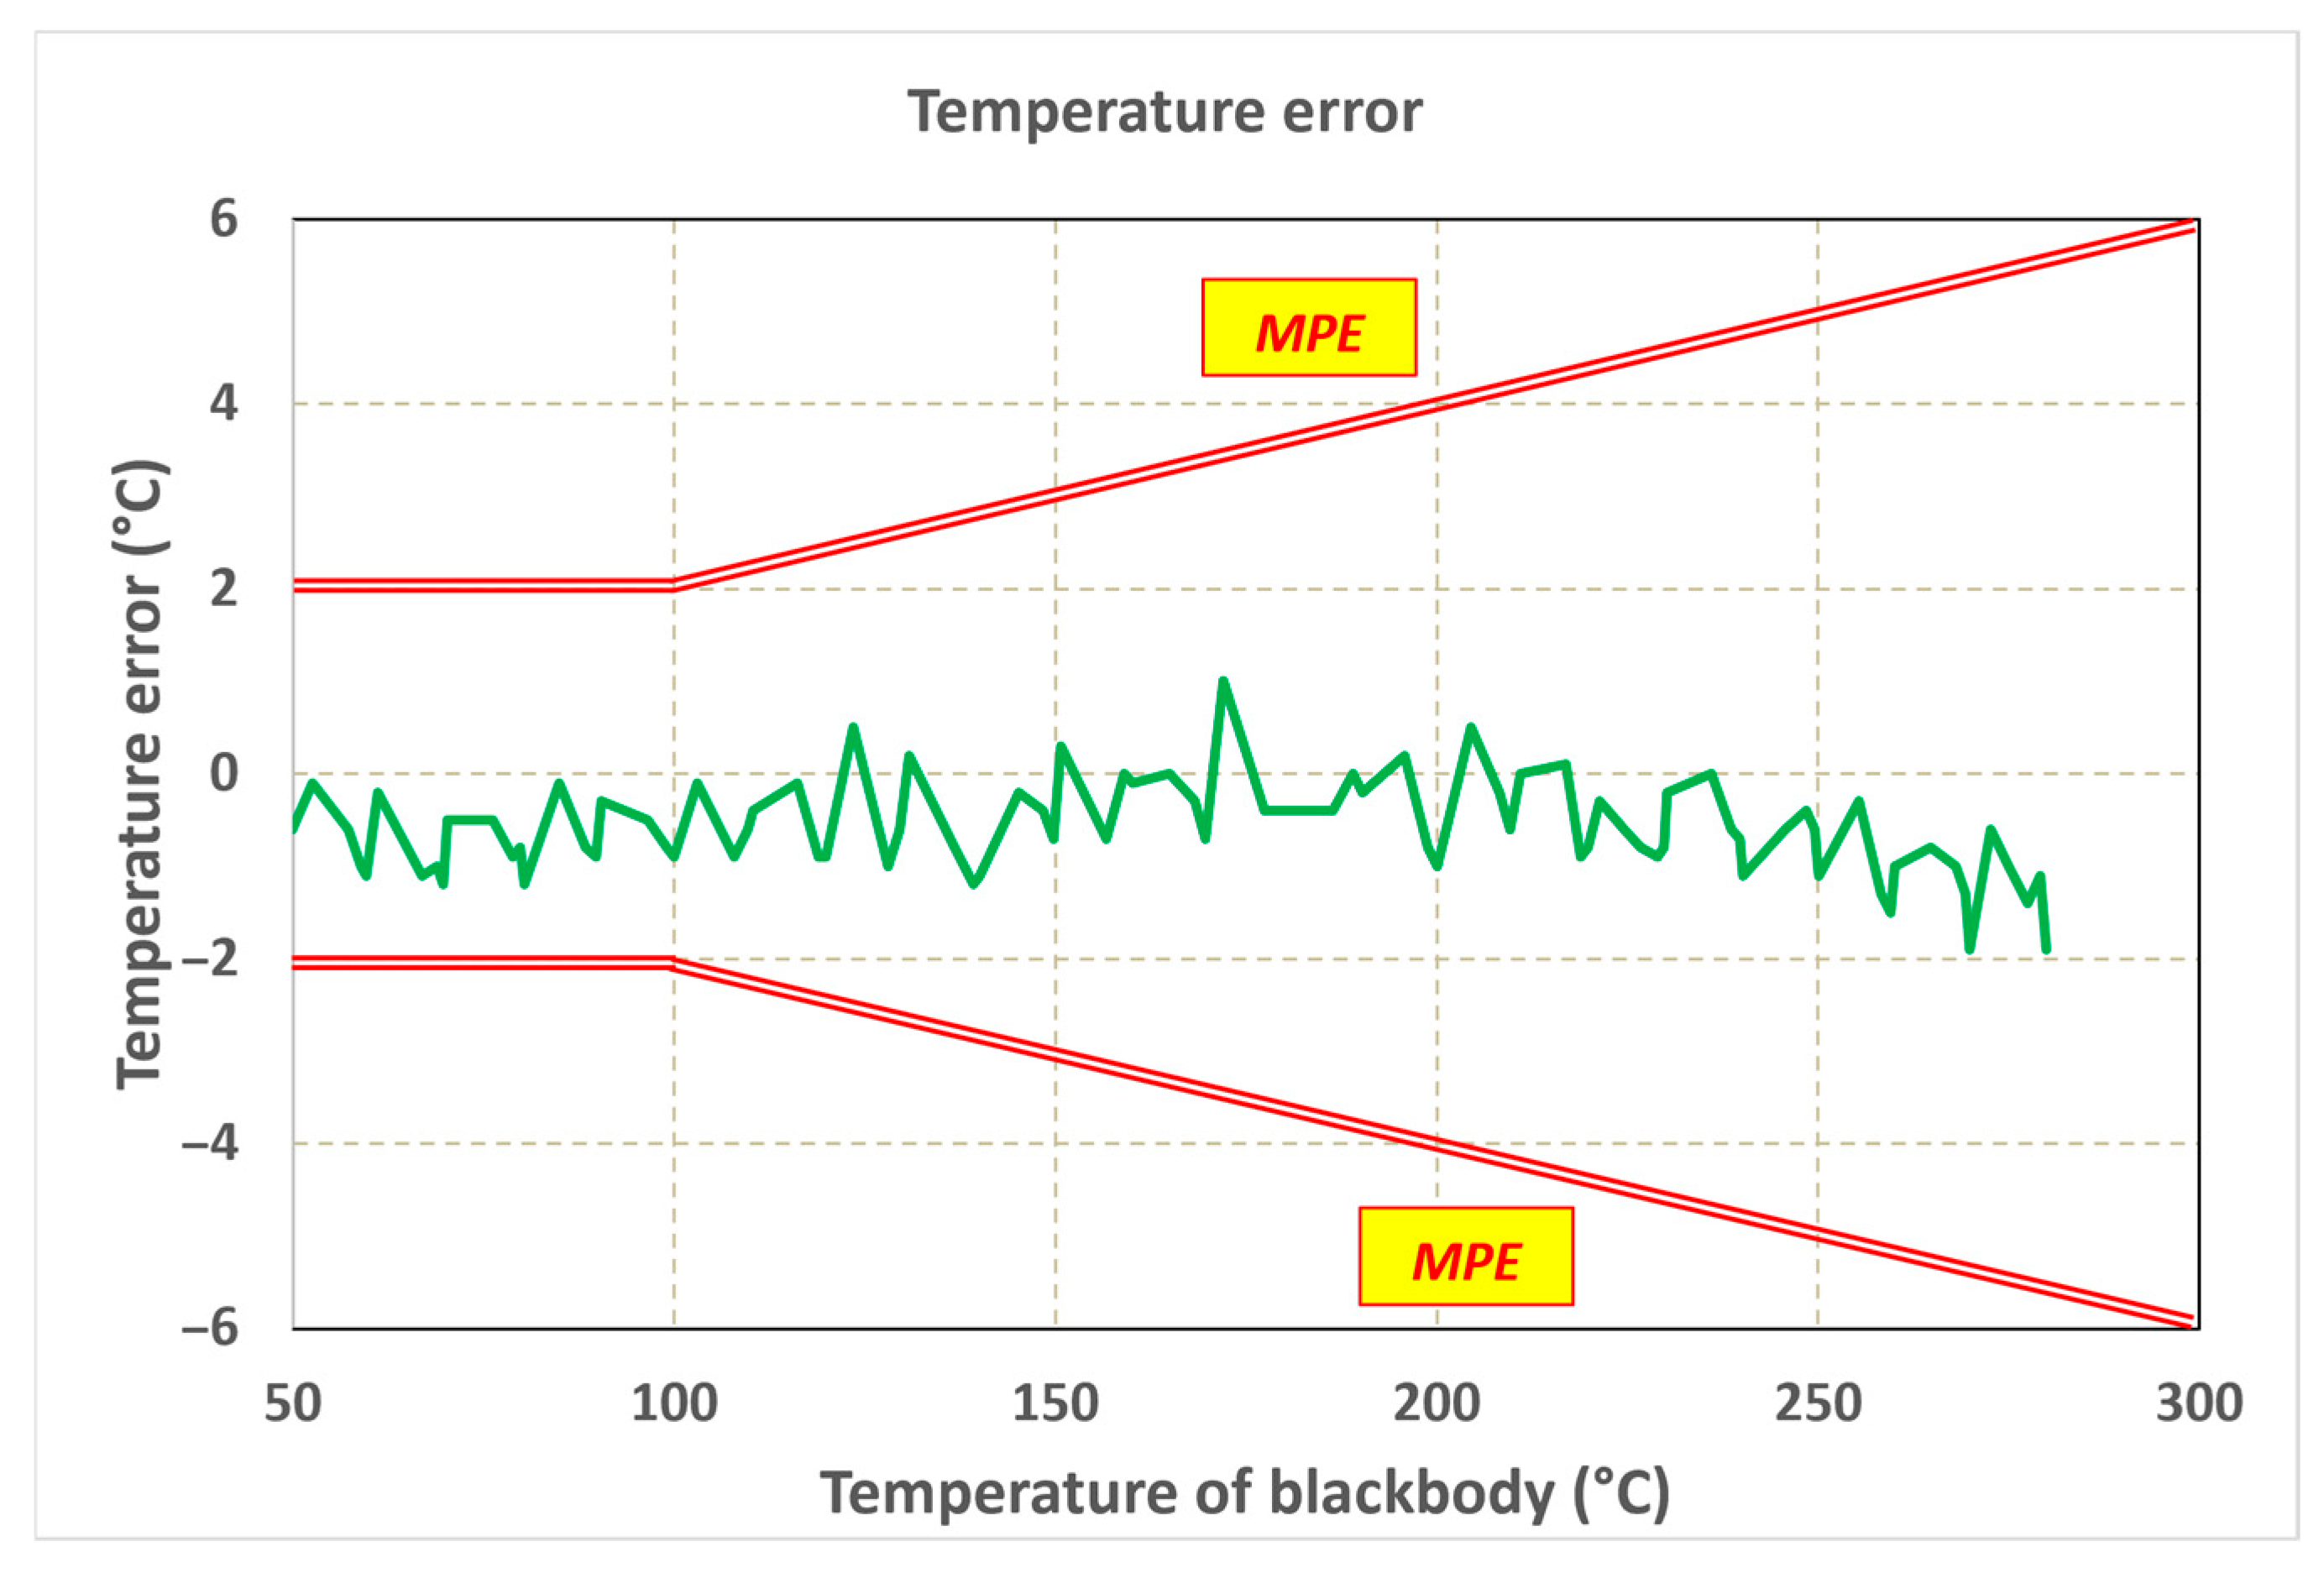
For the selected camera-to-blackbody distance, the temperature error was calculated as the difference between the temperature indication of the evaluated infrared thermal camera and the blackbody reference temperature (
Figure 13).
The maximum temperature error observed during the quasi-static experiment was approximately −1.9 °C, which is lower than the component of the maximum permissible error specified by the manufacturer. The manufacturer declares the accuracy of the infrared thermal camera as ±2 °C or ±2% of the reading. Therefore, the obtained maximum deviation remained within the declared accuracy limits.
A slight decrease in the deviation at higher temperatures was observed. This behaviour may be partly related to the limited resolution of the displayed camera temperature. Since the camera readout was extracted from the video record, the evaluation was based on the displayed numerical value rather than on internal radiometric data. If the camera displays temperature with a coarser resolution than the blackbody reference, rounding and quantization effects can contribute to the apparent error. Therefore, small variations and gradual trends in the deviation curve should be interpreted with respect to the limited resolution of the displayed values.
For this experiment, the following statistical indicators were also evaluated: Mean Absolute Error MAE = 0.69 °C, Root Mean Square Error RMSE = 0.81 °C, and Bias = −0.62 °C. The maximum absolute deviation was approximately 1.90 °C. These values confirm that the infrared thermal camera showed good agreement with the blackbody reference source under quasi-static measurement conditions at a distance of 900 mm.
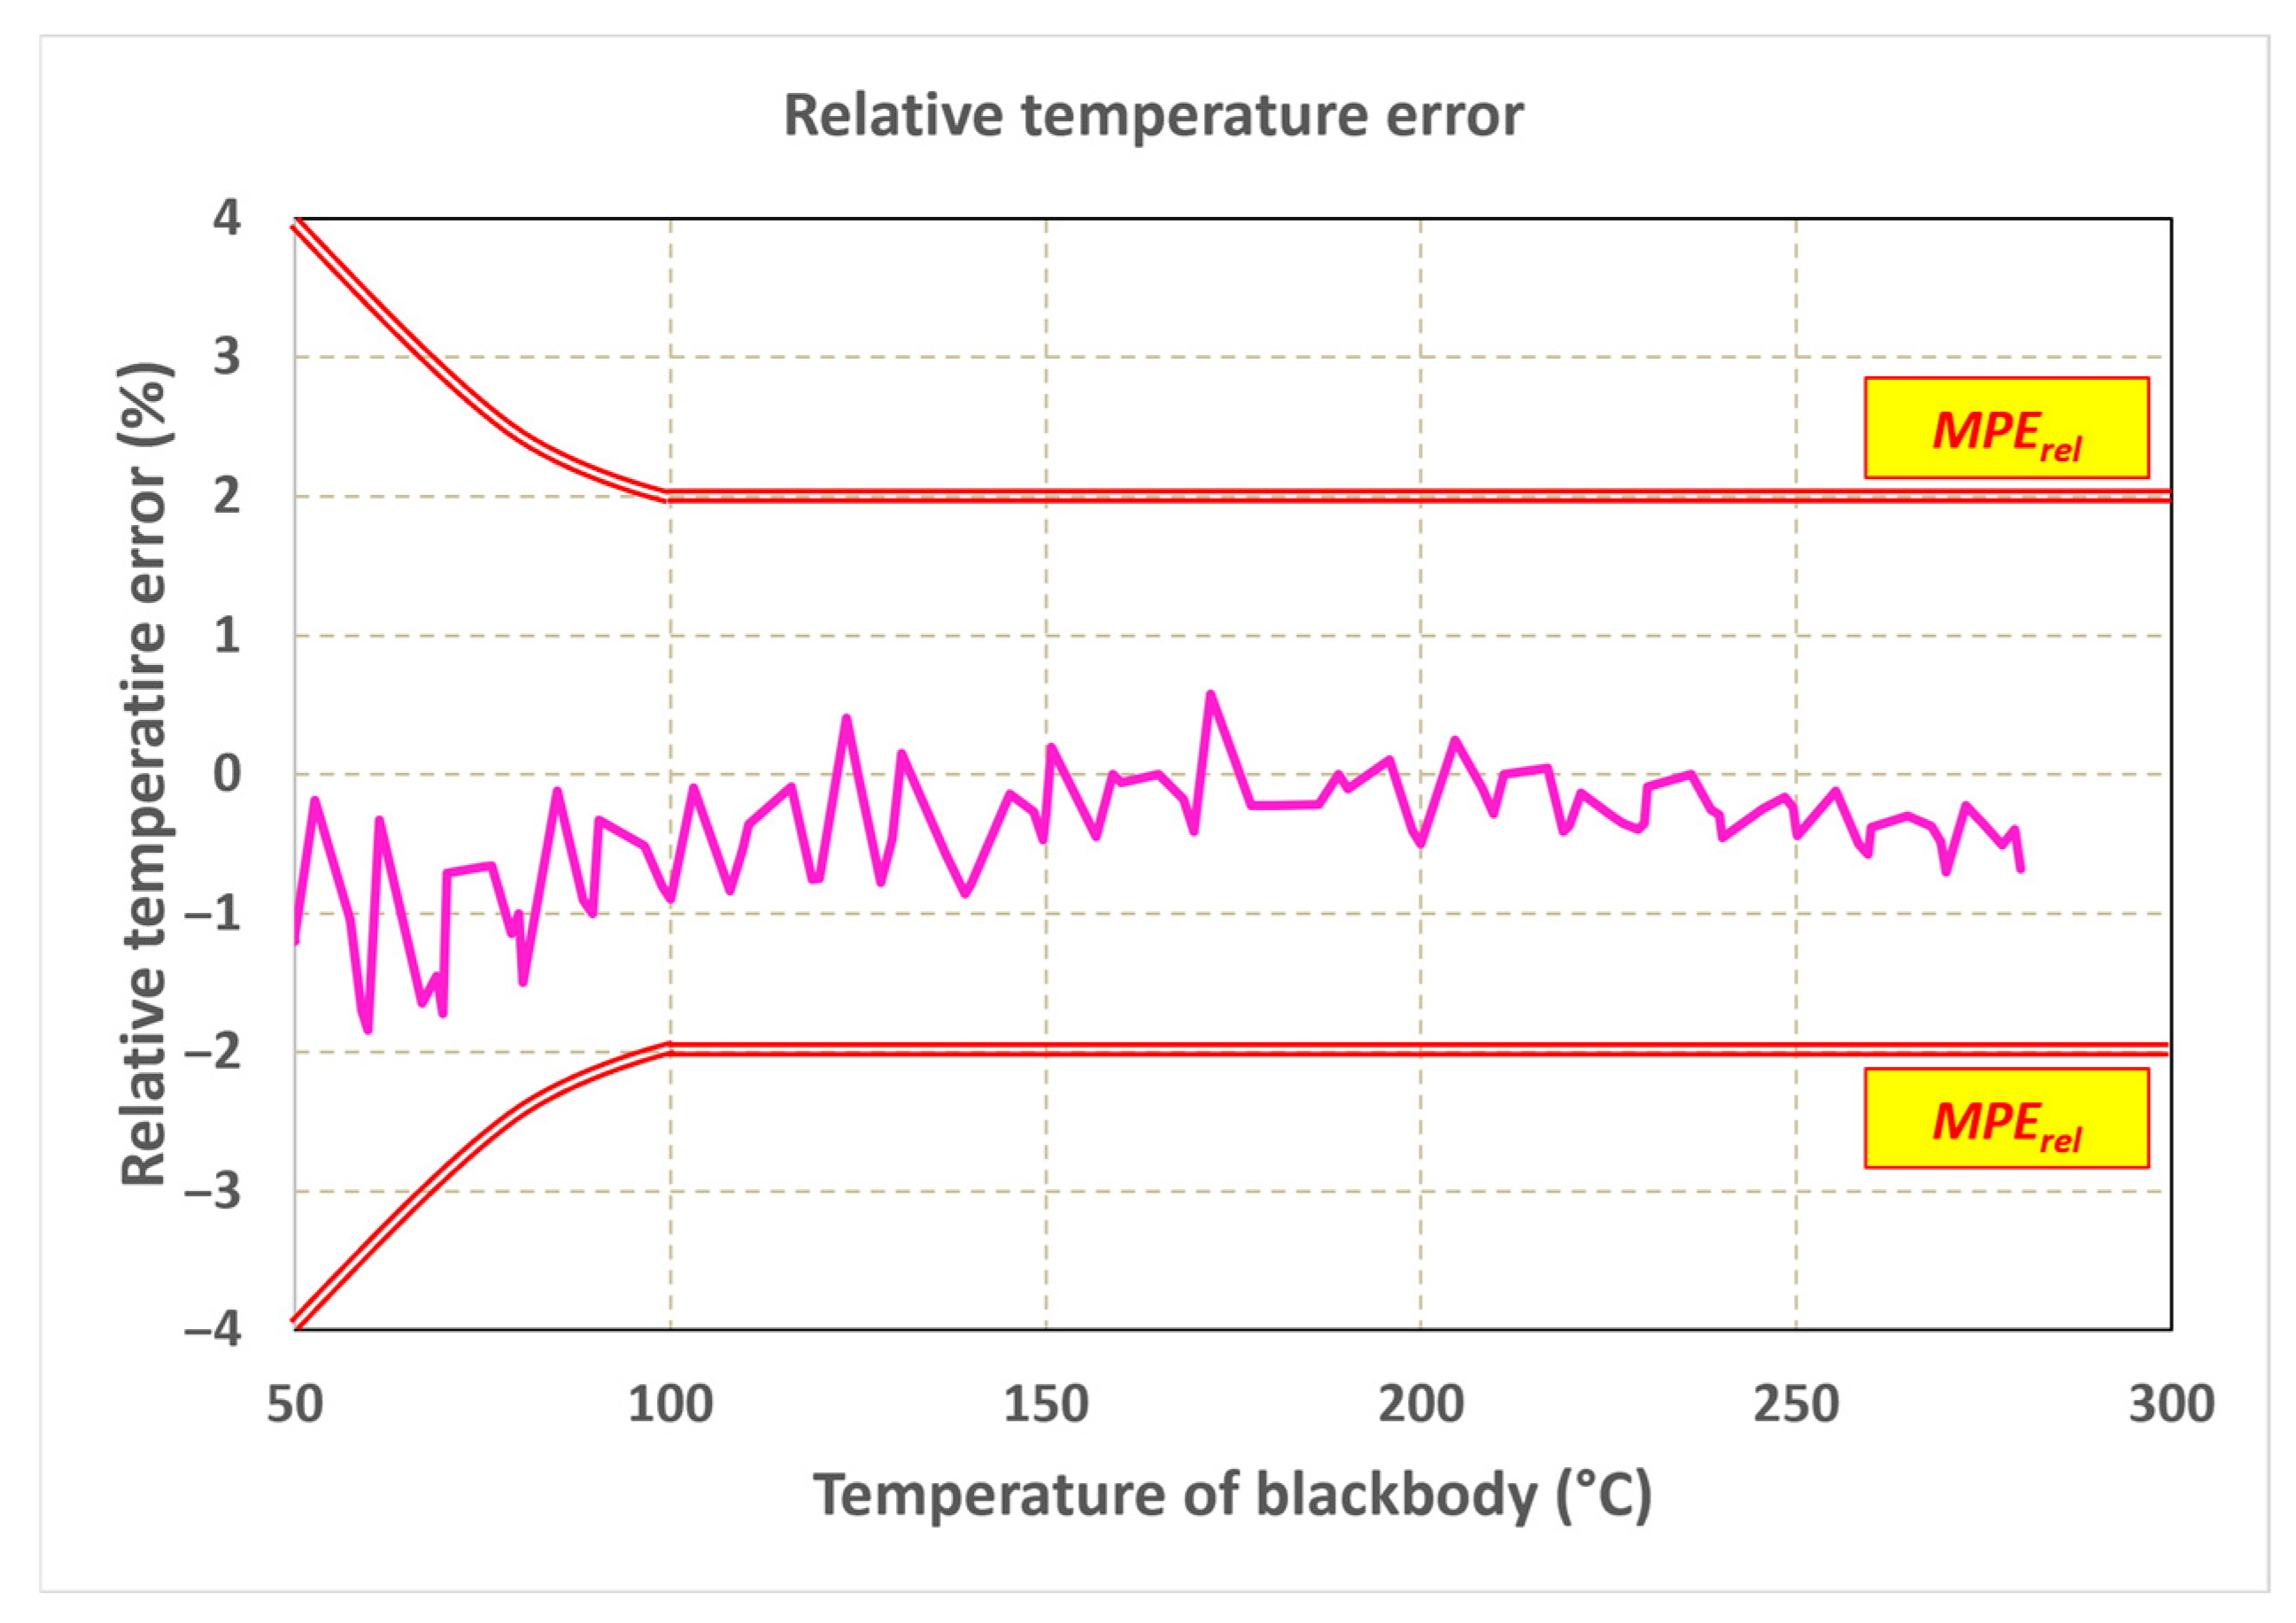
A more informative representation is provided by expressing the errors as relative measurement errors referred to the nominal blackbody temperature (
Figure 14). By applying the proposed video-based evaluation procedure, a relative error curve was obtained for the 900 mm measurement distance. In contrast to conventional manual calibration performed at only a limited number of selected temperature points, this curve contains approximately 90 calibration points. This dense representation provides a more detailed view of the temperature-dependent error behaviour and makes it possible to identify local variations that would not be visible from sparse manual measurements.
3.4. Comparison of Video-Based and Manual Calibration Data
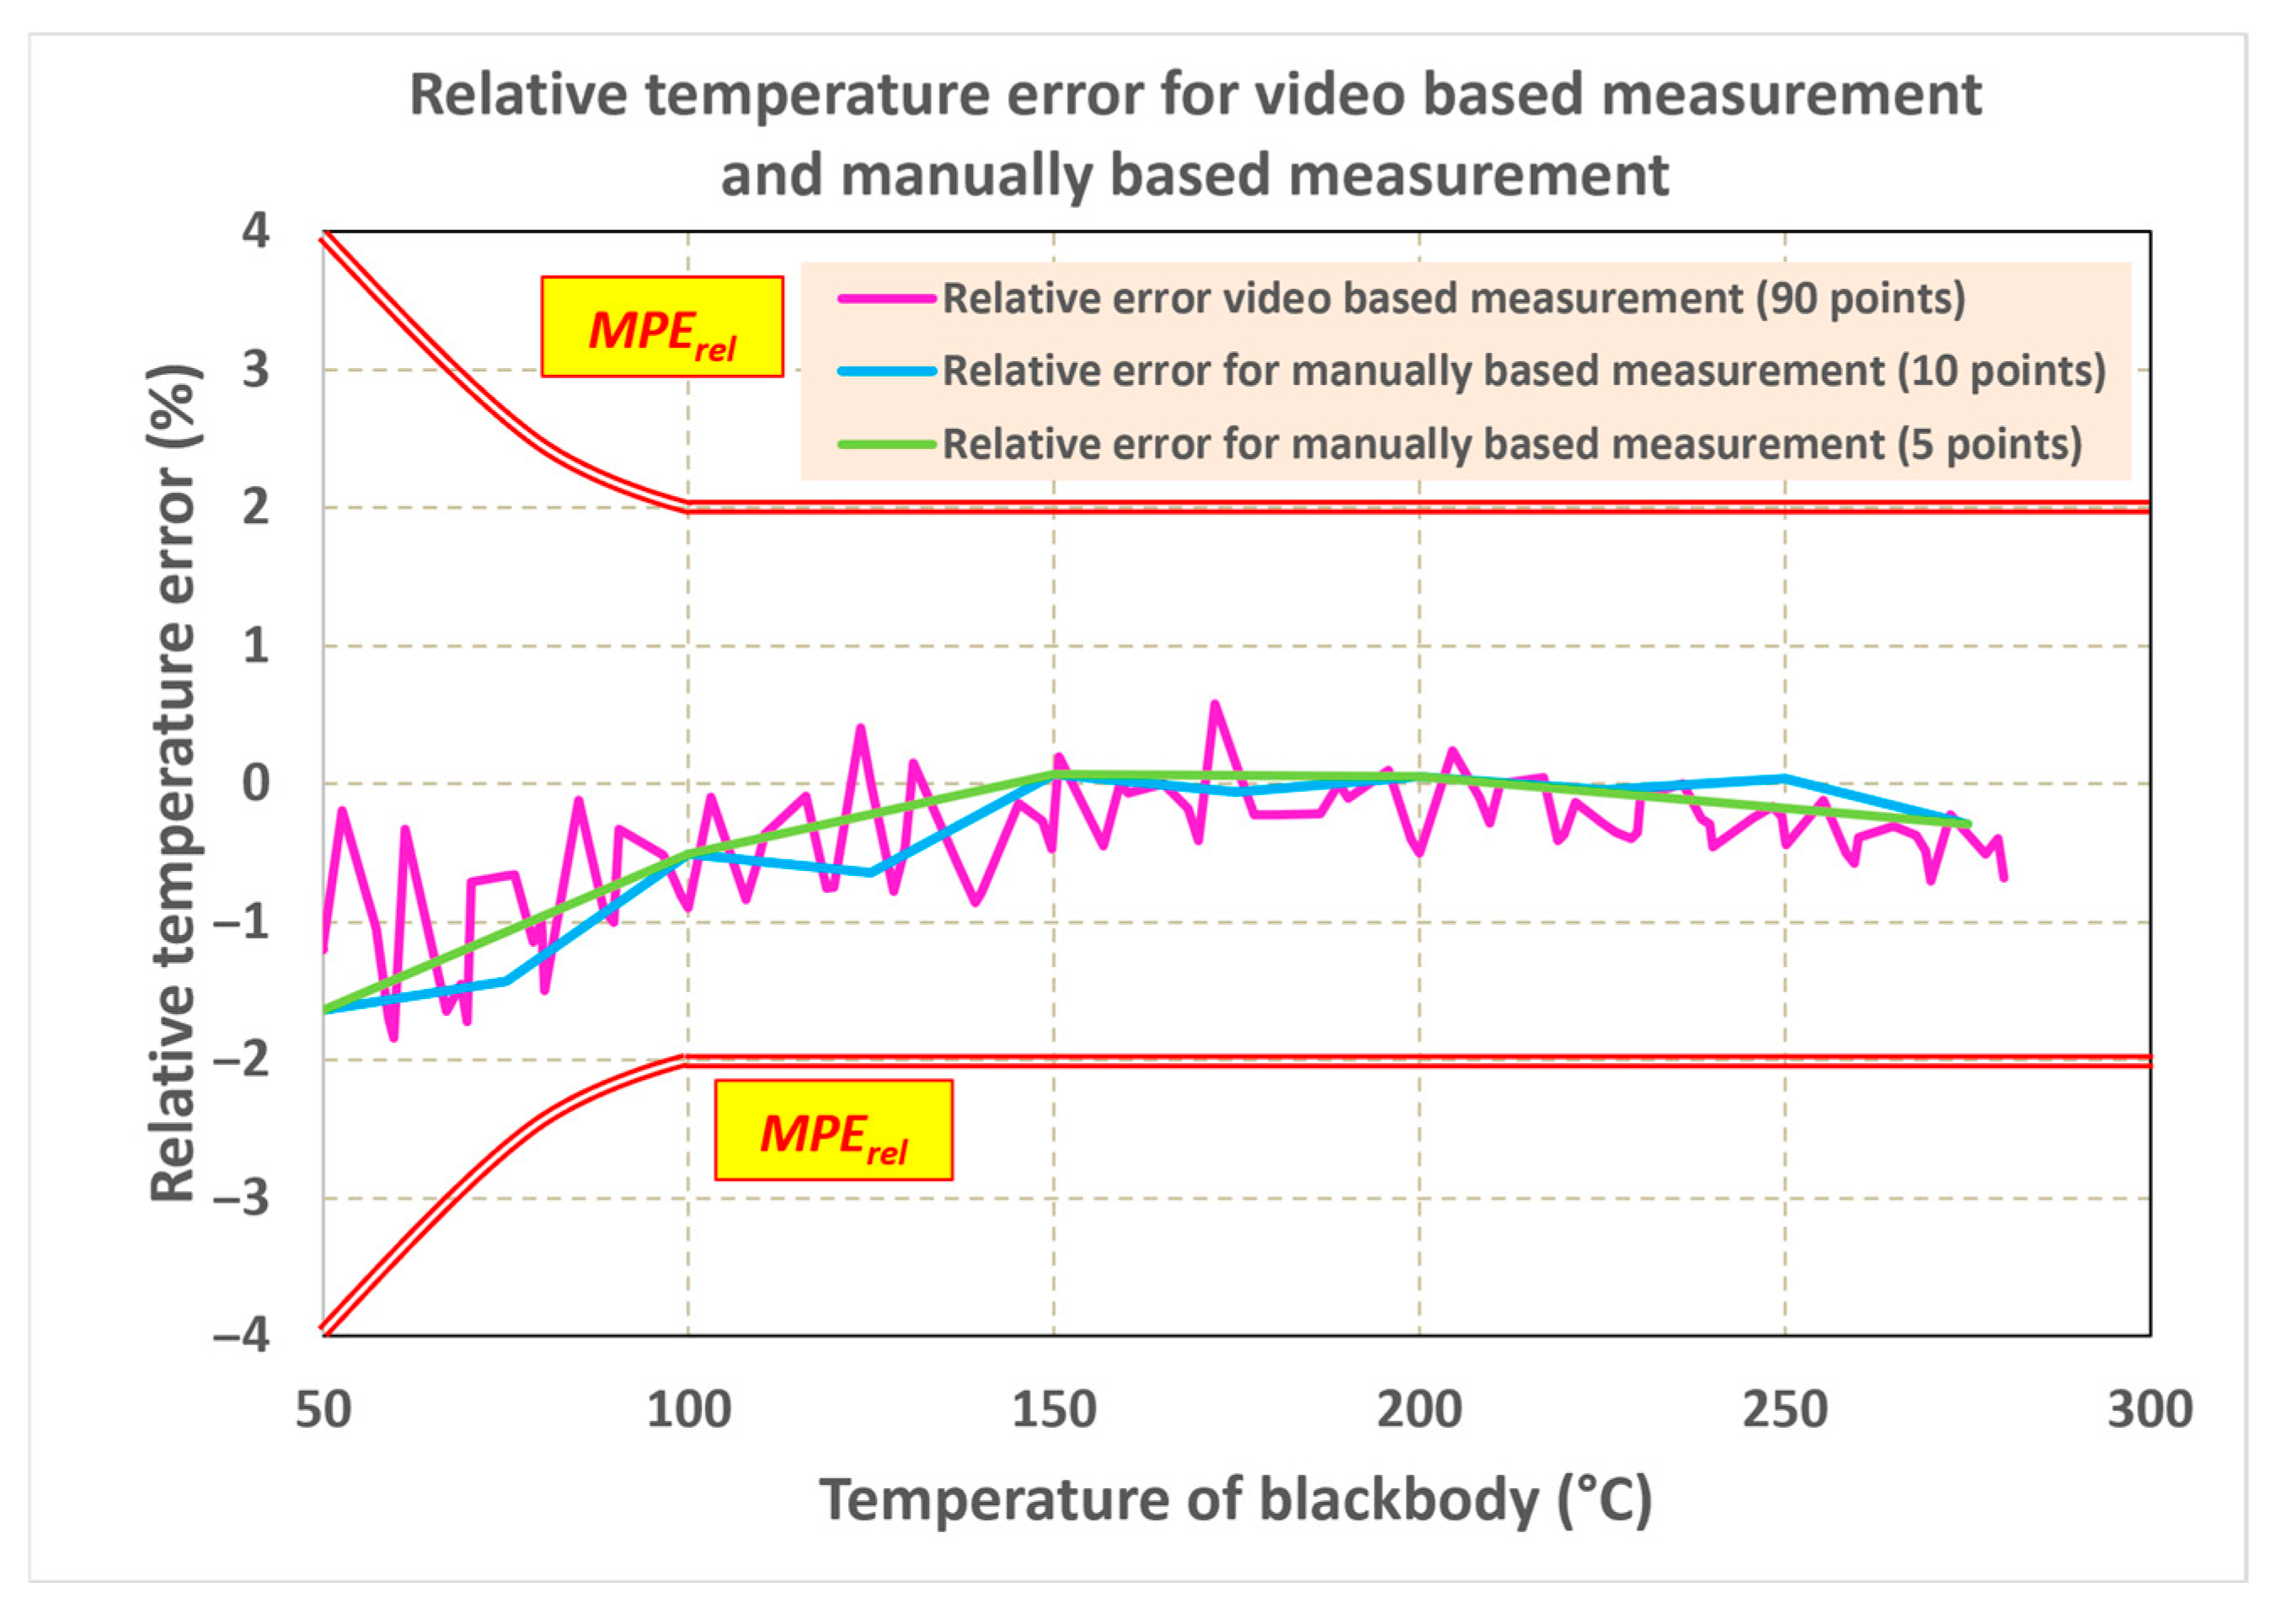
For comparison of the quasi-static video-based method and the manual measurement method, it is useful to present the relative errors in a single graph (
Figure 15). This comparison clearly shows that the use of only five calibration points may be insufficient for a detailed evaluation of the thermographic instrument. Although such a sparse calibration strategy may indicate whether the instrument satisfies the maximum permissible error at selected points, it may fail to detect local deviations occurring between these points.
Therefore, an assessment based only on a limited number of calibration temperatures can lead to an incomplete, or in some cases even incorrect, evaluation of the condition of the thermographic instrument. In contrast, the quasi-static video-based method provides a denser error curve and enables a more detailed analysis of the temperature-dependent measurement behaviour. This represents one of the main advantages of the proposed methodology.
In addition to the quasi-static video-based measurement, the same measurement configuration was evaluated using manually recorded temperature points. The objective of this comparison was not only to verify whether the infrared thermal camera satisfies the manufacturer-specified maximum permissible error, but also to evaluate how much information is lost when only a limited number of calibration points is used.
Figure 15 compares three evaluation strategies. The first curve represents the quasi-static video-based measurement, where 90 temperature points were extracted from the video record. The second curve represents manual measurement using 10 discrete calibration points. The third curve represents a reduced manual strategy using only 5 calibration points, corresponding to a sparse calibration approach.
Although all evaluated relative errors remain within the manufacturer-specified MPErel limits, the differences between the three approaches are significant. The video-based method provides a much more detailed description of the measurement error over the investigated temperature range. In contrast, the manually recorded data provide only a simplified representation of the error curve. The reduced five-point strategy captures only the overall trend and may completely miss local deviations between the selected calibration temperatures.
This is particularly visible in the temperature interval between approximately 50 °C and 150 °C, where the video-based curve contains several local variations that are not represented by the sparse manual measurements. Similarly, at higher temperatures, the video-based curve reveals gradual changes and small local deviations that are smoothed out or completely omitted when only a few calibration points are used.
The comparison demonstrates that compliance with the MPE limit alone does not fully describe the measurement behaviour of the infrared thermal camera. A sparse calibration strategy may confirm that the instrument is within the permissible tolerance, but it cannot provide detailed information about the shape of the error curve. Therefore, local non-linearities, small systematic trends, rounding effects, or temperature-dependent deviations may remain undetected.
The video-based quasi-static method offers an important advantage in this respect. By extracting a larger number of data points from a continuous heating process, it allows the error curve to be reconstructed with much higher resolution. This makes it possible to identify local deviations that would otherwise be missed by conventional manual recording. The method therefore provides a more detailed and informative evaluation of the camera response, while still using a simple experimental setup and a standard blackbody reference source.
It should be emphasized that the presented method is not intended to replace standardized calibration procedures. Rather, it can complement them by providing additional information about the behaviour of the infrared thermal camera between the selected calibration points. This is especially useful when the aim is not only to check compliance with a tolerance limit, but also to analyse the temperature-dependent character of the measurement error.
The results show that, for the investigated measurement distance of 900 mm, the infrared thermal camera remained within the permissible error limits over the evaluated temperature range. However, the dense video-based evaluation revealed a more complex error behaviour than the manual five-point or ten-point measurements. This confirms the main benefit of the proposed methodology: it increases the resolution of calibration evaluation and reduces the risk of overlooking local deviations between discrete calibration points.
3.5. Dynamic Response of the Infrared Thermal Camera
In thermal measurement processes, it can be expected that the measurement system may exhibit a certain delay, rise time and settling time. These dynamic effects should be taken into account when defining the measurement methodology. Manufacturers usually specify the accuracy of infrared thermal cameras, but they do not always provide clear information on how long the measuring sensor should be aimed at the object before the indicated temperature can be considered stable.
For this reason, a simple test based on a rapid step change in the measured temperature can provide useful information about whether the dynamic response of the infrared thermal camera has a significant influence on the measurement result. In this test, the camera view of the blackbody source was initially blocked and then suddenly uncovered. The subsequent change in the temperature indicated by the infrared thermal camera was recorded and evaluated as a transition response.
The same video-based image processing methodology as in the quasi-static continuous verification was used for this measurement. However, in this case, the temperature indication of the infrared thermal camera changed rapidly; therefore, the video data were evaluated with higher temporal resolution. This made it possible to determine the rise time, settling behaviour and overall response speed of the infrared thermal camera after a sudden exposure to the reference temperature source (
Figure 16).
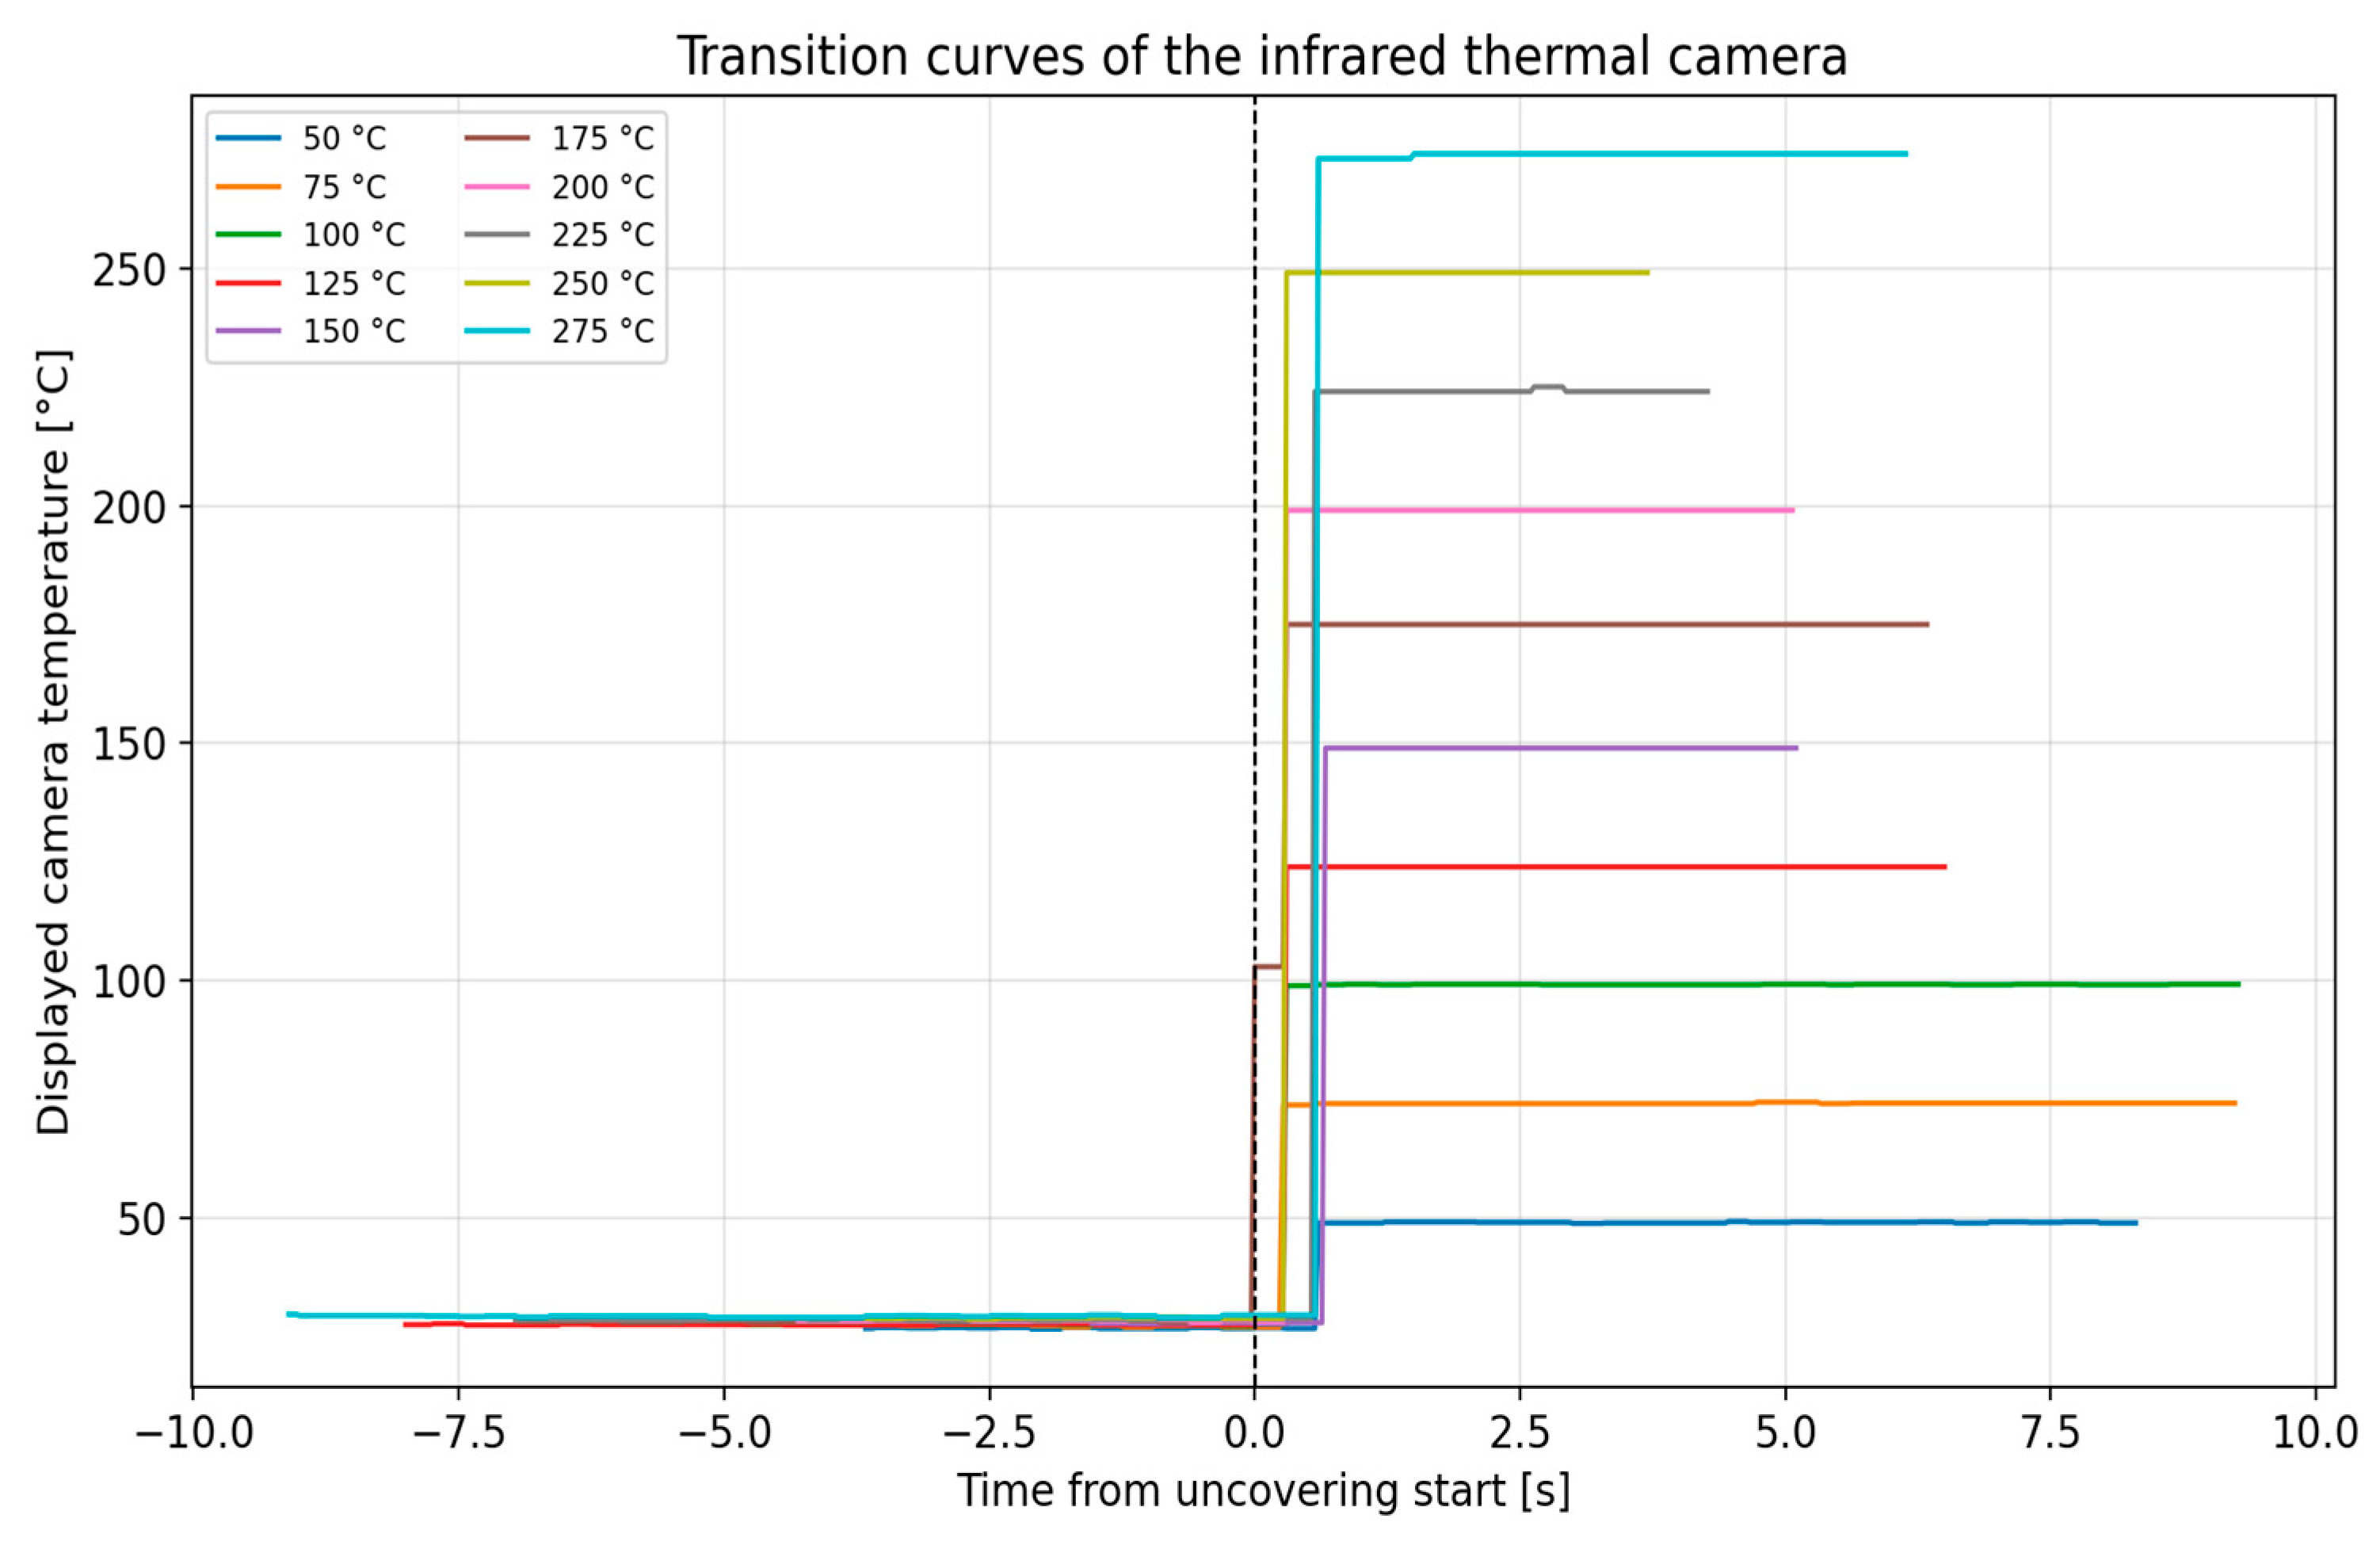
From the recorded transition responses (
Figure 16), the settling times required for the infrared thermal camera indication to reach the stabilized target value corresponding to the blackbody temperature were determined (
Table 3). These values were used to assess how quickly the camera display responded after sudden exposure to the reference temperature source.
The dynamic behaviour of the investigated infrared thermal camera was evaluated using a step-like thermal excitation. During the experiment, the view of the camera to the blackbody source was initially blocked and then suddenly uncovered. This procedure made it possible to analyse the transient response of the displayed camera temperature after exposure to a known reference temperature.
The measurements were performed for several blackbody temperatures in the range from 50 °C to 275 °C. For each temperature level, the camera display was recorded by video and the indicated temperature was extracted frame by frame. The resulting transition curves were then synchronized with respect to the moment of uncovering, which was defined as t = 0.
The obtained transition curves show a very fast response of the infrared thermal camera. The displayed temperature reached 90% and 95% of its final value within approximately 0.3–0.7 s, depending on the investigated temperature level. The average response time was approximately 0.42 s. Settling time for displayed temperatures is in
Table 3. This indicates that the displayed temperature response of the camera is almost immediate in comparison with the time scale of the quasi-static heating experiment.
This result is important for the interpretation of the calibration measurements. During the quasi-static experiment, the blackbody temperature increased at an average rate of approximately 0.05 °C/s. Therefore, even a response delay of 0.42 s would correspond to an apparent temperature error of only about 0.02 °C. Even for the longest observed response times, the corresponding dynamic error would remain below approximately 0.03 °C. Such a contribution is negligible compared with the observed calibration deviations.
Consequently, the dynamic response of the infrared thermal camera cannot be considered a significant source of error in the quasi-static calibration experiment. The results confirm that, under slow heating conditions, the measured deviations mainly represent the quasi-static measurement behaviour of the camera rather than a delay caused by its temporal response.
It should be noted that the evaluated response corresponds to the temperature value displayed by the camera and extracted from the video record. Therefore, the obtained response time includes not only the detector response, but also internal signal processing, display update rate, and video recording limitations. Nevertheless, for the purpose of the present experimental methodology, the response was sufficiently fast and did not limit the accuracy of the quasi-static evaluation.
3.6. Repeatability of the Thermographic Instrument Readings
The repeatability of the thermographic instrument readings was evaluated at the selected measurement distance of 900 mm for ten blackbody temperature levels. For each temperature level, the indicated camera temperature was recorded over a 15 min interval and evaluated using three consecutive 5 min mean values.
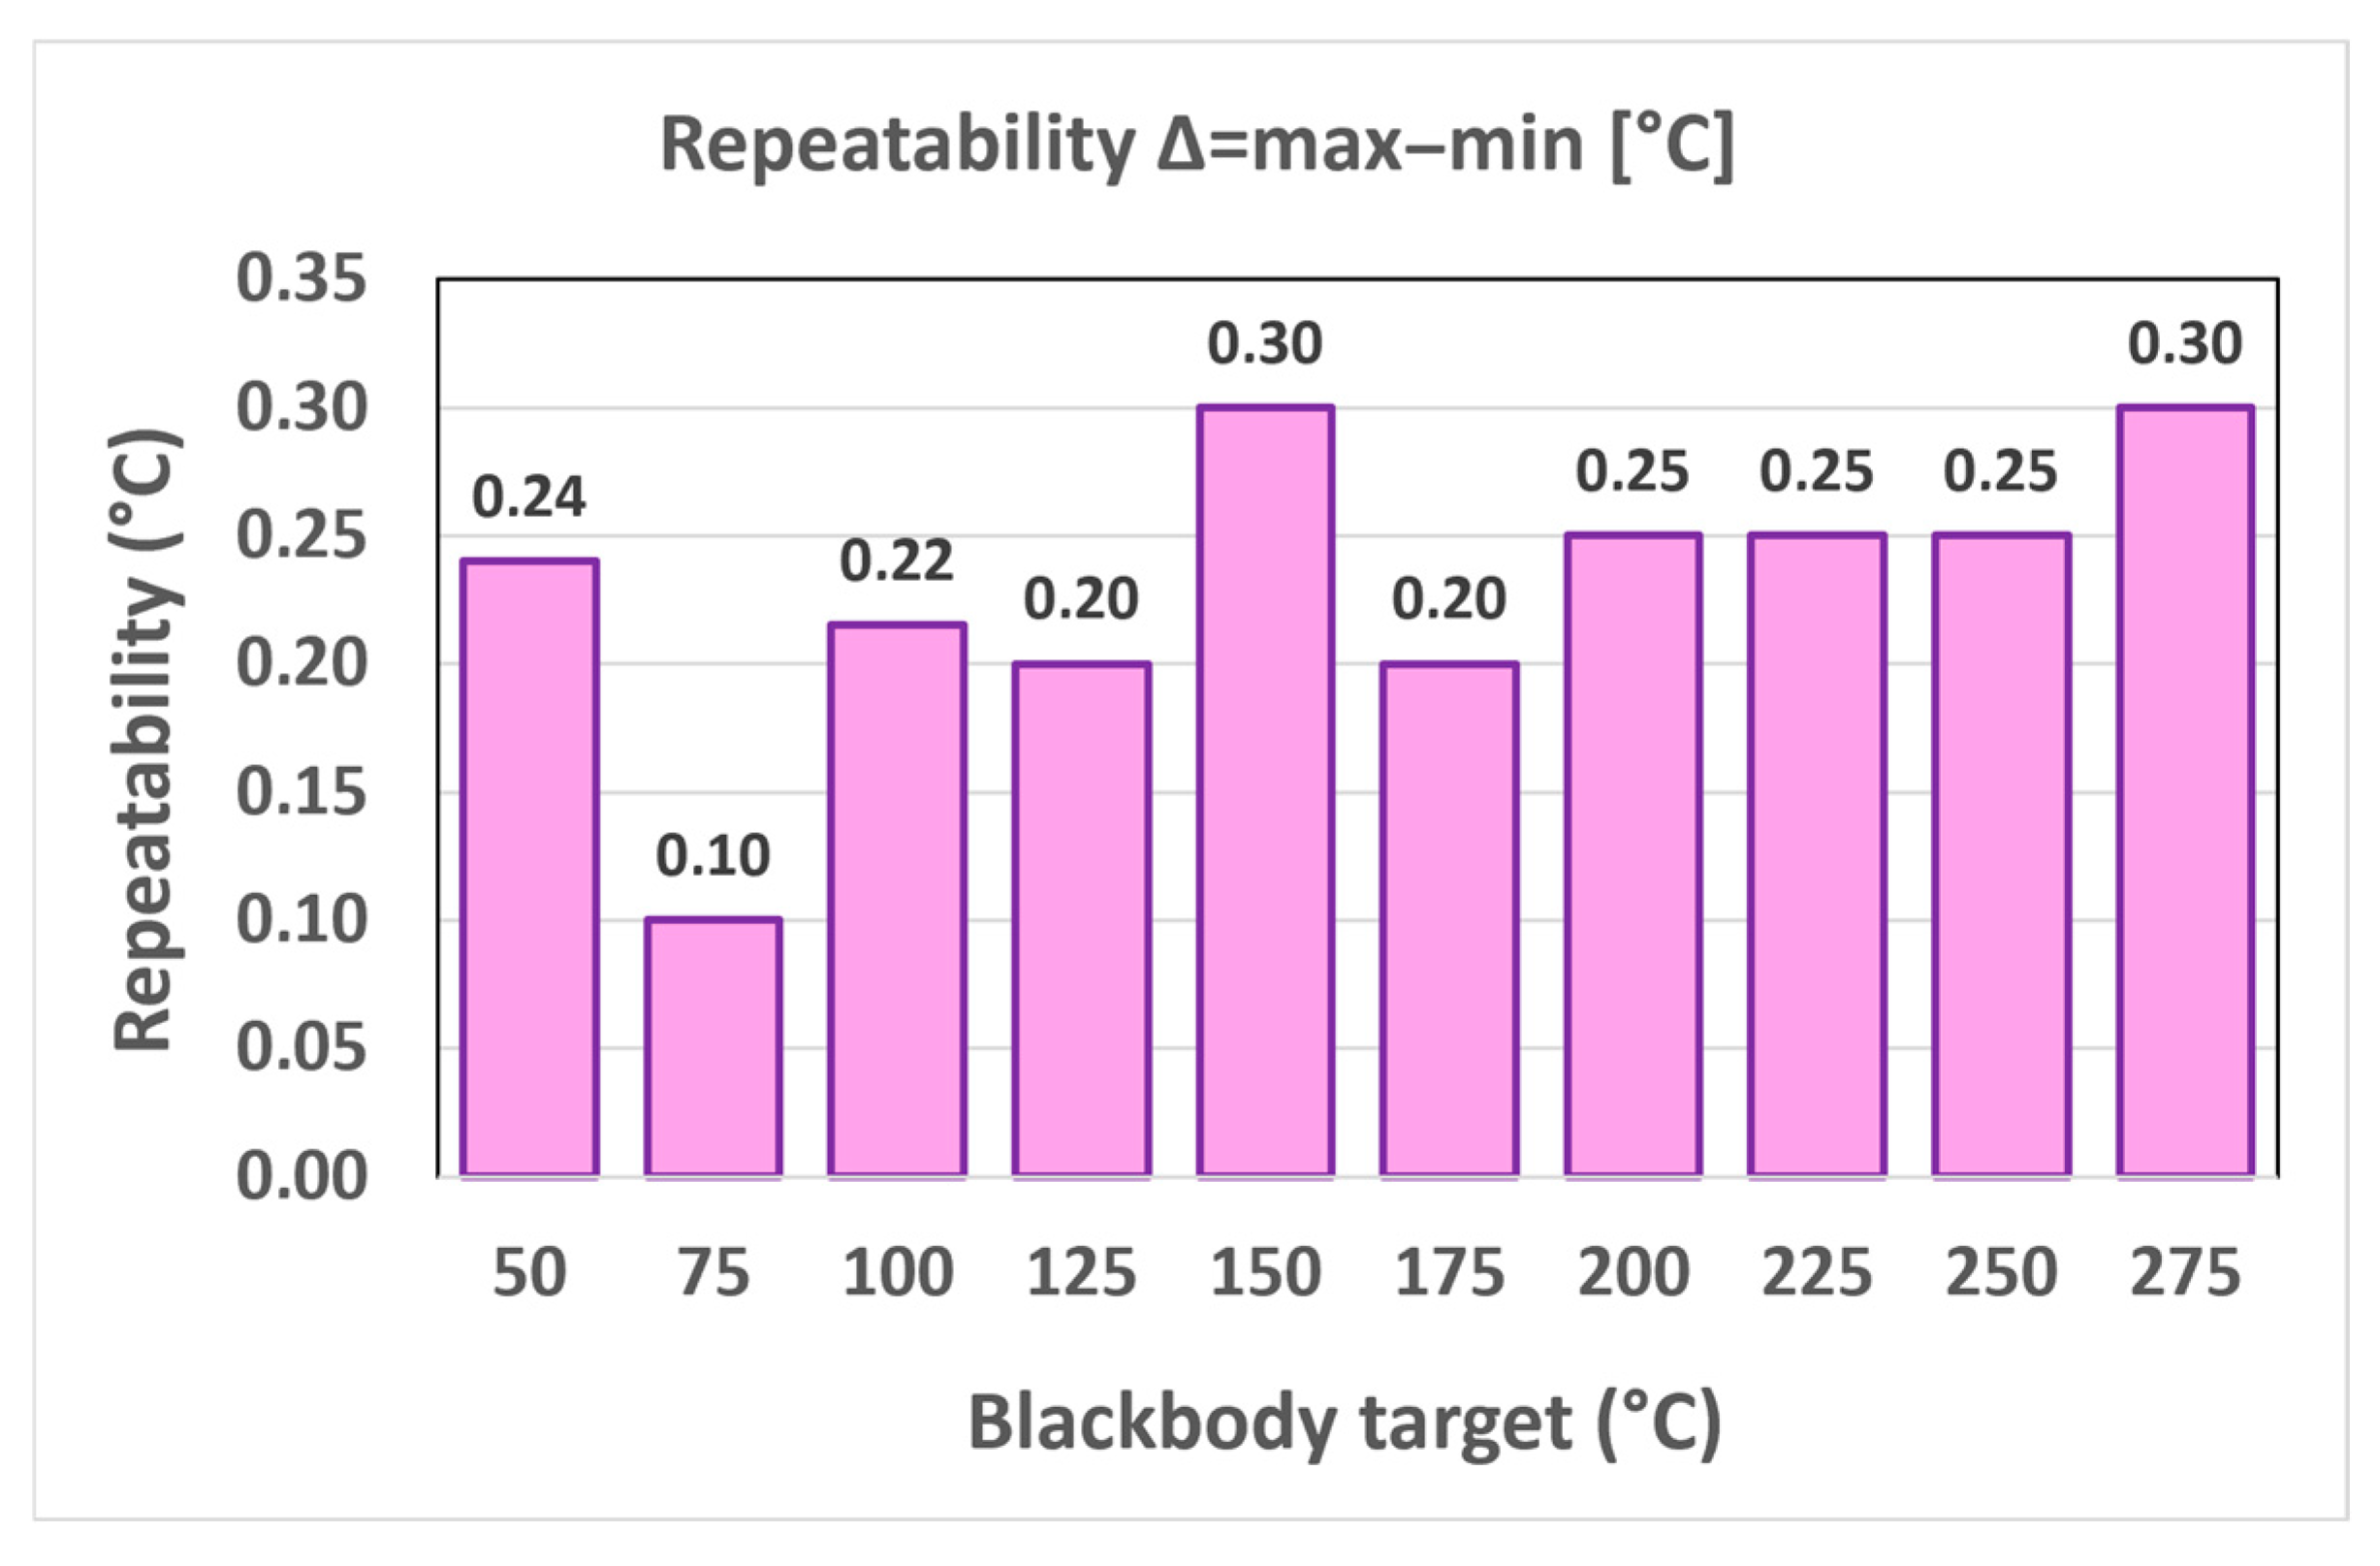
In the initial evaluation, several temperature levels yielded an apparent repeatability of 0.00 °C, because the displayed camera value remained unchanged during the whole observation interval. However, such a result does not necessarily imply perfect physical stability of the measurement system. Rather, it may reflect the limited resolution of the camera display, especially at higher temperatures where the readout is effectively quantized. For this reason, the zero repeatability values were conservatively replaced by the measurement uncertainty/display resolution-related value, resulting in the modified repeatability plot shown in
Figure 17. This correction provides a more realistic representation of the achievable repeatability and avoids overinterpretation of the zero values.
The obtained results (
Figure 17) indicate that the repeatability of the investigated infrared thermal camera is very good over the entire tested temperature range. The evaluated repeatability values lie approximately between 0.10 °C and 0.30 °C, which demonstrates high temporal stability of the indicated temperature during the 15 min observation period. The lowest repeatability value was observed at 75 °C, while the highest values occurred at 150 °C and 275 °C. Nevertheless, even these maximum values remain very small in absolute terms.
An important outcome is that the repeatability does not show any substantial deterioration with increasing temperature. Instead, the results remain within a narrow band across the full investigated range. This suggests that, once the measuring geometry is appropriately selected, the time stability of the infrared thermal camera indication is sufficient for practical calibration-oriented measurements. The slightly higher values observed at some temperature levels may be associated with residual thermal fluctuations of the source, display quantization, or small readout variations introduced by the video-based extraction process, rather than with a fundamental instability of the camera itself.
Overall, the repeatability analysis confirms that the proposed video-based methodology is suitable not only for static accuracy evaluation, but also for assessing the temporal stability of thermographic readings. The results further support the conclusion that the selected measuring distance of 900 mm is appropriate for detailed quasi-static calibration experiments and subsequent uncertainty-oriented analysis.
The manufacturer’s publicly available documentation for the investigated infrared thermal camera specifies the measurement accuracy as ±2 °C or ±2% of the reading. However, a separate manufacturer-declared value for the repeatability of the thermographic instrument readings was not found in the available documentation. Therefore, the experimentally determined repeatability was evaluated independently using the procedure based on repeated readings over three consecutive 5 min intervals.
4. Main Contribution and Discussion
The novelty of this work does not lie in replacing standard blackbody-based calibration procedures, but in extending them by a practical video-based data acquisition and image-processing approach. The proposed method enables quantitative evaluation of infrared thermal camera indications even when neither the camera nor the blackbody calibrator provides direct digital data output. In contrast to conventional sparse manual recording, the method provides a dense temperature-dependent error curve obtained during quasi-static heating. This allows local error variations, distance-dependent behaviour, dynamic response and repeatability of the displayed temperature indication to be analysed within a single experimental framework.
The main contributions of this work can be summarized as follows:
- (i)
A video-based data acquisition workflow for simultaneous extraction of blackbody reference temperature and infrared thermal camera indication without direct digital communication with the instruments;
- (ii)
A dense quasi-static temperature-dependent error evaluation that reveals local deviations not captured by five- or ten-point manual calibration;
- (iii)
An integrated experimental assessment of distance influence, displayed dynamic response and repeatability using the same video-based processing principle.
This methodology makes it possible to transform a conventional visual calibration experiment into a quantitatively evaluable dataset. Instead of manually recording only a limited number of calibration points, the proposed method enables the extraction of a dense temperature-dependent error curve. This provides substantially more information about the behaviour of the camera over the investigated temperature range.
A key part of the proposed method is the robust extraction of numerical values from the video record. Regions of interest corresponding to the blackbody display and the camera temperature readout are defined, preprocessed and evaluated. Multiple frames around each sampling instant can be used to reduce the influence of display flickering, incomplete digit visibility, reflections and short-term recognition artefacts. As a result, the extracted data are more reliable than values obtained from a single video frame.
The proposed video-based approach should therefore not be interpreted as a replacement for direct digital acquisition when such output is available. It is intended as a practical alternative for thermographic instruments and reference sources that do not provide accessible synchronized digital data output.
Before applying the detailed video-based evaluation, a preliminary manual measurement was performed at different distances between the blackbody source and the infrared thermal camera. The results were evaluated using MAE, RMSE and Bias. This analysis showed that the camera-to-blackbody measurement configuration, including distance, target angular size and pixel coverage, had a significant influence on the indicated temperature. The lowest MAE, the lowest RMSE and the smallest absolute Bias were obtained at a distance of 900 mm. Therefore, this distance was selected as the most suitable configuration for the subsequent detailed quasi-static video-based measurements.
The selected distance of 900 mm should not be understood as a universal optimal distance for infrared thermal cameras. It represents the most suitable measurement configuration identified for the investigated camera–blackbody arrangement. The purpose of the distance evaluation was not to prescribe a fixed distance for all thermographic instruments, but to demonstrate a practical procedure for identifying a suitable measurement configuration for a given camera, blackbody aperture, optical field of view, IFOV, focusing capability and radiometric settings.
If a different infrared thermal camera were used, the most suitable distance could change. Cameras with different field of view, detector resolution, IFOV, minimum focus distance, optical design, distance compensation algorithm or internal radiometric processing may require a different camera-to-blackbody distance to achieve sufficient target coverage and stable temperature indication. Similarly, a blackbody source with a different aperture diameter would change the angular size of the reference source and the number of pixels covering the target. Therefore, the proposed methodology should be interpreted as a procedure for experimentally determining the most suitable configuration for a specific thermographic system, rather than as a recommendation of 900 mm as a general calibration distance.
The influence of measurement distance should not be interpreted as a purely geometrical distance effect. Changing the distance between the blackbody reference source and the infrared thermal camera also changes the angular size of the blackbody aperture, the number of detector pixels covering the target, the target size relative to the IFOV and the possible contribution of the size-of-source effect. For the 60 mm blackbody aperture used in this study, the calculated angular diameter decreases from approximately 33.4° at 100 mm to approximately 1.15° at 3000 mm. Using the manufacturer-specified IFOV of 6.9 mrad, this corresponds to a reduction in the target diameter from approximately 84 pixels to approximately 3 pixels.
This reduction in pixel coverage is important because, at larger distances, the blackbody aperture occupies only a small part of the detector array. As a result, the measured temperature may be increasingly influenced by the surrounding background, the point spread function of the optical system, edge effects and the size-of-source effect. This can explain the increasing negative Bias observed at larger distances. Conversely, at very short distances the target covers a large part of the field of view, but the measurement may be affected by focusing limitations, optical geometry and non-uniform sampling of the blackbody aperture. Therefore, the distance of 900 mm should be interpreted as the most suitable measurement configuration for the investigated camera–blackbody arrangement, rather than as a universal optimal distance.
The method was further improved by using a slow quasi-static heating process of the blackbody source. This significantly reduced the influence of dynamic effects that may occur during rapid heating, such as thermal lag of the blackbody surface, delayed indication of the reference temperature, or the response time of the infrared thermal camera. The heating rate during the quasi-static experiment was approximately 0.05 °C/s, which was sufficiently low to reduce the effect of transient thermal behaviour.
The influence of radiometric compensation and spectral characteristics should also be considered when interpreting the obtained measurement errors. Over the investigated blackbody temperature range from approximately 50 °C to 275 °C, the spectral radiance distribution of the blackbody source changes substantially. Since the evaluated camera operates in the long-wave infrared band of 7.5–13 µm, only part of the total blackbody radiation contributes to the detected signal. The retrieved temperature therefore depends not only on the blackbody reference temperature, but also on the effective emissivity of the blackbody surface within this spectral band, the spectral response of the camera, the reflected apparent temperature, atmospheric transmission, measurement distance, atmospheric temperature and relative humidity.
In the present study, these effects were minimized by using a high-emissivity blackbody reference source, by setting the camera emissivity to 0.95, by setting the reflected apparent temperature to 22 °C, and by performing the experiments under controlled indoor laboratory conditions. The atmospheric temperature was 22 ± 1 °C and the relative humidity was 50 ± 10% RH. The distance compensation parameter was set to the nearest available integer metre value allowed by the camera. Nevertheless, because the full spectral emissivity curve of the blackbody source and the normalized spectral response curve of the camera were not available, their individual contributions to the observed measurement error could not be separated. These effects may contribute to the temperature-dependent Bias and local variations visible in the dense video-based error curves.
The dynamic response tests showed that the displayed temperature of the camera reacts very quickly, with response times below approximately 0.7 s. Compared with the slow heating rate used in the quasi-static experiment, this delay represents a negligible contribution to the evaluated error. Even for a response time of 0.7 s, the corresponding dynamic temperature error would be only about 0.03 °C. Therefore, the dynamic response of the camera did not significantly affect the quasi-static calibration results.
The proposed video-based evaluation also showed an important advantage over sparse manual measurement. Although the manual calibration points and the dense video-based data both confirmed that the investigated camera remained within the permissible error limits, the dense dataset revealed local variations and temperature-dependent trends that would not be visible from only five or ten manually recorded points. Therefore, the method does not merely verify whether the camera satisfies the maximum permissible error; it also provides a more detailed description of the shape of the error curve.
This is particularly important because sparse calibration strategies may confirm compliance with tolerance limits while missing local deviations between selected calibration points. In contrast, the proposed method allows these deviations to be observed and analysed. The method can therefore serve as a useful complementary tool to standard calibration procedures, especially in cases where the objective is to investigate the detailed temperature-dependent behaviour of an infrared thermal camera.
Another factor that may influence the continuous error curve is the internal correction strategy of the infrared thermal camera. Handheld uncooled thermal cameras commonly perform internal non-uniformity correction or flat-field correction to compensate detector offset drift and non-uniform detector response. Such operations may temporarily affect the displayed temperature indication. In the present study, the camera did not provide a digital log of NUC/FFC events, gain state or internal correction status. Therefore, these internal processes could not be separated from the displayed temperature data.
For this reason, the local variations observed in the continuous error curve should be interpreted as variations in the displayed temperature indication of the complete thermographic instrument under the specified operating conditions. They should not be interpreted as isolated detector-level variations. The possible contribution of internal correction operations, thermal drift compensation and internal range-related processing is therefore considered as a limitation of the proposed display-based evaluation method. Future work should include cameras with access to raw radiometric data or internal event logs in order to distinguish true radiometric error variations from artefacts caused by internal correction procedures.
The video-based methodology was also applied to the evaluation of the repeatability of the thermographic instrument readings. For this purpose, separate video records were acquired at ten selected blackbody temperature levels at the 900 mm as the most suitable measurement configuration for the investigated camera–blackbody arrangement. The indicated camera temperature was extracted from each video at regular time intervals over a 15 min observation period. The data were divided into three consecutive 5 min intervals, and the mean temperature was calculated for each interval. The repeatability was then expressed as the difference between the maximum and minimum of these three mean values.
The repeatability results confirmed very good temporal stability of the displayed temperature indication. The obtained repeatability values were in the range of approximately 0.10–0.30 °C. Apparent zero repeatability values were not interpreted as perfect physical stability, because they may result from the limited resolution of the displayed camera temperature, especially at higher temperatures. Therefore, these values were conservatively replaced by a value related to the measurement uncertainty or display resolution. The resulting repeatability evaluation shows that the camera indication remained stable over time and that no substantial deterioration of repeatability was observed over the investigated temperature range.
This repeatability analysis further demonstrates the usefulness of the proposed video-based approach. The same methodology that was used for the evaluation of calibration deviation can also be applied to the analysis of temporal stability. Thus, video-based image processing provides not only a dense temperature-dependent error curve, but also additional information about the stability of the thermographic instrument readings during longer observation periods.
The reliability of the blackbody reference quantity is an important factor in the interpretation of the obtained measurement errors. In this study, the temperature displayed by the blackbody controller was used as the reference value. This value represents the temperature controlled by the internal regulation system of the blackbody calibrator and was supported by an independent contact thermometer check using the measurement port of the calibrator. The difference between the contact thermometer reading and the blackbody indication was below ±0.5 °C, which is consistent with the specified accuracy of the blackbody source.
However, the displayed controller temperature cannot be interpreted as a direct spatially resolved measurement of the radiance temperature over the entire blackbody aperture. Possible contributions may arise from aperture temperature non-uniformity, uncertainty of the blackbody calibration, uncertainty of the contact thermometer check and thermal lag during continuous heating. These effects were reduced by using a high-emissivity blackbody calibrator, stable indoor laboratory conditions and a slow quasi-static heating rate. Nevertheless, the reference source uncertainty remains part of the total measurement uncertainty and may contribute to the observed temperature-dependent error of the infrared thermal camera.
In summary, the scientific contribution of this work lies in demonstrating that video recording combined with image processing can be used as a practical and effective method for high-resolution evaluation of infrared thermal camera performance. The approach is simple, does not require direct instrument communication, preserves the experimental setup, and provides richer information than conventional manual recording. It enables the evaluation of distance influence, quasi-static measurement error, dynamic response, comparison with sparse manual calibration strategies, and repeatability of the indicated temperature. This makes the proposed method suitable for comparative studies, methodological verification, educational experiments and preliminary calibration analysis of infrared thermal measurement systems.
To make the presented case study transferable to other infrared thermal cameras, the experimental procedure can be generalized as a camera-specific workflow for identifying suitable verification conditions. The aim of this workflow is not to prescribe a universal measurement distance, but to determine the most suitable operating configuration for a given thermographic instrument, blackbody aperture and set of radiometric compensation parameters. The generalized procedure is summarized in next steps (
Table 4):
This workflow allows the method to be transferred to other camera types. If a different infrared thermal camera is used, the numerical values obtained in the present study, including the selected distance of 900 mm, may change because of different detector resolution, IFOV, field of view, minimum focusing distance, optical design, internal correction strategy and radiometric compensation algorithm. However, the same evaluation logic remains applicable. The most suitable configuration should be identified experimentally by combining statistical error indicators with optical target-coverage criteria. Therefore, the main generalizable result of this study is not the specific distance selected for the tested camera, but the proposed procedure for determining suitable verification conditions for a given camera–blackbody system.
The proposed method was evaluated under controlled indoor laboratory conditions. Therefore, the results should not be directly transferred to uncontrolled outdoor or industrial environments without additional environmental assessment. Ambient temperature, relative humidity, air flow, direct solar radiation, surrounding thermal background and strong heat sources may influence both the blackbody reference source and the infrared thermal camera indication. In particular, humidity and measurement distance affect atmospheric transmission, while surrounding objects and illumination conditions may influence reflected apparent temperature and the stability of display-based video extraction.
In the present study, these effects were reduced by using a short camera-to-blackbody distance, a shaded air-conditioned room, stable low illumination, constant radiometric settings and exclusion of direct solar radiation and strong external heat sources from the measurement area. Nevertheless, residual environmental influences cannot be completely excluded and are considered as part of the practical uncertainty of the display-based evaluation method. For application in less controlled environments, the same procedure should be accompanied by monitoring of ambient temperature, relative humidity, reflected apparent temperature, air flow and surrounding thermal background.
A limitation of the present study is that the long-duration quasi-static heating experiment was performed as a single continuous run. Therefore, the obtained continuous error curve should be interpreted as a detailed diagnostic curve of the tested camera under the specified operating conditions, rather than as an averaged calibration curve obtained from repeated experiments. The repeatability of the displayed temperature indication was evaluated separately under stable conditions. This approach was selected as a practical compromise between the amount of diagnostic information obtained and the time and cost required for the verification procedure.




 ,
,