1. Introduction
Wheat (
Triticum aestivum L.) is a fundamental staple cereal, contributing approximately 20% of the daily protein and calories consumed globally [
1]. Within the agricultural value chain, accurate variety identification is paramount for ensuring seed purity, optimizing crop yields, and determining market pricing based on specific quality characteristics [
2]. The quality of processed end-products, such as bread and pasta, is significantly influenced by the inherent protein and starch content of the specific wheat cultivars utilized in production [
3]. Traditionally, variety verification has relied on manual inspection by trained experts; however, this process is inherently subjective, labor-intensive, and prone to human error caused by fatigue or distraction [
4]. Moreover, modern breeding practices have resulted in cultivars that exhibit extreme morphological similarities, making visual discrimination increasingly difficult even for specialists [
5]. Consequently, there is an urgent need for automated image-based classification systems that provide rapid, objective, and non-destructive solutions to enhance efficiency throughout the grain industry [
6,
7].
Deep learning has revolutionized agricultural image analysis, shifting the paradigm from conventional convolutional neural networks (CNNs) toward more advanced, attention-based architectures [
8]. While representative CNNs such as DenseNet201, InceptionV3, and MobileNetV2 have demonstrated significant success in grain and seed identification, researchers are increasingly adopting Transformer-based models to overcome the limited receptive fields inherent in traditional convolutional operators [
7]. Hierarchical Transformer architectures are particularly relevant to fine-grained visual recognition tasks, as they can effectively represent visual entities at multiple scales. Among these, the Swin Transformer architecture is notable for its shifted windowing scheme, which enables the modeling of long-range dependencies with linear computational complexity [
9]. This capability is crucial for capturing the subtle morphological and textural cues necessary to distinguish between morphologically similar wheat varieties that often appear identical to the human eye [
10]. These developments provide a foundation for investigating whether foreground-focused preprocessing can further enhance the extraction of variety-specific visual characteristics from wheat kernel images.
Wheat kernel images often contain substantial background regions that do not contribute information relevant to variety discrimination [
11]. When the foreground kernel occupies only a limited portion of the total image area, directly resizing a complete high-resolution image to a fixed network input size can significantly reduce the effective representation of fine morphological and textural details [
12]. Furthermore, resizing kernel images to fixed dimensions without maintaining their original aspect ratio can introduce geometric distortions that alter the shape and proportions of the kernels [
10]. Such distortions may affect the representation of subtle morphological and contour-related characteristics that are important for distinguishing visually similar wheat varieties [
10]. Variations in the background can also introduce irrelevant visual information, potentially complicating feature learning and affecting model reliability [
13]. To address these challenges, object-focused cropping, segmentation, or foreground-aware preprocessing can be utilized to increase the proportion of informative pixels while preserving discriminative visual characteristics [
14]. Preserving these fine-grained details is critical for distinguishing between cultivars that exhibit extreme morphological similarities [
4]. Consequently, there is a methodological need for robust preprocessing strategies that systematically emphasize the foreground and facilitate the extraction of discriminative features for fine-grained wheat variety classification.
Previous research has implemented several techniques to isolate grain kernels from collective backgrounds to enhance the learning of discriminative features. Shi et al. [
11] utilized experimental thresholding to remove blue backgrounds from barley images, isolating individual kernels to create a standardized black background for neural network analysis. However, this approach was constrained by the requirement for kernels to be manually arranged in regular grids to facilitate successful detection. Similarly, Bayram & Yıldız [
12] employed manual cropping to extract smaller, informative regions from high-resolution barley images before resizing them, aiming to optimize training efficiency and system performance. For automated wheat classification, Sabanci et al. [
3] applied grayscale conversion and binary segmentation using interclass variance thresholding to isolate and tag grain positions, though their framework remained dependent on a specialized, self-illuminated imaging box to minimize noise. Furthermore, Bagherpour & Shamohammadi [
4] implemented adaptive thresholding to generate binary masks for background removal in Iranian wheat cultivars, with the reported evaluation conducted under controlled laboratory conditions. These studies demonstrate that foreground extraction and object-focused preprocessing have been incorporated into grain and wheat image analysis, but the reported approaches differ substantially in their degree of automation, image acquisition requirements, and preservation of kernel characteristics during preprocessing.
Previous studies have explored background removal, kernel isolation, manual cropping, and threshold-based segmentation in grain and wheat image analysis [
3,
4,
11,
12]. However, these approaches differ in their degree of automation, image acquisition requirements, and preprocessing procedures, with some relying on manual kernel arrangement or cropping and others on specialized imaging conditions. Despite these approaches, the use of automated foreground-aware preprocessing specifically for fine-grained classification of already isolated single wheat kernels remains insufficiently investigated. In this setting, the challenge is not to separate multiple kernels from a common image, but to identify the informative foreground region within each individual kernel image while preserving its discriminative morphological and textural characteristics during preprocessing. The novelty of this study lies in the systematic investigation of an automated foreground-aware preprocessing strategy specifically for fine-grained classification of isolated single wheat kernels, where the contribution of input representation is evaluated independently from additional architectural feature-enhancement mechanisms. To address this gap, this study systematically investigates foreground-aware preprocessing for large-scale wheat variety classification using a dataset comprising 124 wheat varieties. Four baseline architectures, DenseNet201, MobileNetV2, InceptionV3, and Swin Transformer Tiny (SwinT), were first evaluated to establish a comparative performance reference. SwinT was subsequently used as the backbone for evaluating the proposed foreground-aware preprocessing framework, CropWheatSwinT, together with additional feature-enhancement strategies based on CBAM, Coordinate Attention, and RGB–Sobel information. Accordingly, the study provides a controlled comparison between foreground-aware input preprocessing and three additional feature-enhancement strategies within the same SwinT-based framework. The study further examines class-level performance variations and statistically evaluates differences between the baseline and modified architectures. This framework enables a systematic assessment of the contribution of foreground-aware input representation relative to the specific architectural modifications investigated in this study for fine-grained wheat variety classification.
2. Materials and Methods
2.1. Wheat Variety Dataset
The experiments were conducted using the Bread Wheat Image Dataset, a publicly available large-scale image dataset consisting of RGB images of individual bread wheat (
Triticum aestivum L.) kernels acquired under controlled imaging conditions. The dataset contains 124 bread wheat varieties and provides a challenging benchmark for large-scale fine-grained image classification due to the high visual similarity among different cultivars. The dataset was obtained from the Ondokuz Mayıs University AVESİS Scientific Data Sharing Platform, where it is publicly available as Bread Wheat Image Dataset, Version 3 [
15]. Although the original dataset description reports approximately 465,000 images, verification of the downloaded dataset showed that it contains a total of 466,049 RGB images, all of which were used in this study.
The number of images per variety is highly balanced, with most classes containing approximately 3750 images, although minor variations exist in the original dataset. These small differences preserve the natural class distribution while maintaining a nearly balanced dataset suitable for deep learning applications.
To ensure a fair and reproducible evaluation, the dataset was partitioned into training, validation, and independent test subsets using a target ratio of 70%, 15%, and 15%, respectively. For each wheat variety, image-containing folders were first identified within the corresponding class directory. The images within each folder were naturally sorted according to their filenames using natural alphanumeric ordering. For each folder containing at least 10 images, the first 70% of the ordered images were assigned to the training set, the subsequent 15% to the validation set, and the remaining images to the independent test set. This deterministic folder-wise partitioning strategy was adopted to establish a fixed and reproducible dataset split and to prevent variations in test-set composition across experiments. Since the number of images varies slightly among varieties, the exact subset sizes were determined using integer sample counts for each class. Consequently, the final overall distribution differs slightly from the intended ratios, resulting in 323,195 training images (69.35%), 68,258 validation images (14.65%), and 74,596 test images (16.00%). The resulting dataset distribution is summarized in
Table 1. These minor deviations arise naturally from class-wise partitioning while ensuring that each image belongs to exactly one subset and that the original class distribution is preserved across all partitions.
The available dataset organization does not provide explicit sample-level metadata indicating whether multiple images correspond to the same physical wheat kernel, represent repeated acquisitions, or constitute different views of an identical kernel. Therefore, such relationships could not be explicitly identified or used as grouping constraints during partitioning. The partitioning procedure was consequently applied at the image-folder level using the deterministic filename ordering described above. This limitation is acknowledged when interpreting the independence of the image-level subsets. The independent test subset was completely isolated from the training and validation processes and was used exclusively for the final performance evaluation. Consequently, all proposed preprocessing strategies and network architectures were trained and optimized under identical experimental conditions using the same fixed dataset partition, ensuring fair, reproducible, and directly comparable performance evaluation.
2.2. Proposed Foreground-Aware Preprocessing
Deep learning models are highly dependent on the quality and spatial distribution of the input data. In fine-grained wheat variety classification, the wheat kernel generally occupies only a small portion of the captured image, whereas the remaining area predominantly consists of a nearly uniform background. Directly resizing such images to the network input resolution reduces the effective spatial resolution of the foreground object and allocates a considerable number of pixels to non-informative background regions. Consequently, subtle morphological characteristics, including kernel shape, crease structure, and surface texture, become less distinguishable, potentially limiting classification performance.
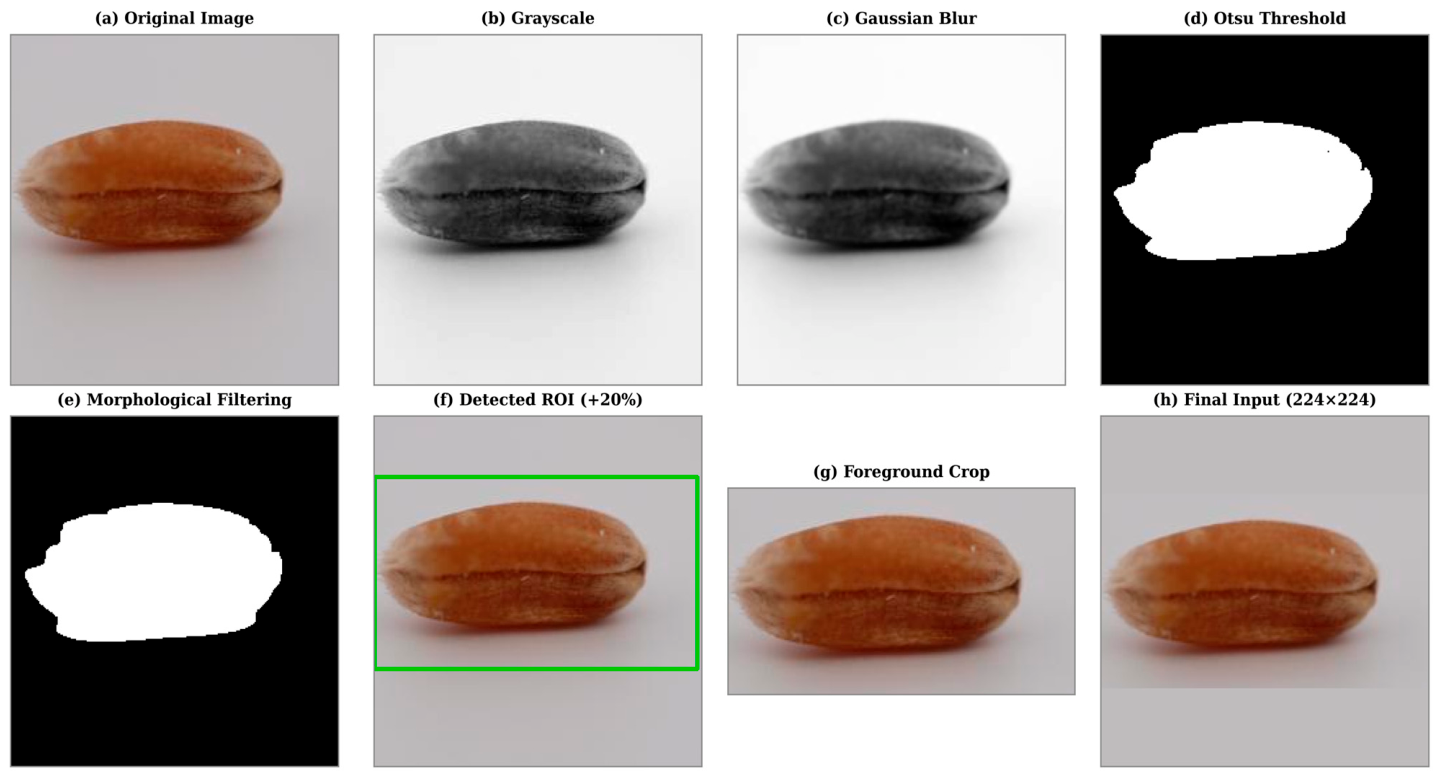
To address this limitation, a foreground-aware preprocessing pipeline was developed to maximize the informative image region while preserving the original geometric characteristics of the wheat kernel. The complete workflow is illustrated in
Figure 1. First, the input RGB image is converted to grayscale (
Figure 1b) to simplify subsequent image processing while preserving the structural characteristics of the kernel. A Gaussian filter with a kernel size of 5 × 5 is then applied (
Figure 1c) to suppress high-frequency noise and improve the robustness of the subsequent segmentation process.
Foreground segmentation is subsequently performed using Otsu’s adaptive thresholding algorithm (
Figure 1d), which automatically determines an optimal threshold by maximizing the between-class variance between foreground and background pixels. Because thresholding may produce small isolated regions and minor discontinuities around the kernel boundary, morphological opening followed by morphological closing is applied using a 5 × 5 elliptical structuring element (
Figure 1e). Opening removes small noisy components, whereas closing fills small gaps within the foreground object, producing a cleaner binary mask suitable for contour extraction.
The external contours of the refined binary mask are extracted, and the largest connected component is assumed to correspond to the wheat kernel. A bounding rectangle enclosing the detected foreground is then computed to define the region of interest (ROI). To avoid removing useful boundary information during cropping, the bounding box is expanded by 20% in both horizontal and vertical directions before extracting the foreground region (
Figure 1f). This safety margin preserves the complete kernel contour while substantially reducing redundant background pixels. The resulting ROI is then cropped from the original RGB image (
Figure 1g).
Unlike conventional preprocessing methods that directly resize the cropped image to a fixed input size, the proposed method preserves the original aspect ratio of the wheat kernel during image normalization. A uniform scaling factor is calculated according to the longer image dimension, thereby preventing geometric distortion. The resized kernel is subsequently centered on a 224 × 224 canvas whose background color is estimated from the median RGB values of the border pixels surrounding the resized crop. This background padding strategy minimizes artificial intensity discontinuities while maintaining a visually consistent background. The resulting normalized image is used as the final network input (
Figure 1h).
By increasing the proportion of informative foreground pixels while preserving the original geometry of the wheat kernel, the proposed preprocessing pipeline increases the representation of discriminative morphological characteristics while reducing redundant background information. This preprocessing strategy forms the basis of the proposed CropWheatSwinTiny (CropWheatSwinT) framework and is evaluated against the baseline SwinTiny (SwinT) model and the modified variants in the experimental section.
2.3. Deep Learning Models
2.3.1. Swin Transformer Tiny
The Swin Transformer introduces a hierarchical architecture that computes visual representations using a shifted windowing scheme. This approach limits self-attention computation to non-overlapping local windows while enabling cross-window connections, resulting in linear computational complexity relative to the input image size [
9]. In this research, the Swin Transformer Tiny (SwinT) variant is utilized for the challenging task of classifying 124 distinct bread wheat varieties.
2.3.2. MobileNetV2
MobileNetV2 is a lightweight convolutional neural network architecture specifically optimized for resource-constrained mobile and embedded environments [
16,
17]. Its core innovation is the use of inverted residual blocks with linear bottlenecks, which utilize depthwise separable convolutions to significantly reduce the number of parameters and computational cost [
18]. This model was included as a lightweight baseline architecture for the classification of 124 bread wheat varieties.
2.3.3. DenseNet201
DenseNet201 is characterized by a dense connectivity pattern where each layer is connected to every other layer in a feed-forward fashion [
19]. This design facilitates maximum information flow, encourages extensive feature reuse, and effectively alleviates the vanishing-gradient problem in deep network structures [
19,
20]. The DenseNet201 architecture was included as a baseline model for the classification of 124 bread wheat varieties.
2.3.4. InceptionV3
InceptionV3 is a deep convolutional neural network that utilizes Inception modules to perform multiple convolutions of varying filter sizes in parallel [
10,
21]. The architecture incorporates factorized convolutions and auxiliary classifiers to act as regularizers, enhancing the model’s ability to capture multi-scale features with high computational efficiency [
21].
2.4. Modified Models
Following the comparative evaluation of the baseline deep learning architectures, SwinT was selected as the reference backbone for the subsequent experiments. The foreground-aware preprocessing strategy described in
Section 2.2 was applied to the modified SwinT-based models, providing a common input representation in which the wheat kernel was localized, cropped with a safety margin, resized while preserving its original aspect ratio, and placed on a 224 × 224 image using median background-color padding. To further investigate whether attention mechanisms and edge information could improve fine-grained wheat variety classification, several modified variants of the SwinT architecture were subsequently developed. These variants incorporated channel attention, convolutional block attention, and Sobel-derived edge information, while maintaining the same classification task and experimental configuration.
2.4.1. CropWheatSwinT
CropWheatSwinT uses the foreground-aware preprocessing strategy described above together with the Swin Transformer Tiny backbone. The resulting cropped RGB images are directly classified by the pretrained SwinT model. Thus, this variant specifically evaluates the contribution of foreground-aware preprocessing without modifying the SwinT architecture.
2.4.2. CA-CropWheatSwinT
CA-CropWheatSwinT extends the CropWheatSwinT framework by incorporating a Coordinate Attention (CA) mechanism, which encodes channel information together with spatial coordinate information to emphasize informative feature responses [
22]. The SwinT backbone itself is not modified internally. Instead, the CA module is applied to the feature representation produced by the final SwinT feature-extraction stage. Specifically, the feature representation generated by the final SwinT feature-extraction stage is first rearranged from NHWC to NCHW format and then passed through the CA module.
The implemented CA module uses separate height- and width-wise feature aggregation, followed by a shared 1 × 1 convolution, batch normalization, and h-swish activation. Separate 1 × 1 convolutions subsequently generate the height- and width-aware attention maps, which are applied multiplicatively to the input feature representation. The resulting refined feature map is then subjected to global average pooling, flattened, and passed to a fully connected classification layer with 124 output units.
2.4.3. CBAM-CropWheatSwinT
CBAM-CropWheatSwinT extends the CropWheatSwinT framework by incorporating the Convolutional Block Attention Module (CBAM), which jointly exploits channel and spatial attention to emphasize informative features and relevant image regions [
23]. As with the CA variant, the CBAM is not inserted into the internal Swin Transformer blocks. Instead, it is applied to the final feature representation generated by the SwinT backbone. The feature representation generated by the final SwinT feature-extraction stage is first converted from NHWC to NCHW format and subsequently processed by the CBAM.
The channel-attention component uses both adaptive average pooling and adaptive maximum pooling, followed by a shared two-layer 1 × 1 convolutional MLP with a reduction ratio of 16. The resulting channel attention map is applied to the feature representation. Spatial attention is then calculated from the channel-wise average and maximum projections using a 7 × 7 convolution. After sequential channel and spatial refinement, the feature map is processed using global average pooling, flattened, and passed to a fully connected classification layer with 124 output units.
2.4.4. CropWheatSwinTwithSobel
CropWheatSwinTwithSobel introduces complementary edge information into the CropWheatSwinT framework through a dual-branch architecture. The same foreground-cropped RGB image is used as the input to the SwinT branch, while a corresponding Sobel edge representation is generated from the RGB image for the auxiliary CNN branch.
For Sobel edge generation, the RGB image is first converted to grayscale. Horizontal and vertical image gradients are then calculated independently using 3 × 3 Sobel operators. The gradient magnitude is obtained by combining the horizontal and vertical gradient components and is subsequently normalized to the range [0, 255]. The resulting single-channel edge image is replicated into three channels before being provided to the auxiliary CNN branch.
The auxiliary EdgeCNN consists of three convolutional blocks. The first block contains a 3 × 3 convolution with 32 output channels, followed by batch normalization, ReLU activation, and 2 × 2 max pooling. The second block uses a 3 × 3 convolution with 64 output channels, followed by batch normalization, ReLU activation, and 2 × 2 max pooling. The third block consists of a 3 × 3 convolution with 128 output channels, followed by batch normalization and ReLU activation. Unlike the first two blocks, the third block does not include a max-pooling operation. An adaptive global average pooling layer is then applied to obtain a 128-dimensional edge feature vector.
In parallel, the RGB image is processed by the SwinT backbone, and the resulting feature representation is converted to a channel-first format and subjected to global average pooling, producing a 768-dimensional RGB feature vector. The 768-dimensional SwinT feature vector and the 128-dimensional EdgeCNN feature vector are then concatenated, resulting in an 896-dimensional fused feature representation. This representation is passed to a fully connected classification head consisting of a linear layer mapping 896 to 512 features, ReLU activation, dropout with a probability of 0.3, and a final linear layer producing predictions for the 124 wheat varieties.
2.5. Training Configuration
All experiments were implemented using the PyTorch (version 2.11.0) deep learning framework and conducted on a workstation equipped with an NVIDIA RTX PRO 6000 Blackwell GPU. A common experimental protocol was maintained across the evaluated architectures to ensure a controlled comparison, while the input resolution was adjusted according to the requirements of each model. Accordingly, the baseline and modified SwinT-based models used 224 × 224 RGB inputs, whereas InceptionV3 used 299 × 299 RGB inputs. The complete experimental configuration is summarized in
Table 2.
For the baseline architectures, training images were augmented using RandomResizedCrop, random horizontal flipping (p = 0.5), random vertical flipping, and random rotation within ±20°. ColorJitter was additionally applied with brightness, contrast, and saturation factors of 0.2 and a hue factor of 0.1. No data augmentation was applied to the validation or test sets. All images were converted to tensors and normalized using the ImageNet mean and standard deviation. The evaluated networks were initialized with ImageNet-pretrained weights and optimized using the AdamW optimizer with a learning rate of 1 × 10⁻⁴ and weight decay of 1 × 10⁻⁴. The batch size was set to 32, and Cross-Entropy Loss was used as the classification objective.
For the modified SwinT-based models, the foreground-aware preprocessing pipeline described in
Section 2.2 was performed offline before training and evaluation. Following foreground localization and cropping with the selected safety margin, each cropped image was resized to fit within a 224 × 224 canvas while preserving its original aspect ratio. The remaining canvas area was filled using the median RGB value estimated from the border pixels of the resized image. After this offline preprocessing, the resulting foreground-preprocessed training images were subjected to RandomResizedCrop with an output size of 224 × 224, random horizontal flipping (
p = 0.5), random vertical flipping, random rotation within ±20°, and ColorJitter with brightness, contrast, and saturation factors of 0.2 and a hue factor of 0.1. These augmentations were applied only during training, while no augmentation was applied to the validation or test images.
All models were trained for a maximum of 50 epochs. During training, the learning rate was adaptively adjusted using the ReduceLROnPlateau scheduler, with validation accuracy as the monitored metric, a reduction factor of 0.5, and a patience of 3 epochs. Early stopping was employed with a patience of 10 epochs based on the validation accuracy. The model achieving the highest validation accuracy during training was selected as the final model for evaluation on the independent test set. The same optimization and model-selection settings were maintained across the evaluated architectures to ensure a controlled comparison.
2.6. Evaluation Metrics
The classification results were assessed using Accuracy, Precision, Recall, and F1-score to provide complementary views of model performance across the 124 wheat varieties. Accuracy reflects the proportion of test images assigned to their correct variety, whereas Precision indicates how reliably a predicted variety corresponds to the actual class. Recall measures the extent to which samples belonging to a given variety are successfully recognized by the model. The F1-score, calculated as the harmonic mean of Precision and Recall, provides a balanced measure when both types of classification errors need to be considered simultaneously [
24].
For overall test-set performance, Precision, Recall, and F1-score were calculated using weighted averaging across the 124 classes. For class-level analysis, F1-score was calculated separately for each wheat variety, and Macro F1 was obtained as the arithmetic mean of the 124 class-specific F1-scores. For consistency, the same evaluation framework was applied to all baseline and modified architectures on the fixed independent test set. This common evaluation protocol ensured that model performance was assessed under identical conditions and allowed for direct comparison of the alternative network designs.
3. Results
3.1. Comparative Performance of Baseline Deep Learning Models
The classification performance of the baseline architectures on the Bread Wheat Image Dataset is presented in
Table 3. Among the evaluated models, SwinT achieved the highest classification performance, with an accuracy of 91.91%, weighted precision of 92.81%, weighted recall of 91.91%, and weighted F1-score of 91.91%. DenseNet201 followed with an accuracy of 89.94% and a weighted F1-score of 89.99%, while InceptionV3 achieved 87.99% accuracy and a weighted F1-score of 88.21%. MobileNetV2 yielded the lowest classification performance, with an accuracy of 83.62% and a weighted F1-score of 83.60%.
The computational characteristics of the evaluated architectures revealed a clear trade-off between classification performance and computational efficiency. MobileNetV2 demonstrated the most lightweight computational profile, with only 2.38 million parameters and 0.33 GFLOPs. It also achieved the lowest inference time (1.22 ms/image) and the highest throughput (815.90 FPS). DenseNet201 contained 18.33 million parameters and required 4.39 GFLOPs, resulting in an inference time of 6.43 ms/image and a throughput of 155.48 FPS. InceptionV3 required 24.69 million parameters and 5.75 GFLOPs, with an inference time of 2.80 ms/image and a throughput of 357.22 FPS. SwinT contained the largest number of parameters (27.61 million) and required 4.37 GFLOPs, while achieving an inference time of 2.71 ms/image and a throughput of 369.31 FPS. Thus, although MobileNetV2 provided the most efficient computational profile, its classification performance was substantially lower than that of the other architectures. DenseNet201 improved classification performance relative to MobileNetV2 but required considerably greater computational resources. SwinT achieved the strongest classification performance among the evaluated architectures, while requiring substantially less inference time than DenseNet201 and InceptionV3 and maintaining a higher throughput than DenseNet201.
To further assess the baseline differences at the class level, pairwise two-sided Wilcoxon signed-rank tests were performed between SwinT and each of the other baseline architectures using per-class F1-scores across the 124 wheat varieties. The results of these pairwise comparisons are summarized in
Table 4. SwinT achieved a higher Macro F1-score than DenseNet201 (0.9196 ± 0.0451 vs. 0.9000 ± 0.0519; ΔF1 = −0.0196, W = 1498.0,
p < 0.001; Cohen’s dz = −0.58), InceptionV3 (0.9196 ± 0.0451 vs. 0.8822 ± 0.0674; ΔF1 = −0.0374, W = 743.0,
p < 0.001; Cohen’s dz = −0.84), and MobileNetV2 (0.9196 ± 0.0451 vs. 0.8362 ± 0.0796; ΔF1 = −0.0834, W = 56.0,
p < 0.001; Cohen’s dz = −1.44). Thus, SwinT demonstrated significantly stronger class-level classification performance than all three baseline architectures, with the largest effect observed relative to MobileNetV2.
The superior performance of SwinT motivated its selection as the reference architecture for the subsequent evaluation of foreground-aware preprocessing and the modified architectural variants.
3.2. Safety Margin Sensitivity Analysis of CropWheatSwinT
Following the selection of SwinT as the reference architecture, an additional sensitivity analysis was conducted to investigate the effect of the safety margin used in the CropWheatSwinT preprocessing. The analysis evaluated 10%, 20%, and 30% margins under the same experimental protocol. The results are presented in
Table 5.
As shown in
Table 5, the 20% safety margin achieved the highest performance across all reported metrics, with 93.07% accuracy and 93.15% weighted F1-score. The 10% and 30% margins resulted in lower accuracies of 88.59% and 92.25%, respectively. Therefore, the 20% margin was selected for the subsequent experiments based on its superior performance among the evaluated settings.
3.3. Performance of the Modified Swin Transformer Architectures
Based on the sensitivity analysis, the 20% safety margin was adopted for CropWheatSwinT in the subsequent experiments.
Table 6 summarizes the classification performance and inference characteristics of the baseline and modified Swin Transformer architectures. All modified architectures retained the same SwinT backbone, while foreground-aware preprocessing and, where applicable, additional feature-enhancement components were introduced according to the corresponding experimental configuration.
The introduction of the proposed foreground-aware preprocessing resulted in a clear improvement. CropWheatSwinT achieved the highest classification performance, reaching 93.07% Accuracy, 93.92% weighted Precision, 93.07% weighted Recall, and 93.15% weighted F1-score. Compared with the baseline SwinT, this corresponds to a 1.16 percentage-point improvement in Accuracy and a 1.24 percentage-point improvement in weighted F1-score. Importantly, this improvement was achieved without changing the underlying SwinT parameter configuration, with the modified model retaining the same 27.61 million parameters as the baseline.
The additional architectural modifications did not provide further improvements over the proposed foreground-aware configuration. CA-CropWheatSwinT achieved 89.17% Accuracy and 89.20% weighted F1-score, whereas CBAM-CropWheatSwinT obtained 86.49% Accuracy and 86.50% weighted F1-score. CropWheatSwinTwithSobel, which incorporated Sobel-derived edge information through an auxiliary CNN branch, achieved 89.51% Accuracy and 89.60% weighted F1-score. Thus, among the evaluated modified architectures, CropWheatSwinT provided the highest classification performance while maintaining the same parameter count as SwinT. The CA-, CBAM-, and Sobel-based modifications resulted in lower classification performance under the adopted experimental configuration.
3.4. Statistical Evaluation of the Modified Swin Transformer Architectures
To further examine whether the observed performance differences between the baseline SwinT and its modified variants were consistent across wheat varieties, a paired statistical analysis was performed using per-class F1-scores. For this analysis, F1-score was calculated separately for each of the 124 wheat varieties, and the reported Macro F1 represents the arithmetic mean of these class-specific F1-scores. The corresponding standard deviation reflects the variability in F1-scores across the 124 varieties. The SwinT architecture achieved a Macro F1 of 0.9196 ± 0.0451 and was used as the baseline for comparison. For each modified architecture, the change in F1-score (ΔF1) was calculated relative to SwinT. A two-sided Wilcoxon signed-rank test was then used to determine whether the class-level F1-scores of each modified architecture differed significantly from those of the SwinT baseline. Cohen’s dz was additionally calculated to quantify the magnitude of the paired changes.
As reported in
Table 7, CropWheatSwinT achieved the highest Macro F1-score (0.9317 ± 0.0437), corresponding to an improvement of 0.0121 over the SwinT baseline. This improvement was statistically significant (W = 2075.0,
p < 0.001), with a moderate positive effect size (Cohen’s dz = 0.40). In contrast, the attention- and edge-enhanced variants produced lower Macro F1-scores than the baseline. CA-CropWheatSwinT achieved a Macro F1-score of 0.8921 ± 0.0473 (ΔF1 = −0.0275), with a statistically significant difference from SwinT (W = 1072.0,
p < 0.001) and a large negative effect size (Cohen’s dz = −0.76). CBAM-CropWheatSwinT obtained 0.8651 ± 0.0581 (ΔF1 = −0.0545), also showing a statistically significant difference (W = 333.0,
p < 0.001) with a large negative effect size (Cohen’s dz = −1.10). Similarly, CropWheatSwinTwithSobel reached 0.8961 ± 0.0599 (ΔF1 = −0.0235), with a statistically significant difference from the baseline (W = 1209.0,
p < 0.001) and a large negative effect size (Cohen’s dz = −0.67). These results indicate that all four modified configurations differed significantly from the SwinT baseline, but only CropWheatSwinT produced a statistically significant improvement, whereas the CA-, CBAM-, and Sobel-based modifications resulted in significant reductions in class-level F1-score.
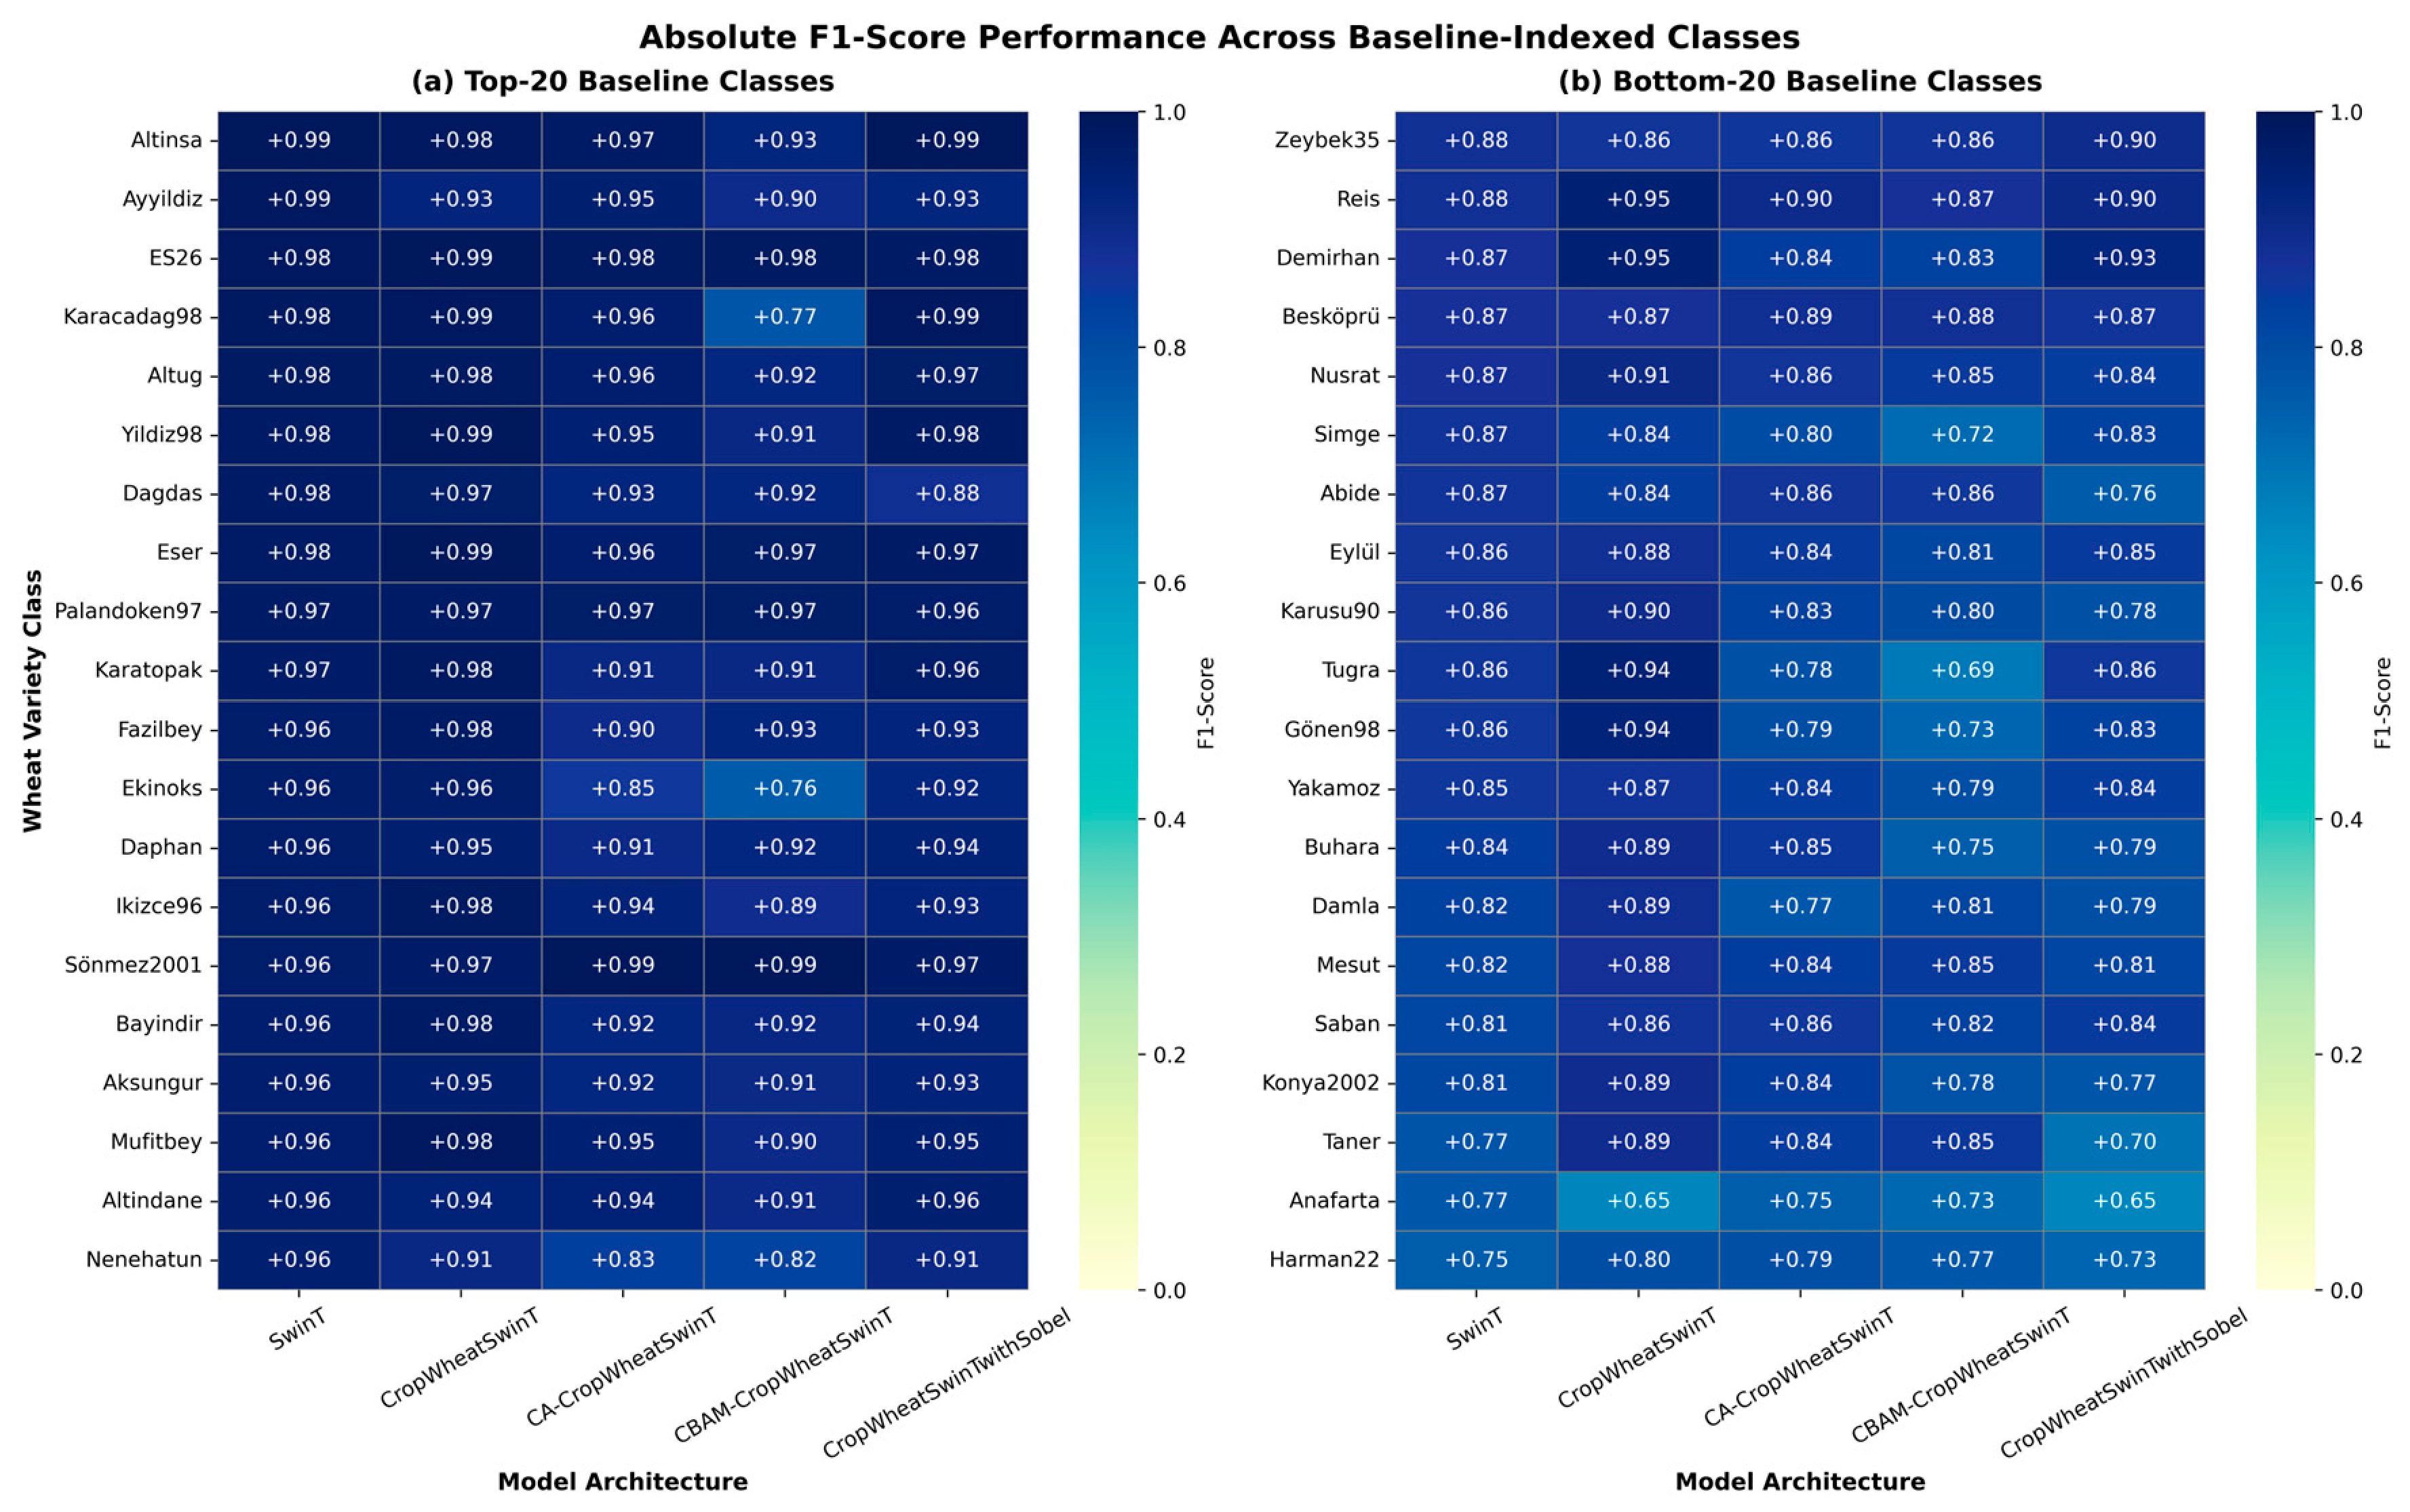
The class-level performance of the evaluated architectures is further illustrated in
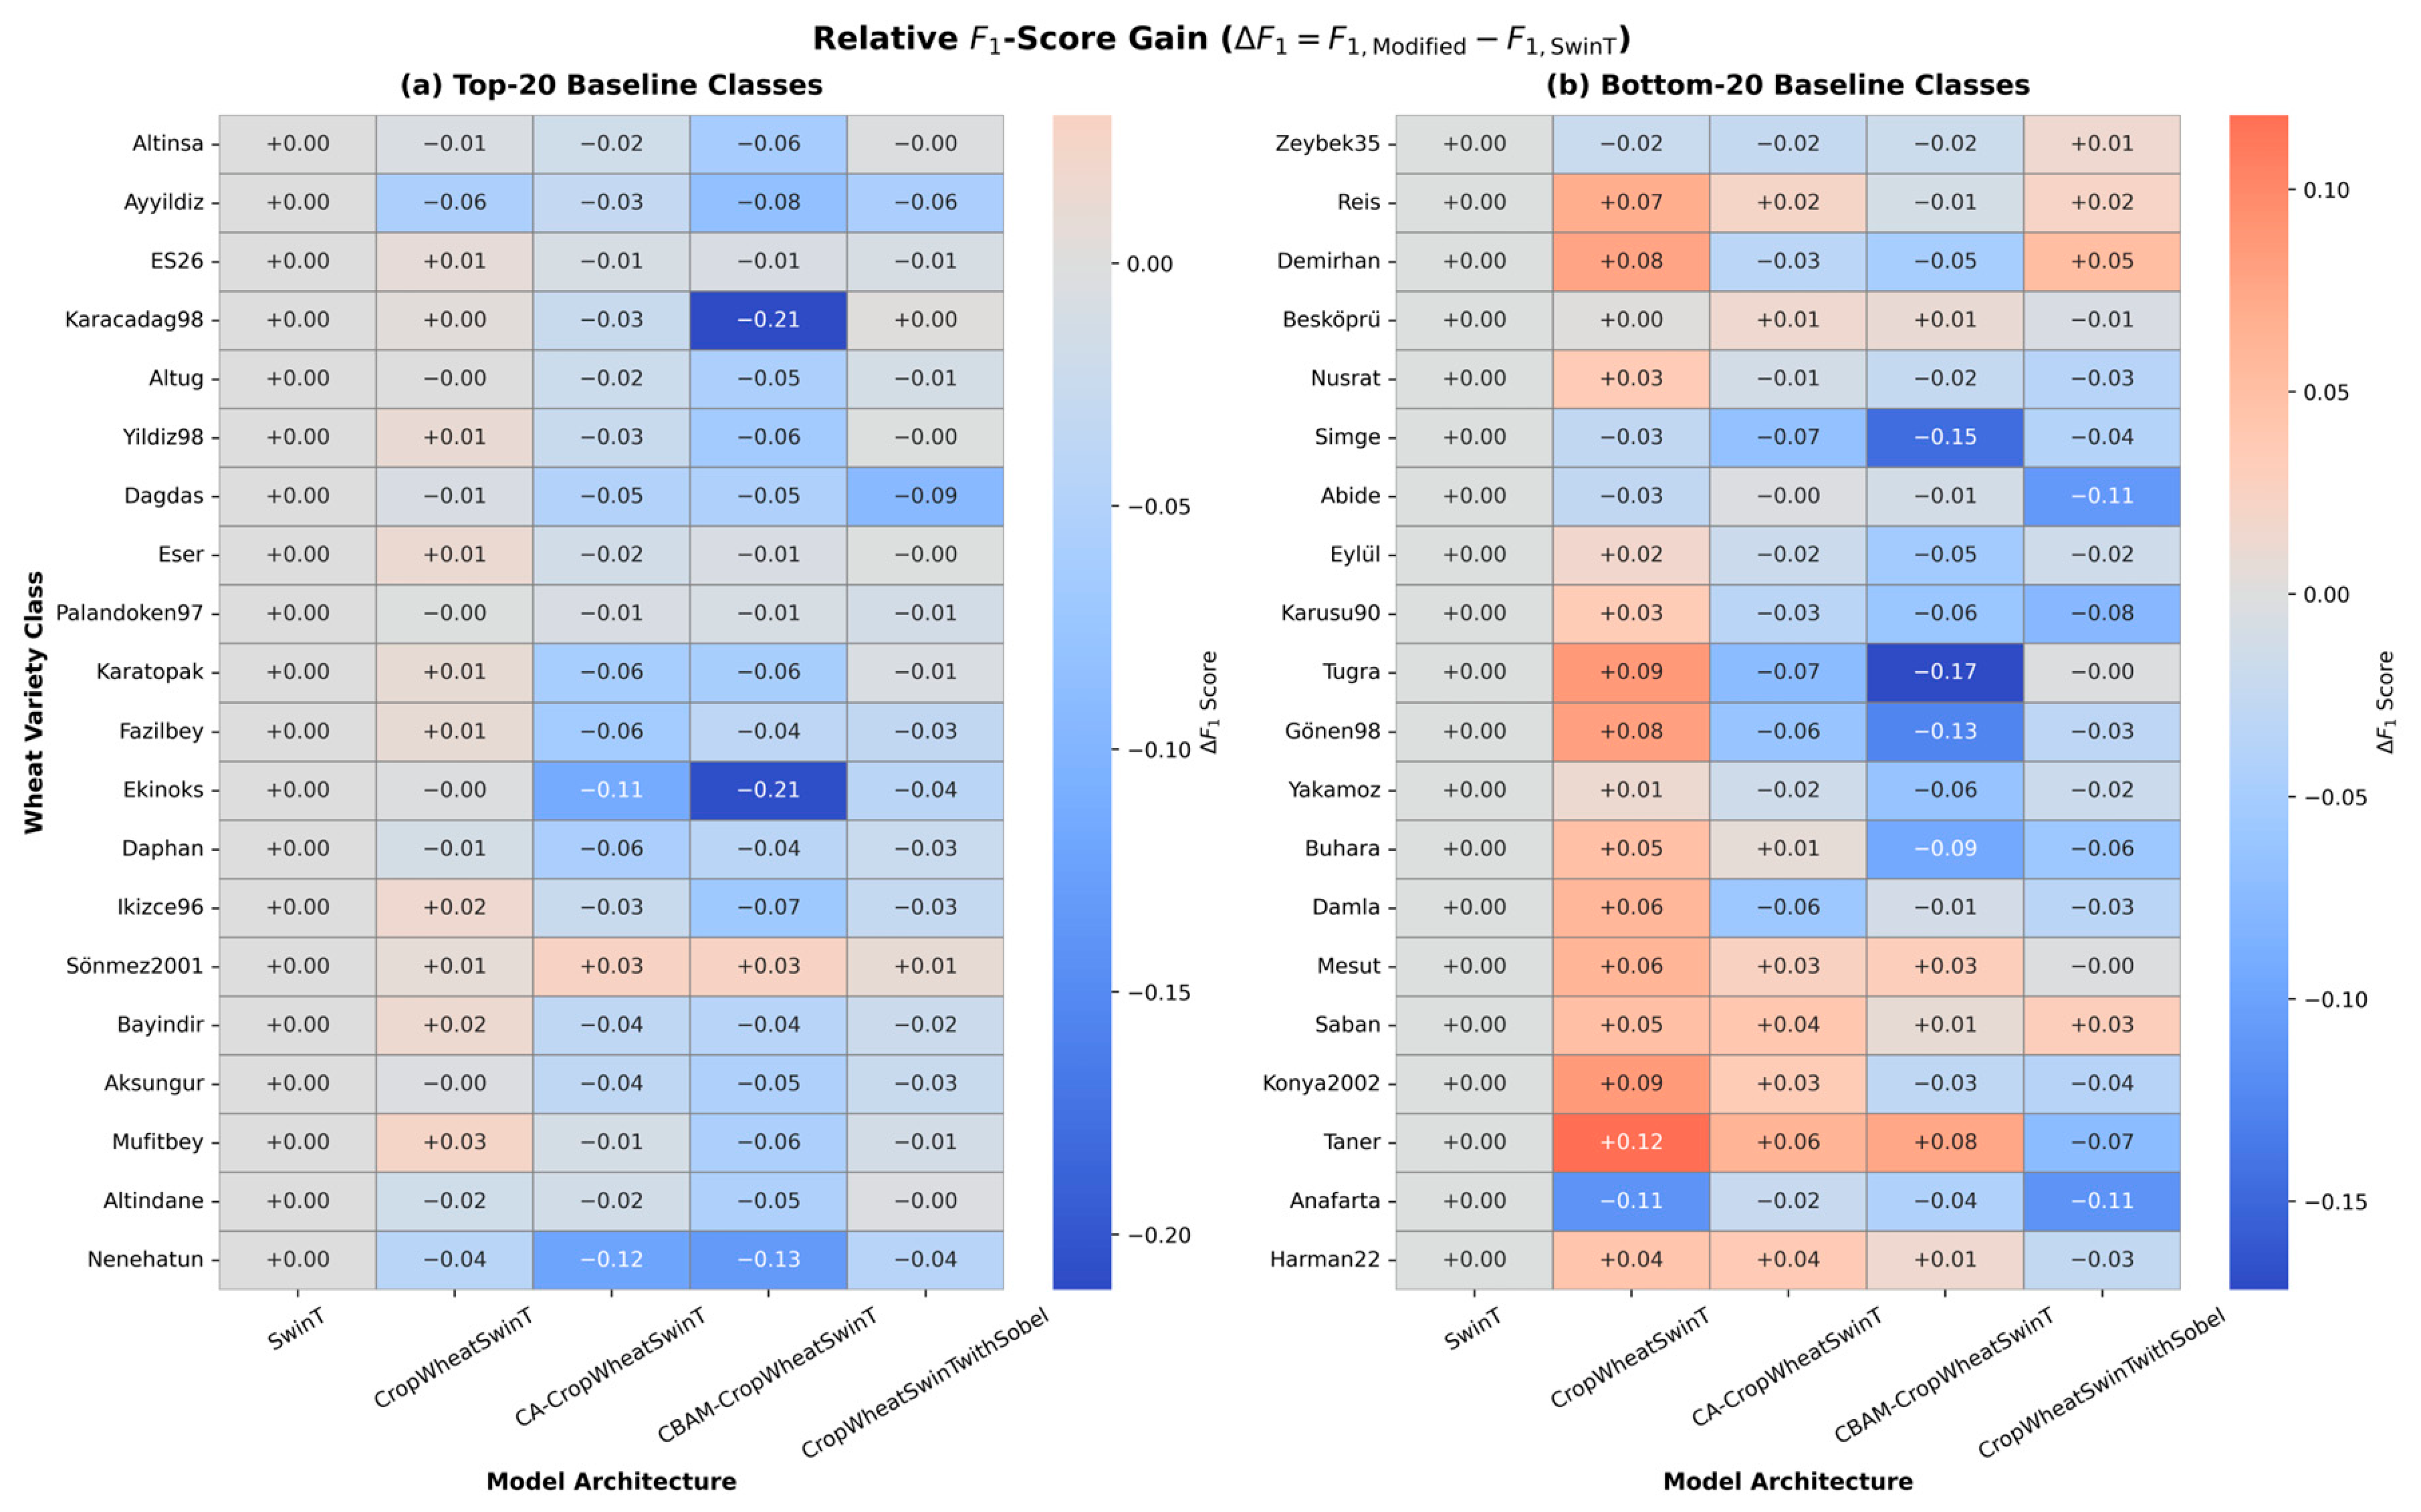
Figure 2. The absolute per-class F1-score heatmap demonstrates noticeable variation in classification performance across individual wheat varieties. CropWheatSwinT maintained high F1-scores for several varieties that also performed well with the SwinT baseline, while CA-CropWheatSwinT and CBAM-CropWheatSwinT showed lower F1-scores for several of these classes. Similar class-level variation was observed among the 20 lowest-performing varieties in the SwinT baseline, where CropWheatSwinT improved the F1-score of several classes, whereas the other modified architectures showed both increases and decreases relative to the baseline.
Figure 3 provides a direct comparison with the SwinT baseline by presenting the relative change in per-class F1-score (ΔF1) for each modified architecture. CropWheatSwinT produced positive ΔF1 values for several wheat varieties, including a number of classes with relatively low baseline F1-scores. In contrast, CA-CropWheatSwinT, CBAM-CropWheatSwinT, and CropWheatSwinTwithSobel exhibited a broader distribution of positive and negative changes across the evaluated classes. These class-level results indicate that the effect of the modified architectures was not uniform across wheat varieties, with CropWheatSwinT showing the most consistent positive changes relative to the SwinT baseline.
3.5. Qualitative Interpretability Analysis
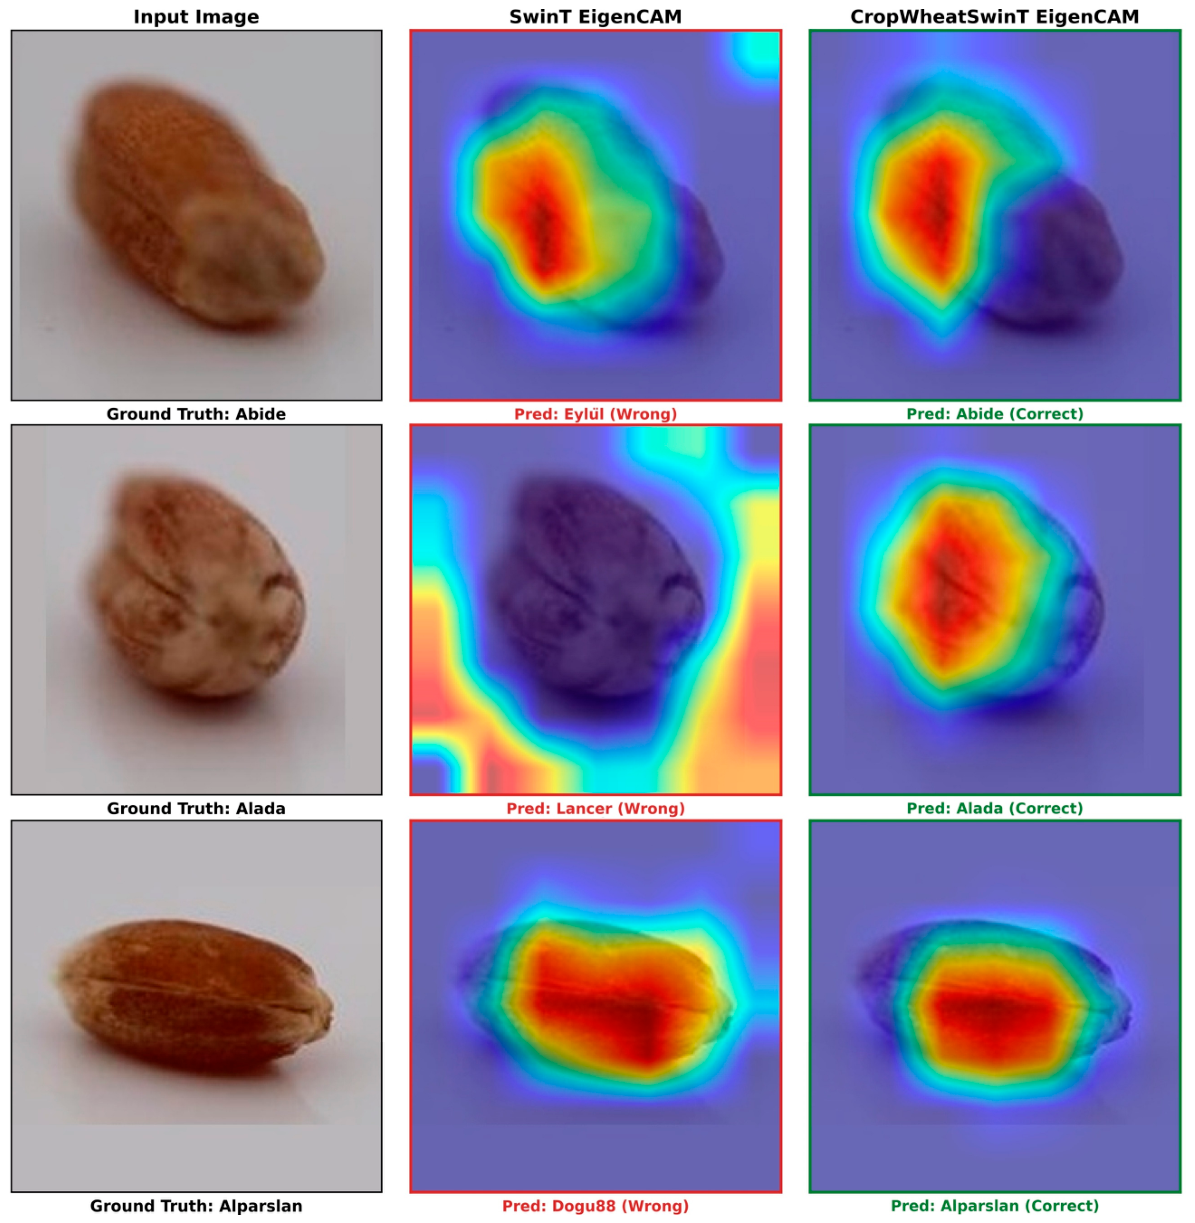
To qualitatively examine the spatial regions contributing to the model predictions, EigenCAM visualizations were generated for both the original SwinT and CropWheatSwinT models using the same test samples.
Figure 4 presents representative examples in which CropWheatSwinT correctly classified the wheat variety whereas SwinT produced an incorrect prediction. The visualizations allow the model response regions of the two configurations to be directly compared under identical test conditions. In several examples, the CropWheatSwinT activation maps appear more concentrated on the wheat kernel, whereas SwinT shows comparatively broader responses that may extend toward background regions. These observations provide qualitative evidence that foreground-aware preprocessing can influence the spatial distribution of model activations and may help emphasize kernel-related visual characteristics. However, these visualizations should be interpreted as qualitative evidence rather than direct evidence of the causal mechanisms underlying the classification.
4. Discussion
The present study investigated the effect of foreground-aware preprocessing and architectural modifications on fine-grained wheat variety classification across 124 wheat varieties. Among the baseline architectures, SwinT achieved the highest classification performance, with an accuracy and weighted F1-score of 91.91%, and was therefore selected as the reference architecture for subsequent experiments. The proposed CropWheatSwinT configuration increased accuracy to 93.07% and weighted F1-score to 93.15%, corresponding to improvements of 1.16 and 1.24 percentage points, respectively. At the class level, the Macro F1-score increased from 0.9196 ± 0.0451 for SwinT to 0.9317 ± 0.0437 for CropWheatSwinT. This improvement was statistically significant (Wilcoxon W = 2075.0, p < 0.001), with a moderate effect size (Cohen’s dz = 0.40). In contrast, the CA-, CBAM-, and RGB–Sobel-based variants produced significantly lower Macro F1-scores than the SwinT baseline, with ΔF1 values of −0.0275, −0.0545, and −0.0235, respectively (p < 0.001). These findings suggest that, under the experimental conditions considered in this study, foreground-aware preprocessing was associated with a greater performance improvement than the additional attention and edge-enhancement mechanisms evaluated in the modified SwinT configurations.
The findings can be discussed in relation to the work of Mengstu & Taner [
7], who investigated deep learning approaches for wheat variety classification using a large dataset comprising 124 wheat varieties and 465,000 images acquired from multiple viewing positions. Their proposed CNN achieved a reported accuracy of 95.40%, with precision, recall, and F1-score values of 95.44%, 95.39%, and 95.36%, respectively. Although this reported performance is higher than that obtained by the best-performing model in the present study, the values should not be interpreted as a direct model-to-model comparison because the experimental protocols are not identical. In particular, the previous study reports an 80% training, 10% validation, and 10% test partition, but does not sufficiently describe how the multi-view images were assigned to these subsets.
This limitation is consistent with the broader methodological concerns raised by Javed et al. [
25] regarding the comparability of reported performance across agricultural AI studies. They emphasized that differences in dataset characteristics, class distributions, environmental conditions, evaluation metrics, and training–testing and validation strategies can substantially affect reported performance, making direct comparison across studies problematic.
In the present study, all evaluated architectures were assessed using the same independently defined test set, allowing differences in classification performance to be attributed more directly to the evaluated models and preprocessing strategies rather than to differences in test-set composition. To further examine the reproducibility of the reported CNN approach, we implemented the proposed architecture according to its reported convolutional and fully connected layer configuration and trained it from scratch under the experimental protocol of the present study. The resulting implementation contained 6,617,884 trainable parameters, compared with 5,876,540 parameters reported in the original study, representing a 12.62% difference; therefore, it should not be considered an exact parameter-level reproduction. Under our standardized training configuration, the implemented CNN achieved an accuracy of only 20.05%, with weighted precision, weighted recall, and weighted F1-score values of 0.3243, 0.2005, and 0.1706, respectively. This substantial discrepancy from the 95.40% accuracy reported by Mengstu & Taner [
7] highlights the sensitivity of classification performance to differences in implementation and experimental conditions and further emphasizes the importance of clearly defined and consistently applied data-partitioning and evaluation protocols when comparing wheat variety classification models.
Data partitioning strategies vary considerably across agricultural image classification studies, although commonly reported ratios include 70:30 [
2,
26,
27], 70:15:15 [
10,
11,
28], 80:20 [
16,
29], and 80:10:10 [
30]. More importantly, the level of methodological detail regarding how images are assigned to these subsets differs substantially. Some studies have adopted explicit strategies, such as stratified partitioning and fixed validation sets [
10], session-based independent test sets [
31], or fixed independent test subsets [
4]. The validation set also plays an important role in model development, as it can be used for hyperparameter tuning, model selection, and monitoring generalization during training, whereas the test set should remain independent of these decisions and be used only for final performance evaluation. In contrast, several studies report only the partition ratio or describe the assignment as random without specifying the unit of partitioning or how the validation set was used during model development. This distinction is particularly important for fine-grained agricultural classification because multiple images may represent the same biological sample or highly correlated observations. If such images are distributed across training, validation, and test subsets, evaluation performance may reflect sample-specific visual characteristics rather than generalization to unseen biological material. Furthermore, differences in test-set composition can substantially affect reported performance, even when the same model is evaluated, emphasizing the importance of a fixed and representative test set [
31]. Therefore, reliable comparison of competing architectures requires not only a clearly defined partitioning strategy and an appropriately used validation set, but also evaluation of all models on the same independently defined test images. In the present study, the validation set was used for model selection during training, while the same independently defined test set was preserved across all evaluated architectures and was not used for model selection or hyperparameter adjustment. This protocol enabled differences in final performance to be attributed more directly to the evaluated models and preprocessing strategies rather than to variations in test-set composition or model-selection procedures.
The results obtained from the modified SwinT models indicate that adding an additional feature-selection mechanism does not necessarily complement the representations already learned by the backbone. Attention mechanisms such as CA and CBAM have been proposed to refine feature representations by assigning greater importance to informative responses [
22,
23]. However, both CA-CropWheatSwinT and CBAM-CropWheatSwinT performed significantly worse than the original SwinT in the present experiments. This outcome may be related to the fact that SwinT already establishes hierarchical representations through shifted-window self-attention [
9], while Transformer-based visual representations can capture relationships between image regions through self-attention [
32]. Therefore, the additional attention operations may not provide sufficiently complementary information for the subtle morphological differences encountered in wheat variety classification. This does not necessarily indicate a general compatibility issue between these mechanisms and Transformer architectures, but rather suggests that the specific implementations evaluated in this study did not provide complementary information beyond the representations already learned by SwinT. A similar pattern was observed for the RGB–Sobel configuration, where the explicit introduction of edge information through an auxiliary branch also failed to improve the baseline. For SwinT, the additional feature-processing modules evaluated in this study did not provide a performance gain, despite introducing explicit feature selection or complementary edge information. In contrast, the foreground-aware modification produced the most favorable outcome under the experimental conditions of this study, suggesting that improving the input representation was more beneficial than adding the feature-enhancement mechanisms evaluated here.
Several limitations should be considered when interpreting the findings of this study. First, the evaluation was conducted on a single wheat variety dataset comprising 124 classes, and because the dataset was collected from a single platform at Ondokuz Mayıs University, relatively homogeneous imaging conditions may have introduced dataset-specific bias. Therefore, the observed benefits of foreground-aware preprocessing within the model configurations evaluated in this study may not necessarily generalize to datasets acquired under substantially different imaging conditions or containing different wheat varieties. Second, although the proposed preprocessing preserves the original aspect ratio and focuses the input representation on the wheat kernel, its effectiveness may depend on the reliability of foreground localization, particularly for images with low foreground–background contrast or uneven illumination. Since the images in this study were acquired under relatively controlled conditions, the robustness of Otsu thresholding under more variable imaging conditions remains to be evaluated. Third, the additional CNN-based comparison was implemented according to the architectural description available in the reference study; however, the resulting parameter count differed from the reported value, and therefore this experiment should be regarded as an implementation-based comparison rather than an exact reproduction. Finally, the present experiments focused on classification performance and computational characteristics, while the effect of the proposed preprocessing on robustness under uncontrolled field conditions, different imaging devices, and external datasets was not directly evaluated. Therefore, the present findings should be interpreted as evidence of the benefit of foreground-aware preprocessing within the specific experimental setting and compared SwinT-based configurations investigated here, rather than as evidence that foreground preprocessing is generally superior to increased model complexity. Future studies involving cross-dataset validation and more diverse acquisition conditions would therefore be valuable for further assessing the generalizability of the proposed approach.
Despite these limitations, the findings indicate that foreground-aware input preprocessing can improve classification performance within the experimental setting investigated in this study. The proposed CropWheatSwinT configuration improved the SwinT baseline while retaining the same backbone and parameter count, whereas the investigated channel-, spatial-, and edge-enhancement modifications did not provide comparable benefits. The significant class-level improvement further indicates that the observed gain was not limited to a small number of dominant varieties. From a practical perspective, these findings suggest that data-centric preprocessing may provide a useful means of improving the representation of subtle variety-specific characteristics without modifying the backbone architecture. The study also highlights the importance of carefully controlled preprocessing, validation, and test-set protocols when evaluating fine-grained agricultural classification models. These considerations may contribute to more reproducible comparisons and provide a basis for further investigation of foreground-aware preprocessing across different wheat datasets and acquisition conditions.
5. Conclusions
Fine-grained wheat variety classification remains a challenging visual recognition problem because different cultivars can exhibit highly similar morphological and textural characteristics. This study systematically evaluated four baseline deep learning architectures, DenseNet201, MobileNetV2, InceptionV3, and SwinT, and investigated whether foreground-aware preprocessing and additional feature-enhancement mechanisms could improve the performance of the strongest baseline architecture.
Among the baseline models, SwinT achieved the highest classification performance, with a weighted F1-score of 91.91%, whereas MobileNetV2 provided the most efficient computational profile, with 2.38 million parameters, 0.33 GFLOPs, an inference time of 1.22 ms, and a throughput of 815.90 FPS.
The main contribution of this study was the development of CropWheatSwinT, a foreground-aware preprocessing strategy that improves the spatial representation of informative wheat-kernel regions without modifying the underlying SwinT architecture. The proposed strategy combines foreground localization, cropping with a safety margin, aspect-ratio-preserving resizing, and background-color padding. CropWheatSwinT achieved a weighted F1-score of 93.15%, with weighted Precision and weighted Recall values of 93.92% and 93.07%, respectively, corresponding to a 1.24 percentage-point improvement in weighted F1-score over the baseline SwinT.
The class-level analysis further supported the observed improvement of the proposed approach. The Macro F1-score increased from 0.9196 ± 0.0451 for SwinT to 0.9317 ± 0.0437 for CropWheatSwinT, corresponding to an improvement of 0.0121. This improvement was statistically significant, indicating that the gain was also reflected in class-level performance across the evaluated wheat varieties.
In contrast, the additional attention- and edge-enhancement mechanisms did not provide comparable benefits. CA-CropWheatSwinT, CBAM-CropWheatSwinT, and CropWheatSwinTwithSobel produced lower Macro F1-scores than the SwinT baseline, with ΔF1 values of −0.0275, −0.0545, and −0.0235, respectively.
Overall, the findings suggest that foreground-aware preprocessing can provide a simple and computationally efficient means of improving fine-grained wheat variety classification without increasing the parameter count of the underlying Transformer architecture.