1. Introduction
Urban digital twins (UDTs) are receiving increasing attention as a computational infrastructure for urban planning, monitoring, simulation, and operations in response to rising urban complexity [
1,
2]. In a UDT environment, heterogeneous static and dynamic urban data are integrated into a virtual 3D representation that supports analysis and decision-making across domains such as mobility, disaster response, resource management, and autonomous systems [
3,
4,
5]. However, at the building scale, the geometric and semantic fidelity of the underlying 3D assets remains a practical bottleneck [
6,
7]. While city-scale representations are increasingly abundant, their transition from visually appealing geometries to computationally actionable semantic models is still incomplete.
Many UDT building models are produced efficiently at scale using aerial photogrammetry or LiDAR and are subsequently textured using automated pipelines. While these workflows excel at generating macro-scale urban contexts, they frequently represent a building facade as a single, continuous textured surface—essentially a “shrink-wrapped” mesh—without explicitly separating constituent architectural elements such as windows, doors, and walls [
8]. As a result, these models are visually plausible but computationally impoverished. They are difficult to query, edit, or repurpose in downstream analytical tasks that require element-level geometric and semantic control. Recent reviews on semantic enrichment emphasize that explicitly structuring 3D city models is essential for unlocking value-added applications, moving beyond mere visualization [
9,
10,
11].
This structural deficiency is particularly problematic for windows. Window geometries and ratios fundamentally impact building energy modeling (BEM), daylight and ventilation simulations, privacy-aware urban visualizations, and facade maintenance planning [
12,
13,
14]. Yet, in practice, many LoD2 (Level of Detail 2) and photogrammetry-based models encode windows only implicitly within 2D texture maps. Extracting these features and converting them into independent 3D objects is thus a critical semantic enrichment step for advancing UDT utility.
As will be discussed in detail in
Section 2, prior research on facade parsing and city model enhancement provides a strong foundation. However, a significant research gap remains. Dense semantic segmentation models often require high-resolution street-level imagery and focus on pixel-level multi-class labeling, making them difficult to apply directly to the low-resolution, occluded, and distorted texture crops typical of aerial 3D models. Conversely, existing 3D reconstruction methods often rely on heavily regularized procedural rules or computationally intensive pipelines. There is a need for a lightweight, operational workflow that robustly bridges the gap between low-quality 2D texture patches and explicit 3D semantic objects.
To address this gap, this study proposes a computational pipeline tailored specifically for the window-level semantic enrichment of texture-mapped building models. Unlike previous studies that treat super-resolution merely as an image enhancement technique, this study formulates SRIM as an explicit input-conditioning strategy for semantic verification of extremely small texture crops. This study makes three main contributions to UDT modeling: (1) proposing a modular verification pipeline that utilizes the Segment Anything Model (SAM) purely as a coarse proposal generator; (2) formulating Super-Resolution-based Input Matching (SRIM) as an explicit, necessary conditioning strategy to overcome the resolution degradation of extremely small texture crops before classification; and (3) defining a mathematical texture-to-mesh mapping procedure that translates verified 2D texture regions into zero-thickness planar 3D patches mapped onto the existing mesh, serving as an initial stage for explicit semantic separation.
2. Related Work
The extraction of building components from UDT environments intersects several distinct research domains. This section reviews prior work in 3D city modeling, facade parsing, and image conditioning, highlighting the specific research gaps that the proposed pipeline aims to address.
2.1. Semantic Enrichment of 3D City Models
The utility of UDTs depends heavily on the geometric and semantic quality of the underlying 3D models. While automated modeling pipelines using aerial photogrammetry and LiDAR have enabled the rapid generation of city-scale geometries, these models frequently lack explicit semantic separation of building components [
6,
15]. In standards such as CityGML, advancing from a monolithic mesh to an enriched semantic model (e.g., explicitly defining windows and doors) is essential for analytical applications like building energy modeling and microclimate simulations [
16].
Recent efforts in semantic enrichment have attempted to bridge this gap by adding 3D details to textured LoD2 building models [
10,
17]. However, many existing reconstruction methods rely on highly regularized procedural rules or require heavy, multi-stage 3D pipelines. There remains a need for lightweight, bottom-up approaches that can extract and instantiate semantic objects directly from the raw texture maps already attached to standard 3D assets.
2.2. Facade Parsing and Element Extraction
Extracting architectural elements from building facades has been extensively studied within the domain of computer vision. Traditional and deep-learning-based semantic segmentation networks, such as FCN [
18] and U-Net [
19], have provided the foundation for dense pixel-level labeling. Specialized models, such as DeepFacade, incorporate structural priors to improve multi-class parsing on curated facade datasets [
20], while other methods rely on established street-view datasets like the CMP Facade Database to train robust classifiers [
21].
Despite these advances, a significant operational gap exists when applying these models to UDT environments. Most dense facade parsers are designed for high-resolution, orthorectified, street-level imagery. In contrast, aerial-derived texture maps in 3D city models are typically low-resolution, suffer from perspective distortions, and contain severe occlusions from street-level objects [
22]. Consequently, full-image dense segmentation often fails or requires extensive retraining. This study adopts a more focused approach: rather than dense multi-class parsing, we target the robust verification of discrete window regions from small texture crops.
2.3. Foundation Models and Image Conditioning in Low-Quality Imagery
The recent emergence of foundation models, notably the Segment Anything Model (SAM) [
23], has shifted the paradigm of object extraction. While SAM exhibits strong zero-shot localization capabilities, it is class-agnostic and generates generic region proposals. To convert these proposals into reliable semantic classes (e.g., windows), a verification stage is required.
A major challenge in verifying proposals from UDT textures is the extremely small size of the extracted crops. Direct resizing (e.g., bilinear interpolation) of these small crops to standard classifier input sizes causes severe blurring and aliasing, degrading feature extraction. In remote sensing and low-quality image analysis, super-resolution (SR) networks—such as EDSR [
24] and ESPCN [
25]—have increasingly been used not merely for visual enhancement but also as a critical preprocessing step to condition inputs for downstream detection and classification tasks [
26,
27]. Furthermore, advanced attention mechanisms and multi-modal fusion frameworks have recently demonstrated significant potential in enhancing feature connectivity in complex remote sensing imagery [
28], providing valuable insights for parsing degraded urban structures. Building on this insight, our work formulates an SR-based Input Matching (SRIM) strategy explicitly as an input-conditioning mechanism to bridge the gap between SAM’s coarse proposals and the verification classifier, thereby significantly improving reliability on low-quality facade textures.
3. Methodology
This study addresses window-level semantic enrichment of texture-mapped 3D building models. The target textures can be produced rapidly and at city scale, but they are often noisy, incomplete, and of limited resolution because the models are generated under practical production constraints. High-rise building surfaces are dominated by walls and windows, whereas doors in aerially acquired textures are frequently occluded by trees, banners, or other street-level objects. For that reason, the present work concentrates on window extraction and 3D instantiation rather than on fully general multi-class facade parsing.
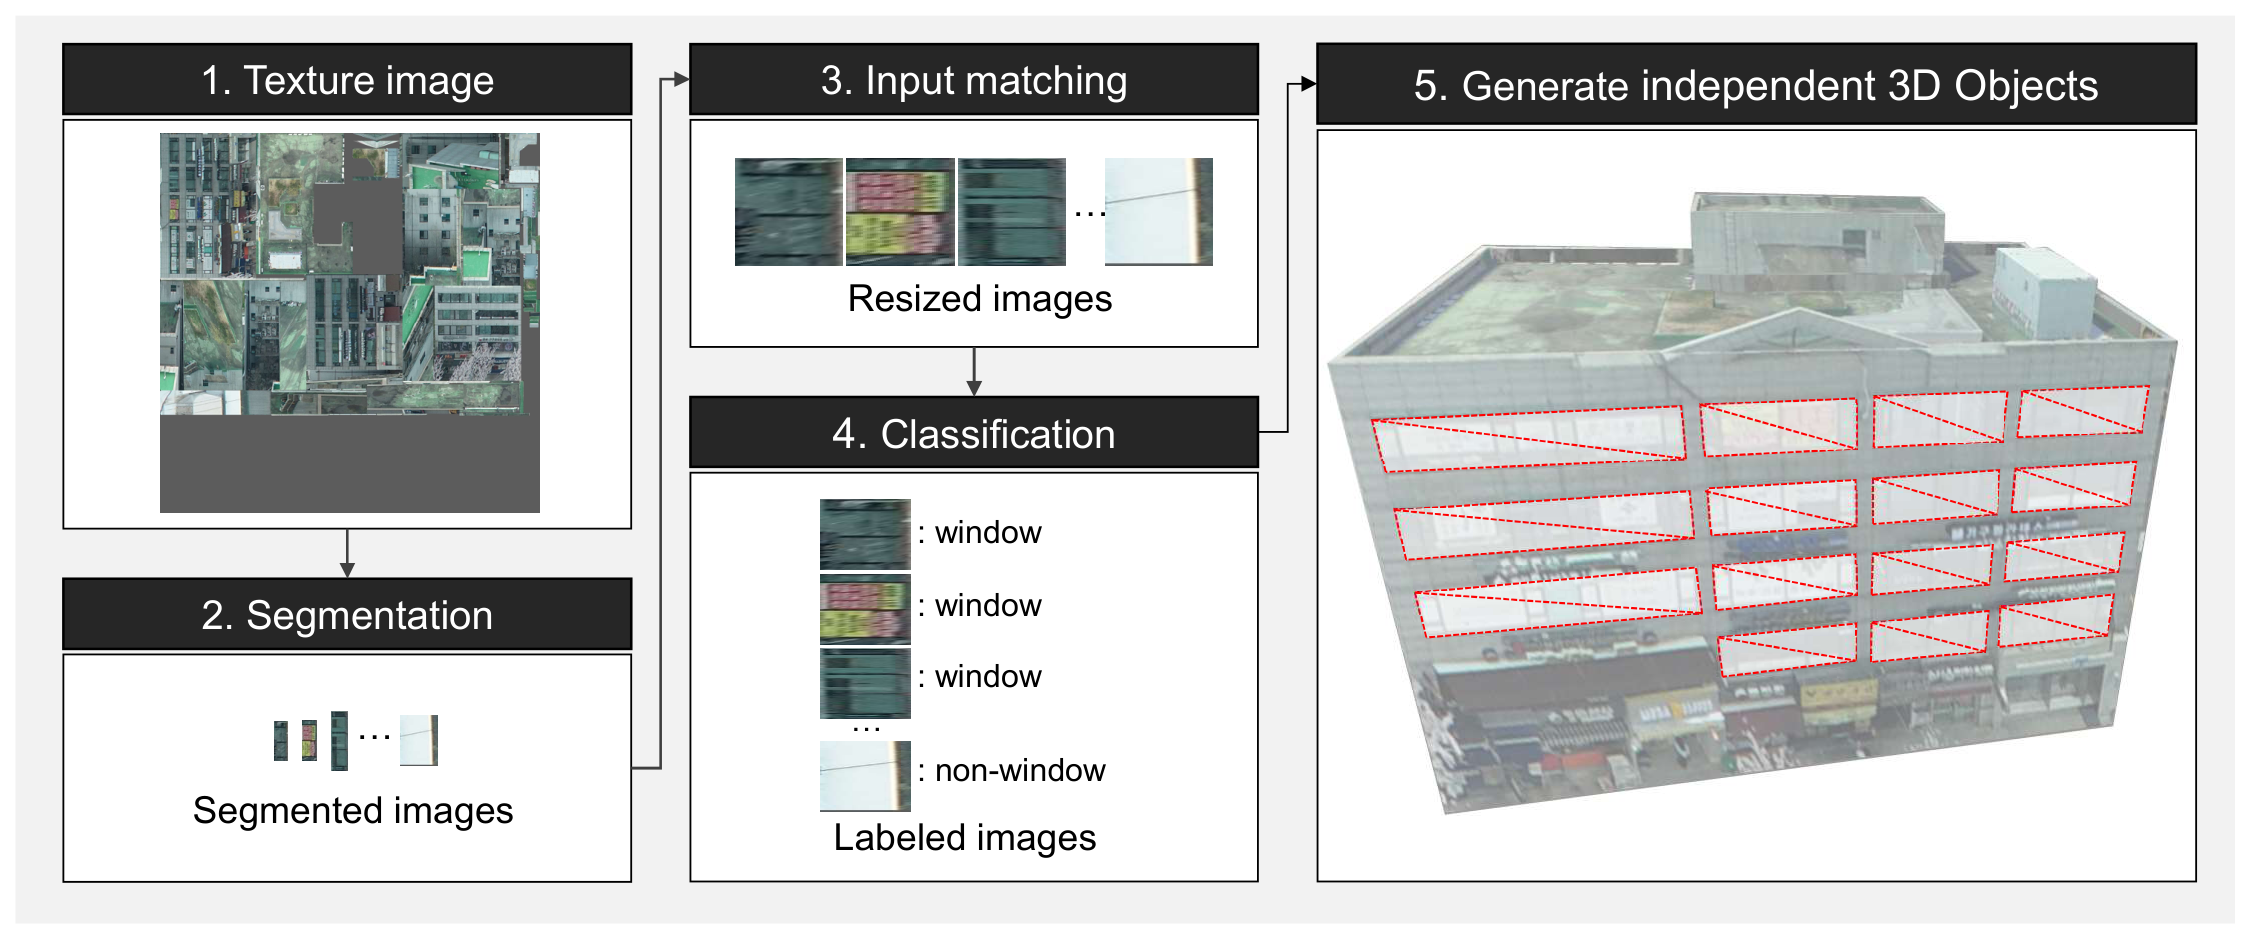
Figure 1 summarizes the proposed workflow.
3.1. Window Candidate Extraction
The first stage processes each texture image with SAM [
23] to obtain coarse candidate regions. In this study, SAM is used as a generic proposal generator rather than as a final semantic segmentation model. We leverage SAM’s zero-shot generalization capabilities, which allow it to robustly identify object boundaries across diverse architectural styles without the need for extensive domain-specific fine-tuning [
29]. In the current implementation, this stage is instantiated with the SAM2.1 Hiera-L checkpoint
sam2.1_hiera_large.pt and configuration
configs/sam2.1/sam2.1_hiera_l.yaml. The resulting regions are treated as tentative window hypotheses and are passed to the subsequent SRIM-assisted verification classifier. This design reduces the amount of background presented to the classifier while retaining the flexibility of a foundation-model-based extractor for diverse facade textures.
Two prompting modes are supported for reproducible candidate extraction. If no region of interest (ROI) is specified, the entire texture image is treated as a single ROI and processed with the automatic mask generator. If one or more rectangular ROIs are specified, each ROI is cropped and processed independently. Optional point prompts can then be added inside an ROI as foreground cues. In other words, the implementation supports both a fully automatic proposal mode and an ROI-restricted prompt mode, while the downstream verification stage remains identical in both cases.
For the automatic proposal mode, we utilized the default settings of the SAM automatic mask generator, discarding masks with a predicted IoU below 0.8 or a stability score below 0.95. Duplicate proposals were removed via box-level non-maximum suppression (NMS) with an IoU threshold of 0.7, a standard technique for filtering overlapping predictions in object detection tasks [
30]. For the point-guided mode, each clicked point is converted from global texture coordinates to ROI-local coordinates and is processed as an independent one-point foreground prompt. The predictor is queried with
multimask_output=True, yielding three candidate masks per point. Only the single mask with the highest predicted IoU is retained for that point. The retained binary mask is then converted to an axis-aligned bounding box; if no valid bounding box can be extracted after alpha-thresholding at 0.55, that candidate is discarded. Candidate masks originating from different points or different ROIs are not merged at this stage, so each surviving SAM output remains an independent window proposal.
3.2. SR-Based Input Matching
After SAM proposes coarse candidate regions, each candidate must be converted into an input suitable for the verification classifier. The ResNet-50-based classifier [
31] expects images of size
pixels, whereas many candidate crops are extremely small (e.g.,
pixels). A direct one-step interpolation (e.g., bilinear or bicubic) from such crops to the classifier input size often leads to severe aliasing and structural information loss [
32]. To mitigate this mismatch, we introduce SR-based input matching (SRIM), which uses super-resolution (SR) as an explicit conditioning step before the final resize.
The key observation is that most SR models operate only at discrete scales. In this work, Enhanced Deep Super-Resolution (EDSR) [
24], Efficient Sub-Pixel Convolutional Network (ESPCN) [
25], and Fast Super-Resolution Convolutional Neural Network (FSRCNN) [
33] support scales of 2, 3, and 4, whereas Laplacian Pyramid Super-Resolution Network (LapSRN) [
34] supports scales of 2, 4, and 8. Instead of fixing a single SR factor, SRIM searches over compositions of the available factors and selects the sequence whose cumulative scale brings the smaller crop dimension closest to the classifier input size. In this sense, SRIM is an input-matching strategy rather than a new SR architecture.
Algorithm 1 builds a map from achievable cumulative scales to the shortest corresponding SR-factor sequence. Because the search is breadth-first, the first discovered sequence for any reachable scale uses the fewest SR operations. We set the maximum admissible scale to
, computed as
, where 224 is the classifier input size and 9 pixels is the smallest candidate dimension observed in the data. This threshold is sufficient to cover the smallest crops while keeping the search space compact.
| Algorithm 1 Construction of the scale-combination map. |
Input: Maximum admissible scale, T; Available SR scale factors, .
Output: Scale combination map, .
- 1:
- 2:
- 3:
- 4:
while Q is not empty do - 5:
- 6:
for all do - 7:
- 8:
if and then - 9:
- 10:
Enqueue - 11:
end if - 12:
end for - 13:
end while - 14:
return
|
Algorithm 2 applies the scale-combination map to a specific candidate crop. Let
denote the smaller image dimension and let
be the set of reachable cumulative scales. The selected scale is
where
N is the classifier input size. If the selected sequence is
and
is the original crop, the sequential SR step is written as
where
denotes the SR operator with scale factor
f. A final bilinear interpolation
then produces the exact classifier input size,
| Algorithm 2 SRIM inference for classifier input matching. |
Input: Scale combination map, ; Image size, ; Classifier input size, N; Original crop, .
Output: Matched classifier input, .
- 1:
- 2:
- 3:
- 4:
for all do - 5:
- 6:
- 7:
if then - 8:
- 9:
- 10:
end if - 11:
end for - 12:
- 13:
for all do - 14:
- 15:
end for - 16:
- 17:
return
|
The practical objective of SRIM is to reduce the distortion introduced when extremely small crops are expanded to classifier scale. In the present workflow, Algorithm 1 is executed once for each family of available SR factors, and Algorithm 2 is applied to every candidate crop. This formulation keeps the method computationally lightweight while making the input-conditioning logic explicit and reproducible.
3.3. Window Region Verification Classifier
A ResNet-50 model pre-trained on the ImageNet dataset [
35] was fine-tuned to serve as a window region verification classifier. ResNet-50 was selected due to its optimal balance between representational capacity and computational efficiency, effectively mitigating the vanishing gradient problem through residual connections [
31]. Since the original ImageNet dataset does not include a specific window class tailored to architectural facades, the model was fine-tuned to output a binary window probability using a Sigmoid activation function. The network is optimized by minimizing the standard binary cross-entropy (BCE) loss [
36].
The training data for fine-tuning was generated directly from 3D building models of 130 buildings within a 1 km radius of Suseo Station in Gangnam-gu, Seoul, South Korea. Workers manually labeled bounding boxes corresponding to window regions on the texture images. The area within each designated bounding box was defined as a window image, whereas areas with zero intersection over union with any window bounding box were randomly extracted and designated as non-window images.
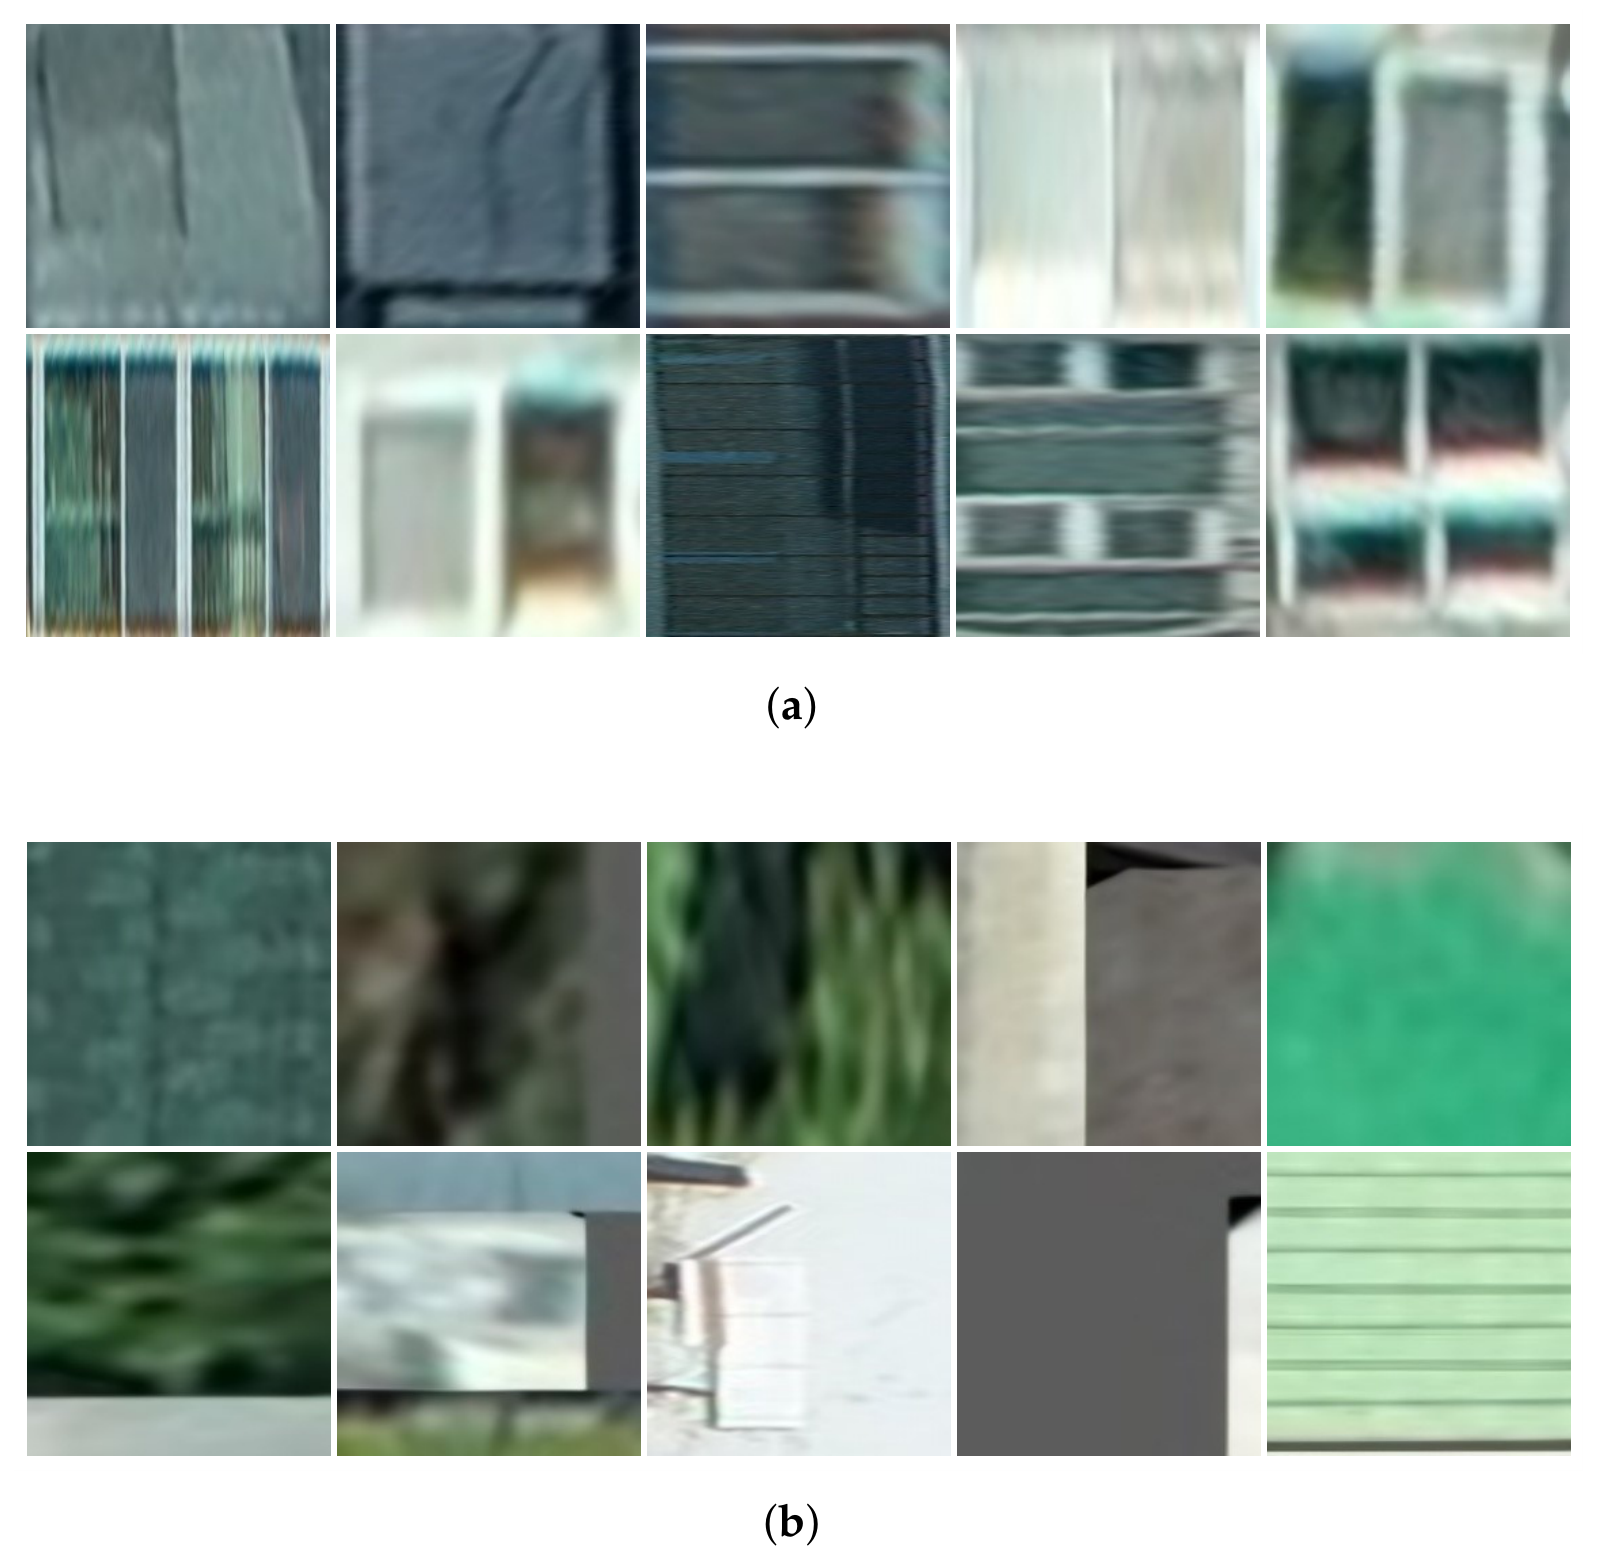
Figure 2 shows representative training samples. The dataset comprises 6703 images: 3387 window images and 3316 non-window images. It was partitioned into training, validation, and test sets using a 70%, 15%, and 15% split, respectively, via random sample-level shuffling. Because the target area consists of apartment complexes with highly homogeneous architectural styles and facade textures, a sample-level split was adopted to prevent the isolation of building-specific idiosyncratic patterns and ensure a balanced morphological distribution across subsets. During fine-tuning, the Adam optimizer [
37] was used with an initial learning rate of 0.001 and a batch size of 256. The network was trained for 20 epochs, and the model with the lowest validation loss was selected for subsequent evaluation.
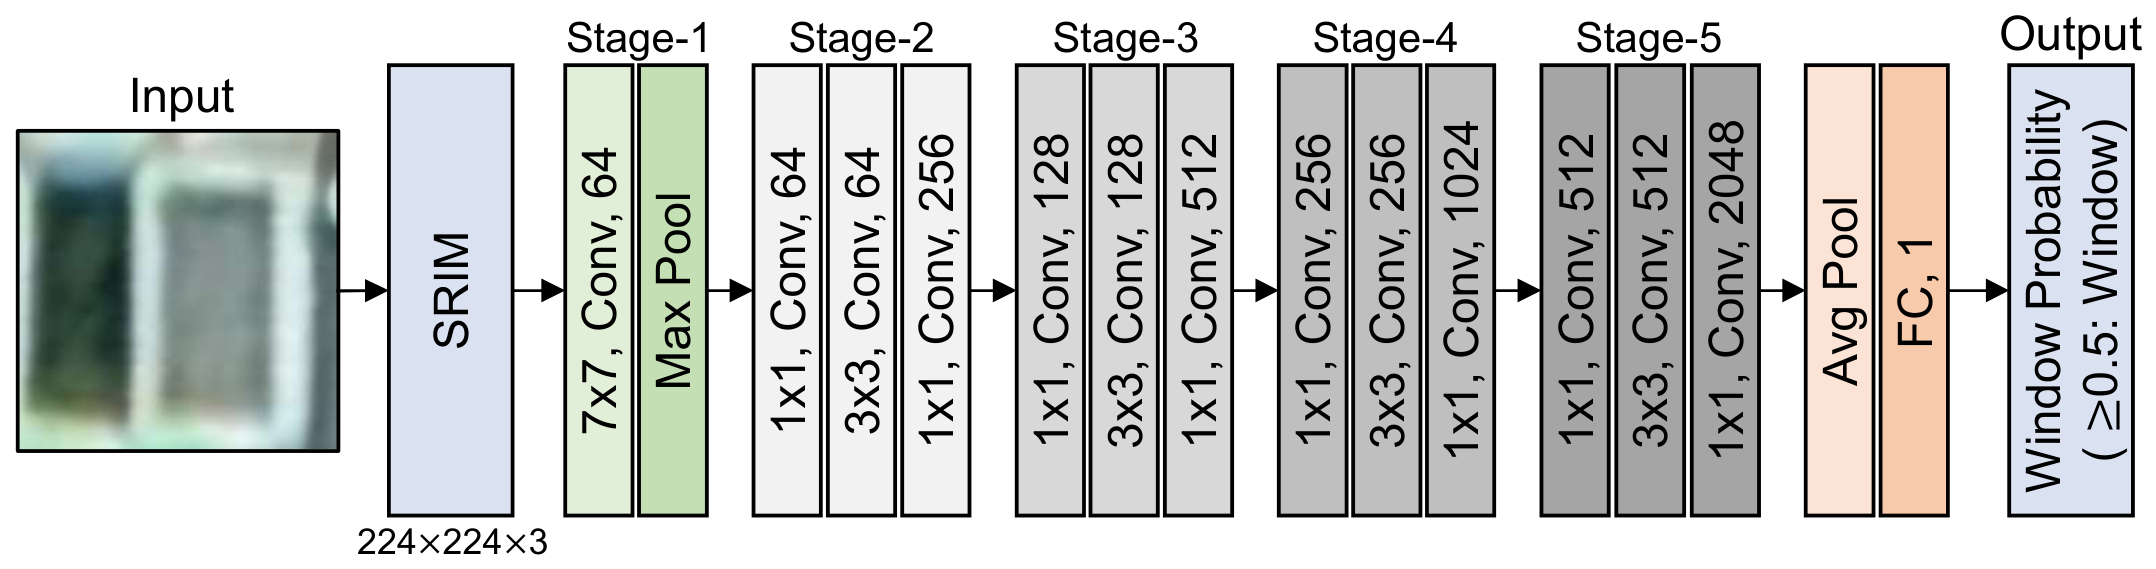
In our architecture, the fine-tuned ResNet-50 model integrates the SRIM module described in
Section 3.2 at its input, as illustrated in
Figure 3. The SRIM module first enhances the resolution of the input image, thereby providing a better conditioned image for feature extraction. The enhanced image is then processed by the ResNet-50 model, which outputs a binary classification label indicating whether the image contains a window. We removed the SRIM module from the training pipeline to reduce computational overhead during iterative training. Instead, all training, validation, and test images were preprocessed using the SRIM technique to match the input size of the classifier before fine-tuning. This preprocessing step eliminates the need for repeated SR operations during training. However, during inference, the SRIM module is integrated directly at the front of the classifier, as depicted in
Figure 3, ensuring that high-resolution inputs are provided for accurate window region verification.
Operationally, each surviving SAM proposal is converted into a classifier crop by extracting the proposal bounding box from the original texture image and expanding it by a fixed 7-pixel margin on all sides, clipped to the image boundary. The crop is resized to
using the resizing method under evaluation in
Section 3.2, converted to an RGB tensor, and normalized with the ImageNet mean and standard deviation. During inference, candidate crops are processed in batches of 256. The classifier outputs a single logit, and the sigmoid probability is rounded to obtain the final binary decision; equivalently, a proposal is accepted as a window when
and is discarded otherwise. No additional post-classification merging, voting, or non-maximum suppression is applied. Therefore, each positively classified proposal becomes one final window instance, and its absolute image coordinates are recovered by adding the local proposal box to the origin of the ROI from which it was generated.
3.4. Generating Individual 3D Window Objects
After a candidate region has been verified as a window, the next step is to instantiate it as an independent 3D object. The purpose of this stage is semantic enrichment of an existing texture-mapped building model by attaching explicit window geometry to regions previously encoded only in texture space.
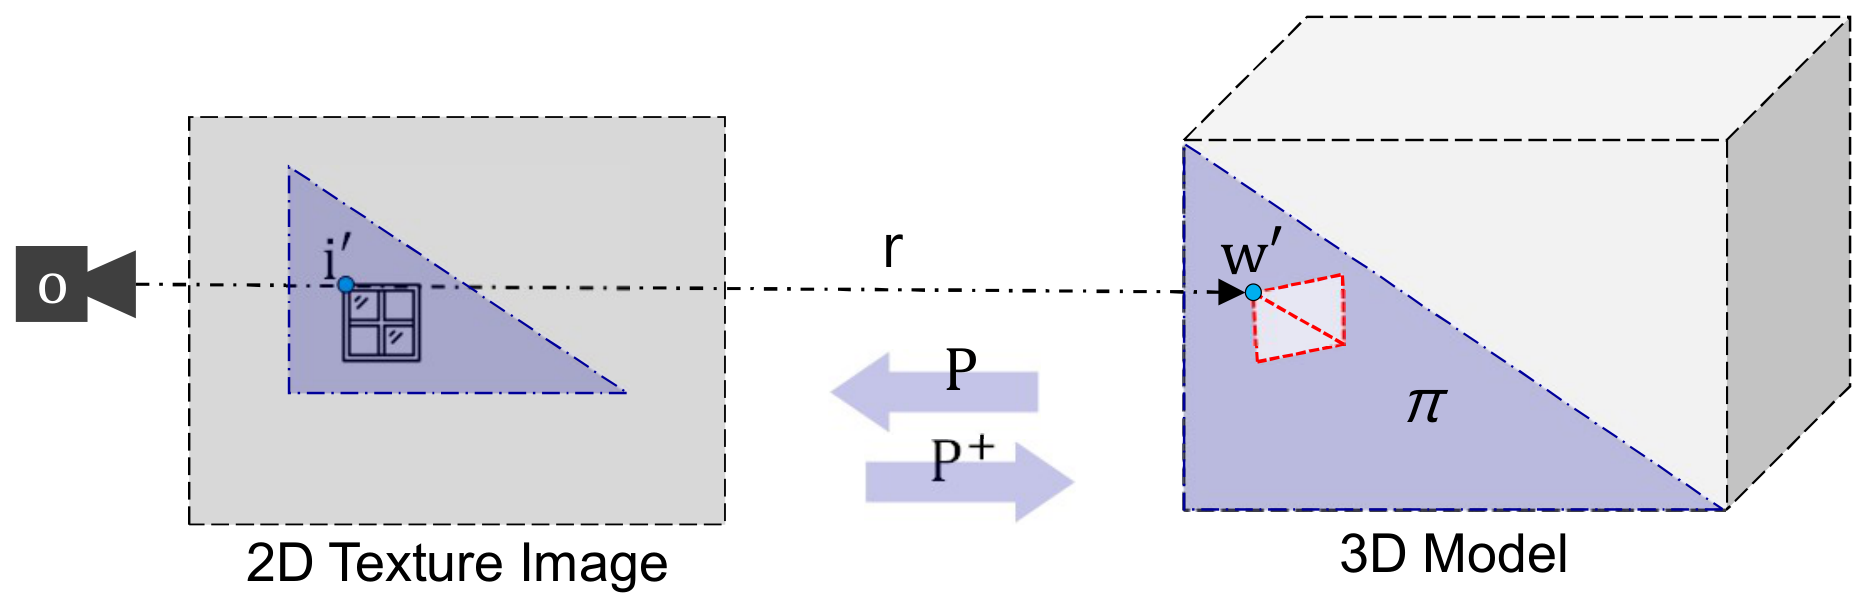
For each verified window vertex in the texture image, we first identify the triangle of the texture atlas to which the vertex belongs using a standard point-in-triangle test based on cross-product signs. The procedure assumes that the texture region associated with each mesh triangle is locally planar, which is appropriate for the facade patches considered here (
Figure 4). Since standard UDT LoD2 models inherently abstract building geometries into simplified planar polygons, this locally planar assumption is consistent with the target data structure. Addressing complex non-planar architectural features (e.g., curved walls) or mitigating severe distortions in the original texture atlas would require modeling at a higher level of detail (e.g., LoD3), which remains beyond the current scope of this pipeline.
Let
denote the homogeneous 2D texture coordinates of the three vertices of the matched texture triangle and let
denote the corresponding homogeneous 3D vertices of the mesh triangle. Drawing from fundamental principles of multiple view geometry [
38], we define a
linear mapping
such that
For a verified window vertex
in texture space, the inverse mapping defines a 3D projection ray. Because
is non-square, a standard inverse does not exist; therefore, the Moore–Penrose pseudo-inverse is applied [
38,
39] to obtain the ray direction:
The point obtained from Equation (
5) lies on the projection ray rather than directly on the facade plane. We therefore compute the intersection between that ray and the plane of the matched mesh triangle, utilizing the standard ray-plane intersection formulation widely used in computer graphics [
40]. Let the plane be defined as
where the plane normal is
and
. With camera origin
, the ray equation is
where
denotes the Cartesian part of
. Substituting Equation (
7) into Equation (
6) gives the intersection parameter
t:
In the implementation,
is assumed for simplicity, which reduces Equation (
8) to the form used in our computations. The final 3D window vertex is then
Applying this procedure to all vertices of a verified window polygon yields a zero-thickness 3D window surface that acts as a coplanar overlay on the original facade rather than a boolean-cut geometry. This patch can be instantiated as a separate object and textured with the corresponding image patch from the original facade texture.
4. Experimental Results
The experimental section is organized around three questions: whether SRIM improves the primary window region verification task, whether the same resizing behavior is observed on diverse auxiliary crops, and whether verified window regions can be instantiated as independent 3D objects.
4.1. Primary Evaluation of SR-Based Input Matching for Window Region Verification
Because the central methodological claim of this paper concerns input conditioning for small candidate crops, the primary quantitative evaluation is organized around the window region verification stage. This isolates the effect of SRIM from the upstream proposal generator and from the downstream 2D-to-3D mapping stage. To evaluate the effectiveness of different SR techniques within SRIM, we compared EDSR, ESPCN, FSRCNN, and LapSRN against bilinear interpolation, which serves as the conventional resizing baseline commonly used in standard deep learning pipelines. Each method was run 10 times with random weight initialization and randomized training data order while keeping the dataset partition fixed.
Table 1 reports the mean and standard deviation of accuracy, F1 score, mean average precision (mAP), and mean area under the curve (mAUC); an independent samples t-test confirmed that the performance improvement of EDSR over the bilinear baseline is statistically significant (
).
The results indicate that EDSR yields the best performance across all reported metrics. Specifically, accuracy improves by 1.4 percentage points, from 93.6% with bilinear interpolation to 95.0% with EDSR. Although this gain is modest in absolute magnitude, it is statistically significant and consistent across all reported metrics and across 10 runs, which is important in the intended workflow. Each false positive accepted by the verifier propagates to the 3D instantiation stage as an unnecessary window object, whereas each false negative leaves a facade opening unavailable for downstream analysis. Consequently, a small but stable improvement at the verification stage can reduce manual cleanup and improve the reliability of semantic enrichment when many candidate regions are processed across large model collections.
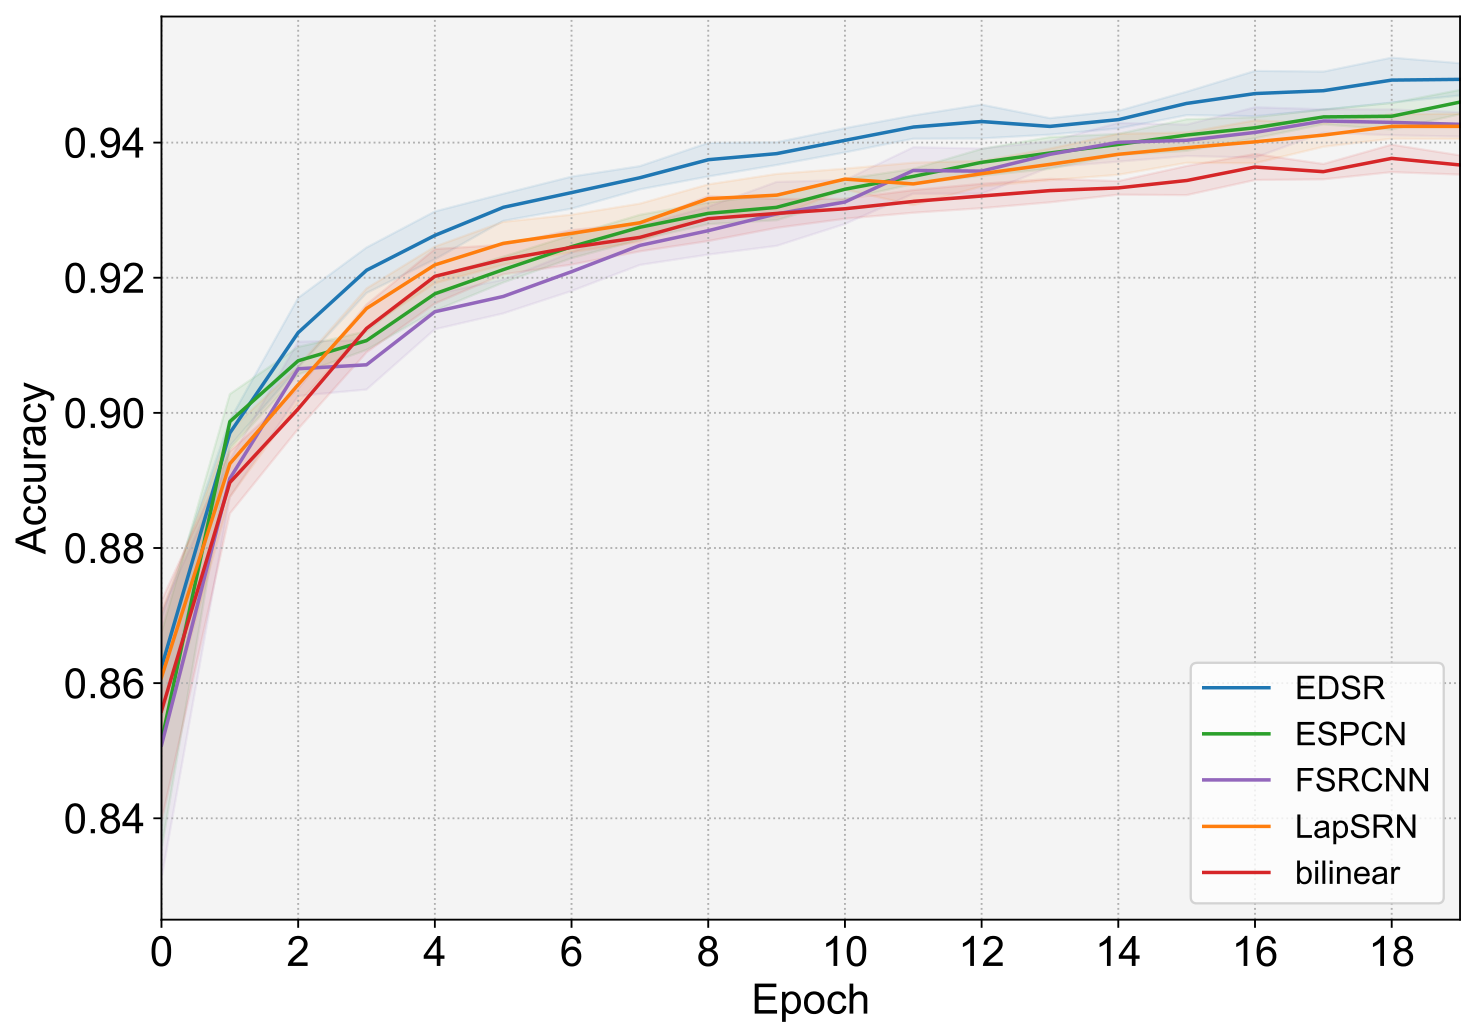
Figure 5 visualizes the mean and standard deviation of test accuracy at each epoch across the 10 runs and shows that the EDSR-based model remains consistently strong throughout training. This domain-specific experiment constitutes the primary quantitative evidence for the proposed pipeline because it directly uses window crops derived from texture images of the target 3D building models.
4.2. Auxiliary Evaluation of SR-Based Input Matching on Open Images Crops
While the primary evaluation in
Section 4.1 demonstrates SRIM’s effectiveness on our specific patch verification task, it is crucial to verify that the feature-preserving benefits of SRIM are domain-agnostic and not merely an artifact of our fine-tuned binary classifier. To isolate the resizing behavior and demonstrate its fundamental effectiveness, as auxiliary evidence for the resizing behavior of SRIM, we conducted an additional experiment on images spanning diverse classes. Although these images do not contain architectural facades, this multi-class classification setup using a pre-trained model provides an objective baseline to confirm that SRIM prevents structural information loss better than conventional interpolation methods during the aggressive resizing of extremely small crops. We selected 21,477 bounding-box-cropped images from 156 classes in Open Images Dataset V7 [
41]. These classes were chosen based on their overlap with ImageNet categories. We considered eight representative resizing techniques, including conventional interpolation methods such as nearest neighbor, bilinear, bicubic, and Lanczos, together with deep learning-based SR methods such as EDSR [
24], ESPCN [
25], FSRCNN [
33], and LapSRN [
34]. For the SR methods, the SRIM procedure in
Section 3.2 was applied.
Using each technique, we resized the evaluation images to
, the input size of ResNet-50, and measured performance with a pre-trained ResNet-50 initialized with ImageNet weights. Performance was assessed using accuracy, F1 score, mAP, and mAUC. The results are presented in
Table 2.
Table 2 shows that EDSR achieves the highest accuracy, F1 score, and mAP, which is consistent with the primary findings in
Section 4.1. EDSR employs a residual architecture, omits batch normalization to reduce memory usage, and is well suited to recovering detail in small images [
24]. These properties likely contribute to its advantage in classification after resizing. By contrast, nearest neighbor produces the lowest performance across all metrics, which is consistent with its limited ability to preserve fine detail. This auxiliary experiment supports the observation that SRIM improves the conditioning of small cropped regions beyond the target dataset. By explicitly showing that the accuracy improvements hold across 156 diverse classes without any domain-specific fine-tuning, this experiment validates the general robustness of the SRIM formulation and provides additional evidence for the effectiveness of SRIM as a preprocessing step for UDT texture crops.
4.3. Qualitative Demonstration of Individual 3D Window Object Generation
Individual 3D window objects are generated from the verified window regions in the building texture model. The 3D vertices of these windows are computed using the method described in
Section 3.4, allowing the creation of separate window models that are ready for texturing. The corresponding textures derived from the original 2D texture maps are then applied to each 3D window model, preserving visual consistency between the texture domain and the generated 3D geometry.
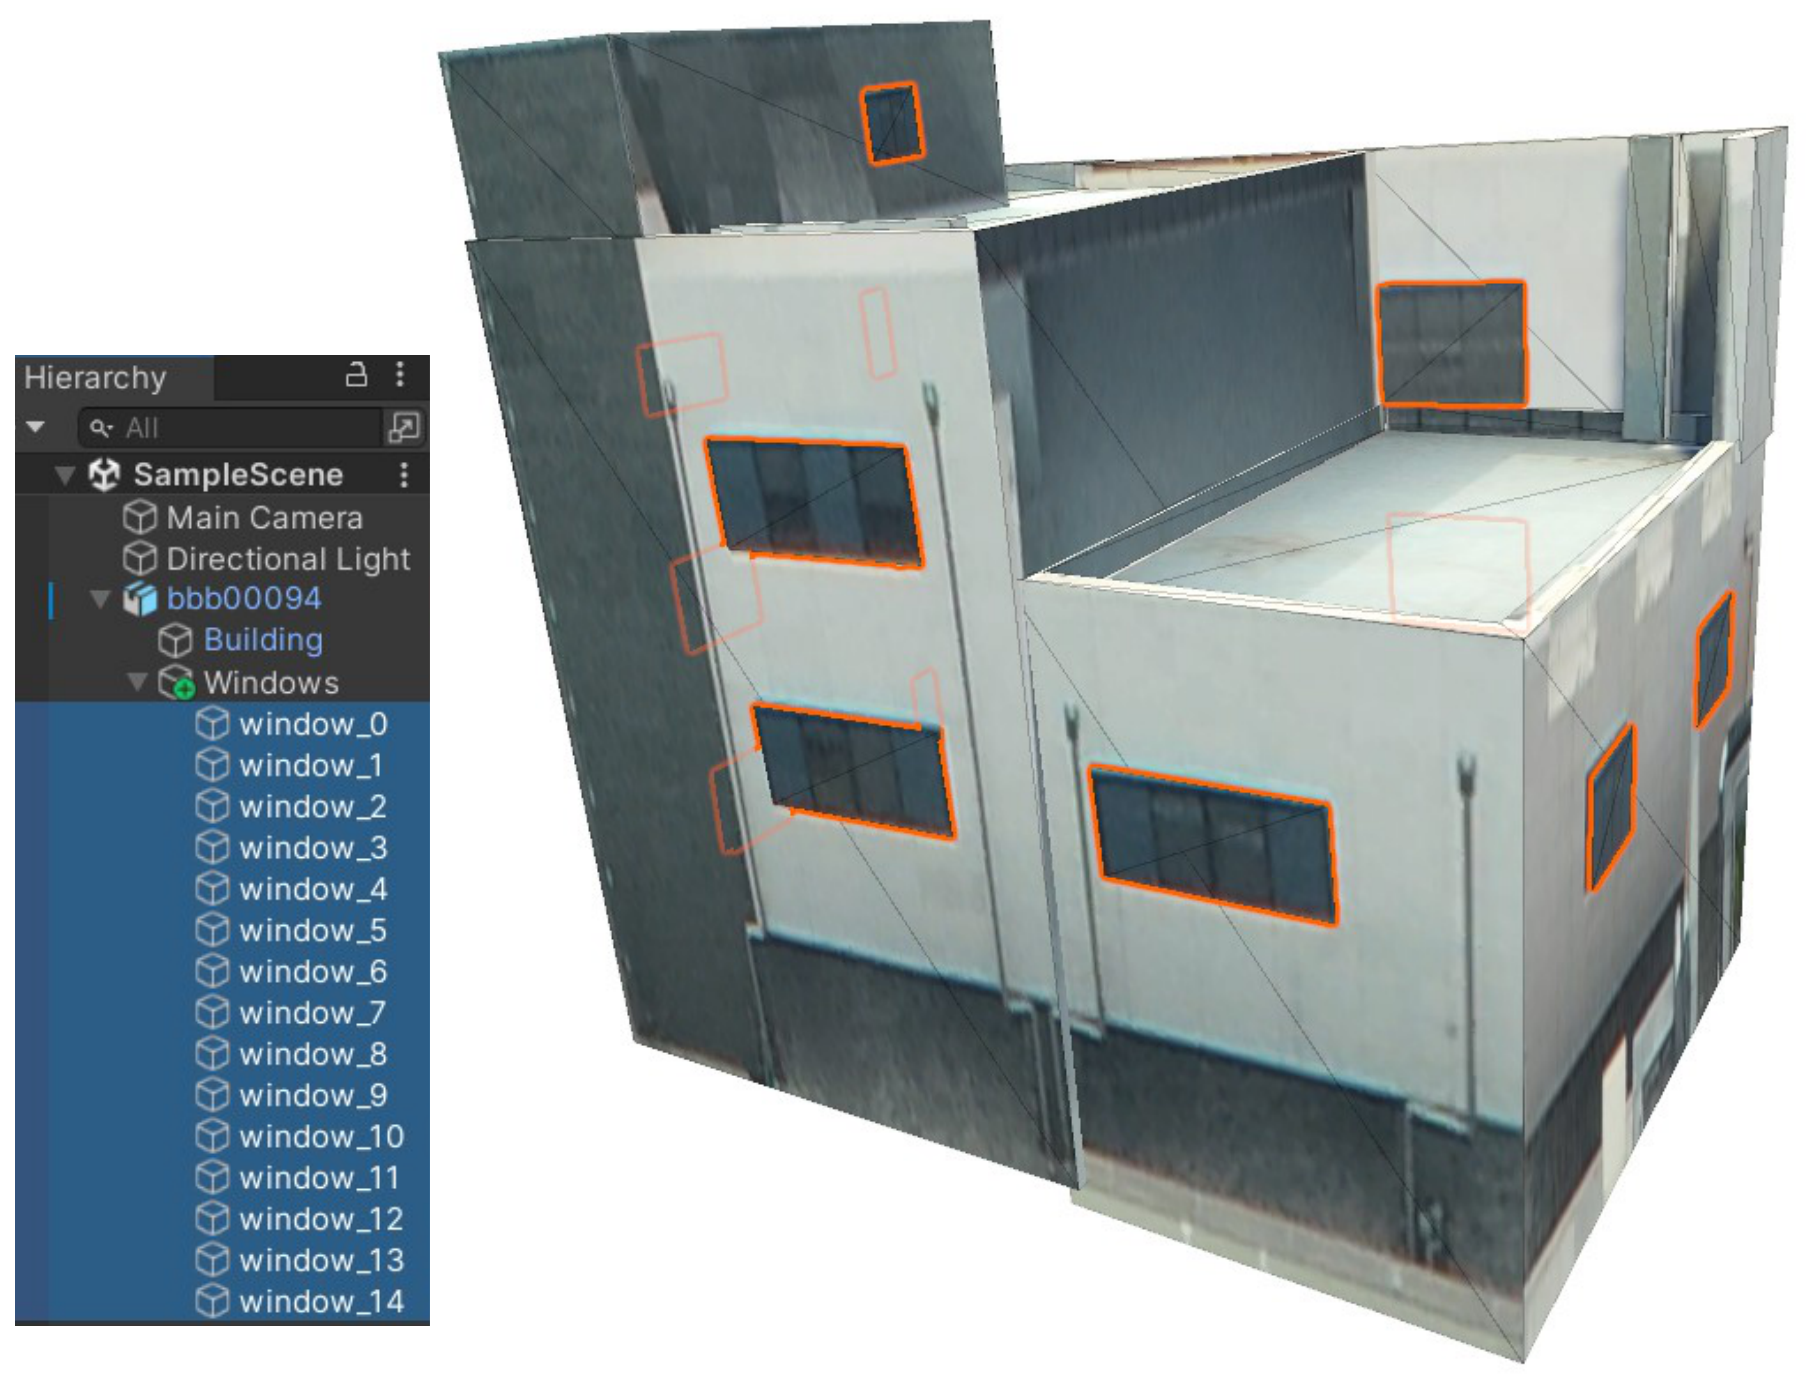
Figure 6 shows a representative building model with the generated individual window objects. In the Unity3D 2020.3.49f1 visualization, selecting window_0 through window_14 highlights their outlines in orange, qualitatively demonstrating successful instantiation as separate 3D objects.
Beyond these individual building tests, we further validated the scalability of the proposed pipeline on a large-scale testbed consisting of two specific apartment complexes in Suseo-dong, Gangnam-gu, Seoul, Republic of Korea. The input 3D models were provided in OBJ format, generated via aerial photogrammetry at an LoD2-equivalent level of abstraction, with an estimated average Ground Sampling Distance (GSD) of 3–5 cm for the facade textures. This area represents a high-density residential environment where manual window modeling for multiple high-rise structures is significantly labor-intensive. By applying the automated pipeline to these entire complexes, we demonstrate the practical utility of the method for city-scale semantic enrichment.
As illustrated in
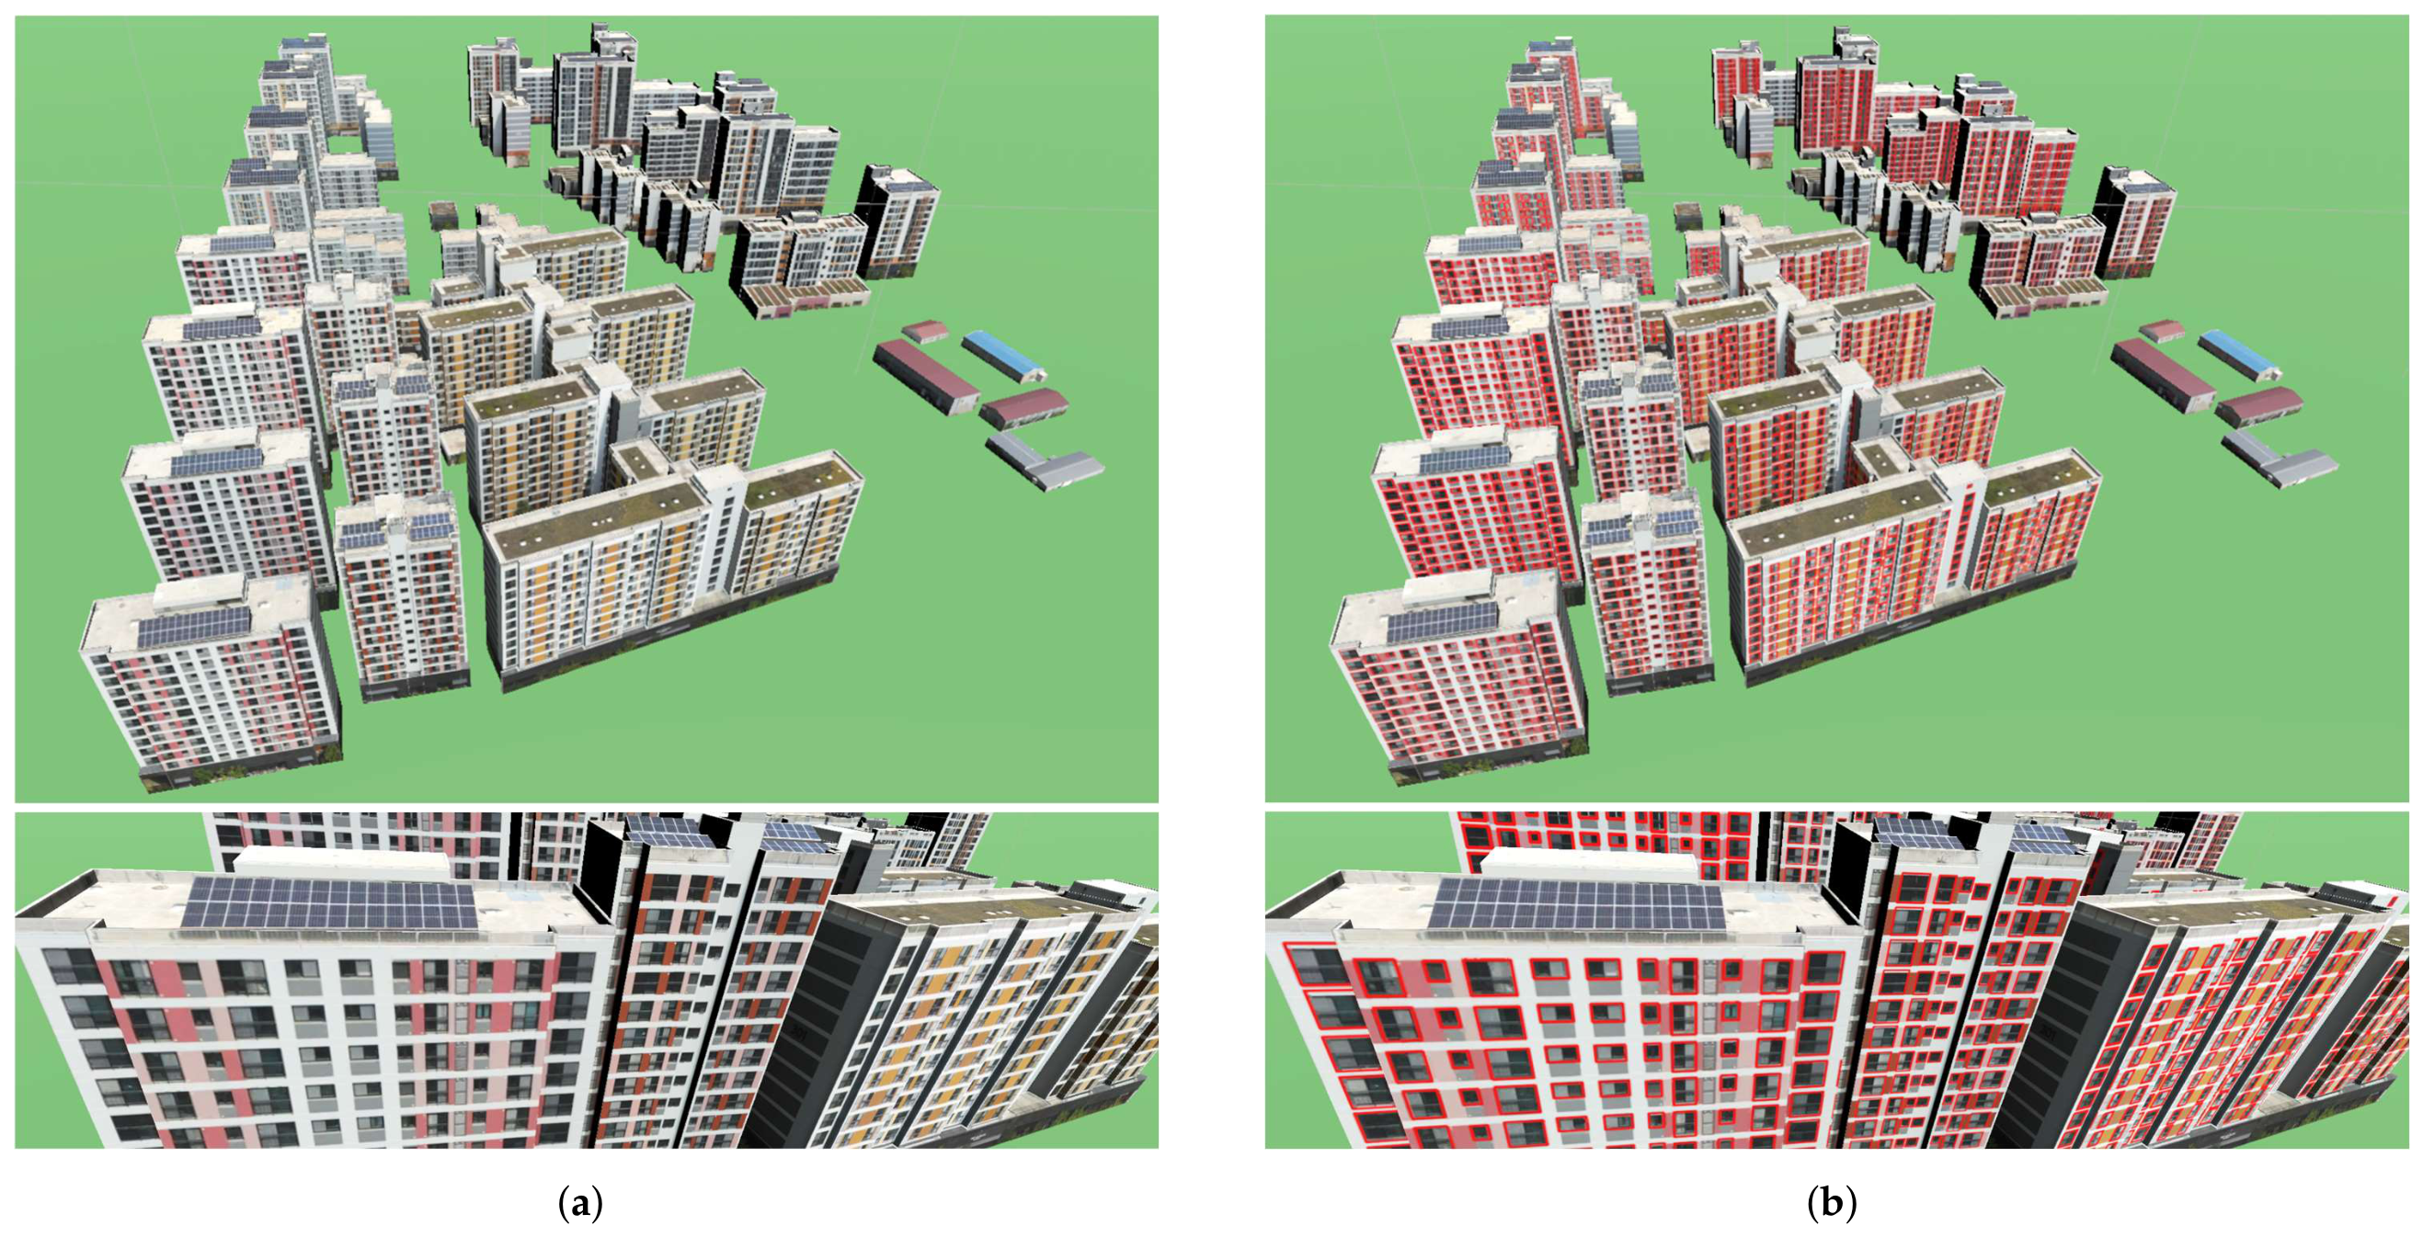
Figure 7, the window instantiation process was successfully executed across all buildings within the selected complexes. The transition from the raw facade textures in
Figure 7a to the semantically enriched models in
Figure 7b demonstrates the pipeline’s ability to handle complex arrangements and repetitive patterns. The red overlays in
Figure 7b represent the verified window meshes that were automatically generated and accurately mapped onto the existing building facades. Despite the inherent perspective distortions in the aerial-derived textures, the SRIM-conditioned verification maintained high reliability. This successful deployment on a real-world multi-building site confirms that our methodology effectively transforms monolithic, large-scale urban models into semantically enriched assets ready for element-level analysis. In terms of computational efficiency, processing a single building model took an average of 4.2 s using a single NVIDIA RTX 3090 GPU, demonstrating the practical feasibility of the pipeline for rapid city-scale deployment.
4.4. Quantitative Evaluation of 3D Window Instantiation
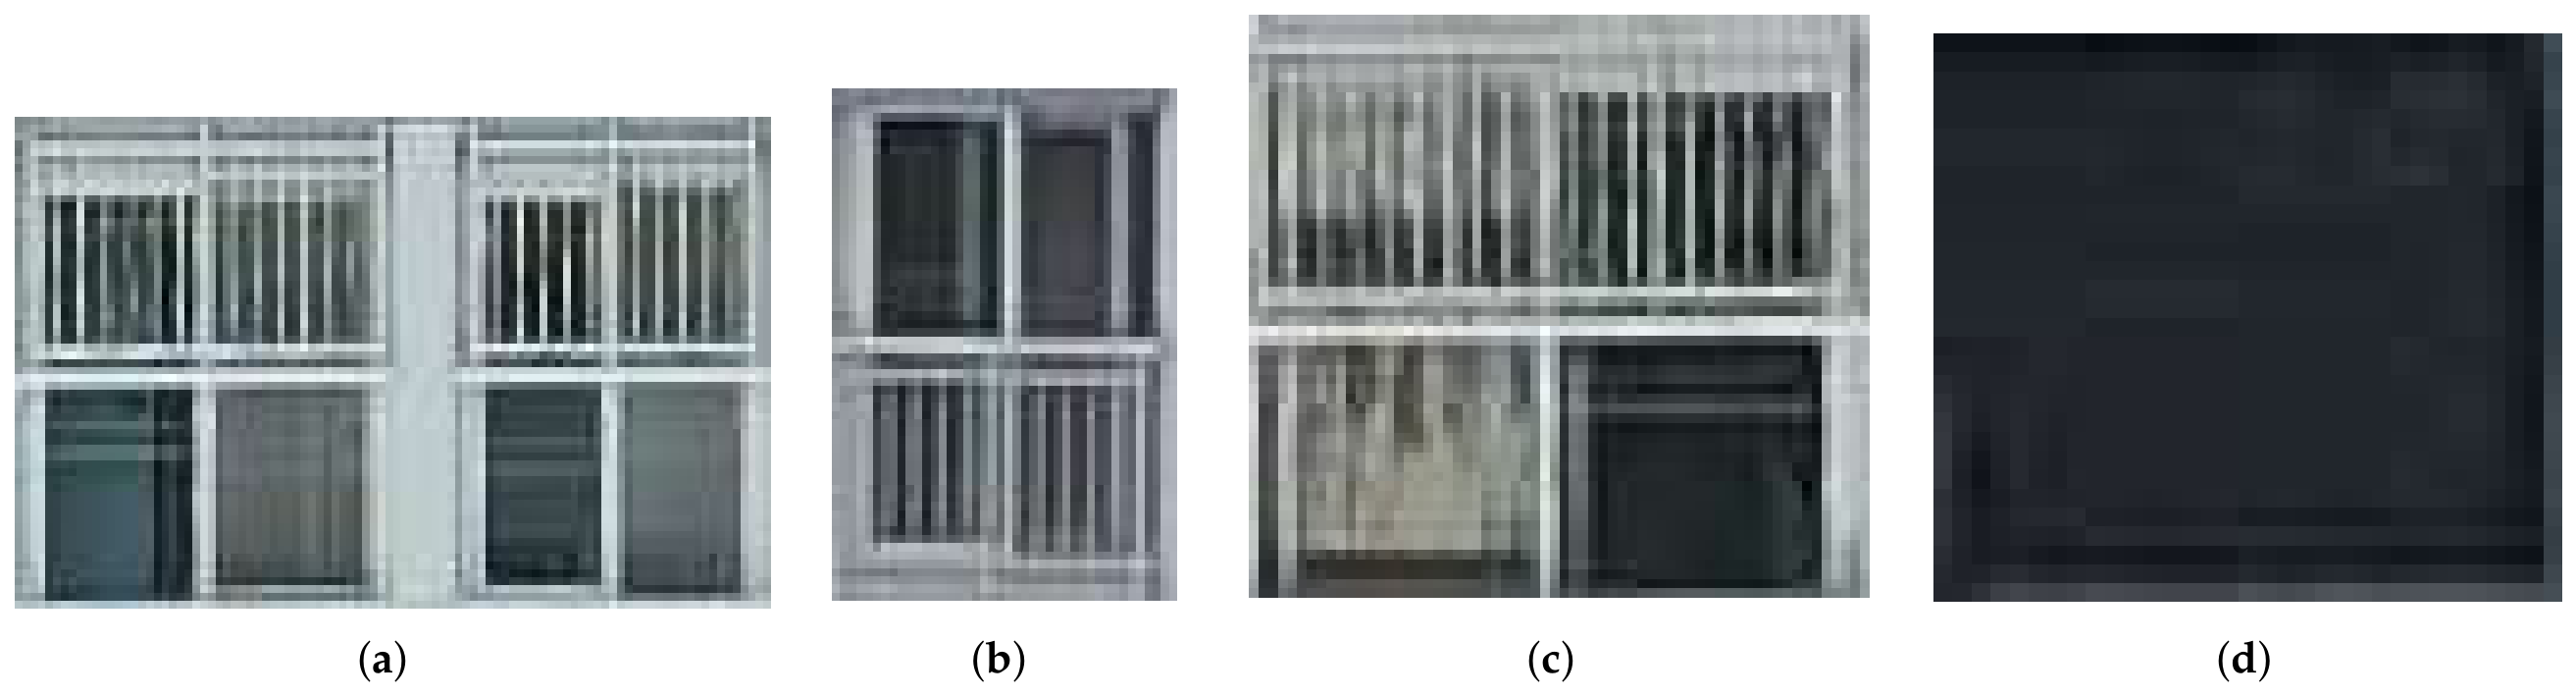
Since our objective is semantic enrichment rather than metric reconstruction, geometric fidelity was evaluated using normalized aspect ratio instead of absolute positional error. Owing to the lack of CAD-level ground truth for large-scale aerial models, we conducted a sampling validation on 200 window instances from the Suseo-dong testbed. Because photogrammetric building models inherently contain topological noise and occlusions, achieving millimeter-level geometric accuracy falls outside the scope of this study. Accordingly, geometric reliability was evaluated across four representative window types (50 samples each): wide rectangular, tall rectangular, nearly square, and unclear/ambiguous texture frames. These are summarized in
Table 3 and
Figure 8.
To evaluate the geometric fidelity independently of absolute scale, we measured the Aspect Ratio (
) of the windows, defined as
, where
W and
H are the normalized width and height. We compared the aspect ratio of the manually annotated window regions in the original texture (
) against the aspect ratio of the automatically generated 3D window meshes projected back onto the facade plane (
). The Relative Error (
) is calculated as follows:
Based on the morphological characteristics and texture quality of the facades, we categorized the evaluated windows into four distinct types: wide rectangular, tall rectangular, nearly square, and windows with unclear or ambiguous texture frames. As previously mentioned, we validated the geometric fidelity using 50 independent samples for each type.
Table 3 and
Figure 8 summarize the geometric evaluation results for these four representative categories.
The overall Mean Relative Error (MRE) was 14.93%, primarily driven by the fixed 7-pixel crop padding. While this uniform margin preserves nearly square proportions (Type C, <1% error), it geometrically biases extreme aspect ratios toward squares, causing 15–21% deviations in wide (Type A) and tall (Type B) windows. Type D shows natural variance due to blurred texture boundaries. Because these geometric deviations are systematic consequences of the padding rather than random algorithmic failures, the resulting fidelity remains practically sufficient for bounding-box-level semantic separation in UDT applications.
5. Discussion
The quantitative results demonstrate that EDSR-based SRIM is an effective input-conditioning strategy for the window region verification task. While the accuracy advantage over bilinear interpolation is mathematically modest (1.4 percentage points), the trend is highly stable across accuracy, F1 score, mAP, and mAUC. In the context of automated city-scale UDT modeling, this stability is critical; the pipeline operates on thousands of extremely small texture crops, where a classifier is highly sensitive to the structural information loss introduced during aggressive down- or up-sampling. Minimizing false positives and false negatives directly translates to reduced manual cleanup and higher reliability in the generated 3D assets.
A key aspect of this study that requires careful contextualization is the geometric fidelity of the instantiated 3D windows. The quantitative evaluation reported an overall Mean Relative Error (MRE) of 14.93% in aspect ratios. While this level of deviation falls short of the millimeter-level precision expected in architectural CAD or strictly calibrated photogrammetry, it must be evaluated against its intended use case: semantic enrichment of large-scale urban models. In many downstream UDT applications, such as preliminary Building Energy Modeling (BEM) and Window-to-Wall Ratio (WWR) estimation, identifying the topological presence and approximate scale of windows is vastly more valuable than possessing a visually perfect but geometrically monolithic “shrink-wrapped” mesh [
42]. For instance, early-stage BEM studies indicate that WWR variations of up to 10–15% are generally acceptable tolerances that do not fatally alter overarching thermal load estimates [
43]. The systematic error introduced by the uniform crop padding is a deliberate trade-off to ensure robust verification without heavy computational overhead. While computational simplicity drove this choice, we fully agree that implementing an adaptive padding strategy—where margins scale proportionally to the candidate crop size—could significantly mitigate these geometric biases, and we have noted this as a key area for future improvement. For semantic LOD2 (Level of Detail 2) enhancements, bounding-box-level separation provides sufficient explicitly structured data to enable daylight analysis, ventilation simulations, and interactive metaverse visualization.
The broader implications of this pipeline lie in its scalability and operational efficiency. As demonstrated by the deployment in the Suseo-dong testbed, the proposed methodology successfully bridges the gap between raw photogrammetric outputs and semantically actionable objects without requiring human-in-the-loop remodeling. Traditionally, elevating a monolithic textured 3D city model to a semantically segmented asset is profoundly labor-intensive. By combining foundation models (SAM) for agnostic localization with SRIM-conditioned lightweight classifiers (ResNet-50) for targeted verification, this workflow facilitates the creation of enriched digital twins. It offers a scalable solution for urban planners and facility managers to retroactively inject semantic value into legacy 3D city models.
Despite these advantages, the current study operates within clear practical boundaries. The scope is restricted to window extraction; applying this framework to other facade elements, such as doors or balconies, presents distinct challenges due to severe street-level occlusions and highly variable geometries. Furthermore, the geometric validation in this study relies on 2D aspect ratio projections, which primarily captures texture distortion rather than absolute metric spatial deviations (e.g., positional offsets in meters). A full-scale, volumetric geometric validation against ground-truth LiDAR or CAD data is necessary to quantify true spatial accuracy. Crucially, because the dataset was partitioned using random sample-level shuffling, crops from the same building may appear in both the training and test sets. While this approach balances morphological distributions within highly homogeneous apartment complexes, it introduces a potential risk of data leakage. Consequently, the current evaluation metrics may overestimate the model’s generalization capacity for entirely unseen architectural environments. Finally, integrating these generated planar patches into standardized 3D GIS formats (e.g., native CityGML 3.0 semantic structures) and validating the pipeline across diverse cities with varying architectural styles remain critical next steps for future research. In addition, while our primary quantitative experiments intentionally isolate the window verification classifier to precisely evaluate the SRIM module and decouple it from upstream proposal variances, a comprehensive end-to-end evaluation of the complete pipeline—incorporating SAM’s initial proposal recall on unseen buildings—is an essential direction to fully establish system-level reliability in future work.
6. Conclusions
This paper presented a novel computational modeling pipeline explicitly designed for the window-level semantic enrichment of texture-mapped 3D building models in Urban Digital Twins (UDTs). To overcome the inherent resolution and geometric limitations of aerially derived textures, the proposed pipeline integrates SAM-based coarse candidate generation, an explicit Super-Resolution-based Input Matching (SRIM) conditioning step, a fine-tuned ResNet-50 verification classifier, and a robust texture-to-mesh geometric mapping procedure.
In the primary domain-specific evaluation, the EDSR-based SRIM configuration achieved the highest performance, yielding a mean accuracy of 95.0% and an F1 score of 0.951 over 10 independent runs. Auxiliary experiments on Open Images crops corroborated the consistent advantage of SRIM-based conditioning over conventional interpolation methods when processing severely degraded small crops. Crucially, the practical deployment and evaluation of the generated 3D windows—which yielded a mean relative error of 14.93%—demonstrated that the methodology effectively converts implicit texture patterns into explicit, manipulable 3D objects suitable for large-scale semantic enrichment. We explicitly note that this process is designed for semantic object separation rather than geometrically accurate metric 3D reconstruction.
The core contribution of this research extends beyond algorithmic improvements in image classification; it provides a practical and scalable workflow that transforms static, visually driven 3D city meshes into computationally actionable semantic assets. By automating the extraction and 3D instantiation of building elements, this approach significantly reduces the manual labor traditionally required for structural detailing. Consequently, it supports and enables critical downstream UDT applications, including automated building energy modeling, component-level facade maintenance planning, and simulation-oriented urban refinement.
Future work will aim to expand this enrichment framework to encompass a broader ontology of architectural elements, explicitly addressing the complexities of street-level occlusions. Additionally, integrating the pipeline with large-scale semantic storage formats (e.g., CityGML 3.0) and conducting comprehensive geometric validations against authoritative LiDAR, CAD, or BIM ground truth datasets will further solidify its operational readiness for next-generation smart city infrastructures. Furthermore, exploring lightweight backbone networks, such as MobileNet or EfficientNet, will be a key research direction to minimize inference latency and optimize the pipeline for large-scale batch processing in urban scenarios.
Author Contributions
Conceptualization, A.L. and S.J.; methodology, A.L. and S.J.; software, A.L., S.P. and S.J.; validation, A.L., S.J., S.P. and S.W.; resources, J.S.P.; data curation, J.S.P.; writing—original draft preparation, A.L. and S.J.; writing—review and editing, A.L., S.J. and S.W.; visualization, A.L. and S.J.; funding acquisition, J.S.P. All authors have read and agreed to the published version of the manuscript.
Funding
This work is supported by the Korea Agency for Infrastructure Technology Advancement (KAIA) grant R&D program of Digital Land Information Technology Development funded by the Ministry of Land, Infrastructure and Transportation (MOLIT) (Grant: RS-2022-00142501). This research was also supported by the ANCHOR program through the Daejeon ANCHOR Center, funded by the Ministry of Education (MOE) and the Daejeon Metropolitan City, Republic of Korea (2026-ANCHOR-06-002).
Institutional Review Board Statement
Not applicable.
Informed Consent Statement
Not applicable.
Data Availability Statement
The data that support the findings of this study are available from Ji Sang Park or Sooyoung Jang upon reasonable request.
Conflicts of Interest
The authors declare no conflicts of interest.
References
- Supianto, A.A.; Nasar, W.; Aspen, D.M.; Hasan, A.; Karlsen, A.T.; Torres, R.D.S. An Urban Digital Twin Framework for Reference and Planning. IEEE Access 2024, 12, 152444–152465. [Google Scholar] [CrossRef] [Scilit]
- Azari, P.; Li, S.; Shaker, A. An Effective Approach to Geometric and Semantic BIM/GIS Data Integration for Urban Digital Twin. ISPRS Int. J. Geo-Inf. 2025, 14, 478. [Google Scholar] [CrossRef] [Scilit]
- Lee, A.; Lee, K.W.; Kim, K.H.; Shin, S.W. A geospatial platform to manage large-scale individual mobility for an urban digital twin platform. Remote Sens. 2022, 14, 723. [Google Scholar] [CrossRef] [Scilit]
- Lei, B.; Stouffs, R.; Biljecki, F. Assessing and benchmarking 3D city models. Int. J. Geogr. Inf. Sci. 2023, 37, 788–809. [Google Scholar] [CrossRef] [Scilit]
- Sun, S.; Su, L.; Yang, X.; Qi, C.; Liu, X.; Pan, L.; Zhang, Q. Efficient Four-Level LOD Simplification for Single-and Multi-Mesh 3D Scenes Towards Scalable BIM/GIS/Digital Twin Integration. ISPRS Int. J. Geo-Inf. 2026, 15, 61. [Google Scholar] [CrossRef] [Scilit]
- Biljecki, F.; Stoter, J.; Ledoux, H.; Zlatanova, S.; Çöltekin, A. Applications of 3D city models: State of the art review. ISPRS Int. J. Geo-Inf. 2015, 4, 2842–2889. [Google Scholar] [CrossRef] [Scilit]
- Shahat, E.; Hyun, C.T.; Yeom, C. City digital twin potentials: A review and research agenda. Sustainability 2021, 13, 3386. [Google Scholar] [CrossRef] [Scilit]
- Buyukdemircioglu, M.; Kocaman, S.; Isikdag, U. Semi-automatic 3D city model generation from large-format aerial images. ISPRS Int. J. Geo-Inf. 2018, 7, 339. [Google Scholar] [CrossRef] [Scilit]
- Xue, F.; Wu, L.; Lu, W. Semantic enrichment of Building and City Information Models: A ten-year review. Adv. Eng. Inform. 2021, 47, 101245. [Google Scholar] [CrossRef] [Scilit]
- Zhao, T.; Xiong, T.; Li, M.; Li, Z. Automatic Reconstruction of 3D Building Models from ALS Point Clouds Based on Façade Geometry. ISPRS Int. J. Geo-Inf. 2025, 14, 462. [Google Scholar] [CrossRef] [Scilit]
- Wysocki, O.; Schwab, B.; Beil, C.; Holst, C.; Kolbe, T.H. Reviewing open data semantic 3D city models to develop novel 3D reconstruction methods. Int. Arch. Photogramm. Remote Sens. Spat. Inf. Sci. 2024, 48, 493–500. [Google Scholar] [CrossRef] [Scilit]
- Schrotter, G.; Hürzeler, C. The digital twin of the city of Zurich for urban planning. PFG-Photogramm. Remote Sens. Geoinf. Sci. 2020, 88, 99–112. [Google Scholar] [CrossRef] [Scilit]
- Nouvel, R.; Schulte, C.; Eicker, U.; Pietruschka, D.; Coors, V. CityGML-based 3D city model for energy diagnostics and urban energy policy support. In Proceedings of the Building Simulation 2013; IBPSA: Wakefield, MA, USA, 2013; Volume 13, pp. 218–225. [Google Scholar]
- Yaqoob, I.; Salah, K.; Jayaraman, R.; Omar, M. Metaverse applications in smart cities: Enabling technologies, opportunities, challenges, and future directions. Internet Things 2023, 23, 100884. [Google Scholar] [CrossRef] [Scilit]
- Musialski, P.; Wonka, P.; Aliaga, D.G.; Wimmer, M.; Van Gool, L.; Purgathofer, W. A survey of urban reconstruction. In Proceedings of the Computer Graphics Forum; Wiley Online Library: Hoboken, NJ, USA, 2013; Volume 32, pp. 146–177. [Google Scholar]
- Gröger, G.; Plümer, L. CityGML–Interoperable semantic 3D city models. ISPRS J. Photogramm. Remote Sens. 2012, 71, 12–33. [Google Scholar] [CrossRef] [Scilit]
- Zhang, X.; Chen, K.; Johan, H.; Erdt, M. SLOD2+WIN: Semantics-aware addition and LoD of 3D window details for LoD2 CityGML models with textures. Vis. Comput. 2024, 40, 7507–7525. [Google Scholar] [CrossRef] [Scilit]
- Long, J.; Shelhamer, E.; Darrell, T. Fully convolutional networks for semantic segmentation. In Proceedings of the IEEE Conference on Computer Vision and Pattern Recognition, Boston, MA, USA, 7–12 June 2015; pp. 3431–3440. [Google Scholar]
- Ronneberger, O.; Fischer, P.; Brox, T. U-Net: Convolutional networks for biomedical image segmentation. In Proceedings of the Medical Image Computing and Computer-Assisted Intervention–MICCAI 2015: 18th International Conference, Munich, Germany, 5–9 October 2015; Proceedings, Part III 18; Springer: Berlin/Heidelberg, Germany, 2015; pp. 234–241. [Google Scholar]
- Liu, H.; Zhang, J.; Zhu, J.; Hoi, S.C.H. DeepFacade: A Deep Learning Approach to Facade Parsing. In Proceedings of the Twenty-Sixth International Joint Conference on Artificial Intelligence (IJCAI-17), Melbourne, Australia, 19–25 August 2017; pp. 2301–2307. [Google Scholar] [CrossRef] [Scilit] [PubMed]
- Tyleček, R.; Šára, R. Spatial pattern templates for recognition of objects with regular structure. In Proceedings of the German Conference on Pattern Recognition; Springer: Berlin/Heidelberg, Germany, 2013; pp. 364–374. [Google Scholar]
- Lippoldt, F. Window Detection in Facades for Aerial Texture Files of 3D CityGML Models. In Proceedings of the IEEE/CVF Conference on Computer Vision and Pattern Recognition Workshops, Long Beach, CA, USA, 16–17 June 2019; pp. 11–19. [Google Scholar]
- Kirillov, A.; Mintun, E.; Ravi, N.; Mao, H.; Rolland, C.; Gustafson, L.; Xiao, T.; Whitehead, S.; Berg, A.C.; Lo, W.Y.; et al. Segment Anything. In Proceedings of the IEEE/CVF International Conference on Computer Vision, Paris, France, 1–6 October 2023; pp. 4015–4026. [Google Scholar]
- Lim, B.; Son, S.; Kim, H.; Nah, S.; Mu Lee, K. Enhanced deep residual networks for single image super-resolution. In Proceedings of the IEEE Conference on Computer Vision and Pattern Recognition Workshops, Honolulu, HI, USA, 21–26 July 2017; pp. 136–144. [Google Scholar]
- Shi, W.; Caballero, J.; Huszár, F.; Totz, J.; Aitken, A.P.; Bishop, R.; Rueckert, D.; Wang, Z. Real-time single image and video super-resolution using an efficient sub-pixel convolutional neural network. In Proceedings of the IEEE Conference on Computer Vision and Pattern Recognition, Las Vegas, NV, USA, 27–30 June 2016; pp. 1874–1883. [Google Scholar]
- Shermeyer, J.; Van Etten, A. The effects of super-resolution on object detection performance in satellite imagery. In Proceedings of the IEEE/CVF Conference on Computer Vision and Pattern Recognition Workshops, Long Beach, CA, USA, 16–20 June 2019; pp. 1432–1441. [Google Scholar]
- Wang, Z.; Chen, J.; Hoi, S.C. Deep learning for image super-resolution: A survey. IEEE Trans. Pattern Anal. Mach. Intell. 2020, 43, 3365–3387. [Google Scholar] [CrossRef] [Scilit] [PubMed]
- Yuan, Y.; Cheng, Y.; Pan, B.; Jin, G.; Yu, D.; Ye, M.; Zhang, Q. A multi-modal attention fusion framework for road connectivity enhancement in remote sensing imagery. Mathematics 2025, 13, 3266. [Google Scholar] [CrossRef] [Scilit]
- Ji, W.; Li, J.; Bi, Q.; Liu, T.; Li, W.; Cheng, L. Segment anything is not always perfect: An investigation of sam on different real-world applications. Mach. Intell. Res. 2024, 21, 617–630. [Google Scholar] [CrossRef] [Scilit]
- Hosang, J.; Benenson, R.; Schiele, B. Learning non-maximum suppression. In Proceedings of the IEEE Conference on Computer Vision and Pattern Recognition, Honolulu, HI, USA, 21–26 July 2017; pp. 4507–4515. [Google Scholar]
- He, K.; Zhang, X.; Ren, S.; Sun, J. Deep residual learning for image recognition. In Proceedings of the IEEE Conference on Computer Vision and Pattern Recognition, Las Vegas, NV, USA, 27–30 June 2016; pp. 770–778. [Google Scholar]
- Keys, R. Cubic convolution interpolation for digital image processing. IEEE Trans. Acoust. Speech Signal Process. 1981, 29, 1153–1160. [Google Scholar] [CrossRef] [Scilit]
- Dong, C.; Loy, C.C.; Tang, X. Accelerating the super-resolution convolutional neural network. In Proceedings of the Computer Vision–ECCV 2016: 14th European Conference, Amsterdam, The Netherlands, 11–14 October 2016; Proceedings, Part II 14; Springer: Berlin/Heidelberg, Germany, 2016; pp. 391–407. [Google Scholar]
- Lai, W.S.; Huang, J.B.; Ahuja, N.; Yang, M.H. Deep laplacian pyramid networks for fast and accurate super-resolution. In Proceedings of the IEEE Conference on Computer Vision and Pattern Recognition, Honolulu, HI, USA, 21–26 July 2017; pp. 624–632. [Google Scholar]
- Deng, J.; Dong, W.; Socher, R.; Li, L.J.; Li, K.; Fei-Fei, L. ImageNet: A large-scale hierarchical image database. In Proceedings of the 2009 IEEE Conference on Computer Vision and Pattern Recognition; IEEE: Piscataway, NJ, USA, 2009; pp. 248–255. [Google Scholar]
- Goodfellow, I.; Bengio, Y.; Courville, A.; Bengio, Y. Deep Learning; MIT Press: Cambridge, MA, USA, 2016; Volume 1. [Google Scholar]
- Kingma, D.P.; Ba, J. Adam: A method for stochastic optimization. arXiv 2014, arXiv:1412.6980. [Google Scholar]
- Hartley, R.; Zisserman, A. Multiple View Geometry in Computer Vision; Cambridge University Press: Cambridge, UK, 2003. [Google Scholar]
- Penrose, R. A generalized inverse for matrices. In Proceedings of the Mathematical Proceedings of the Cambridge Philosophical Society; Cambridge University Press: Cambridge, UK, 1955; Volume 51, pp. 406–413. [Google Scholar]
- Foley, J.D. Computer Graphics: Principles and Practice; Addison-Wesley Professional: Boston, MA, USA, 1996; Volume 12110. [Google Scholar]
- Kuznetsova, A.; Rom, H.; Alldrin, N.; Uijlings, J.; Krasin, I.; Pont-Tuset, J.; Kamali, S.; Popov, S.; Malloci, M.; Kolesnikov, A.; et al. The Open Images Dataset V4: Unified image classification, object detection, and visual relationship detection at scale. Int. J. Comput. Vis. 2020, 128, 1956–1981. [Google Scholar] [CrossRef] [Scilit]
- Wysocki, O.; Schwab, B.; Biswanath, M.K.; Greza, M.; Zhang, Q.; Zhu, J.; Froech, T.; Heeramaglore, M.; Hijazi, I.; Kanna, K.; et al. TUM2TWIN: Introducing the large-scale multimodal urban digital twin benchmark dataset. ISPRS J. Photogramm. Remote Sens. 2026, 232, 810–830. [Google Scholar] [CrossRef] [Scilit]
- Troup, L.; Phillips, R.; Eckelman, M.J.; Fannon, D. Effect of window-to-wall ratio on measured energy consumption in US office buildings. Energy Build. 2019, 203, 109434. [Google Scholar] [CrossRef] [Scilit]
Figure 1.
Proposed workflow: (1) texture image acquisition, (2) window candidate extraction, (3) SR-based input matching, (4) window/non-window verification, and (5) generation of independent 3D objects.
Figure 1.
Proposed workflow: (1) texture image acquisition, (2) window candidate extraction, (3) SR-based input matching, (4) window/non-window verification, and (5) generation of independent 3D objects.
Figure 2.
Examples of training images: (a) window and (b) non-window.
Figure 2.
Examples of training images: (a) window and (b) non-window.
Figure 3.
Architecture of the ResNet-50-based window region verification classifier.
Figure 3.
Architecture of the ResNet-50-based window region verification classifier.
Figure 4.
Mapping of a 2D window texture vertex to its corresponding 3D point using the projection matrix and its pseudo-inverse . The camera origin is denoted by and the projection ray by .
Figure 4.
Mapping of a 2D window texture vertex to its corresponding 3D point using the projection matrix and its pseudo-inverse . The camera origin is denoted by and the projection ray by .
Figure 5.
Graph of mean and standard deviation of test accuracy for the EDSR, ESPCN, FSRCNN, LapSRN, and Bilinear-based fine-tuned models at each epoch across 10 repetitions.
Figure 5.
Graph of mean and standard deviation of test accuracy for the EDSR, ESPCN, FSRCNN, LapSRN, and Bilinear-based fine-tuned models at each epoch across 10 repetitions.
Figure 6.
An example of a building model with generated individual window objects.
Figure 6.
An example of a building model with generated individual window objects.
Figure 7.
Deployment of the window enrichment pipeline on two specific apartment complexes in the Suseo-dong testbed, Seoul: (a) raw building models before detection and (b) models after automated window instantiation. The red highlights in (b) indicate the verified window objects across the entire site.
Figure 7.
Deployment of the window enrichment pipeline on two specific apartment complexes in the Suseo-dong testbed, Seoul: (a) raw building models before detection and (b) models after automated window instantiation. The red highlights in (b) indicate the verified window objects across the entire site.
Figure 8.
Visual examples of the four sampled window types used for geometric evaluation: (a) Type A: Wide rectangular, (b) Type B: Tall rectangular, (c) Type C: Nearly square, and (d) Type D: Unclear/ambiguous texture frame.
Figure 8.
Visual examples of the four sampled window types used for geometric evaluation: (a) Type A: Wide rectangular, (b) Type B: Tall rectangular, (c) Type C: Nearly square, and (d) Type D: Unclear/ambiguous texture frame.
Table 1.
Performance of SR-based input matching for the window region verification classifier: mean and standard deviation over 10 runs.
Table 1.
Performance of SR-based input matching for the window region verification classifier: mean and standard deviation over 10 runs.
| | Accuracy | F1 Score | mAP | mAUC |
|---|
| EDSR | 0.950 ± 0.00267 | 0.951 ± 0.00249 | 0.921 ± 0.00489 | 0.950 ± 0.00272 |
| ESPCN | 0.946 ± 0.00190 | 0.948 ± 0.00205 | 0.917 ± 0.00257 | 0.946 ± 0.00186 |
| FSRCNN | 0.942 ± 0.00191 | 0.944 ± 0.00171 | 0.911 ± 0.00392 | 0.943 ± 0.00195 |
| LapSRN | 0.942 ± 0.00197 | 0.944 ± 0.00208 | 0.911 ± 0.00284 | 0.942 ± 0.00193 |
| Bilinear | 0.936 ± 0.00126 | 0.938 ± 0.00106 | 0.905 ± 0.00279 | 0.936 ± 0.00128 |
Table 2.
Auxiliary comparison of resizing methods on Open Images crops from 156 classes.
Table 2.
Auxiliary comparison of resizing methods on Open Images crops from 156 classes.
| | Accuracy | F1 Score | mAP | mAUC |
|---|
| Nearest Neighbor | 0.4605 | 0.5812 | 0.4237 | 0.7721 |
| Bilinear | 0.5014 | 0.6044 | 0.4524 | 0.7834 |
| Bicubic | 0.5013 | 0.6061 | 0.4533 | 0.7839 |
| Lanczos | 0.5010 | 0.6049 | 0.4511 | 0.7838 |
| EDSR | 0.5066 | 0.6074 | 0.4549 | 0.7864 |
| ESPCN | 0.5038 | 0.6061 | 0.4537 | 0.7853 |
| FSRCNN | 0.5026 | 0.6053 | 0.4520 | 0.7851 |
| LapSRN | 0.5064 | 0.6036 | 0.4495 | 0.7871 |
Table 3.
Geometric evaluation of generated 3D window objects based on normalized aspect ratio (AR) comparison (N = 200).
Table 3.
Geometric evaluation of generated 3D window objects based on normalized aspect ratio (AR) comparison (N = 200).
| Window Type | Description | Ground Truth () | Predicted Mesh () | Relative Error (%) |
|---|
| Type A | Wide rectangular | 2.65 | 2.24 | 15.47 (±4.82) |
| Type B | Tall rectangular | 0.42 | 0.51 | 21.42 (±5.91) |
| Type C | Nearly square | 1.05 | 1.04 | 0.95 (±0.38) |
| Type D | Unclear/Ambiguous texture | 1.60 | 1.95 | 21.87 (±6.74) |
| Overall | Mean across all samples | - | - | 14.93 (±5.86) |
| Disclaimer/Publisher’s Note: The statements, opinions and data contained in all publications are solely those of the individual author(s) and contributor(s) and not of MDPI and/or the editor(s). MDPI and/or the editor(s) disclaim responsibility for any injury to people or property resulting from any ideas, methods, instructions or products referred to in the content. |