Article

Alterations in Center of Pressure and Ground Reaction Forces Across Transition and Progression Conditions of Stair Negotiation in Adults with Chronic Ankle Instability: A Cross-Sectional Study


1
Department of Physical Therapy, Gachon University, Incheon 21936, Republic of Korea
2
Department of Physical Therapy, Baekseok University, Cheonan 31065, Republic of Korea
3
Department of Occupational Therapy, Semyung University, Jecheon 27136, Republic of Korea
*
Authors to whom correspondence should be addressed.
These authors contributed equally to this work.
Appl. Sci. 2026, 16(17), 8837; https://doi.org/10.3390/app16178837
Submission received: 24 July 2026 / Revised: 2 September 2026 / Accepted: 3 September 2026 / Published: 5 September 2026
(This article belongs to the Special Issue Advanced Research in Foot and Ankle Kinematics)

Abstract

Chronic ankle instability (CAI) is associated with recurrent ankle sprains, episodes of giving way, and functional limitations. Stair negotiation is a mechanically demanding daily activity, but whether CAI-related alterations differ between the transition and progression conditions of stair negotiation remains unclear. This cross-sectional study (IRB No. 1044396-202505-HR-068-01) compared center of pressure (COP) and ground reaction force (GRF) responses between 13 adults with CAI and 12 healthy adults across four stair negotiation conditions. COP and GRF were measured using a force plate and analyzed using a 2 × 4 mixed repeated-measures analysis of variance. Significant group × condition interactions were observed for COP path length (p = 0.015), COP velocity (p = 0.007), anterior force at push-off (p = 0.036), and vertical force at push-off (p = 0.030). The healthy group demonstrated greater COP path length and velocity during the transition from level walking to stair ascent, whereas the CAI group demonstrated greater anterior force at push-off during the transition and progression conditions of stair descent and greater vertical force at push-off during stair-ascent progression. These findings suggest that CAI may be associated with condition-dependent alterations in COP and GRF responses related to dynamic balance and force regulation during stair negotiation.

1. Introduction

Lateral ankle sprain is one of the most common musculoskeletal injuries of the lower extremity during sports and daily activities [1]. Following an initial lateral ankle sprain, up to 40% of individuals develop chronic ankle instability (CAI) [2]. CAI is characterized by recurrent ankle sprains, episodes of giving way, perceived ankle instability, and persistent functional limitations [3]. CAI is particularly prevalent among young and physically active adults and may restrict participation in physical activity and lead to long-term functional consequences [4,5]. Therefore, a better understanding of CAI-related functional deficits is needed to inform task-specific rehabilitation.
Individuals with CAI exhibit mechanical and sensorimotor impairments within the foot–ankle complex, including reduced joint mobility, muscle weakness, altered proprioception, and impaired neuromuscular control [6,7]. Postural control depends on the integration of visual, vestibular, and proprioceptive information [8], and individuals with CAI have been reported to rely more heavily on visual information when maintaining postural stability [9]. Altered lower-extremity muscle activation has also been observed in individuals with CAI across functional tasks [10], which may influence the regulation of weight transfer and limb loading during dynamic activities.
Stair negotiation is a common but mechanically demanding daily activity, requiring greater lower-extremity force generation and postural control than level walking [11,12]. Stair ascent requires propulsion to elevate the body, whereas stair descent requires controlled lowering and impact attenuation [12]. Stair negotiation also comprises transition conditions between level walking and the stairs, and progression conditions during stair ascent and descent [13]. These conditions differ in weight transfer and limb loading and may impose condition-specific demands on dynamic balance and force regulation in individuals with CAI. Identifying condition-specific alterations may therefore inform stair-related clinical assessment and the development of task-specific rehabilitation strategies.
Center of pressure (COP) characterizes the progression of plantar loading during stance and provides information regarding weight transfer within the base of support, whereas ground reaction force (GRF) reflects the magnitude and direction of external forces exchanged between the body and the support surface [12,14]. Previous studies have reported altered COP and GRF patterns in individuals with ankle instability during dynamic tasks [15,16]. Together, COP and GRF provide complementary biomechanical information by characterizing weight-transfer behavior and external force regulation, respectively. Because these aspects are related but not equivalent, their combined assessment may provide a more complete perspective on dynamic balance and force regulation during stair negotiation in individuals with CAI.
Previous studies of postural control in individuals with CAI have primarily focused on landing and level-walking tasks [15,17]. Stair-specific studies in individuals with CAI have largely concentrated on descent, reporting impaired proprioception [18] and altered joint kinetics [19,20]. In contrast, evidence regarding stair ascent in individuals with CAI remains limited. Studies in healthy adults have demonstrated distinct biomechanical demands between stair ascent and descent, including differences in body-mass transfer, COP and GRF events, and lower-extremity joint kinematics and kinetics [11,14]. These task-specific differences provide a rationale for examining both ascent and descent in individuals with CAI. However, previous CAI studies have not systematically compared transition and progression conditions across both directions of stair negotiation. Consequently, whether CAI-related alterations in dynamic balance and force regulation vary across these conditions remains unclear. The present study addresses this gap by distinguishing transition from progression conditions based on the different mechanical roles of the measured limb and by examining both during stair ascent and descent in the same sample.
Therefore, this study aimed to examine COP responses related to dynamic balance and GRF responses related to force regulation across the transition and progression conditions of stair negotiation in adults with and without CAI. We hypothesized that between-group differences in COP and GRF would be condition-dependent, with different response patterns emerging between the transition and progression conditions of stair negotiation.

2. Materials and Methods

2.1. Study Design

This cross-sectional comparative study was conducted in a laboratory at Gachon University. The study was approved by the Institutional Review Board of Gachon University (No. 1044396-202505-HR-068-01; June 2025) and registered on Clinical Research Information Service (no. KCT0012283). Before enrollment, all participants received an explanation of the study purpose and procedures and provided written informed consent. All procedures were performed in accordance with the Declaration of Helsinki.

2.2. Participants

Participants were recruited using convenience sampling between July and September 2025 through bulletin board advertisements at an Incheon community center and Gachon University. A total of 30 participants with or without chronic ankle instability (CAI) were enrolled in the study. The inclusion criteria of the CAI group were as follows [3,21]: (1) a history of ankle sprain at least 12 months prior to study enrollment; (2) a self-reported feeling of ankle instability during physical activity; (3) a history of recurrent lateral ankle sprain, defined as two or more lateral ankle sprains of the affected ankle; (4) a Cumberland Ankle Instability Tool (CAIT) score below 24 points in only one ankle, indicating unilateral CAI; (5) aged 20–35 years. The healthy group consisted of adults aged 20–35 years with a CAIT score of 28 points or higher [22], based on the original discrimination threshold of 27.5, with integer scores of 28 or above representing the stable range. The exclusion criteria for both groups were as follows: (1) lower-extremity surgery within the previous year; (2) a musculoskeletal injury of the lower extremity within the previous six months; (3) an acute ankle sprain within three months; or (4) neurological, vestibular, musculoskeletal, or other medical conditions that could affect balance or gait. Because episodes of giving way do not result in an acute sprain and are therefore recalled less reliably than sprain events, instability was ascertained through the self-reported feeling of ankle instability and a history of recurrent lateral ankle sprain rather than through a specified number of giving-way episodes. Healthy participants were required to have no ankle sprain within the previous 12 months; however, a lifetime history of ankle sprain or instability was not used as an exclusion criterion. The participant selection criteria were therefore informed by selected recommendations of the International Ankle Consortium [3].

2.3. Sample Size

The required sample size was estimated using G*Power software (version 3.1.9.7; Heinrich Heine University, Düsseldorf, Germany). Because no previous study has separately examined the transitioning and progressing conditions of stair negotiation in individuals with CAI, a medium effect size of Cohen’s f = 0.25 was assumed [23]. The parameters for the sample size calculation were as follows: F test; repeated-measures analysis of variance with a within–between interaction; effect size, f = 0.25; α error probability = 0.05; statistical power = 0.80; number of groups = 2; number of measurements = 4; correlation among repeated measures = 0.5; and nonsphericity correction ε = 1. The required sample size was 24 participants. After accounting for an anticipated dropout rate of 20%, a total of 30 participants were recruited.

2.4. Procedure

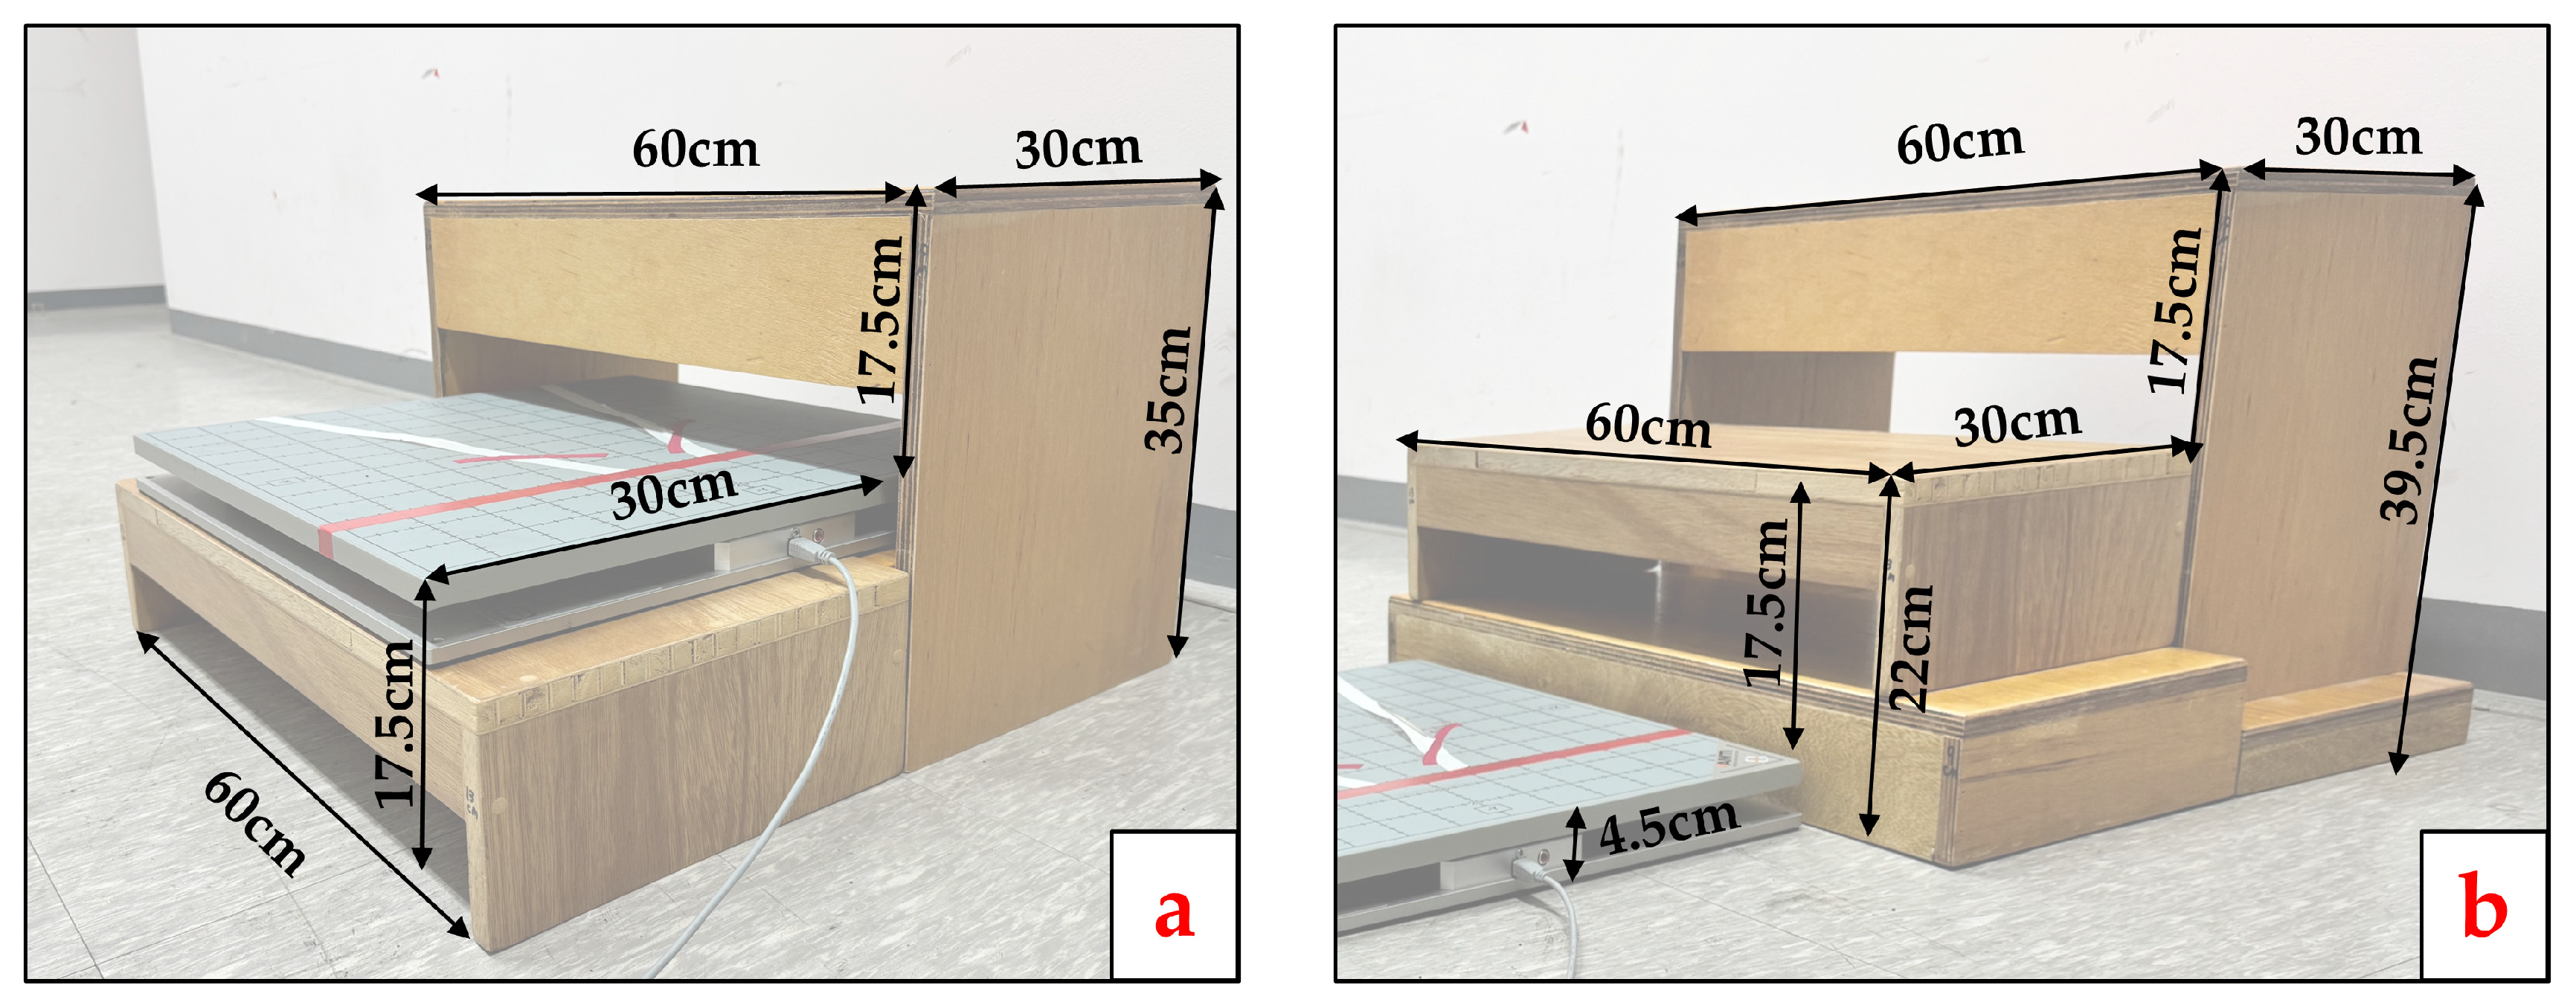
Custom-made two-step wooden stairs were used in this study. The stair dimensions were based on the standard stair specifications of the Korea Agency for Technology and Standards, with each step having a height of 17.5 cm, a depth of 30 cm, and a width of 60 cm. Since the protocol required alternating placement of the force plate on the floor and the first step, the stairs were constructed to accommodate the 4.5 cm height of the force plate. Detailed dimensions of the custom-made wooden stairs according to force-plate placement are shown in Appendix A (Figure A1).
Stair ascent and descent were assessed under four conditions, defined by the movement direction and the position of the force plate. All data were analyzed over the entire stance phase of the measured limb on the force plate, defined from the point at which vertical GRF exceeded 10 N to the point at which it fell below 10 N. All measurements were performed by a single examiner, a physical therapist with more than three years of clinical experience. In the CAI group, the affected limb was designated as the measured limb because it was the limb exhibiting chronic instability. As no equivalent criterion applied in the healthy group, the dominant limb was used as a consistent reference across participants.
Before data collection, all participants were instructed to perform each of the four conditions at their self-selected comfortable speed and completed a 5 min familiarization session. Movement speed was not quantitatively monitored or standardized across participants. Participants were instructed to place the entire plantar surface of the foot within the measurement area of the force plate. Three trials were recorded for each condition and averaged for analysis. The order of the four conditions was randomized using a four-block permutation to control order effects. A 5 min rest was provided between conditions to minimize fatigue. The four stair conditions are shown in Table 1 and Figure 1.

2.5. Outcome Measures

Center of pressure (COP) and ground reaction force (GRF) were measured using an AMTI AccuSway force plate (Advanced Mechanical Technology Inc., Watertown, MA, USA), a multi-axis platform widely used for quantifying postural sway and ground reaction forces in balance and stair research [24,25]. COP and GRF were acquired during separate sets of trials. COP was sampled at 200 Hz, whereas GRF was sampled at 1000 Hz to provide greater temporal resolution for transient force peaks. COP was measured first, followed by GRF. Each participant therefore performed three trials for COP and three trials for GRF in each condition.

2.5.1. Center of Pressure

COP data were collected using Balance Clinic software (version 1.5.1; Advanced Mechanical Technology Inc., Watertown, MA, USA) at 200 Hz and processed using a fourth-order, single-pass causal Butterworth IIR digital filter with a cut-off frequency of 10 Hz. Balance measures obtained from AMTI force plates have shown good-to-excellent test–retest reliability (intraclass correlation coefficient = 0.76–0.99) [26]. Three COP variables were extracted. All COP variables were calculated over the entire stance phase without temporal normalization. Stance duration was determined using the 10 N vertical GRF threshold to delimit the stance phase. Path length (mm) was defined as the total length of the COP trajectory during the stance phase. COP velocity (mm/s) was defined as the path length divided by the stance duration. Area 95 (mm2) was defined as the area of the 95% confidence ellipse enclosing the COP trajectory during the stance phase. These variables were selected to characterize complementary aspects of COP movement, including movement distance, rate, and spatial area [27]. Area 95 was selected as a two-dimensional COP-area measure that has been used in postural-control research, including studies of individuals with CAI [28]. COP variables were reported in their original units and were not normalized to foot dimensions.

2.5.2. Ground Reaction Force

GRF data were acquired using NetForce software (version 3.5.3; Advanced Mechanical Technology Inc., Watertown, MA, USA) at 1000 Hz. The exported data were filtered in MATLAB (ver. R2025b; MathWorks, Natick, MA, USA) using a fourth-order, zero-lag Butterworth low-pass filter with a cut-off frequency of 10 Hz. Three GRF components were analyzed: the anterior–posterior GRF (Fx), reflecting braking and propulsion; the medio-lateral GRF (Fy), reflecting medio-lateral stability; and the vertical GRF (Fz), reflecting weight acceptance and impact loading. According to the force-plate coordinate convention used in this study, positive Fx values represented anterior forces and negative Fx values represented posterior forces, whereas negative Fy values represented lateral forces. Thus, negative Fx values represented posterior braking force, while positive Fx values represented anterior propulsive force. From the characteristic GRF curves, five discrete points were identified. The filtered GRF data were exported to Microsoft Excel for extraction of the discrete GRF variables. The stance phase was defined using a 10-N threshold of the vertical GRF (Fz). The 10-N threshold was used solely to delimit the stance phase and did not define the timing of the GRF peak variables. Consistent with previous GRF studies [29,30], the first and second vertical GRF peaks were designated as Fz-HC and Fz-PO, respectively. Within the stance phase, the Fz curve was visually inspected to identify two distinct local maxima. One vertical GRF peak was first identified using the Excel MAX function. A non-overlapping search region encompassing the other visually distinct local maximum and excluding the region of the first identified peak was then selected, and the MAX function was applied within this region to identify the second peak. The two identified peaks were subsequently classified according to their temporal order as the first and second vertical GRF maxima. The minimum Fz value between the two maxima was identified using the MIN function and defined as mid-stance. The Fz signal was then used as the temporal reference for the other GRF components. Fx-HC was defined as the Fx value at the time point of the first Fz maximum, corresponding to the braking phase, whereas Fx-PO was defined as the Fx value at the time point of the second Fz maximum, corresponding to the propulsion phase. Fy-MS was defined as the Fy value at the time point of the minimum Fz between the two vertical maxima. The identified points were visually verified against the corresponding GRF curves.

2.6. Statistical Analysis

All statistical analyses were performed using SPSS software (version 25.0; IBM Corp., Armonk, NY, USA). Continuous variables were expressed as means and standard deviations, and nominal variables were expressed as frequencies. The Shapiro–Wilk test was used to assess the normality of the data. Outliers were screened using a criterion of ±3 standard deviations from the group mean, applied during data-quality screening rather than prespecified a priori. A participant showing extreme values across multiple outcomes was excluded at the participant level from the primary analyses rather than selectively from individual outcomes. Between-group differences in general characteristics were analyzed using independent t-tests or the Mann–Whitney U test for continuous variables, and Fisher’s exact test for nominal variables.
A 2 × 4 mixed repeated-measures analysis of variance (RM-ANOVA) was used to compare each COP and GRF variable between groups (CAI and healthy) and across the four stair conditions (Asc-T, Asc-P, Desc-T, and Desc-P), as well as to examine the group × condition interaction and main effects of group and condition. Homogeneity of covariance matrices was assessed using Box’s M test, and homogeneity of error variances between groups at each condition was assessed using Levene’s test. Both assumptions were satisfied for all outcome variables. Mauchly’s test was used to assess the sphericity assumption. When sphericity was violated, epsilon-based corrections were applied. The Huynh–Feldt correction was used when epsilon was 0.75 or greater, and the Greenhouse–Geisser correction when it was below 0.75. The effect size for the group × condition interaction was expressed as partial eta-squared (η2p) [31].
When a statistically significant group × condition interaction was identified, post hoc comparisons were performed between groups within each condition and across conditions within each group. When the interaction was not significant, significant main effects of group and condition were examined. The Bonferroni correction was applied to control for Type I errors in all multiple comparisons, and the reported p-values correspond to Bonferroni-adjusted values. The level of statistical significance was set at α = 0.05.

3. Results

3.1. Participants’ General Characteristics

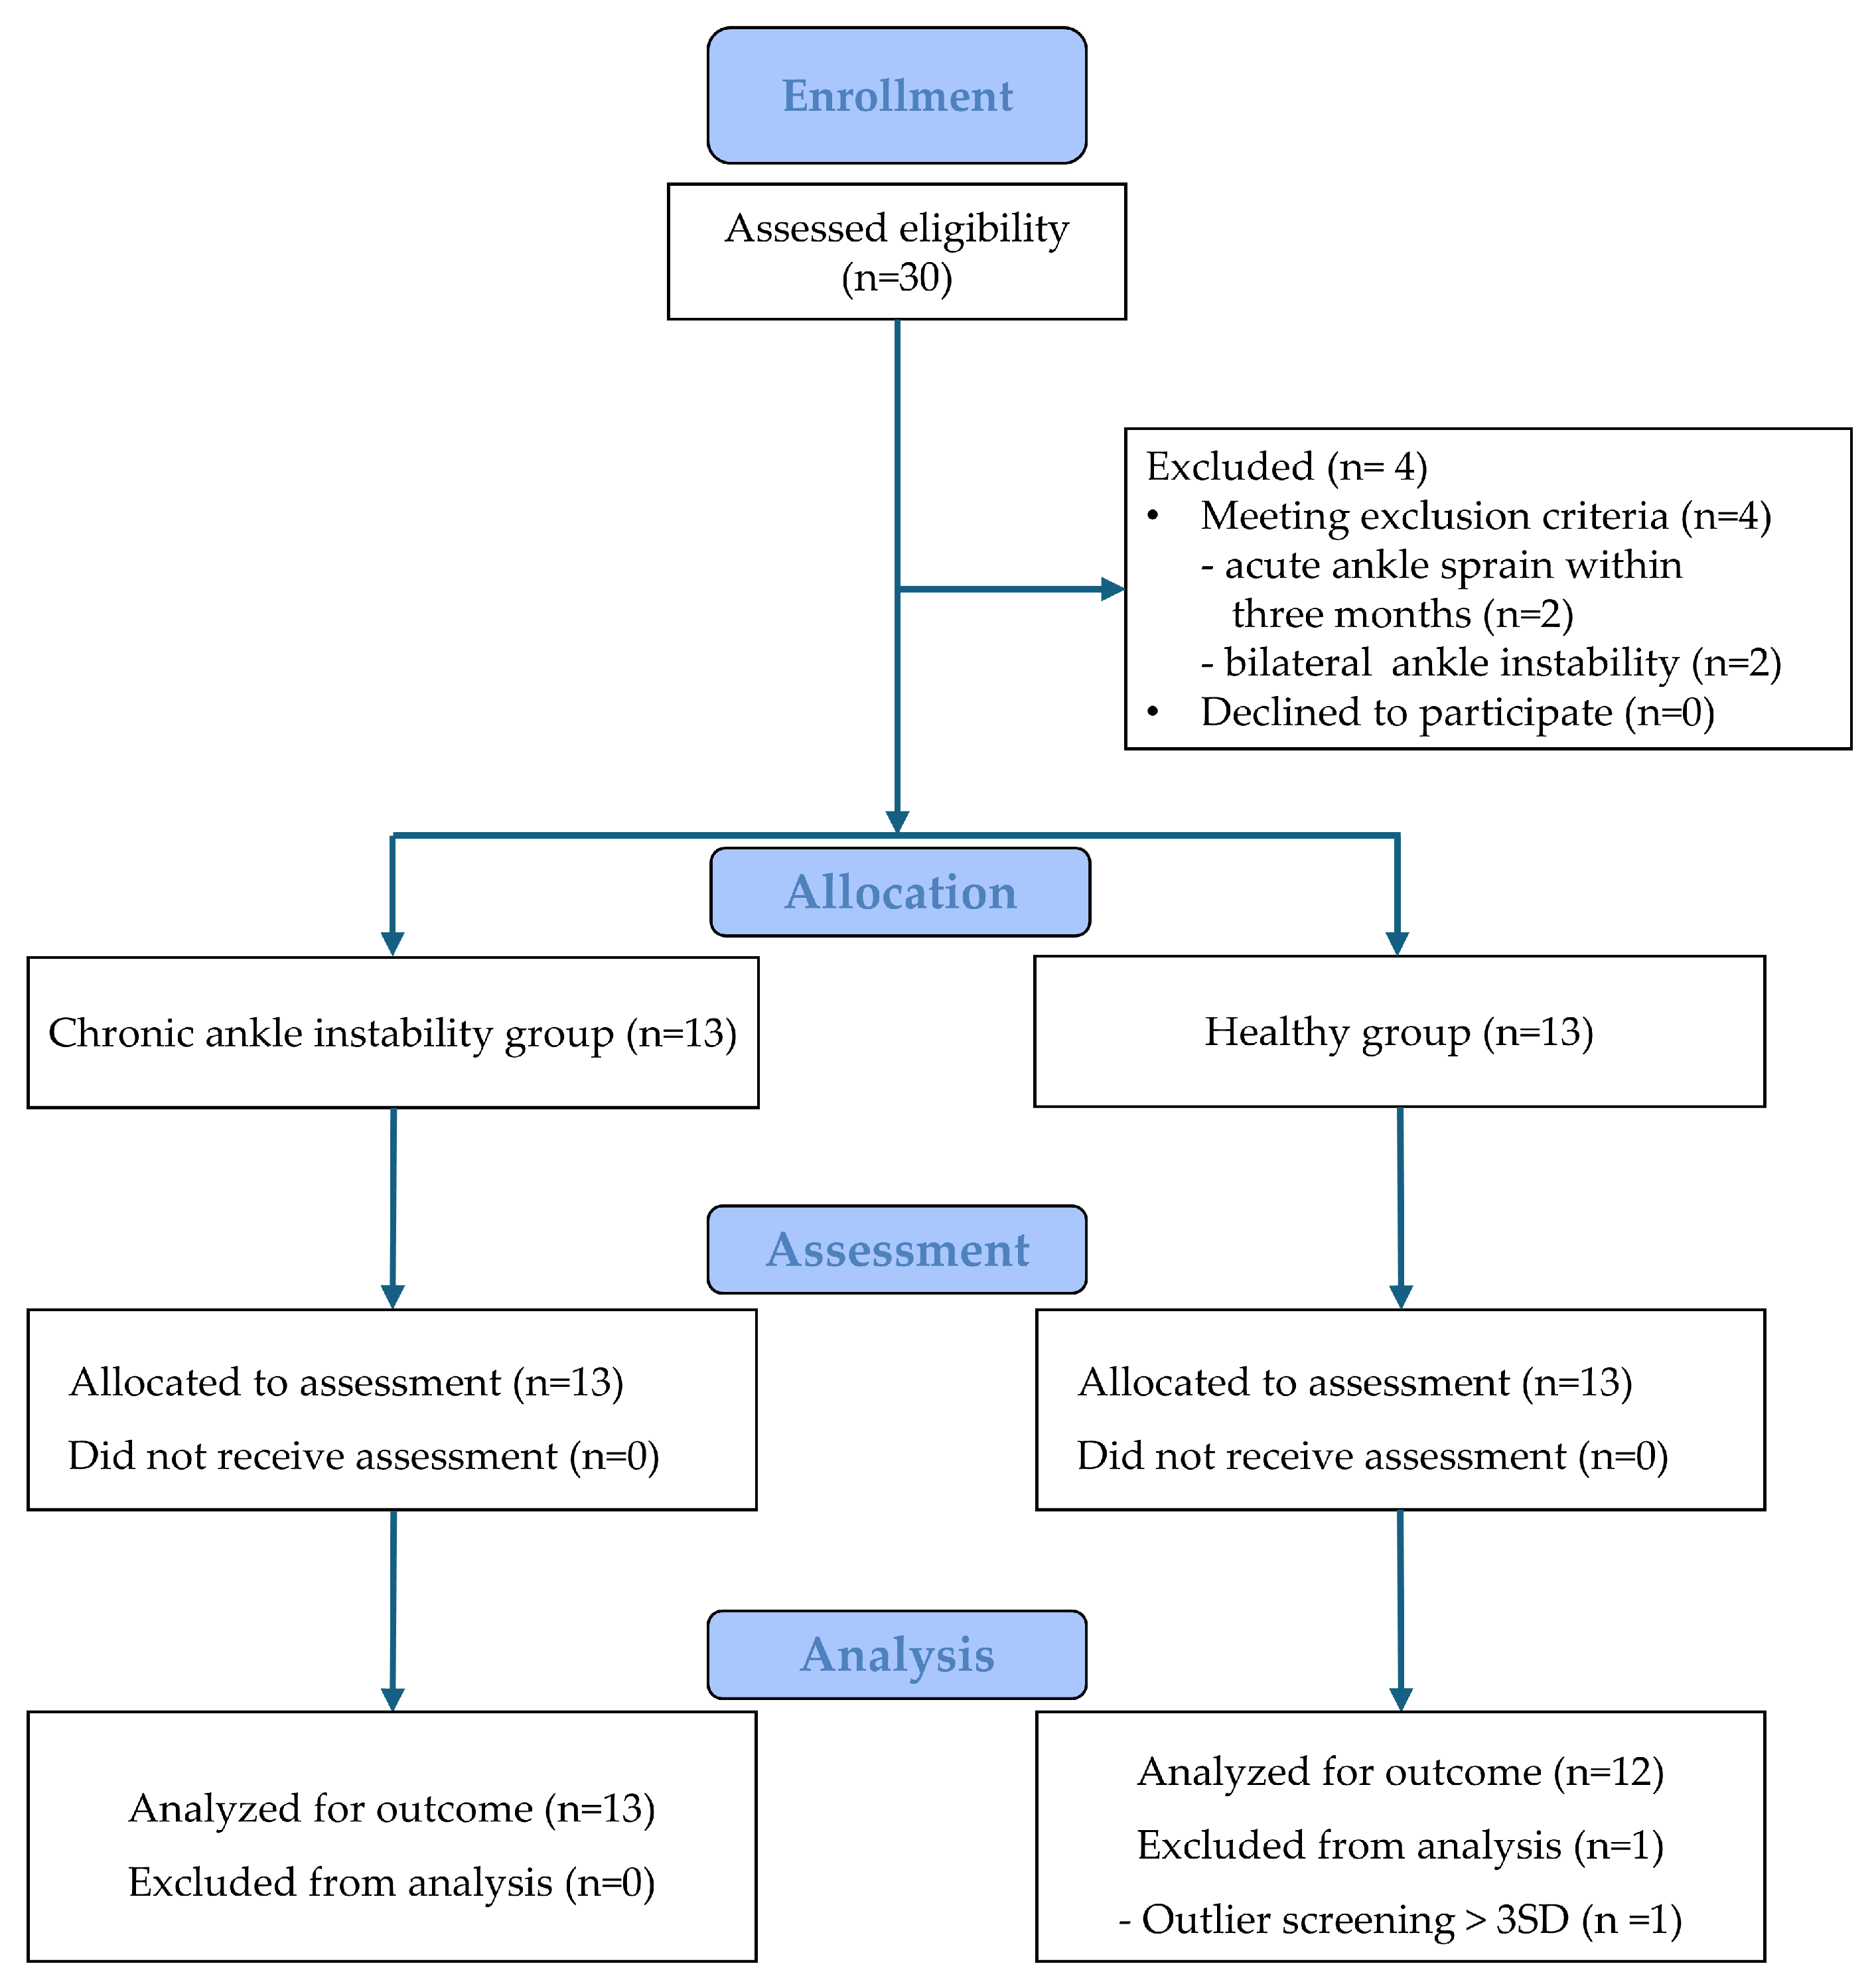
A total of 30 participants were assessed for eligibility. Four participants were excluded for meeting the exclusion criteria (acute ankle sprain within three months, n = 2; bilateral ankle instability, n = 2). The remaining 26 participants were assigned to the CAI group (n = 13) or the healthy group (n = 13), and all completed the assessment. One participant in the healthy group showed markedly extreme values exceeding ±3 standard deviations from the group mean across multiple COP and GRF outcomes during data-quality screening. Because these values formed a pattern considered biomechanically implausible for normal stair negotiation, the participant was excluded from the primary analyses. Although no specific acquisition or calibration failure was documented, the source of these extreme observations could not be conclusively determined. Sensitivity analyses including this participant were therefore additionally performed for all outcomes showing significant group × condition interactions and are presented in Supplementary Table S1. Accordingly, 25 participants (CAI, n = 13; healthy, n = 12) were included in the primary analysis, as shown in Figure 2.
The general characteristics of the participants are presented in Table 2. No significant between-group differences were observed in height, body mass, body mass index, foot length, foot width, or dominant leg side (p > 0.05). The CAI group showed a significantly lower CAIT score than the healthy group (p < 0.001). In the CAI group, the affected limb corresponded to the dominant limb in 11 of 13 participants (84.6%; right/right, n = 8; left/left, n = 3). In the remaining two participants, the affected limb was left and the dominant limb was right. Stance duration did not differ between groups in any of the four conditions (p > 0.05).

3.2. Center of Pressure During Stair Ascent and Descent

For COP path length, a significant group × condition interaction was observed (F = 4.578, p = 0.015, η2p = 0.172), representing a large effect (Table 3). During Asc-T, the healthy group demonstrated a significantly greater path length than the CAI group (p = 0.020). A significant difference among conditions was identified in the healthy group (p < 0.001), with path length during Asc-T being significantly greater than that during Asc-P and Desc-T. In contrast, no significant difference among conditions was observed in the CAI group (p = 0.051).
The group × condition interaction was also significant for COP velocity (F = 5.465, p = 0.007, η2p = 0.192), representing a large effect (Table 4). During Asc-T, the healthy group demonstrated a significantly greater velocity than the CAI group (p = 0.021). A significant difference was observed in the healthy group (p < 0.001), with velocity during Asc-T being significantly greater than that during Asc-P and Desc-T, and velocity during Desc-P being significantly greater than that during Asc-P. A significant difference was also identified in the CAI group (p = 0.002), with velocity during Desc-P being significantly greater than that during Asc-P.
In contrast, COP Area 95 showed no significant group × condition interaction (F = 0.678, p = 0.569, η2p = 0.029) (Table 5). A significant difference among conditions was identified in both groups (CAI, p = 0.034; healthy, p = 0.036). In the healthy group, Area 95 during Desc-P was significantly greater than during Desc-T, whereas no significant pairwise difference was found in the CAI group. However, the absence of a significant group × condition interaction indicates that the condition-related changes in COP Area 95 did not differ significantly between the CAI and healthy groups.

3.3. Ground Reaction Force During Stair Ascent and Descent

The GRF x-axis data are presented in Table 6. For Fx-HC, no significant group × condition interaction was observed (F = 1.267, p = 0.292, η2p = 0.052). Significant within-group differences were found in both groups (p < 0.001). The posterior force during Desc-T was significantly greater than during Asc-T, Asc-P, and Desc-P in both groups.
A significant group × condition interaction was observed for Fx-PO (F = 3.008, p = 0.036, η2p = 0.116), representing a medium effect. The CAI group demonstrated a significantly greater anterior force than the healthy group during Desc-T (p = 0.025) and Desc-P (p = 0.036), whereas no between-group differences were found during Asc-T or Asc-P (p > 0.05). Significant within-group differences were identified in both groups (p < 0.001).
The GRF y-axis data are presented in Table 7. For Fy-MS, no significant group × condition interaction was observed (F = 1.613, p = 0.194, η2p = 0.066). Significant within-group differences were found in both groups (CAI, p < 0.001; healthy, p = 0.002). In the CAI group, the lateral force during Desc-T and Desc-P was significantly greater than during Asc-T and Asc-P, whereas in the healthy group, only Desc-P was significantly greater than Asc-T and Asc-P.
The GRF vertical axis data are shown in Table 8. For Fz-HC, no significant group × condition interaction was observed (F = 1.250, p = 0.289, η2p = 0.052). Significant within-group differences were found in both groups (p < 0.001). In the CAI group, the vertical force during Desc-T and Desc-P was significantly greater than during Asc-T and Asc-P. In the healthy group, the vertical force during Desc-T was significantly greater than during Asc-T and Asc-P, and the force during Asc-T was significantly greater than during Asc-P.
A significant group × condition interaction was observed for Fz-PO (F = 3.793, p = 0.030, η2p = 0.142), representing a large effect. During Asc-P, the CAI group demonstrated a significantly greater vertical force than the healthy group (p = 0.006), whereas no between-group differences were found during Asc-T, Desc-T, or Desc-P (p > 0.05). Significant within-group differences were found in both groups (p < 0.001). In the CAI group, the vertical force during Asc-T and Asc-P was significantly greater than during Desc-T and Desc-P, and the force during Desc-T was significantly greater than during Desc-P. In the healthy group, the vertical force during Asc-T was significantly greater than during Asc-P, Desc-T, and Desc-P.
For Fx-HC, Fy-MS, and Fz-HC, the absence of significant group × condition interactions indicates that there was no statistical evidence that the patterns across conditions differed between the CAI and healthy groups, despite significant within-group differences.

3.4. Sensitivity Analysis

Sensitivity analyses including the healthy participant excluded from the primary analyses were performed for the outcomes that showed significant group × condition interactions in the primary analysis. The group × condition interactions for COP path length and velocity remained significant, whereas those for Fx-PO and Fz-PO were no longer significant (Supplementary Table S1).

4. Discussion

The principal finding of this study was that COP and GRF showed condition-dependent response patterns that differed between the CAI and healthy groups. When between-group differences emerged, COP path length and velocity were greater in the healthy group, whereas GRF differences consistently reflected greater force magnitudes in the CAI group.

4.1. Center of Pressure During Stair Ascent and Descent

The overall pattern of COP responses differed across stair-negotiation conditions between the CAI and healthy groups. The principal COP finding may therefore reflect less pronounced condition-dependent modulation of COP responses rather than a generalized reduction in COP movement [32]. During Asc-T, the supporting limb must regulate forward body progression while the contralateral limb advances onto the first step, and COP movement reflects the continuous redistribution of plantar pressure required to control the progression of the body within the base of support [13]. The greater COP path length and velocity demonstrated by the healthy group may reflect a more pronounced adjustment to the transitional demands of Asc-T, whereas the absence of a comparable increase in the CAI group may indicate that this condition did not elicit a similar adjustment. This interpretation is consistent with previous reports of reduced variability and diminished complexity of postural-control responses in individuals with CAI [33,34]. However, it should be regarded as a hypothesis rather than a demonstrated mechanism, as no direct measures of motor control or movement variability were obtained in the present study. Repeated ankle sprains impair somatosensory input from the ankle [7,9], which may limit the ability to adjust COP movement in response to changing loading and movement demands.
The absence of a group difference in COP Area 95 further suggests that the alteration was related to the distance and rate of COP movement rather than to the overall spatial area occupied by the trajectory. This dissociation is in agreement with previous reports of altered COP characteristics in individuals with CAI without corresponding differences in sway area [34]. An alternative explanation must nevertheless be considered, because stair-negotiation speed was self-selected and not quantified. COP velocity during gait is known to change with walking speed [35]. Although stance duration did not differ between groups in any condition, approach speed and cadence were not measured, and the healthy group may have approached Asc-T at a higher speed, thereby producing greater COP path length and velocity independently of differences in COP response modulation. The data in this study therefore cannot determine whether the observed pattern reflects constrained weight transfer in the CAI group, a higher approach speed in the healthy group, or a combination of these factors. Future studies should directly measure approach speed and cadence, or standardize movement speed, to clarify the contribution of temporal task characteristics to condition-specific COP responses.

4.2. Ground Reaction Force During Stair Ascent and Descent

The anterior–posterior GRF findings showed distinct patterns at heel contact and push-off. Posterior braking force at heel contact was greatest during Desc-T in both groups, consistent with greater braking demands during the transition from stair descent to level walking [12,13]. At push-off, anterior propulsive force was greater during the descent conditions than during the ascent conditions in both groups. This indicates that greater propulsion was a general feature of stair descent, while the greater anterior propulsive force observed in the CAI group during Desc-T and Desc-P appears to represent a group-specific alteration superimposed on this task-related pattern. This pattern may be consistent with a more rapid unloading of the affected limb, as shortened single-limb support time has been reported during gait in individuals with CAI [36]. However, stance duration did not differ between groups in any condition of our study, and anterior–posterior impulse was not measured. Therefore, the present findings cannot confirm that unloading occurred more rapidly. Elevated braking and propulsive GRFs have also been reported during level walking in individuals with CAI [37], although a recent meta-analysis indicated that such alterations are not uniformly observed across all gait-related kinetic variables [38]. In the present study, however, the alteration during descent was confined to anterior force at push-off, suggesting that anterior–posterior force regulation may be expressed differently according to the locomotor task. The relevance of task context is further supported by evidence that lower-extremity biomechanical patterns during stair descent are associated with perceived instability in individuals with a history of unilateral ankle sprain [39]. Nevertheless, given previous evidence of reduced ankle contribution and proximal compensatory adaptations in individuals with CAI [20,40], the greater anterior force observed in the CAI group should not be interpreted as greater ankle propulsion.
In contrast to the anterior–posterior GRF, lateral GRF did not differ between groups in any condition. A previous study similarly reported no medio-lateral GRF differences across five functional tasks, including step-down, despite identifying differences in ankle frontal-plane kinematics [15], and a comparable dissociation has been observed during level walking [37]. In both groups, lateral force at mid-stance was greater during the descent conditions than during the ascent conditions, indicating that frontal-plane loading was governed primarily by task demands rather than by ankle instability. Because stair negotiation was performed along a fixed path, its medio-lateral demand may have been insufficient to reveal CAI-related deficits, unlike jump landing and side cutting, which impose greater frontal-plane demands [17,41].
The vertical GRF findings showed distinct patterns between heel contact and push-off. At heel contact, vertical force did not differ between groups, although both groups generally produced greater forces during descent than during ascent. This condition-dependent pattern reflects the greater vertical loading associated with accepting body weight while the body moves downward during stair descent [42]. The absence of a group difference contrasts with previous single-leg landing research, in which individuals with CAI demonstrated lower peak vertical GRF, interpreted as a softer landing strategy [21]. However, a recent meta-analysis reported greater peak vertical GRF in individuals with CAI [43], indicating that findings across landing studies remain inconsistent. Unlike discrete landing, stair negotiation involves continued progression after foot contact, and this task-specific demand may partly account for the absence of a between-group difference in the present study. At push-off, the CAI group generated greater vertical force during both ascent conditions than during both descent conditions, whereas the healthy group generated greater vertical force during Asc-T than during Asc-P and both descent conditions. Moreover, the CAI group generated greater vertical force than the healthy group during Asc-P, while no between-group difference was observed during the other conditions. These findings suggest that the CAI-related alteration in vertical force was specific to Asc-P rather than representing a generalized increase across stair-ascent conditions. During Asc-P, the measured limb was positioned on the first step and contributed to supporting and elevating the body. Thus, the greater vertical force may reflect altered force regulation while the limb supported continued upward progression. Increased vertical GRF has also been reported in individuals with CAI during level walking [37] and running [44], suggesting that elevated vertical loading may occur across different locomotor tasks. However, its occurrence only during Asc-P in the present study indicates that this alteration may depend on the specific mechanical role of the limb within the task. Previous stair-to-ground transition research reported reduced ankle plantarflexion moment and relative ankle work contribution, together with increased knee and hip contributions, in individuals with CAI [20]. Therefore, the greater vertical GRF during Asc-P does not necessarily indicate greater ankle force generation and may instead reflect altered interjoint coordination or redistribution of mechanical demand across the lower extremity. Because vertical impulse, time to peak force, joint kinetics, and muscle activity were not measured, the mechanism underlying this difference cannot be determined. Although BMI did not differ significantly between groups in the present study, its potential influence on stair-negotiation biomechanics should also be considered [45].

4.3. Limitations

This study has several limitations. First, the relatively small sample of young adults with unilateral CAI and the use of convenience sampling may limit the generalizability of the findings. Additionally, physical activity level was not assessed, which may limit the characterization of the study population and comparisons with other CAI populations. The selection criteria did not incorporate all operational thresholds recommended by the International Ankle Consortium, and some uncertainty therefore remains in the characterization of CAI and healthy groups. Second, because a single force plate was alternately positioned on the floor and the first step, the four conditions were assessed separately rather than within a continuous stair sequence. Therefore, step-by-step adaptations and strategies could not be examined. Third, the affected limb in the CAI group was compared to the dominant limb in the healthy group, which may have introduced a limb-selection effect, as the dominant and non-dominant limbs may differ in loading and control strategies during stair negotiation. Although the affected limb corresponded to the dominant limb in most participants with CAI (84.6%), this correspondence was not complete, and a potential limb-selection effect cannot be excluded. Fourth, stair-negotiation speed was self-selected and was not quantitatively monitored. Although stance duration was quantified and did not differ between groups in any condition, differences in stair-negotiation speed may have influenced both COP and GRF outcomes. Therefore, its contribution to the observed findings cannot be excluded. Fifth, the analysis was limited to COP variables and discrete GRF peaks. Time to peak force, joint kinematics and kinetics, and muscle activity were not quantified, restricting interpretation of the mechanisms underlying the observed differences. Finally, testing was conducted using a standardized laboratory two-step staircase, and the findings may not generalize to stairs with different dimensions or to real-world environments. Future studies should use multiple synchronized force plates together with motion analysis and electromyography to evaluate continuous stair negotiation in larger and more diverse samples.

5. Conclusions

This study suggests that individuals with CAI exhibit a different pattern of dynamic balance and force regulation than healthy individuals during stair negotiation. The two groups demonstrated different condition-dependent response patterns, with group differences emerging in specific transition and progression conditions. These findings suggest that CAI may be associated with altered COP and GRF responses to condition-specific task demands. Because stair-negotiation speed was self-selected and was not quantitatively monitored, its contribution to the observed COP differences cannot be excluded. Clinical assessment based on a single stair condition may therefore not fully capture condition-specific biomechanical differences. These findings may help inform future clinical assessment and rehabilitation research by highlighting the potential value of considering both transition and progression conditions and condition-specific COP and GRF responses during stair negotiation. However, the clinical relevance of these findings and their applicability to routine assessment and rehabilitation should be confirmed in larger studies and clinical settings.

Supplementary Materials

The following supporting information can be downloaded at https://www.mdpi.com/article/10.3390/app16178837/s1, Supplementary Table S1: Sensitivity analyses including the healthy participant with extreme observations.

Author Contributions

Conceptualization, T.-W.P. and E.-Y.J.; methodology, T.-W.P. and H.-Y.C.; software, J.-H.J. and H.-Y.C.; validation, H.-R.S.; formal analysis, E.-Y.J.; investigation, T.-W.P.; resources, J.-H.J. and H.-Y.C.; data curation, E.-Y.J. and H.-R.S.; writing—original draft preparation, T.-W.P., H.-R.S. and J.-H.J.; writing—review and editing, E.-Y.J. and H.-Y.C.; visualization, T.-W.P. and E.-Y.J.; supervision, E.-Y.J. and H.-Y.C.; project administration, T.-W.P. and H.-Y.C. All authors have read and agreed to the published version of the manuscript.

Funding

This research received no external funding.

Institutional Review Board Statement

The study was conducted in accordance with the Declaration of Helsinki and approved by the Institutional Review Board of Gachon University (No. 1044396-202505-HR-068-01; 15 June 2025).

Informed Consent Statement

Informed consent was obtained from all subjects involved in the study.

Data Availability Statement

The data presented in this study are available on request from the corresponding author. The data are not publicly available due to ethical restrictions.

Acknowledgments

The authors used ChatGPT (GPT-5.5, OpenAI) solely for English language editing and to improve the clarity and readability of the manuscript. The authors have reviewed and edited the output and take full responsibility for the content of this publication.

Conflicts of Interest

The authors declare no conflicts of interest.

Abbreviations

The following abbreviations are used in this manuscript:
Asc-PStair ascent, progressing
Asc-TStair ascent, transitioning
%BWPercentage of body weight
CAIChronic ankle instability
CAITCumberland Ankle Instability Tool
CIConfidence interval
COPCenter of pressure
Desc-PStair descent, progressing
Desc-TStair descent, transitioning
FxAnterior–posterior ground reaction force
Fx-HCAnterior–posterior ground reaction force during heel contact
Fx-POAnterior–posterior ground reaction force during push-off
FyMedio-lateral ground reaction force
Fy-MSLateral ground reaction force during mid-stance
FzVertical ground reaction force
Fz-HCVertical ground reaction force during heel contact
Fz-POVertical ground reaction force during push-off
GRFGround reaction force
RM-ANOVARepeated measures analysis of variance

Appendix A

Figure A1. Dimensions of the custom-made two-step wooden stairs according to force-plate placement. (a) Force plate positioned on the first step. (b) Force plate positioned on the floor. The stairs were constructed to accommodate the 4.5 cm height of the force plate while maintaining an effective step height of 17.5 cm. Each step had a depth of 30 cm, and the stairs had a width of 60 cm.
Applsci 16 08837 g0a1

References

  1. Tyler, J.R.; Sandler, A.B.; Albagli, A.; Gilat, R.; Scanaliato, J.P.; Parnes, N. The National Epidemiology of Ankle Sprains in the United States: Updates from 2010 to 2024. Orthopedics 2025, 48, 371–377. [Google Scholar] [CrossRef] [Scilit] [PubMed]
  2. Hertel, J.; Corbett, R.O. An updated model of chronic ankle instability. J. Athl. Train. 2019, 54, 572–588. [Google Scholar] [CrossRef] [Scilit] [PubMed]
  3. Gribble, P.A.; Delahunt, E.; Bleakley, C.; Caulfield, B.; Docherty, C.; Fourchet, F.; Fong, D.; Hertel, J.; Hiller, C.; Kaminski, T. Selection criteria for patients with chronic ankle instability in controlled research: A position statement of the International Ankle Consortium. J. Orthop. Sports Phys. Ther. 2013, 43, 585–591. [Google Scholar] [CrossRef] [Scilit] [PubMed]
  4. Lin, C.-I.; Houtenbos, S.; Lu, Y.-H.; Mayer, F.; Wippert, P.-M. The epidemiology of chronic ankle instability with perceived ankle instability—A systematic review. J. Foot Ankle Res. 2021, 14, 41. [Google Scholar] [CrossRef] [Scilit] [PubMed]
  5. Herzog, M.M.; Kerr, Z.Y.; Marshall, S.W.; Wikstrom, E.A. Epidemiology of ankle sprains and chronic ankle instability. J. Athl. Train. 2019, 54, 603–610. [Google Scholar] [CrossRef] [Scilit] [PubMed]
  6. Thompson, C.; Schabrun, S.; Romero, R.; Bialocerkowski, A.; van Dieen, J.; Marshall, P. Factors contributing to chronic ankle instability: A systematic review and meta-analysis of systematic reviews. Sports Med. 2018, 48, 189–205. [Google Scholar] [CrossRef] [Scilit] [PubMed]
  7. Xue, X.; Ma, T.; Li, Q.; Song, Y.; Hua, Y. Chronic Ankle Instability Is Associated with Proprioception Deficits: A Systematic Review and Meta-Analysis. J. Sport Health Sci. 2021, 10, 182–191. [Google Scholar] [CrossRef] [Scilit] [PubMed]
  8. Peterka, R.J. Sensorimotor integration in human postural control. J. Neurophysiol. 2002, 88, 1097–1118. [Google Scholar] [CrossRef] [Scilit] [PubMed]
  9. Song, K.; Burcal, C.J.; Hertel, J.; Wikstrom, E.A. Increased visual use in chronic ankle instability: A meta-analysis. Med. Sci. Sports Exerc. 2016, 48, 2046–2056. [Google Scholar] [CrossRef] [Scilit] [PubMed]
  10. Labanca, L.; Mosca, M.; Ghislieri, M.; Agostini, V.; Knaflitz, M.; Benedetti, M.G. Muscle activations during functional tasks in individuals with chronic ankle instability: A systematic review of electromyographical studies. Gait Posture 2021, 90, 340–373. [Google Scholar] [CrossRef] [Scilit] [PubMed]
  11. Protopapadaki, A.; Drechsler, W.I.; Cramp, M.C.; Coutts, F.J.; Scott, O.M. Hip, knee, ankle kinematics and kinetics during stair ascent and descent in healthy young individuals. Clin. Biomech. 2007, 22, 203–210. [Google Scholar] [CrossRef] [Scilit] [PubMed]
  12. McFadyen, B.J.; Winter, D.A. An integrated biomechanical analysis of normal stair ascent and descent. J. Biomech. 1988, 21, 733–744. [Google Scholar] [CrossRef] [Scilit] [PubMed]
  13. Neuman, R.M.; Fey, N.P. There are unique kinematics during locomotor transitions between level ground and stair ambulation that persist with increasing stair grade. Sci. Rep. 2023, 13, 8576. [Google Scholar] [CrossRef] [Scilit] [PubMed]
  14. Zachazewski, J.E.; Riley, P.O.; Krebs, D.E. Biomechanical analysis of body mass transfer during stair ascent and descent of healthy subjects. J. Rehabil. Res. Dev. 1993, 30, 412–422. [Google Scholar] [PubMed]
  15. Brown, C.; Padua, D.; Marshall, S.W.; Guskiewicz, K. Individuals with mechanical ankle instability exhibit different motion patterns than those with functional ankle instability and ankle sprain copers. Clin. Biomech. 2008, 23, 822–831. [Google Scholar] [CrossRef] [Scilit] [PubMed]
  16. Watabe, T.; Takabayashi, T.; Tokunaga, Y.; Kubo, M. Copers adopt an altered dynamic postural control compared to individuals with chronic ankle instability and controls in unanticipated single-leg landing. Gait Posture 2022, 92, 378–382. [Google Scholar] [CrossRef] [Scilit] [PubMed]
  17. Chan, L.Y.T.; Sim, Y.T.N.; Gan, F.K.; Abd Razak, H.R.B. Effect of chronic ankle instability on lower extremity kinematics, dynamic postural stability, and muscle activity during unilateral jump-landing tasks: A systematic review and meta-analysis. Phys. Ther. Sport 2022, 55, 176–188. [Google Scholar] [CrossRef] [Scilit] [PubMed]
  18. Wang, X.; Wang, Z.; Adams, R.; Gao, Y.; Lyu, J.; Han, J. Effects of stair riser height on ankle proprioception in individuals with and without chronic ankle stability. Front. Bioeng. Biotechnol. 2025, 13, 1457233. [Google Scholar] [CrossRef] [Scilit] [PubMed]
  19. Farahpour, N.; Yaghoubi, U.M.; Robbins, S.; Allard, P.; Moisan, G. Dynamic Step-Down Tasks Reveal Altered Lower Limb Biomechanics in Chronic Ankle Instability. J. Foot Ankle Res. 2026, 19, e70102. [Google Scholar] [CrossRef] [Scilit] [PubMed]
  20. Zhong, Y.; Cen, X.; Hu, X.; Xu, D.; Tu, L.; Jemni, M.; Fekete, G.; Sun, D.; Song, Y. Control deficits and compensatory mechanisms in individuals with chronic ankle instability during dual-task stair-to-ground transition. Bioengineering 2025, 12, 1120. [Google Scholar] [CrossRef] [Scilit] [PubMed]
  21. Kawaguchi, K.; Taketomi, S.; Mizutani, Y.; Inui, H.; Yamagami, R.; Kono, K.; Kage, T.; Takei, S.; Fujiwara, S.; Ogata, T. Dynamic postural stability is decreased during the single-leg drop landing task in male collegiate soccer players with chronic ankle instability. Orthop. J. Sports Med. 2022, 10, 23259671221107343. [Google Scholar] [CrossRef] [Scilit] [PubMed]
  22. Hiller, C.E.; Refshauge, K.M.; Bundy, A.C.; Herbert, R.D.; Kilbreath, S.L. The Cumberland ankle instability tool: A report of validity and reliability testing. Arch. Phys. Med. Rehabil. 2006, 87, 1235–1241. [Google Scholar] [CrossRef] [Scilit] [PubMed]
  23. Cohen, J. Statistical Power Analysis for the Behavioral Sciences, 2nd ed.; Routledge: New York, NY, USA, 2013. [Google Scholar]
  24. Bolt, D.; Giger, R.; Wirth, S.; Swanenburg, J. Step-down test assessment of postural stability in patients with chronic ankle instability. J. Sport Rehabil. 2018, 27, 1a–5. [Google Scholar] [CrossRef] [Scilit] [PubMed]
  25. Bonnet, V.; Azevedo-Coste, C.; Robert, T.; Fraisse, P.; Venture, G. Optimal external wrench distribution during a multi-contact sit-to-stand task. IEEE Trans. Neural Syst. Rehabil. Eng. 2017, 25, 987–997. [Google Scholar] [CrossRef] [Scilit] [PubMed]
  26. Stemplewski, R.; Maciaszek, J.; Osiński, W.; Szeklicki, R. Test-retest reliability of measurements of the center of pressure displacement in quiet standing and during maximal voluntary body leaning among healthy elderly men. J. Hum. Kinet. 2011, 28, 15–23. [Google Scholar] [CrossRef] [Scilit] [PubMed]
  27. Rhea, C.K.; Kiefer, A.W.; Haran, F.J.; Glass, S.M.; Warren, W.H. A new measure of the CoP trajectory in postural sway: Dynamics of heading change. Med. Eng. Phys. 2014, 36, 1473–1479. [Google Scholar] [CrossRef] [Scilit] [PubMed]
  28. Linens, S.W.; Ross, S.E.; Arnold, B.L.; Gayle, R.; Pidcoe, P. Postural-stability tests that identify individuals with chronic ankle instability. J. Athl. Train. 2014, 49, 15–23. [Google Scholar] [CrossRef] [Scilit] [PubMed]
  29. Jafarnezhadgero, A.A.; Majlesi, M.; Azadian, E. Gait ground reaction force characteristics in deaf and hearing children. Gait Posture 2017, 53, 236–240. [Google Scholar] [CrossRef] [Scilit] [PubMed]
  30. Farahpour, N.; Jafarnezhad, A.; Damavandi, M.; Bakhtiari, A.; Allard, P. Gait ground reaction force characteristics of low back pain patients with pronated foot and able-bodied individuals with and without foot pronation. J. Biomech. 2016, 49, 1705–1710. [Google Scholar] [CrossRef] [Scilit] [PubMed]
  31. Tomczak, M.; Tomczak, E. The need to report effect size estimates revisited. An overview of some recommended measures of effect size. Trends Sport Sci. 2014, 21, 19–25. [Google Scholar]
  32. Kim, M.J.; Kim, S.; Kim, J.; Hopkins, J.T.; Choi, W.; Oh, S.; Son, S.J. Directional deficits in reactive postural control during perturbations among groups of chronic ankle instability, ankle sprain coper, and healthy control. Sci. Rep. 2025, 15, 16947. [Google Scholar] [CrossRef] [Scilit] [PubMed]
  33. McKeon, P.O.; Hertel, J. Spatiotemporal postural control deficits are present in those with chronic ankle instability. BMC Musculoskelet. Disord. 2008, 9, 76. [Google Scholar] [CrossRef] [Scilit] [PubMed]
  34. Esteves, J.; Dinis, R.; Fernandes, O.; Castro, M.A.; Oliveira, R.; Pezarat-Correia, P. Differences in postural control between healthy and subjects with chronic ankle instability. Phys. Ther. Sport 2022, 56, 8–14. [Google Scholar] [CrossRef] [Scilit] [PubMed]
  35. Chiu, M.-C.; Wu, H.-C.; Chang, L.-Y. Gait speed and gender effects on center of pressure progression during normal walking. Gait Posture 2013, 37, 43–48. [Google Scholar] [CrossRef] [Scilit] [PubMed]
  36. Gigi, R.; Haim, A.; Luger, E.; Segal, G.; Melamed, E.; Beer, Y.; Nof, M.; Nyska, M.; Elbaz, A. Deviations in gait metrics in patients with chronic ankle instability: A case control study. J. Foot Ankle Res. 2015, 8, 1. [Google Scholar] [CrossRef] [Scilit] [PubMed]
  37. Son, S.J.; Kim, H.; Seeley, M.K.; Hopkins, J.T. Altered walking neuromechanics in patients with chronic ankle instability. J. Athl. Train. 2019, 54, 684–697. [Google Scholar] [CrossRef] [Scilit] [PubMed]
  38. Luan, L.; Orth, D.; Newman, P.; Adams, R.; El-Ansary, D.; Han, J. Do individuals with ankle instability show altered lower extremity kinematics and kinetics during walking? A systematic review and meta-analysis. Physiotherapy 2024, 125, 101420. [Google Scholar] [CrossRef] [Scilit] [PubMed]
  39. Cao, S.; Wang, C.; Ma, X.; Jiang, S.; Yu, Y.; Wang, X.; Huang, J.; Zhang, C. Stair descent biomechanics reflect perceived instability in people with unilateral ankle sprain history. Clin. Biomech. 2020, 72, 52–57. [Google Scholar] [CrossRef] [Scilit] [PubMed]
  40. DeJong, A.F.; Koldenhoven, R.M.; Hertel, J. Proximal adaptations in chronic ankle instability: Systematic review and meta-analysis. Med. Sci. Sports Exerc. 2020, 52, 1563–1575. [Google Scholar] [CrossRef] [Scilit] [PubMed]
  41. Xu, Y.; Mo, Y.; Liu, C.; Chen, H.; Zhao, J.; Zhang, W.; Yu, Y.; Li, Y.; Wang, L.; Yuan, Y. Differences in lower extremity kinematics and kinetics during a side-cutting task in patients with and without chronic ankle instability. Front. Sports Act. Living 2025, 7, 1593231. [Google Scholar] [CrossRef] [Scilit] [PubMed]
  42. Stacoff, A.; Diezi, C.; Luder, G.; Stüssi, E.; Kramers-de Quervain, I.A. Ground reaction forces on stairs: Effects of stair inclination and age. Gait Posture 2005, 21, 24–38. [Google Scholar] [CrossRef] [Scilit] [PubMed]
  43. He, Z.; Zhu, H.; Ye, B.; Zheng, Z.; Liu, G.; Pan, H.; Liu, R. Does chronic ankle instability patients lead to changes in biomechanical parameters associated with anterior cruciate ligament injury during landing? A systematic review and meta-analysis. Front. Physiol. 2024, 15, 1428879. [Google Scholar] [CrossRef] [Scilit] [PubMed]
  44. Bigouette, J.; Simon, J.; Liu, K.; Docherty, C.L. Altered vertical ground reaction forces in participants with chronic ankle instability while running. J. Athl. Train. 2016, 51, 682–687. [Google Scholar] [CrossRef] [Scilit] [PubMed]
  45. Çakır, O.; Çilli, M. Impact of Body Weight on Stair Ascent and Descent Biomechanics in Teenagers. Pamukkale J. Sport Sci. 2026, 17, 170–186. [Google Scholar] [CrossRef] [Scilit]
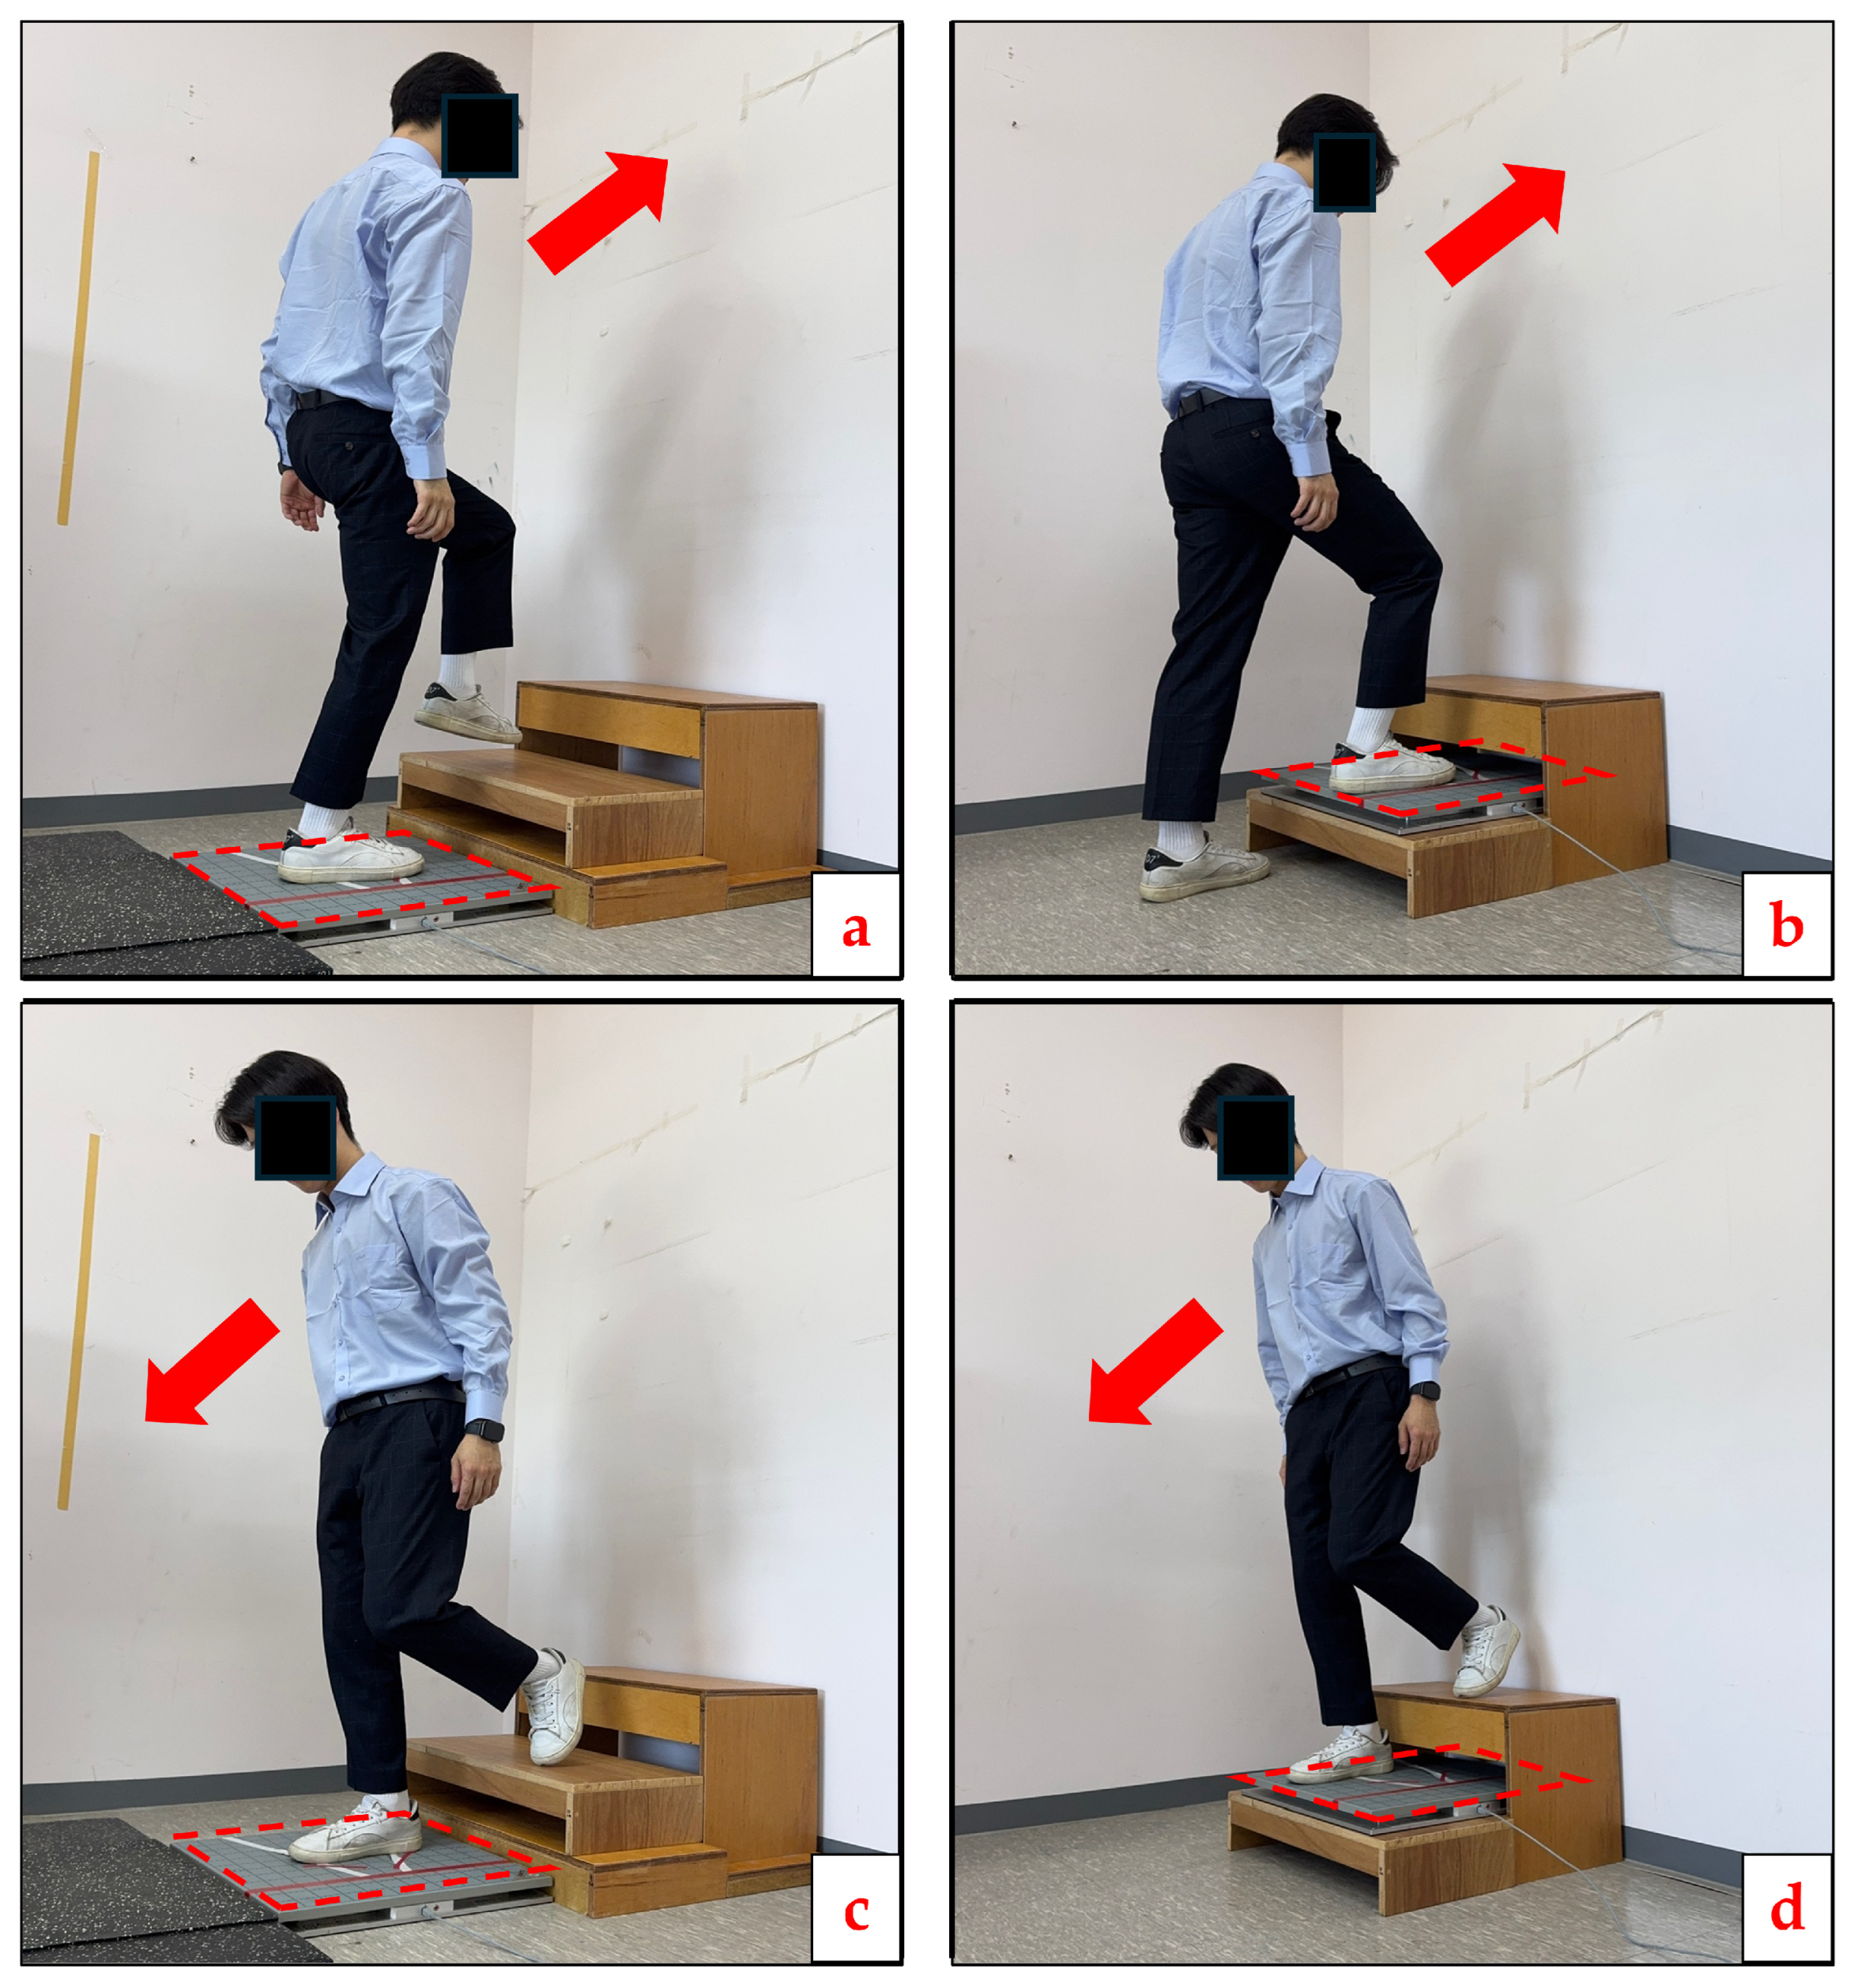
Figure 1. Experimental setup for the four conditions during stair ascent and descent. (a) Stair ascent, transitioning (Asc-T); (b) stair ascent, progressing (Asc-P); (c) stair descent, transitioning (Desc-T); (d) stair descent, progressing (Desc-P). The red dashed outline indicates the force plate on which the measured limb was placed. Arrows indicate the direction of movement.
Applsci 16 08837 g001
Figure 2. Flow diagram of participants.
Applsci 16 08837 g002
Table 1. Definitions of the four conditions during stair ascent and descent.
ConditionForce Plate LocationDescription
Stair Ascent, Transitioning (Asc-T)FloorThe transition from level walking into stair ascent. The measured limb supports the body on the floor while the opposite limb steps up to the first step.
Stair Ascent, Progressing (Asc-P)First stepThe progression of stair ascent. The measured limb steps onto the first step and accepts body weight while continuing the upward movement.
Stair Descent, Transitioning (Desc-T)FloorThe transition from stair descent into level walking. The measured limb steps down onto the floor and accepts body weight as the descent ends and level walking resumes.
Stair Descent, Progressing (Desc-P) First stepThe progression of stair descent. The measured limb supports the body on the first step while the opposite limb steps down to the floor.
Table 2. The general characteristics of participants.
VariablesCAI Group
(n = 13)
Healthy Group
(n = 12)
p-Value
Age (years) 129.92 ± 2.7831.58 ± 2.060.106 3
Height (cm) 1169.15 ± 9.28166.88 ± 6.680.491 3
Weight (kg) 167.62 ± 14.2562.50 ± 10.860.326 3
Body mass index 123.50 ± 3.0122.19 ± 2.650.262 3
Foot length (mm) 1252.31 ± 21.47248.75 ± 11.890.617 3
Foot width (cm) 19.55 ± 0.769.23 ± 0.760.302 3
CAIT score 122.00 ± 1.0828.75 ± 0.62<0.001 4
Gender (Male/Female) 28/58/41.000 5
Affected side (L/R)5/8
Dominant leg side(L/R) 23/100/120.220 5
Asc-T stance duration (s) 10.91 ± 0.090.93 ± 0.120.623 3
Asc-P stance duration (s) 11.00 ± 0.121.08 ± 0.210.270 3
Desc-T stance duration (s) 10.83 ± 0.090.84 ± 0.130.912 3
Desc-P stance duration (s) 10.86 ± 0.120.90 ± 0.140.488 3
1 data expressed mean ± standard deviation; 2 data expressed frequency; 3 independent t-test; 4 Mann–Whitney U test; 5 Fisher’s exact test. Asc-P, stair ascent progressing; Asc-T, stair ascent transitioning; CAI, chronic ankle instability; CAIT, Cumberland Ankle Instability Tool; Desc-P, stair descent progressing; Desc-T, stair descent transitioning; R, right; L, left.
Table 3. Center of pressure path length during stair ascent and descent.
GroupAsc-T a
[95% CI]
Asc-P b
[95% CI]
Desc-T c
[95% CI]
Desc-P d
[95% CI]
Within-Group
p-Value
Group × Condition Interaction
p-Value
FEffect Size
2p)
Path length (mm)
CAI121.71 ± 28.68
[94.76, 148.67]
116.45 ± 27.74
[99.99, 132.90]
134.22 ± 50.41
[112.38, 156.07]
128.89 ± 22.37
[117.06, 140.72]
0.0510.015 *4.5780.172
Healthy170.05 ± 61.99 b,c
[140.75, 199.35]
109.48 ± 29.61 a,d
[91.59, 127.37]
115.26 ± 11.07 a
[91.52, 139.01]
127.84 ± 18.16 b
[114.99, 140.70]
<0.001 *
Between-group
p-value
0.020 *0.5580.2360.902
Data are presented as mean ± standard deviation. The 95% confidence intervals were obtained from the estimated marginal means of the repeated-measures analysis of variance. * p < 0.05; a indicates significant difference from Asc-T; b indicates significant difference from Asc-P; c indicates significant difference from Desc-T; d indicates significant difference from Desc-P. Asc-P, stair ascent progressing; Asc-T, stair ascent transitioning; CAI, chronic ankle instability; CI, confidence interval; Desc-P, stair descent progressing; Desc-T, stair descent transitioning; η2p, partial eta squared.
Table 4. Center of pressure velocity during stair ascent and descent.
GroupAsc-T a
[95% CI]
Asc-P b
[95% CI]
Desc-T c
[95% CI]
Desc-P d
[95% CI]
Within-Group
p-Value
Group × Condition
Interaction
p-Value
FEffect Size
2p)
Velocity (mm/s)
CAI133.55 ± 26.79
[98.99, 168.11]
117.09 ± 28.60 d
[100.44, 133.73]
161.57 ± 58.60
[134.69, 188.46]
151.39 ± 27.78 b
[130.91, 171.88]
0.002 *0.007 *5.4650.192
Healthy193.12 ± 82.48 b,c
[157.14, 229.09]
102.07 ± 29.46 a,d
[84.75, 119.39]
143.94 ± 29.07 a
[115.96, 171.92]
152.83 ± 42.70 b
[131.52, 174.15]
<0.001 *
Between-group
p-value
0.021 *0.2090.3570.921
Data are presented as mean ± standard deviation. The 95% confidence intervals were obtained from the estimated marginal means of the repeated-measures analysis of variance.* p < 0.05; a indicates significant difference from Asc-T; b indicates significant difference from Asc-P; c indicates significant difference from Desc-T; d indicates significant difference from Desc-P. Asc-P, stair ascent progressing; Asc-T, stair ascent transitioning; CAI, chronic ankle instability; CI, confidence interval; Desc-P, stair descent progressing; Desc-T, stair descent transitioning; η2p, partial eta squared.
Table 5. Center of pressure area of the 95% confidence ellipse during stair ascent and descent.
GroupAsc-T a
[95% CI]
Asc-P b
[95% CI]
Desc-T c
[95% CI]
Desc-P d
[95% CI]
Within-Group
p-Value
Group × Condition
Interaction
p-Value
FEffect Size
2p)
Area 95 (mm2)
CAI24.08 ± 7.47
[19.11, 29.06]
27.37 ± 10.37
[20.61, 34.12]
20.26 ± 10.92
[14.20, 26.33]
18.83 ± 5.14
[14.70, 22.96]
0.034 *0.5690.6780.029
Healthy25.79 ± 9.81
[20.62, 30.97]
24.69 ± 13.13
[17.66, 31.71]
16.15 ± 10.19 d
[9.84, 22.47]
19.89 ± 8.92 c
[15.59, 24.19]
0.036 *
Data are presented as mean ± standard deviation. The 95% confidence intervals were obtained from the estimated marginal means of the repeated-measures analysis of variance. * p < 0.05; a indicates significant difference from Asc-T; b indicates significant difference from Asc-P; c indicates significant difference from Desc-T; d indicates significant difference from Desc-P. Asc-P, stair ascent progressing; Asc-T, stair ascent transitioning; CAI, chronic ankle instability; CI, confidence interval; Desc-P, stair descent progressing; Desc-T, stair descent transitioning; η2p, partial eta squared.
Table 6. Ground reaction force x-axis heel contact and push-off during stair ascent and descent.
GroupAsc-T a
[95% CI]
Asc-P b
[95% CI]
Desc-T c
[95% CI]
Desc-P d
[95% CI]
Within-Group
p-Value
Group × Condition
Interaction
p-Value
FEffect Size
2p)
Fx-HC (% body weight)
CAI−10.83 ± 2.46 c
[−12.42, −9.25]
−10.23 ± 1.81 c
[−11.07, −9.40]
−15.90 ± 4.17 a,b,d
[−17.95, −13.86]
−11.96 ± 4.26 c
[−13.90, −10.02]
<0.001 *0.2921.2670.052
Healthy−8.16 ± 3.06 c
[−9.81, −6.51]
−9.80 ± 0.94 c
[−10.67, −8.92]
−13.55 ± 2.75 a,b,d
[−15.67, −11.42]
−10.42 ± 2.04 c
[−12.44, −8.40]
<0.001 *
Fx-PO (% body weight)
CAI7.60 ± 2.52 b,c,d
[6.13, 9.06]
3.88 ± 1.26 a,c
[3.19, 4.57]
12.65 ± 2.01 a,b
[11.18, 14.12]
14.28 ± 2.23 a,b
[13.13, 15.43]
<0.001 *0.036 *3.0080.116
Healthy8.07 ± 2.58 b,c,d
[6.55, 9.60]
3.59 ± 1.15 a,c,d
[2.87, 4.31]
10.20 ± 3.05 a,b
[8.67, 11.72]
12.50 ± 1.72 a,b
[11.31, 13.70]
<0.001 *
Between-group
p-value
0.6460.5510.025 *0.036 *
Data are presented as mean ± standard deviation. The 95% confidence intervals were obtained from the estimated marginal means of the repeated-measures analysis of variance. * p < 0.05; a indicates significant difference from Asc-T; b indicates significant difference from Asc-P; c indicates significant difference from Desc-T; d indicates significant difference from Desc-P. Asc-P, stair ascent progressing; Asc-T, stair ascent transitioning; CAI, chronic ankle instability; CI, confidence interval; Desc-P, stair descent progressing; Desc-T, stair descent transitioning; Fx-HC, anterior–posterior ground reaction force during heel contact; Fx-PO, anterior–posterior ground reaction force during push-off; η2p, partial eta squared.
Table 7. Ground reaction force y-axis mid stance during stair ascent and descent.
GroupAsc-T a
[95% CI]
Asc-P b
[95% CI]
Desc-T c
[95% CI]
Desc-P d
[95% CI]
Within-Group
p-Value
Group × Condition
Interaction
p-Value
FEffect Size
2p)
Fy-MS (% body weight)
CAI−6.04 ± 1.16 c,d
[−6.64, −5.45]
−5.21 ± 1.61 c,d
[−6.09, −4.34]
−8.36 ± 2.36 a,b
[−9.77, −6.95]
−8.50 ± 1.66 a,b
[−9.61, −7.40]
<0.001 *0.1941.6130.066
Healthy−5.67 ± 0.88 d
[−6.28, −5.05]
−5.79 ± 1.44 d
[−6.71, −4.88]
−7.29 ± 2.56
[−8.76, −5.82]
−7.94 ± 2.17 a,b
[−9.09, −6.79]
0.002 *
Data are presented as mean ± standard deviation. The 95% confidence intervals were obtained from the estimated marginal means of the repeated-measures analysis of variance. * p < 0.05; a indicates significant difference from Asc-T; b indicates significant difference from Asc-P; c indicates significant difference from Desc-T; d indicates significant difference from Desc-P. Asc-P, stair ascent progressing; Asc-T, stair ascent transitioning; CAI, chronic ankle instability; CI, confidence interval; Desc-P, stair descent progressing; Desc-T, stair descent transitioning; Fy-MS, lateral ground reaction force during mid-stance; η2p, partial eta squared.
Table 8. Ground reaction force z-axis heel contact and push-off during stair ascent and descent.
GroupAsc-T a
[95% CI]
Asc-P b
[95% CI]
Desc-T c
[95% CI]
Desc-P d
[95% CI]
Within-Group
p-Value
Group × Condition
Interaction
p-Value
FEffect Size
2p)
Fz-HC (% body weight)
CAI110.83 ± 4.49 c,d
[108.01, 113.65]
107.69 ± 6.64 c,d
[104.48, 110.90]
159.13 ± 35.47 a,b
[138.58, 179.68]
145.77 ± 33.64 a,b
[129.83, 161.72]
<0.001 *0.2891.2500.052
Healthy113.36 ± 5.33 b,c
[110.43, 116.29]
105.44 ± 4.17 a,c
[102.10, 108.79]
147.71 ± 36.19 a,b
[126.33, 169.10]
128.78 ± 19.50
[112.18, 145.37]
<0.001 *
Fz-PO (% body weight)
CAI117.15 ± 10.66 c,d
[111.71, 122.58]
120.22 ± 11.77 c,d
[114.72, 125.73]
104.98 ± 6.97 a,b,d
[101.74, 108.21]
95.63 ± 9.69 a,b,c
[90.51, 100.75]
<0.001 *0.030 *3.7930.142
Healthy115.29 ± 7.99 b,c,d
[109.63, 120.95]
108.55 ± 6.42 a
[102.83, 114.28]
103.99 ± 3.70 a
[100.62, 107.36]
97.58 ± 7.99 a
[92.25, 102.91]
<0.001 *
Between-group
p-value
0.6300.006 *0.6670.590
Data are presented as mean ± standard deviation. The 95% confidence intervals were obtained from the estimated marginal means of the repeated-measures analysis of variance. * p < 0.05; a indicates significant difference from Asc-T; b indicates significant difference from Asc-P; c indicates significant difference from Desc-T; d indicates significant difference from Desc-P. Asc-P, stair ascent progressing; Asc-T, stair ascent transitioning; CAI, chronic ankle instability; CI, confidence interval; Desc-P, stair descent progressing; Desc-T, stair descent transitioning; Fz-HC, vertical ground reaction force during heel contact; Fz-PO, vertical ground reaction force during push-off; η2p, partial eta squared.
Disclaimer/Publisher’s Note: The statements, opinions and data contained in all publications are solely those of the individual author(s) and contributor(s) and not of MDPI and/or the editor(s). MDPI and/or the editor(s) disclaim responsibility for any injury to people or property resulting from any ideas, methods, instructions or products referred to in the content.