Article

Effect of Tank Orientation and Fill Level on the Thermal Response of Bi-Lobed Type C Tanks for Liquefied CO2 Transport


1
Department of Ocean Engineering, Korea Maritime & Ocean University, Busan 49112, Republic of Korea
2
Department of Convergence Studies on the Ocean Science and Technology, Korea Maritime & Ocean University, Busan 49112, Republic of Korea
*
Author to whom correspondence should be addressed.
Appl. Sci. 2026, 16(17), 8738; https://doi.org/10.3390/app16178738
Submission received: 2 August 2026 / Revised: 29 August 2026 / Accepted: 31 August 2026 / Published: 2 September 2026

Abstract

Bi-lobed Type C pressure vessels are an attractive cargo-containment option for the marine transport of liquefied carbon dioxide (LCO2) because they combine the high design pressure of cylindrical Type C tanks with an improved utilization of the prismatic hold volume. Although the structural and sloshing behaviors of such tanks have received considerable attention, their thermal response (heat ingress, boil-off and self-pressurization) has not been thoroughly examined. Furthermore, the influence of tank orientation (vertical versus horizontal) remains unresolved even for conventional cylinders. In this study a bi-lobed Type C tank, derived from a validated single-lobe design through the Senjanović proportioning rule, is analyzed using a two-node lumped-parameter thermal network built in Thermal Desktop 24.2/SINDA/FLUINT, with CO2 properties supplied by the Span–Wagner equation of state through REFPROP 9.1. The model was verified against the NASA multipurpose hydrogen test bed (MHTB) liquid-hydrogen self-pressurization experiment and against a liquid-CO2 cargo-tank measurement. Vertical bi-lobed tank (VBT) and horizontal bi-lobed tank (HBT) orientations were then compared at four fill levels ranging from 20% to 90%. The results demonstrate that orientation significantly alters cumulative heat ingress, pressure rise and vapor temperature, with the effect being strongly amplified at low fill levels. The pressure rise is shown to be governed by the onset of boiling, the timing of which is determined by how quickly each orientation warms the liquid to saturation.

1. Introduction

Ship transport of liquefied CO2 is emerging as a core link in the carbon capture and storage (CCS) chain. Because liquid CO2 must be transported between its triple point (5.18 bar, −56.6 °C) and its critical point (73.8 bar, 31.1 °C), it cannot be stored at atmospheric pressure. Consequently, independent pressure-vessel-type (IMO Type C) tanks represent the only practical containment option [1]. As a result, the cargo containment system constitutes the component subjected to the highest design pressure. The existing fleet operates primarily in the medium-pressure regime (approximately 15 to 20 bar at −30 to −20 °C), whereas newbuild designs are migrating toward the low-pressure regime (approximately 5 to 10 bar at −55 to −40 °C), where lower pressures permit thinner plates and, consequently, larger tank volumes [1,2]. Seo and Lee [3] demonstrated for a 5000 m3 cylindrical Type C LCO2 tank that the required shell thickness of 48.2 mm is set not by the rule minimum [4], the liquid head, or buckling, but rather by the vapor pressure combined with the boil-off accumulated over the holding time. Type C LCO2 tank design is thus intrinsically pressure-driven, and any reduction in heat ingress or pressure rise translates directly into a lighter, larger, and more cost-effective tank.
A conventionally circular pressure tank fills the rectangular cross-section of a ship’s cargo hold poorly. Thus, the bi-lobed tank, formed by two cylindrical lobes intersecting along a longitudinal center bulkhead, was introduced to mitigate this volumetric loss [5]. The conventional single-lobe cylindrical Type C tank features high structural efficiency and design pressure tolerance, remaining a common choice for the marine transport of cryogenic cargoes [6]. The bi-lobed configuration sacrifies some structural simplicity to achieve superior volumetric efficiency within prismatic cargo holds. Consequently, bi-lobed Type C tanks are increasingly being adopted in new LCO2 carriers. However, published research on bi-lobed tanks has predominantly focused on structural aspects and sloshing behaviors. Senjanović et al. [5] established the classification-rule design procedure, deriving the shell scantlings using membrane theory and dimensioning the longitudinal bulkhead as a tension-loaded member that equilibrates the circumferential membrane forces transmitted by the two lobes at the Y-joint. Subsequent work has further refined this approach through finite element and optimization methods [7]. Regarding hydrodynamic aspects, Saghi and Saghi [8] compared horizontal and vertical cylinder-shaped bi-lobed tanks under sway excitation using a coupled RANS-VOF solver. In contrast, only a limited number of studies have addressed thermal behavior. For instance, Ye et al. [9] investigated boil-off in a bi-lobed tank to determine optimized tank dimensions for a small-scale LNG carrier. To date, comprehensive studies on heat ingress, thermal stratification, or self-pressurization in bi-lobed tanks remain extremely scarce, and no such investigation has been reported for LCO2 bi-lobed tanks.
Several studies have investigated the thermal behavior of VBT and HBT. Sharafian et al. [10] modeled vertical and horizontal LNG storage tanks with a non-equilibrium thermodynamic formulation and concluded that horizontal tanks exhibit a longer holding time than vertical tanks under dynamic operating conditions. Similarly, Wang and Mérida [11] applied a similar framework to equal-volume liquid-hydrogen tanks and found that the pressure rise in horizontal cylinders is slower than in vertical cylinders, attributing this to more efficient vapor–liquid heat exchange across the wider interface. However, both studies focused on stationary land-based or generic single-cavity cylinders. Consequently, neither study addressed marine Type C tanks, nor did they consider multi-lobe geometry, such as a bi-lobed tank system.
The thermal response of the two orientations is evaluated using a lumped-parameter model built in Thermal Desktop coupled with SINDA/FLUINT. The tank wall and insulation govern the conduction and radiation heat transfer, whereas the contained CO2 is resolved as a coupled thermal-fluid system. In this manner, heat conducted through the insulation drives the phase change and subsequent pressure rise inside the tank. The tank interior is represented by a two-node scheme, wherein the liquid and the vapor phases are each treated as a single control volume that exchanges mass and energy across a saturated interface [12,13].
The present study investigates on the thermal behavior of a bi-lobed LCO2 tank. The primary objectives of this study are therefore (1) to establish a robust numerical framework for the thermal analysis of the LCO2 cargo containment systems, (2) to understand the thermal behavior of the bi-lobed LCO2 tank with respect to tank orientation and fill level, and (3) to evaluate the subsequent impact on self-pressurization.
Specifically, the study determines how tank orientation redistributes the wetted wall area and the vapor–liquid interface, and how this redistribution manifests in the heat ingress, the boil-off gas generation, and the rate of ullage pressure rise. These thermodynamic quantities dictate the holding time and consequently the design pressure of a pressure-driven Type C LCO2 tanks. Because this redistribution is highly dependent on the liquid inventory, four fill levels are examined, spanning from a 20% part-load to a 90% laden condition (namely 20, 30, 50 and 90%).
The numerical model was validated in two stages against the NASA multipurpose hydrogen test bed (MHTB) liquid-hydrogen experiments [14] and the liquid-CO2 cargo-tank measurements [15]. The MHTB case verifies the ullage pressure and temperature response of a cryogenic pressure vessel, whereas the CO2 case validates the liquid expansion behavior of the actual cargo of interest.

2. Bi-Lobed Tank Geometry

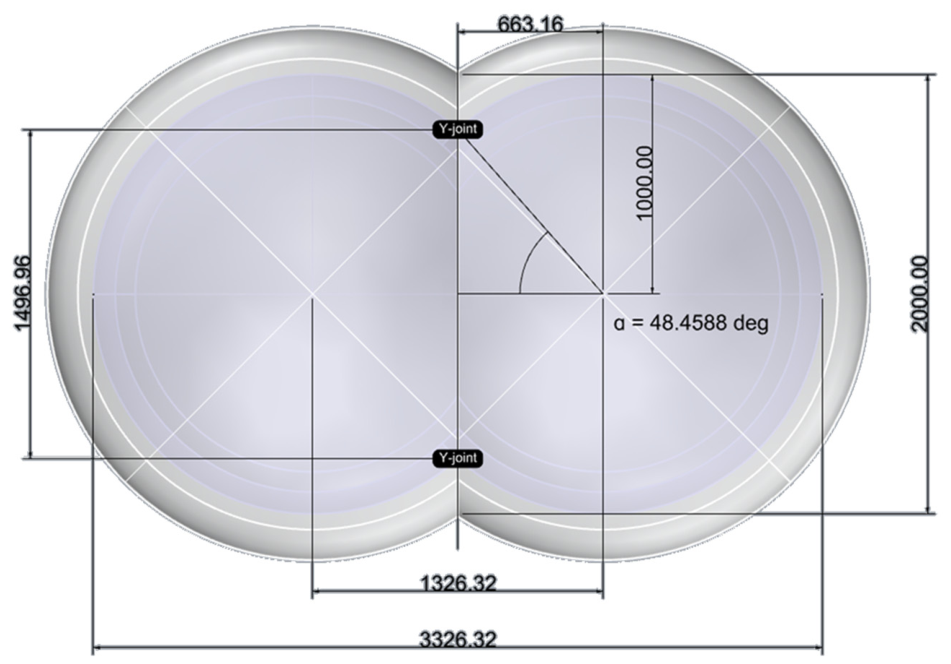
No specific bi-lobed tank geometry for LCO2 service has been published in the open literature. Because parameters such as the lobe radius, lobe offset, and the associated scantlings remain proprietary to shipyards, the open literature contains no equivalent of the cylindrical design chain reported by Seo and Lee [3]. To address this limitation, the cargo tank analyzed in this study was developed by merging two identical cylindrical Type C lobes, each reproducing the validated single-lobe LCO2 tank design [16], into a single bi-lobed vessel. The two lobes, with an internal radius R = 1000 mm, are offset horizontally so that their centers are separated by 2e and are joined along a vertical Y-joint bulkhead of half-height b. The lobe offset is fixed by the dimensionless ratio e/R = 0.663160, which reproduces the reference value 0.663158 to within 0.0003% and corresponds to a lobe half-angle α = arc-cos(e/R) = 48.459° [5]. This ratio serves as a hull-packing geometric parameter that is independent of the cargo carried, thereby governing the intersection depth of the two cylinders. Following the equal-volume convention [8], the vertical and horizontal configurations are represented by the same joined body rotated through 90°. Consequently, the internal volume, total wall area, and surface-to-volume ratio remain identical between the two cases, with the only difference being the direction of the gravity vector. The resulting cross-section is illustrated in Figure 1.
The joint half-height is b = (R2e2)1/2 = 748.48 mm, yielding a total bulkhead height of 2b = 1496.96 mm. The overall breadth of the section is 2(R + e) = 3326.32 mm and its height is 2R = 2000 mm, resulting in a cross-sectional area is 5.5844 m2. Relative to two separate 2000 mm cylinders placed side by side (4000 mm total breadth), the bi-lobed section saves 674 mm of breadth by removing the lobe overlap. The internal volume measured from the CAD model is 36.16 m3, whereas the faceted volume used in the thermal discretization is 35.39 m3, representing a minor deviation of 2.1%. The tank extends axially over a length L = 6770.63 mm. The principal dimensions of the tank are summarized in Table 1.
The containment system features a triple-wall arrangement. The inner pressure vessel is fabricated from T-304 stainless steel prepared to an A240-304/SSPC-SP-10 [17] finish. It is surrounded by Cryogel x201 aerogel insulation and by an outer carbon-steel (ASTM A516 [17] Grade 70) shell finished with white urethane paint. Consistent with the original single-lobe design, the insulation thickness is non-uniform, measuring 210 mm over the cylindrical sides and 285 mm at the dished ends; this asymmetry is a characteristic feature of the reference vessel and is retained unchanged in both orientations.

3. Computational Methods

3.1. Governing Equations

The tank is modeled using the FLUINT lumped-fluid formulation [18] comprising two coupled control volumes, a liquid lump and a vapor lump. Although these two lumps occupy the entire internal tank volume and share a uniform system pressure, they are allowed to deviate from thermodynamic equilibrium, thereby permitting the liquid to become subcooled and the vapor to become superheated relative to the interface. Nevertheless, they are initialized in an identical saturated state. Each lump is assumed to be perfectly mixed and is described by a single thermodynamic state, with mass and energy occurring across a common interface held at saturation. The mass conservation for the two lumps is expressed as follows:
dml/dt = − , dmv/dt = +
where t denotes time, and ml and mv represent the liquid and vapor masses, respectively. is the net interfacial mass-transfer rate (defined as positive for evaporation). Based on the global tank energy balance, the energy conservation equation for the two lumps is formulated as follows:
d ( m l u l ) / d t = Q wl ˙ Q lv ˙ m ˙ h l P d V l / d t
d ( m v u v ) / d t = Q wv ˙ + Q lv ˙ + m ˙ h l P d V v / d t
where u is the specific internal energy. Q wl ˙ and Q wv ˙ represent the heat transfer rates from the wetted and dry wall to the liquid and vapor phases, respectively. Q lv ˙ is the net heat transfer rate exchanged across the interface, and hl is the donor (saturated liquid) enthalpy carried by the interfacial mass transfer. The wall-to-fluid heat transfer rates are evaluated by convective formulations as Q w ˙ = U A ( T w T lump ) , with UA = F Aht h, where Tw is the wall temperature, Tlump is the lump temperature, h is the convective heat transfer coefficient (accounting for boiling and condensation), Aht is the heat-transfer area and F is the corresponding area fraction. Aht is the wetted wall area for the liquid lump and the dry wall area for the vapor lump. The last term in each energy equation represents the pressure–volume work resulting from the interfacial displacement, with P denoting the shared lump pressure. Because the same donor enthalpy (hl) appears in both lump formulations, the interfacial mass transfer conserves energy exactly. Finally, the two lumps collectively share the fixed total tank volume,
Vl + Vv = Vtank = const
where Vl and Vv denote the liquid and vapor volumes, respectively, and Vtank represents the total tank volume. Because dVl/dt = −dVv/dt, the pressure-work terms eliminate each other in the combined energy balance. The interface model is closed by the saturation condition, whereby the shared system pressure (P) and the interface temperature (Ti) strictly satisfy the thermodynamic saturation relations. Consequently, Tsat and Psat denote the saturation temperature and pressure, respectively, governed by the relation,
Ti = Tsat(P), P = Psat(Ti)
Heat reaches the cargo through the SINDA conduction–radiation network that represents the outer shell, aerogel insulation, and the inner tank. Accordingly, each node i obeys the finite-difference heat balance equation,
Ci dTi/dt = Σj Gij (TjTi) + Σj Rij (Tj4Ti4) + Qi
where Ci = ρiVicp,i is the nodal thermal capacitance, and ρi, Vi and cp,i represent the density, volume and specific heat of node i, respectively. Ti and Tj are the temperatures of nodes i and j, respectively. Furthermore, Gij is the linear (conduction) conductor between nodes i and j, defined as kA/L for a wall layer of conductivity (k), area (A) and thickness (L). Rij is the radiation conductor, given by Rij = σFijAi, where σ is the Stefan–Boltzmann constant, Ai is the surface area of node i, and Fij is the exchange factor computed by Monte Carlo ray tracing. Qi is the applied heat source. This ambient environment is represented by a radiation sink node and a convective air node, thereby combining exterior radiation to the sink with convection to the air. The network is integrated in time using the implicit, second-order Crank–Nicolson scheme in SINDA/FLUINT. Accordingly, the exterior-surface heat flux is expressed as follows:
q ext ˙ = ε σ   ( T env 4 T i 4 ) + h c   ( T air T i )
where ε is infrared emissivity, Tenv = 45 °C (318.15 K) is the radiative sink temperature, Tair = 25 °C (298.15 K) is the ambient air temperature, and hc is the convective heat transfer coefficient. Solar heating is incorporated into the radiative sink, following the international gas carrier (IGC) design condition [19]. The radiative surface properties are listed in Table 2, and the material properties in Table 3. The fluid network (Equations (1)–(5)) and the thermal network (Equations (6) and (7)) are solved simultaneously by SINDA/FLUINT within Thermal Desktop 24.2.

3.2. Fluid and Material Properties

The thermodynamic and transport properties of carbon dioxide are evaluated using the Span–Wagner reference equation of state [20], accessed through the NIST REFPROP 9.1 property library [21]. The Span–Wagner formulation is expressed as a fundamental Helmholtz-energy function of temperature and density, rendering it thermodynamically consistent for both caloric and transport properties over the entire fluid region relevant to LCO2 transport. This includes the near-critical states, which are typically poorly represented by cubic equations of state. At each time step, the saturation pressure, latent heat, densities and specific heats required by Equations (2)–(5) are returned by REFPROP based on the current lump states.
The insulation thermal conductivity in Table 3 is treated as a single, temperature-independent effective value for Cryogel X201 aerogel, evaluated at the mean insulation temperature of the investigated cases. Because aerogel thermal conductivity increases weakly with temperature, this constant value neglects the temperature gradient across the insulation layer, which spans from the cargo temperature of −45 °C to the ambient and solar-sink boundary temperatures of 25–45 °C. Because the aerogel layer constitutes the controlling thermal resistance of the containment system, total heat ingress scales nearly linearly with this conductivity. Consequently, incorporating a temperature-dependent conductivity would shift the absolute heat ingress of both orientations by the same proportion, leaving the vertical-versus-horizontal comparison unaffected.

3.3. Boundary and Initial Conditions

The environmental boundary is based on the design ambient conditions stipulated in the IGC Code [19]. The surrounding air temperature is taken as 25 °C (298.15 K), and solar heating of the exposed surfaces is represented by an equivalent radiative sink of 45 °C (318.15 K) acting on the outer shell, in conjunction with the radiative properties listed Table 2. The cargo is initialized in a state of saturated liquid–vapor equilibrium at a pressure of 8 bar (800 kPa) and a temperature of −45 °C (228.15 K). Four fill levels are considered (20, 30, 50 and 90%), each analyzed in both the VBT and HBT orientations, and the transient simulation is advanced for 5 × 10⁴ s [22,23]. The boundary and initial conditions are summarized in Table 4.

3.4. Computational Mesh

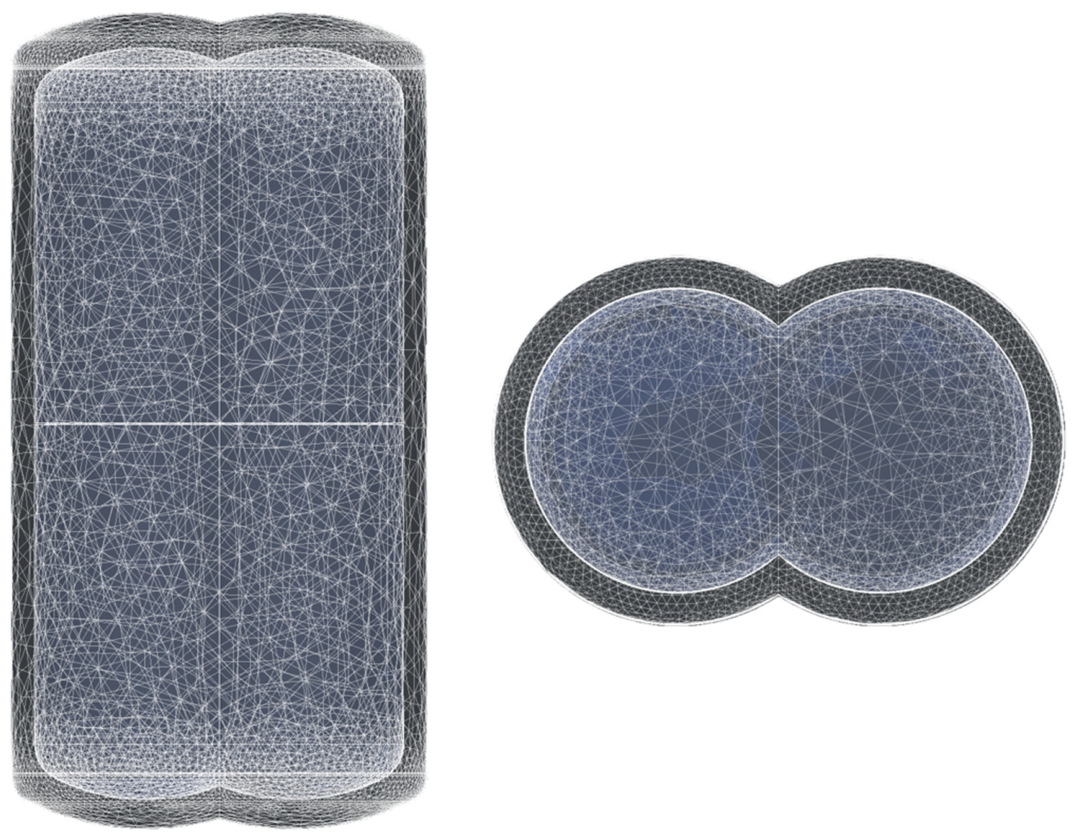
The outer shell and the inner vessel were discretized using an unstructured triangular surface mesh generated in Thermal Desktop. The element size was controlled by setting a maximum dimension fraction of 0.07 and a maximum turning angle of 15°. This ensured that the mesh was automatically refined along the curved lobe walls and the dished ends, where the surface curvature is most pronounced, while remaining coarser in flatter regions. Because the same meshing controls were applied to both the vertical and horizontal orientations, the two configurations share a geometrically identical discretization and differ only in the direction of the gravity vector.
The two-phase cargo interior is represented by a liquid-volume solid constructed to the same internal dimensions as the inner tank and connected to it through a compartment. This compartment partitions the enclosed fluid into the saturated-liquid and vapor lumps of the two-node models. The longitudinal center bulkhead that joins the two lobes along the Y-joints is a continuous structural plate [5] and was excluded from the thermal model. Because the two lobes are geometrically identical and subjected to symmetric thermal boundary conditions, the centerline bulkhead lies on a plane of thermal symmetry across which no net heat flux passes. Consequently, inter-lobe heat exchange is absent, meaning that treating the cargo as a single combined liquid lump and a single vapor lump is thermodynamically equivalent to resolving the two lobes separately. The only remaining thermal roles of the bulkhead are its parasitic heat capacity and a potential fin-conduction path from the outer shell, both of which are minor. Following the bulkhead-sizing relation of Senjanović et al. [5], in which the bulkhead stress does not exceed the shell stress, the plate thickness is approximately 2(e/R) times the 10 mm inner-shell thickness (yielding roughly 13 mm). The heat capacity of such a plate, spanning the Y-joint height (2b = 1.50 m) over the tank length (L = 6.77 m), is approximately 0.5 MJ·K−1, less than 3% of the liquid thermal capacity at the lowest fill level (20%) and even smaller at higher filling ratios. Moreover, the structural bulkhead is also perforated for sloshing relief [5], which further limits longitudinal and transverse conduction. Because this residual influence is identical for both orientations, it exerts a negligible effect on the computed heat ingress and self-pressurization, and no effect on the comparison between the HBT and VBT. The resulting discretized meshes for the two orientations are shown in Figure 2.
A grid dependency verification was performed for the representative horizontal case at 20% filling ratio, where the wetted and free-surface areas govern the thermal response. Three surface meshes were generated by setting the maximum dimension fraction to 0.10, 0.07 and 0.05 while holding the maximum turning angle fixed at 15°, and the resulting geometric areas and steady-state heat ingress rate are compared in Table 5. Across the three meshes, the wetted, dry, and free-surface areas agree to within 0.04%. Steady-state heat rates were successfully computed for the 0.07 and 0.05 meshes, showing agreement within 0.02%. For the coarsest mesh (0.10), the numerical solver diverged due to extreme element skewness exceeding 0.999. Thus, only its geometric quantities are reported. Because these surface areas are determined analytically by the vessel geometry and fill level rather than by a resolved fluid field, they are virtually independent of spatial discretization. Furthermore, since the vertical and horizontal cases employ identical surface meshes, any residual discretization error is common to both orientations and cancels in the comparative analysis.

4. Model Validations

Due to the absence of empirical self-pressurization data for bi-lobed LCO 2 tanks, the thermal-fluid model was verified in two stages. The first stage involves the well-documented NASA MHTB liquid-hydrogen experiments [14] to validate the cryogenic self-pressurization model, specifically by evaluating the pressure and ullage-temperature responses. The second stage utilizes a liquid- CO 2 cargo-tank measurement [15] to verify the liquid-level expansion response of the actual cargo fluid under investigation.

4.1. Liquid-Hydrogen Tank (MHTB)

The MHTB is a ground-based liquid-hydrogen test bed located at NASA Marshall Space Flight Center [14]. The tank is a 5083-aluminum cylinder measuring 3.05 m in diameter and 3.05 m height, closed by 2:1 elliptical dished dome. It has an internal volume of 18.09 m3 and a total internal surface area of 35.74 m2. The vessel is insulated by approximately 3.5 cm of spray-on foam beneath a 45-layer multilayer-insulation (MLI) blanket and enclosed in an environmental shroud that imposes a uniform boundary temperature. The reported experiment campaign spans two heat-leak series and three fill levels. The present validation uses the self-pressurization and mixing segment of the high-heat-leak series at a 90% fill level, for which the measured heat leak was 54.1 W and the ullage contained gaseous hydrogen alone (test segment P263981D).
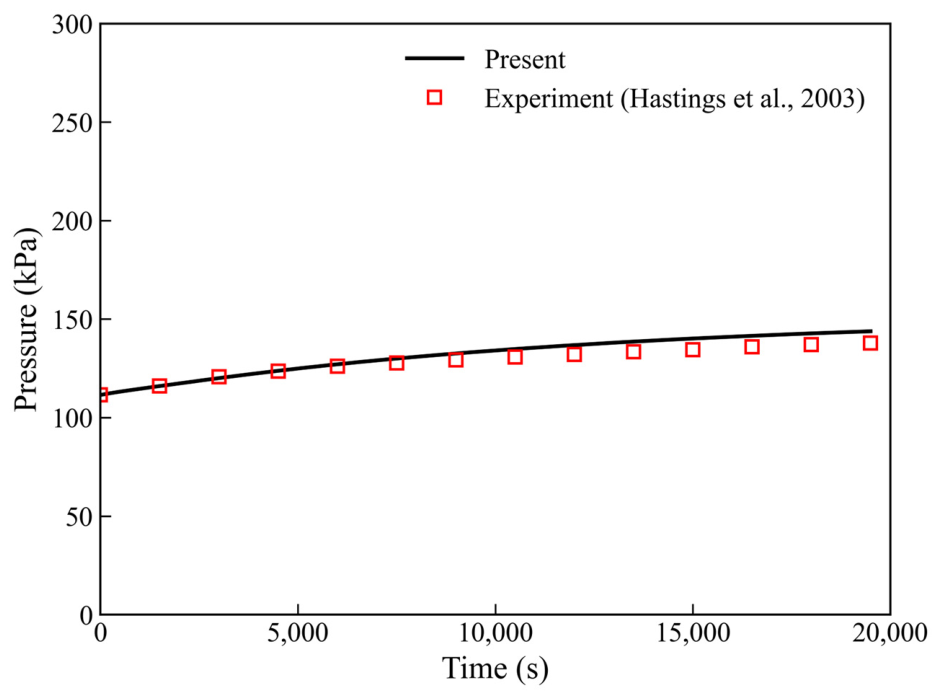
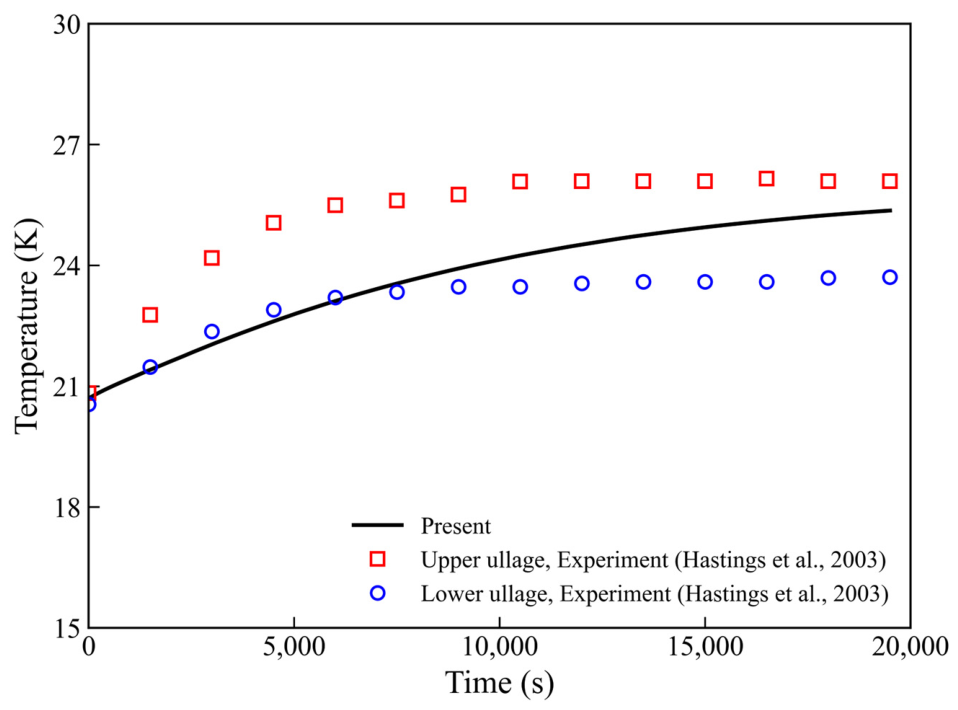
This case was reproduced using the two-node network. Figure 3 compares the computed ullage pressure against the measured history. The model reproduces the pressure rise closely but slightly overpredicts its rate, the same behavior reported for the original NASA analysis of this test, and the root-mean-square (RMS) deviation of the computed pressure from the measurement over this duration is 3.9 kPa, representing approximately 3.0% of the mean. Inherently, a lumped model that treats each phase as perfectly mixed cannot fully capture the thermal stratification and the interfacial heat and mass exchange that develop in a physical tank. Consequently, its absolute self-pressurization rate deviates slightly from the measurement [14]. Figure 4 shows the ullage temperature. The predicted single vapor temperature falls between the measured upper- and lower-ullage thermocouples, as expected for a lumped representation of a stratified ullage, and it departs from the mean of the two thermocouples by an RMS of 0.75 K (1.7 K from the upper and 0.9 K from the lower thermocouples).

4.2. Liquid-CO2 Cargo Tank

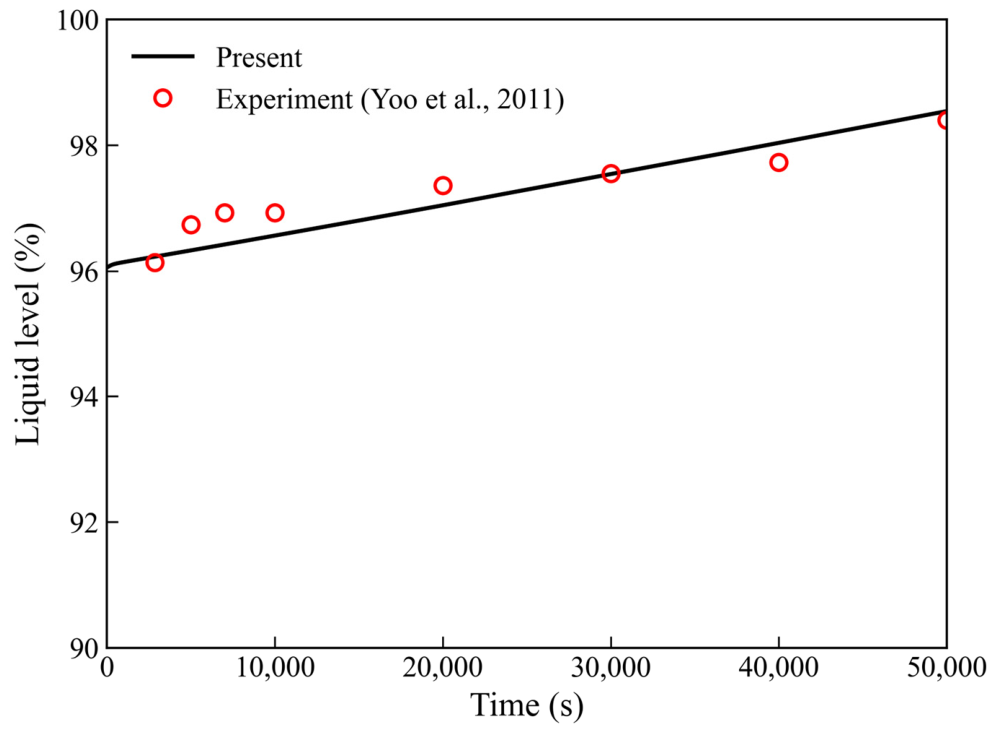
The second validation utilizes data from a liquid-CO2 cargo-tank experiment [15]. The experiment was performed on a vertical stainless-steel pressure tank geometrically similar to the cargo tank of the DSME ECO2 carrier, featuring an internal height of 2450 mm, an internal diameter of 1036 mm, a wall thickness of 18 mm, and a polyurethane-foam insulation thickness of 150 mm. Forty-six temperature sensors installed along the tank depth, together with a pressure transducer, resolved the vertical temperature distribution and the liquid level position. The comparison focuses on the high-fill level condition representative of a laden voyage, in which the tank was locked up at a liquid fraction of 96.04% and 6.82 bar and allowed to self-pressurize for approximately 5 × 10⁴ s under an ambient temperature ranging between 8.8 and 13.8 °C, over which the measured liquid fraction rose to approximately 98.4%.
Figure 5 compares the predicted liquid level against the experimental measurement [15]. As the cargo absorbs heat, the thermal expansion of the liquid causes the liquid level to rise. The computed history follows the measured data points across the entire 5 × 10⁴ s duration, thereby confirming that the model accurately captures the volumetric response of LCO2 governed by the Span–Wagner equation of state. The agreement is quantitative, exhibiting an RMS deviation of 0.31 percentage points (0.3% of the mean level) relative to the eight measured points. Consequently, these two validations strongly support the use of the numerical model for evaluating the thermal performance across different tank orientations.

5. Results and Discussion

5.1. Heat Ingress, Pressurization and Vapor Temperature

The thermal behavior of the two orientations is fundamentally governed by how the fixed internal surface area of the tank is partitioned between wetted wall and vapor–liquid interface. Table 6 lists, for each case, the wetted wall area, which dictates the heat transferred delivered to the liquid, and the free-surface area, which controls the evaporation rate, out of the total internal area of 69.66 m2. At low fill level the horizontal tank wets far more wall surface than the vertical tank (24.6 m2 versus 16.1 m2 at a 20% fill level). The two wetted areas converge to equality near a 50% fill level (34.8 m2 each), and this relationship reverses at 90% (49.4 m2 versus 59.5 m2), which mirrors the crossover observed in the cumulative heat ingress. Furthermore, the free-surface area is three to five times larger for the horizontal orientation across all fill levels (19.7 m2 versus 5.5 m2 at a 20% fill level), explaining why the horizontal tank undergoes evaporation and subsequent boiling far more readily. At a 90% fill level, the free-surface area of the HBT is more than double that of the VBT while the total wall area remains constant; this corresponds to the larger interfacial area mechanism to which Wang and Mérida [11] attributed the slower pressure rise observed in horizontal cylinders. At low fill levels, this redistribution of wetted and interface areas shifts dramatically, meaning that the selected fill levels effectively bracket the practical range of the orientation effect.
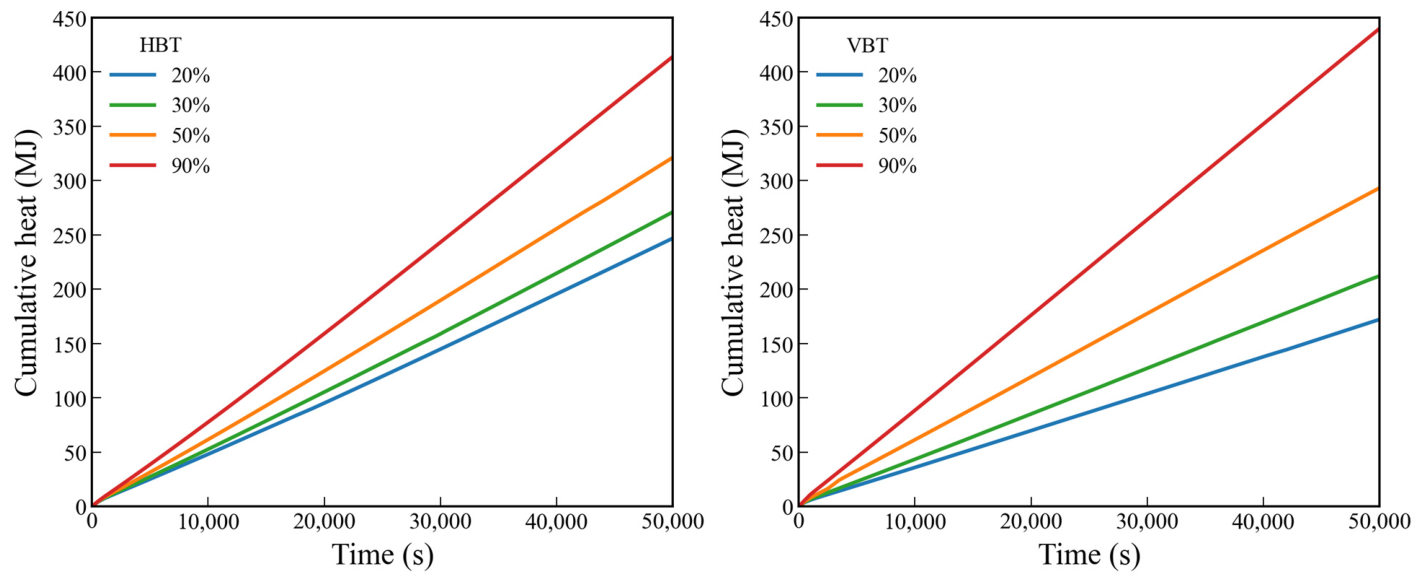
Figure 6 shows the cumulative heat transferred to the cargo over time. In both orientations, the total heat ingress increases monotonically with fill level, as a larger and colder liquid inventory maintains a steeper temperature gradient across the wall. At low and intermediate fill levels, the HBT absorbs significantly more heat than the VBT (247 MJ versus 172 MJ at a 20% fill level, 271 MJ versus 212 MJ at a 30% fill level, and 321 MJ versus 293 MJ at a 50% fill level, evaluated over 5 × 10⁴ s). This discrepancy arises because the shallow liquid layer in the HBT wets a substantially larger fraction of the tank wall area. Conversely, at a 90% fill level, where both orientations are almost fully wetted, the trend reverses with the VBT absorbing slightly more heat than the HBT (440 MJ versus 414 MJ).
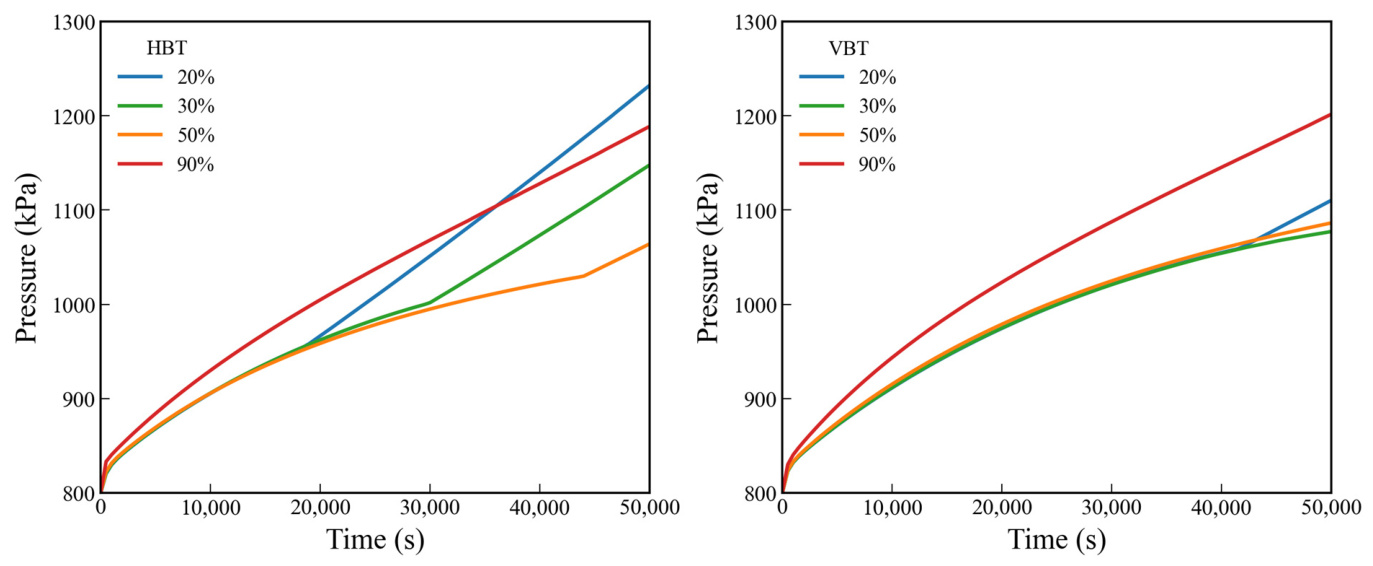
The pressure histories are presented in Figure 7, where two distinct features emerge. First, for the HBT, the pressure curves exhibit a pronounced inflection point, characterized by an initial decelerating rise followed by a sharp steepening, and this onset of slope change occurs progressively earlier at lower fill levels. In contrast, the pressure curves for the VBT increase smoothly throughout the simulation. Second, the rate and magnitude of pressure rise depend strongly on both fill level and orientation. At a low fill level, the final pressure in the HBT is substantially higher (1232 kPa versus 1110 kPa at 20% fill level). The pressure discrepancy between the HBT and VBT progressively narrows across the 30 and 50% fill levels. At a 90% fill level, the ordering reverses, with the final pressure in the VBT being slightly higher than that in the HBT (1202 kPa versus 1189 kPa). Notably, the final pressure in the HBT reaches its minimum near mid-fill level (1064 kPa at a 50% fill level), because bulk boiling initiates only toward the conclusion of the simulation period. Prior to the onset of boiling, the VBT exhibits a higher pressure than the HBT, indicating poorer thermodynamic performance during the sensible heating phase. However, once boiling commences, the relative thermal performance is reversed. While previous studies on single cylindrical tanks suggested that the horizontal orientation is more favorable at low fill levels [10,11], the present findings indicate that these conclusions cannot be directly extended to bi-lobe configurations. This divergence should not be attributed solely to the bi-lobe geometry, because previous studies also differ from the present work regarding working fluids ( LNG and liquid hydrogen versus LCO2), operating and boundary conditions, and fundamental modeling assumptions, such as the non-equilibrium two-node formulation and the Span–Wagner equation of state utilized here. Any of these factors could contribute to the difference in the predicted orientation rankings.
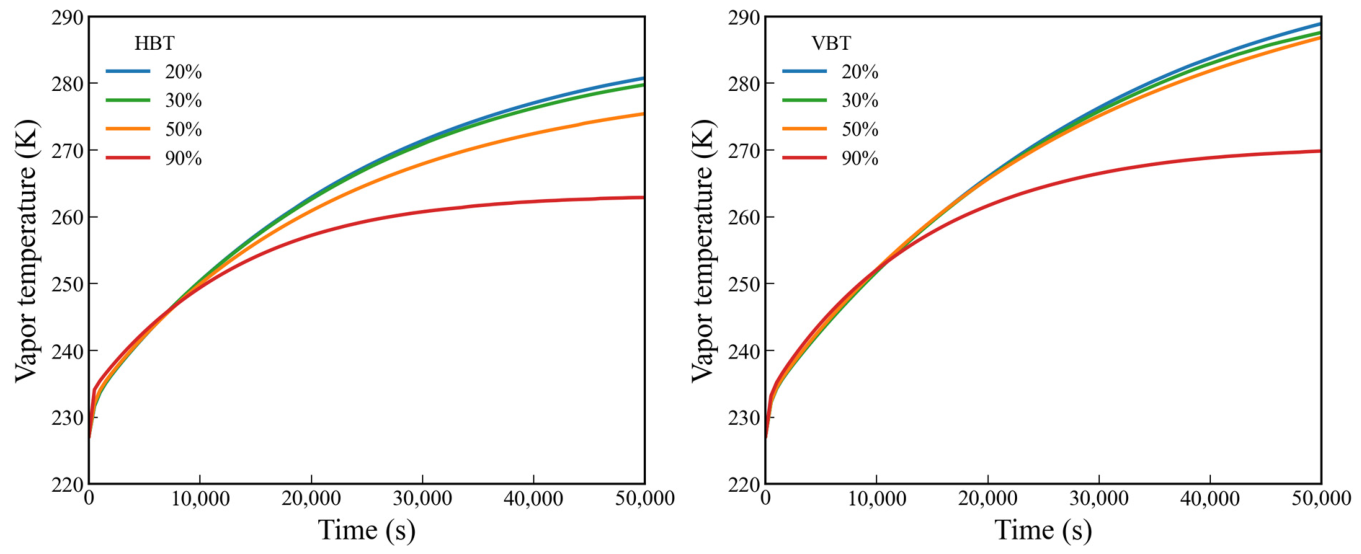
Figure 8 shows the vapor (ullage) temperature histories for the HBT and VBT. Across all fill levels, the vapor temperature exhibits a trend inverse to that the system pressure. Specifically, the vapor in the VBT consistently achieves a higher temperature than in the HBT. The vertical orientation combines a higher vapor temperature with a lower pressure at high fill levels, whereas the horizontal orientation combines a lower vapor temperature with a higher pressure at low fill levels. The key thermodynamic parameters for all eight cases are summarized in Table 7.

5.2. Boiling-Onset Mechanism

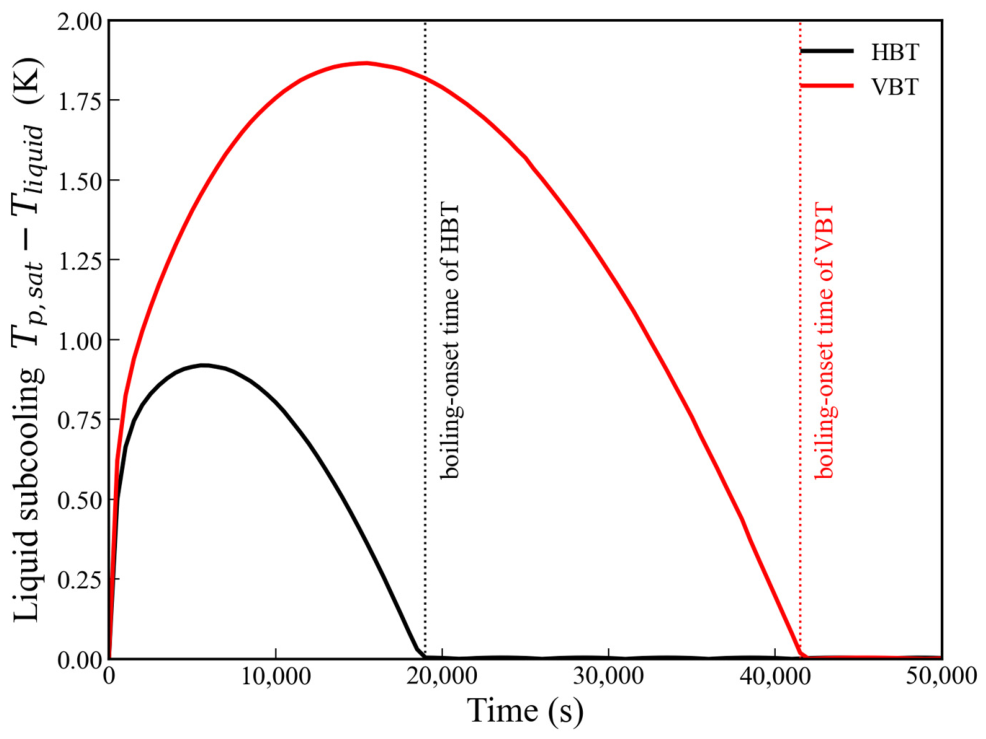
The sudden change in the slope of the pressure curve in the HBT marks a physical regime transition, specifically the onset of boiling in the liquid phase. In the non-equilibrium two-node model, each lump maintains its own independent temperature. Consequently, the liquid may remain subcooled, and the vapor superheated relative to the saturated interface. Figure 9 shows the liquid subcooling degree (Tp,satTl) for the two orientations at a 20% fill level.
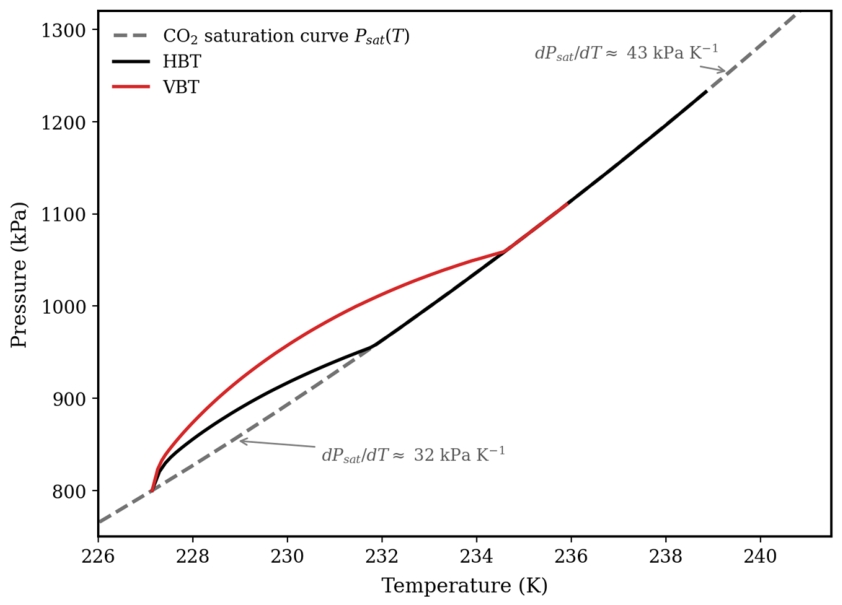
During the initial transient period before the liquid reaches saturation, no net evaporation occurs, and the vapor mass remains constant. The ullage nonetheless pressurizes faster than the liquid warms due to two mechanisms acting on this fixed vapor inventory. First, thermal expansion of the warming liquid reduces the ullage volume and compresses the vapor; second, the dry wall conducts heat directly to the vapor, raising its temperature and pressure. Their relative contributions depend on the filling ratio. At low fill levels, the large ullage volume and extensive dry-wall area make direct vapor heating the dominant mechanism, as evidenced by the vapor superheat of up to 53 K reached in these cases. Conversely, at high fill levels, the small ullage is strongly compressed by even modest liquid expansion; consequently, the volumetric-compression term dominates, generating rapid pressurization with negligible boil-off. The liquid therefore becomes slightly subcooled with respect to the rising saturation temperature (Figure 9), preventing net evaporation from occurring. The tank pressure is dictated by the vapor state. As the wetted wall continues to heat the liquid, this subcooling is gradually diminished. When subcooling reaches zero (indicated by the dotted line in Figure 9), the liquid attains saturation and bulk evaporation commences at the interface. Beyond this point, the system pressure becomes dependent on the liquid saturation state, given by P = Psat(Tl). Because the CO2 saturation curve is strongly convex, the slope (dPsat/dT) rises from approximately 32 to 43 kPa·K−1 between the initial 228 K and the final liquid temperature. (Figure 10) [20]. The steady warming of the liquid is converted into an accelerating pressure rise, which manifests as the change in slope in the HBT pressure curves in Figure 7. The change in curvature therefore represents the boiling-onset point, and the subsequent acceleration stems from the convex saturation curve acting on the saturated liquid phase.
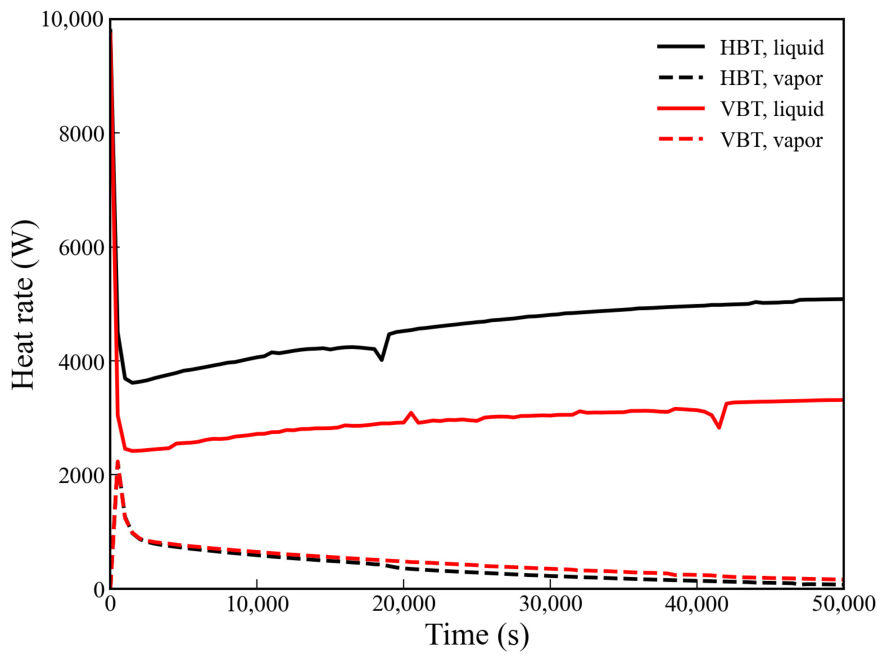
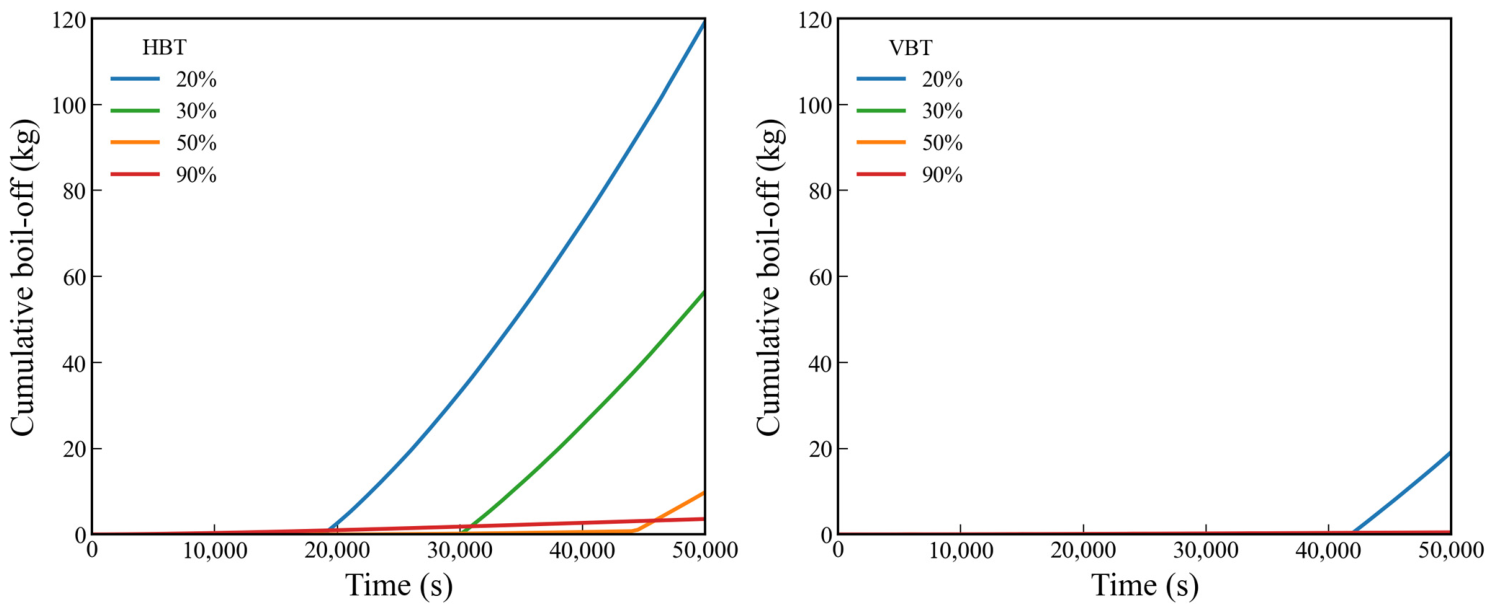
Because the boiling-onset time corresponds to the duration of the required time to warm the liquid from its initial subcooled state to saturation, it is fundamentally governed by the liquid heating rate, d T l / d t = Q l ˙ m ˙ h fg / ( m l c p ) , where hfg is the latent heat of vaporization and cp is the liquid specific heat. Both a lower fill level (smaller ml) and the horizontal orientation (larger wetted wall area, thus a larger Q l ˙ ) accelerate this rate and consequently advance the regime transition. This mechanism is confirmed by a direct comparison of the two orientations at a 20% fill level (Figure 11 and Table 8). In the HBT, 93% of the heat ingress is delivered directly to the liquid (mean Q l ˙ = 4.6 kW). As a result, the liquid reaches saturation at t ≈ 1.9 × 10⁴ s, and 119 kg of vapor is subsequently generated, driving the final pressure to 1232 kPa. In contrast, for the VBT, only 88% of a smaller heat load reaches the liquid (mean Q l ˙ = 3.0 kW). The liquid remains subcooled for more than twice as long, with boiling not initiating until t ≈ 4.2 × 10⁴ s, resulting in only 19 kg of vapor generation, and a final pressure of just 1110 kPa. The heat that does not enter the liquid instead serves to superheat the vapor. Hence the ullage temperature of the VBT reaches 53 K above saturation compared to 42 K for the HBT. This explains why the VBT exhibits a higher vapor temperature despite maintaining a lower system pressure.
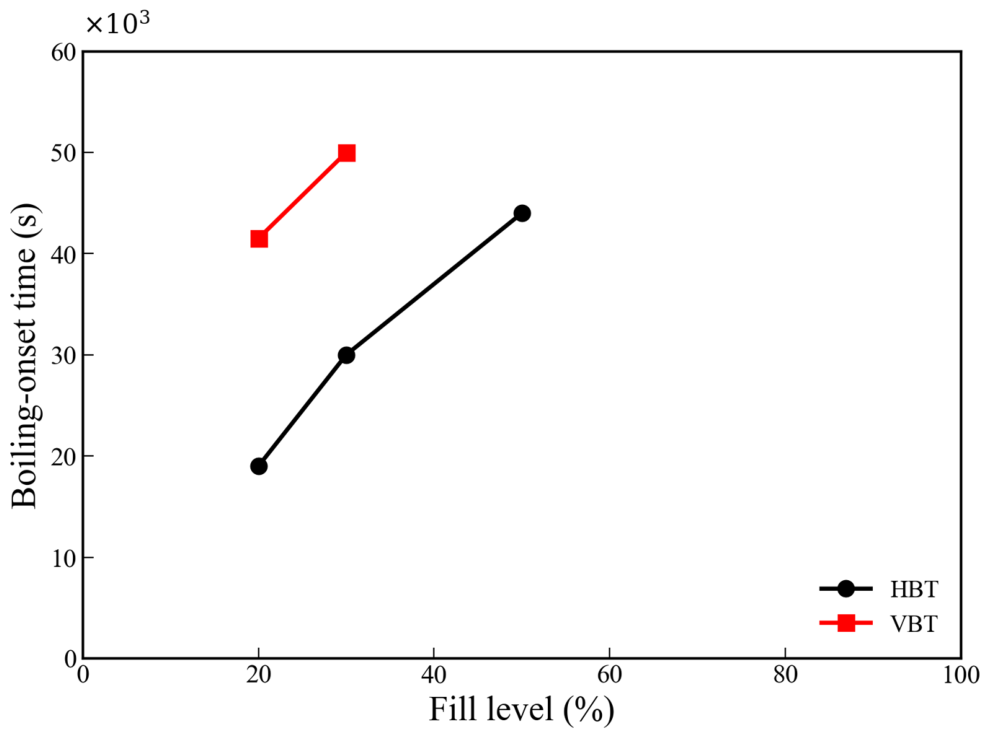
The boiling-onset times for all cases are presented in Figure 12. Across all fill levels, the HBT attains boiling earlier than the VBT. In both orientations, the onset of boiling is delayed as the fill level increases, stretching from the growth of the liquid thermal mass. Specifically, boiling initiates at 1.9 × 10⁴, 3.0 × 10⁴ and 4.4 × 10⁴ s for the HBT at 20, 30 and 50% fill levels, respectively, whereas for the VBT, it begins at 4.2 × 10⁴ and 5.0 × 10⁴ s at 20 and 30% fill levels, respectively. At higher fill level, boiling is not initiated within the total 5 × 10⁴ s simulation period. In these latter cases, the liquid remains subcooled by up to 5 K, and the pressure rises instead via the thermal expansion of the liquid compressing the confined ullage space, thereby reaching high system pressure with negligible boil-off generation.
For a pressure-driven Type C LCO2 tank, the governing design parameter is the system pressure. The orientation that effectively delays the onset of boiling, here the VBT, yields a longer holding time at low fill levels, whereas at high fill levels, the choice between orientations becomes largely neutral. This ranking is opposite to what would be implied by evaluating the vapor temperature alone. It is the thermodynamic state of the liquid phase, rather than the ullage space, that dictates the design pressure limit of the tank.

5.3. Boil-Off Gas Generation

Because the tank is a closed system without ventilation, the boil-off gas generation manifests as a loss of liquid mass (Δml), which is equal and opposite to the vapor mass gained. Following the marine industry convention, it is expressed as a boil-off rate (BOR) in weight percent of the loaded liquid mass per day (wt%/day). Figure 13 shows the cumulative boil-off for the HBT and VBT, and Table 9 lists the corresponding total masses and rates. Notably, the boil-off is essentially confined to the HBT at low fill levels. The HBT loses 119 kg at a 20% fill level (2.51 wt%/day), 57 kg at a 30% fill level (0.79%/day) and 10 kg at a 50% fill level (0.08%/day), whereas the VBT and all 90% case lose only a few kilograms or less (≤0.02 wt%/day). The high-fill cases exhibit minimal boil-off, primarily because their large liquid mass has not yet reached saturation within the simulation period. In prolonged or pressure-controlled operation, the boil-off rate would be directly dictated by the wetted-wall areas given in Table 6. Within the present study, however, the low-fill level condition in the HBT dominates both the pressure rise and the boil-off and is the governing case for the design of a bi-lobed Type C LCO2 tank.

5.4. Limitations and Validity

The cargo is modeled as two perfectly mixed control volumes, a liquid node and a vapor node, which inherently does not resolve internal spatial fields within either phase. It is therefore essential to state clearly which orientation-dependent phenomena the formulation captures and which it does not. The model captures the first-order driver of the orientation effect, namely how gravity partitions the fixed internal surface into a wetted wall that determines the heat delivered to the liquid, and a free surface that governs the evaporation area (Table 6). It also accounts for the energy balance of each phase, the liquid warming rate that determines boiling onset, the non-equilibrium departure of the liquid and vapor from the saturated interface via liquid subcooling and vapor superheat, and the system pressure through thermodynamic saturation coupling. Conversely, it does not capture spatially distributed phenomena within each phase, such as thermal stratification in the liquid and ullage, natural-convection boundary layers along the tank wall, the local distribution of the wall heat-transfer coefficient, the spatial variation in interfacial heat and mass transfer, and free-surface deformation or sloshing.
Two considerations support the validity of this formulation for the orientation comparison. First, the comparison is relative rather than absolute. The two cases employ identical models, mesh resolutions, thermophysical properties, and boundary conditions, differing solely in the direction of gravity. The unresolved interphase phenomena therefore develop in the same manner in both orientations. Specifically, both configurations exhibit a stratified warm ullage and a buoyancy-driven boundary layer along the wetted wall. Consequently, they introduce a systematic bias of similar magnitude that largely cancels out when the horizontal and vertical results are compared. The comparative ranking is instead dictated by the partitioning of wetted and free-surface areas, which the model resolves exactly. Second, the ranking is governed by geometry rather than by the convective closure. Varying the film coefficient scales the heating rates of both orientations proportionally without altering their relative order, because the ratio of heat delivered to the liquid is primarily determined by the ratio of wetted areas (Table 6).
The magnitude of the lumped-model error is bounded by validation against the MHTB experiment, which involves a physical, strongly stratified liquid-hydrogen tank. The two-node model reproduces the experimental self-pressurization rate within an RMS error of 3.9 kPa (approximately 3.0% of the mean) and the ullage temperature within 0.75 K. Because the single predicted vapor temperature falls between the measured upper and lower ullage thermocouple readings, the lumped vapor node effectively captures the vertically averaged response of the stratified ullage. This bounded, systematic error is common to both orientations and therefore does not undermine their relative comparison; furthermore, the predicted trends agree with higher-resolution multi-node and CFD stratification studies of cryogenic tanks [12,13]. Consequently, the two-node formulation is robust for establishing the orientation ranking and the boiling-onset mechanism reported here, even though the absolute self-pressurization magnitudes carry a lumped-model bias. Finally, a spatially resolved CFD analysis that quantifies interphase stratification for each orientation presents a worthwhile direction for future work.
A further limitation concerns the scope of the validation. The model is validated against the MHTB liquid-hydrogen tank and a liquid-CO2 cargo tank, neither of which features a bi-lobe geometry. Consequently, the quantitative results for the bi-lobe configurations should be regarded as predictive and indicative rather than experimentally verified. Nevertheless, the available literature on bi-lobe tanks is qualitatively consistent with the present findings. Specifically, Ye et al. [9] optimized the dimensions of a bi-lobe LNG tank to reduce its boil-off rate, demonstrating that boil-off is highly sensitive to tank geometry. A geometric dependence consistent with that identified here. Direct experimental validation on a bi-lobe Type C tank under representative LCO2 conditions would provide definitive confirmation and is a priority for future work.
The sensitivity of the results to the empirical interfacial heat-transfer coefficient was evaluated by scaling the condensing coefficient of the liquid–vapor interface over a wide range from 0.5 to 20 times its nominal value for the horizontal tank at a 20% fill level. The boiling-onset time remained unchanged within the temporal resolution of the output, and the final pressure varied by only 0.04 kPa (0.003%) across this range. This insensitivity is expected because the aerogel insulation provides the controlling thermal resistance. Consequently, the total heat ingress to the cargo, and thus the liquid warming rate that determines boiling onset, is essentially independent of the interfacial coefficient. The reported trends are therefore robust against uncertainties in this empirical input.
The analysis is carried out for a single tank size. Because the orientation effect originates from how gravity partitions the fixed internal surface into a wetted wall and a free surface, it is primarily geometric and therefore expected to persist across different scales. Increasing the tank size reduces the surface-to-volume ratio. Consequently, the heat ingress per unit liquid mass decreases and the absolute boiling-onset time lengthens, while the relative difference between the horizontal and vertical orientations, dictated by the area partition rather than by absolute scale, remains preserved. Confirming this scaling behavior at an industrial scale is nevertheless a useful direction for future work.

6. Conclusions

A two-node lumped-parameter thermal model was developed for a bi-lobed Type C tank intended for liquefied CO2 transport and used to isolate the geometric effects of tank orientation on heat ingress, self-pressurization and boil-off generation. The bi-lobed tank was generated from a validated single-lobe design by applying the proportioning rule [5], and the numerical model was verified against both the MHTB liquid-hydrogen self-pressurization experiment [14] and a liquid-CO2 cargo-tank measurement [15].
Tank orientation was found to have a first-order effect on the thermal response, with its magnitude depending strongly on fill level. At a 90% fill level, the two orientations are thermodynamically almost equivalent, although the VBT exhibits marginally higher cumulative heat ingress, pressure and vapor temperature. At a 20% fill level, however, the difference becomes highly pronounced. The HBT admits approximately 45% more heat and reaches a higher system pressure, whereas the VBT preferentially superheats the vapor, causing the pressure and temperature rankings between the two orientations to reverse.
The accelerated pressure rise was directly traced to the onset of boiling. The liquid must first warm from a slightly subcooled state to saturation, after which the convex CO2 saturation curve turns its steady warming into an accelerating pressure rise. Both the HBT orientation and a lower fill level drive the liquid to this saturation point sooner. Their pressure increases earlier and faster, generating almost all the boil-off. In contrast, the VBT orientation and higher fill levels maintain the liquid subcooled state for longer durations, resulting in minimal or zero evaporation. For a pressure-driven Type C LCO2 tank, the low-fill level with the HBT is therefore the governing design case, demonstrating that tank orientation becomes a meaningful design lever mainly at low fill levels.

Author Contributions

Conceptualization, D.H. and S.P.; methodology, D.H.; software, D.H.; validation, D.H.; writing—original draft preparation, D.H.; writing—review and editing, S.P.; supervision, S.P. All authors have read and agreed to the published version of the manuscript.

Funding

This research was supported by the Korea Planning & Evaluation Institute of Industrial Technology (KEIT), funded by the Ministry of Trade, Industry and Energy (RS-2024-00432033).

Institutional Review Board Statement

Not applicable.

Informed Consent Statement

Not applicable.

Data Availability Statement

The data presented in this study are available on request from the corresponding author.

Conflicts of Interest

The authors declare no conflicts of interest.

References

  1. Roussanaly, S.; Deng, H.; Skaugen, G.; Gundersen, T. At what pressure shall CO2 be transported by ship? An in-depth cost comparison of 7 and 15 barg shipping. Energies 2021, 14, 5635. [Google Scholar] [CrossRef] [Scilit]
  2. ABS. CO2 Impurities and LCO2 Carrier Design: Practical Considerations; American Bureau of Shipping: Spring, TX, USA, 2024. [Google Scholar]
  3. Seo, Y.; Lee, J. Structural Assessment of an IMO Type C Tank for Liquefied CO2 Storage Under Classification Rule-Based Load Conditions. J. Mar. Sci. Eng. 2026, 14, 821. [Google Scholar] [CrossRef] [Scilit]
  4. ABS. Guidance Notes on Strength Assessment of Independent Type C Tanks; American Bureau of Shipping: Spring, TX, USA, 2022. [Google Scholar]
  5. Senjanović, I.; Mravak, Z.; Slapničar, V.; Gospić, I. Structure Design of Bilobe Cargo Tanks in Liquefied Gas Carriers. Brodogradnja 2002, 50, 323–334. [Google Scholar]
  6. Liu, Y.; Zhou, P.; Jeong, B.; Wang, H. Design and optimization of a type-C tank for liquid hydrogen marine transport. Int. J. Hydrogen Energy 2023, 48, 34885–34896. [Google Scholar] [CrossRef] [Scilit]
  7. Salarkia, M.; Golabi, S.; Amirsalari, B. Optimum Design of Liquified Natural Gas Bi-lobe Tanks using Finite Element, Genetic Algorithm and Neural Network. J. Appl. Comput. Mech. 2020, 6, 862–877. [Google Scholar] [CrossRef] [Scilit]
  8. Saghi, H.; Saghi, R. Numerical simulation of half-full cylindrical and bi-lobed storage tanks against the sloshing phenomenon. Ocean Eng. 2022, 266, 112896. [Google Scholar] [CrossRef] [Scilit]
  9. Ye, C.; Lin, Y.; Yu, Y. Reducing Boil-off Rate for Bi-Lobed Tank on Small-Scale LNG Carrier. In Proceedings of the 29th International Ocean and Polar Engineering Conference (ISOPE), Honolulu, HI, USA, 16–21 June 2019. Paper ISOPE-I-19-254. [Google Scholar]
  10. Sharafian, A.; Herrera, O.E.; Mérida, W. Performance analysis of liquefied natural gas storage tanks in refueling stations. J. Nat. Gas. Sci. Eng. 2016, 36, 496–509. [Google Scholar] [CrossRef] [Scilit]
  11. Wang, Z.; Mérida, W. Thermal performance of cylindrical and spherical liquid hydrogen tanks. Int. J. Hydrogen Energy 2024, 53, 667–683. [Google Scholar] [CrossRef] [Scilit]
  12. Sakowski, B.A.; Hauser, D.M.; Kassemi, M. SINDA/FLUINT and Thermal Desktop Multi-Node Settled and Unsettled Propellant Tank Modeling of Zero Boil Off Test. In Proceedings of the AIAA Propulsion and Energy 2019 Forum, Indianapolis, IN, USA, 19–22 August 2019. Paper AIAA 2019-4281. [Google Scholar]
  13. Wang, X.Y.; Harrison, J.; Noonan, A.; Desai, P.S. Numerical Modeling of Thermal Stratification in Cryogenic Propellant Tanks. In Proceedings of the Thermal and Fluids Analysis Workshop (TFAWS), Galveston, TX, USA, 20–24 August 2018. Paper TFAWS18-CT-04 (GRC-E-DAA-TN60294). [Google Scholar]
  14. Hastings, L.J.; Flachbart, R.H.; Martin, J.J.; Hedayat, A.; Fazah, M.; Lak, T.; Nguyen, H.; Bailey, J.W. Spray Bar Zero-Gravity Vent System for On-Orbit Liquid Hydrogen Storage; NASA/TM-2003-212926; NASA Marshall Space Flight Center: Huntsville, AL, USA, 2003.
  15. Yoo, B.-Y. A Study on the Boil-off Gas Generation and Thermal Behaviour of Liquefied Gas Cargo Tanks. Ph.D. Thesis, Seoul National University, Seoul, Republic of Korea, 2011. [Google Scholar]
  16. Han, D.; Park, S. Numerical Analysis of Re-Liquefaction System for Liquefied CO2. J. Ocean Eng. Technol. 2026, 40, 85–98. [Google Scholar] [CrossRef] [Scilit]
  17. ASM International. Handbook Committee. In Properties and Selection—Irons, Steels, and High-performance Alloys; ASM International: Materials Park, OH, USA, 1990; Volume 1. [Google Scholar]
  18. Cullimore, B.A.; Ring, S.G.; Johnson, D.A. SINDA/FLUINT User’s Manual, Version 6.2; C&R Technologies (ANSYS, Inc.): Boulder, CO, USA, 2020. [Google Scholar]
  19. IMO. International Code for the Construction and Equipment of Ships Carrying Liquefied Gases in Bulk (IGC Code), Resolution MSC.370(93); International Maritime Organization: London, UK, 2014.
  20. Span, R.; Wagner, W. A new equation of state for carbon dioxide covering the fluid region from the triple-point temperature to 1100 K at pressures up to 800 MPa. J. Phys. Chem. Ref. Data 1996, 25, 1509–1596. [Google Scholar] [CrossRef] [Scilit]
  21. Lemmon, E.W.; Huber, M.L.; McLinden, M.O. NIST Standard Reference Database 23: Reference Fluid Thermodynamic and Transport Properties (REFPROP), Version 9.1; National Institute of Standards and Technology: Gaithersburg, MD, USA, 2013.
  22. Ahn, S.; Choi, G.; Park, S. Numerical Investigation of the Phase Change Behavior of Liquefied CO2 in a Type-C Cryogenic Tank. Appl. Sci. 2025, 15, 12586. [Google Scholar] [CrossRef] [Scilit]
  23. Park, S.; Kim, J.; Yang, S.H. Study on the Change in Fluid Dynamic Characteristics Due to the Recess Deck Inside the Drillship Moonpool. J. Offshore Mech. Arct. Eng. 2026, 148, 061402. [Google Scholar] [CrossRef] [Scilit]
Figure 1. Cross-section and principal dimensions of selected bi-lobed Type C cargo tank.
Applsci 16 08738 g001
Figure 2. Surface meshes of the VBT (left) and HBT (right).
Applsci 16 08738 g002
Figure 3. Ullage pressure of the MHTB liquid-hydrogen tank [14].
Applsci 16 08738 g003
Figure 4. Ullage temperature of the MHTB liquid-hydrogen tank [14].
Applsci 16 08738 g004
Figure 5. Liquid level of the liquid-CO2 cargo tank [15].
Applsci 16 08738 g005
Figure 6. Cumulative heat ingress at 20, 30, 50 and 90% fill levels for the HBT (left) and VBT (right) orientations.
Applsci 16 08738 g006
Figure 7. Pressure at 20, 30, 50 and 90% fill levels for the HBT (left) and VBT (right).
Applsci 16 08738 g007
Figure 8. Vapor temperature at 20, 30, 50 and 90% fill levels for the HBT (left) and VBT (right).
Applsci 16 08738 g008
Figure 9. Liquid subcooling (Tp,satTl) for the HBT and VBT at a 20% fill level.
Applsci 16 08738 g009
Figure 10. Liquid state of the HBT and VBT at a 20% fill level on the CO2 saturation curve.
Applsci 16 08738 g010
Figure 11. Heat ingress for the liquid and the vapor of the HBT and VBT at a 20% fill level.
Applsci 16 08738 g011
Figure 12. Boiling-onset time for various fill levels.
Applsci 16 08738 g012
Figure 13. Cumulative boil-off (liquid mass lost) at 20, 30, 50 and 90% fill levels for the HBT (left) and VBT (right).
Applsci 16 08738 g013
Table 1. Principal dimensions of the bi-lobed Type C cargo tank.
ParameterSymbolValue
Lobe internal radiusR1000.00 mm
Lobe half-offsete663.16 mm
Offset ratioe/R0.663160
Lobe half-angleα48.459°
Y-joint half-heightb748.48 mm
Bulkhead height2b1496.96 mm
Overall breadth2(R + e)3326.32 mm
Overall height2R2000 mm
Axial lengthL6770.63 mm
Cross-sectional areaA5.5844 m2
Total internal surface areaAs69.66 m2
Internal volume (CAD)V36.16 m3
Discretized volumeVd35.39 m3
Liquid volume at 90% fill levelVl32.54 m3
Table 2. Radiative properties of the wall surfaces.
SurfaceSolar AbsorptivityInfrared EmissivityAbsorptivity/Emissivity
A240-304, SSPC-SP-10 (inner vessel)0.4500.3501.286
A516-70, urethane paint, white (outer shell)0.2500.9000.278
Table 3. Thermophysical properties of the containment materials.
MaterialConductivity (W/(m·K))Density (kg/m3)Specific Heat (J/(kg·K))
ASTM A516 carbon steel, Grade 70 (outer shell)527800470
Cryogel x201 (insulation)0.05128.1481620
Stainless steel T-304 (inner vessel)14.9637999.49459.63
Table 4. Boundary and initial conditions.
QuantityValue
Ambient air temperature25 °C (298.15 K)
Solar-equivalent radiative sink45 °C (318.15 K)
Initial cargo pressure8 bar (800 kPa)
Initial cargo temperature−45 °C (228.15 K)
Initial statesaturated liquid–vapor equilibrium
Fill levels20, 30, 50 and 90%
OrientationsVBT, HBT
Simulated duration5 × 104 s
Table 5. Grid dependency verification for the horizontal tank at 20% fill level.
Mesh (Fraction)Surface ElementsWetted Area (m2)Dry Area (m2)Free-Surface Area (m2)Steady-State Heat Rate (W)
0.10628224.62945.01319.734not obtained (skewness > 0.999)
0.07719424.63245.02819.7399793
0.05630424.62945.01319.7359792
Table 6. Wetted wall area and free-surface (vapor–liquid interface) area.
CaseWetted Wall Area (m2)Free-Surface Area (m2)
HBT, 20%24.619.7
VBT, 20%16.15.5
HBT, 30%28.321.0
VBT, 30%22.15.5
HBT, 50%34.822.0
VBT, 50%34.84.7
HBT, 90%49.417.5
VBT, 90%59.55.6
Table 7. Thermodynamic parameters for all cases (self-pressurization over 5 × 10⁴ s).
CaseCumulative Heat (MJ)Boiling-Onset Time (103 s)Final Pressure (kPa)Final Vapor Temperature (K)
HBT 20%247191232280.8
VBT 20%172421110288.9
HBT 30%271301148279.8
VBT 30%212501077287.6
HBT 50%321441064275.4
VBT 50%293not reached *1086286.9
HBT 90%414not reached *1189262.9
VBT 90%440not reached *1202269.9
* “Not reached” means the liquid did not attain saturation within the simulated time.
Table 8. Heat ingress and thermodynamic properties for the HBT and VBT at a 20% fill level (self-pressurization over 5 × 10⁴ s).
QuantityHBT, 20%VBT, 20%
Mean heat rate to liquid ( Q l ˙ )4.6 kW3.0 kW
Fraction of heat to liquid93%88%
Cumulative heat ingress247 MJ172 MJ
Maximum liquid subcooling0.9 K1.9 K
Boiling-onset time1.9 × 104 s4.2 × 104 s
Cumulative boil-off (liquid mass lost)119 kg19 kg
Final cargo pressure1232 kPa1110 kPa
Final liquid temperature238.8 K235.9 K
Final vapor temperature280.8 K288.9 K
Final vapor superheat (TvTp,sat)42 K53 K
Table 9. Boil-off generation over 5 × 10⁴ s.
CaseLoaded Liquid Mass (kg)Cumulative Boil-Off (kg)BOR (wt%/Day)
HBT, 20%8195119.22.51
VBT, 20%819519.20.40
HBT, 30%12,29256.50.79
VBT, 30%12,2920.00.00
HBT, 50%20,4879.80.08
VBT, 50%20,4870.10.00
HBT, 90%36,8763.60.02
VBT, 90%36,8760.50.00
Disclaimer/Publisher’s Note: The statements, opinions and data contained in all publications are solely those of the individual author(s) and contributor(s) and not of MDPI and/or the editor(s). MDPI and/or the editor(s) disclaim responsibility for any injury to people or property resulting from any ideas, methods, instructions or products referred to in the content.