Article

A Rolling Bearing Fault Diagnosis Method Based on S-LE-EGWO Jointly Optimizing VMD, MCKD and SVM

School of Mechanical and Electrical Engineering, Changchun University of Technology, Changchun 130012, China
*
Author to whom correspondence should be addressed.
Appl. Sci. 2026, 16(17), 8631; https://doi.org/10.3390/app16178631
Submission received: 6 August 2026 / Revised: 26 August 2026 / Accepted: 27 August 2026 / Published: 30 August 2026

Abstract

To overcome the nonlinear and non-stationary characteristics of rolling bearing vibration signals and the challenge of extracting incipient weak fault features, this paper proposes a joint fault diagnosis method based on Variational Mode Decomposition (VMD), Maximum Correlated Kurtosis Deconvolution (MCKD) and Support Vector Machine (SVM). Different from most existing studies that separately optimize individual stages of the fault diagnosis workflow, the proposed method adopts a multi-strategy enhanced grey wolf algorithm (S-LE-EGWO) to collaboratively tune parameters for multiple key modules within a unified framework. Firstly, taking the minimum envelope entropy as the fitness function, the S-LE-EGWO algorithm is utilized to optimize the mode number K and penalty factor α of VMD to realize adaptive decomposition of vibration signals. Secondly, kurtosis combined with the correlation coefficient is adopted to select effective. Intrinsic Mode Function (IMF), and the signal is reconstructed based on the screened components. Then, the S-LE-EGWO algorithm is employed to optimize the parameters of MCKD to realize effective extraction of periodic fault impulses. Finally, multi-dimensional fault features are extracted, dimension-reduced by Kernel Principal Component Analysis (KPCA), and fed into the optimized SVM classifier to complete fault identification. Feature-oriented mechanism analysis is carried out using simulation signals, and the proposed method is validated on the CWRU rolling-bearing dataset, with comparative investigations against four mainstream optimization-based diagnostic algorithms. The test results show that the proposed method can effectively mine weak fault features of bearings. Compared with other algorithms, the presented method achieves superior identification performance and possesses favorable recognition capability for incipient weak faults, which can realize the classification of bearing faults.

1. Introduction

As a critical rotating support component in mechanical systems, rolling bearings play an important role in various fields such as intelligent manufacturing, aerospace, and wind turbine transmission systems. Vibration signals of rolling bearings exhibit nonlinear and non-stationary characteristics. In addition, due to their long-term operation under noisy and complex working conditions, the bearing signals are easily masked by background noise and are prone to various faults such as surface cracks, wear, and pitting. These faults not only affect the normal operation of the equipment but may also lead to production interruptions, reduced efficiency, and even safety accidents [1,2]. Therefore, it is of considerable engineering value and practical significance to investigate weak fault feature enhancement and precise identification methods for rolling bearings under strong background noise, which can contribute to reducing equipment operation and maintenance costs and preventing safety accidents.
Vibration signal analysis is currently the most widely adopted method for bearing fault diagnosis. Extensive efforts have been devoted by both domestic and international scholars to addressing key issues in this field, including fault feature extraction, algorithm optimization, and pattern recognition. Measured vibration signals of rolling bearings often contain substantial irrelevant background noise and exhibit coupled multi-frequency components, which necessitate preprocessing through decomposition and denoising to effectively separate fault impact components from interfering components [3]. To meet the demands of noise reduction and fault feature separation for bearing vibration signals, a variety of time-frequency analysis and adaptive decomposition methods have been developed in existing studies. Wavelet transform (WT) is widely used for signal denoising owing to its joint time-frequency analysis capability; however, it lacks adaptive decomposition properties, and its decomposition performance depends on the manual presetting of wavelet basis functions and coefficient thresholds, which limits its applicability to strongly non-stationary and multi-component coupled fault impulse signals [4]. Empirical mode decomposition (EMD) can adaptively decompose vibration signals into intrinsic oscillatory components without the need for a pre-specified decomposition basis; however, it suffers from drawbacks such as mode mixing and end effects [5]. To address this issue, various noise-assisted improved algorithms have been successively proposed, including Ensemble Empirical Mode Decomposition (EEMD), Complementary Ensemble Empirical Mode Decomposition (CEEMD), and Complete Ensemble Empirical Mode Decomposition with Adaptive Noise(CEEMDAN), along with other derived methods such as Fast Ensemble Empirical Mode Decomposition (FEEMD)and Fast Multivariate Decomposition (FMD). However, these approaches can only slightly alleviate mode mixing and are unable to fundamentally eliminate the inherent deficiencies. Moreover, they suffer from drawbacks such as high computational cost, a lack of rigorous mathematical foundation, and residual noise in the reconstructed signal [6]. Although Local Mean Decomposition (LMD) can preserve more amplitude information in the frequency domain, it remains sensitive to noise and computationally intensive, and thus still struggles to effectively avoid mode mixing [7]. In response to the limitations of the aforementioned methods, Variational Mode Decomposition (VMD) was proposed, which inherently overcomes the problems of mode mixing and end effects, is supported by a rigorous mathematical framework, and exhibits superior performance in bearing fault feature extraction and fault diagnosis [8]. However, the decomposition performance of VMD is heavily dependent on the selection of the mode number K and the quadratic penalty factor α . The traditional empirical parameter selection approach lacks adaptability, and when applied to vibration signals under varying operating conditions and different damage severities, it tends to suffer from over-decomposition or under-decomposition, which directly compromises the accuracy of subsequent fault feature extraction.
To address the difficulty in adaptive parameter selection of VMD, numerous scholars have introduced swarm intelligence optimization algorithms into the parameter optimization process, using indicators such as envelope entropy and kurtosis as fitness functions to automatically search for the optimal parameter combination. Zhou et al. [9] employed the Moth-Flame Optimization (MFO) algorithm to adaptively search for the optimal combination of the VMD mode number K and the penalty factor α , and combined it with improved Generalized Multiscale Fuzzy Entropy (GMFE) to construct a feature set, thereby improving the fault identification accuracy. Ma et al. [10] utilized the RIME algorithm to adaptively optimize the VMD parameters, significantly improving the parameter search efficiency. Chen et al. [11] proposed the IDBO-VMD method based on an improved Dung Beetle Optimizer (IDBO), achieving excellent diagnostic accuracy on the multi-damage hybrid dataset. Zhou et al. [12] integrated the advantages of the Whale Optimization Algorithm (WOA) and the Grey Wolf Optimizer (GWO) to optimize both the VMD parameters and the Support Vector Machine(SVM) hyperparameters, achieving high-accuracy bearing fault diagnosis on both public benchmark datasets and measured field data. However, most existing studies focus solely on parameter optimization at the single stage of VMD. After VMD decomposition and reconstruction, the fault impulse features remain insufficiently prominent under strong background noise, necessitating further feature enhancement.
To further enhance the periodic fault impulse components masked by strong noise, McDonald et al. proposed the Maximum Correlated Kurtosis Deconvolution (MCKD) method. This method iteratively optimizes the filter coefficients to maximize the correlated kurtosis of the signal, thereby effectively highlighting periodic fault pulses. It has demonstrated excellent performance in enhancing weak fault features of bearings [13]. Ke et al. [14] integrated an improved optimization strategy with MCKD, achieving accurate diagnosis of weak vibration faults in electronic equipment and bearings under strong noise conditions. Li et al. [15] improved the extraction accuracy of bearing fault features by optimizing the filter length and shift parameter of MCKD. Li et al. [16] employed the Dung Beetle Optimizer (DBO) to adaptively determine the optimal filter length and shift order of the MCKD method. Although MCKD demonstrates significant advantages in noise reduction and highlighting periodic fault impulses, its parameter selection still relies on prior knowledge and requires manual setting.
In recent years, shallow machine learning models, particularly SVM, have been widely applied to intelligent fault recognition tasks for rolling bearings. Zhang et al. [17] constructed a fault feature set based on Refined Composite Multiscale Dispersion Entropy (RCMDE) and optimized SVM using the WOA, thereby realizing effective multi-class bearing fault identification. Wang et al. [18] optimized the parameters of SVM using the WOA algorithm and constructed a WOA-SVM optimization model, achieving accurate classification and diagnosis of fault signals. Qiao et al. [19] introduced the Quantum Genetic Algorithm (QGA) to adaptively optimize the penalty factor and kernel parameters of SVM, effectively improving the classification and prediction performance of bearing fault diagnosis. Most existing SVM-based methods only optimize the classifier parameters in isolation, without achieving integrated collaborative optimization of front-end signal decomposition, feature extraction, and back-end classification model, leaving room for further improvement in fault identification performance. While data-driven bearing fault diagnosis methods have achieved high classification accuracy, most deep models remain black boxes in real-world industrial deployment, leading to insufficient interpretability. Recently, Explainable Artificial Intelligence (XAI) has emerged as a research hotspot to tackle this challenge, with the goal of improving the transparency of diagnostic decisions in rotating machinery monitoring [20].
To address the above issues, this paper proposes a novel integrated bearing fault diagnosis method that synergistically optimizes the entire set of parameters of VMD, MCKD, and SVM using the improved grey wolf optimizer (S-LE-EGWO), while incorporating KPCA for nonlinear feature dimensionality reduction.
This paper improves the GWO by applying the Sobol sequence to the population initialization of the three leading wolves, namely α , β and δ . Moreover, the Electric Eel Foraging Optimization (EEFO) algorithm is further incorporated to adjust the convergence factor, combined with Lévy flight and an improved weighting of the Euclidean distance of step sizes, forming a hybrid algorithm that accelerates convergence and prevents falling into local optima. The main contributions of this paper are as follows:
(1)
Propose an improved GWO, namely S-LE-EGWO, which employs multiple optimization strategies to overcome the inherent shortcomings of standard GWO, including premature convergence and insufficient optimization accuracy.
(2)
Design the S-LE-EGWO algorithm to synergistically optimize the two-stage signal processing parameters of VMD and MCKD, thereby achieving dual enhancement of vibration signal denoising and fault impulse highlighting.
(3)
Integrate KPCA feature dimensionality reduction with the S-LE-EGWO-SVM classification model to construct an integrated intelligent diagnosis framework for multiple bearing faults.
The remainder of this paper is organized as follows: Section 2 systematically introduces the basic theories of VMD, GWO, SVM, etc., elaborates on the principle of the proposed S-LE-EGWO multi-strategy improved algorithm and its parameter optimization mechanism, providing theoretical support for the subsequent establishment of the fault diagnosis model. Section 3 presents the joint optimization fault diagnosis method based on S-LE-EGWO. In Section 4, experiments on rolling bearing fault diagnosis are used for verification. Section 5 summarizes the research content of the full paper.

2. Materials and Methods

2.1. VMD

The VMD method decomposes the original signal into K groups of band-limited amplitude-modulated and frequency-modulated modal components u k ( t ) , and its mathematical expression is as follows:
u k ( t ) = A k ( t ) cos ( φ k ( t ) )
where A k ( t ) 0 denotes the instantaneous amplitude of the modal component; ϕ k ( t ) denotes a monotonically increasing phase function, and both the amplitude and the instantaneous frequency exhibit slowly varying characteristics over time.
The algorithm constructs the analytic signal corresponding to each mode by means of the Hilbert transform, quantitatively calculates the modal bandwidth via the L2 norm of the gradient of the analytic signal, and thereby builds a constrained variational optimization mathematical model.
min { u k } , { ω k } k t δ ( t ) + j π   t u k ( t ) e j ω k t 2 2                                                                 s . t .     k = 1 K u k = f ( t )
where u k ( t ) denotes the Intrinsic Mode Function (IMF) components obtained by VMD decomposition, ω k denotes the center frequency of each IMF component, and δ ( t ) is the impulse function.
To solve this optimization problem, the study introduces the quadratic penalty coefficient and Lagrange multipliers to construct the augmented Lagrangian function, and relies on the alternating direction method of multipliers to perform alternating iterative optimization of modal components and center frequencies in the frequency domain. The complete mathematical derivation, iterative update rules, and convergence proof can be referred to the original public literature on VMD [21].

2.2. Multi-Strategy Enhanced Grey Wolf Optimizer (S-LE-EGWO)

The GWO is a swarm intelligence optimization method proposed by Mirjalili et al., which is constructed based on the hunting behavior of wolf packs [22]. The algorithm divides the population individuals according to the social hierarchy of wolf packs, with the three types of dominant individuals α , β and δ and leading the global optimization, and completes the optimal solution search through a three-stage iterative mechanism of encircling, chasing, and attacking prey. The specific steps are as follows:
D = C X p t X t
X t + 1 = X p t A D
where X denotes the position of the grey wolf, t is the current iteration number, X p denotes the position of the prey, and D denotes the distance between the grey wolf and the prey.
The coefficient vectors A and C are the core regulatory parameters of the algorithm, and are calculated as follows:
A = 2 a r 1 a
C = 2 r 2
where r 1 and r 2 are random numbers uniformly distributed in the interval [0, 1]; the parameter a is the convergence factor, which serves as a key variable for balancing the global exploration and local exploitation capabilities of the algorithm, and its value linearly decreases from 2 to 0 over the course of iterations. The calculation formula is given as follows:
a = 2 2 t t max
All ordinary grey wolves update their positions based on the coordinates of the α , β and δ wolves, by first calculating the distances from each individual to the three leader wolves using Equations (8)–(10).
D α = C 1 X α X
D β = C 2 X β X
D δ = C 3 X δ X
where C 1 , C 2 and C 3 are random vectors, and X is the position of the current grey wolf.
Combined with the distance values, the updated position coordinates of the grey wolves are obtained using Equations (11)–(14).
X 1 = X α A 1 ( D α )
X 2 = X β A 2 ( D β )
X 3 = X δ A 3 ( D δ )
X ( t + 1 ) = X 1 + X 2 + X 3 3
To address the drawbacks of the traditional GWO, which suffers from population aggregation and premature convergence, and shows poor stability when processing multi-dimensional and noise-contaminated signals in multi-parameter joint optimization scenarios, this study proposes an improved algorithm to satisfy the adaptive parameter-optimization requirements of VMD, MCKD, and SVM. Therefore, multi-strategy improvements and optimizations are conducted in this paper. The specific steps are as follows:
Step 1: The population is initialized using the Sobol sequence
The Sobol sequence is a non-overlapping, low-discrepancy method for generating sequences using random numbers, which is used to produce uniformly distributed sample points in a multi-dimensional search space [23]. Let the search range of the global solution be [ l b , u b ] . With the random numbers generated by the Sobol sequence S i [ 0 , 1 ] , the initial population positions are expressed as follows:
X n = l b + S i u b l b
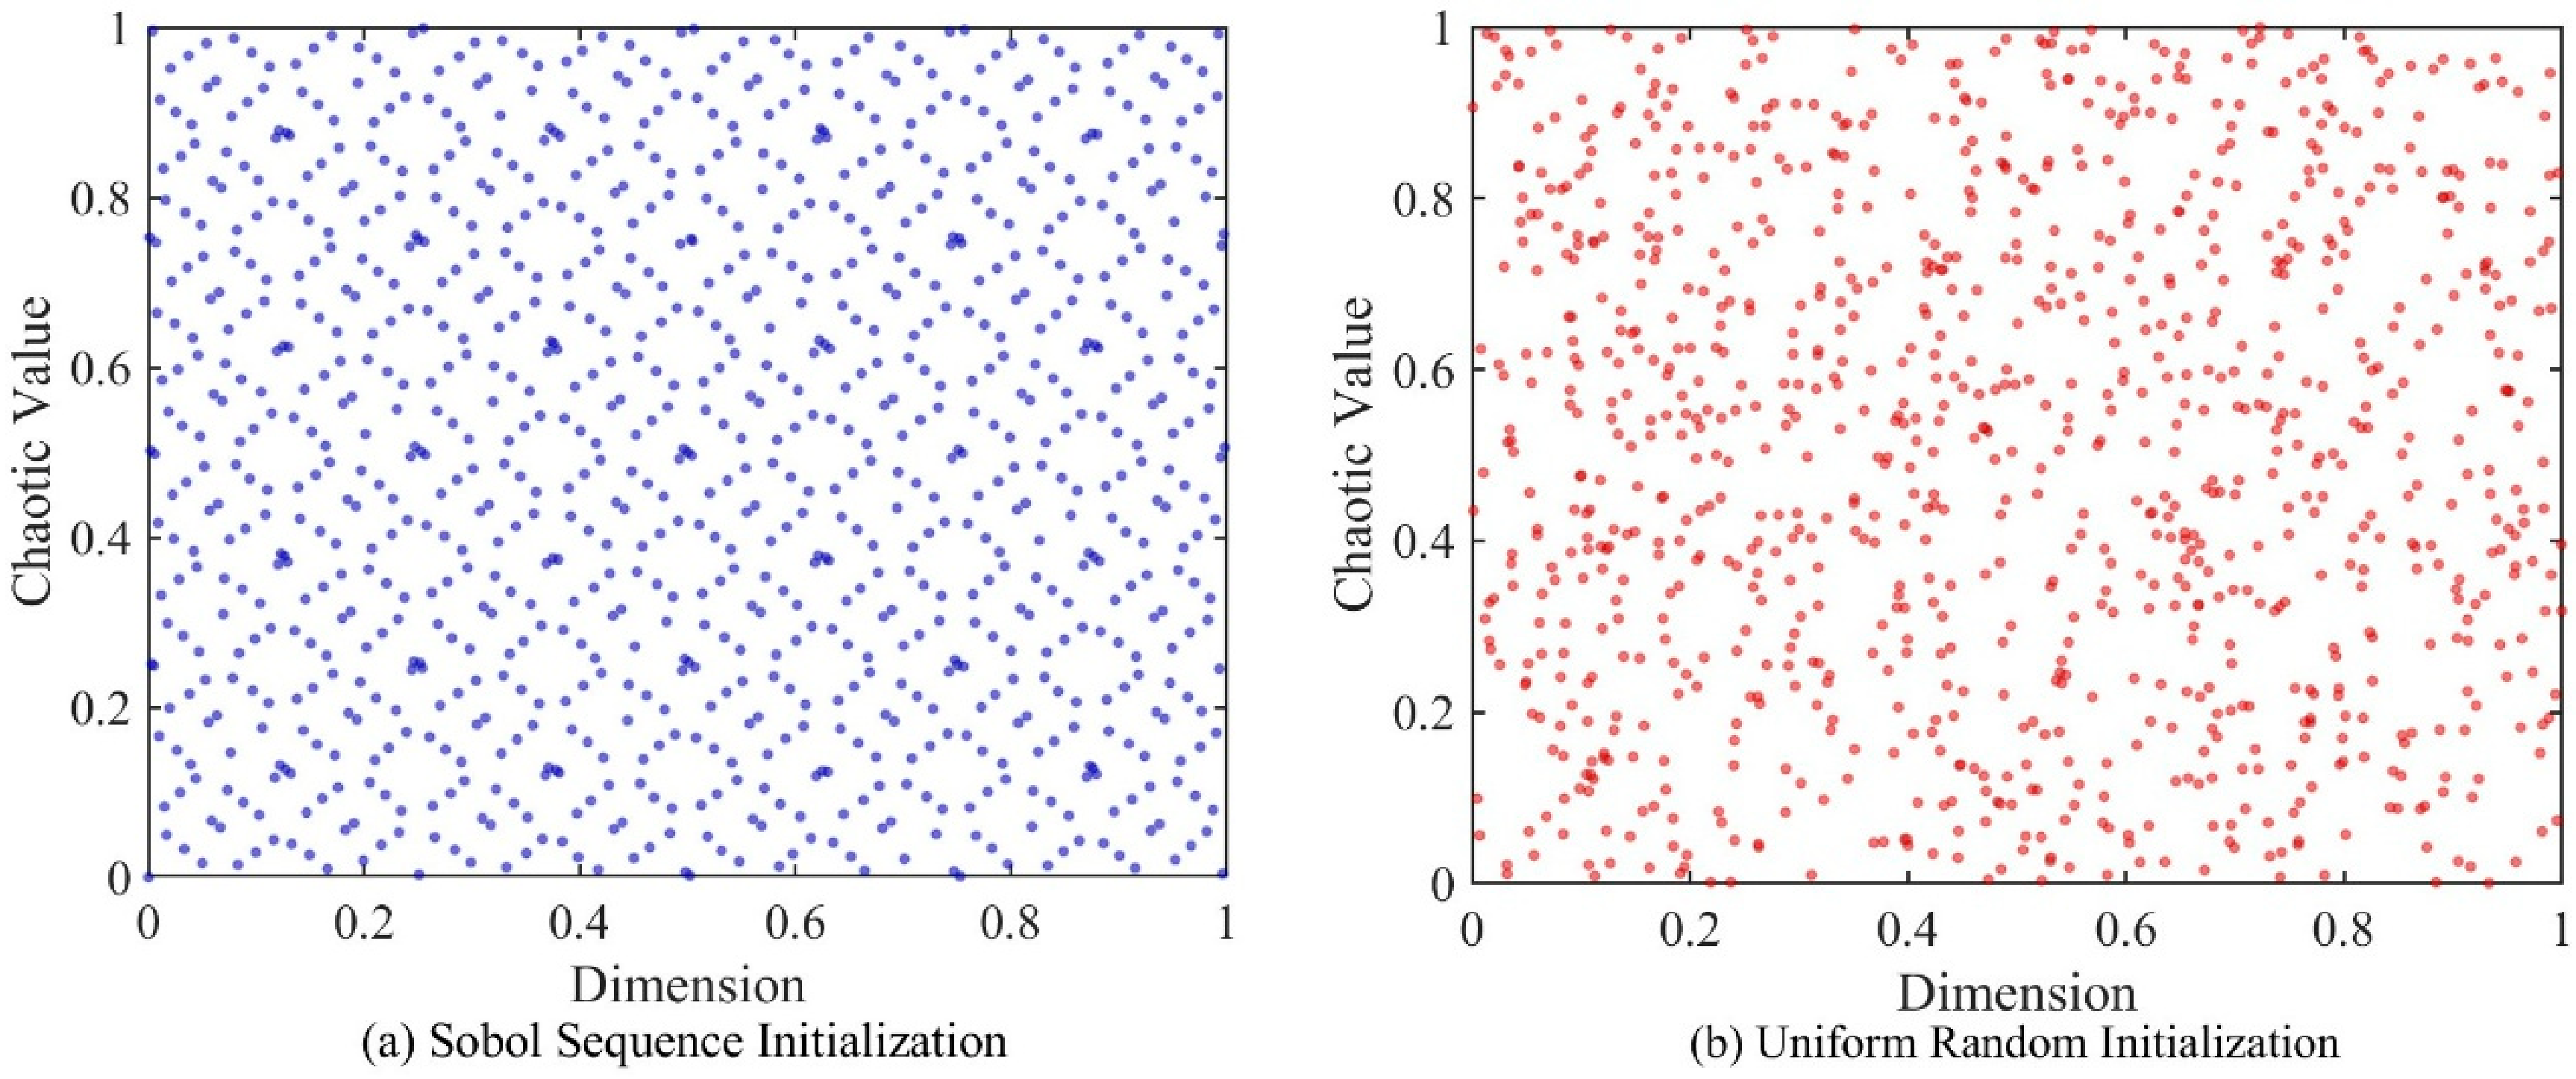
With the dimension set to 9 and the population size to 1000, Figure 1 visually illustrates the difference in initialization distribution between the Sobol sequence and the random method. Compared with the random method that tends to produce empty regions and clustering effects, the Sobol sequence initialization yields a comparable number of individuals within the search space and can enhance the uniformity of the initial population distribution.
Step 2: A nonlinear convergence factor is introduced
The EEFO algorithm [24] exhibits excellent global search and convergence properties, and its resting behavior can effectively balance the global exploration and local exploitation capabilities of the algorithm. In this paper, the convergence factor of the GWO is reconstructed by drawing on the resting mechanism of EEFO, so as to improve the convergence speed and optimization accuracy of GWO.
The resting area is formulated as follows:
X X Z t α 0 × Z t x prey t
α 0 = 2 e e t T
where X p r e y is the position vector of the optimal solution obtained so far, a 0 is the initial scale of the resting area.
The formula for selecting the resting position is as follows:
R i t + 1 = Z t + α × Z t x p r e y ( t )
α = α 0 sin 2 π r 2
where a is the scale of the resting area, and r 2 is a random number in (0, 1).
The resting position mechanism from the EEFO algorithm is introduced into the GWO, and the corresponding formula is expressed as follows:
a = 2 e e t t max × sin 2 π r 2
Step 3: A position update perturbation based on Lévy flight is introduced
To enhance the global search capability of the algorithm, this paper draws on the Lévy flight mechanism from the EEFO algorithm—originally designed to simulate the migratory behavior of electric eels—and incorporates it into the position update process of individual grey wolves. Through random perturbations, this mechanism disrupts the homogeneous state of the population, thereby improving population diversity and strengthening the ability to escape local optima.
EEFO employs the following formulas to characterize the migratory movement of electric eels from the resting area to the hunting area:
ν i t + 1 = γ 5 × R i t + 1 + γ 6 × H γ t + 1 L × H γ t + 1 x i t
H γ t + 1 = x p r e y t + β × x ¯ t x p r e y t
where H r can be regarded as an arbitrary position within the hunting area, r 5 and r 6 are random numbers in (0, 1). H γ t + 1 x i t denotes the movement of the eel toward the hunting area, and L is the Lévy flight function.
To incorporate the aforementioned Lévy flight term L into the original three-head wolf weighted position update formula of GWO, a random perturbation is imposed on the grey wolf position. The improved position iteration formula is given as follows:
X ( t + 1 ) = X 1 + X 2 + X 3 3 + L
Step 4: A weight improvement for the step length based on Euclidean distance is introduced
The traditional GWO assigns fixed weights to the α , β and δ wolves, while neglecting the spatial distance differences between ordinary wolves and the leader wolves, and thus cannot dynamically adjust the balance between exploration and exploitation during the iterative process. This may lead to search imbalance and reduced convergence performance. To address this issue, this paper constructs a dynamic adaptive weight allocation strategy based on the proportion of Euclidean distance differences between each individual wolf and the three leader wolves.
This mechanism can automatically assign learning weights according to spatial distance: individuals in close proximity are assigned higher weights to accelerate local convergence, while those farther away maintain stronger global exploration capability. In this way, the algorithm achieves a balanced trade-off between exploration and exploitation, thereby enhancing optimization accuracy, convergence speed, and algorithmic generality, while also mitigating the issue of local optima [25].
d 12 = k = 1 n x 1 k x 2 k 2
The Euclidean distances between the ω wolf and the three leader wolves ( α , β and δ ) are given as follows:
d ω α = k = 1 n x α k x ω k 2
d ω β = k = 1 n x β k x ω k 2
d ω δ = k = 1 n x δ k x ω k 2
The relative value of the difference between the maximum and average Euclidean distances between the ω wolf and the three leader wolves ( α , β and δ ) is calculated as:
λ ω α = d ω α max d ω α media d ω α max
λ ω β = d ω β max d ω β media d ω β max
λ ω δ = d ω δ max d ω δ media d ω δ max
The weights of the step lengths based on Euclidean distances between the ω wolf and the three leader wolves ( α , β and δ ) are set as follows:
W 1 = λ ω α λ ω α + λ ω β + λ ω δ
W 2 = λ ω β λ ω α + λ ω β + λ ω δ
W 3 = λ ω δ λ ω α + λ ω β + λ ω δ
The final position update formula for the grey wolves is expressed as follows:
X ( t + 1 ) = W 1 X 1 + W 2 X 2 + W 3 X 3 3 + L

2.3. Parameter Optimization of VMD Based on S-LE-EGWO

The decomposition performance of VMD is highly dependent on two preset parameters: the number of intrinsic mode components K and the quadratic penalty factor α .The mode number K determines the number of decomposed components. Too small α value may lead to under-decomposition, making it difficult to effectively separate multi-scale fault features within α single component; too large α value may result in over-decomposition and generate spurious modal components. The penalty factor α controls the bandwidth range of each mode. If set too high, it may filter out weak fault impact signatures; if set too low, it may provide insufficient noise reduction capability, thereby degrading the signal-to-noise ratio (SNR) of the modal components [26,27].
The values of K and α are often determined based on empirical values from the literature or manual experience, which makes the parameter selection lack adaptability. Consequently, the method exhibits limited adaptability to bearing vibration signals under varying operating conditions and different damage severities, and it is difficult to guarantee stable decomposition results. To address these issues, the S-LE-EGWO algorithm is adopted in this paper to perform global optimization on the two core parameters of VMD, thereby achieving adaptive parameter matching and avoiding the subjectivity and limitations associated with manual selection.
The fitness function determines the optimization direction and the decomposition performance of VMD. Bearing damage generates periodic impulse signals, and the envelope of a clean fault component exhibits strong regularity. Envelope entropy is used to quantify the significance of impulse features in the signal: the lower the entropy, the more prominent the periodic impulse characteristics; the higher the entropy, the more severely the fault information is masked by noise [28].
Based on the above characteristics, this paper adopts the minimum envelope entropy (MEE) as the fitness function for the S-LE-EGWO-based optimization of VMD. During the iterative process of the algorithm, the minimum envelope entropy of the decomposed IMF components is taken as the optimization objective, guiding the population to search for the optimal parameter combination ( [ K , α ] ), thereby ensuring that the resulting modal components can maximize the prominence of fault impulses while suppressing background noise interference.
Nevertheless, low envelope entropy alone cannot absolutely guarantee that a single IMF corresponds to the real fault-related component, since interference-dominated components may also produce small entropy values under certain signal conditions. Therefore, parameter optimisation guided by MEE and subsequent IMF screening are treated as two sequential steps in this study. The MEE-driven optimisation aims to obtain appropriate VMD decomposition parameters and output a set of candidate IMFs with good sparsity. After VMD decomposition, kurtosis and correlation coefficient are further introduced to perform secondary screening, so as to identify the final fault-sensitive IMF from these candidate components.
Let the modal component obtained by VMD decomposition be denoted as x ( n ) , the total signal length be N , and the calculation of its envelope entropy consists of the following three steps:
Step 1: The Hilbert envelope signal is calculated
The Hilbert transform is applied to the modal component x ( n ) to construct the corresponding analytic signal:
x ˜ ( n ) = x ( n ) + j H [ x ( n ) ]
where H [ ] denotes the Hilbert transform operator. The instantaneous envelope signal a ( n ) of the component is obtained by taking the modulus of the analytic signal:
a ( n ) = x ˜ ( n ) = x 2 ( n ) + H 2 [ x ( n ) ]
Step 2: The envelope signal is normalized
The envelope signal is normalized so as to satisfy the summation constraint of a probability distribution, and the normalized envelope sequence P ( n ) is obtained.
p ( n ) = a ( n ) n = 1 N a ( n )
After normalization, the sequence satisfies the condition that n = 1 N p ( n ) = 1 , and thus it can be equivalently regarded as the probability distribution sequence of the envelope signal.
Step 3: The envelope entropy is numerically calculated
According to the definition of Shannon entropy, the envelope entropy E of the modal component is calculated as follows:
E e = n = 1 N p ( n ) ln p ( n )
During the iterative process of S-LE-EGWO, the VMD decomposition results corresponding to each set of parameters [ K , α ] are substituted into the above formula to calculate the envelope entropy. The minimum envelope entropy is taken as the fitness evaluation criterion, and the parameter combination that yields the minimum fitness value is finally output as the optimal decomposition parameters for VMD.
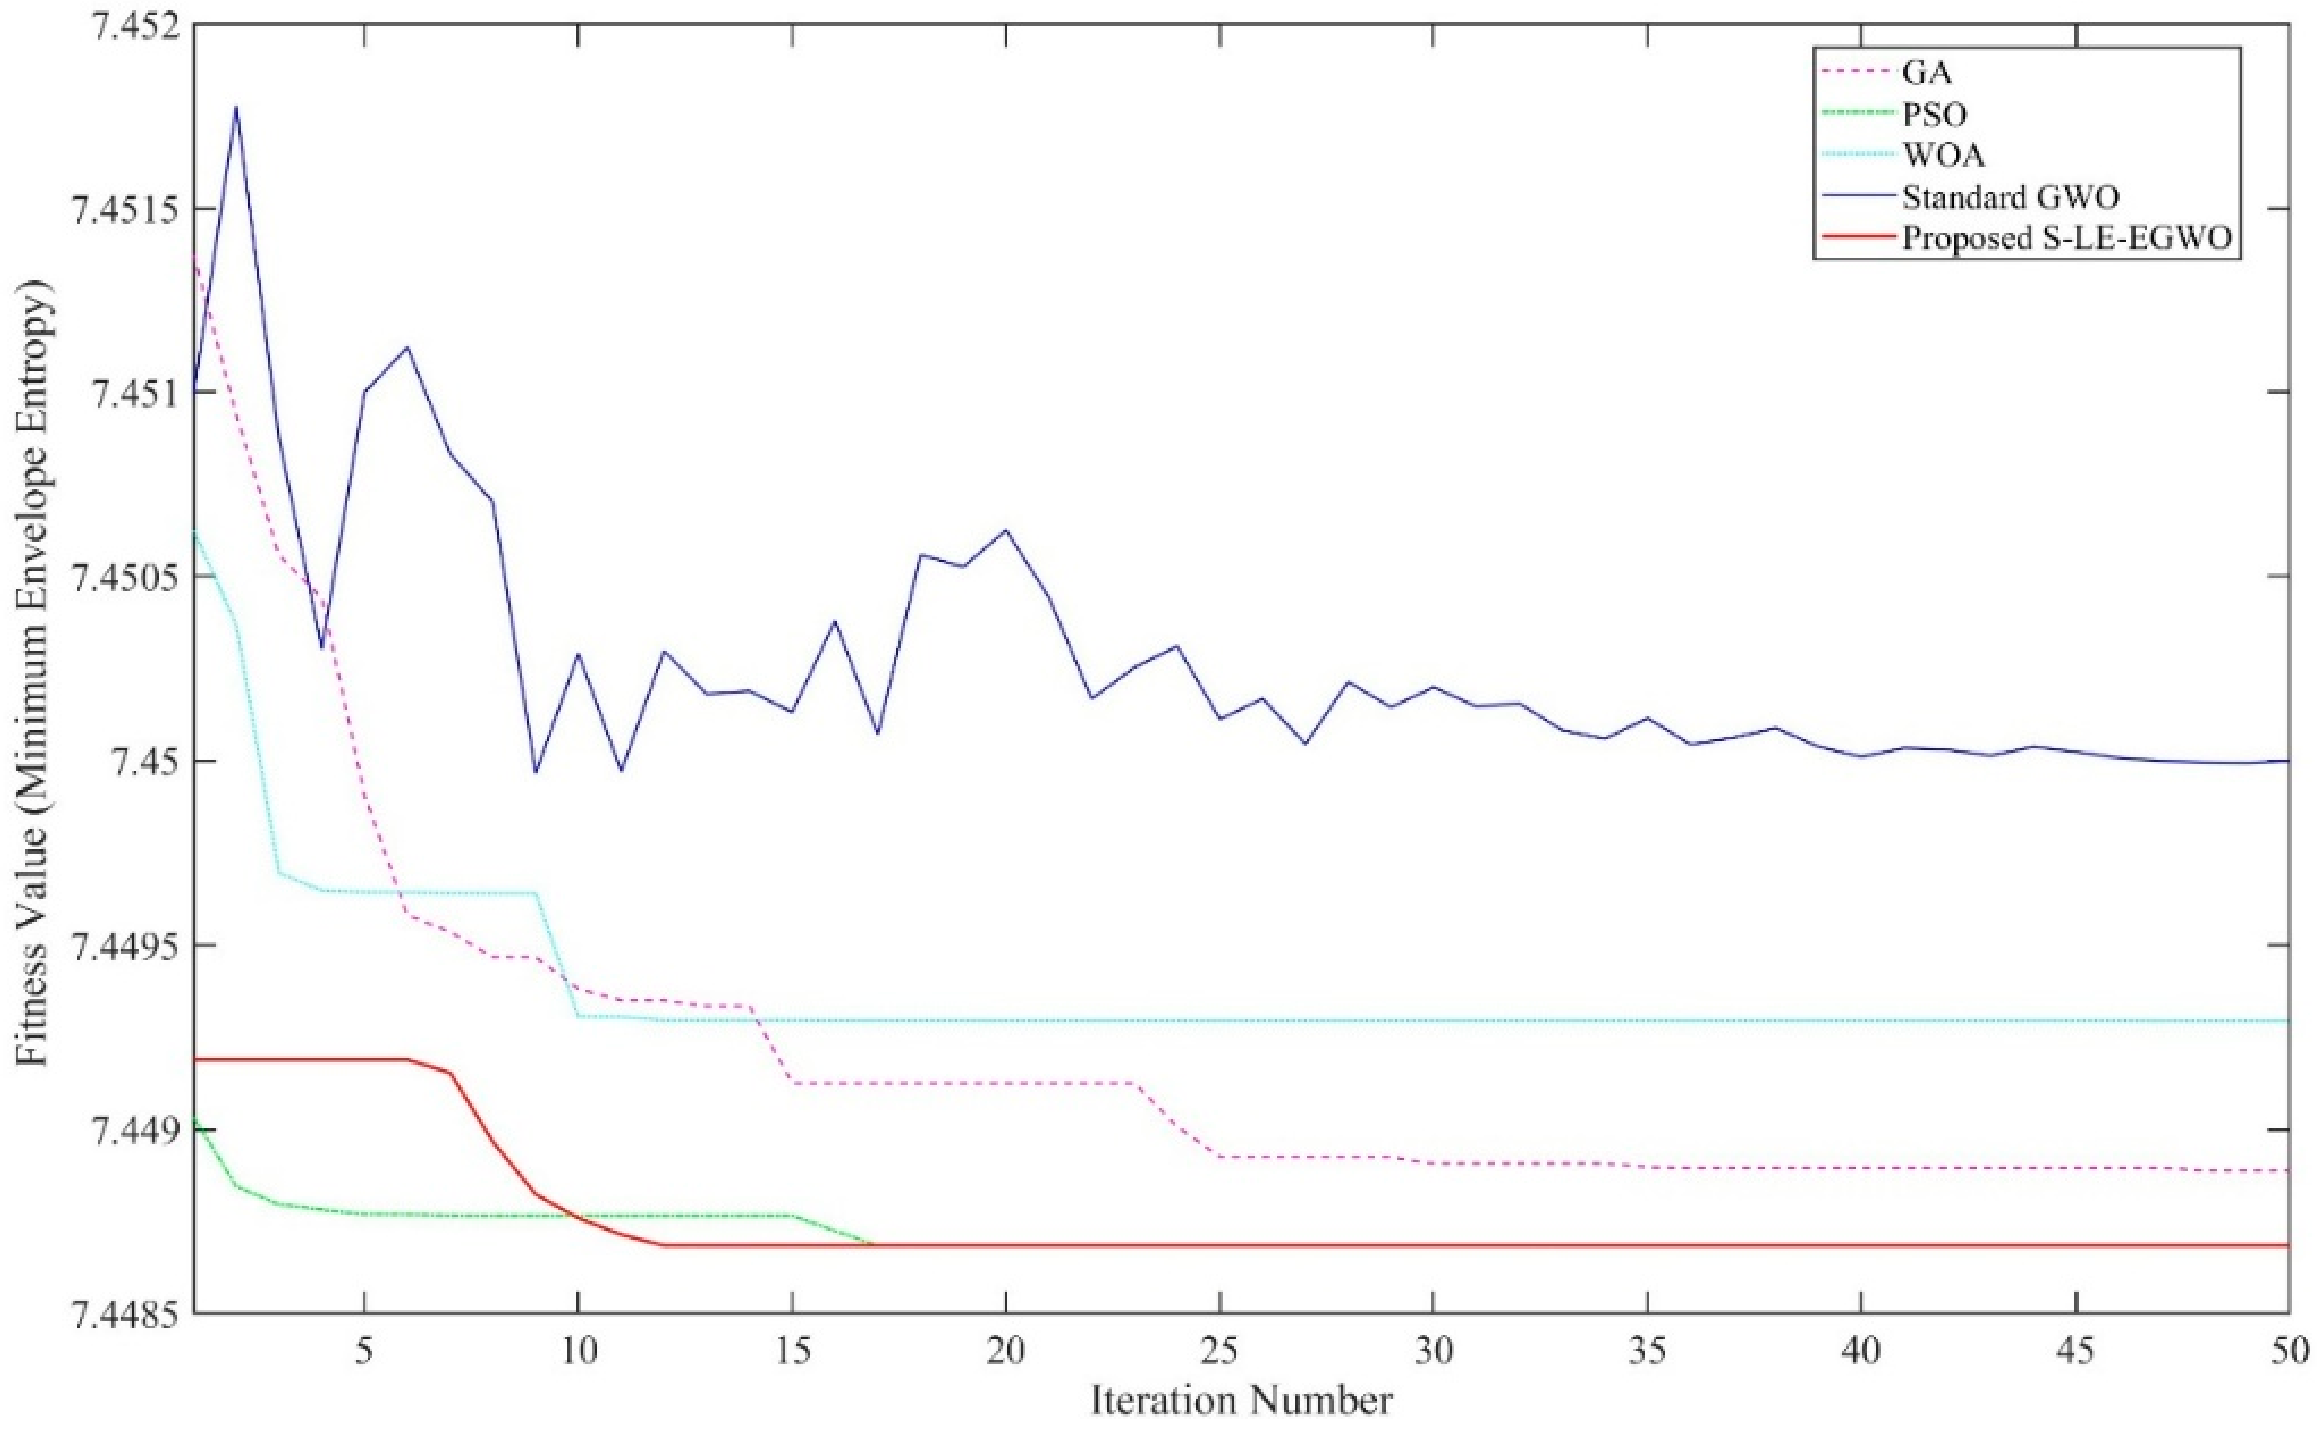
Figure 2 presents the iterative convergence curves of five optimization algorithms with the minimum envelope entropy as the objective function. The standard GWO exhibits obvious numerical oscillations throughout the iteration process, indicating poor convergence stability. In contrast, Genetic Algorithm (GA), WOA, and Particle Swarm Optimization (PSO) decline rapidly in the early stage but quickly converge to local optima, failing to continue searching for better parameter combinations. The proposed S-LE-EGWO algorithm employs the Sobol sequence for uniform population initialization to improve the quality of the initial solutions, and integrates a nonlinear convergence factor with a Lévy flight perturbation to balance the global exploration and local exploitation capabilities. It converges to the global optimal steady-state value at approximately the 15th iteration, and the final envelope entropy is significantly lower than that of the other compared algorithms. These results demonstrate that the improvement strategies adopted in this paper effectively enhance the optimization accuracy and convergence stability of the grey wolf optimizer, thereby providing an optimal parameter matching scheme for the VMD-MCKD fault feature extraction model.
Due to the random initialization nature of optimizers and the high computational cost of VMD decomposition for long-length vibration signals, seven independent runs are carried out for VMD parameter tuning. Statistical results summarized in Appendix A demonstrate that the proposed S-LE-EGWO can stably obtain lower minimum envelope entropy compared with other competing algorithms. One representative set of optimal parameters is selected for the subsequent signal decomposition procedure.
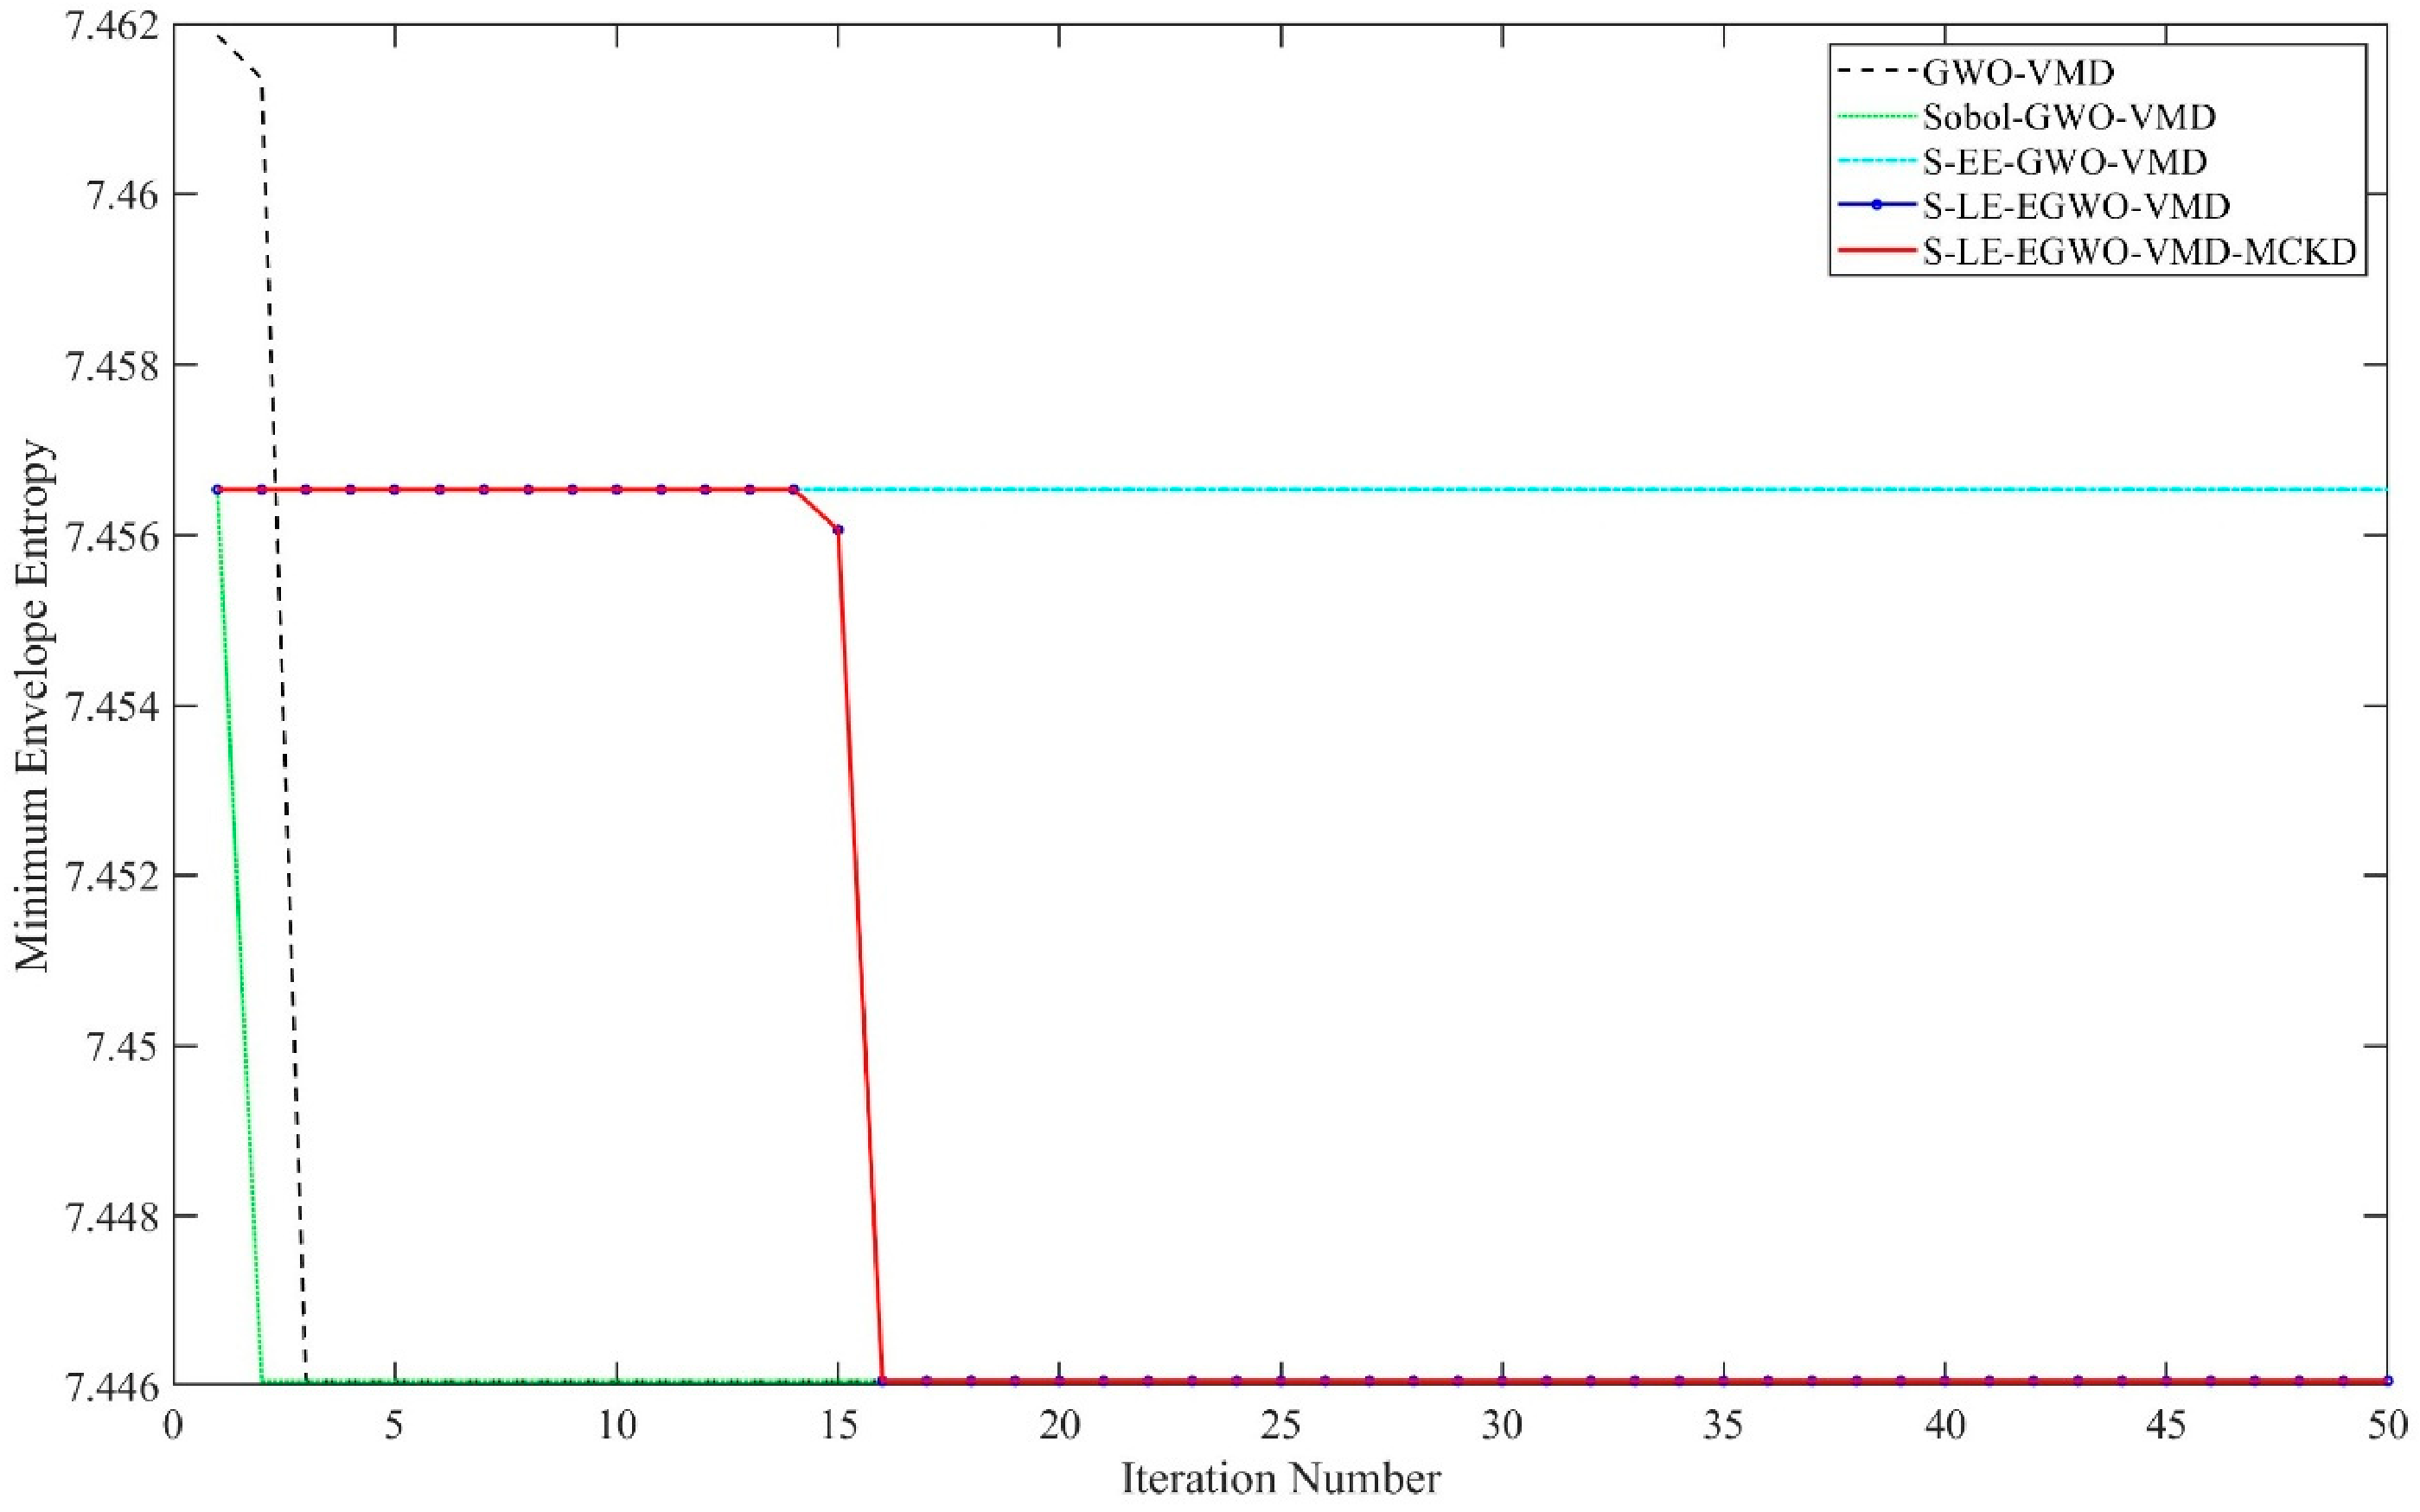
Several improvement modules are progressively incorporated into the original GWO to construct the S-LE-EGWO optimizer. Taking minimum envelope entropy as the objective function for VMD parameter tuning, Figure 3 shows convergence curves corresponding to different improved algorithm configurations.
The Sobol sequence optimizes the spatial distribution of the initial population and alleviates the risk of local optima induced by random initialization. As illustrated by the convergence curves, the variant with Sobol initialization converges considerably faster than the original GWO, while its steady-state envelope entropy remains close to that of original GWO. This indicates that Sobol initialization mainly enhances search efficiency rather than decomposition accuracy.
After introducing the EEFO-inspired nonlinear convergence factor, the steady-state envelope entropy decreases remarkably, verifying that this component effectively optimizes VMD parameter matching and reduces minimum envelope entropy. Further integration of Lévy-flight perturbation and adaptive weights yields S-LE-EGWO. Under the present experimental conditions, the performance improvement brought by Lévy-flight perturbation is relatively marginal, and the main performance gain originates from the EEFO-based nonlinear convergence factor. Incorporating the EEFO-inspired nonlinear convergence factor into the grey-wolf optimizer significantly reduces the steady-state envelope entropy, which demonstrates that the EEFO strategy can effectively optimize VMD parameter-matching performance.
Subsequently, the MCKD impulse-feature enhancement module is introduced, corresponding to the S-LE-EGWO-VMD-MCKD curve. This hybrid scheme finds favorable global parameters around the 15th iteration and rapidly reduces envelope entropy. Although its final steady-state value is comparable to that of S-LE-EGWO-VMD, MCKD accelerates global optimum searching and improves signal decomposition quality. It amplifies weak fault impulses of rolling bearings and generates high-quality inputs for the subsequent KPCA dimensionality-reduction procedure.
Seven independent optimization experiments were completed due to high computational cost of VMD for long vibration signals. The statistical results including mean value and standard deviation are listed in Table A1. It can be observed that S-LE-EGWO obtains the lowest average minimum envelope entropy among all algorithms.
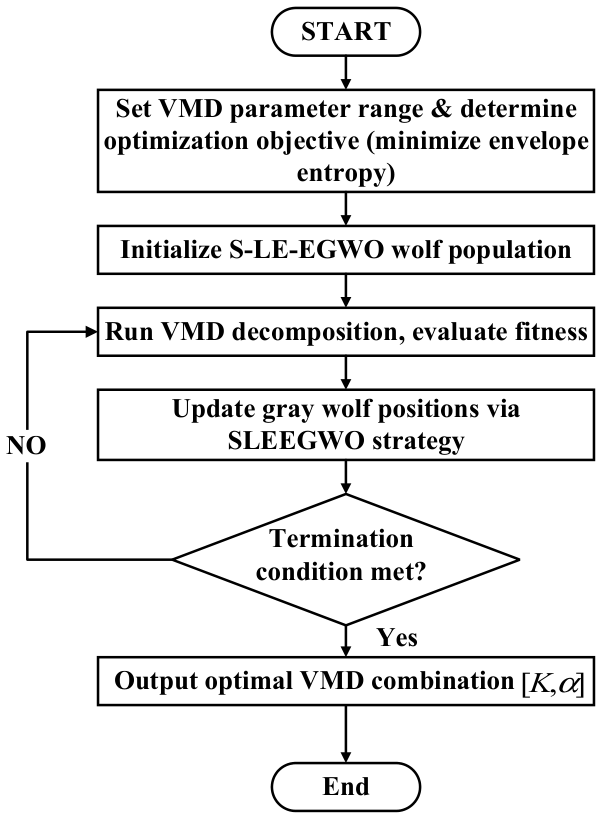
The proposed S-LE-EGWO algorithm’s optimization process for VMD parameters is illustrated in Figure 4.

2.4. Fault Diagnosis Model Based on Optimized SVM

SVM is a classifier grounded in statistical learning theory that is capable of solving small-sample and nonlinear classification problems. As a widely applied supervised machine learning algorithm, SVM has been extensively used in various fields since its introduction, owing to its excellent classification performance and generalization capability [29,30].
The mathematical principle of SVM is primarily based on finding an optimal separating hyperplane that effectively distinguishes sample points of different categories. To address the issue of linear inseparability in the original sample space, SVM can effectively overcome the common drawbacks of traditional machine learning methods, such as the curse of dimensionality and overfitting. Consequently, it exhibits outstanding adaptability in scenarios involving small sample sizes, nonlinear coupling, and high-dimensional feature identification [31].
Considering that bearing fault identification is a typical task involving small-sample and nonlinear scenarios, this paper adopts SVM to establish the bearing fault pattern recognition framework. Specifically, multi-domain features in both the time and frequency domains are extracted from the denoised signals to construct a high-dimensional feature vector set. These features are then subjected to nonlinear dimensionality reduction via KPCA, and the resulting low-dimensional feature samples are subsequently fed into the SVM model to accomplish bearing fault identification.
The kernel parameter g of the Radial Basis Function (RBF) kernel and the penalty parameter c of SVM directly determine the fitting performance and classification accuracy of the model. Empirical assignment based on human experience may lead to suboptimal model performance. To address the issue of arbitrary selection of these critical SVM parameters, this paper employs the S-LE-EGWO intelligent optimization algorithm to perform parameter optimization, based on which an adaptive parameter-optimized SVM model for bearing fault diagnosis is constructed. The specific flowchart is shown in Figure 5.

3. Joint Fault Diagnosis Method Based on S-LE-EGWO

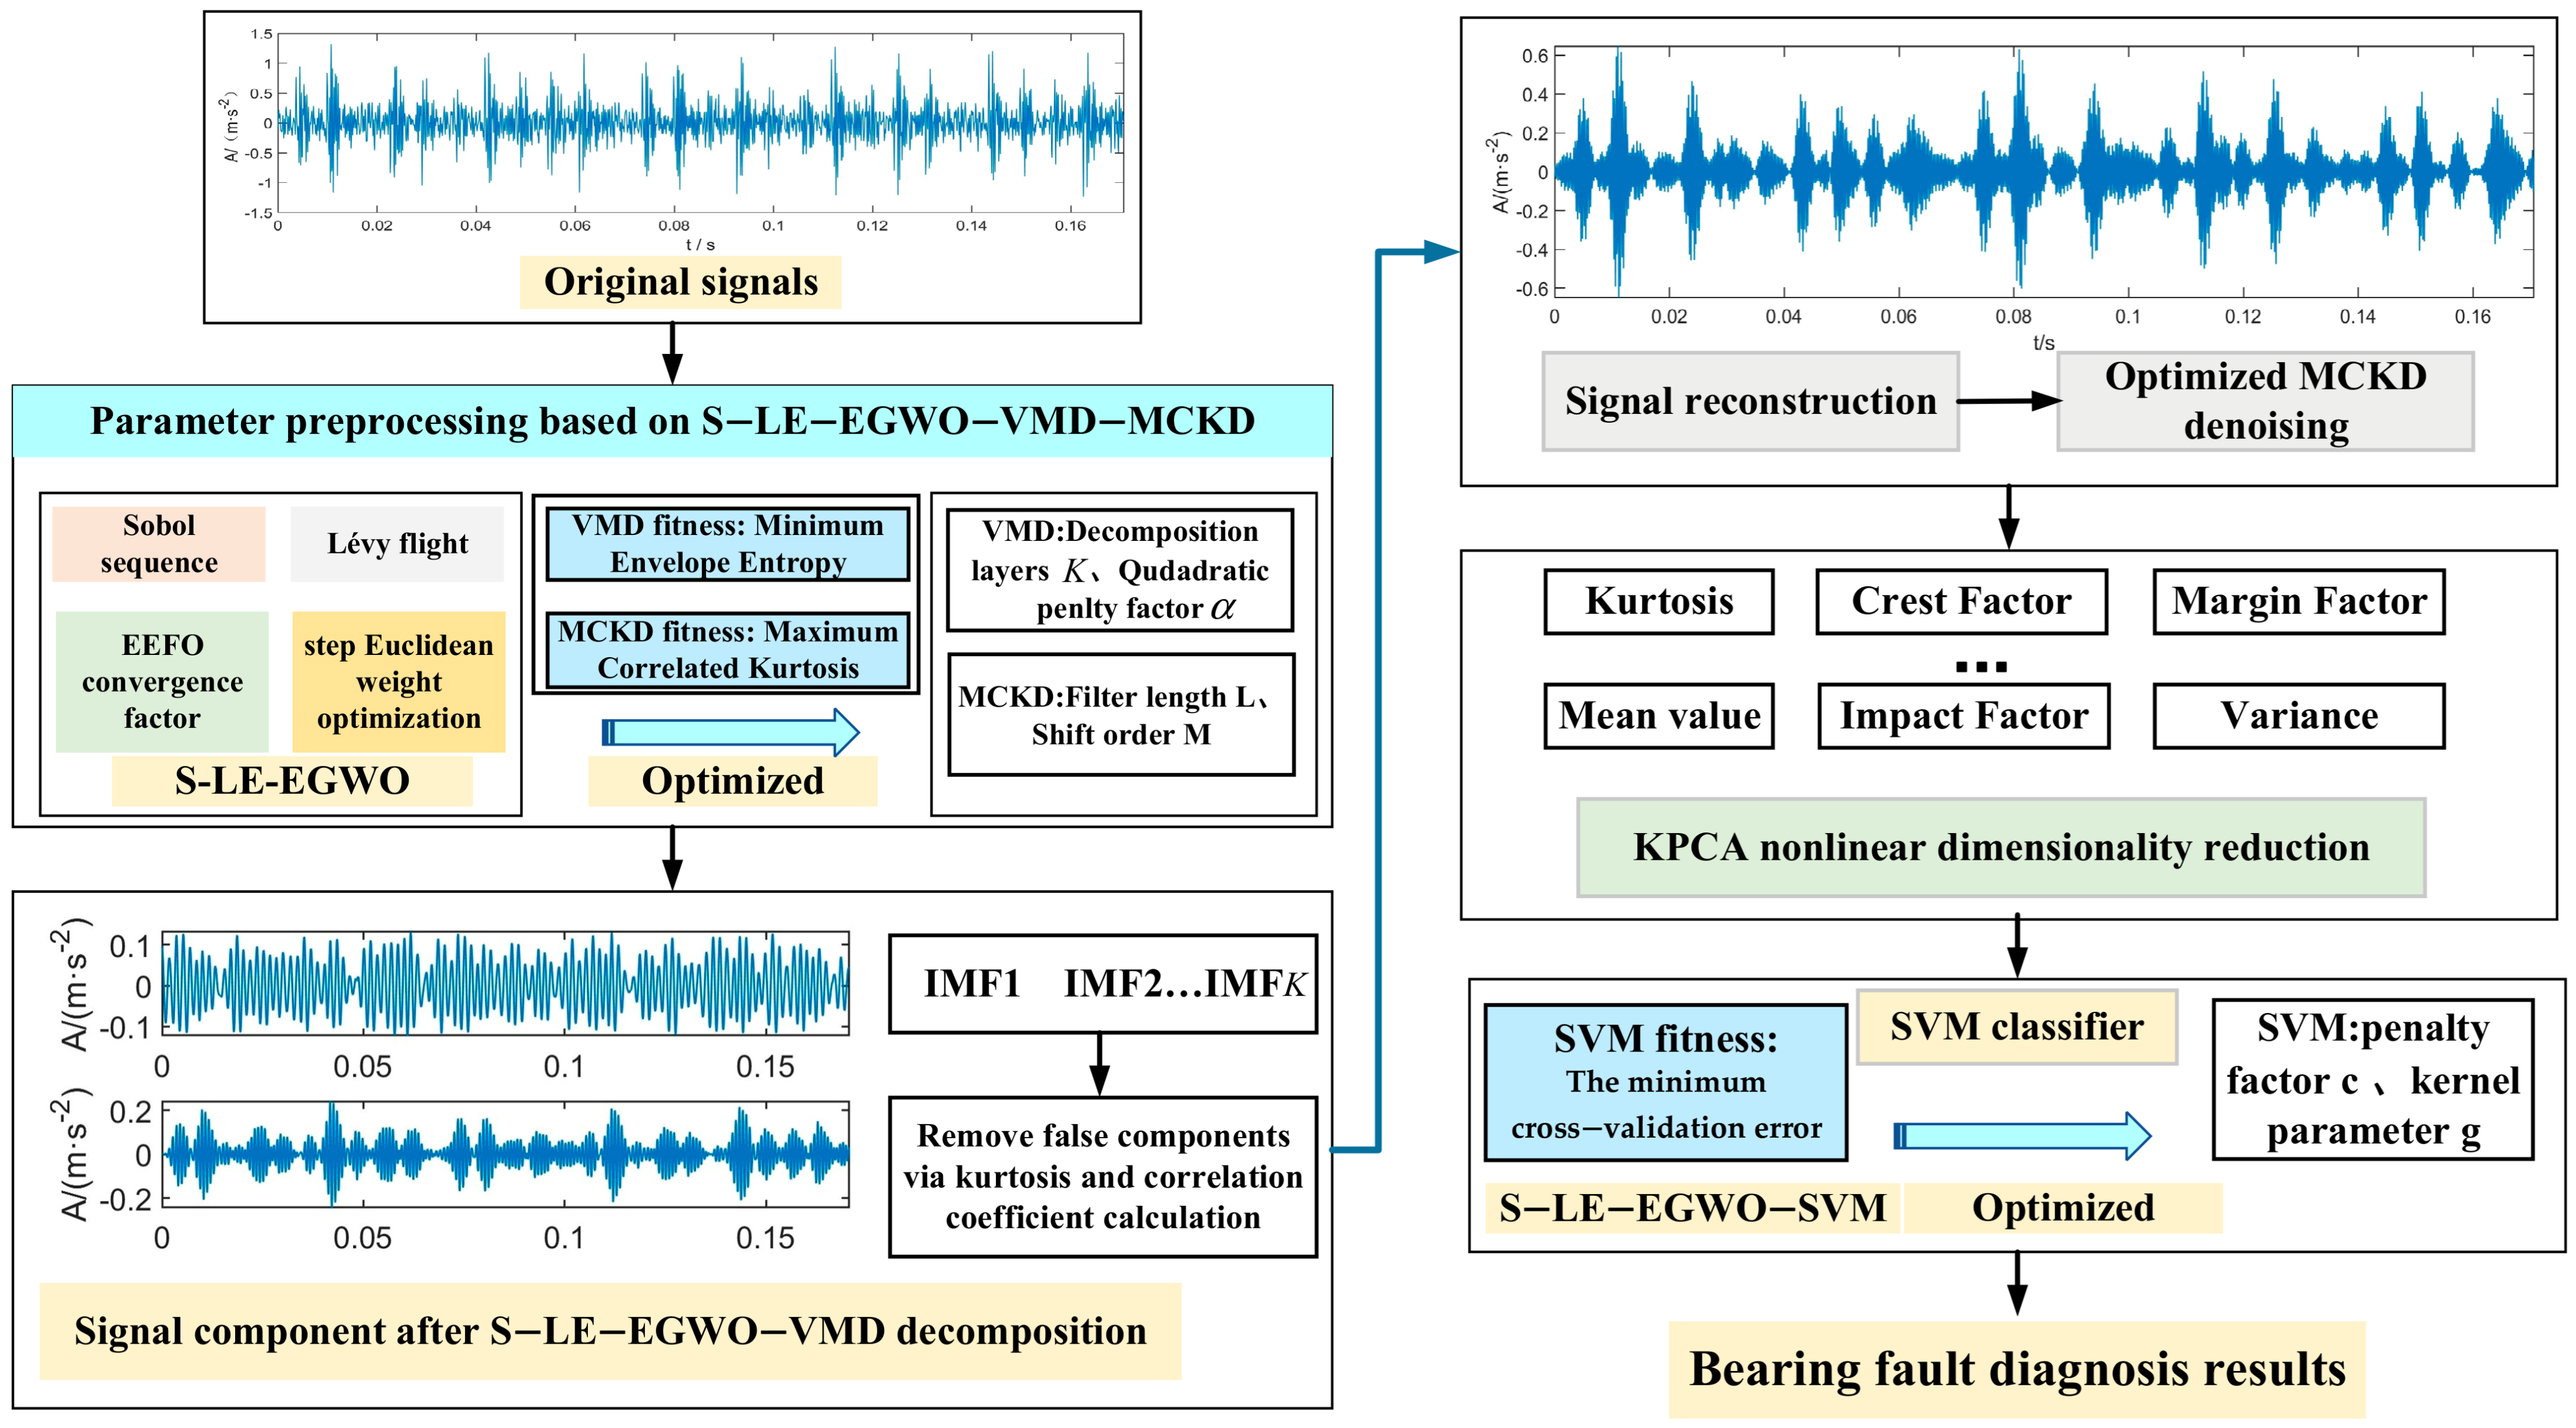
The main procedure of rolling bearing fault diagnosis consists of raw vibration signal acquisition, signal preprocessing, feature extraction, and fault classification. The overall technical route is illustrated in Figure 6. First, vibration signals under different bearing conditions are collected by sensors and then adaptively decomposed using VMD. The S-LE-EGWO algorithm is introduced to perform global optimization on the key VMD parameters, i.e., the mode number K and the penalty factor α , so as to determine their optimal combination and thereby alleviate the decomposition distortion problem caused by empirical manual settings. Subsequently, kurtosis and correlation coefficient are calculated for each IMF component obtained from the S-LE-EGWO-VMD decomposition, so as to remove spurious IMFs and reconstruct the signal. Then, the optimized MCKD is applied for noise reduction, followed by the extraction of multi-domain feature vectors. The KPCA algorithm is employed to perform nonlinear dimensionality reduction, and the reduced feature vectors are fed into the SVM classification model to achieve bearing fault identification. Meanwhile, the S-LE-EGWO algorithm is used to adaptively optimize the penalty factor c and kernel parameter g of the SVM, thereby improving the classification accuracy of the model.
The detailed procedure of the proposed bearing fault diagnosis method based on S-LE-EGWO is presented as follows:
  • Fault signal acquisition
Raw vibration signals are collected under four bearing conditions, namely normal state, inner-race crack, outer-race crack, and rolling element damage. These measurements yield raw time-domain vibration data contaminated by environmental noise, which serve as the initial input for the entire fault diagnosis algorithm.
2.
S-LE-EGWO-Optimized VMD Decomposition and Effective Mode Reconstruction
The minimum envelope entropy is adopted as the fitness metric, and the S-LE-EGWO algorithm is employed to iteratively search for the optimal values of the two critical VMD parameters, namely the mode number K and the penalty factor α , thereby ameliorating the deficiency of traditional VMD that relies on empirical manual parameter setting. With the optimal parameters, modal decomposition of the raw vibration signal is performed. The spurious modal components are then eliminated based on kurtosis and correlation coefficient criteria, while the informative IMF components carrying fault-related information are retained. Subsequently, the time-domain signal is reconstructed using these effective components.
3.
S-LE-EGWO-Optimized MCKD for Feature Denoising Enhancement
The maximum correlated kurtosis is adopted as the fitness function, and the S-LE-EGWO algorithm is again utilized to determine the optimal combination of the MCKD filter length L and the shift order M . Subsequently, the reconstructed signal is fed into the optimized MCKD algorithm, so as to suppress the residual background noise, amplify the periodic fault impulse signals that are masked by noise, and thereby enhance the identifiability of the fault features.
4.
Time-Domain Feature Extraction and KPCA-Based Dimensionality Reduction
For the denoised and purified fault signals, multiple time-domain statistical features including mean, variance, kurtosis, crest factor, impulse factor, and margin factor are extracted to construct an initial high-dimensional feature set. The KPCA algorithm is then employed to perform nonlinear dimensionality reduction on the original feature set, so as to eliminate redundant feature information, reduce feature dimensionality, and alleviate the computational burden of the subsequent classification model.
5.
S-LE-EGWO-Optimized SVM for Fault Identification and Classification
The dimension-reduced feature samples are divided into training and testing sets. The minimum cross-validation error is adopted as the fitness value, and the S-LE-EGWO algorithm is employed to adaptively optimize the SVM penalty parameter c and the kernel parameter g , thereby compensating for the deficiencies of traditional SVM in terms of poor parameter matching and unstable identification accuracy. Based on the optimal parameters, the final fault classification model is constructed to realize accurate discrimination and classification of different bearing fault types and achieve reliable fault-diagnosis performance.

4. Experimental Verification and Result Analysis

4.1. Experimental Data and Test Platform

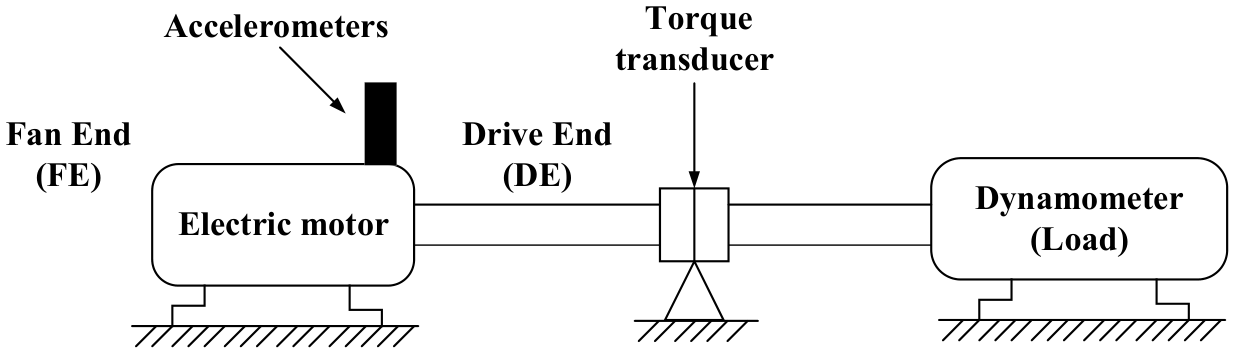
To validate the proposed fault diagnosis method S-LE-EGWO-VMD-MCKD-SVM, this paper conducts experimental research using the publicly available rolling bearing dataset from Case Western Reserve University (CWRU) [32]. The schematic diagram of the experimental test platform is shown in Figure 7. The entire setup consists of a 2 hp (approximately 1.5 kW) drive motor, a torque sensor, an encoder, an accelerometer at the drive end (DE), and an accelerometer at the fan end (FE), which can stably simulate steady-state operating conditions commonly encountered in industrial field applications. The bearing used in the experiment is an SKF 6205-2RS JEM deep-groove ball bearing, mounted on the motor drive end. Vibration signals were collected using accelerometers at a sampling frequency of 12 kHz, with the motor operating at an approximate speed of 1750 r/min. The vibration acceleration data acquired at the drive end are selected as the analysis object in this study.
All fault types were introduced by electrical discharge machining (EDM), creating single-point damage on the inner race, outer race, and rolling element, respectively. Together with the normal (healthy) condition, a total of 10 bearing operating conditions were established. For each condition, 120 raw samples were acquired, with each sample containing 2048 data points, resulting in a total dataset of 1200 samples. A stratified partitioning strategy was then adopted, in which 20% of the samples were randomly selected as the independent test set, and the remaining 80% as the training set, so as to ensure that the proportion of each fault type remained consistent between the training and test sets.
Samples are generated by a sliding window approach with a step size of 1000 sampling points, which brings about overlaps between adjacent samples, and a total of 1200 samples are obtained. The corresponding original CWRU data files are 99.mat, 107.mat, 120.mat, 132.mat, 146.mat, 159.mat, 171.mat, 137.mat, 190.mat and 240.mat. To avoid information leakage caused by overlapping segments, all samples cropped from one single original.mat recording are entirely assigned to either the training set or the test set; samples from the same original recording will not be split into both subsets. Stratified random partitioning is performed at the recording-file level instead of individual sample level. To guarantee experimental reproducibility, the random seed is fixed to 42 (rng(42) in MATLAB R2023b) during sample partition.
All numerical simulations, including signal decomposition, multi-domain feature extraction, KPCA-based dimensionality reduction, and S-LE-EGWO-optimized SVM classification, were carried out in MATLAB R2023b on a machine equipped with an Intel Ultra 7 processor and 32 GB of RAM.
Note that all samples are extracted from continuous raw vibration recordings by sliding-window segmentation, and the train-test partition is performed on extracted samples rather than on raw signal segments. Potential segment overlap between training and test samples is an inherent limitation of the CWRU benchmark, since each fault condition under 1750 rpm-2 HP only corresponds to one single continuous acquisition record. In future work, multi-recording cross-validation will be adopted to further verify the generalization performance. Besides, the KPCA projection matrix is fitted exclusively using training-set features, and test-set features are only projected onto the learned subspace without participating in model fitting.
The key hyper-parameters involved in the S-LE-EGWO optimizer, VMD, MCKD and SVM directly determine the feature-extraction and classification performance. The search bounds for SVM hyper-parameters, iteration termination conditions of each algorithm, VMD convergence tolerance and MCKD filtering parameters are all critical for optimization results. To ensure experimental reproducibility, these major algorithm settings are summarized in Table 1.

4.2. Experimental Results and Analysis

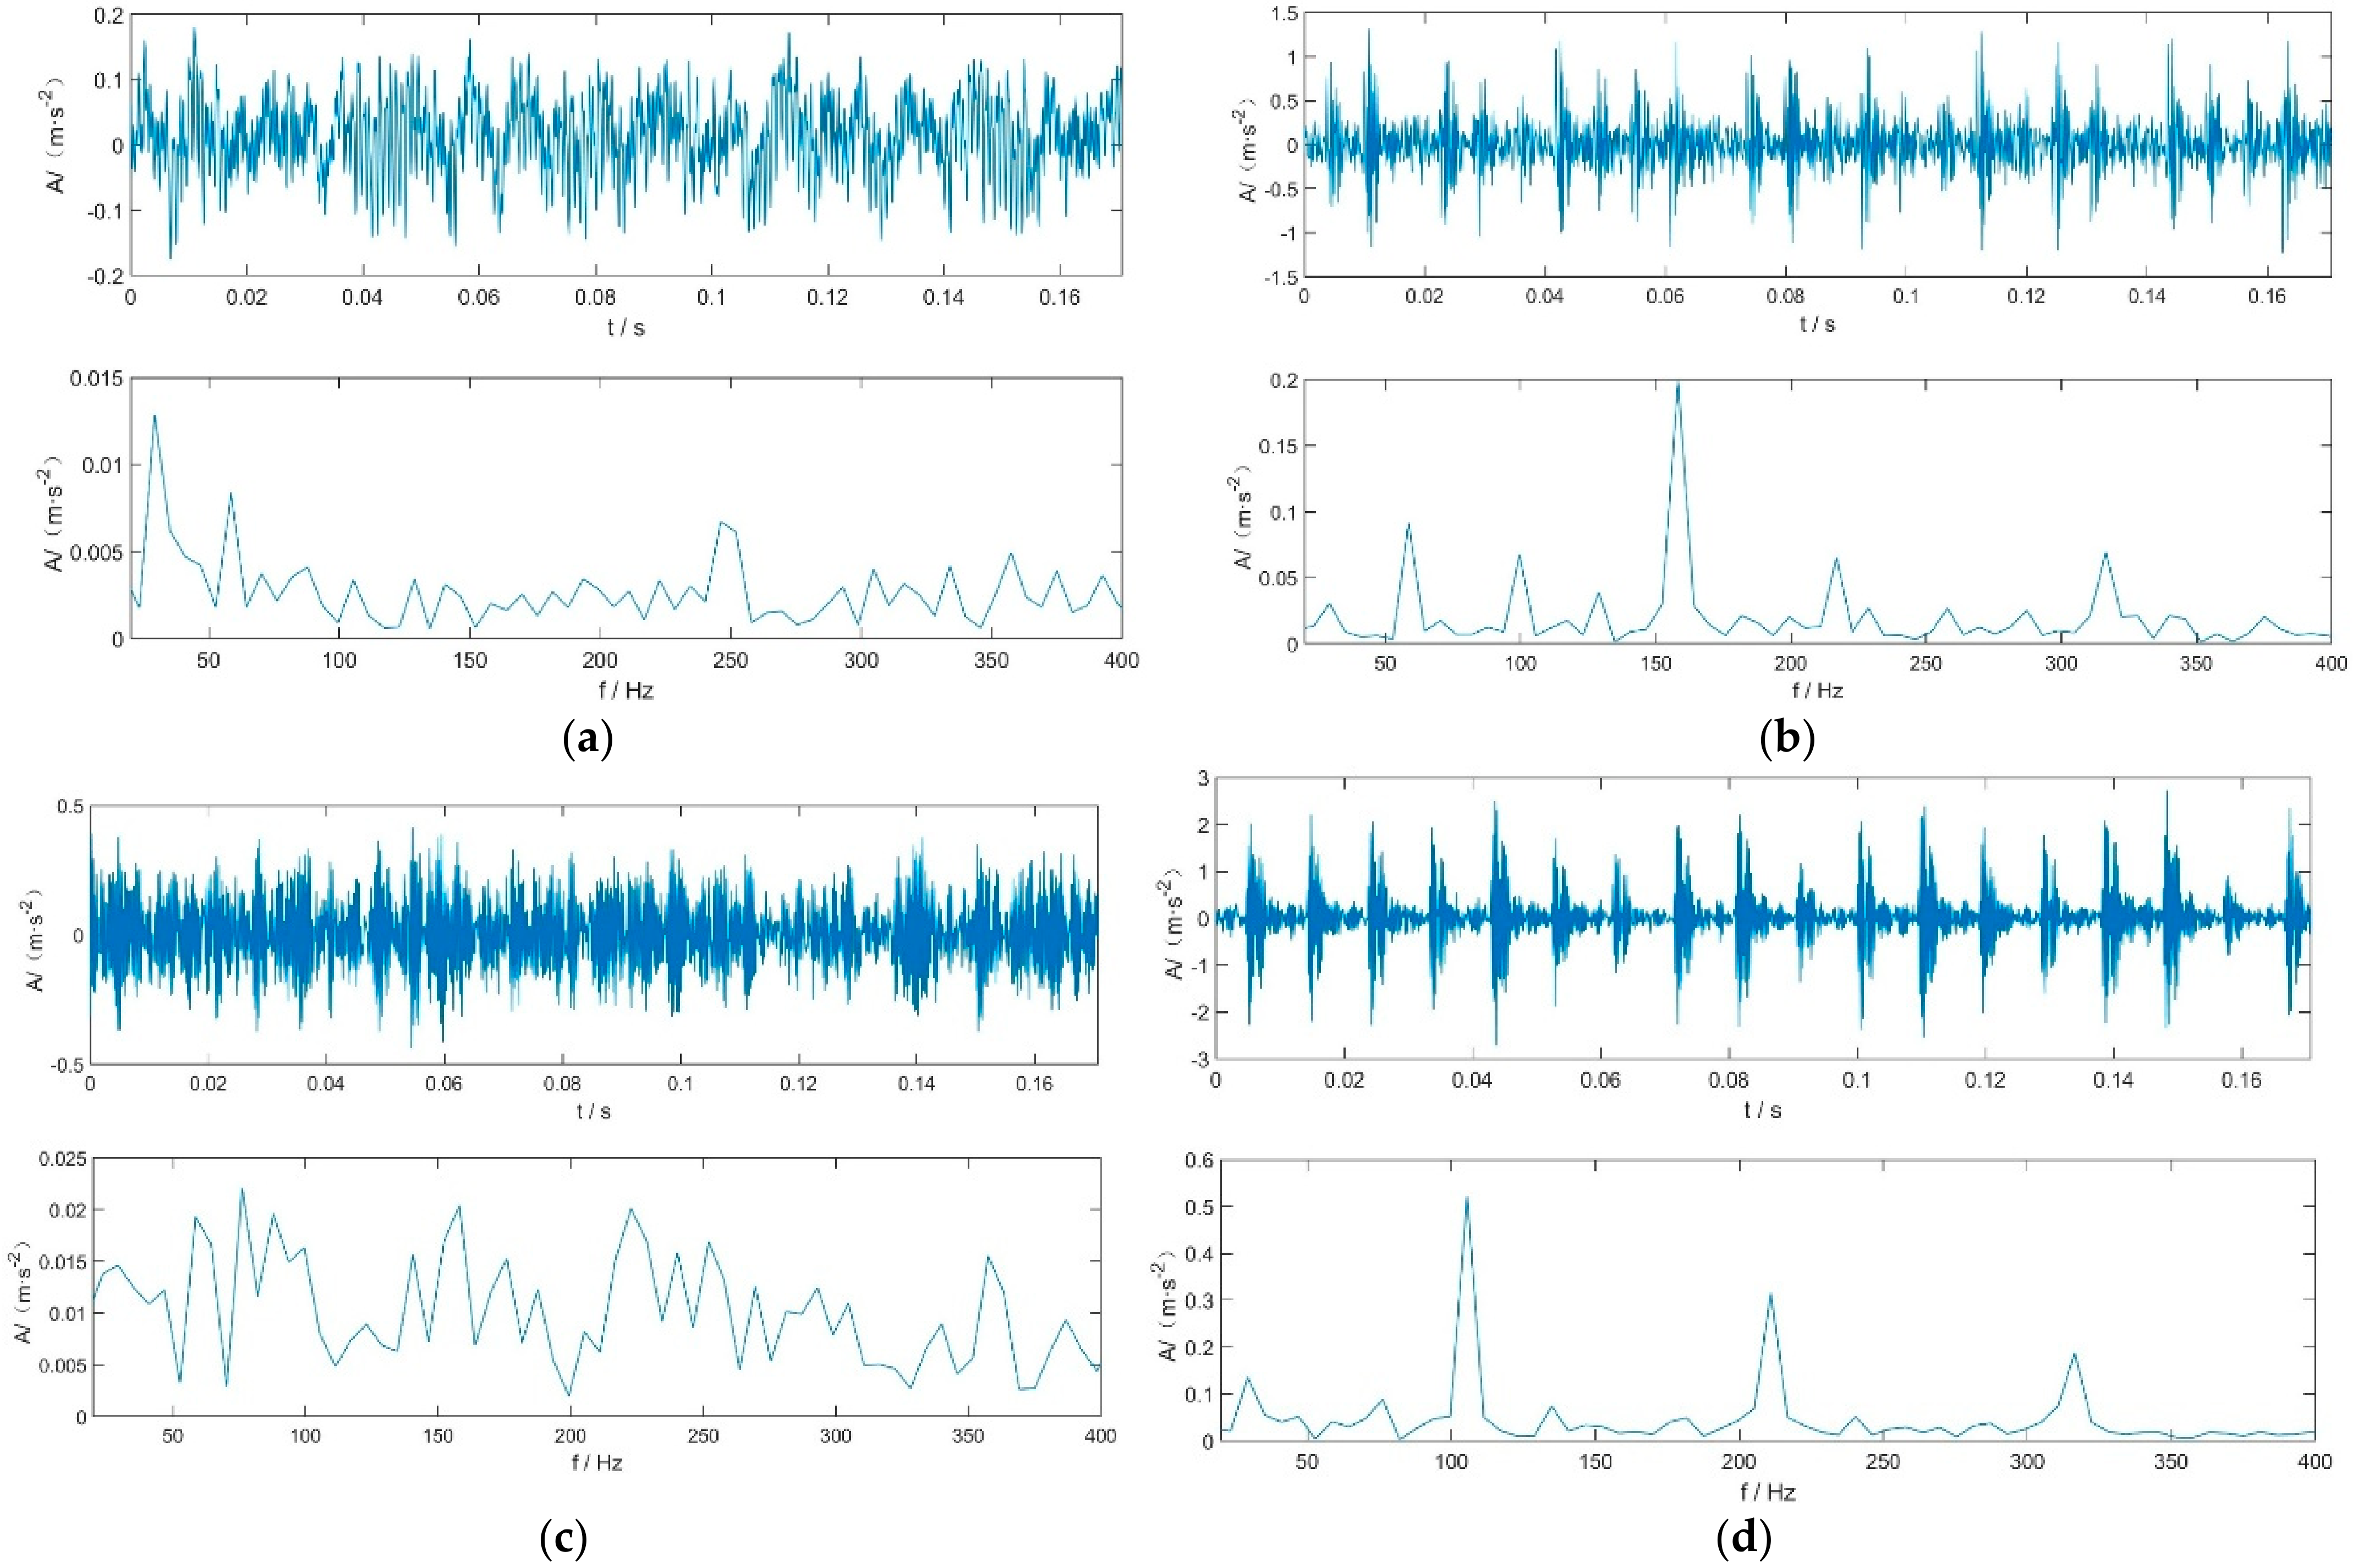
To more clearly illustrate the variation pattern of fault characteristics of rolling bearings at different damage stages, comparative analyses of time-domain waveforms and envelope spectra are carried out for inner-race faults with three severity levels, as shown in Figure 8.
Figure 8a shows that the vibration signal of a healthy bearing is stable without obvious impulsive components, and no prominent fault characteristic peaks can be observed in the corresponding envelope spectrum.
When the fault damage diameter reaches 0.007 inches (incipient fault, Figure 8b), weak periodic impulse components start to appear in the time-domain waveform. However, the impulse amplitude is inherently very low owing to the minor early-stage damage. Accordingly, the peaks of fault characteristic frequencies in the envelope spectrum are indistinct and hard to identify directly, which poses a great challenge to the accurate diagnosis of incipient faults.
As the fault size further increases to 0.014 inches (moderate fault, Figure 8c) and 0.021 inches (severe fault, Figure 8d), the amplitude of transient impulses in the time domain rises significantly. The fault characteristic frequencies together with their harmonics in the envelope spectrum gradually become clearer and easier to recognize. In particular, for the severe fault with a damage size of 0.021 inches, the impulse features are sufficiently prominent and can be directly identified by conventional spectrum-analysis methods.
The above analyses demonstrate that the difficulty of fault diagnosis in the incipient degradation stage of bearings mainly stems from the intrinsically weak impulse features induced by tiny damage. Therefore, it is necessary to introduce a feature enhancement module to extract such weak fault impulse signals. This is the motivation for integrating the MCKD algorithm into the diagnostic framework proposed in this paper.
The decomposition performance of VMD is highly dependent on the selection of the penalty factor α and the mode number K . The conventional empirical trial-and-error approach is highly subjective and cannot guarantee global optimality. To address this issue, the S-LE-EGWO algorithm is adopted in this paper to adaptively optimize the key parameters of VMD, with the minimum envelope entropy employed as the fitness function. The population size is set to 12, the maximum number of iterations to 25, and the parameter search ranges for α and K are set to [2000, 3000] and [2, 8], respectively.
Through the optimization, the optimal parameter combination is obtained as α = 2000 and K = 6 , with the corresponding minimum envelope entropy being 6.2202. Among the decomposed IMFs, the 5th IMF component exhibits the minimum envelope entropy and is therefore selected as the optimal modal component for subsequent feature enhancement.
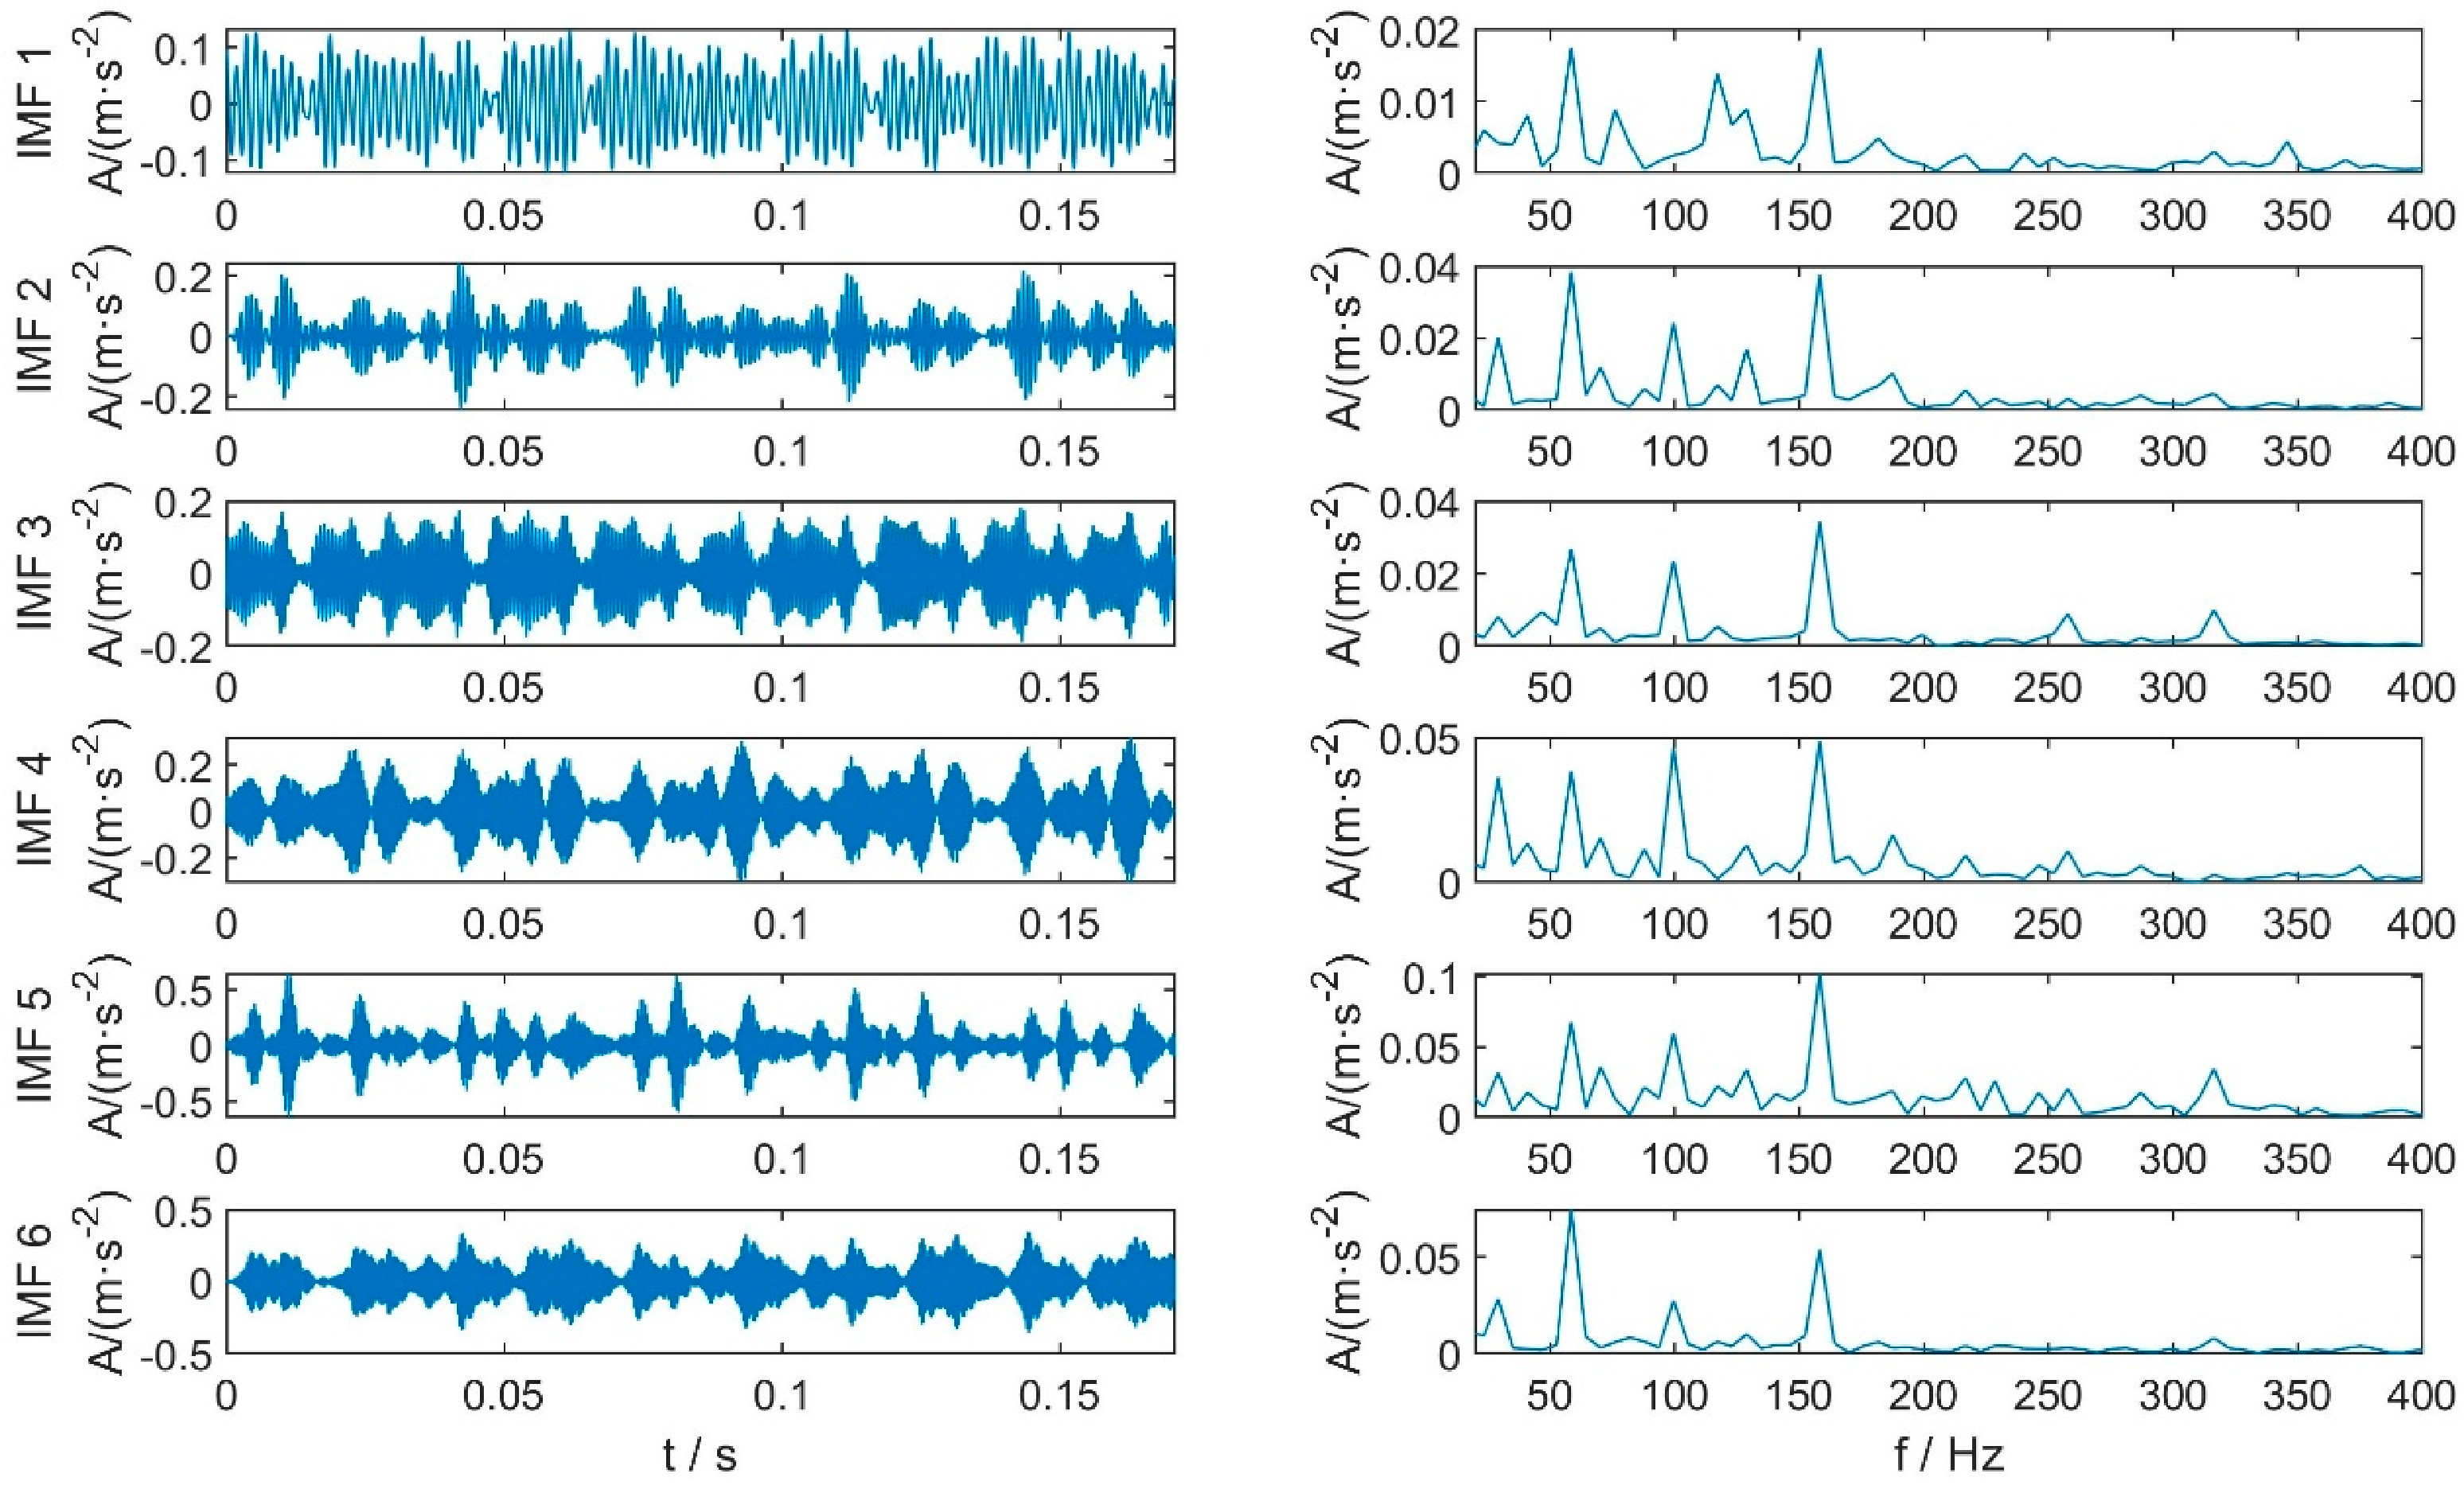
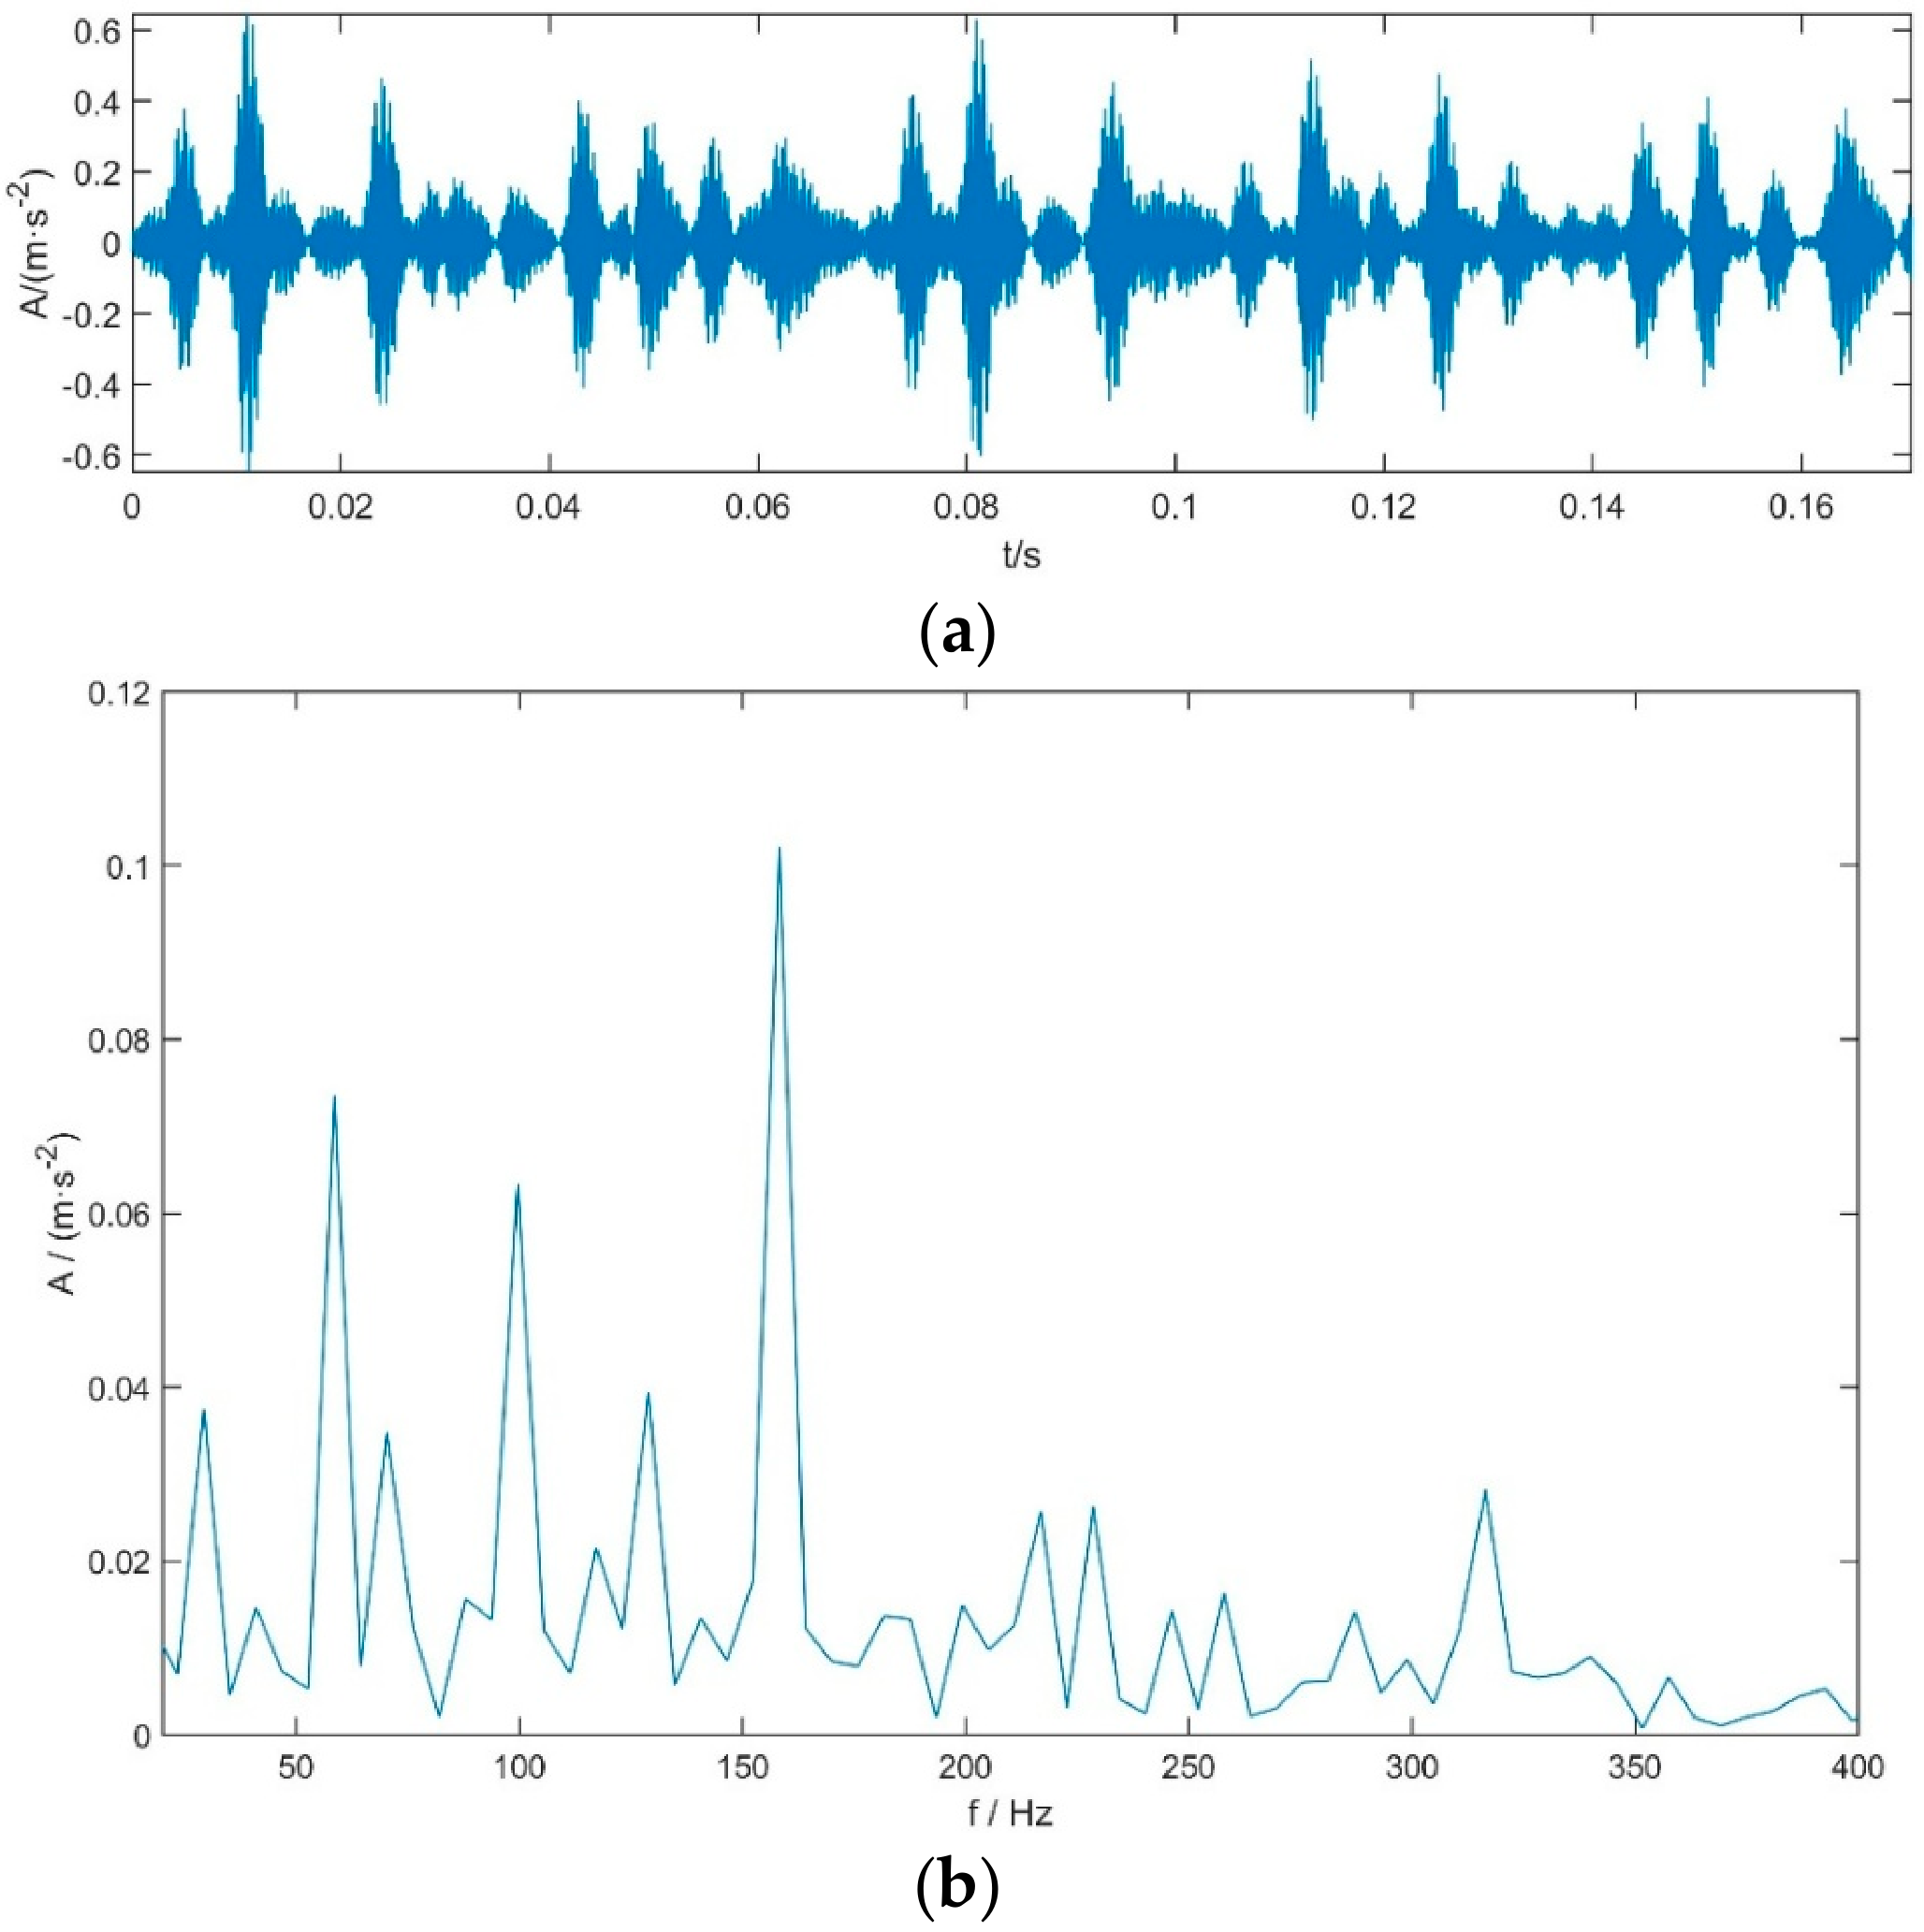
Figure 9 presents the VMD decomposition results of the inner-race fault signal with a damage diameter of 0.007 inches, using the S-LE-EGWO-optimized parameters ( α = 2000 , K = 6 ). The original vibration signal is adaptively decomposed into six IMF components. IMF1 is dominated by high-frequency narrow-band oscillations and environmental background noise, exhibiting a fine and regular time-domain waveform, while the fault-related spectral peaks in the envelope spectrum remain weak. IMF2, IMF3, and IMF4 represent medium-frequency transition modes; although they contain periodic fluctuations, the distinguishability of fault impulses is limited, and the envelope spectrum feature peaks are relatively low. IMF5 is identified as the primary mode that carries the most significant fault information, with clear and regular periodic impulse trains in the time domain and the most prominent inner-race fault characteristic frequency and its harmonics in the envelope spectrum. IMF6 exhibits relatively high impulse amplitudes in the time domain; however, the effective fault spectral peaks in the envelope spectrum show attenuation, accompanied by increased redundant interference components. The decomposition results are well-organized with reasonable frequency band division, which not only validates the effectiveness of the VMD parameter optimization scheme in this study but also aligns with the conclusion that IMF5 is selected as the optimal component by the screening criterion.
Jointly considering kurtosis and correlation coefficient, two general rules are adopted for IMF screening. If only one IMF possesses distinctly larger kurtosis and correlation coefficient than other decomposed modes, this component is directly regarded as the fault-sensitive IMF. In case multiple IMFs exhibit comparable high kurtosis and correlation values and contain evident fault-related impulses, all these qualified IMFs are superimposed for subsequent envelope spectrum analysis, rather than selecting only one individual component.
The kurtosis values of each IMF component and their correlation coefficients with the original signal are calculated, as shown in Table 2. The theoretical kurtosis of Gaussian white noise is 3. The kurtosis values of IMF1, IMF3, and IMF6 are all below 3, indicating the absence of periodic impulse characteristics. IMF2 exhibits a kurtosis slightly above 3, but its correlation coefficient is relatively low, containing only weak disturbances. IMF4 has a kurtosis approaching 3 and contains no fault impulse information. The aforementioned components are primarily composed of background noise and redundant frequency-domain components, and are therefore identified as spurious components. IMF5 achieves a kurtosis of 5.1958, which is the highest among all components, indicating that its periodic fault impulses are the most prominent. In addition, its correlation coefficient with the original signal is 0.61532, representing the highest degree of energy coupling. Combined with the time-domain impulse morphology in the decomposition spectra and the amplitude characteristics of fault frequencies in the envelope spectrum, IMF5 is determined to be the effective fault mode.
IMF5 is selected for signal reconstruction, while the remaining spurious components are discarded to purify the fault features, as shown in Figure 10. The reconstructed waveform eliminates most of the background noise, exhibiting clear and regular periodic impulse trains induced by the inner-race fault. In the envelope spectrum, the prominent inner-race fault characteristic frequency and its harmonics are clearly captured. These results demonstrate that the adopted VMD-based screening algorithm effectively purifies the original signal and accurately extracts the fault features.
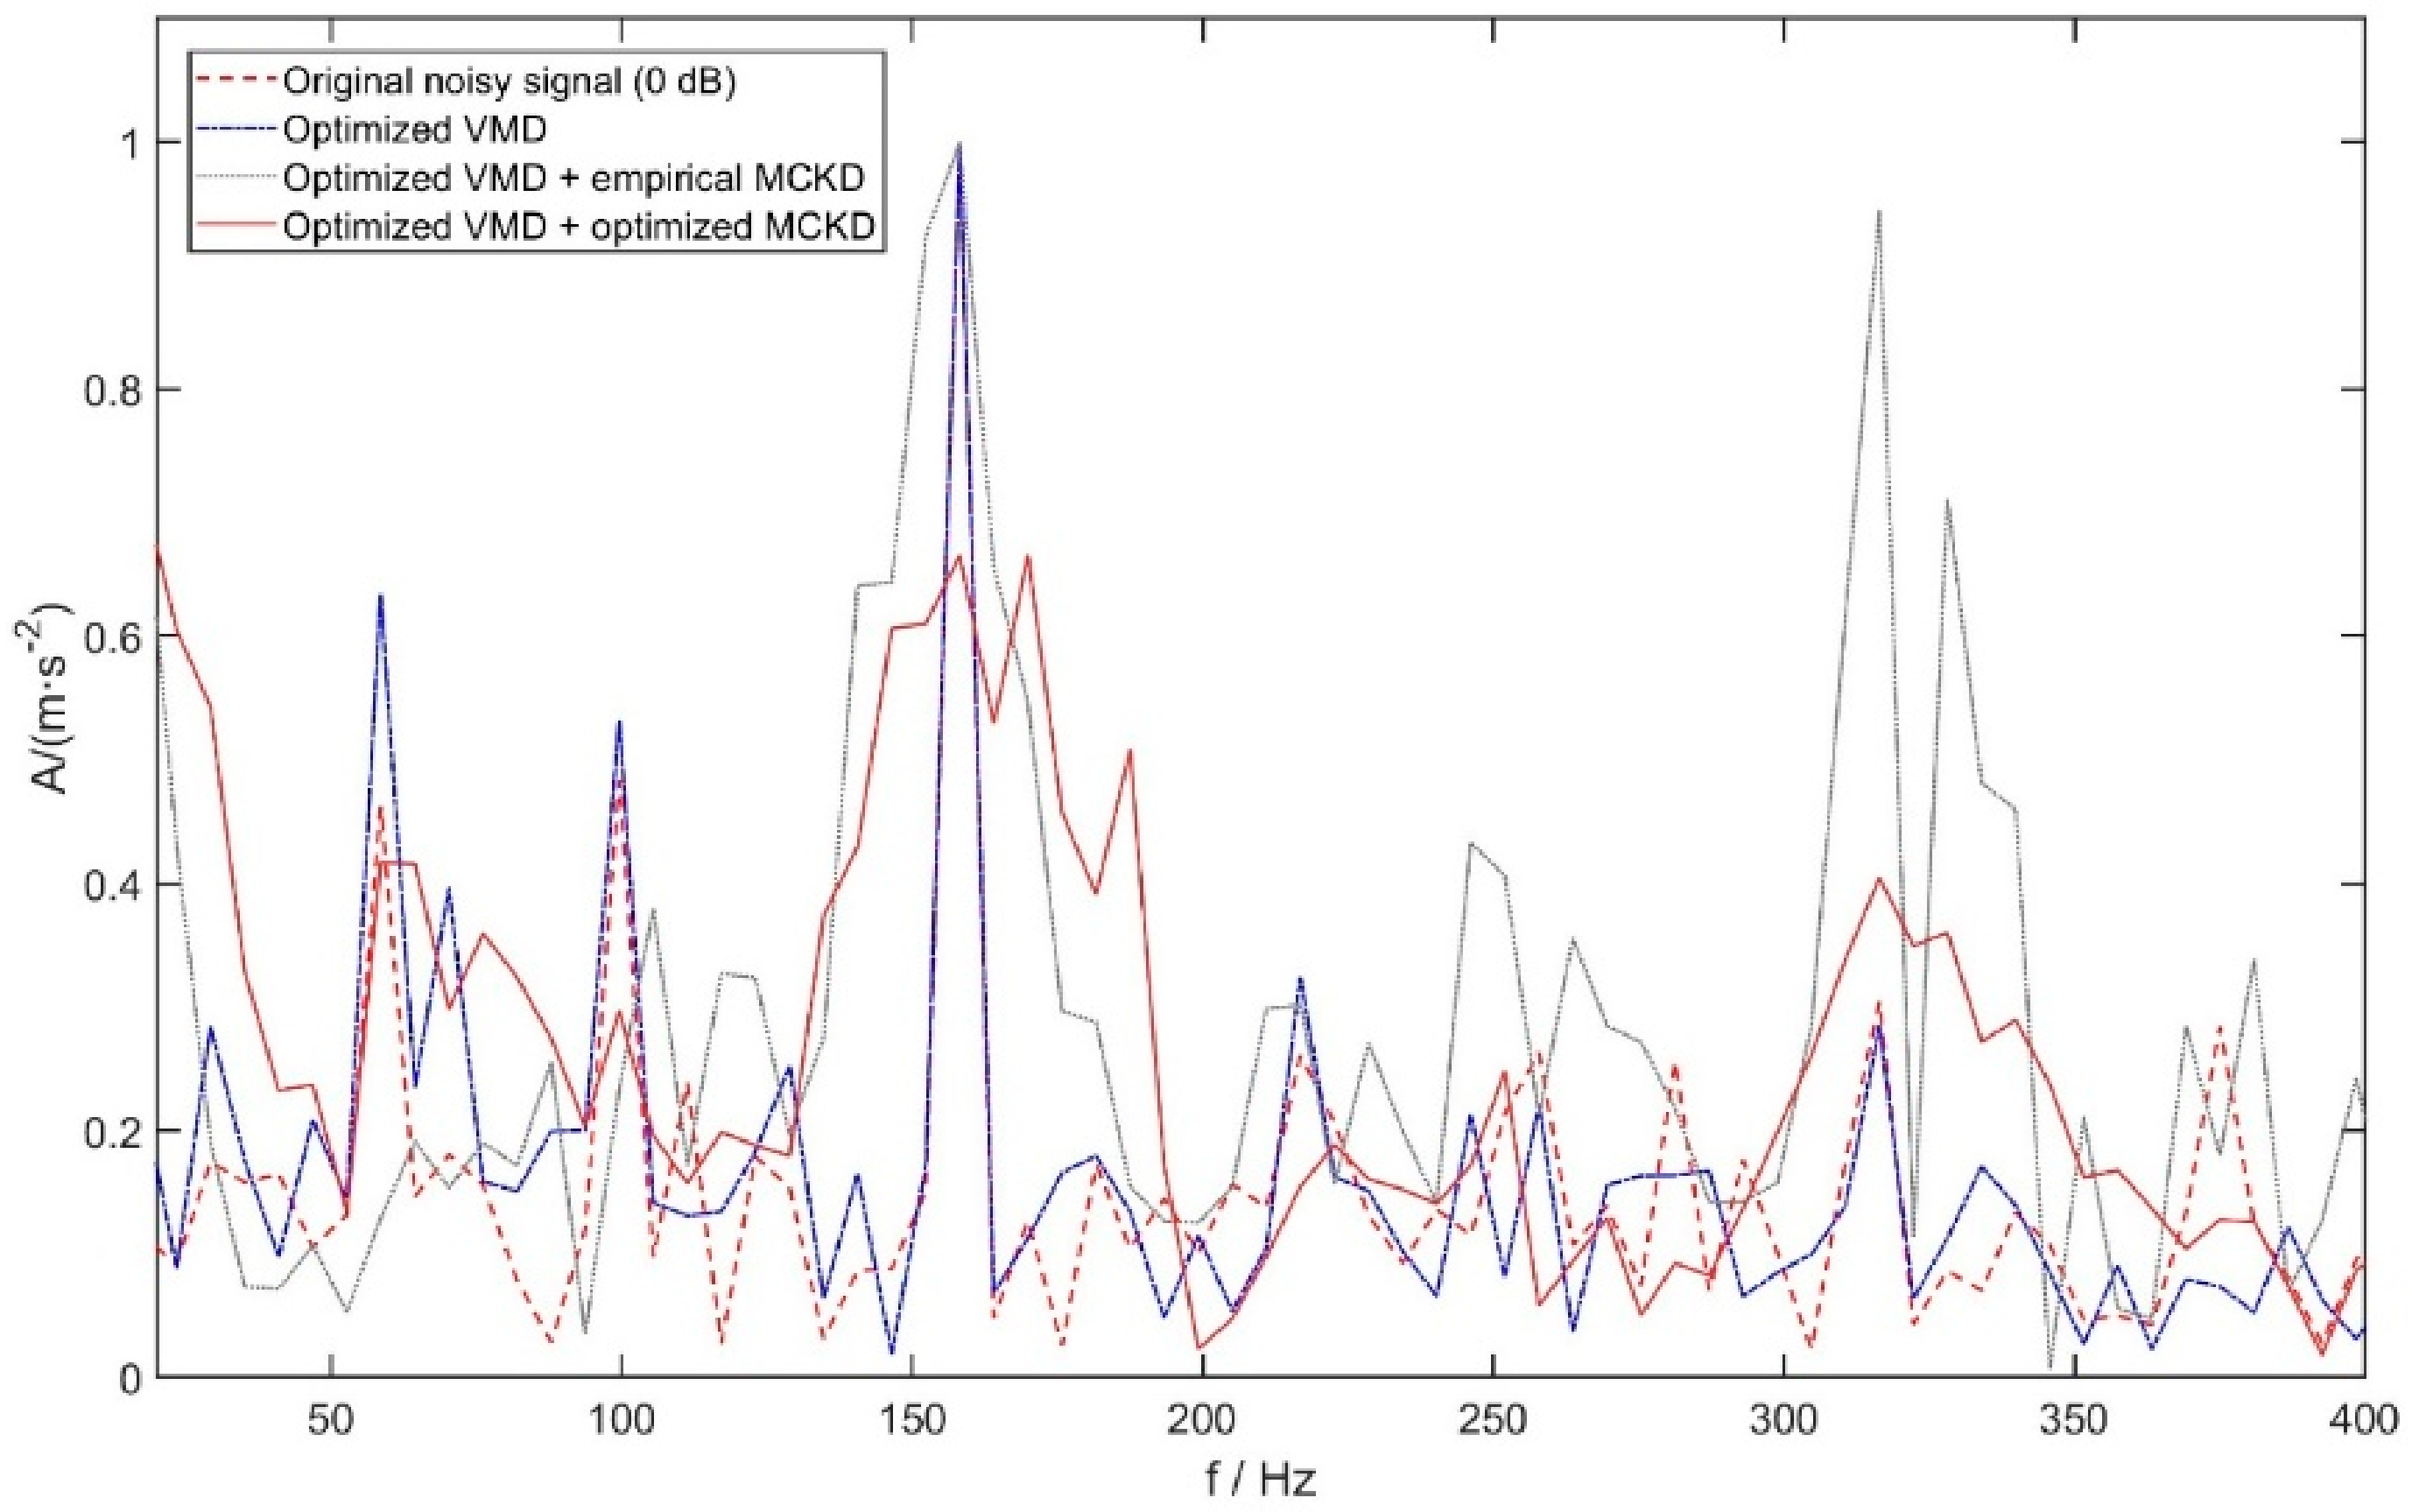
On this basis, the MCKD algorithm is further introduced to perform feature enhancement on the optimal IMF component, so as to improve the identifiability of weak fault features under strong background noise, as shown in Figure 11.
From the comparative results of the normalized envelope spectra, it can be observed that the original noisy signal is severely contaminated by Gaussian noise, with the fault characteristic frequencies masked by massive clutter. After processing by the S-LE-EGWO-optimized VMD, part of the high-frequency random noise is filtered out, and the fault features become preliminarily identifiable. Although the MCKD algorithm with empirically determined parameters can enhance the fault peaks, it simultaneously excites a large number of spurious frequency components, leading to deterioration of the spectral baseline. In contrast, the proposed method employs S-LE-EGWO for joint adaptive optimization of both VMD and MCKD parameters, which not only reinforces the amplitudes of the inner-race fault fundamental frequency and its harmonics, but also effectively suppresses irrelevant noise and spurious peaks across the entire spectrum, thereby significantly improving the extraction capability for weak fault features of rolling bearings under strong noise conditions.
To quantitatively distinguish the amplitude and impulse characteristics of vibration signals under different bearing operating conditions, multiple time-domain statistical indicators are calculated for the signals under normal condition, inner-race fault, outer-race fault, and rolling element fault, with the results presented in Table 3. The table includes nine typical time-domain features, namely mean, variance, peak value, kurtosis, root mean square (RMS), crest factor, impulse factor, shape factor, and margin factor, which can intuitively reflect the differences in amplitude fluctuation and impulse impact among signals with different fault diameters and fault types.
After dataset partitioning, feature normalisation and KPCA projection are fitted solely on training samples. The learned normalisation parameters and KPCA projection matrix are then utilised to transform test-set features without refitting. The first two principal components are taken as inputs of the SVM classifier. SVM hyper-parameter optimisation is implemented via cross-validation within the training set, and the test set is only adopted for final performance assessment.
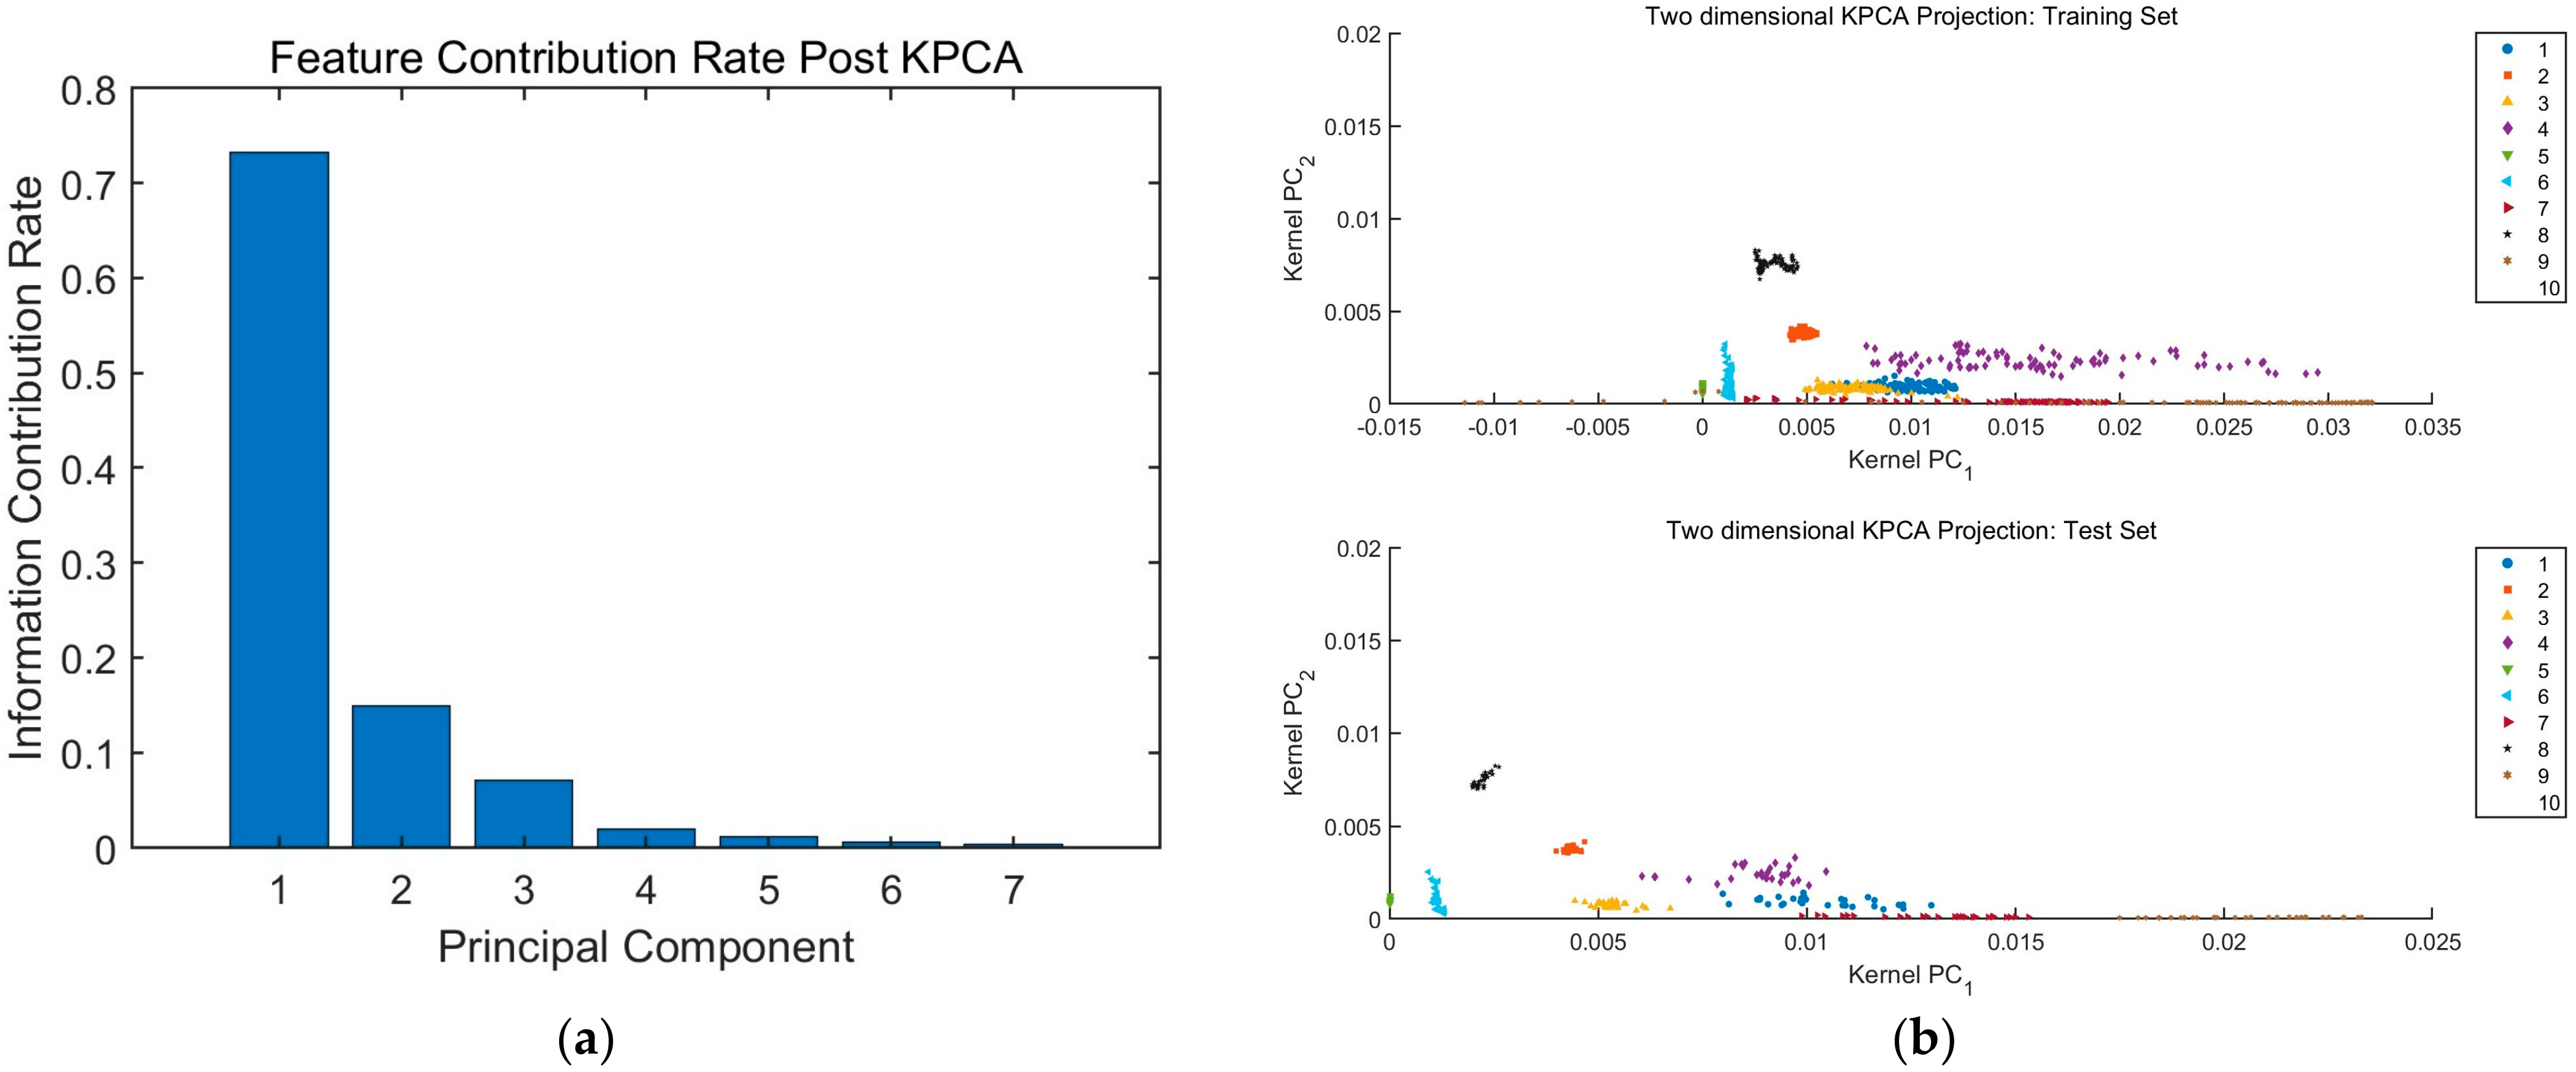
Based on the samples of the ten bearing operating conditions mentioned above, the original high-dimensional feature vectors are constructed. The KPCA algorithm is then employed to perform dimensionality reduction on the feature set. In this paper, the polynomial kernel function is adopted, with the kernel parameter set to 2 and the target dimensionality set to 7. The distribution of information contribution rates of each principal component is shown in Figure 12a, while Figure 12b presents the two-dimensional sample distribution in the KPCA feature space.
The first and second principal components contribute approximately 74% and 15% of the original feature information, respectively, achieving a cumulative contribution of nearly 90%. Although the first two components capture most discriminative fault information, higher-order components still contain valid feature details rather than pure redundant noise. As illustrated in Figure 12a for KPCA dimensionality-reduction analysis, the first nine principal components are adopted for subsequent classification to preserve sufficient multi-domain fault feature information. As shown in Figure 12b, most fault categories form relatively independent clusters in the KPCA feature space, whereas obvious feature overlap occurs among categories 5, 6, 8, 9 and 10, which accounts for the unsatisfactory classification accuracy of category-6. It is worth noting that subfigure (b) is merely a two-dimensional visualization, and the practical classification model uses nine-dimensional feature vectors.
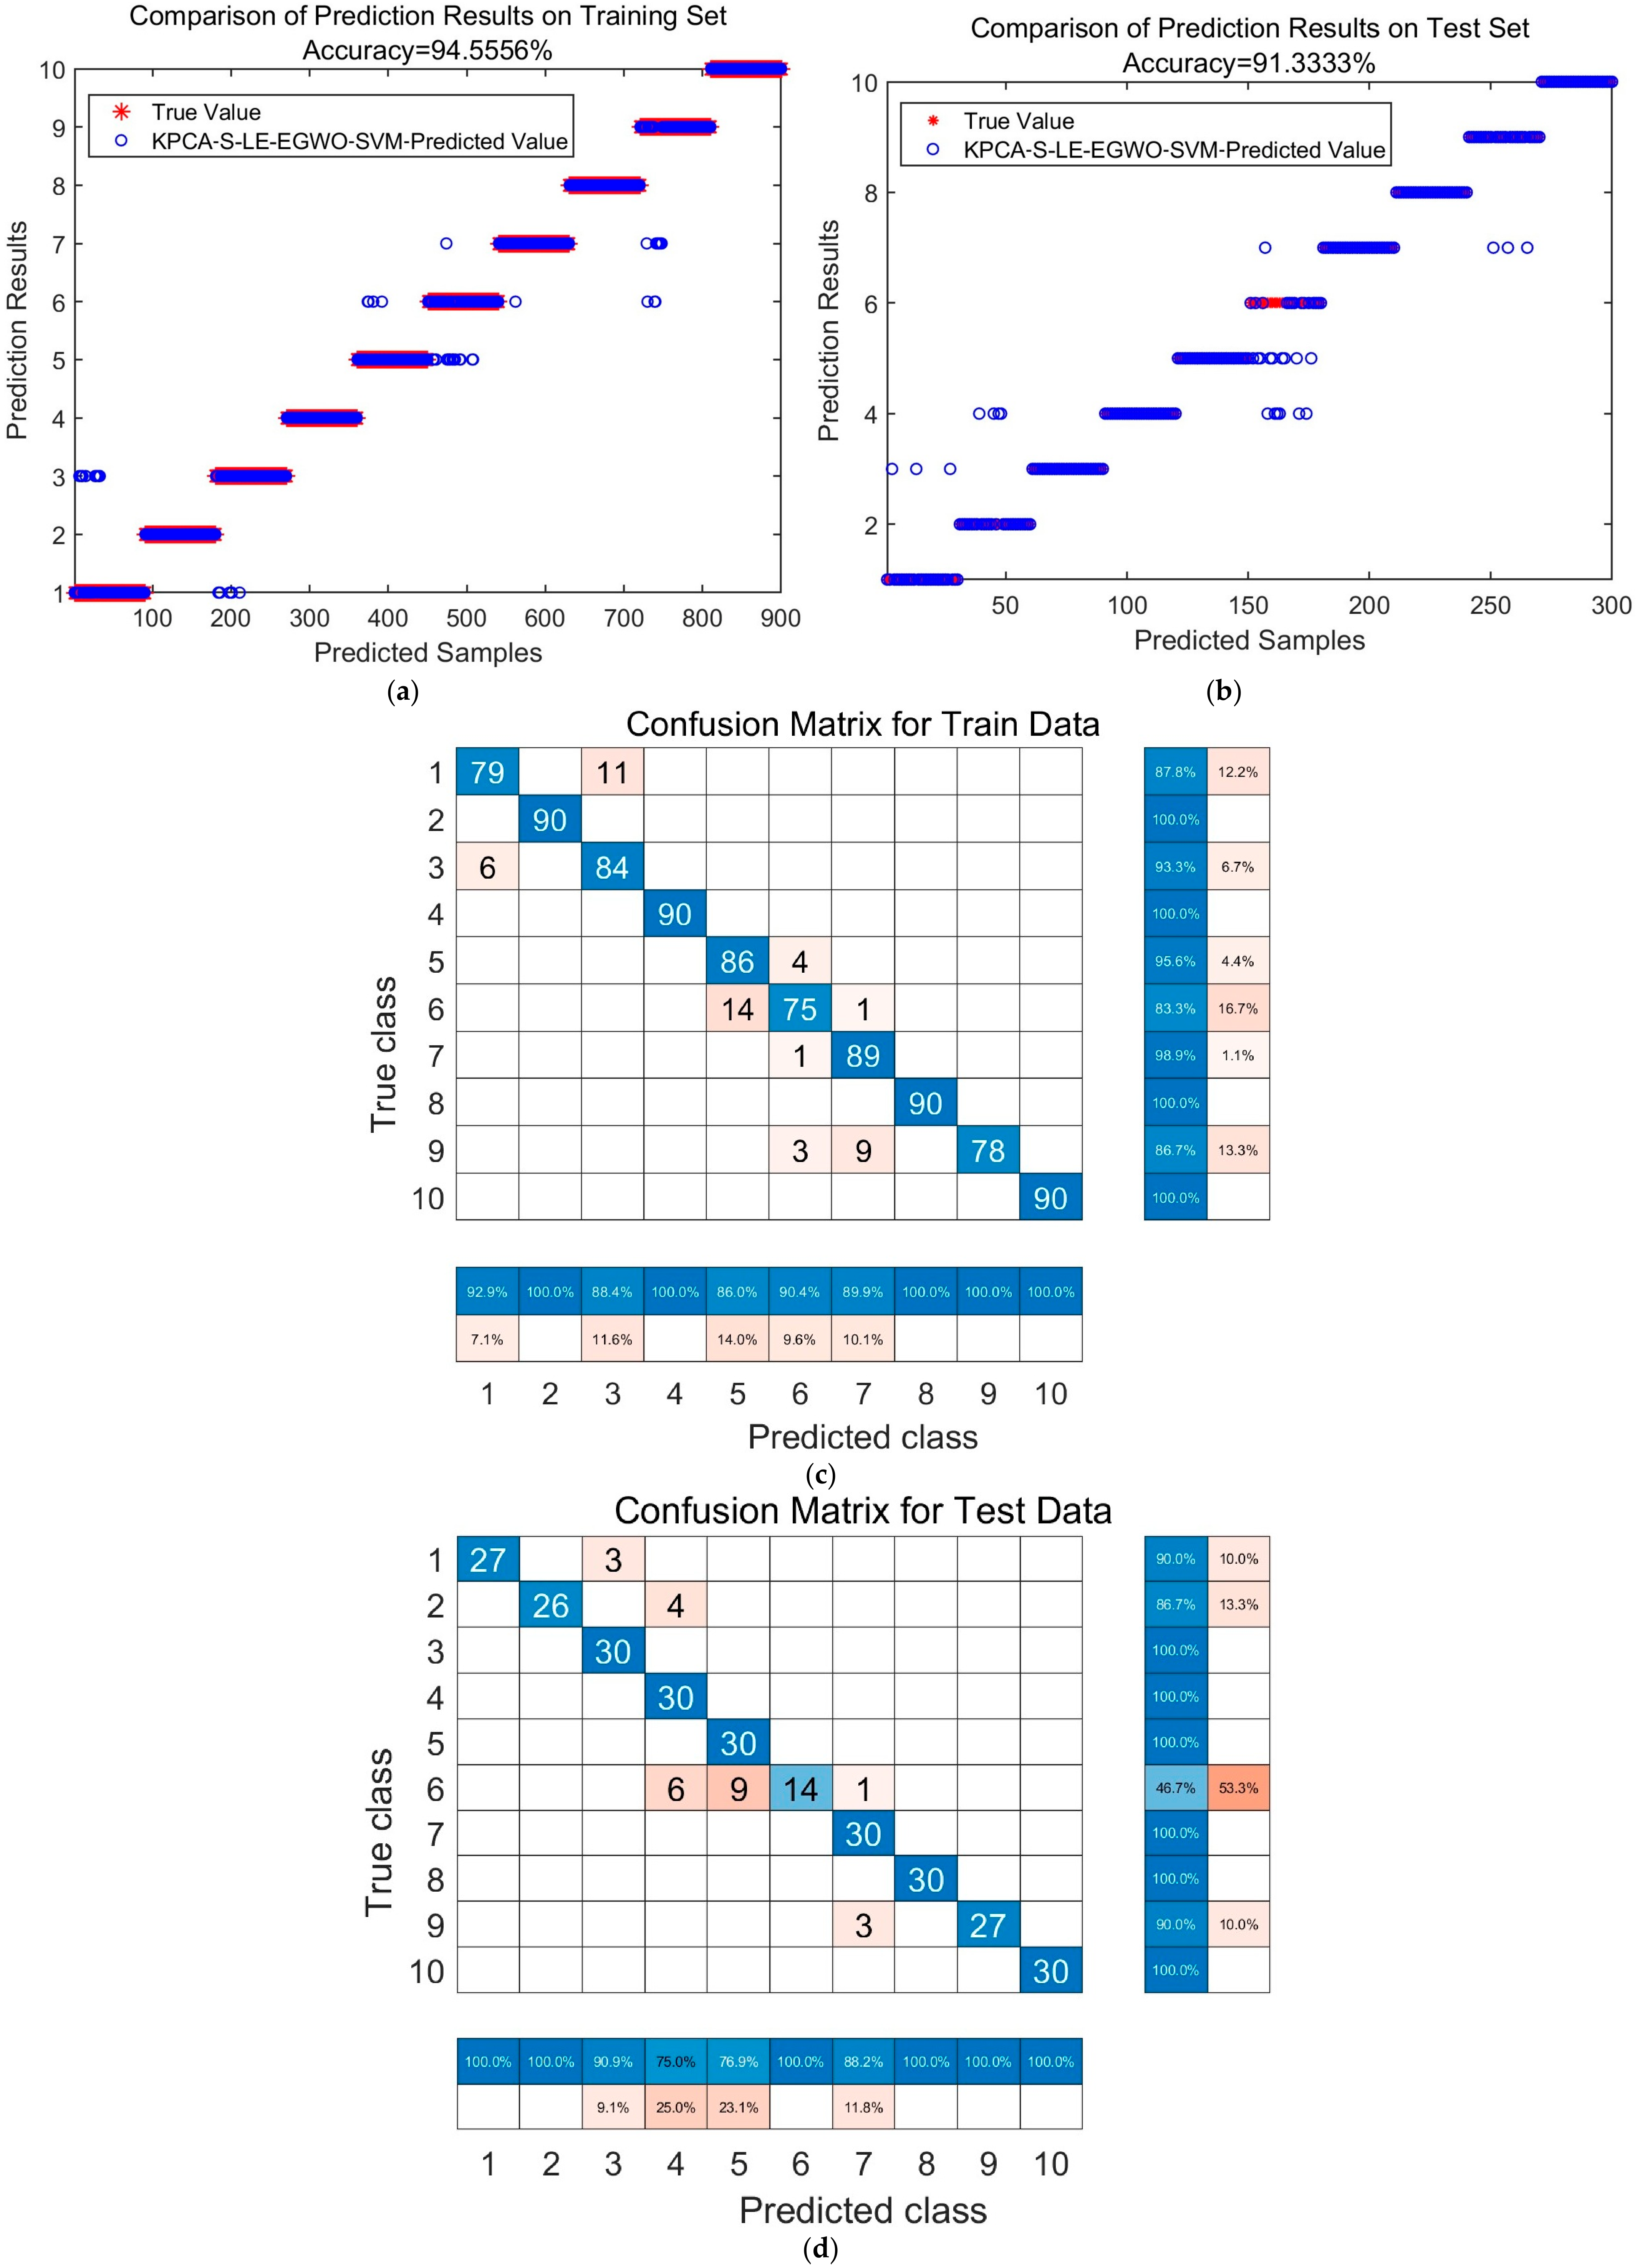
The S-LE-EGWO algorithm is employed to adaptively optimize the core parameters of the SVM model, and the low-dimensional feature vectors obtained after KPCA-based dimensionality reduction are fed into the classifier to accomplish fault identification. The classification accuracy reaches 94.55% on the 960 training samples and 91.33% on the 240 testing samples. There exists a reasonable generalization gap between training and test accuracy without severe over-fitting. Nevertheless, category-6 fault samples show relatively more misclassifications due to feature aliasing with other fault modes. The detailed prediction comparison curves and confusion matrix results are presented in Figure 13.
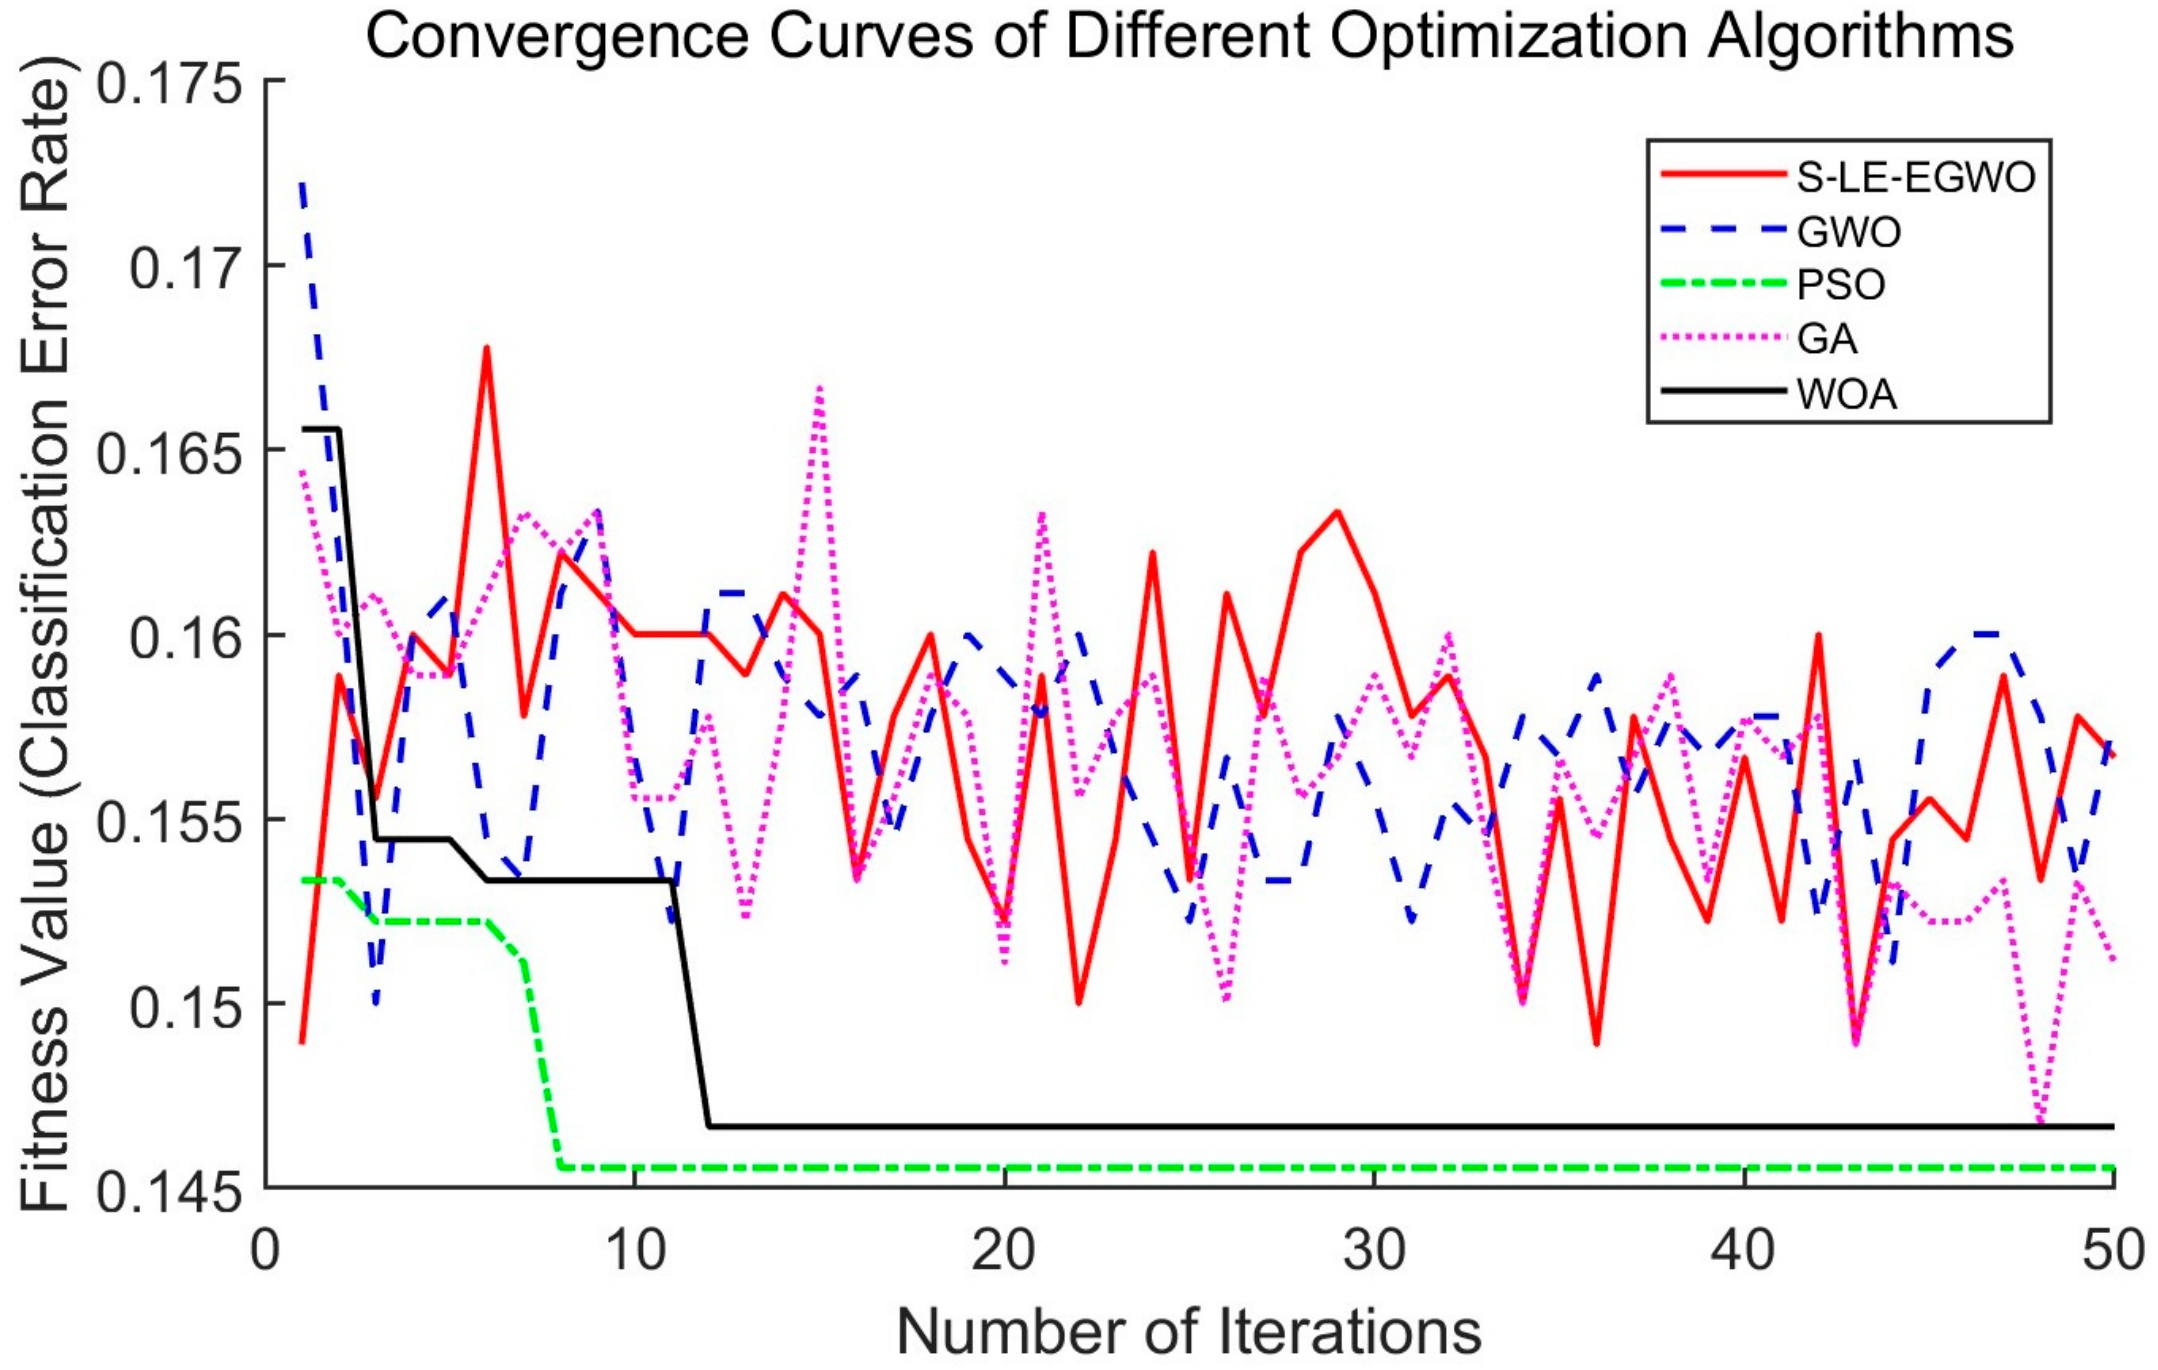
Figure 14 illustrates the convergence curves of the five optimization algorithms for the SVM parameter tuning task. Notably, the curves correspond to one representative independent run, which directly reflects the iterative behaviors of the algorithms. It can be seen that PSO converges rapidly and achieves a relatively lower classification error in this specific run. Nevertheless, single-run results are easily affected by algorithmic randomness. To provide a more robust evaluation, we conducted 15 independent runs for comprehensive statistical comparisons, as summarized in Table 4, to further quantify the performance discrepancies among these methods.
Table 4 summarizes the statistical comparison results of five algorithms for SVM hyper-parameter optimization over 15 independent runs. The fitness value denotes the classification error rate in the parameter-search phase, where a lower value indicates better optimization performance and the standard deviation reflects each algorithm’s operational stability. The mean, standard deviation, maximum and minimum of test-set diagnostic accuracy are also reported to evaluate model stability under different stratified random data partitions. Average convergence iterations and single-trial computational time are also provided. It should be noted that prediction-related figures in the manuscript originate from one representative run for intuitive visualization, while all statistical metrics in Table 4 are aggregated across the repeated experiments. The Wilcoxon rank-sum test is performed with S-LE-EGWO as the reference algorithm. All p-values are less than 0.05, demonstrating statistically significant differences between S-LE-EGWO and the competing algorithms.

5. Conclusions

Aiming at the accurate identification of incipient faults in rolling-bearing vibration signals, this paper constructs an integrated fault-diagnosis framework combining the proposed S-LE-EGWO optimizer with VMD, MCKD, KPCA and SVM. The S-LE-EGWO integrates multiple improvement strategies, including Sobol-sequence-based population initialization, nonlinear convergence factor, Lévy-flight perturbation, and step-size weight based on modified Euclidean distance, to realize collaborative adaptive parameter optimisation for VMD, MCKD and SVM. Multi-domain statistical features in time and frequency domains are extracted from the denoised and purified fault signals, and KPCA is employed to eliminate feature redundancy and perform nonlinear dimensionality reduction. Ablation studies and comparative tests with alternative algorithms are carried out based on the CWRU rolling-bearing dataset. The main conclusions are summarised as follows:
The improved S-LE-EGWO effectively mitigates the inherent drawbacks of the original grey wolf algorithm, such as high randomness in population initialization and premature convergence. By adopting the minimum envelope entropy as the fitness function for adaptive VMD parameter optimisation, the proposed method avoids under-decomposition and over-decomposition and suppresses mode mixing in vibration signals. On this basis, MCKD optimized by S-LE-EGWO is further applied to enhance the extraction of weak periodic fault impulses. The final diagnosis model achieves a classification accuracy of 94.55% on the training set and 91.33% on the test set, exhibiting desirable recognition performance for all ten fault types under the experimental conditions of the CWRU dataset.
Compared with GA, PSO, WOA, and the original GWO, S-LE-EGWO demonstrates relatively faster convergence speed, lower final fitness values, and enhanced overall optimization performance in parameter optimization tasks. Compared with the traditional VMD-SVM method and other diagnostic schemes assisted by single optimization algorithms, the proposed joint optimization framework achieves higher fault identification accuracy.
Although this study has achieved certain promising experimental results, we acknowledge that there are still some limitations. All experiments were conducted on the laboratory CWRU bearing dataset under fixed rotational speed and load conditions. In future work, we will validate the S-LE-EGWO-VMD-MCKD method using bearing signals from real industrial scenarios, different operating conditions, and other independent datasets, to further assess its practical applicability.

Author Contributions

Conceptualization, F.L. and X.Y.; methodology, F.L.; software, F.L.; validation, F.L. and X.Y.; formal analysis, F.L.; investigation, F.L.; resources, X.Y.; data curation, F.L.; writing—original draft preparation, F.L.; writing—review and editing, F.L. and X.Y.; visualization, F.L.; supervision, X.Y.; project administration, X.Y.; funding acquisition, X.Y. All authors have read and agreed to the published version of the manuscript.

Funding

This research received no external funding.

Institutional Review Board Statement

Not Applicable.

Informed Consent Statement

Not Applicable.

Data Availability Statement

Publicly available datasets were analyzed in this study. This work uses the bearing vibration dataset from Case Western Reserve University (CWRU). The dataset can be accessed at: https://engineering.case.edu/bearingdatacenter (accessed on 26 August 2026).

Conflicts of Interest

The authors declare no conflict of interest.

Appendix A

Table A1. Statistical results of minimum envelope entropy obtained by different optimization algorithms over seven independent runs.
AlgorithmMean FitnessStd
S-LE-EGWO0.43680.1926
GWO0.44460.1957
PSO0.44780.1966
GA0.44350.1959
WOA0.43830.1933

References

  1. Chen, Z.; Zhu, L.; Lu, H.; Chen, S.; Zhu, F.; Liu, S.; Han, Y.; Xiong, G. Research on bearing fault diagnosis based on improved genetic algorithm and BP neural network. Sci. Rep. 2024, 14, 15527. [Google Scholar] [CrossRef] [Scilit]
  2. Wang, L.; Zou, T.; Cai, K.; Liu, Y. Rolling bearing fault diagnosis method based on improved residual shrinkage network. J. Braz. Soc. Mech. Sci. Eng. 2024, 46, 172. [Google Scholar] [CrossRef] [Scilit]
  3. Mao, M.; Xu, B.; Sun, Y.; Tan, K.; Wang, Y.; Zhou, C.; Zhou, C.; Yang, J. Application of FCEEMD-TSMFDE and adaptive CatBoost in fault diagnosis of complex variable condition bearings. Sci. Rep. 2024, 14, 30448. [Google Scholar] [CrossRef] [Scilit]
  4. Zhai, Z.; Luo, L.; Chen, Y.; Zhang, X. Rolling bearing fault diagnosis based on a synchrosqueezing wavelet transform and a transfer residual convolutional neural network. Sensors 2025, 25, 325. [Google Scholar] [CrossRef] [Scilit]
  5. Bennia, F.; Moussaoui, S.; Boutalbi, M.C.; Messaoudi, N. Comparative study between EMD, EEMD, and CEEMDAN based on De-Noising Bioelectric Signals. In Proceedings of the 2024 8th International Conference on Image and Signal Processing and Their Applications (ISPA), Biskra, Algeria, 21–22 April 2024; IEEE: New York, NY, USA, 2024; pp. 1–6. [Google Scholar]
  6. Shi, L.; Liu, W.; You, D.; Yang, S. Rolling bearing fault diagnosis based on CEEMDAN and CNN-SVM. Appl. Sci. 2024, 14, 5847. [Google Scholar] [CrossRef] [Scilit]
  7. Pan, Y.; Hu, Z.; Chen, J.; Wang, H.; Hong, R. Improved complete ensemble robust local mean decomposition with adaptive noise for slewing bearings performance degradation assessment. IEEE Access 2022, 10, 78677–78690. [Google Scholar] [CrossRef] [Scilit]
  8. Jin, Z.; Chen, D.; He, D.; Sun, Y.; Yin, X. Bearing fault diagnosis based on VMD and improved CNN. J. Fail. Anal. Prev. 2023, 23, 165–175. [Google Scholar] [CrossRef] [Scilit]
  9. Zhou, T.; Zhang, G.; Cai, Y. Research on Aircraft Engine Bearing Clearance Fault Diagnosis Method Based on MFO-VMD and GMFE. J. Mech. Mater. Mech. Res. 2024, 7. [Google Scholar] [CrossRef] [Scilit]
  10. Ma, Z.; Zhang, Y. A study on rolling bearing fault diagnosis using RIME-VMD. Sci. Rep. 2025, 15, 4712. [Google Scholar] [CrossRef] [Scilit]
  11. Chen, L.; Bai, X.; He, Y.; Jia, D.; Li, Y.; Li, Z. Multi-fault diagnosis and damage assessment of rolling bearings based on IDBO-VMD and CNN-BiLSTM. Sci. Rep. 2025, 15, 31121. [Google Scholar] [CrossRef] [Scilit]
  12. Zhou, J.; Xiao, M.; Niu, Y.; Ji, G. Rolling Bearing Fault Diagnosis Based on WGWOA-VMD-SVM. Sensors 2022, 22, 6281. [Google Scholar] [CrossRef] [Scilit]
  13. Mcdonald, G.L.; Zhao, Q.; Zuo, M.J. Maximum correlated Kurtosis deconvolution and application on gear tooth chip fault detection. Mech. Syst. Signal Process. 2012, 33, 237–255. [Google Scholar] [CrossRef] [Scilit]
  14. Ke, Z.; Liu, H.; Shi, J.; Shi, B. Fault diagnosis method of weak vibration signal based on improved VMD and MCKD. Meas. Sci. Technol. 2024, 35, 025113. [Google Scholar] [CrossRef] [Scilit]
  15. Du, Y.; Li, G. Application of adaptive MCKD method optimized by SSA based on mixed strategy in rolling bearing fault diagnosis. J. Adv. Mech. Des. Syst. Manuf. 2023, 17, JAMDSM0058. [Google Scholar] [CrossRef] [Scilit]
  16. Li, D.; Li, M.; Yang, L.; Wang, X.; Zhang, F.; Liang, Y. Rolling bearing fault diagnosis in strong noise background based on vibration signals. Signal Image Video Process. 2024, 18, 1295–1303. [Google Scholar] [CrossRef] [Scilit]
  17. Zhang, X.; Zhao, J.; Teng, H.; Liu, G. A novel faults detection method for rolling bearing based on RCMDE and ISVM. J. Vibroengineering 2019, 21, 2148–2158. [Google Scholar] [CrossRef] [Scilit]
  18. Wang, B.; Ji, C.; Wang, Y.; Li, X.; Hu, X. A Rolling Bearing Fault Diagnosis Technique Based on WOA-VMD-SVM. Int. J. Acoust. Vib. 2026, 31, 3. [Google Scholar] [CrossRef] [Scilit]
  19. Qiao, Z.; Liu, Y.; Liao, Y. An improved method of EWT and its application in rolling bearings fault diagnosis. Shock Vib. 2020, 2020, 4973941. [Google Scholar] [CrossRef] [Scilit]
  20. Rezazadeh, N.; Caputo, F.; Aversano, A.; Lamanna, G.; De Luca, A.; Perfetto, D. Prototype-attention domain adaptation for explainable bearing fault diagnosis. Procedia Struct. Integr. 2026, 80, 411–417. [Google Scholar] [CrossRef] [Scilit]
  21. Dragomiretskiy, K.; Zosso, D. Variational mode decomposition. IEEE Trans. Signal Process. 2014, 62, 531–544. [Google Scholar] [CrossRef] [Scilit]
  22. Mirjalili, S.; Mirjalili, S.M.; Lewis, A. Grey wolf optimizer. Adv. Eng. Softw. 2014, 69, 46–61. [Google Scholar] [CrossRef] [Scilit]
  23. Ye, J.; Shi, R.; Guo, C. Research on hierarchical emergency resource scheduling for island petrochemical enterprises based on improved multi-objective grey wolf optimization algorithm. Energy 2025, 322, 135791. [Google Scholar] [CrossRef] [Scilit]
  24. Zhao, W.; Wang, L.; Zhang, Z.; Fan, H.; Zhang, J.; Mirjalili, S.; Khodadadi, N.; Cao, Q. Electric eel foraging optimization: A new bio-inspired optimizer for engineering applications. Expert Syst. Appl. 2024, 238, 122200. [Google Scholar] [CrossRef] [Scilit]
  25. Yan, F.; Xu, X.; Xu, J. Grey Wolf Optimizer With a Novel Weighted Distance for Global Optimization. IEEE Access 2020, 8, 120173–120197. [Google Scholar] [CrossRef] [Scilit]
  26. Yi, C.; Lv, Y.; Dang, Z. A fault diagnosis scheme for rolling bearing based on particle swarm optimization in variational mode decomposition. Shock Vib. 2016, 2016, 9372691. [Google Scholar] [CrossRef] [Scilit]
  27. Wang, Y.; Markert, R.; Xiang, J.; Zheng, W. Research on variational mode decomposition and its application in detecting rub-impact fault of the rotor system. Mech. Syst. Signal Process. 2015, 60, 243–251. [Google Scholar] [CrossRef] [Scilit]
  28. Lei, Y.; Lin, J.; He, Z.; Zuo, M.J. A review on empirical mode decomposition in fault diagnosis of rotating machinery. Mech. Syst. Signal Process. 2013, 35, 108–126. [Google Scholar] [CrossRef] [Scilit]
  29. Wang, Z.; Yao, L.; Cai, Y. Rolling bearing fault diagnosis using generalized refined composite multiscale sample entropy and optimized support vector machine. Measurement 2020, 156, 107574. [Google Scholar] [CrossRef] [Scilit]
  30. Cervantes, J.; Garcia-Lamont, F.; Rodríguez-Mazahua, L.; Lopez, A. A comprehensive survey on support vector machine classification: Applications, challenges and trends. Neurocomputing 2020, 408, 189–215. [Google Scholar] [CrossRef] [Scilit]
  31. Zhang, X.; Li, C.; Wang, X.; Wu, H. A novel fault diagnosis procedure based on improved symplectic geometry mode decomposition and optimized SVM. Measurement 2020, 173, 108644. [Google Scholar] [CrossRef] [Scilit]
  32. Smith, W.A.; Randall, R.B. Rolling element bearing diagnostics using the Case Western Reserve University data: A benchmark study. Mech. Syst. Signal Process. 2015, 64–65, 100–131. [Google Scholar] [CrossRef] [Scilit]
Figure 1. Comparison of sample distributions under different initialization strategies. (a) Sobol-sequence-based initialization: individuals are uniformly distributed across the entire search space [0, 1]2 without obvious clustering; (b) Uniform random initialization: local aggregation and vacant regions of sample points can be observed.
Applsci 16 08631 g001
Figure 2. Convergence curves of GA, PSO, WOA, standard GWO and the proposed S-LE-EGWO algorithm with minimum envelope entropy as the objective function. Note: The convergence curve corresponds to one representative independent run.
Applsci 16 08631 g002
Figure 3. Convergence curves of minimum envelope entropy under different improved strategies in ablation experiments. Note: Convergence curves correspond to a single representative run, only for demonstrating iterative behaviors. Note: The above convergence curves are obtained from one representative independent run to allow an intuitive observation of the iterative characteristics.
Applsci 16 08631 g003
Figure 4. Flowchart of VMD parameter optimization based on the improved S-LE-EGWO algorithm.
Applsci 16 08631 g004
Figure 5. The optimization process of SVM based on the S-LE-EGWO algorithm.
Applsci 16 08631 g005
Figure 6. Flowchart of bearing fault diagnosis method with joint optimization based on S-LE- EGWO.
Applsci 16 08631 g006
Figure 7. Schematic diagram of the rolling bearing test rig from Case Western Reserve University.
Applsci 16 08631 g007
Figure 8. Tim−domain waveforms and envelope spectra of bearing vibration signals under different inner race fault severities. (a) Normal condition; (b) Inner race fault with 0.007″ damage diameter (early stage); (c) Inner race fault with 0.014″ damage diameter (middle stage); (d) Inner race fault with 0.021″ damage diameter (late stage).
Applsci 16 08631 g008
Figure 9. VMD decomposition results of the 0.007″ inner race fault signal optimized by S−LE−EGWO, where α = 2000 and K = 6 . The left column presents the time−domain waveforms of each IMF, and the right column shows the corresponding envelope spectra.
Applsci 16 08631 g009
Figure 10. Tim−domain waveform and envelope spectrum of IMF5 reconstructed signal (a) Time−domain waveform; (b) Envelope spectrum.
Applsci 16 08631 g010
Figure 11. Comparison of envelope spectra obtained by different processing methods.
Applsci 16 08631 g011
Figure 12. KPCA dimensionality-reduction analysis results. (a) Information contribution rate of each principal component after KPCA dimensionality reduction; (b) Two-dimensional KPCA projection distribution of training and test samples.
Applsci 16 08631 g012
Figure 13. Prediction comparison and confusion matrix of the proposed KPCA-S-LE-EGWO-SVM diagnostic model. (a) Comparison between true labels and predicted results of the training set, with overall classification accuracy reaching 94.55%; (b) Prediction result comparison on the test set, achieving an accuracy of 91.33%; (c) Confusion matrix of training samples for 10 bearing health states; (d) Confusion matrix of test samples corresponding to ten bearing working conditions. Blue cells denote correct classification predictions, and light-beige cells represent misclassified samples.
Applsci 16 08631 g013
Figure 14. Convergence curves of different optimization algorithms. Note that the curves are ob tained from one representative independent run for intuitive observation of iterative behavior.
Applsci 16 08631 g014
Table 1. Statistical comparison of different optimization algorithms for SVM parameter-optimization.
AlgorithmParameterValue/Search RangeDescription
S-LE-EGWO optimizerPopulation size N p o p 20Number of search agents
Maximum iteration I t e r max 50Termination condition for optimization
Search bound for SVM [ l b , u b ] [0.01, 100]Lower-upper bounds for SVM c and g
Independent runs15Repeated trials for statistical comparison
Fitness evaluation3-fold cross-validationFitness calculation in parameter-searching loop
VMDMode number K Optimized by S-LE-EGWONumber of decomposition modes
Penalty factor α Optimized by S-LE-EGWOVMD penalty coefficient
Convergence tolerance 10 7 Iterative stopping threshold of VMD
MCKDMaximum inner iterations20
Calculated from theoretical fault frequency
Internal iteration upper limit
Fault period T Period parameter for MCKD filtering
SVMKernel functionRadial basis function (RBF)Kernel type
Penalty coefficient c Optimized by S-LE-EGWOSVM penalty factor
Kernel width g Optimized by S-LE-EGWORBF kernel parameter
Table 2. Kurtosis and correlation coefficient between each IMF component decomposed by VMD and the original vibration signal.
ParameterIMF
IMF1IMF2IMF3IMF4IMF5IMF6
Kurtosis2.00353.79942.14182.96795.19582.6527
Correlation coefficient0.23110.29220.32610.45560.61530.5197
Table 3. Time-domain statistical feature parameters of vibration signals under various bearing health states.
Statistical Time-Domain Feature Indicators
Bearing ConditionFault DiameterMean VarPeak KurRMS CFIFWFCLF
NormalNone0.00920.00110.19563.25550.03455.65737.20891.27428.6699
Inner race0.17780.00510.00360.33612.60410.06035.56866.86761.23328.0395
0.35560.00000.00070.16762.79940.02776.04047.52251.24548.8912
0.53340.00450.00760.47012.41660.08735.38416.54571.21577.6143
Outer race0.17780.00870.00080.18573.12280.03056.08567.80711.28289.3805
0.35560.00130.00090.15912.51580.03035.23636.39101.22057.4555
0.53340.00840.00010.05262.59160.01323.96104.75561.20065.4617
Roller0.17780.02520.00220.30563.17760.05155.92397.32591.23668.5415
0.35560.01790.00010.05762.56070.02072.77613.16331.13943.4735
0.53340.01560.91474.22820.12527.30389.61261.31611.15900.0156
Table 4. Statistical results over 15 independent stratified-partition runs.
AlgorithmMean FitnessStdMean Acc (%)Std_AccMax
Acc (%)
Min
Acc (%)
p -Value (vs. S-LE-EGWO) Convergence IterationComputational Time (s)
S-LE-EGWO0.156671.24 × 10−391.270.8292.6789.7131.422.7
GWO0.157781.86 × 10−390.151.1391.8487.923.12 × 10−337.621.5
PSO0.145562.11 × 10−388.731.4190.9586.224.75 × 10−642.224.1
GA0.151111.63 × 10−389.461.0591.2887.361.84 × 10−440.528.3
WOA0.146671.95 × 10−388.911.2690.7486.532.33 × 10−539.123.4
Disclaimer/Publisher’s Note: The statements, opinions and data contained in all publications are solely those of the individual author(s) and contributor(s) and not of MDPI and/or the editor(s). MDPI and/or the editor(s) disclaim responsibility for any injury to people or property resulting from any ideas, methods, instructions or products referred to in the content.