1. Introduction
The 1973
MS7.6 Luhuo earthquake is the most representative strike-slip event in the Xianshuihe fault zone, and the near-fault ground motion of such events is of direct concern to railways, bridges, and hydropower stations along strike-slip faults in the Sichuan-Yunnan region. In particular, the velocity pulses, permanent displacements, and spatial heterogeneity of near-fault ground motion can strongly influence the seismic response of bridges, base-isolated buildings, and wind turbines, as well as the selection of design ground motions [
1,
2,
3]. In addition, determining appropriate setback distances from active strike-slip faults is a critical consideration for infrastructure planning in seismically active regions, including the Sichuan-Yunnan area [
4]. The earthquake occurred at 18:37:05 local time on 6 February 1973, with its instrumental epicenter at 31.50° N, 100.40° E, the macroseismic epicenter near Xialatuo in Luhuo County, and a focal depth of 11 km [
5,
6]. The surface-wave magnitude was
MS7.6 [
7,
8,
9], the USGS reported
MS7.5 [
10], and the moment magnitude was
MW7.3 [
11].
The Xianshuihe fault lies at the northeastern edge of the Sichuan-Yunnan block. Reactivated by the sustained southeastward extrusion of the eastern Tibetan Plateau, it has remained highly active and is one of the most seismically active large fault zones in continental China [
7,
12,
13,
14,
15]. The fault zone has a complex geometry and pronounced segmentation. Taking the Huiyuansi pull-apart basin as the boundary, it divides into a northwestern segment and a southeastern segment with markedly different structures: the northwestern segment is relatively simple and straight, whereas the southeastern segment consists of several subsidiary faults and is structurally complex. The late Quaternary left-lateral slip rate increases from northwest to southeast, from 8–11 mm/yr on the northwestern segment to 8–12 mm/yr on the southeastern segment and 9.6–13.4 mm/yr on the Moxi fault [
16]. The northwestern segment trends approximately N45° W over a total length of about 180 km, with a seismogenic width of approximately 20 km. It comprises several subfaults with branching and echelon-like structures; two possible stepovers have been identified near Renda and Jueluosi, and the dip varies from steeply northeast-dipping to nearly vertical. Such geometric complexities may exert a first-order control on the style of rupture propagation and termination [
17,
18,
19,
20,
21,
22,
23].
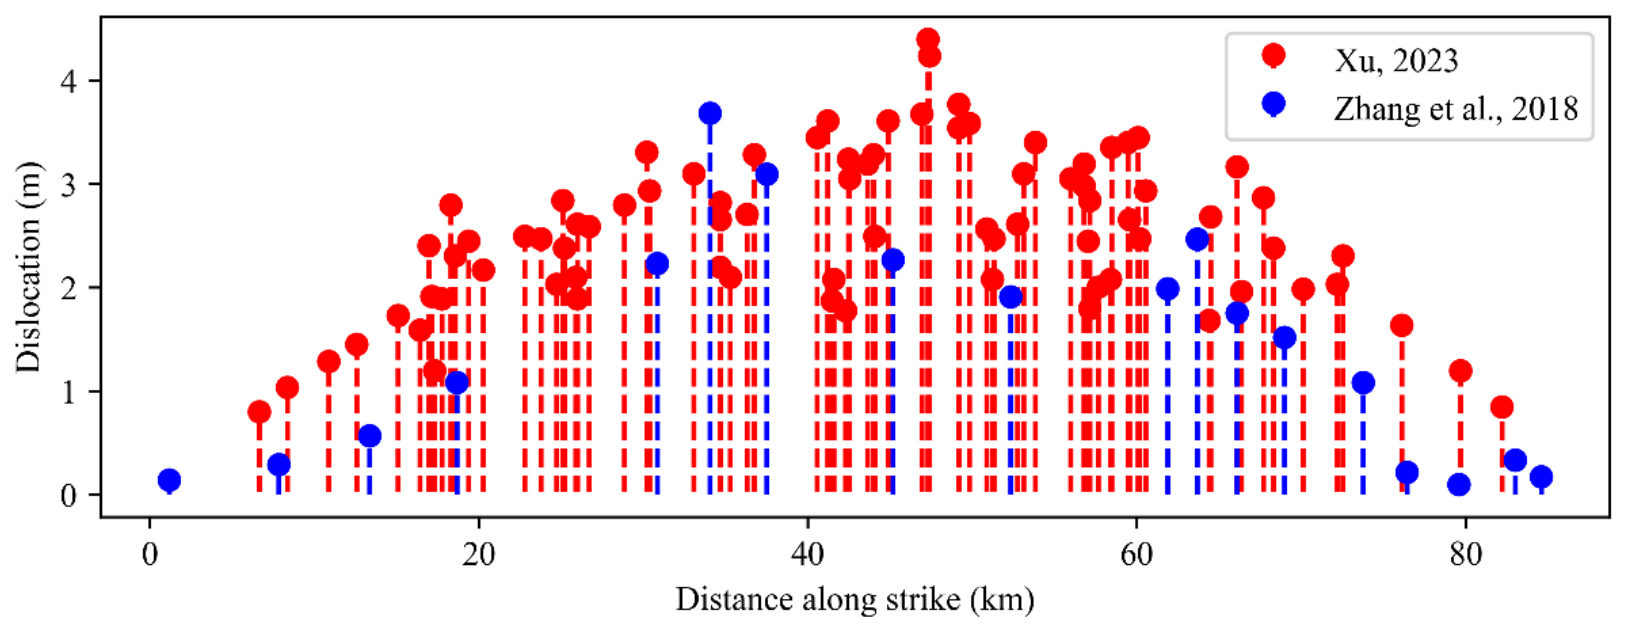
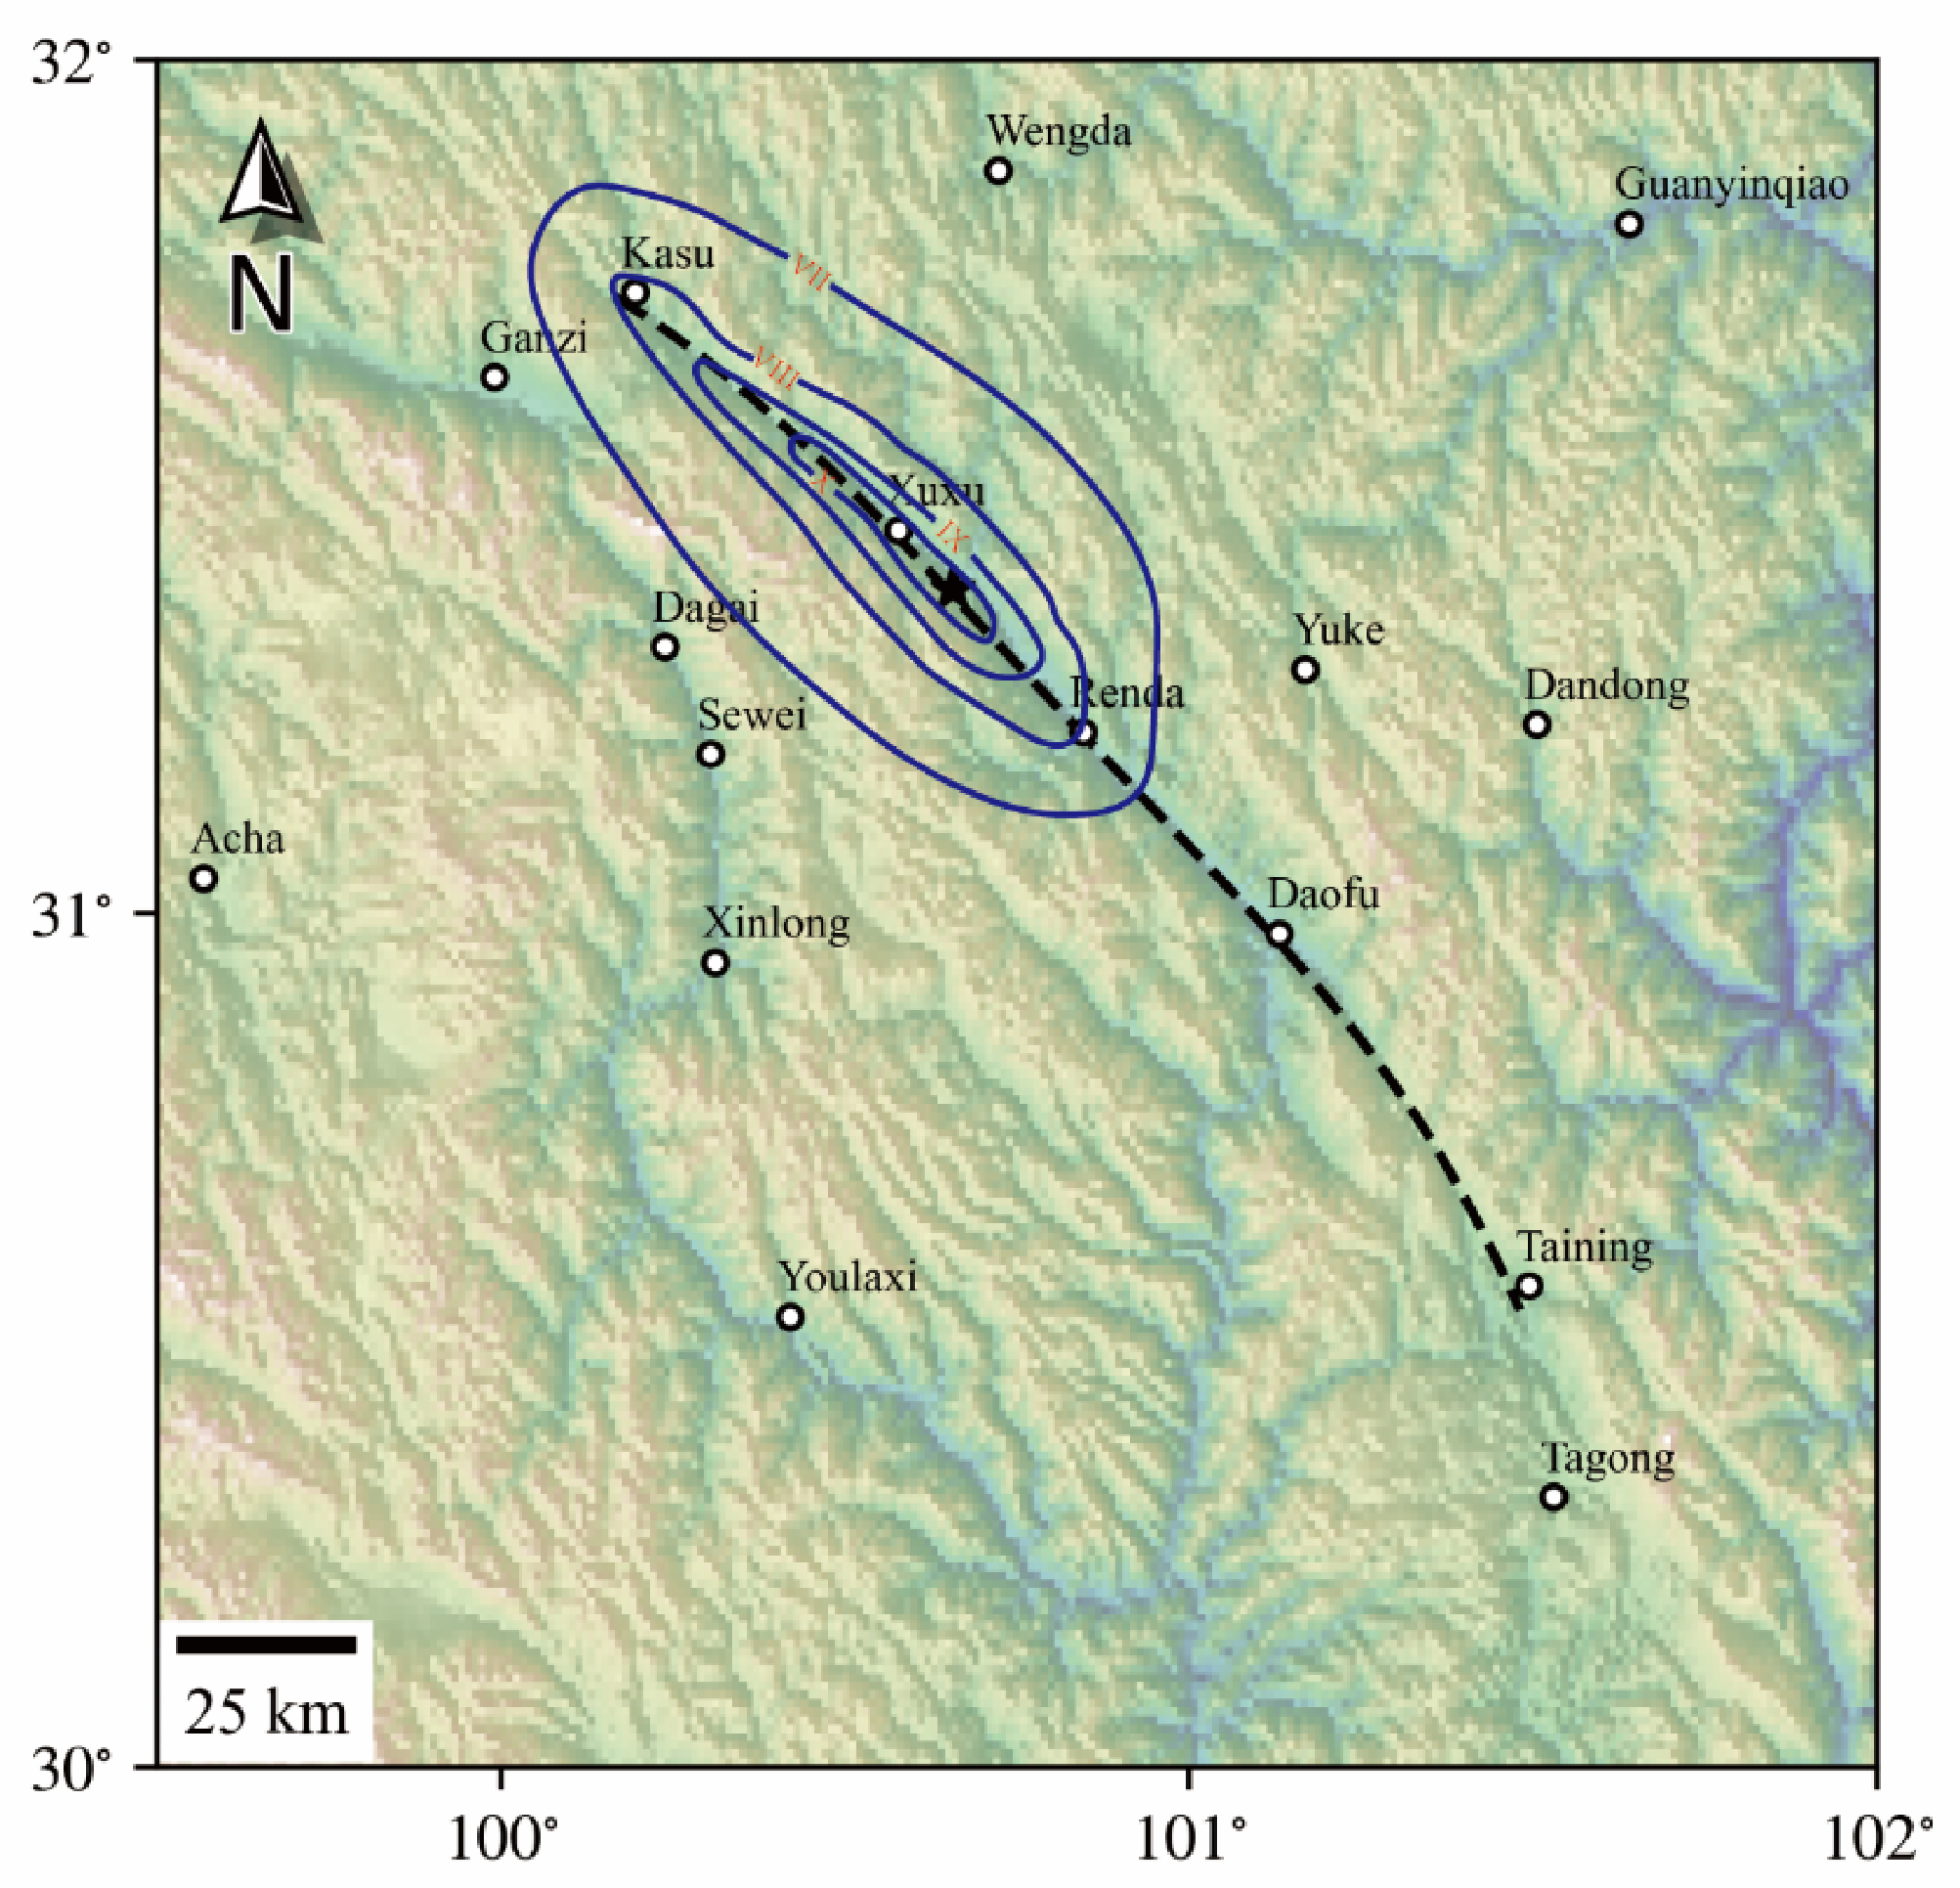
The surface rupture of the Luhuo earthquake extends from Kasu in the northwest to Renda in the southeast—about 90 km in total—and is expressed mainly as fault scarps and ground fissure belts. The maximum left-lateral surface offset of 4.0 m occurred near Xuxu (
Figure 1). Because the surface rupture coincides closely with the northwestern segment of the Xianshuihe fault, that segment is identified as the seismogenic fault. In addition to surface faulting, the earthquake triggered widespread rockfalls, landslides, and sand liquefaction, whose distribution is closely related to near-fault ground-motion characteristics and local site conditions [
9,
24,
25]. The observed intensity distribution (
Figure 2) shows elongated isoseismals that are nearly symmetric about the causative fault, attenuate rapidly perpendicular to the strike and slowly along-strike, and decay faster toward the southeast than toward the northwest. The VIII area of intensity and above has a spoon-shaped pattern, and the maximum intensity reached X on the China seismic intensity scale [
6,
9].
The dynamic rupture behavior and ground-motion characteristics of strike-slip faults have also drawn extensive attention in other intracontinental settings. For instance, the 6 February 2023 Kahramanmaraş earthquake sequence in the East Anatolian Fault Zone (EAFZ) provided critical insights into the relationship between source parameters and structural damage patterns along major strike-slip systems [
26]. The EAFZ shares important tectonic similarities with the Xianshuihe fault as an active intracontinental strike-slip boundary, and comparative studies between these fault systems can enhance our understanding of fault segmentation and seismic hazard. In addition, dynamic rupture simulations have been successfully applied to other major Chinese earthquakes, such as the 2008 Wenchuan
MW7.9 earthquake, where 3D curve-grid finite-difference methods were used to simulate spontaneous rupture and near-field strong ground motion [
27]. These methodological precedents inform the modeling strategy adopted in this study.
Several studies have inverted the rupture process of the Luhuo earthquake, but the results differ considerably. Estimated rupture lengths range from 71 km [
28] to 105 km [
10]; average strike-slip displacements range from 3.8 m [
29] to 4.9 m [
10]; and seismic moments range from 8.22 × 10
19 N·m [
11] to 1.9 × 10
20 N·m [
10], corresponding to
MW7.3 to 7.44. Key source parameters therefore remain unresolved. Beyond these uncertainties, the earthquake exhibited a notable rupture pattern: propagation was bilateral, yet the seismogenic fault did not break through completely, stopping spontaneously near Renda instead of continuing southeastward along the northwestern segment.
Notably, numerical simulation is now widely used to investigate the rupture process of strong earthquakes and the characteristics of near-fault ground motion. For example, dynamic rupture simulations using 3D curve-grid finite-difference methods have been successfully applied to the 2008 Wenchuan earthquake, demonstrating the capability of such approaches to reproduce spontaneous rupture and near-field strong ground motion in complex fault settings [
27]. Within the kinematic source framework, deterministic simulations have reproduced the broadband ground motion of recent strike-slip events such as the 2022
MS6.9 Menyuan earthquake [
30], and hybrid schemes that couple the frequency-wavenumber method with the spectral element method [
31,
32] have greatly improved the efficiency of near-fault ground-motion simulation. Kinematic models, however, prescribe the slip distribution and the space-time evolution of rupture in advance and cannot mechanically explain why a rupture nucleates, propagates, and stops where it does. Dynamic rupture simulation instead takes the initial stress state and a friction law as input so that the initiation, growth, and arrest of rupture emerge spontaneously as mechanical results. It links the regional stress field, the fault geometry, and stress perturbations directly to the ground-motion field, providing a suitable framework for investigating the termination of the Luhuo rupture. Local topography and site conditions such as mountains and basins also significantly scatter and amplify seismic waves [
33,
34,
35] and should not be neglected in near-fault ground-motion assessment.
In this study, we simulate the dynamic rupture and ground motion of the Luhuo earthquake using the spectral element method, systematically examining the effects of regional stress orientation, fault geometry, and the stress perturbation inherited from a historical earthquake on rupture behavior and intensity distribution. The simulated results are compared with observations of magnitude, rupture length, surface offsets, and intensity to identify rupture scenarios consistent with the data. We first determine the preferred stress orientation, then evaluate the role of fault geometry in rupture termination, and finally introduce the stress perturbation from the 1923 Daofu earthquake to test its influence on rupture propagation.
3. Rupture Process and Ground-Motion Analysis
3.1. Orientation of the Regional Maximum Principal Stress
To constrain a plausible orientation of the regional maximum principal compressive stress, four vertical fault models were run with orientation angles (
θ) of N85° W, N80° W, N75° W, and N70° W, and the preferred direction was selected by comparing the simulated slip distributions, surface offsets, and intensity patterns with the observations.
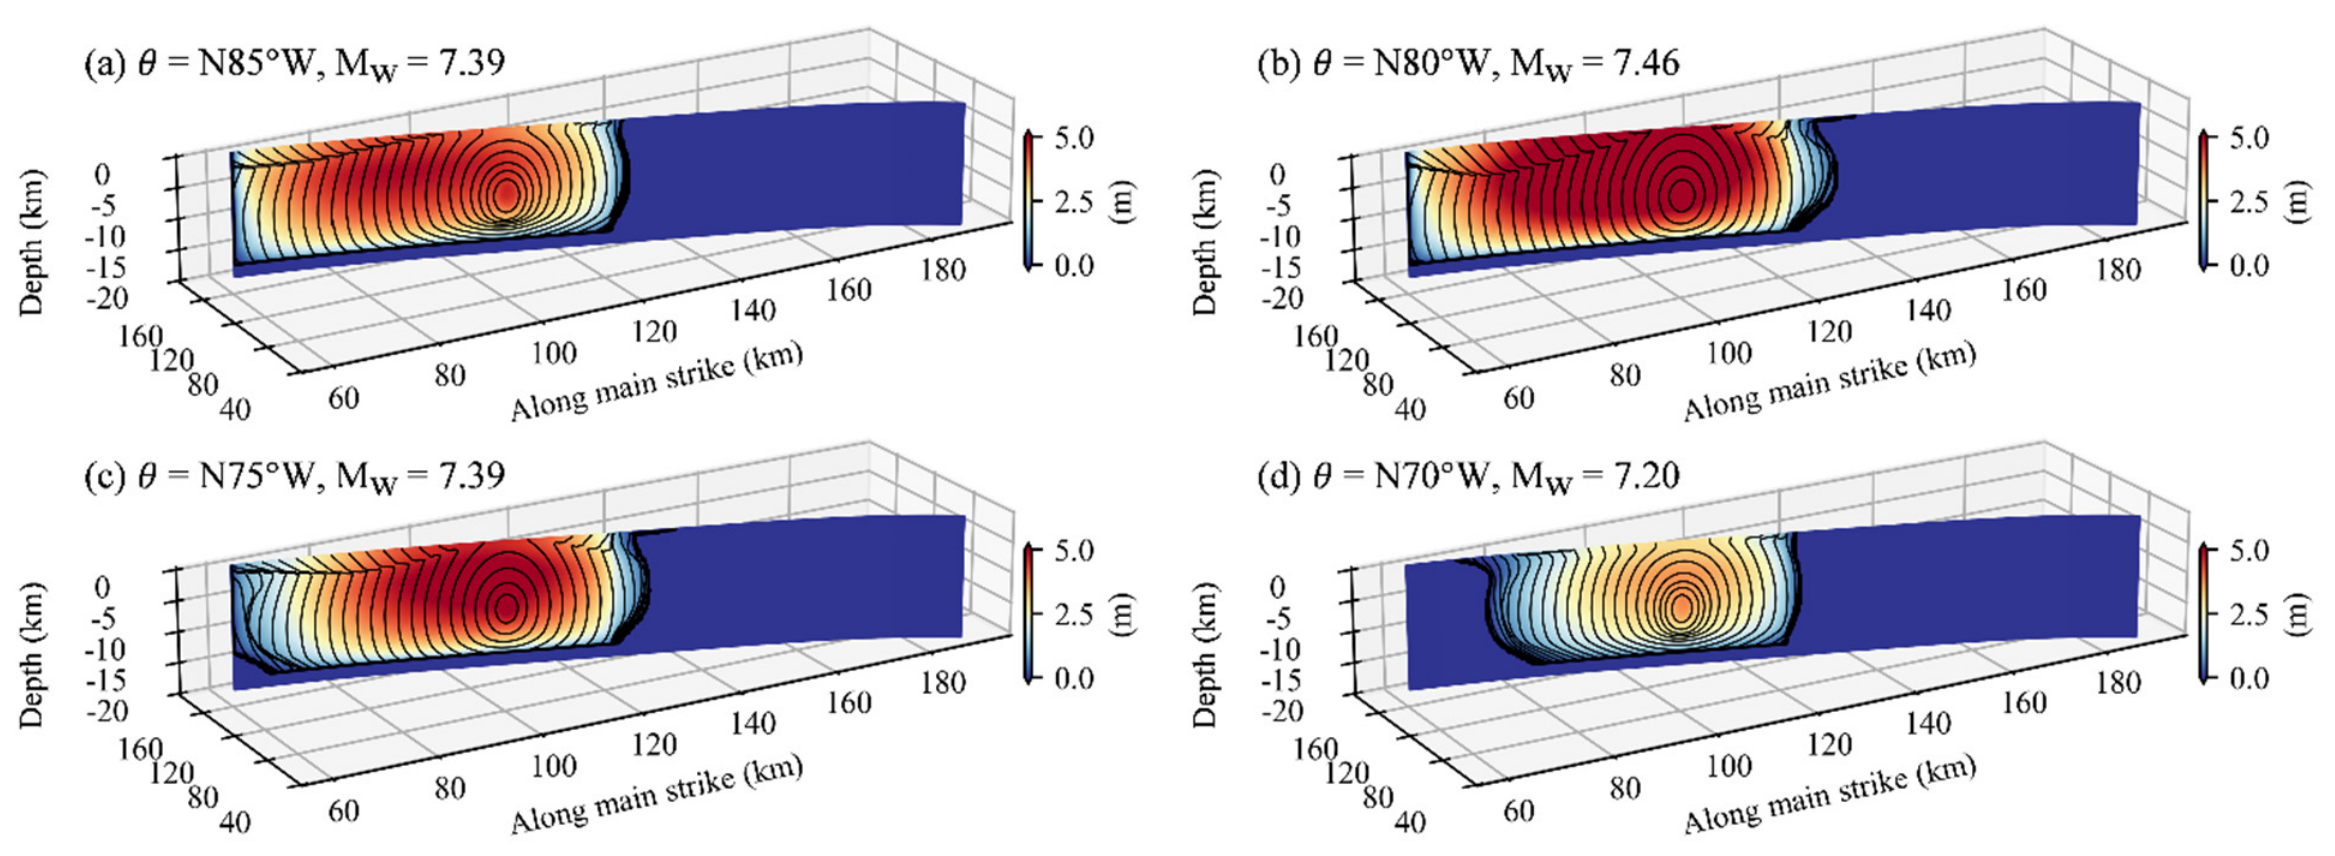
Figure 6 shows the final slip and rupture time contours for the four cases. For N85° W, N80° W, and N75° W (
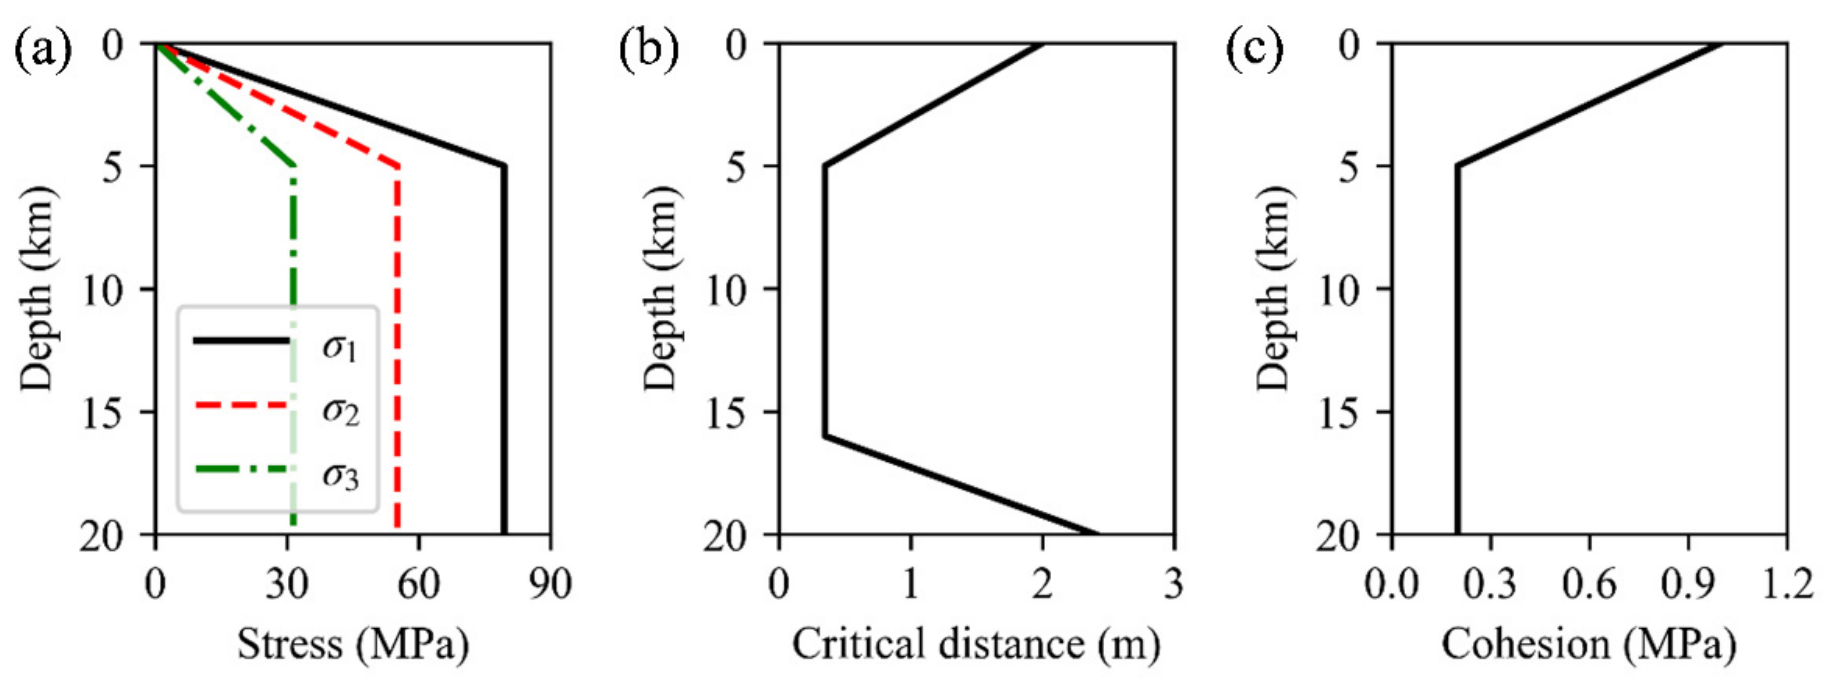
Figure 6a–c), rupture propagates rapidly northwestward to the fault edge after nucleation, whereas the southeastward front stops after about 25 km. This arrest results from the high cohesion prescribed in advance near Renda: without that constraint, the rupture in some models would break almost the entire fault, in clear conflict with the field observations. It should be emphasized that the high cohesion serves only as an equivalent numerical barrier for calibrating the stress orientation and does not represent a physical mechanism; because it is imposed identically in all four models, the relative comparison among orientations is unaffected, and the physical cause of the termination is examined in
Section 3.3 with a stress-perturbation model for the historical earthquake. As the stress orientation rotates clockwise from N85° W to N75° W, the location of maximum slip migrates from the northwestern toward the southeastern end. Rupture is predominantly subshear, but supershear episodes appear near the free surface, and their depth extent changes with the orientation: for
θ = N85° W, supershear is nearly absent toward the southeast, whereas for N80° W and N75° W, clear supershear propagation develops in that direction. For
θ = N70° W (
Figure 6d), the behavior differs entirely: the northwestward front stops spontaneously soon after nucleation, the slip is much smaller than in the other three models, and the moment magnitude is only 7.20. These contrasts show that the stress orientation changes the partitioning of normal and shear stress on the fault and, thereby, the stress drop, slip distribution, rupture mode, and magnitude. The small bend near Dandu also hinders sustained rupture propagation.
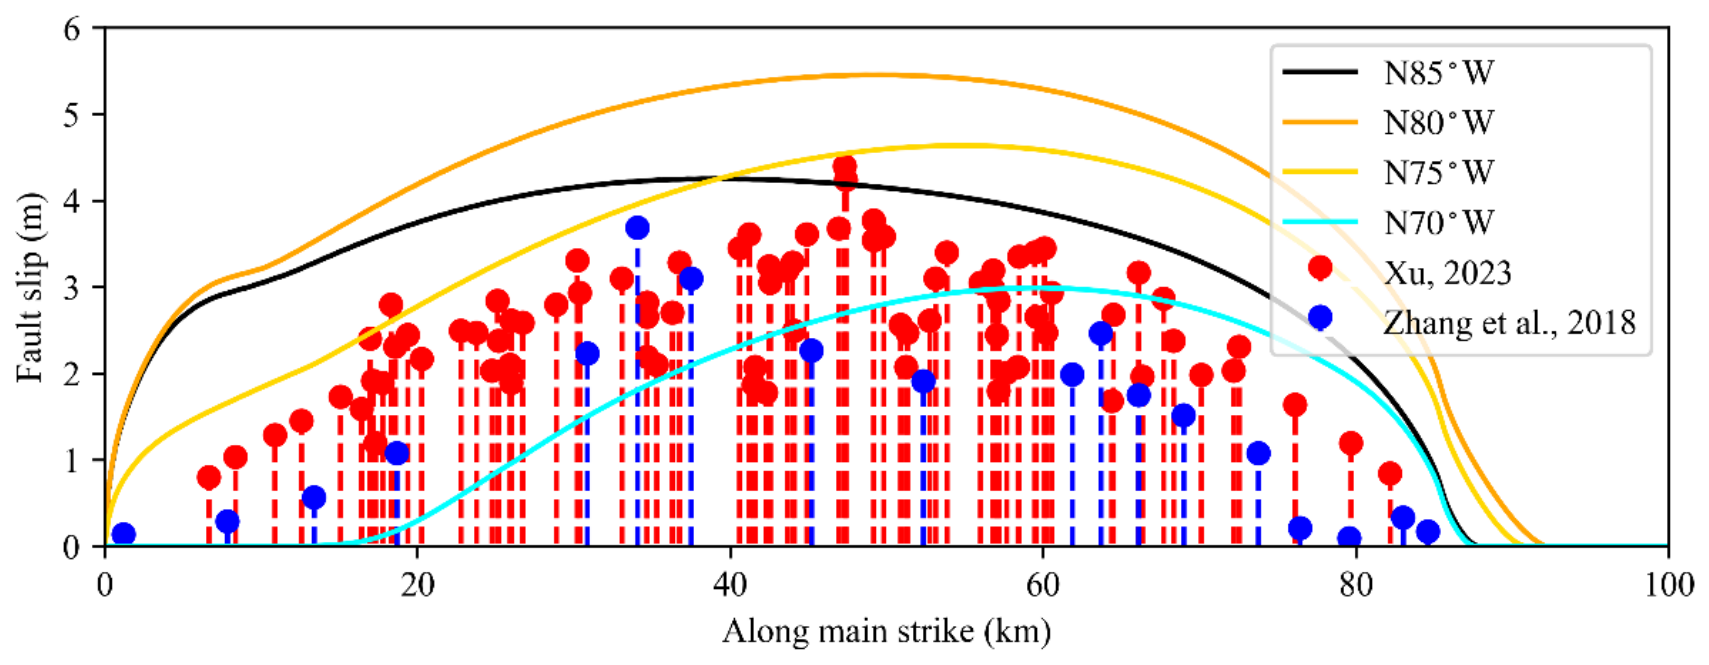
Figure 7 compares the simulated surface left-lateral offsets with the field measurements [
8,
9]. As the orientation rotates clockwise from N85° W to N70° W, the location of the maximum surface offset shifts from northwest to southeast. For
θ = N80° W, the maximum offset exceeds 5 m, far above the observed maximum of 4 m, the entire offset curve is systematically higher than the observations, and its shape departs markedly from the data. For
θ = N70° W the maximum offset falls below 3 m, the rupture is far too short, and the curve bears little resemblance to the observations. For both N80° W and N75° W, the surface-rupture length approaches 90 km. For
θ = N85° W, the maximum offset is slightly below the observed value, and the simulated offsets are generally high at the northwestern end but fit well at the southeastern end, whereas for
θ = N75° W, the maximum offset is slightly above the observed maximum, the northwestern end fits well, and the southeastern end is slightly high.
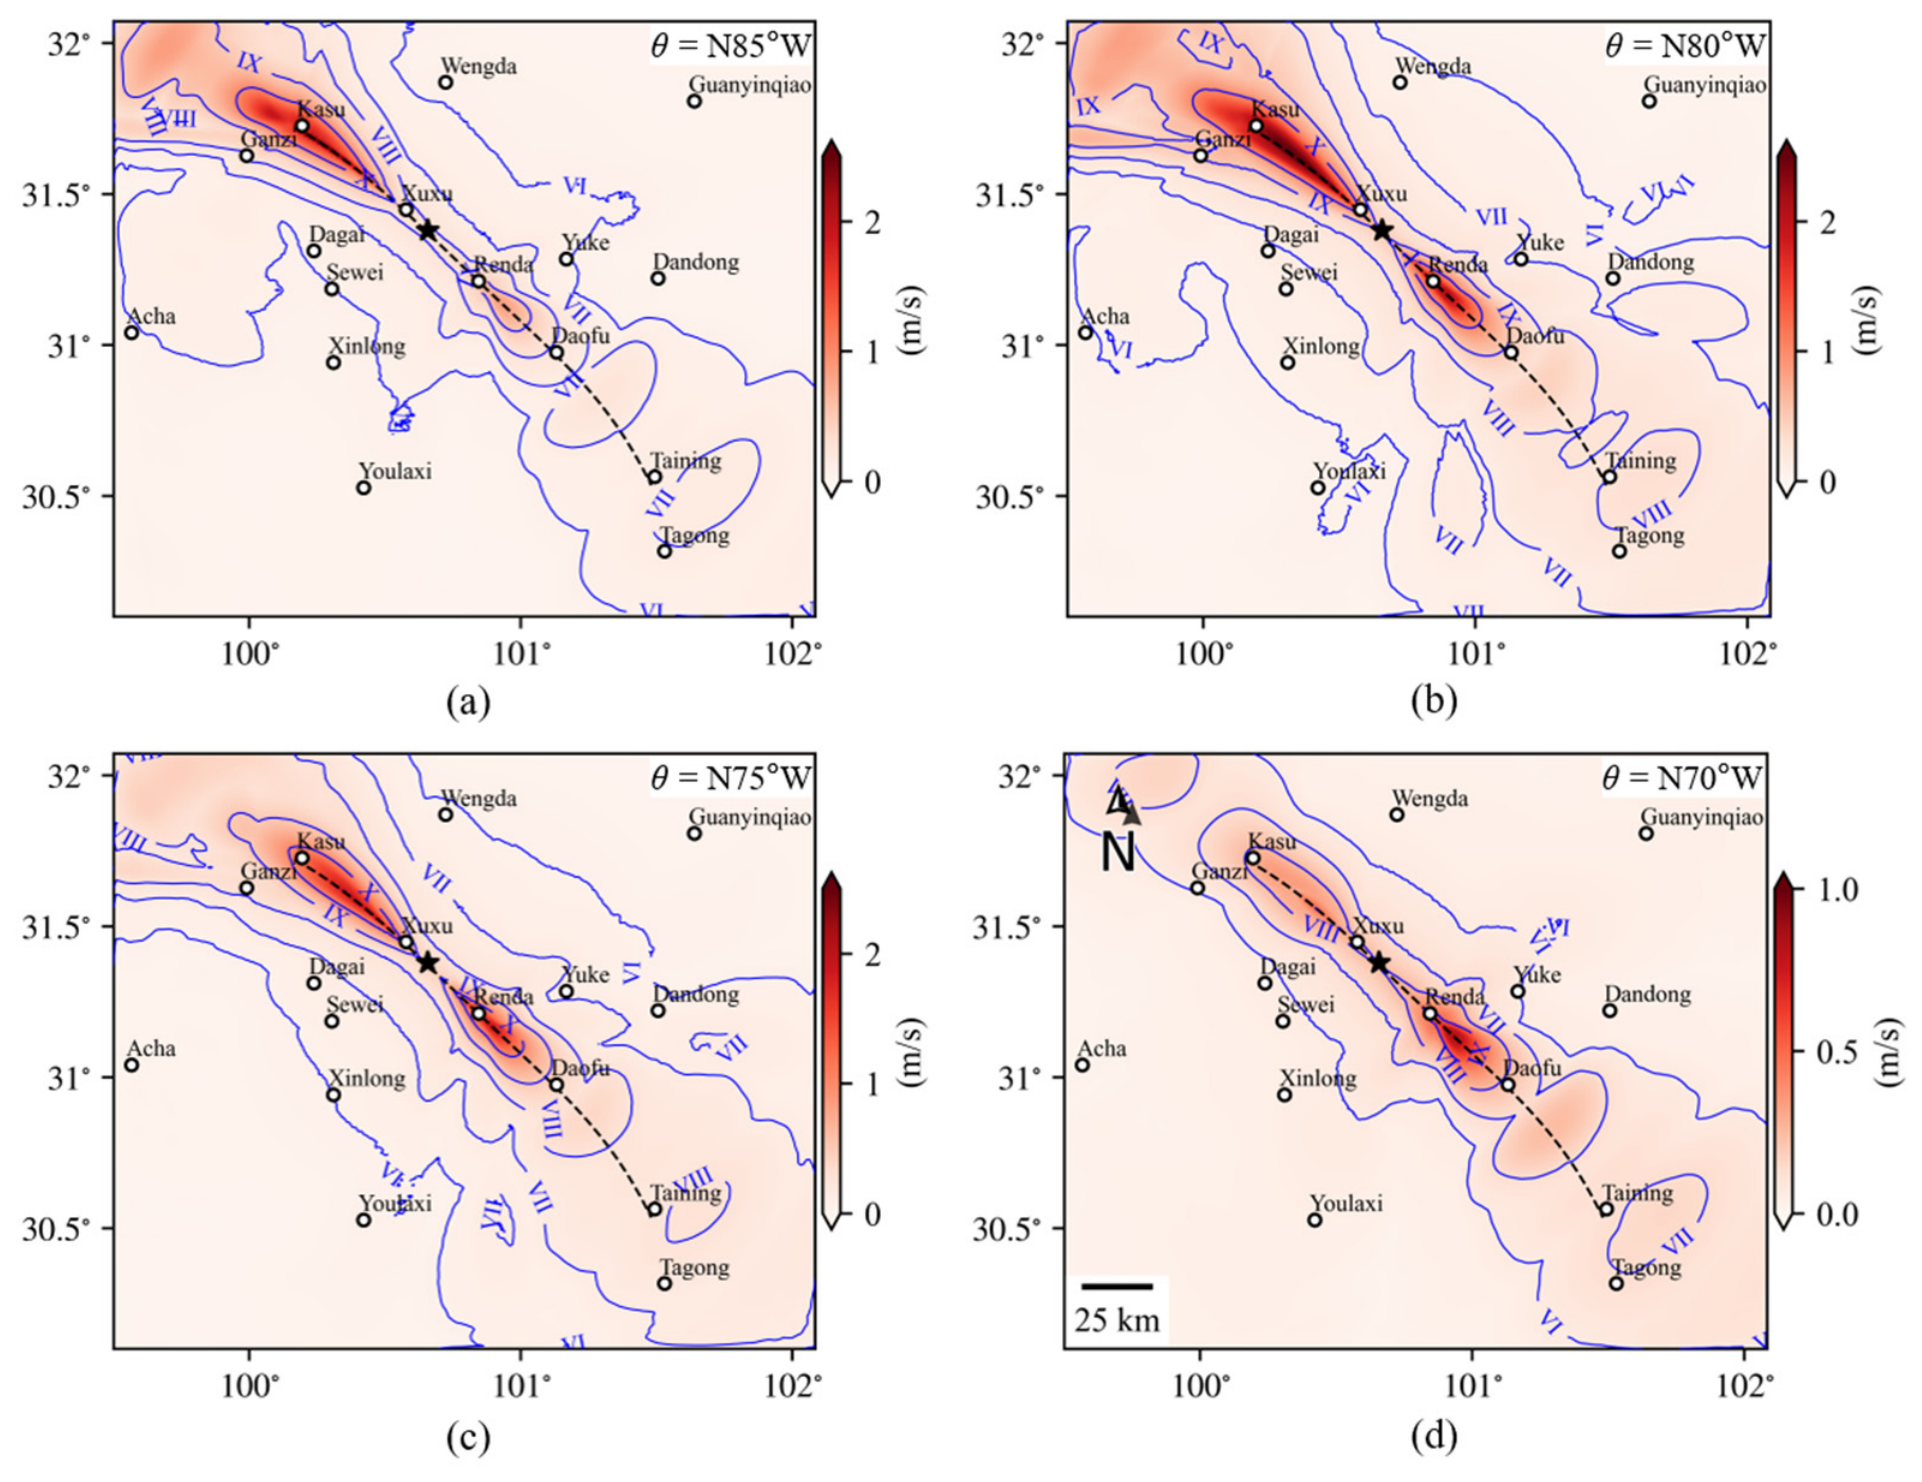
The simulated horizontal peak ground velocity (PGVh) is extracted at surface receivers and mapped in
Figure 8. The blue contours are intensity isoseismals derived from PGVh according to the Chinese national standard seismic intensity scale, with intensities labeled by Roman numerals. It should be noted that because the resolved frequency band is limited to about 1 Hz, the theoretical intensity converted from PGVh mainly reflects the long-period ground-motion level and is used here for a relative comparison with the spatial pattern of the observed intensity. The orientation of the regional maximum principal stress exerts direct control over the simulated shaking, and each model produces a distinct pattern. All models show bilateral rupture. As the orientation rotates clockwise, the zone of maximum intensity shifts southeastward, and the intensity at the northwestern end decreases. For
θ = N70° W (
Figure 8d), the maximum PGVh is only about 0.84 m/s, and the maximum intensity reaches only IX, which is well below the observed X. For
θ = N85° W (
Figure 8a) and N80° W (
Figure 8b), the intensity pattern is roughly symmetric about the fault and concentrated at the northwestern end. For
θ = N75° W (
Figure 8c), the intensity is distributed more evenly between the two ends, the zone of intensity (X) extends along the fault, and the pattern most resembles the observations. Owing to rupture directivity, however, the maximum PGVh of 2.4 m/s in
Figure 8c converts to intensity XI, which is slightly above the observed maximum of X. Part of this discrepancy may reflect the incompleteness of the historical intensity records and the subjectivity of macroseismic assessment, and part may arise from the model itself, for example, the uncertainty of the initial stress level, the absence of inelastic dissipation in the elastic medium, and the bias introduced by converting long-period PGV to intensity.
According to the intensity and surface-offset records compiled by Xu [
9] and Wen et al. [
6], the maximum surface offset of 4.0 m occurred near Xialatuo, which is very close to the epicenter, and the slip in
Figure 6c is, indeed, concentrated around the hypocenter. Combining the offset and intensity comparisons, we identify N75° W as the optimal orientation of the regional maximum principal compressive stress; the simulated intensity for this direction agrees best with the observed zone of intensity (X) and provides numerical support for constraints on the regional stress field. All subsequent simulations therefore adopt this orientation. We note that this preference rests mainly on the relative differences among orientations in the surface-offset fit, the shape of the slip distribution, and the spatial intensity pattern, while the equivalent numerical barrier is identical in all models, so the selected orientation is insensitive to how the barrier is prescribed. Even for the optimal orientation, however, confining the rupture length to no more than 90 km still requires the high cohesion near Renda or some other barrier mechanism. Regional stress alone therefore cannot fully explain the termination of the Luhuo rupture, and fault geometry and stress perturbations from historical earthquakes must be considered (
Section 3.2 and
Section 3.3).
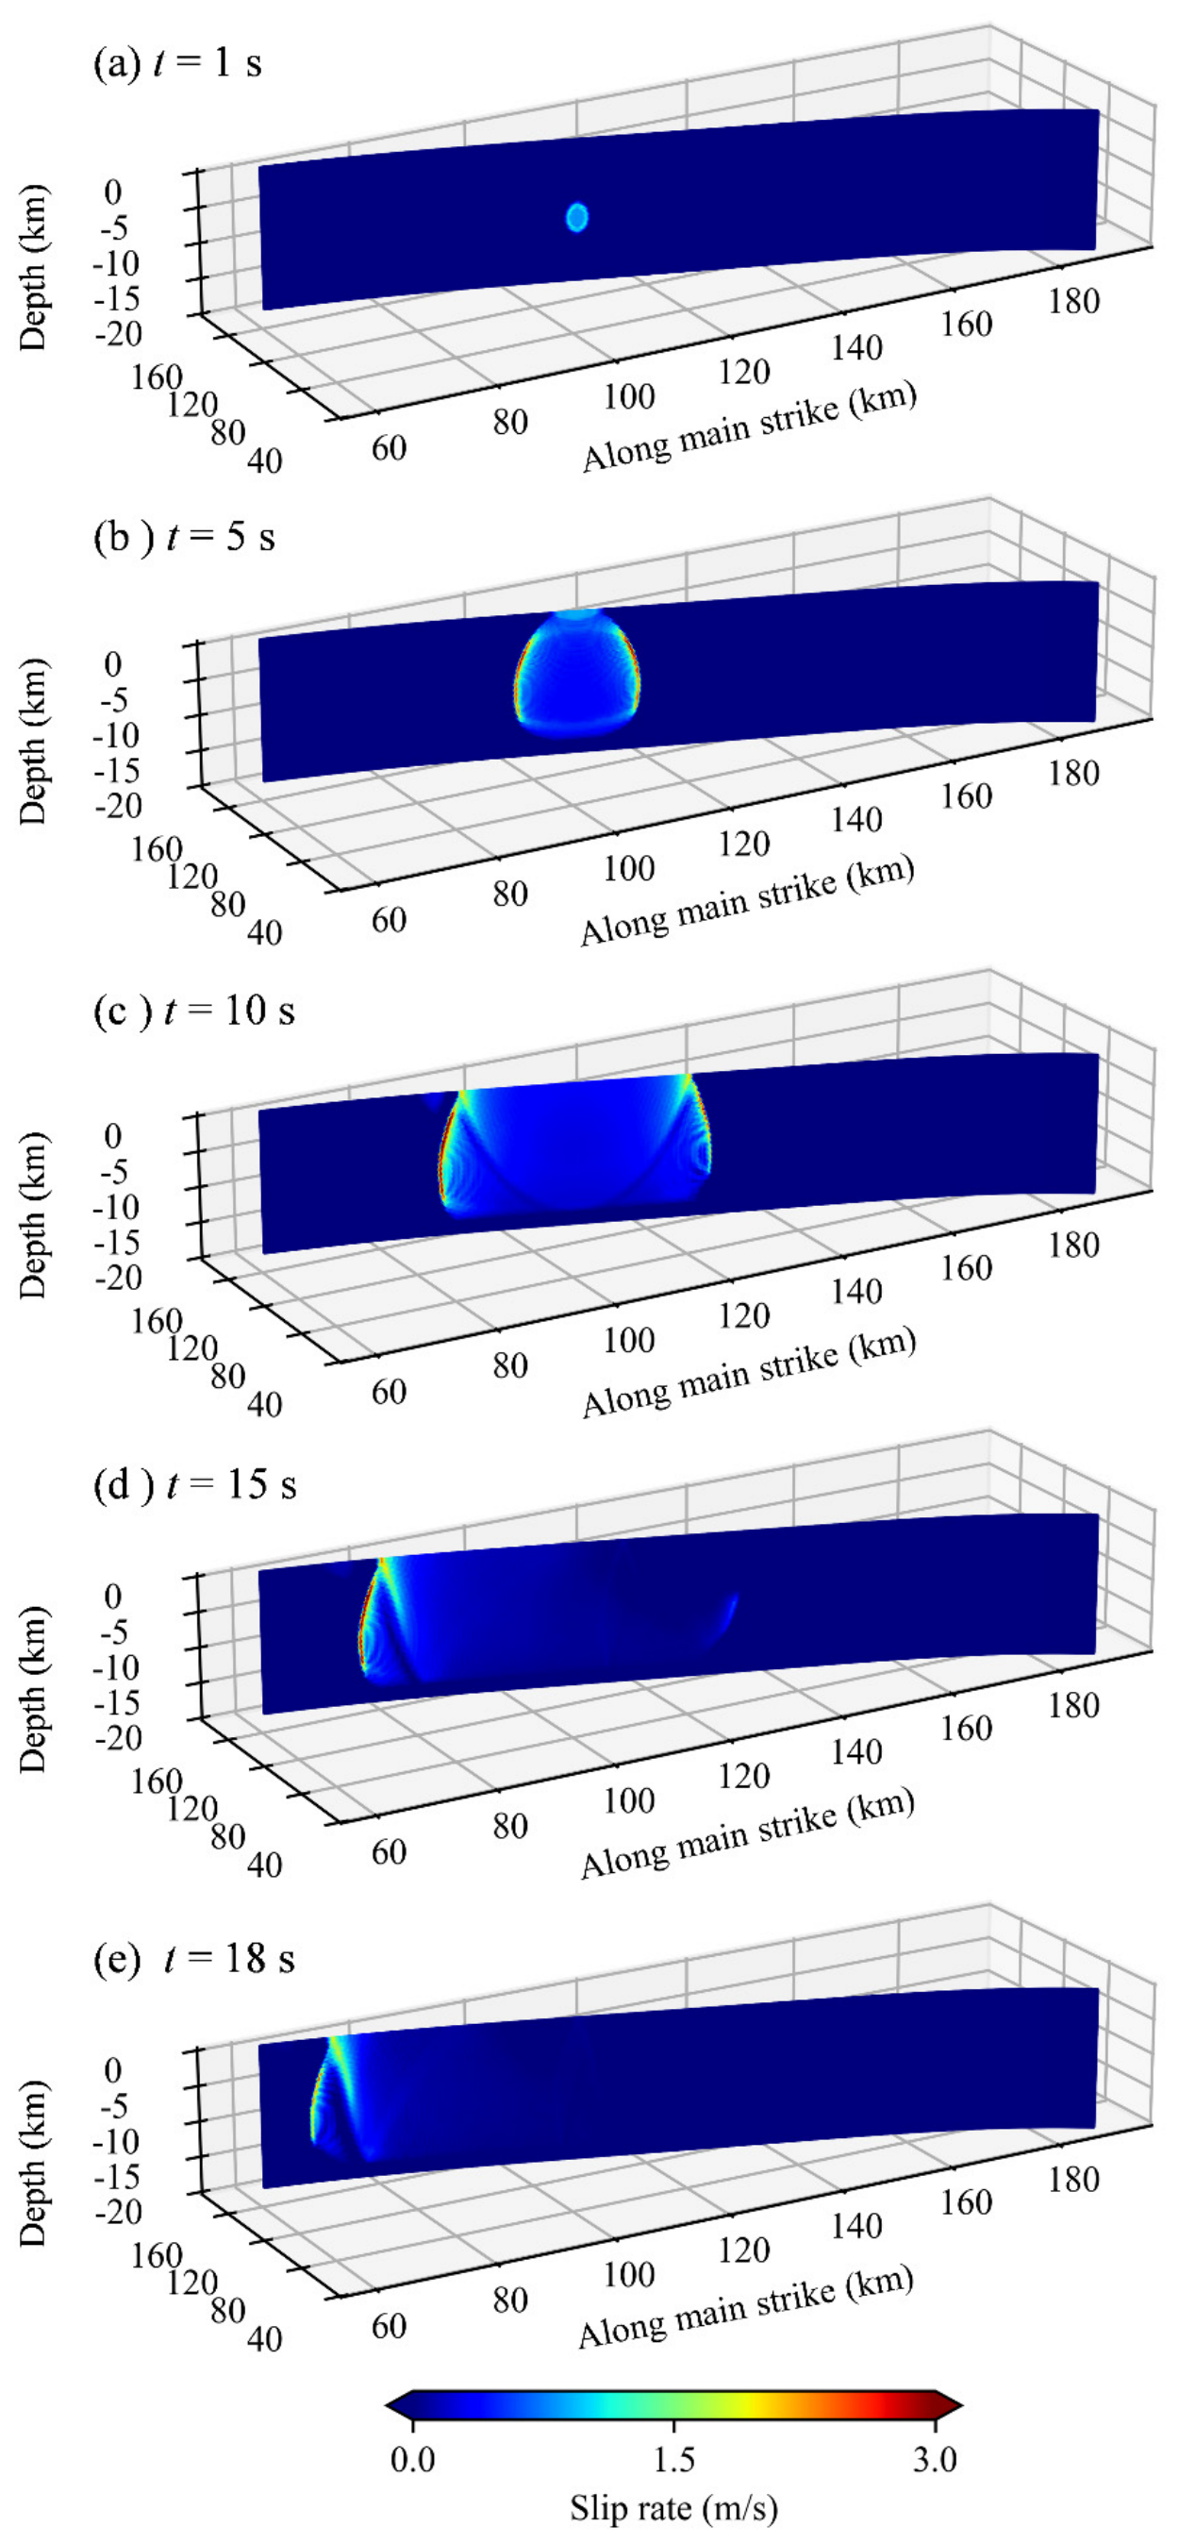
Figure 9 shows snapshots of the along-strike slip rate for
θ = N75° W. Rupture spreads outward from the nucleation patch and reaches the vicinity of the surface after about 5 s. At 1, 5, and 10 s, the rupture is clearly bilateral. At 10 s, supershear appears near the free surface and propagates downward into the fault; Kaneko and Lapusta [
45] attributed this behavior to SV waves that convert to P waves at the free surface and load the fault ahead of the front. By 15 s, the southeastward rupture has nearly stopped, and after 18 s, the northwestward front reaches the fault edge. The whole rupture lasts about 20 s.
3.2. Effects of Fault Geometry and Dip on Rupture Propagation
Section 3.1 showed that the regional stress orientation alone cannot explain rupture termination. This section systematically examines how fault geometry affects rupture propagation and ground motion to test whether geometry is the dominant control on termination.
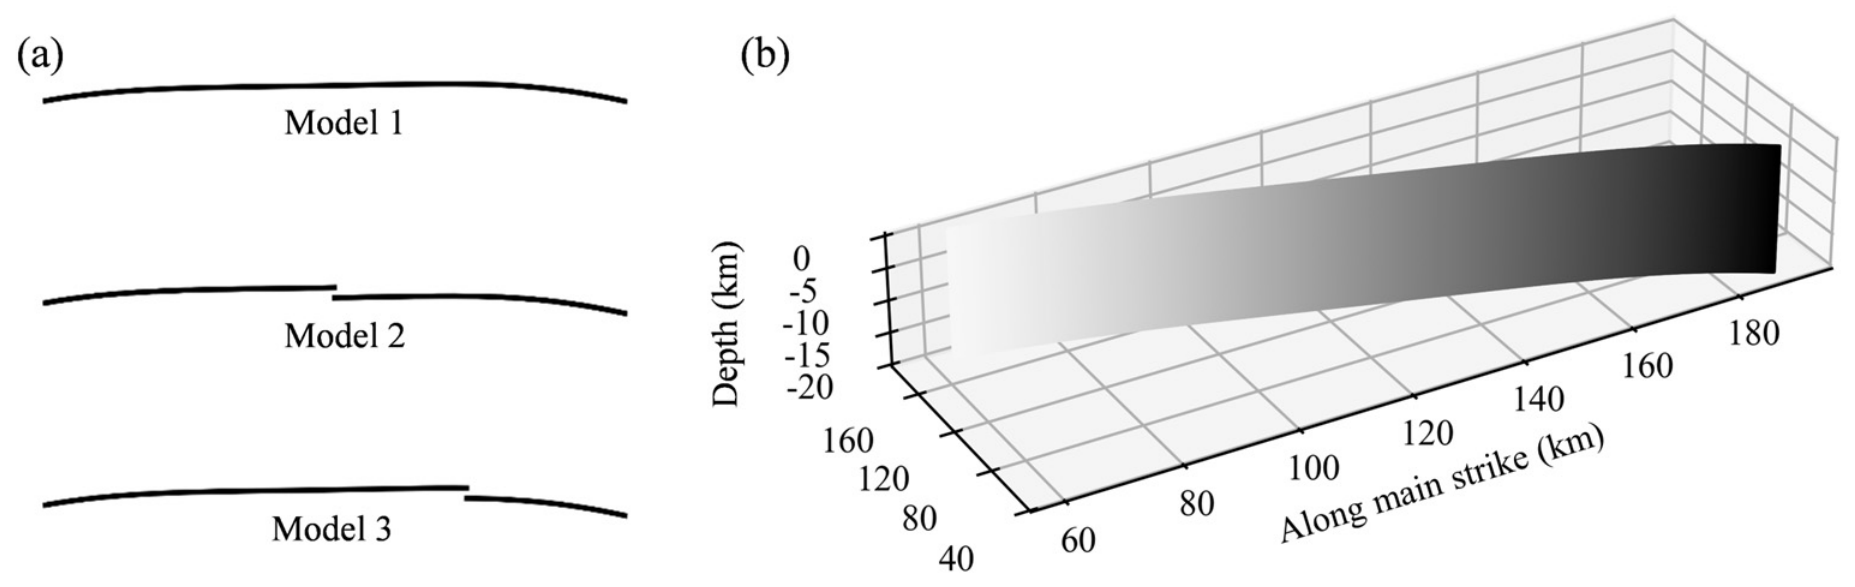
Three surface trace models were considered (
Figure 3a): Model 1 is the continuous baseline trace, Model 2 has a 1 km stepover at Renda, and Model 3 has a 1 km stepover at Jueluosi. All are vertical, and the other parameters are unchanged.
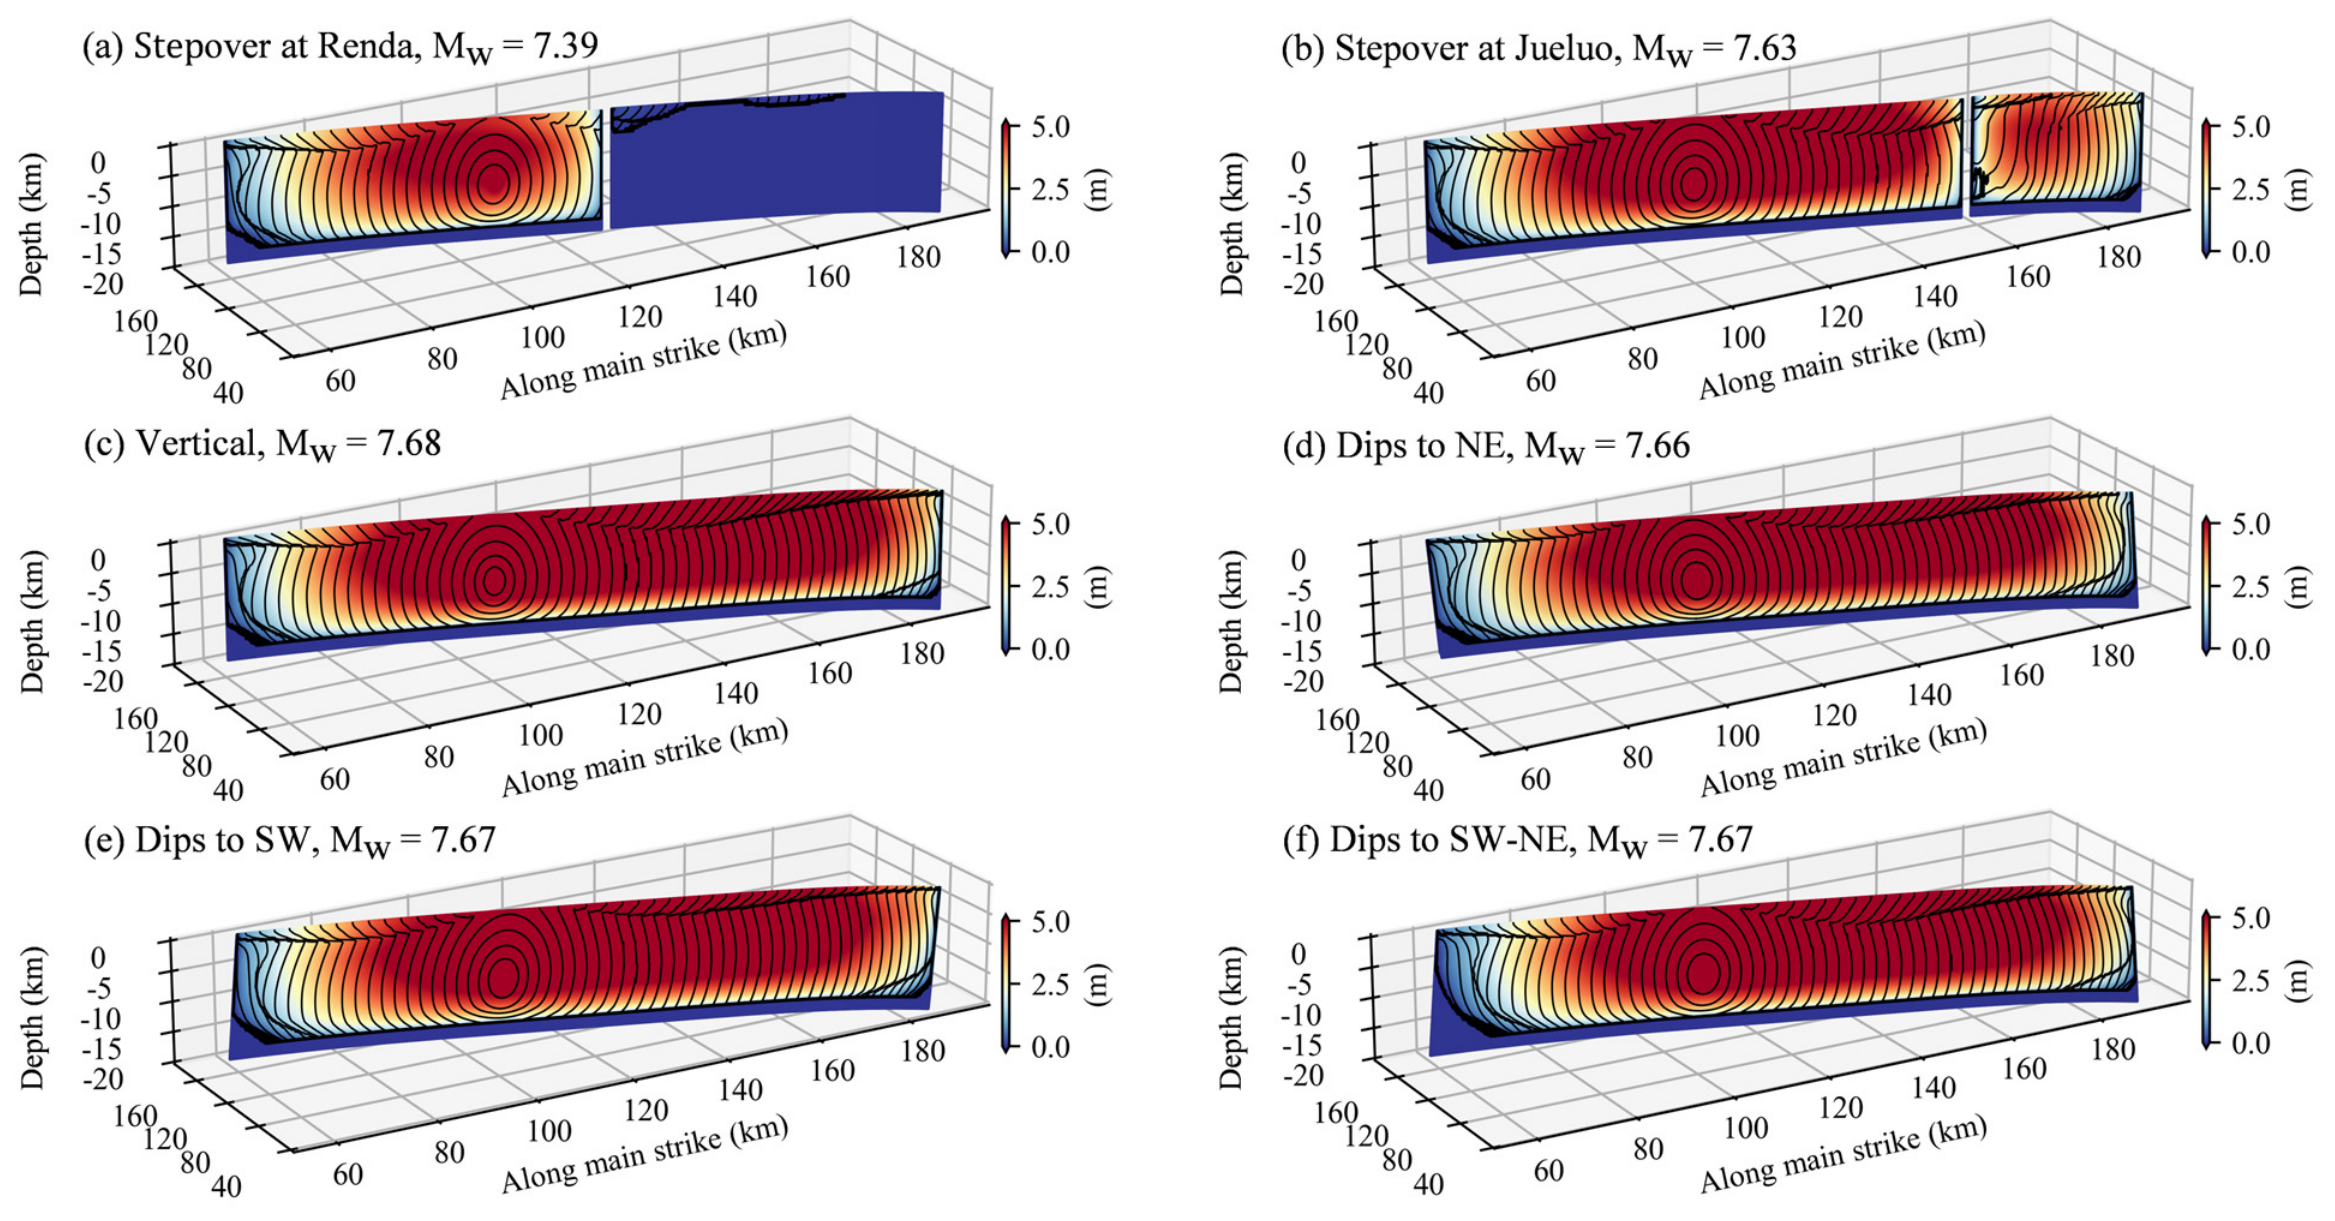
Figure 10a–c show the final slip and rupture time contours of the three models.
For the Renda stepover model (
Figure 10a), the rupture on the northwestern part of the main fault behaves as in the continuous model, but on reaching the Renda stepover, it fails to jump effectively onto the secondary fault. Only minor slip appears at shallow depth on the secondary fault and does not propagate downward, so the southeastern end shows essentially no surface rupture, consistent with the observations of the Luhuo earthquake. The very small residual slip on the secondary fault, however, may not fully account for the complete absence of rupture there.
For the Jueluosi stepover model (
Figure 10b), the rupture jumps successfully across the stepover and breaks the entire secondary fault, producing pronounced surface rupture at the southeastern end, in clear contradiction with the observation that this end did not rupture. The different jumping abilities can be attributed to the acceleration distance of the rupture front before the stepover: at Renda, the distance is short, and the front lacks the energy to cross the gap, whereas the Jueluosi stepover lies farther southeast, the front is fully accelerated, and the jump succeeds [
46,
47].
For the continuous trace (
Figure 10c), rupture spreads bilaterally from the nucleation patch and eventually breaks the whole fault. The slip distribution on the northwestern part resembles that of the vertical model in
Figure 6c, with larger slip at the northwestern end and smaller slip at the southeastern end, but because nothing impedes the rupture, the moment magnitude reaches 7.68, which is far above the value inferred from observations, and the simulated surface rupture greatly exceeds 90 km, inconsistent with the field surveys.
Based on the continuous trace, three dipping models were then built (
Figure 10d–f): dipping northeast at 80°; dipping southwest at 80°; and a mixed model that dips southwest on the western side of Renda and northeast on the eastern side, is vertical at Renda, and varies linearly to 80° at both fault ends.
Figure 10d–f show their final slip and rupture times. In both uniform dip models, the rupture breaks the entire fault, and the slip distribution resembles that of the continuous vertical model, with slightly smaller slip amplitudes. The two differ in where free-surface supershear first appears: it develops earlier at the southeastern end for the northeast-dipping fault and earlier at the northwestern end for the southwest-dipping fault, reflecting the influence of the dip direction on free-surface supershear. Both produce surface ruptures far longer than 90 km. The mixed dip model (
Figure 10f) also breaks the whole fault, with slip and magnitude slightly below the continuous model and a very similar rupture pattern; its free-surface supershear appears somewhat earlier, and the excessive rupture length persists. Dip variations are therefore also unable to arrest the rupture.
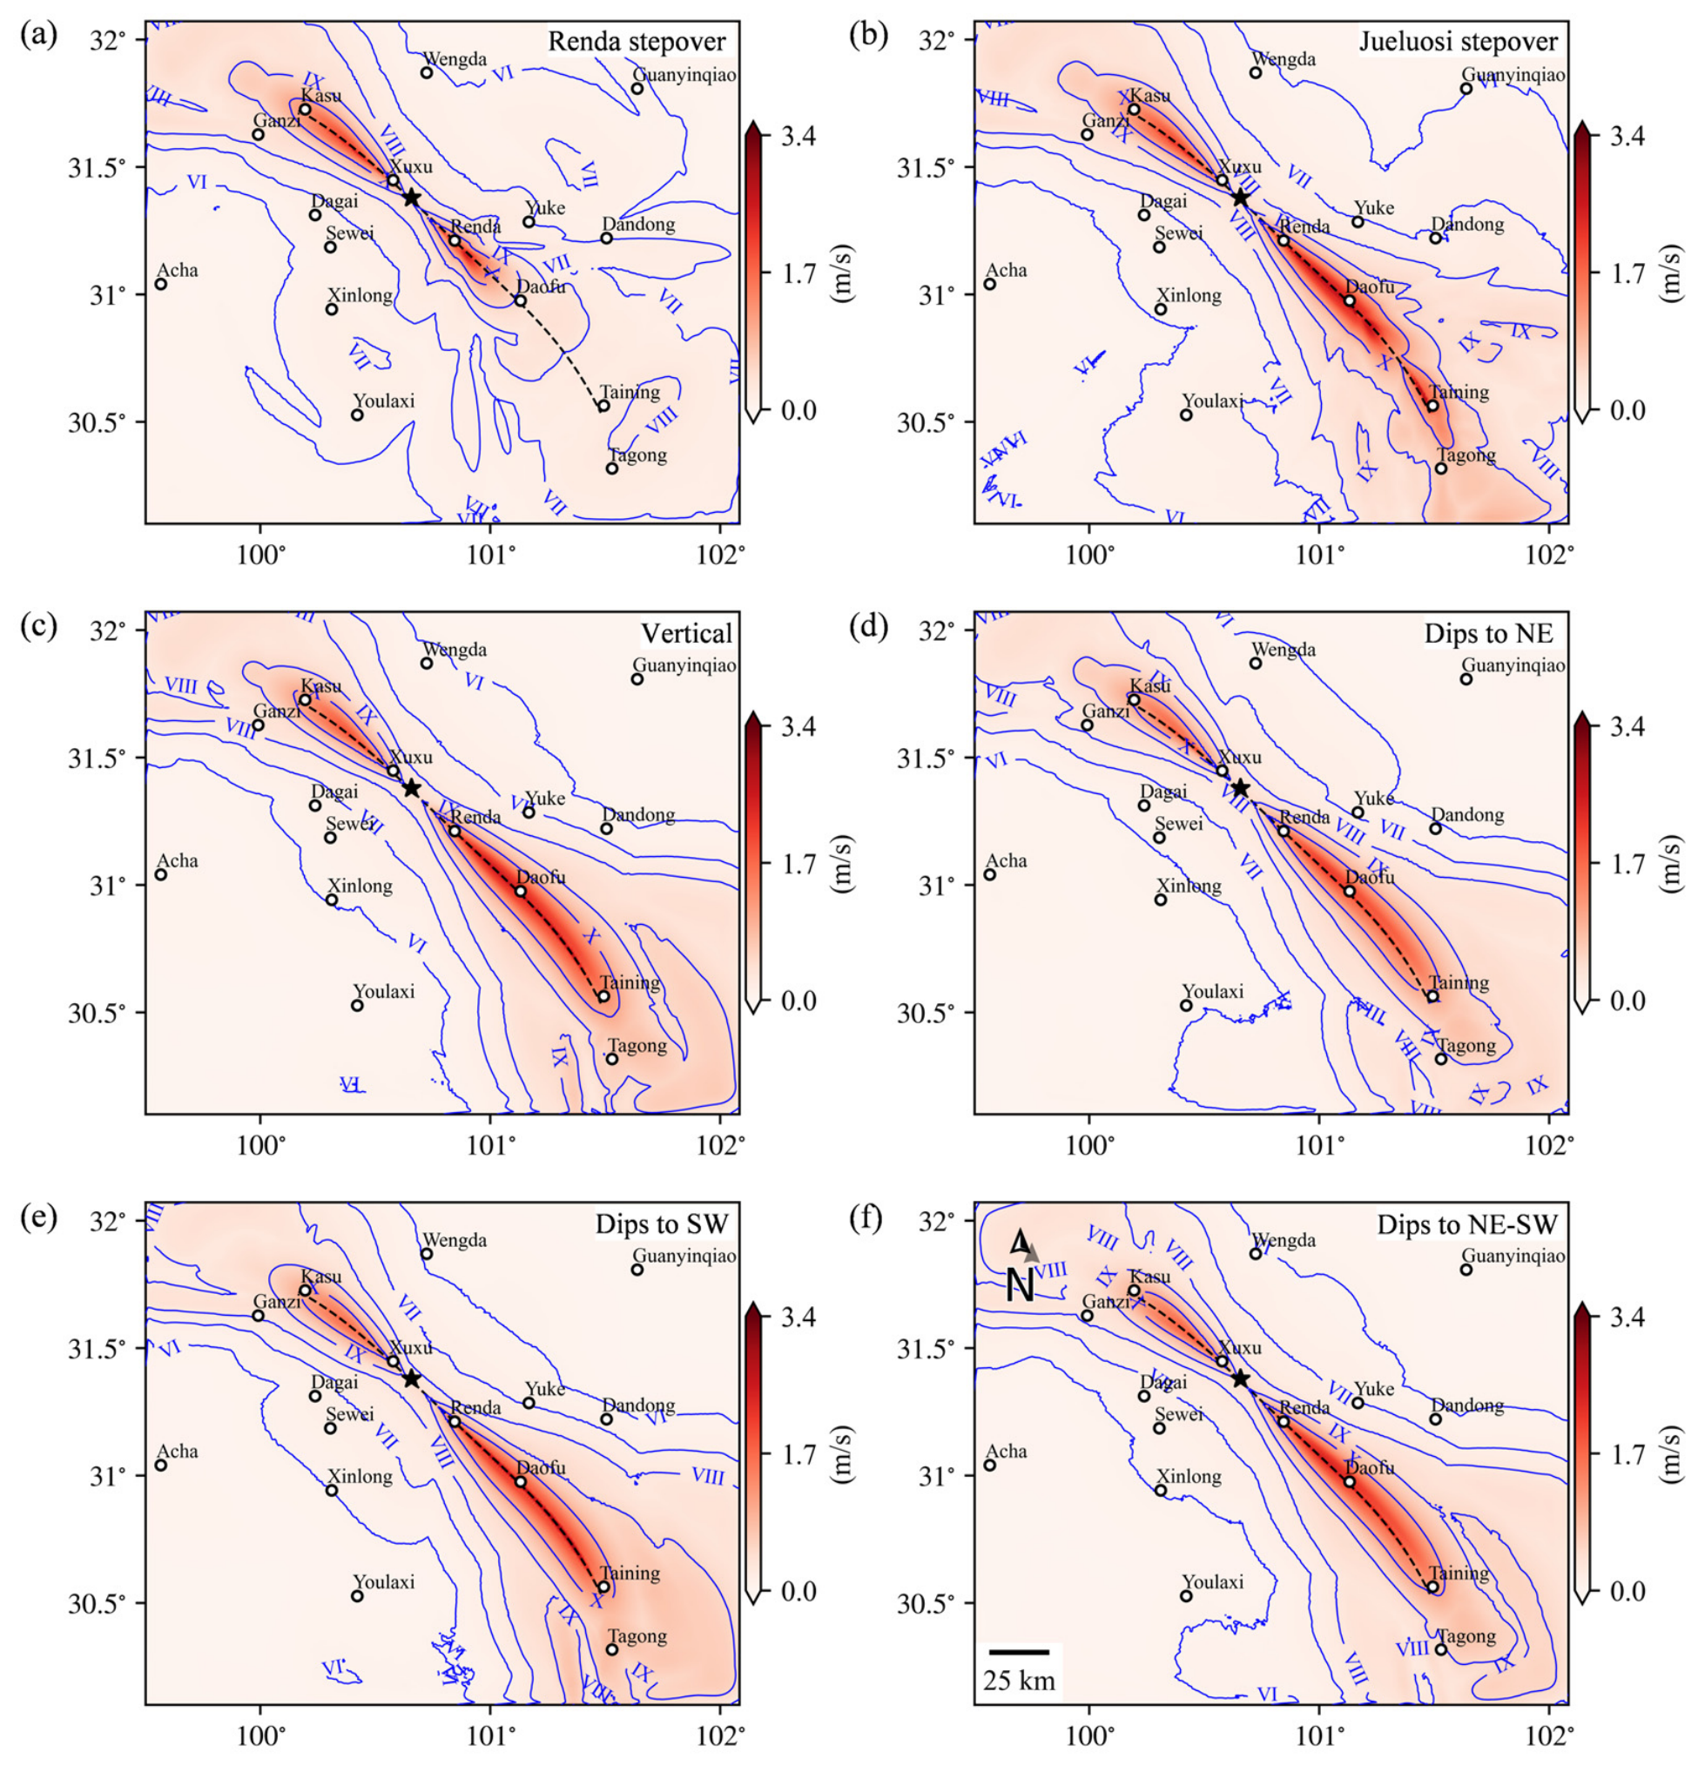
Figure 11 maps PGVh and the theoretical intensity for the geometry models. All models reach a maximum intensity of XI (the XI contour is omitted for comparison with the observed intensity), but the spatial patterns differ markedly. With the stepover at Renda (
Figure 11a), the area of intensity (X) and above is concentrated at the northwestern end, and the intensity southeast of Renda drops quickly below VIII, mirroring the near absence of slip on the secondary fault; the northwestern pattern matches the observations reasonably well. With the stepover at Jueluosi (
Figure 11b), the rupture crosses the step and slips substantially on the secondary fault, so the damage extends along the whole fault while the X zone pinches toward the fault trace at the step; the X zone at the southeastern end contradicts the observed intensity. For the continuous vertical model (
Figure 11c), the X zone covers almost the entire trace, and its southeastern extent is far larger than observed, again indicating that the unconfined rupture is too long and that some particular condition must have prevented the southeastern portion of the northwestern segment from failing during the Luhuo earthquake. The two uniform dip models produce similar intensity patterns (
Figure 11d,e): rupture directivity concentrates severe shaking near the two fault ends; the rupture extends farther along the southeastern portion, which therefore experiences stronger shaking; and a clear hanging-wall effect appears, with stronger shaking on the hanging wall. The mixed dip model (
Figure 11f) resembles the continuous vertical model, with a slightly smaller IX zone and a locally more pronounced hanging-wall effect, and the problem of excessive rupture length remains.
These simulations show that the Renda stepover can explain the rupture length and the absence of surface rupture at the southeastern end, although minor surface slip remains on its secondary fault, whereas the Jueluosi stepover, the continuous trace, and the dipping models all lead to complete rupture or to significant rupture at the southeastern end, in conflict with the observations. We acknowledge that we have not exhaustively tested all possible geometric configurations (e.g., a substantially larger stepover distance might conceivably arrest the rupture). However, within the range of geometric models constrained by the available geological and seismological data for the northwestern Xianshuihe segment, purely geometric discontinuities can only partly limit rupture propagation and cannot fully explain the termination of the Luhuo earthquake. The residual mismatch of the Renda stepover model, in particular, suggests that an additional mechanism, such as a stress perturbation from a historical earthquake, further suppressed rupture and shaking in that area. The next section examines the contribution of the stress heterogeneity generated by the 1923 Daofu earthquake.
3.3. Stress Perturbation from the 1923 Earthquake and Rupture Termination
The results of
Section 3.1 and
Section 3.2 indicate that neither the regional stress orientation nor the fault geometry, including stepovers and dip variations, fully explains the arrest of the Luhuo rupture near Renda: continuous and dipping faults rupture completely, and the Renda stepover blocks the jump but leaves small surface slip on the secondary fault. We therefore infer that stress heterogeneity produced by a historical earthquake is the dominant cause of the termination. The destructive 1923 Daofu earthquake occurred on the central part of the northwestern segment, and its surface rupture partly overlaps that of the Luhuo earthquake. The event released substantial stress on this part of the fault, leaving the central portion at a low initial shear stress before the Luhuo earthquake and thereby forming a low-stress barrier. To represent this effect, a zone of reduced initial shear stress is introduced on the Renda section of the continuous vertical fault of
Figure 10c: the initial shear stress within the zone is lowered to the dynamic level while the normal stress is unchanged, and all other parameters follow the baseline model.
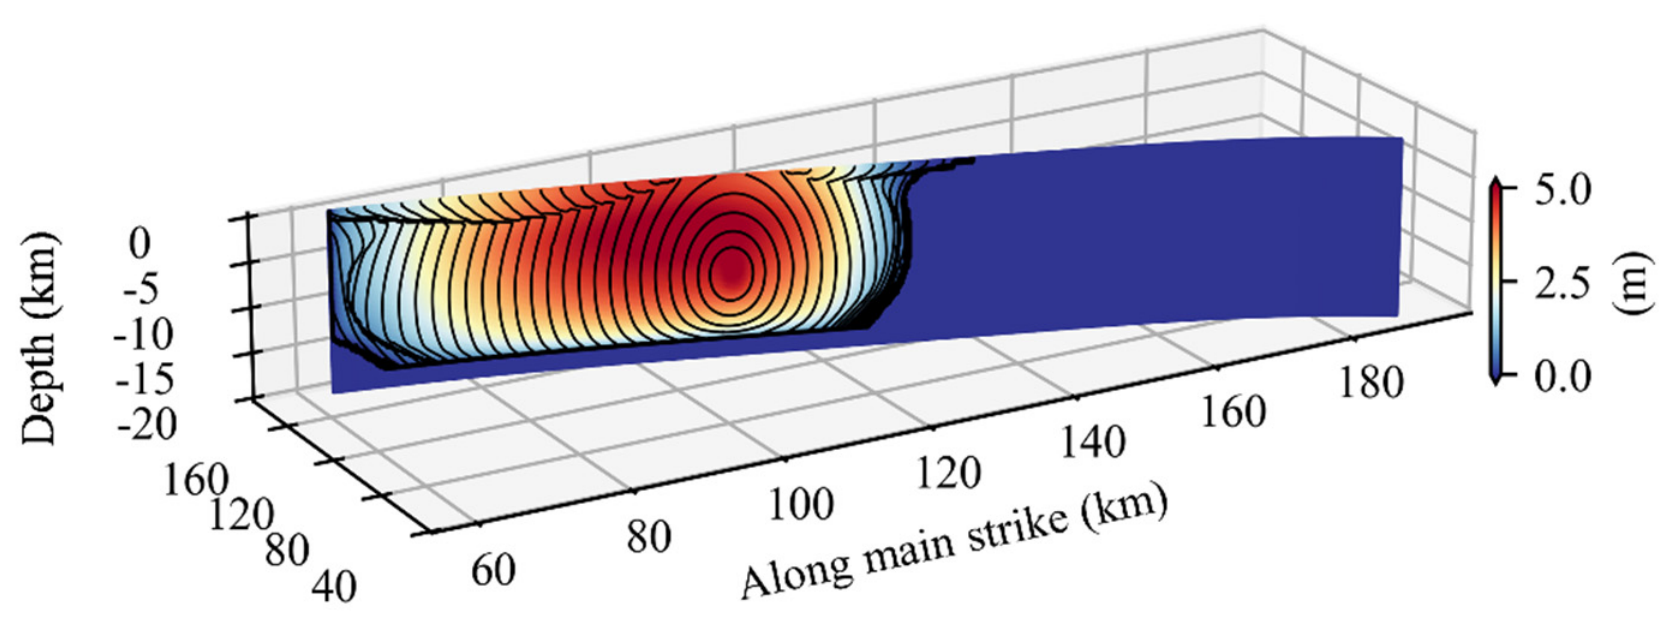
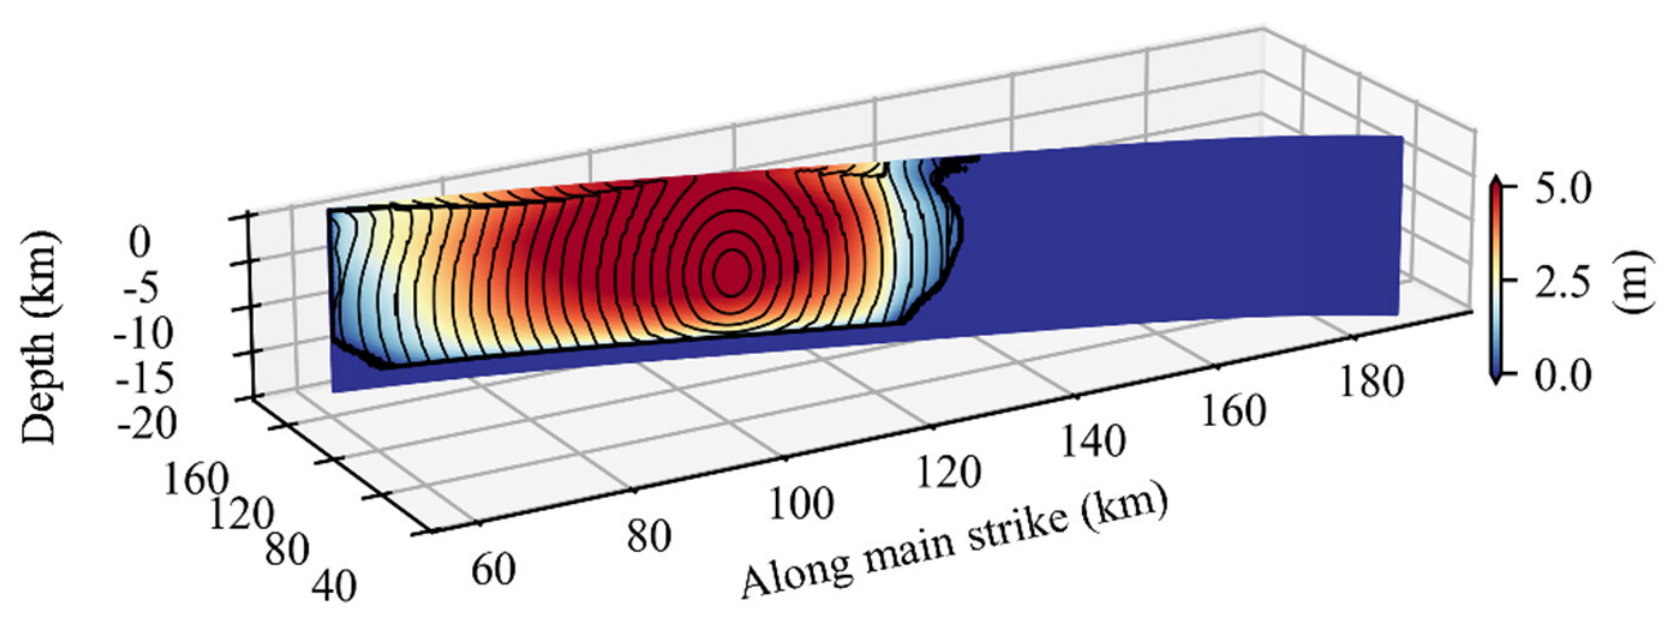
Figure 12 shows the resulting final slip and rupture time contours. Compared with the model without the stress reduction (
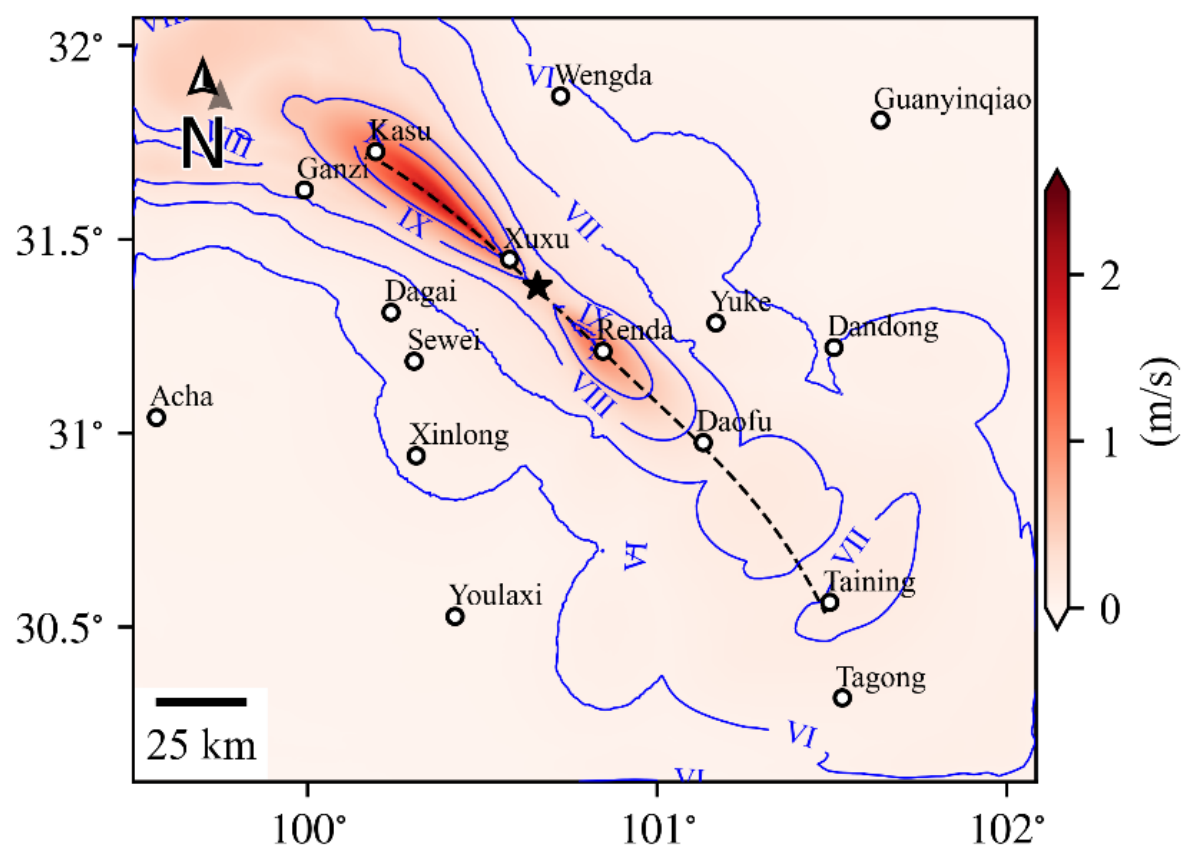
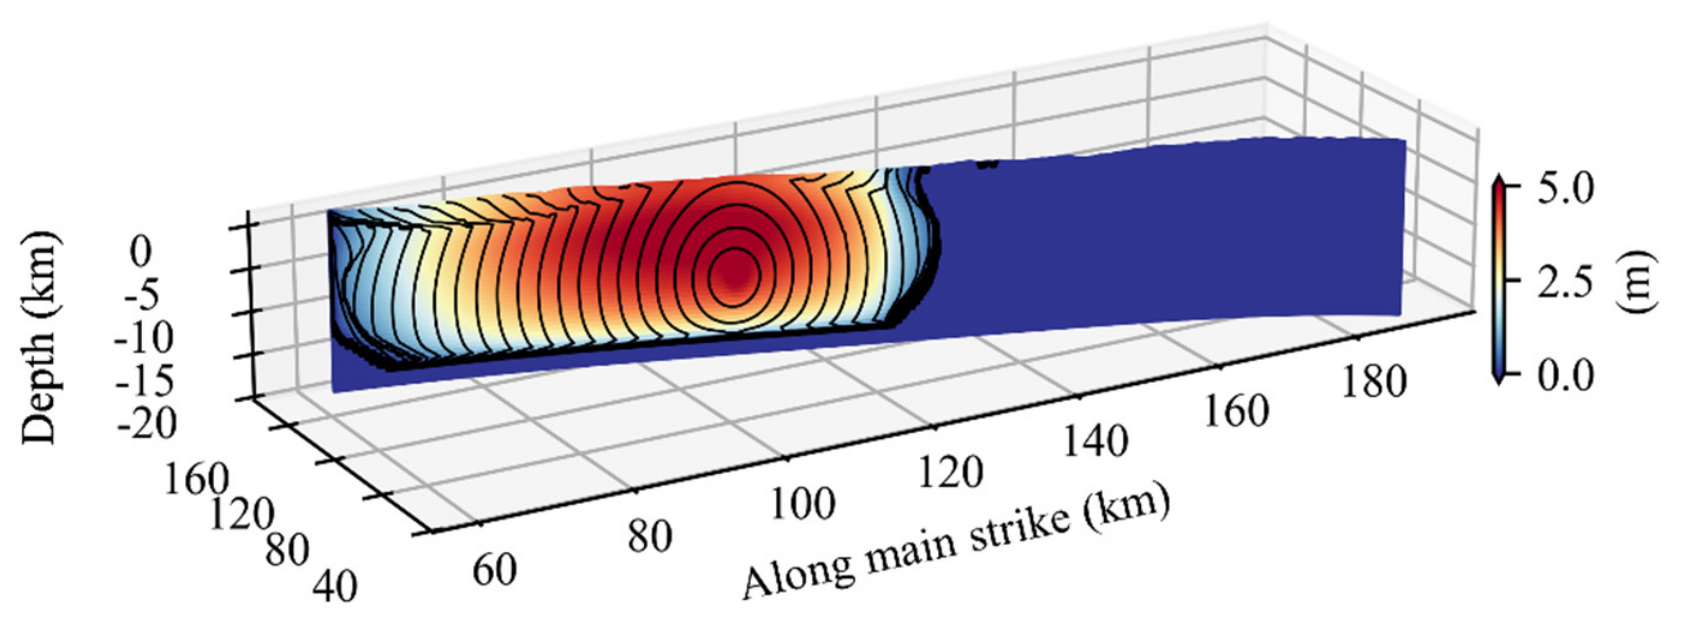
Figure 6c), the northwestward rupture is almost unchanged: it quickly reaches the northwestern fault edge with an essentially identical slip distribution. In the reference model, the southeastward rupture was stopped at Renda by the artificially high cohesion, whereas in the stress-drop model, the front decelerates and stops spontaneously when it enters the low-stress zone: the rupture time contours crowd together inside the barrier, and the southeastern part of the fault remains essentially unslipped. The moment magnitude of 7.36 is slightly below the 7.39 of the reference model and closer to the value of
MW7.3 inferred from observations. The arrest occurs because the shear stress drops sharply within the zone while the frictional strength is unchanged, so the available stress drop collapses, the energy available to sustain the rupture front becomes insufficient, and propagation ceases spontaneously.
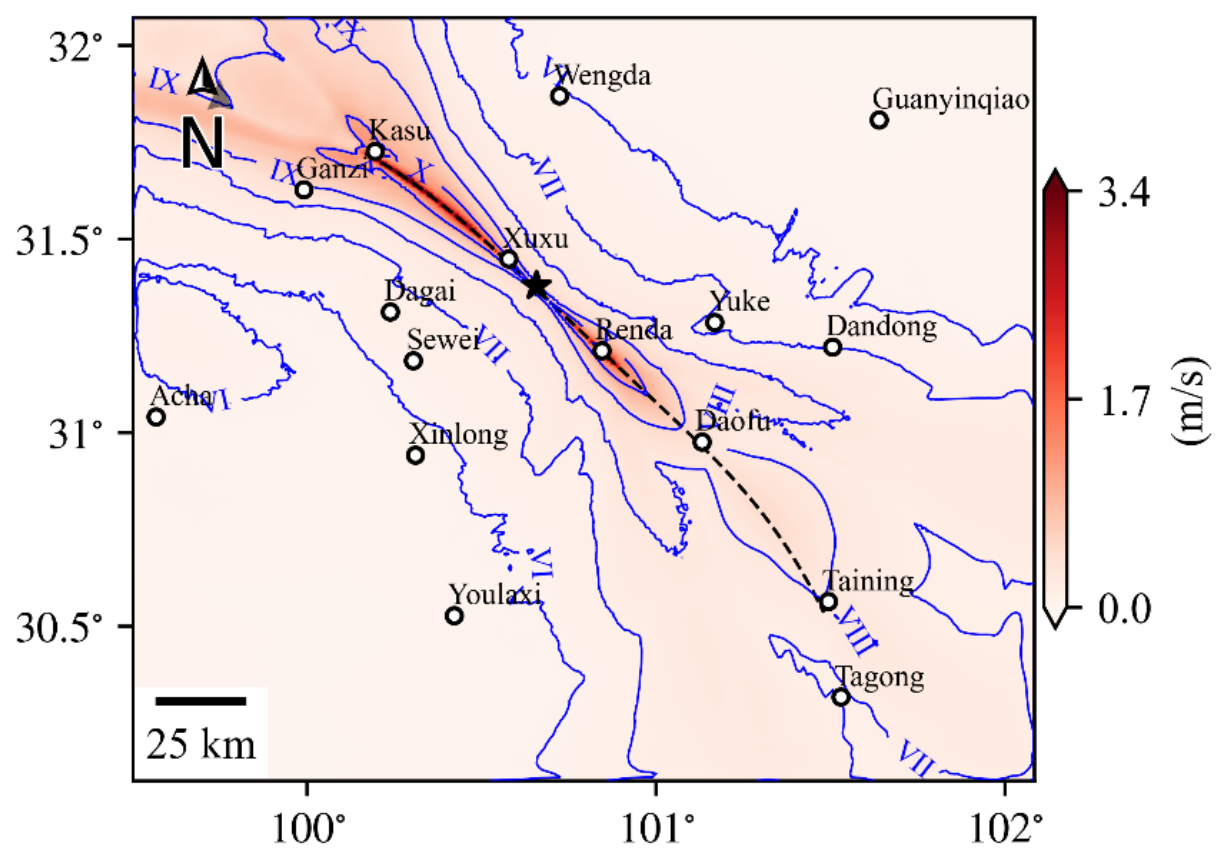
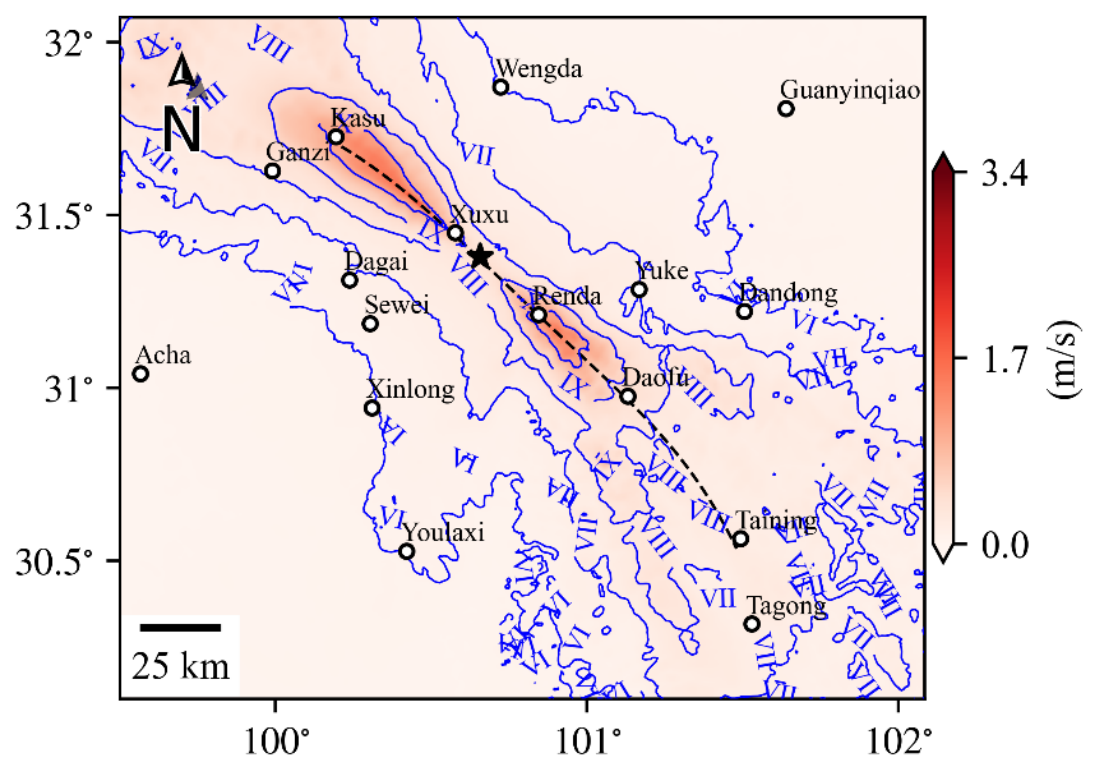
Figure 13 maps the PGVh and theoretical intensity of the stress perturbation model. Relative to the N75° W model without the stress reduction (
Figure 8c), the intensity at the northwestern end is almost identical, and the X zone still covers the northwestern part of the fault, but near Renda, the isoseismals contract, and the X zone narrows, showing that the stress reduction weakens the shaking there. The intensity at the southeastern end drops markedly, with a maximum of only VIII over a limited area, in much better agreement with the observations.
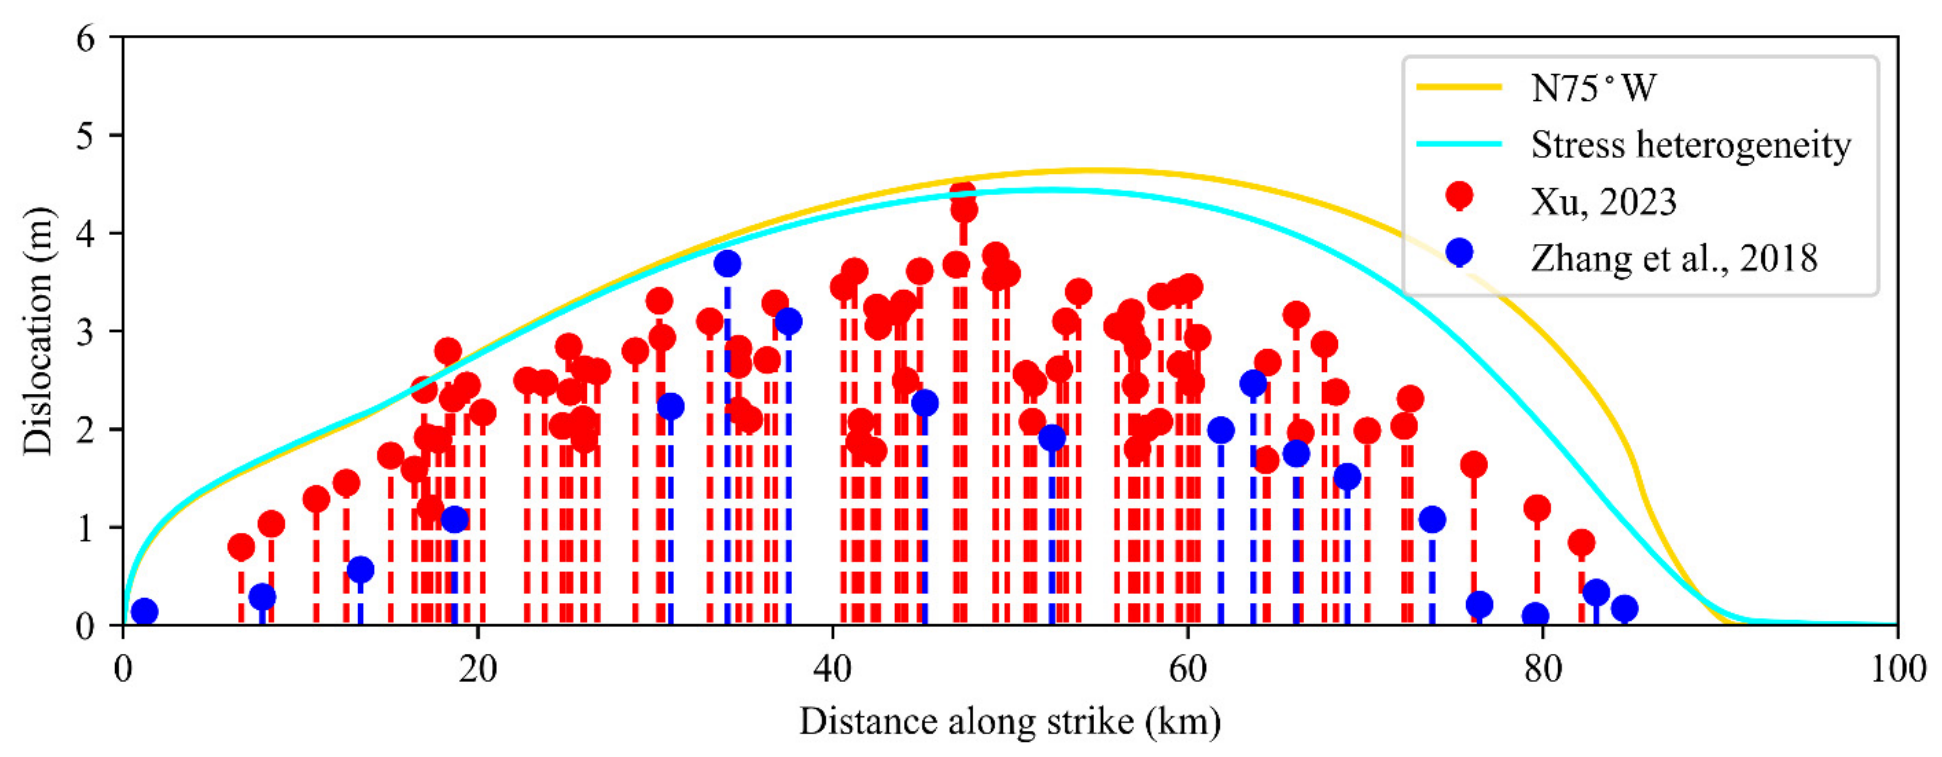
Figure 14 compares the simulated surface left-lateral offsets with the measurements. The simulated rupture length of about 90 km matches the observations; the northwestern offsets nearly coincide with those of
Figure 6c and fit the data well; and between Xuxu and Renda (50 to 90 km along-strike), the offsets fall rapidly to nearly zero, which is smaller than in the model without the stress reduction and closer to the measurements. The stress-drop model is therefore clearly superior in reproducing the surface-offset distribution.
Taking the fault slip, surface offsets, and intensity together, the model incorporating the stress drop of the 1923 Daofu earthquake simultaneously reproduces the following observed features: rupture stops spontaneously near Renda, the southeastern end shows no surface rupture, the spatial distribution of the surface offsets agrees closely with the measurements, and the intensity pattern is more plausible. By contrast, the purely geometric Renda stepover blocks the jump but retains surface slip on its secondary fault, and the continuous and dipping models rupture completely and produce excessive intensity at the southeastern end. Stress heterogeneity inherited from a historical earthquake is therefore the most likely dominant control on the termination of the Luhuo rupture. Stress shadows left by past events can arrest subsequent ruptures spontaneously and substantially modify the magnitude and the intensity distribution. In seismic hazard assessment for the strike-slip fault zones of the Sichuan-Yunnan region, paleoseismic and historical earthquake records should be used to constrain the stress heterogeneity on the faults so that potential magnitudes and near-fault shaking are not overestimated.
3.4. Effects of the Fault Damage Zone and Realistic Topography
Numerous earthquakes on the Xianshuihe fault zone have produced fracture-filled damage zones on both sides of the fault whose physical and chemical properties differ greatly from those of the host rock. This section examines the influence of such a damage zone on the rupture of a single event. Based on the optimal orientation of θ = N75° W, a damage zone of width H = 2.0 km is introduced on both sides of the fault, and the S-wave velocity within it is reduced such that VS,D/VS,I = 0.8, where the subscripts D and I denote the damage zone and the intact rock.
Figure 15 shows the final slip and rupture time contours with the damage zone. The rupture mode is nearly identical to that of the model without it, although the extent of free-surface supershear shrinks relative to
Figure 6c. The maximum slip of 6.0 m exceeds the 4.4 m of
Figure 6c, whereas the moment magnitude of 7.31 is smaller than 7.39. For the same background stress field and the same stress drop, the lower impedance of the damage zone increases the slip on the fault while the moment magnitude decreases.
Figure 16 maps the corresponding PGVh and intensity: relative to
Figure 8c, the X zone near the fault is smaller and more elongated, hugging the fault trace, whereas the IX and VIII zones expand. Thus, the damage zone contracts the zone of highest intensity and enlarges the zones of intermediate intensity so that the meizoseismal area shrinks while the region of moderate to strong damage grows. For the towns and infrastructure along the strike-slip faults of the Sichuan-Yunnan region, the broad extent of the intermediate-intensity zones deserves attention, and the hazard in the areas surrounding the fault should not be underestimated.
The simulations above assume a flat free surface and neglect the actual relief. Mountains and basins, however, are known to amplify and modulate near-fault ground motion strongly. The Luhuo earthquake occurred on the northwestern segment of the Xianshuihe fault in the western Sichuan Plateau, where the relief is severe and high mountains, gorges, and small intermontane basins are widespread and previous studies have shown that topographic relief can also affect the rupture process itself [
48,
49]. The influence of topography on the rupture process and the ground-motion distribution of the Luhuo earthquake therefore needs to be assessed.
Real topography is added to the optimal model using the 90 m resolution digital elevation model of the Shuttle Radar Topography Mission (SRTM), from which the surface elevation of the study region is extracted and interpolated onto the free surface of the computational mesh. The fault geometry, source parameters, velocity structure, and friction parameters follow the baseline model of
Section 3.1, and the damage zone is omitted so that the effect of topography can be isolated. The results are compared with the flat surface model with the vertically dipping fault.
Figure 17 shows the final slip and rupture time contours of the model with realistic topography. They are highly similar to those of the flat model (
Figure 6c): rupture starts at the nucleation patch, propagates rapidly to the northwestern end, travels some distance southeastward, and stops; the shape of the slip distribution, the maximum slip, and the moment magnitude show no clear difference. Topography therefore has little influence on the spontaneous rupture on the fault, because rupture dynamics is governed mainly by the fault geometry, the initial stress field, and the friction law, and the stress perturbations induced by the relief are far smaller than the tectonic stresses. Thus, neglecting topography is a reasonable simplification when only the rupture process of the Luhuo earthquake is considered.
Figure 18 maps the PGVh and theoretical intensity of the model with topography. The overall pattern resembles that of the flat model (
Figure 8c): the high-intensity zone remains a narrow band along the fault trace, and the attenuation on the two sides is broadly similar. Topography, however, introduces conspicuous complexity in detail. The monotonic decay of intensity with distance from the fault that characterizes the flat model is broken, and local pockets of anomalously high intensity appear within the low-intensity background as a result of the focusing of wave energy by the relief. The isoseismals are no longer smooth ellipses but jagged, serrated, and locally closed, indicating strong scattering and diffraction of the seismic waves and a spatial redistribution of energy. Thus, topographic modulation of ground motion is also significant in a real earthquake.
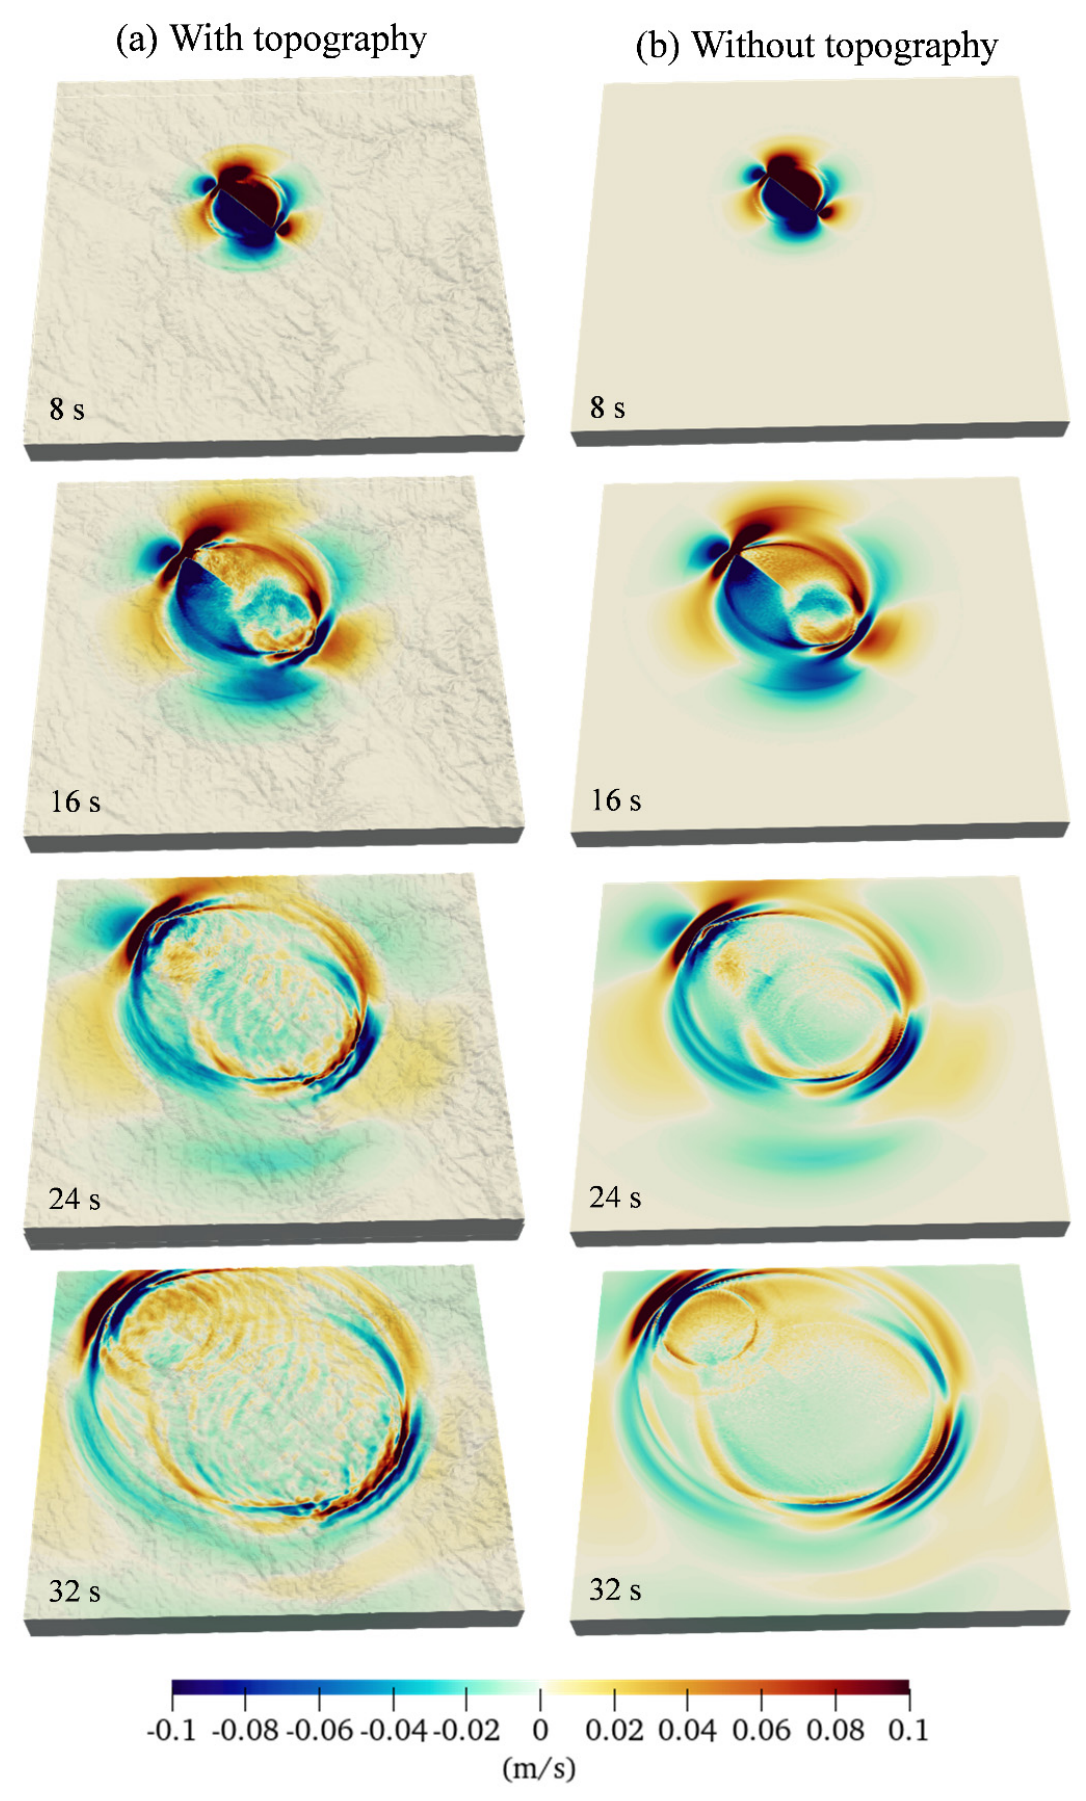
Figure 19 compares the north–south velocity wavefields of the models with undulating and flat surfaces. Within the first 16 s after rupture initiation, the wavefronts of the two models are almost identical in shape and propagation speed, showing that the early body-wave radiation and near-field propagation are controlled by the source and the deep velocity structure before the influence of topography emerges. After 16 s, the differences grow: the wavefield of the topographic model becomes more complex, with folded and bifurcated fronts that record repeated reflections and mode conversions of the incident waves at the irregular surface.
In summary, the fault damage zone mainly affects the source slip and the near-field high-frequency radiation, whereas topography mainly modulates wave propagation and the distribution of ground motion. In near-fault ground-motion simulations, neither effect can be neglected: the damage zone controls the peak intensity and the spatial attenuation gradient, while topography controls local intensity anomalies and the duration of shaking, and together, they make the real ground-motion field considerably more complex than that of a flat, homogeneous model.
4. Discussion
Under the optimal orientation of the regional maximum principal stress determined in
Section 3.1, the southeastward rupture would have propagated across almost the entire modeled fault without additional constraint, in conflict with the field surveys. To match the observed termination position numerically, high cohesion was prescribed near Renda so that the rupture front decelerated and stopped there. This is an a priori numerical constraint whose purpose is to reproduce the observed rupture length before any physical mechanism is introduced so that the stress orientation can be calibrated; it lacks a firm physical basis and serves only as a device for parameter calibration.
The stress-drop model introduced in
Section 3.3 is, by contrast, a mechanism model with a clear physical basis. The 1923 Daofu earthquake released substantial stress near Renda, leaving the region at a low initial shear stress before the Luhuo earthquake and forming a low-stress barrier. In this model, the artificially elevated cohesion is no longer needed: the rupture front stops spontaneously after entering the low-stress zone because its energy supply fails. The model not only reproduces the observed termination position but also explains the reduction in the surface offsets and the contraction of the isoseismals. In terms of physical plausibility, the stress-drop model is superior to the artificial constraint. This does not entirely negate the value of the high cohesion during parameter calibration: when information on the historical stress perturbation is unavailable, high cohesion can serve temporarily as an equivalent representation of the barrier. The final conclusions, however, should rest on the stress-drop model, whose mechanism is explicit.
The stress-drop model yields a surface rupture of about 90 km, which is slightly longer than the 71 km estimate of Lin and Zhang [
28] but clearly shorter than the 105 km estimate of Zhou et al. [
10] and is close to the field-survey estimate and in good agreement with the surface-offset profile. Its moment magnitude of
MW7.36 lies between the
MW7.3 of Yang et al. [
11] and the 7.44 of Zhou et al. [
10,
29], and its average strike-slip displacement of 3.77 m is slightly smaller than the 3.8 m inferred by Zhou et al. [
29]. The simulation therefore agrees reasonably well with previous observations and inversions in the rupture length, moment magnitude, and average slip, supporting the validity of the model.
PGVh and its corresponding theoretical seismic intensity are used primarily to distinguish among different rupture scenarios rather than to provide a comprehensive set of design-level ground-motion parameters. Parameters such as pseudo-spectral acceleration at specific periods (e.g., T = 1.0, 2.0, 3.0, and 5.0 s), Arias intensity, significant duration, and fling-step permanent displacement are not presented, as their extraction for specific engineering sites would require detailed site-specific analyses and would deviate from our central focus on rupture physics. Nevertheless, we emphasize that our simulated velocity and displacement time histories can be post-processed by end-users to obtain these additional engineering parameters. We therefore encourage future work to build upon our source models to perform site-specific response analyses for critical infrastructure in this region.
Our simulations indicate that fault geometry alone cannot fully account for the observed rupture termination. This does not imply that geometry is irrelevant; a sufficiently large stepover or a more complex branching geometry could conceivably arrest rupture propagation. Rather, our conclusion is constrained by the specific fault geometry of the northwestern Xianshuihe segment: within the tested configurations (continuous trace, stepovers at Renda and Jueluosi with 1 km offset, and three dip variants), none produced a termination pattern consistent with all three observational constraints simultaneously. We therefore interpret our results as showing that geometry was not the dominant control for this earthquake rather than implying that geometry plays no role.
Although the simulations agree with the observations in many respects, several limitations remain. The velocity structure is taken from USTClitho2.0. Although this is among the best lithospheric-scale velocity models for continental China, its resolution is insufficient to capture shallow sediments, low-velocity anomalies within the fault zone, and local velocity gradients, and such fine structures may affect the propagation of high-frequency waves and the details of near-fault strong ground motion. The rupture length and slip distribution are also sensitive to the friction parameters, such as the slip-weakening distance and the static friction coefficient. Although the conclusions remain robust within a reasonable parameter range, future work should refine the velocity model with regional deep exploration data and quantify the uncertainty with ensemble simulations. In addition, the mesh size and the computational cost limit the resolved frequency to about 1 Hz, so the simulated PGV, theoretical intensity, and velocity pulse characteristics mainly represent ground motion during periods longer than about 1 s and do not cover the full frequency band of engineering interest. Within this limitation, the synthesized near-fault long-period motions, including velocity pulses and permanent displacements, can supply the long-period component for time-history analyses of major projects such as the fault-crossing sections of the Sichuan-Tibet railway, for which recorded pulse-like motions are scarce, while the high-frequency content should be supplemented with stochastic or broadband hybrid simulations. The results provide a physical basis for seismic hazard assessment on complex fault systems and for the long-period ground-motion input at engineering sites.
The spontaneous arrest of the Luhuo rupture near Renda shows that stress shadows left by historical earthquakes can substantially change the extent of subsequent ruptures. The northwestern segment of the Xianshuihe fault has hosted repeated strong earthquakes, and its stress state is highly heterogeneous. The length of a future rupture depends not only on the regional stress loading but also on the distribution of stress deficits and barriers along the fault. Hazard assessment for the fault zone should therefore not infer the maximum possible magnitude from geometric continuity alone; paleoseismic data, historical earthquakes, and numerical simulation should be combined to quantify the stress heterogeneity on the fault. This study provides a physical basis for constructing earthquake scenarios in the region.
5. Conclusions
In this study, multiple three-dimensional dynamic rupture simulations of the 1973 MS7.6 Luhuo earthquake on the Xianshuihe fault were performed to investigate the controls on rupture propagation, termination, and near-fault ground motion. The effects of the regional stress orientation, fault geometry (stepovers and dip variations), stress heterogeneity inherited from the 1923 Daofu earthquake, fault damage zone, and realistic topography were systematically examined. The main conclusions are outlined as follows.
(1) The optimal orientation of the regional maximum principal compressive stress is N75° W. Under this orientation, the simulated surface offsets and intensity distribution agree best with the observations, the rupture propagates bilaterally, and supershear episodes occur near the free surface.
(2) Fault geometry is not the dominant control on rupture termination. Continuous and dipping fault models allow rupture to break the entire fault, and although a stepover at Renda blocks the rupture jump, minor surface slip remains on the secondary fault.
(3) Stress heterogeneity generated by the 1923 Daofu earthquake is the most plausible dominant cause of rupture termination. With the initial shear stress near Renda reduced, the simulated arrest position, surface offsets, and intensity distribution all fit the observations better.
(4) A fault damage zone increases the slip, lowers the moment magnitude, contracts the zone of highest intensity, and enlarges the zones of intermediate intensity. Neglecting the damage zone would underestimate the near-fault peak intensity and misrepresent the spatial pattern of intensity.
(5) Topography has a negligible effect on the rupture process on the fault but modulates the ground motion markedly. Realistic relief complicates the isoseismals, and the scattering and surface waves generated by topography in the later stage of wave propagation lengthen the duration of shaking and increase the spatial variability of ground motion.