Article

Study on the Pre-Concentration of Spodumene Using Dense Medium Cyclone

1
Faculty of Land Resource Engineering, Kunming University of Science and Technology, Kunming 650000, China
2
Xinjiang Kunlun Blue Diamond Mining Development Co., Ltd., Hetian 848000, China
3
School of Minerals Processing and Bioengineering, Central South University, Changsha 410083, China
*
Author to whom correspondence should be addressed.
Appl. Sci. 2026, 16(17), 8489; https://doi.org/10.3390/app16178489
Submission received: 24 July 2026 / Revised: 10 August 2026 / Accepted: 17 August 2026 / Published: 26 August 2026
(This article belongs to the Special Issue Advanced Technologies in Mine and Mineral Separation)

Abstract

Dense medium cyclone (DMC) separation offers a potential route for the pre-concentration of spodumene ores prior to downstream grinding and flotation. In this study, the effects of dense medium suspension density and feed pressure on spodumene pre-concentration were investigated through actual ore separation tests combined with CFD simulations. Under the optimal conditions of a feed pressure of 150 kPa and a medium density of 2200 kg/m3, the Li2O grade increased from 1.30% in the feed to 5.72% in the concentrate, with a Li2O recovery of 77.23% and a separation efficiency of 60.42%. CFD results showed that the optimal operating conditions produced a relatively stable flow field with lower turbulent kinetic energy. Excessively high medium density or feed pressure increased the probability of fine spodumene particles reporting to the overflow, resulting in lithium losses, whereas insufficient medium density or feed pressure promoted the misplacement of gangue minerals into the concentrate. These results clarify the effects of key operating parameters on spodumene separation in a DMC and provide a basis for optimizing the pre-concentration of hard-rock lithium ores.

1. Introduction

Lithium has become an important strategic resource for modern energy storage technologies. Owing to their high energy density, long cycle life, and low self-discharge rate, lithium-ion batteries are widely used in electric vehicles, portable electronic devices, and large-scale energy storage systems [1,2,3,4]. Among various lithium-bearing minerals, spodumene (LiAlSi2O6) is one of the most important raw materials for lithium extraction from hard-rock deposits because of its relatively high theoretical Li2O content (~8.03%) and mature beneficiation and metallurgical technologies [5,6,7,8,9].
In recent years, significant progress has been made in lithium resource exploration in Xinjiang, particularly at the Dahongliutan lithium deposit in the West Kunlun region [10,11]. Located in Hotan County, Xinjiang, the deposit contains considerable spodumene resources. The proven ore reserves in the initial mining area reach approximately 50 million tonnes, containing about 0.70 million tonnes of Li2O, and the total resources are expected to increase further with continued exploration [12]. As a key project under Xinjiang’s “14th Five-Year Plan”, its development is important for strengthening lithium resource supply [13,14].
Natural spodumene ores generally contain large amounts of quartz, feldspar, mica, and other gangue minerals, making effective beneficiation necessary before subsequent metallurgical processing [15,16]. Conventional beneficiation methods include hand sorting, gravity separation, magnetic separation, flotation, and combined flowsheets [15]. Flotation can produce high-grade lithium concentrates but generally involves relatively high reagent consumption and complex operating conditions [17,18,19,20,21,22]. Conventional gravity separation methods, such as jigging and shaking tables, are limited by the relatively small density difference between spodumene and major silicate gangue minerals. The typical densities reported in the literature are approximately 3100–3300 kg/m3 for spodumene and approximately 2650 kg/m3 for quartz [23].
Dense medium cyclones (DMCs) are continuous and high-throughput gravity separation devices widely used in coal and mineral processing [24]. In a DMC, particles are separated according to their migration behavior in a high-density suspension under a centrifugal flow field [25]. Compared with conventional gravity separation equipment, DMCs provide enhanced centrifugal separation and are suitable for processing relatively coarse particles, giving them considerable potential for spodumene pre-concentration [26].
However, DMC separation is influenced not only by mineral density differences but also by operating parameters and internal hydrodynamic conditions. Therefore, this study evaluates the pre-concentration of a low-grade spodumene ore from the Dahongliutan deposit using a DMC. The effects of medium density and feed pressure on separation performance were investigated through actual ore experiments, while CFD simulations were used to analyze the corresponding flow-field characteristics, particle trajectories, and residence times. The distinctive feature of this work is the integration of experimental separation results with CFD-based hydrodynamic analysis to clarify the relationship between operating parameters, internal flow behavior, and spodumene separation performance, thereby providing a basis for DMC process optimization.

2. Materials and Methods

2.1. Materials and Samples

The raw material used in this study was obtained from the run-of-mine feed of the Dahongliutan spodumene deposit in Xinjiang, China, which is a typical granitic pegmatite-type lithium ore. The collected bulk sample was thoroughly homogenized to ensure representativeness, and a representative subsample was characterized by multi-element chemical analysis, X-ray diffraction (XRD; D/Max-2200, Rigaku Corporation, Akishima, Tokyo, Japan), mineral liberation analysis (MLA; MLA 650F, FEI Company, Hillsboro, OR, USA), scanning electron microscopy coupled with energy-dispersive X-ray spectroscopy (SEM-EDS; QUANTA 600, FEI Company, Hillsboro, OR, USA; GENESIS 2000, EDAX Inc., Mahwah, NJ, USA), and polarized-light microscopy (BX53, Olympus Corporation, Hachioji, Tokyo, Japan).
The chemical composition of the raw ore is shown in Table 1. The ore contains 1.68 wt% Li2O, with SiO2 and Al2O3 contents of 71.90 and 15.51 wt%, respectively. The relatively high contents of SiO2 and Al2O3 indicate that silicate minerals constitute the major components of the ore.
The XRD pattern of the raw ore, obtained using a D/Max-2200 X-ray diffractometer (Rigaku Corporation, Akishima, Tokyo, Japan), is shown in Figure 1. The characteristic diffraction peaks of spodumene, quartz, plagioclase, and K-feldspar are clearly identified, indicating that spodumene is the principal lithium-bearing mineral, whereas quartz and feldspar are the dominant gangue minerals.
(MLA; MLA 650F, FEI Company, Hillsboro, OR, USA), scanning electron microscopy (SEM; QUANTA 600, FEI Company, Hillsboro, OR, USA) coupled with energy-dispersive X-ray spectroscopy (EDS; GENESIS 2000, EDAX Inc., Mahwah, NJ, USA), and polarized-light microscopy (BX53, Olympus Corporation, Hachioji, Tokyo, Japan) were employed. For MLA, representative subsamples were prepared as polished sections, and mineral phases were identified based on backscattered-electron images combined with EDS spectra. The relative mineral contents were calculated from the accumulated mineralogical statistics of the analyzed particles and fields. MLA was also used to evaluate the liberation characteristics of spodumene, while SEM-EDS and polarized-light microscopy were used to assist mineral identification and characterize mineral occurrence.
The bulk raw ore was crushed to −6 mm, and its particle-size distribution is presented in Table 2. The −6 + 0.9 and −0.9 + 0.45 mm fractions accounted for 27.87% and 37.57%, respectively, indicating that the crushed product was predominantly distributed in the relatively coarse size fractions. The −0.5 mm fraction was subsequently removed by screening, and the resulting −6 + 0.5 mm fraction was used as the feed for the DMC separation experiments.

2.2. Equipment and Method

2.2.1. Dense Medium Cyclone Separation Tests

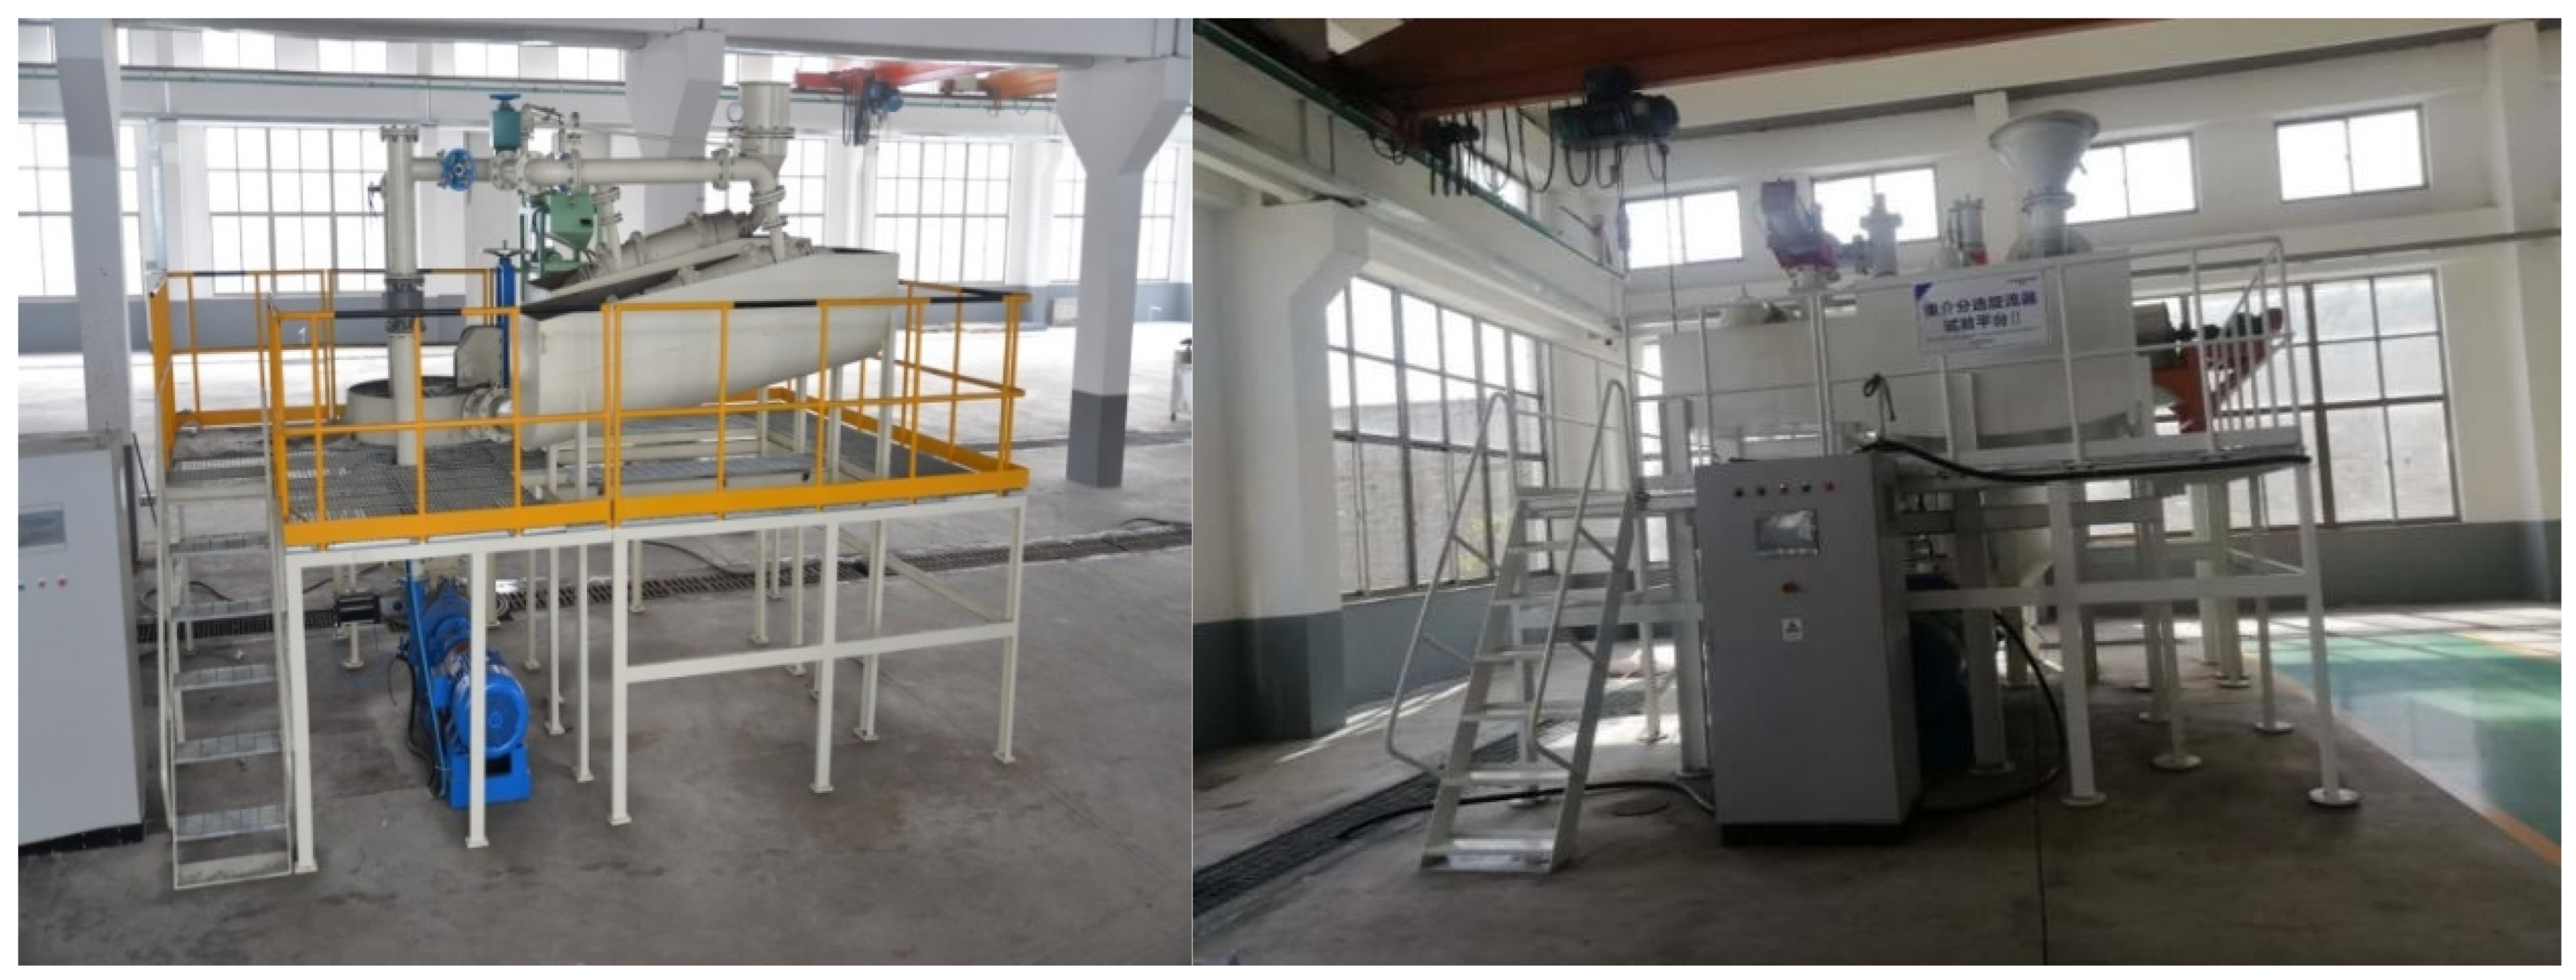
The actual-ore separation tests were conducted using a two-product dense medium cyclone with a nominal diameter of 250 mm (D250; Haiwang Hydrocyclone, Yantai, Shandong, China) and an inclination angle of 20° relative to the horizontal (Figure 2). The separating medium was a ferrosilicon–water suspension. The experimental system mainly consisted of an ore feeding unit, dense medium circulation system, slurry pump, and DMC separator. During operation, the ore was mixed with the ferrosilicon suspension and continuously pumped into the cyclone. Feed pressure was monitored using a pressure sensor installed at the cyclone inlet. Before sampling, the dense medium was circulated sufficiently to ensure uniform mixing, and samples were collected only after stable operation was achieved under the preset conditions.
In the DMC, the underflow was collected as the concentrate and the overflow as the tailings. After steady-state operation was reached, concentrate and tailings were sampled simultaneously over the same time interval. The products were screened to remove ferrosilicon, dried, and weighed to determine their yields. Representative subsamples were then collected for Li2O analysis. Based on the measured product yields and Li2O grades, the Li2O recovery and separation efficiency were calculated.

2.2.2. CFD Simulation Method

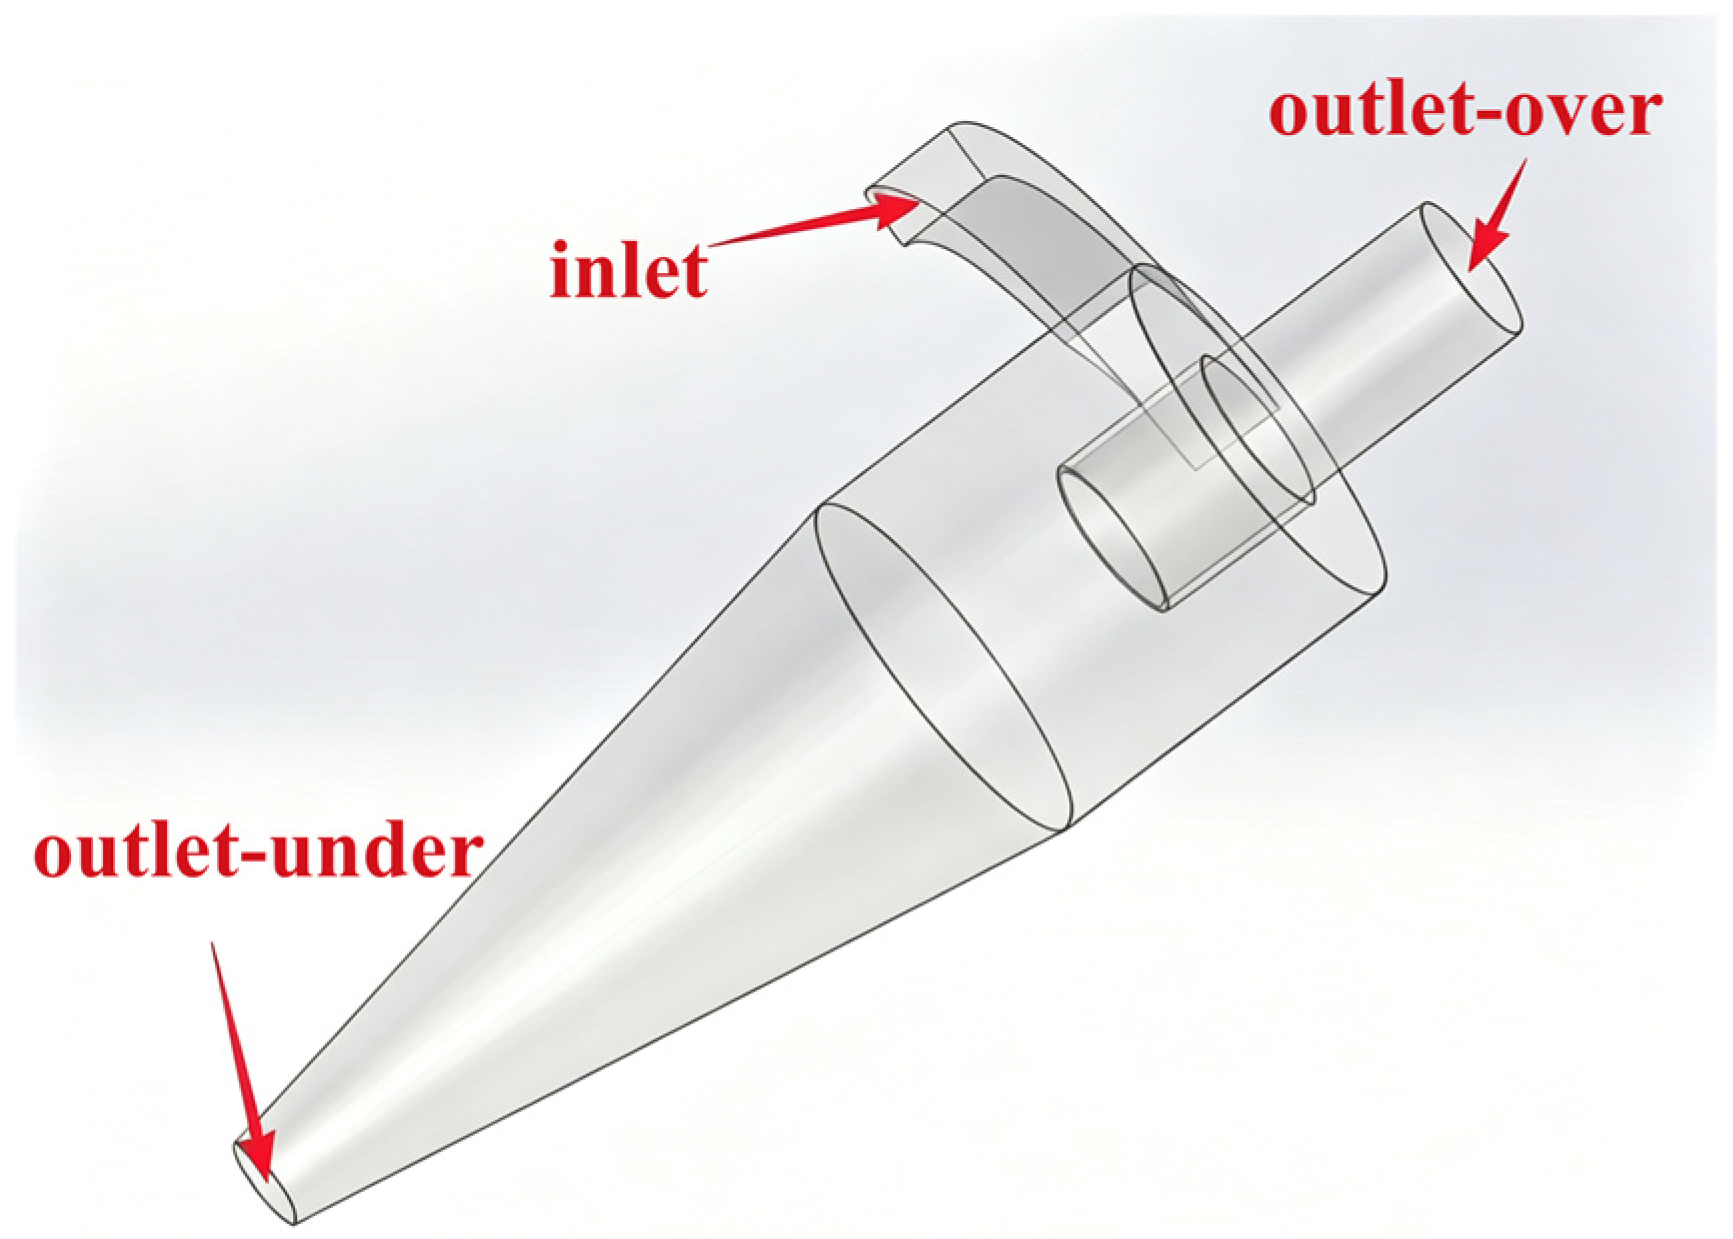
The boundary definitions of the DMC are shown in Figure 3. The feed inlet was defined as inlet, while the overflow and underflow outlets were defined as outlet-over and outlet-under, respectively. To reproduce the actual operating conditions, pressure-inlet and pressure-outlet boundary conditions were applied. Considering the high-altitude location of the experimental site in Xinjiang, the operating pressure was set according to the local ambient pressure of approximately 61.6 kPa.
The continuous flow field was solved in ANSYS Fluent (ANSYS, Inc., Canonsburg, PA, USA) based on the finite volume method. The governing equations included the continuity and momentum equations, while the RNG k–ε turbulence model was employed to describe the strongly swirling turbulent flow inside the DMC. The ferrosilicon–water suspension was treated as the continuous separating medium, and its density was varied according to the experimental conditions. The calculations were initialized based on the prescribed operating and boundary conditions and iterated until a stable solution was obtained.
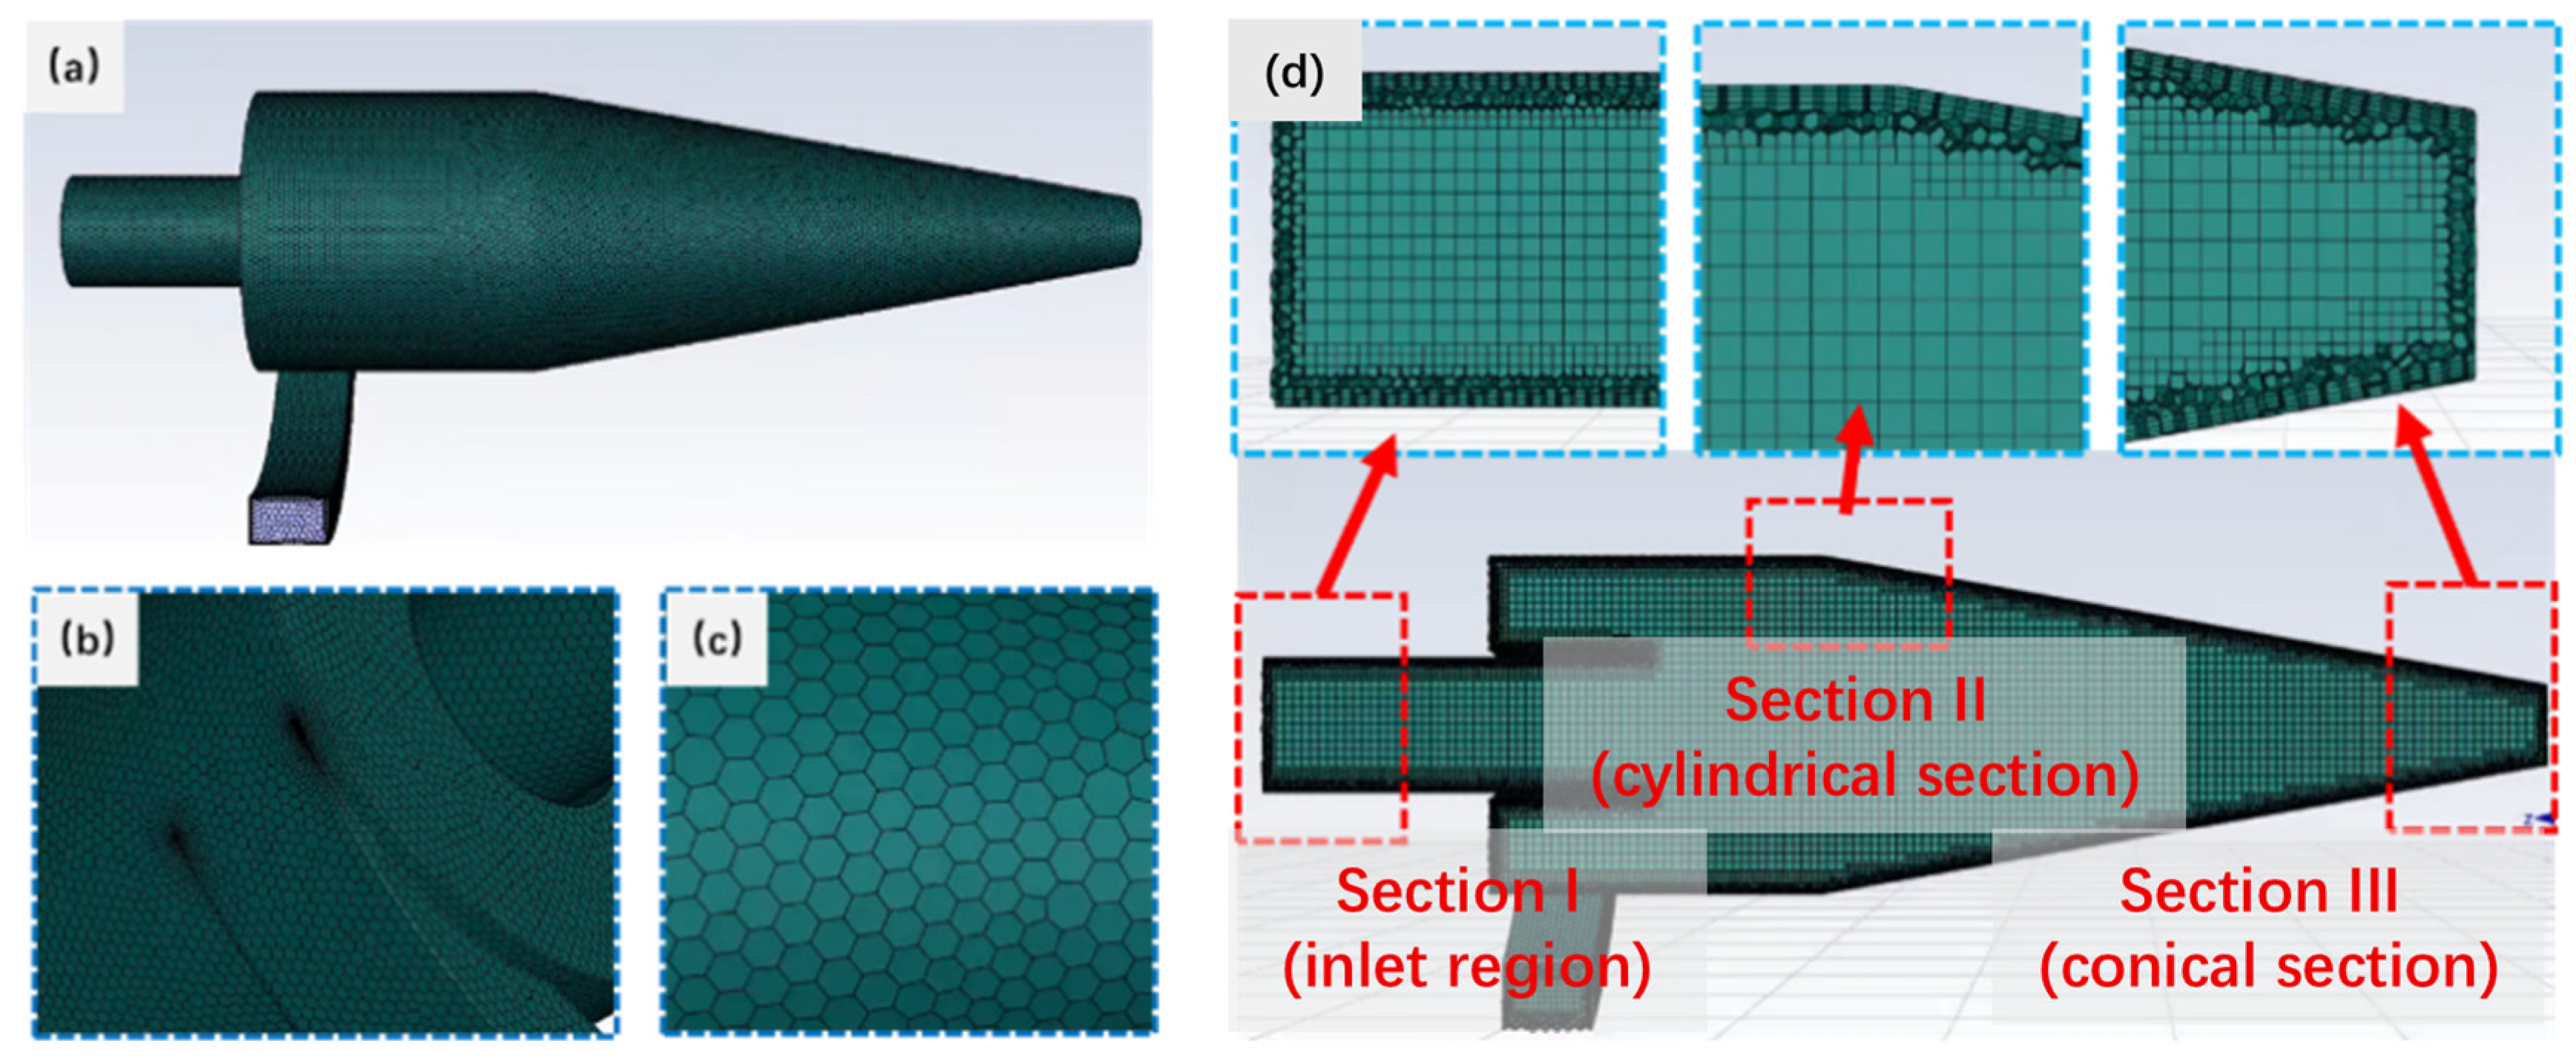
The computational domain was discretized into approximately 4.0 × 10⁵ finite-volume cells, with local refinement applied in regions with relatively strong variations in the flow field. The mesh configuration is shown in Figure 4. Figure 4a presents the overall mesh distribution, while Figure 4b,c show the locally refined and near-wall regions. Representative cross-sections in the inlet, cylindrical, and conical sections were selected for subsequent flow-field analysis, as shown in Figure 4d.
After convergence of the continuous-phase calculation, pressure, velocity, turbulent kinetic energy, and turbulent dissipation rate were extracted from the selected cross-sections for comparative analysis. Particle migration was further investigated using the Discrete Phase Model (DPM). Representative particle densities of 2600 and 3200 kg/m3 were used for the dominant silicate gangue minerals and spodumene, respectively, and particle diameters of 0.5, 3.0, and 6.0 mm were selected to represent fine, intermediate, and coarse particles. Particle trajectories and residence times were then analyzed under different feed-density and feed-pressure conditions.

3. Results

3.1. Mineralogical Characteristics of the Feed Ore

The quantitative mineral composition of the raw ore determined by MLA is presented in Table 3. Lithium-bearing minerals account for 27.18% of the ore and are dominated by spodumene (21.60%) and lepidolite (4.98%), with minor amounts of amblygonite (0.35%) and elbaite (0.25%). The main gangue minerals are plagioclase (33.19%), quartz (28.26%), and K-feldspar (10.90%), together accounting for most of the 72.77% gangue fraction. These results are consistent with the major mineral phases identified by XRD. The identification of the minor lithium-bearing minerals was further supported by SEM-EDS analysis; however, because Li cannot be reliably quantified by conventional EDS, the phase-specific distribution of lithium among the individual lithium-bearing minerals was not determined in this study. Considering their low abundances, amblygonite and elbaite represent only minor components of the lithium-bearing mineral assemblage. The values reported to two decimal places represent the statistical output of the MLA and should be interpreted as quantitative modal estimates rather than an analytical precision of ±0.01%.
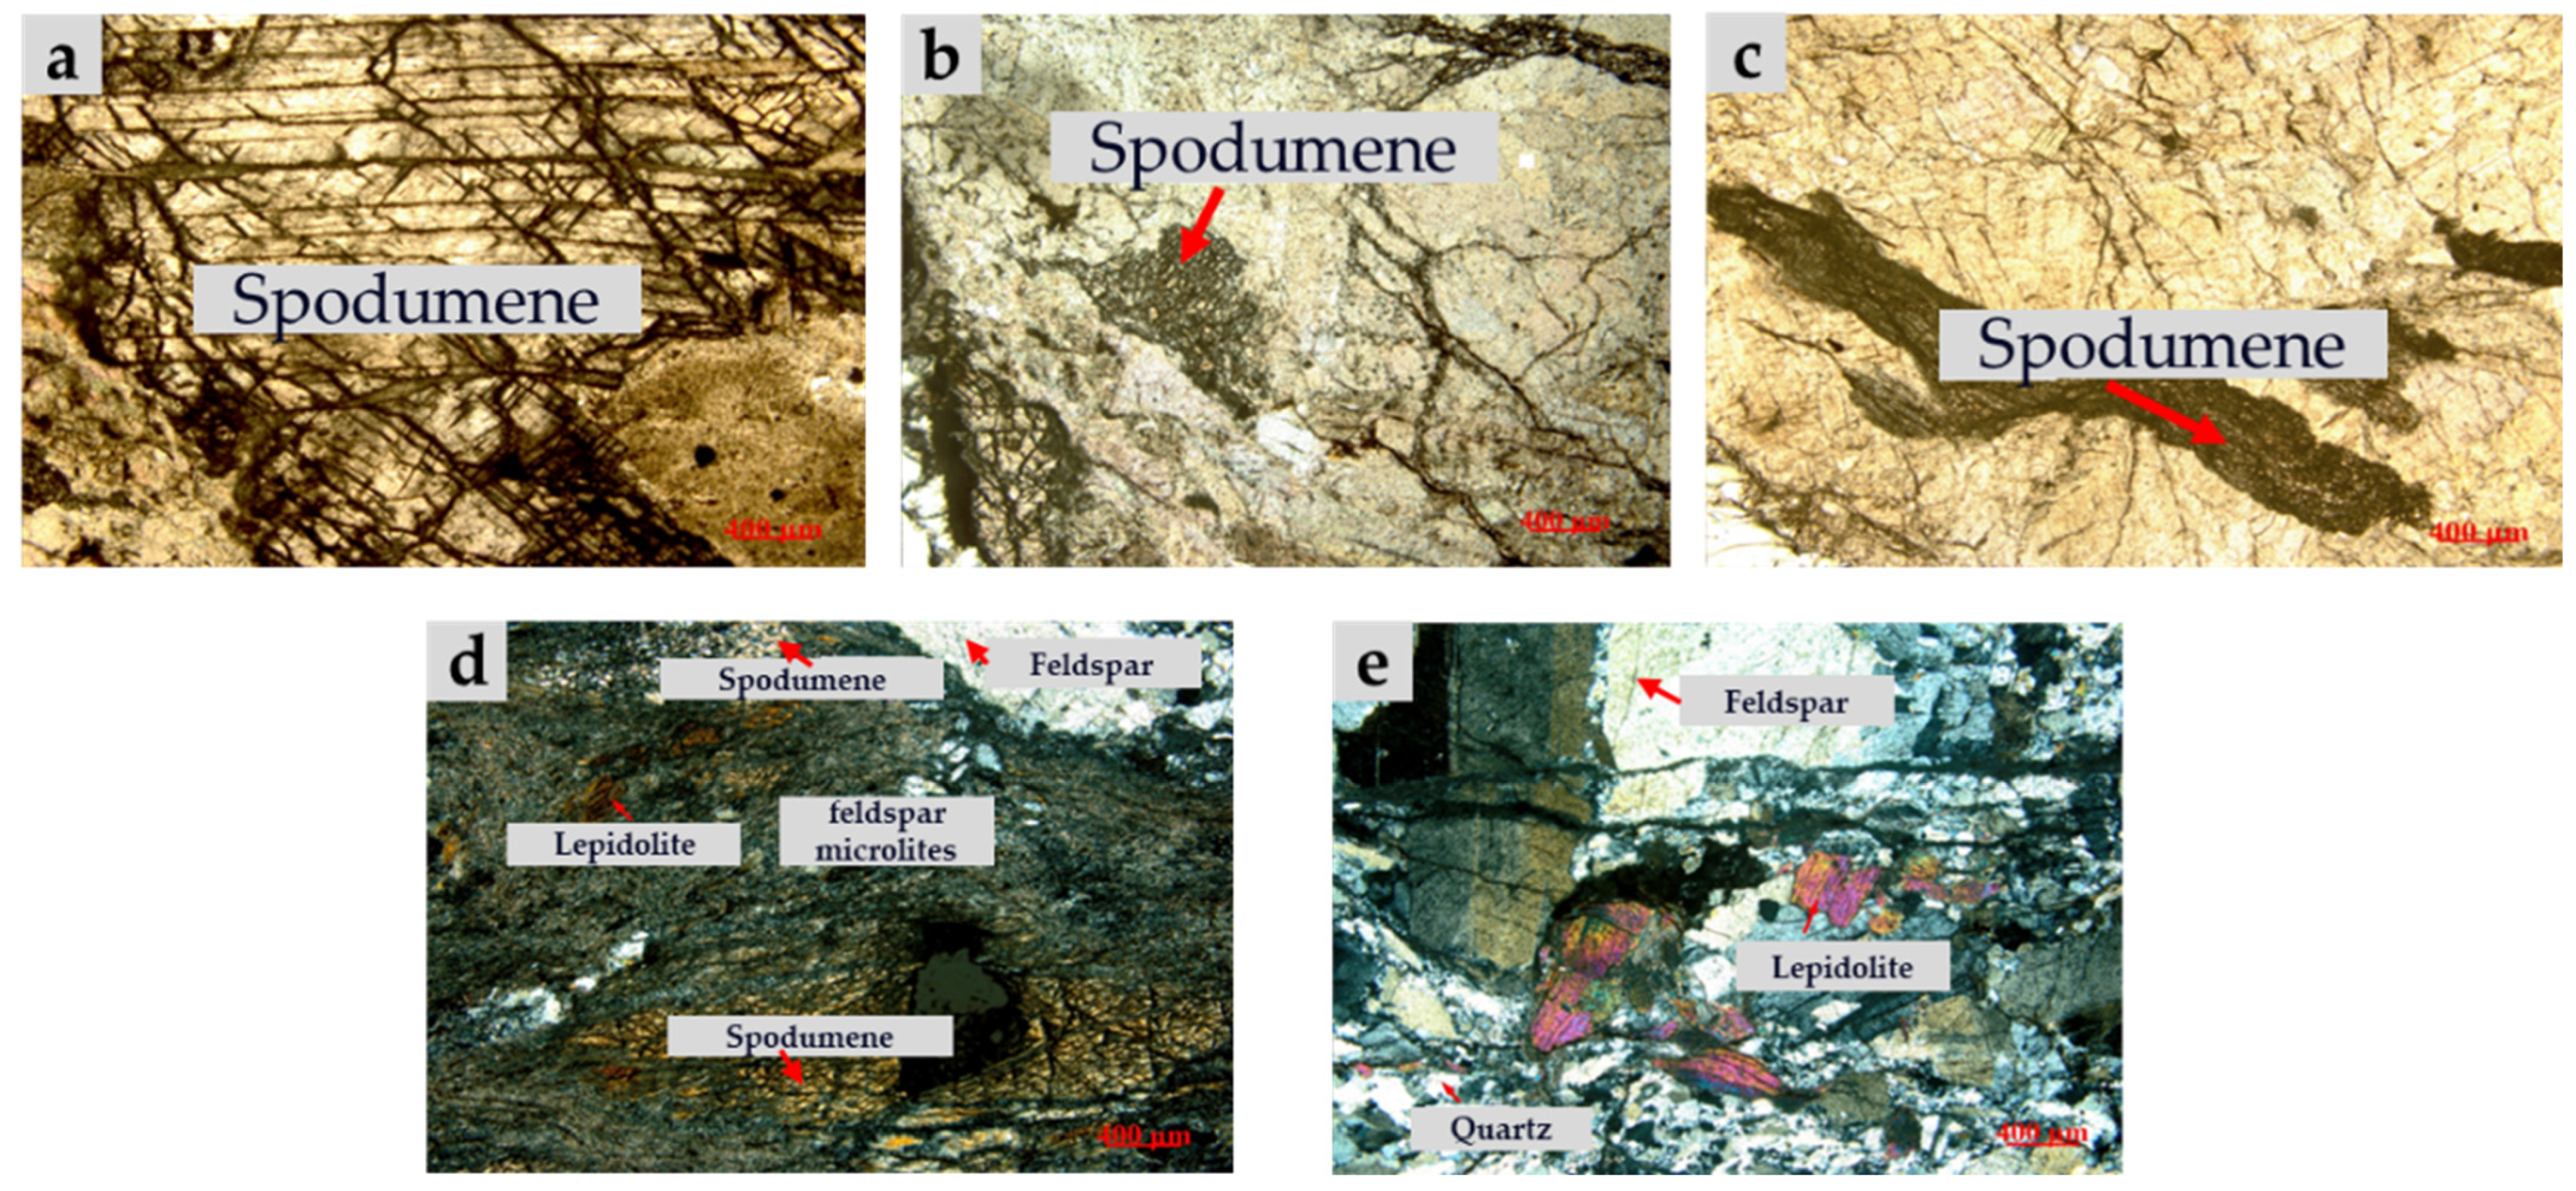
Polarized-light microscopy showed that spodumene mainly occurs as subhedral prismatic crystals, irregular fine-grained aggregates, and pseudo-prismatic aggregates (Figure 5a–c). The relatively coarse prismatic crystals reach approximately 3 mm, whereas the fine-grained aggregates are generally below approximately 1 mm. Minor fractured spodumene and lithium-bearing mica associated with feldspar and quartz were also observed (Figure 5d,e).
MLA liberation analysis showed that the liberation degree of spodumene was 76.66% in the −6 + 0.9 mm fraction and increased to 90.22% in the −0.9 + 0.45 mm fraction. Thus, spodumene exhibits favorable liberation within the particle size range used for DMC separation. Combined with the density difference between spodumene and the dominant quartz and feldspar gangue minerals, these characteristics provide a favorable mineralogical basis for DMC pre-concentration.

3.2. Experimental Tests on Actual Ore Samples

3.2.1. Effect of DMC Feed Density on Separation Performance

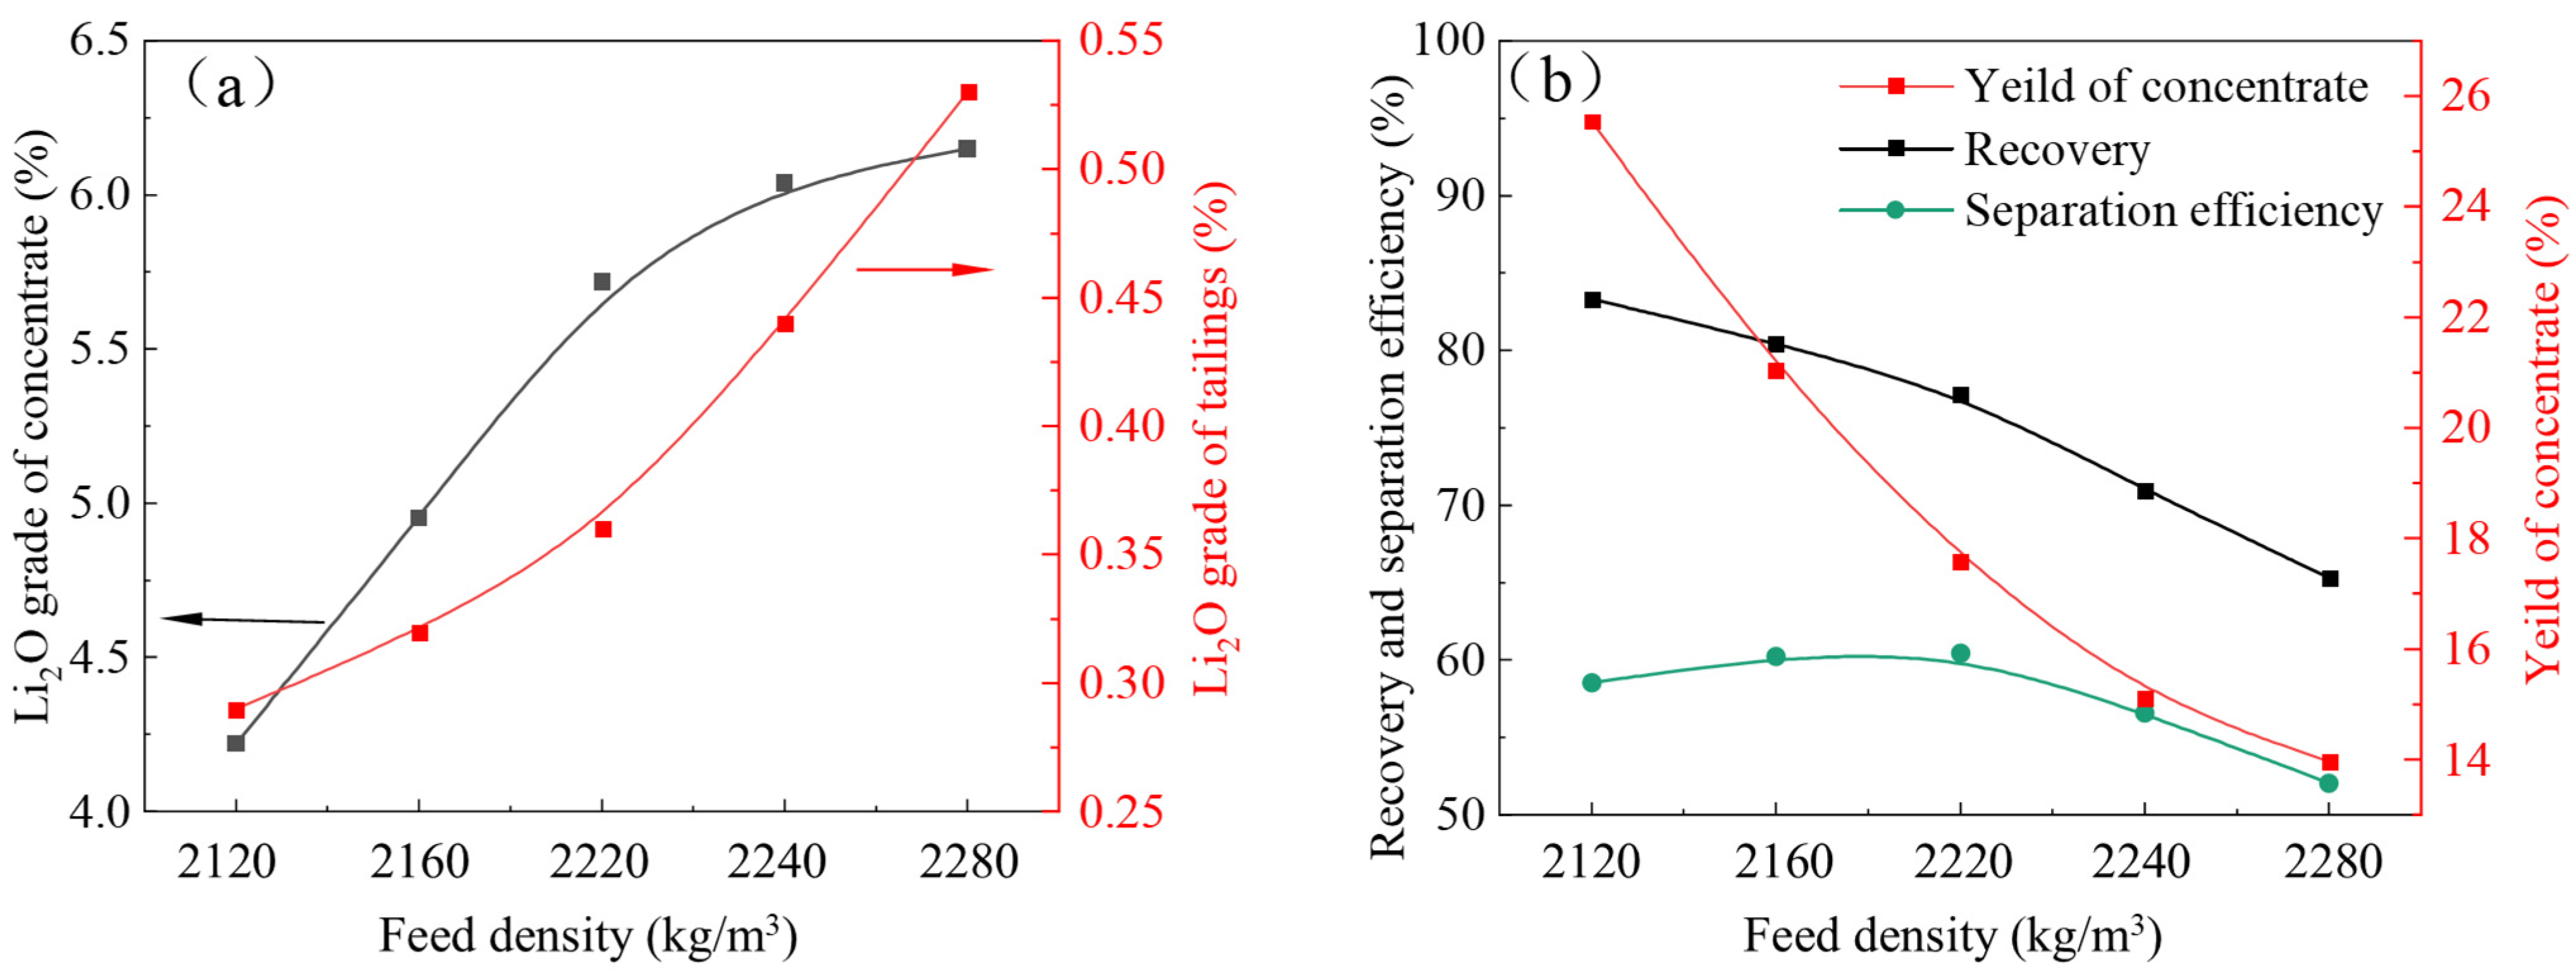
The feed density of the DMC was controlled by adjusting the mass ratio of ferrosilicon powder to water and was further verified based on the measured volume and mass of the sampled feed suspension. In dense medium separation, feed density is a comprehensive operating parameter that directly determines the separation density and simultaneously influences suspension properties, such as viscosity and flow behavior. As the feed density increases, the density contrast between particles and the medium changes, thereby affecting particle migration and stratification behavior within the separation zone. However, excessively high medium density may increase suspension viscosity and hinder the movement and separation of fine spodumene particles, resulting in reduced separation efficiency. Based on preliminary tests, the investigated feed density range was selected around the effective separation region of the DMC. The relatively small density interval was adopted to accurately evaluate the influence of feed density on separation performance and determine the optimal operating condition for the tested ore.
As shown in Figure 6a, increasing the feed density improves the Li2O grade of the concentrate; however, the Li2O grade of the tailings also increases simultaneously. Figure 6b indicates that the concentrate yield decreases with increasing feed density. The increase in medium density alters the particle-medium interaction and migration behavior within the DMC separation zone. Under the combined effects of centrifugal force, buoyancy, drag force, and particle-fluid interactions, fine spodumene particles are more likely to migrate toward the central air core and discharge through the overflow, resulting in a decrease in Li2O recovery in the concentrate.
According to the variation in separation efficiency with feed density, the maximum separation efficiency is achieved at a feed density of 2200 kg/m3. Although this medium density is lower than the typical densities reported in the literature for spodumene (~3100–3300 kg/m3) and quartz (~2650 kg/m3), these values are used only as reference mineral densities rather than sample-specific measurements. The separation behavior in a DMC is not determined solely by the static density difference between minerals and the medium. Instead, the rotational flow field promotes density-dependent stratification and particle migration within the cyclone. At a feed density of 2200 kg/m3, an appropriate balance between spodumene recovery and gangue rejection is achieved, resulting in the highest separation efficiency. Therefore, this value was selected as the optimal operating condition for processing the test samples using the D250-type DMC.

3.2.2. Effect of DMC Feed Pressure on Separation Performance

Under the optimal feed density condition of 2200 kg/m3, the effect of feed pressure on DMC separation performance was investigated using controlled-variable experiments. Feed pressure affects not only the throughput of material entering the DMC but also the initial velocity of particles entering the separation zone and the internal flow field distribution.
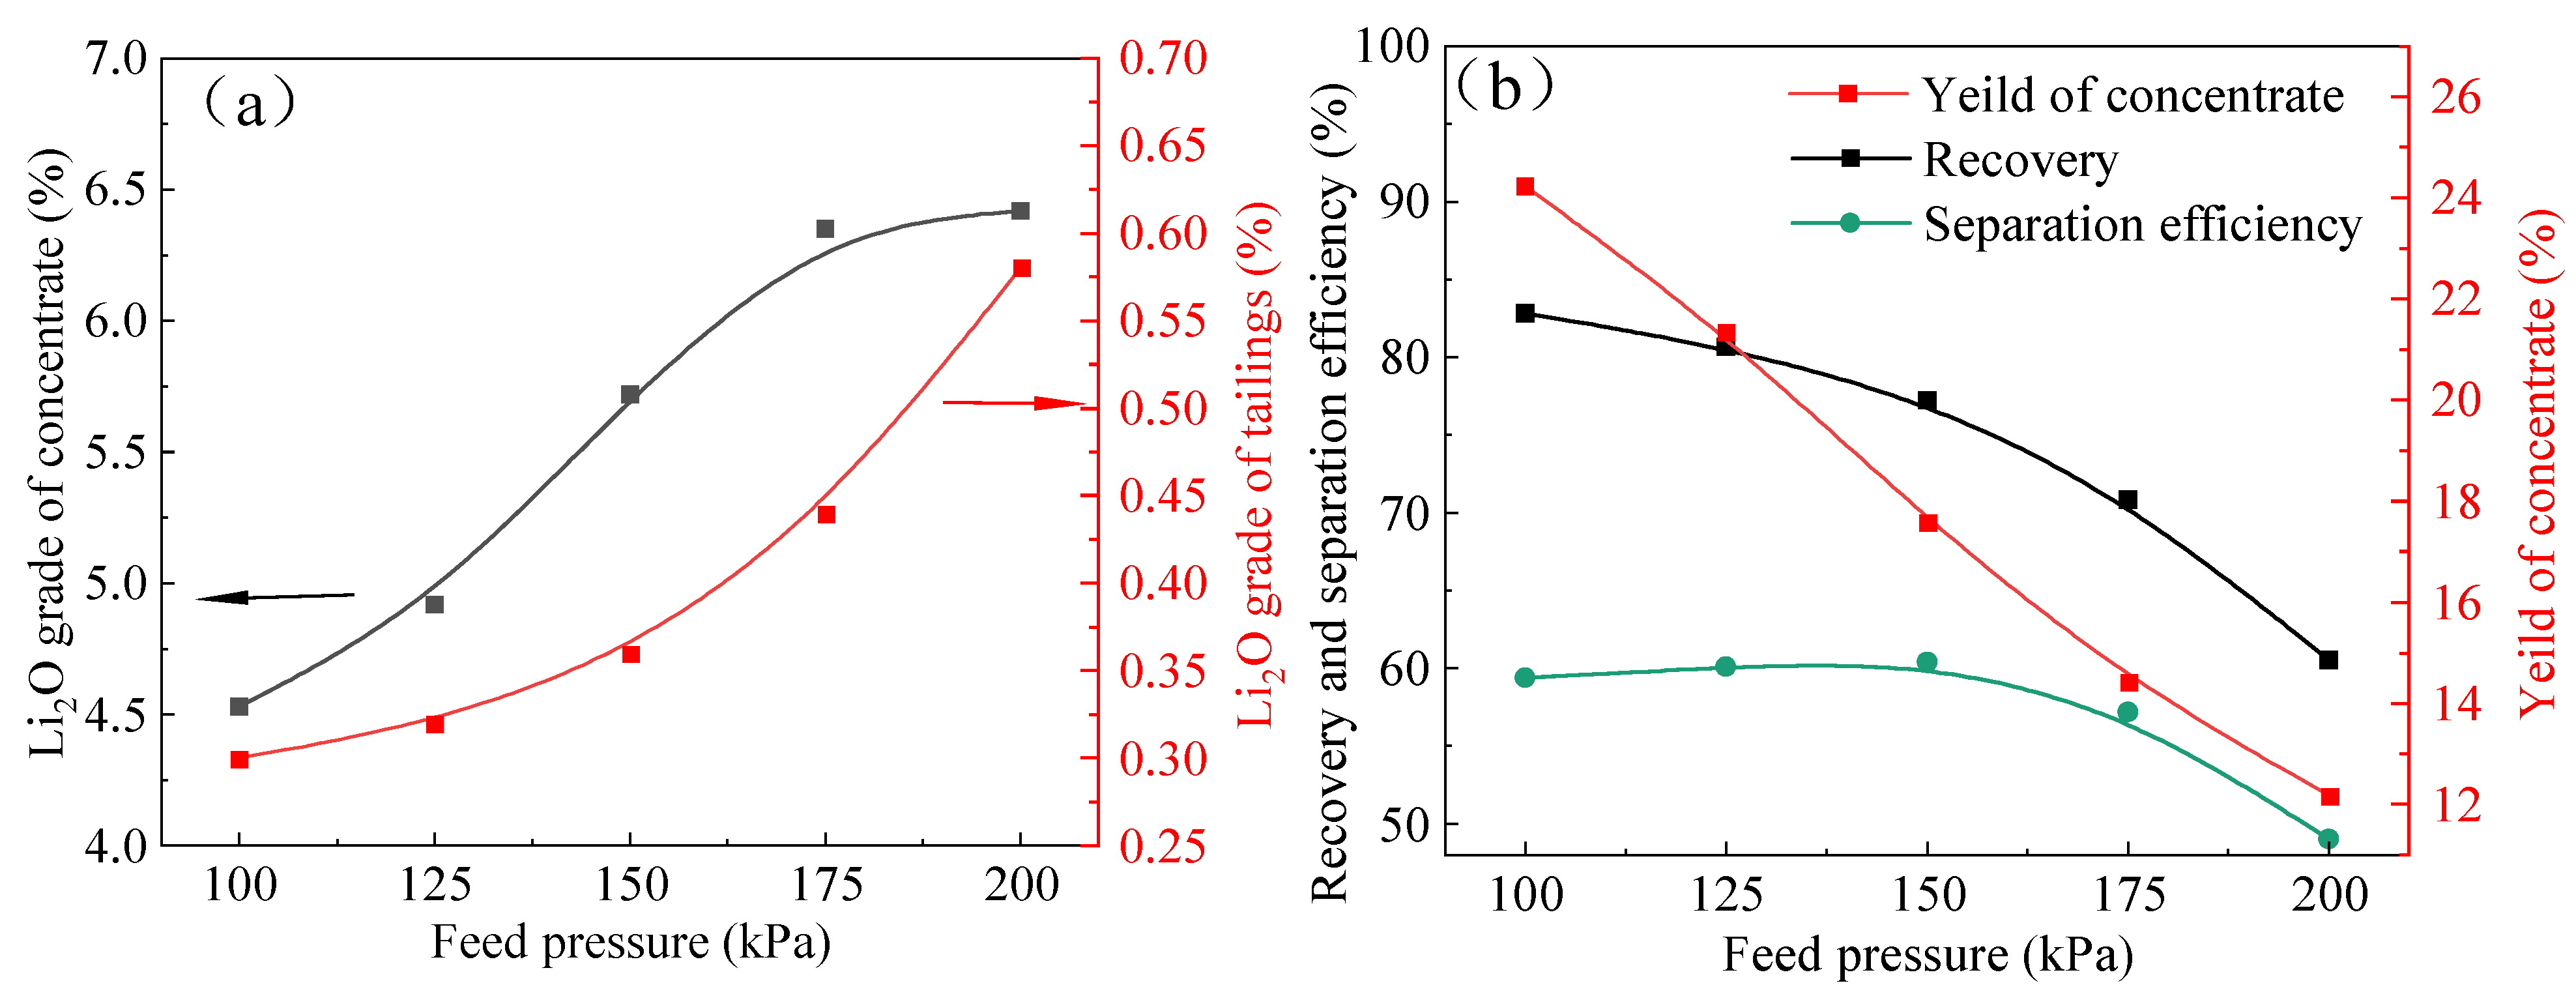
As shown in Figure 7a, increasing the feed pressure results in higher Li2O grades in both the concentrate and tailings. When the feed pressure increases from 175 to 200 kPa, the increase in concentrate Li2O grade becomes less pronounced, whereas the Li2O grade of the tailings increases significantly, indicating that excessive feed pressure may negatively affect separation performance. Figure 7b further shows that increasing feed pressure decreases the concentrate yield, suggesting that more particles migrate into the overflow, resulting in reduced Li2O recovery in the concentrate.
Based on the variation in separation efficiency with feed pressure, the maximum separation efficiency is obtained at a feed pressure of 150 kPa. Therefore, a feed pressure of 150 kPa was selected as the optimal condition for the D250-type DMC. Under this condition, the feed material with an initial Li2O grade of 1.30% was upgraded to a concentrate with a Li2O grade of 5.72%, a Li2O recovery of 77.23%, and a separation efficiency of 60.42% after a single DMC separation. These results demonstrate the effectiveness of DMC for spodumene preconcentration.

3.3. CFD Simulation Experiments

3.3.1. Effect of Feed Density on the Separation Process

Effect of Feed Density on the Pressure Distribution in the Separation Zone
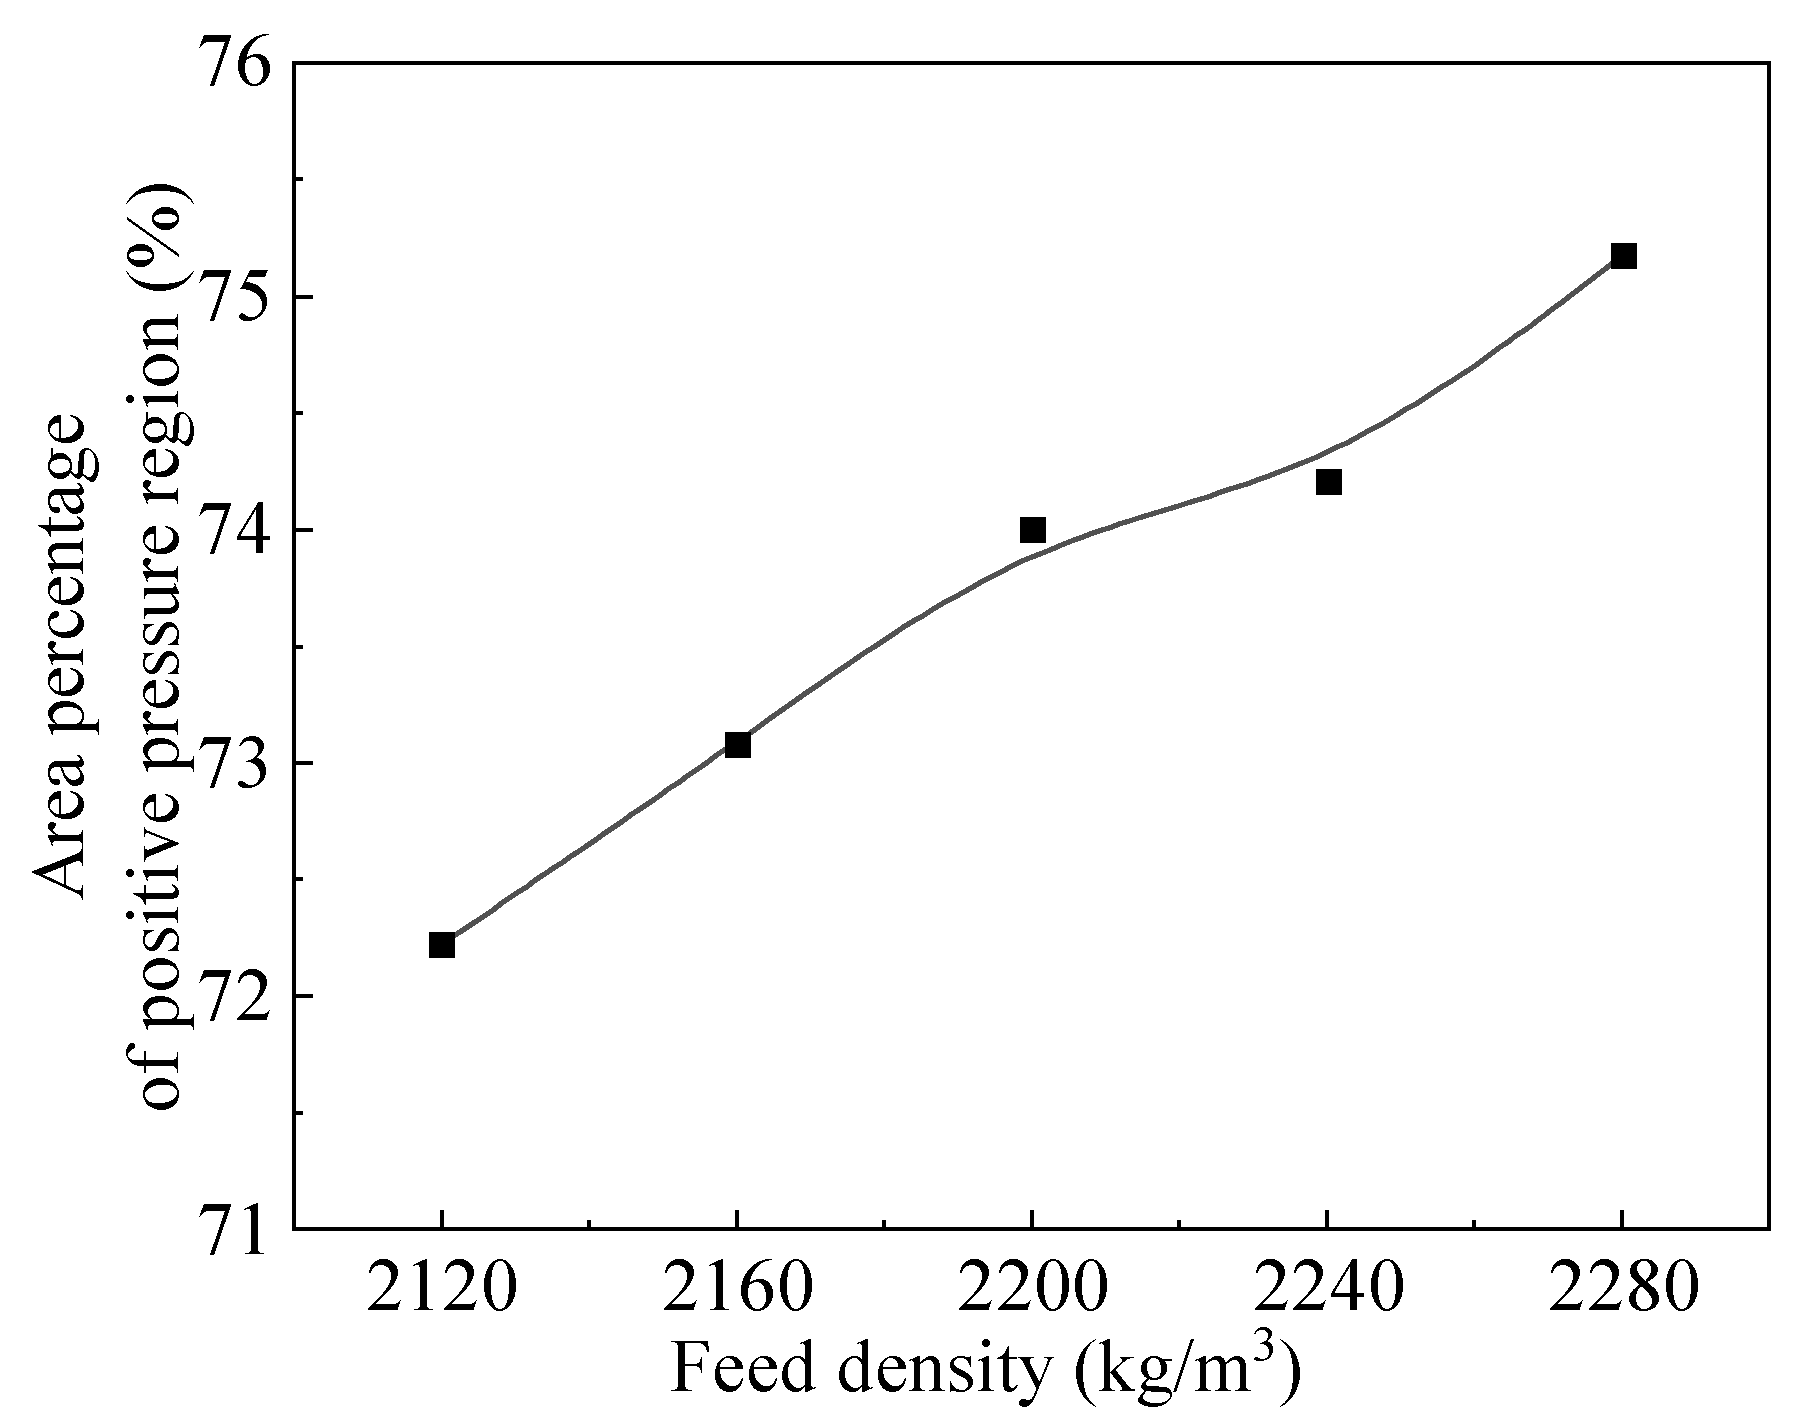
The effect of feed density on the pressure field was evaluated by calculating the ratio of the positive-pressure region area to the total cross-sectional area under different feed densities. As shown in Figure 8, at the same feed pressure, increasing feed density enlarges the proportion of positive-pressure regions within the DMC separation zone, while reducing the proportion of negative-pressure regions.
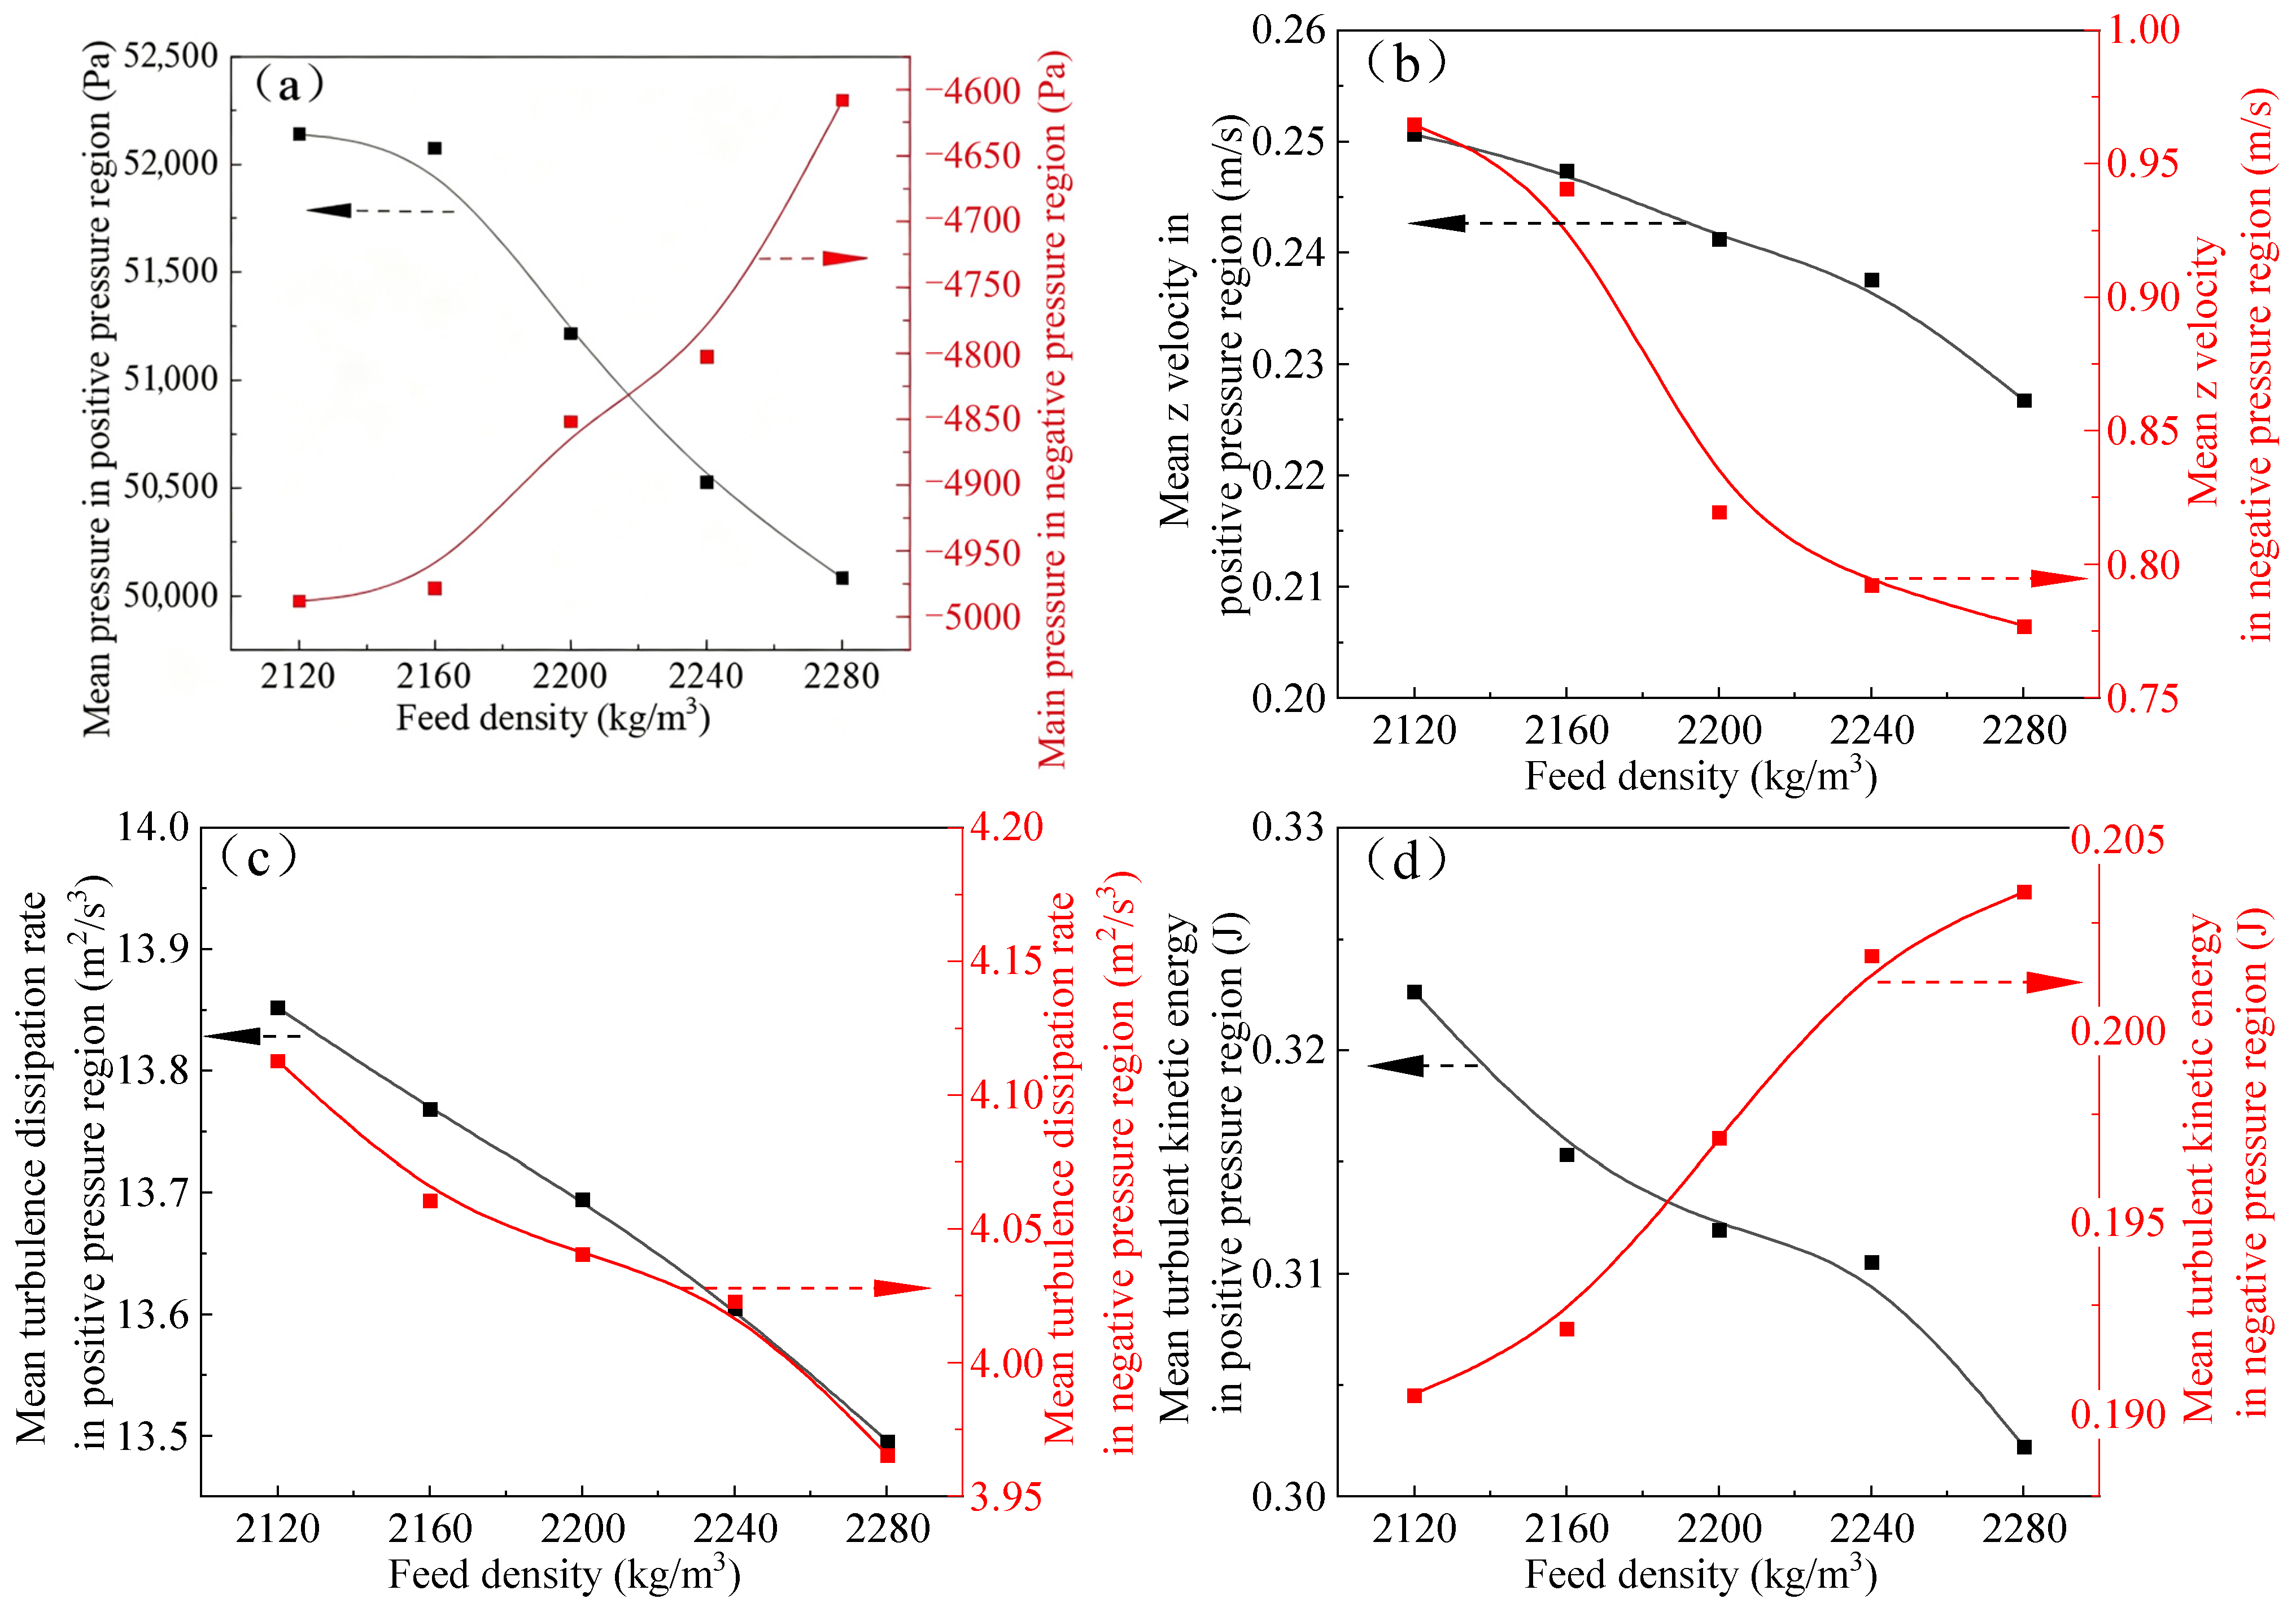
Figure 9 illustrates the effects of feed density on the mean pressure (a), mean velocity (b), turbulent dissipation rate (c), and turbulent kinetic energy (d) within the DMC separation zone.
As shown in Figure 9a, increasing feed density decreases the absolute pressure values in both positive- and negative-pressure regions. Figure 9b indicates that the mean fluid velocity along the z-axis decreases in both pressure regions with increasing feed density. As shown in Figure 9c, increasing feed density reduces the turbulent dissipation rate in both positive- and negative-pressure regions. Figure 9d shows that the turbulent kinetic energy in the positive-pressure region decreases with increasing feed density, whereas that in the negative-pressure region exhibits an increasing trend.
Effect of Feed Density on the Velocity Distribution in the Separation Zone
In the following analysis, velocity along the positive z-axis is defined as +z velocity, while velocity along the negative z-axis is defined as −z velocity. The influence of feed density on the velocity field was evaluated by calculating the proportion of +z and −z velocity regions under different feed density conditions.
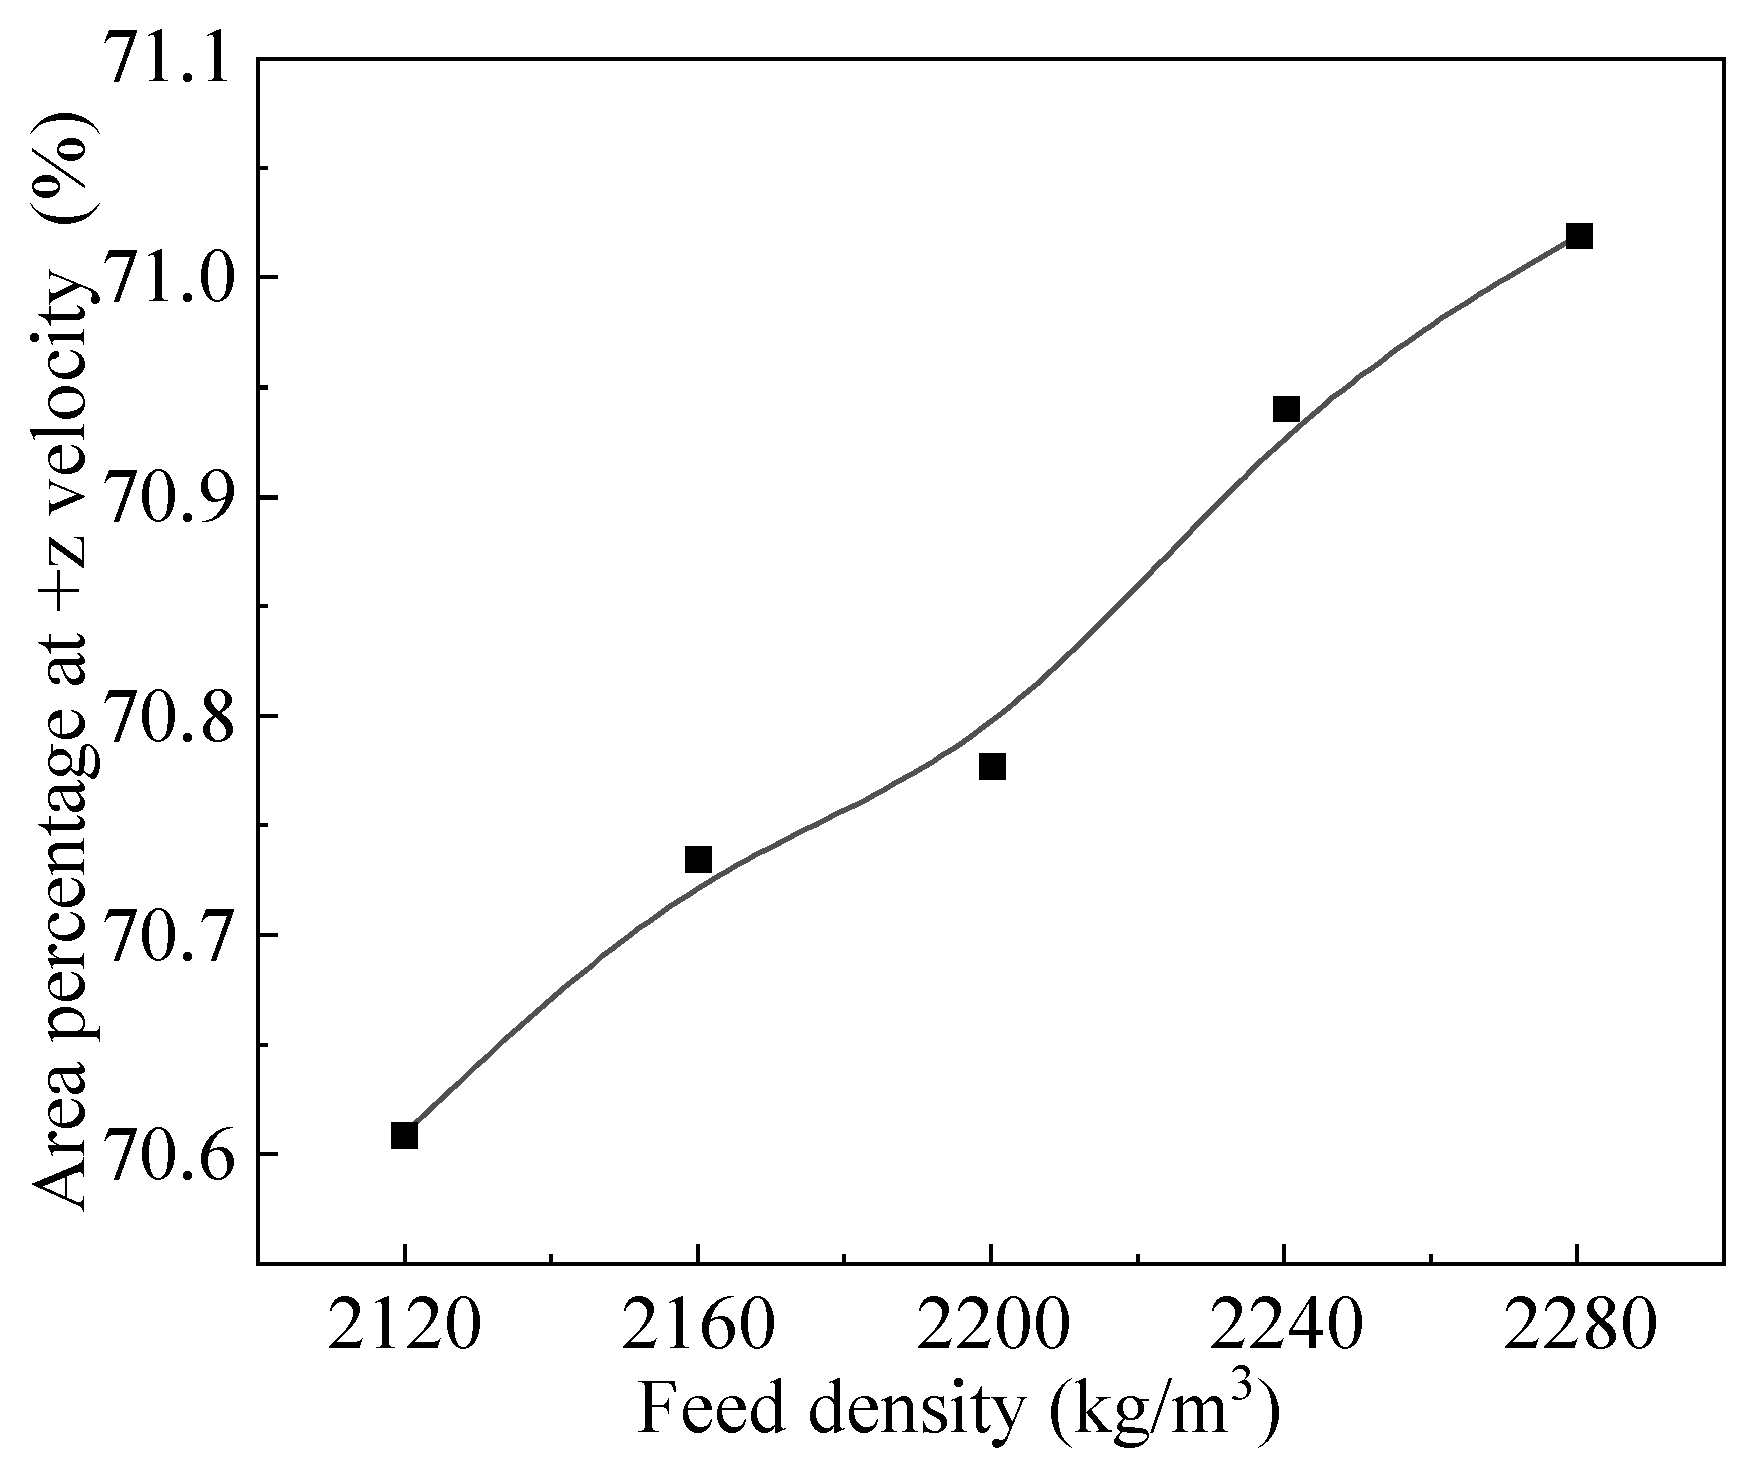
Figure 10 presents the ratio of the +z velocity region area to the total cross-sectional area. At the same feed pressure, increasing feed density increases the proportion of the +z velocity region while decreasing the proportion of the −z velocity region. This indicates that feed density affects not only the buoyancy force acting on particles but also the internal flow characteristics of the separation zone. Increasing feed density reduces the thickness of the downward-moving slurry layer along the inner wall of the DMC.
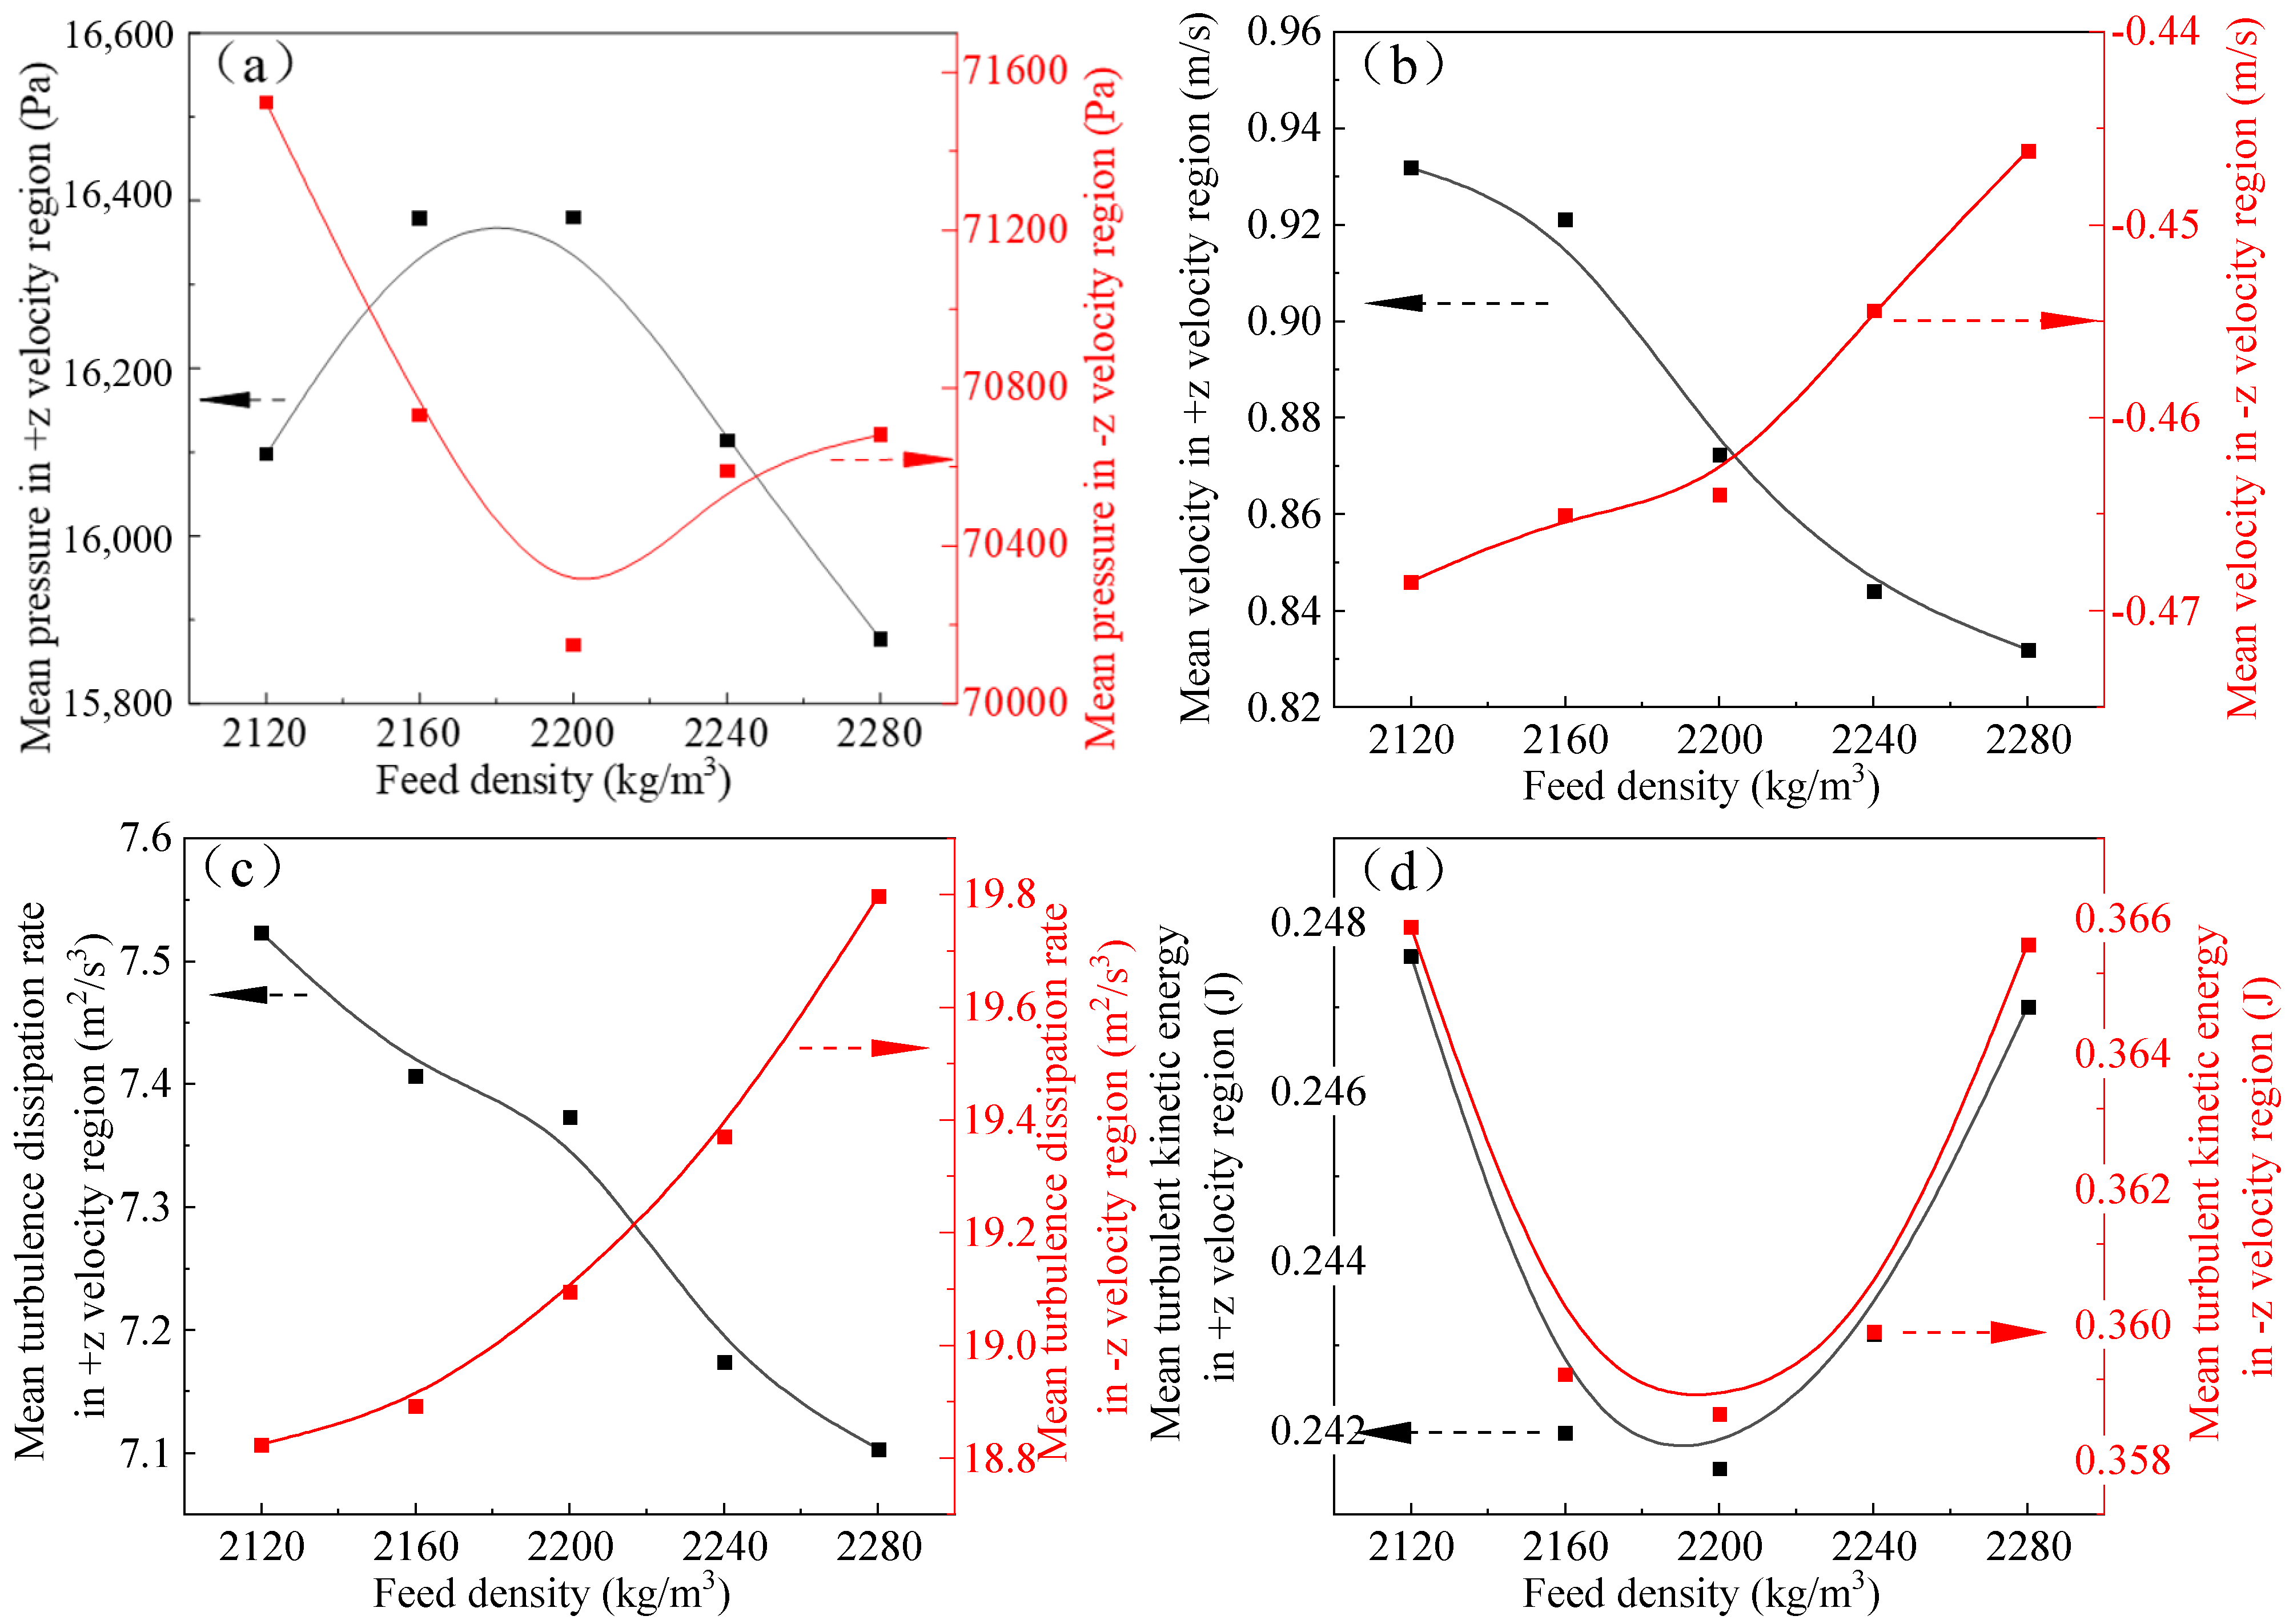
Figure 11 illustrates the effects of feed density on the mean pressure (a), mean velocity (b), turbulent dissipation rate (c), and turbulent kinetic energy (d) in different velocity regions of the separation zone.
As shown in Figure 11a, with increasing feed density, the mean pressure in the +z velocity region initially increases and then decreases, reaching a maximum at a feed density of 2200 kg/m3. In contrast, the mean pressure in the −z velocity region initially decreases and then increases, reaching a minimum at the same feed density. The experimental results indicate that the highest separation efficiency is achieved at this feed density, suggesting that a larger pressure difference between the +z and −z velocity regions is beneficial for particle separation.
Figure 11b shows that increasing feed density decreases the absolute values of mean velocity in both the +z and −z velocity regions, indicating a reduction in flow velocity. Figure 11c demonstrates that increasing feed density decreases the turbulent dissipation rate in the +z velocity region but increases it in the −z velocity region. Figure 11d indicates that the turbulent kinetic energy in both velocity regions initially decreases and then increases with increasing feed density, reaching minimum values at a feed density of 2200 kg/m3. When the mean pressure in the +z velocity region and the turbulent kinetic energy in the −z velocity region are relatively low, improved separation performance can be achieved.
Effect of Feed Density on Particle Trajectories and Residence Time
The Discrete Phase Model (DPM) in Fluent was applied to simulate the particle trajectories and residence times of six particle types in the DMC, including three particle sizes and two particle densities. The particle densities were set to 2600 kg/ m3 and 3200 kg/ m3 to represent the dominant silicate gangue minerals and spodumene, respectively. These values were selected as representative densities based on typical mineral densities reported in the literature and were used as simplified model parameters rather than experimentally measured densities of the actual samples. The three particle sizes were 0.5, 3, and 6 mm, representing fine-, medium-, and coarse-sized particles in the feed, respectively. The simulation results are summarized in Table 4.
As shown in Table 4, for 0.5 mm gangue particles, increasing feed density decreases the residence time of particles discharged through the overflow. In contrast, for 6 mm spodumene particles, higher feed density increases the residence time of particles reporting to the underflow. Increasing feed density enhances the buoyancy effect acting on particles, promoting particle migration toward the overflow and reducing the probability of entering the underflow.
Table 4 further indicates that when the feed density exceeds 2200 kg/m3, fine spodumene particles tend to migrate into the overflow, resulting in lithium losses. Moreover, at higher feed densities, coarse spodumene particles also exhibit an increased tendency to enter the overflow, further increasing the loss of valuable minerals. This observation is consistent with the experimental results, where higher feed densities correspond to increased Li2O grades in the tailings.
When the feed density is lower than 2200 kg/m3, coarse gangue particles are more likely to report to the underflow, reducing the concentrate grade. Meanwhile, finer gangue particles may also enter the concentrate under low-density conditions, further decreasing concentrate quality. These results agree with the experimental observations that lower feed densities produce concentrates with lower Li2O grades. Therefore, a feed density of 2200 kg/m3 provides favorable conditions for separating fine spodumene from coarse gangue minerals in the feed.

3.3.2. Effect of Feed Pressure on the Separation Process

Effect of Feed Pressure on the Pressure Distribution in the Separation Zone
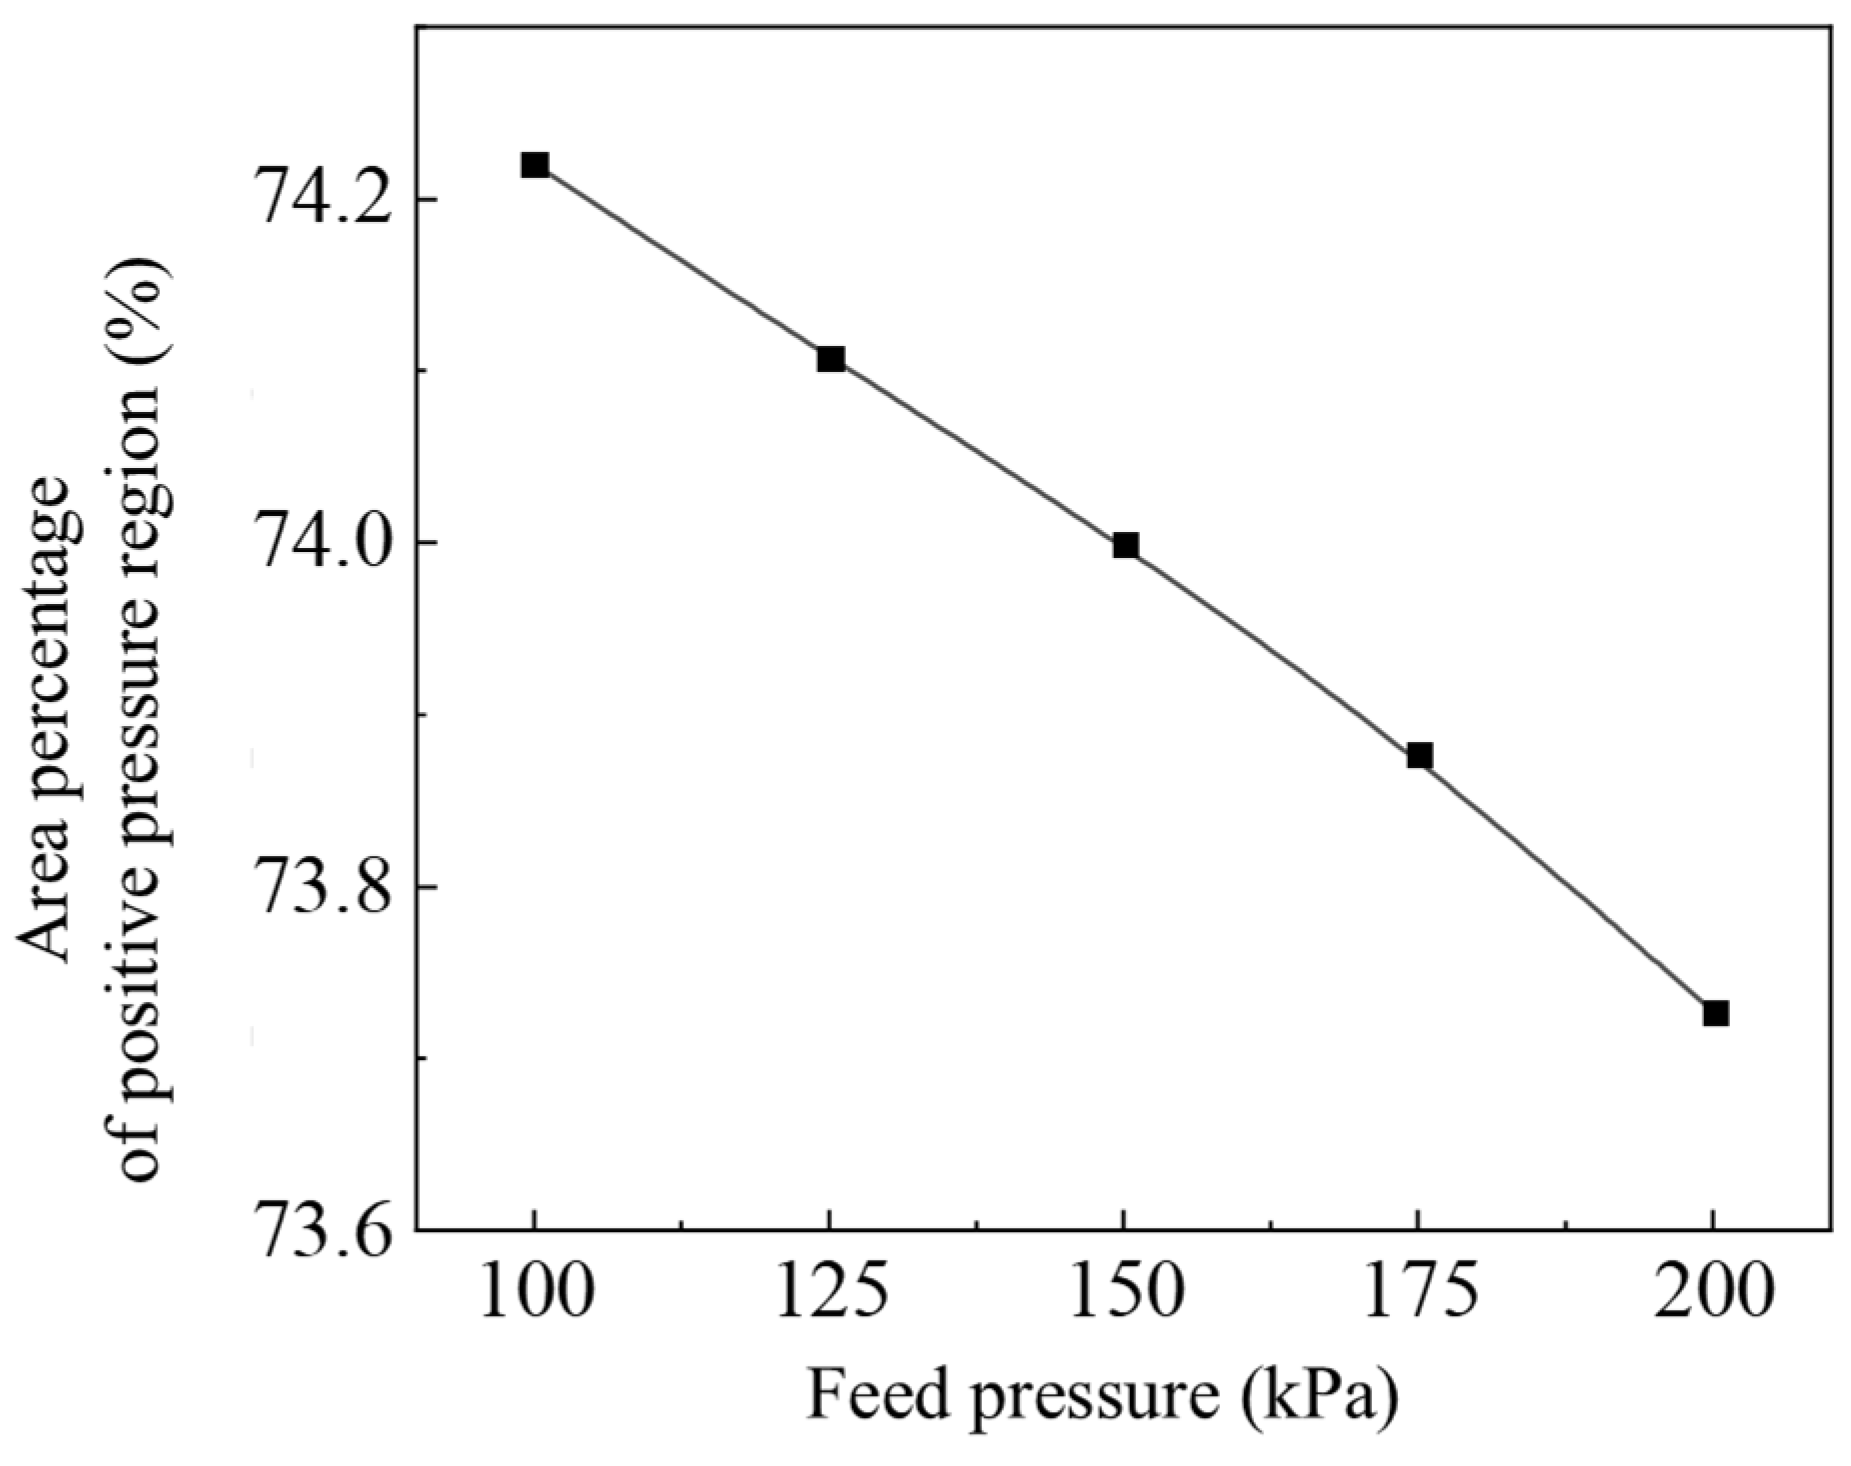
Using the same method described above, the area of positive-pressure regions under different feed pressures was extracted to evaluate the influence of feed pressure on the pressure field. Figure 12 presents the ratio of the positive-pressure region area to the total cross-sectional area. As shown, increasing feed pressure decreases the proportion of positive-pressure regions and increases the proportion of negative-pressure regions within the DMC separation zone.
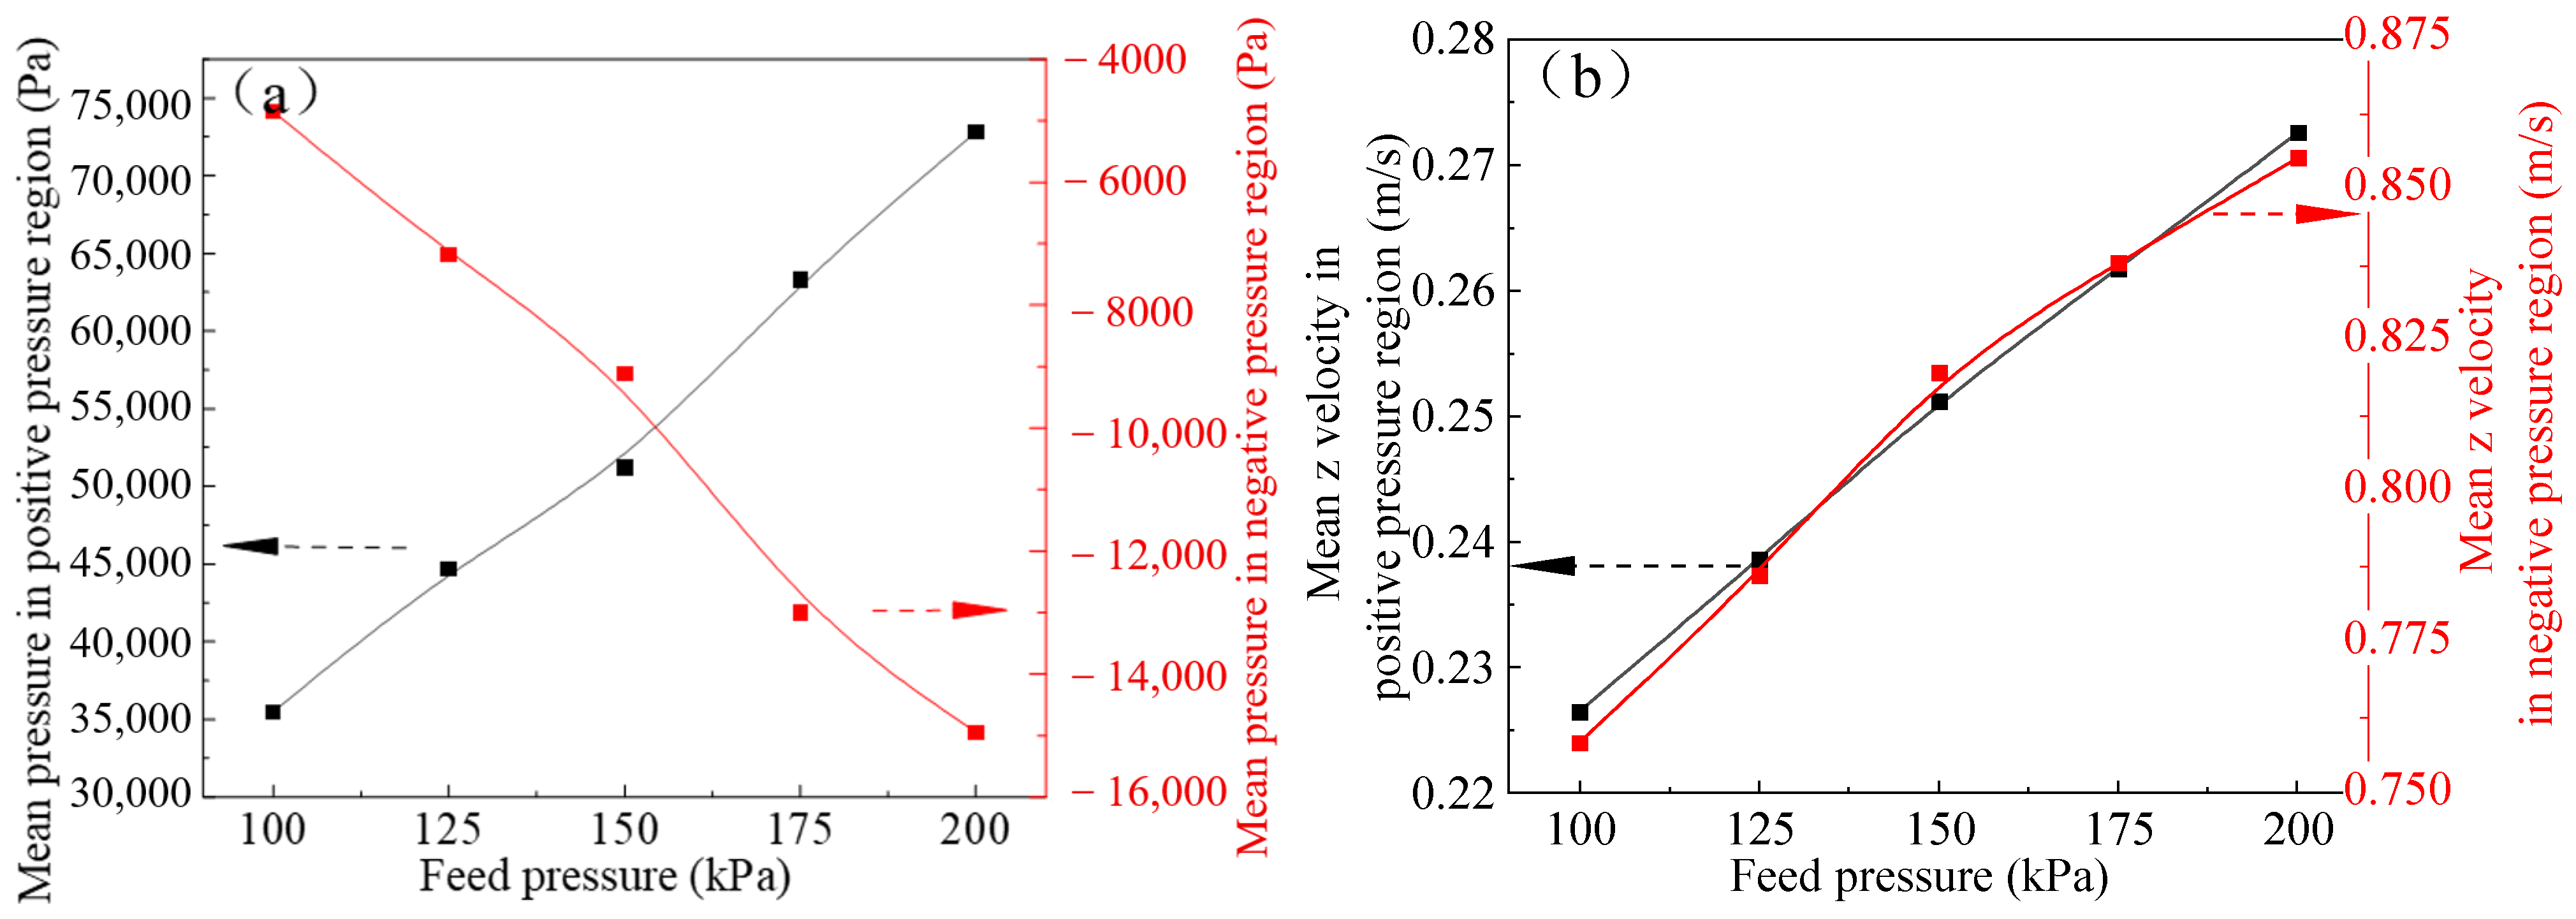
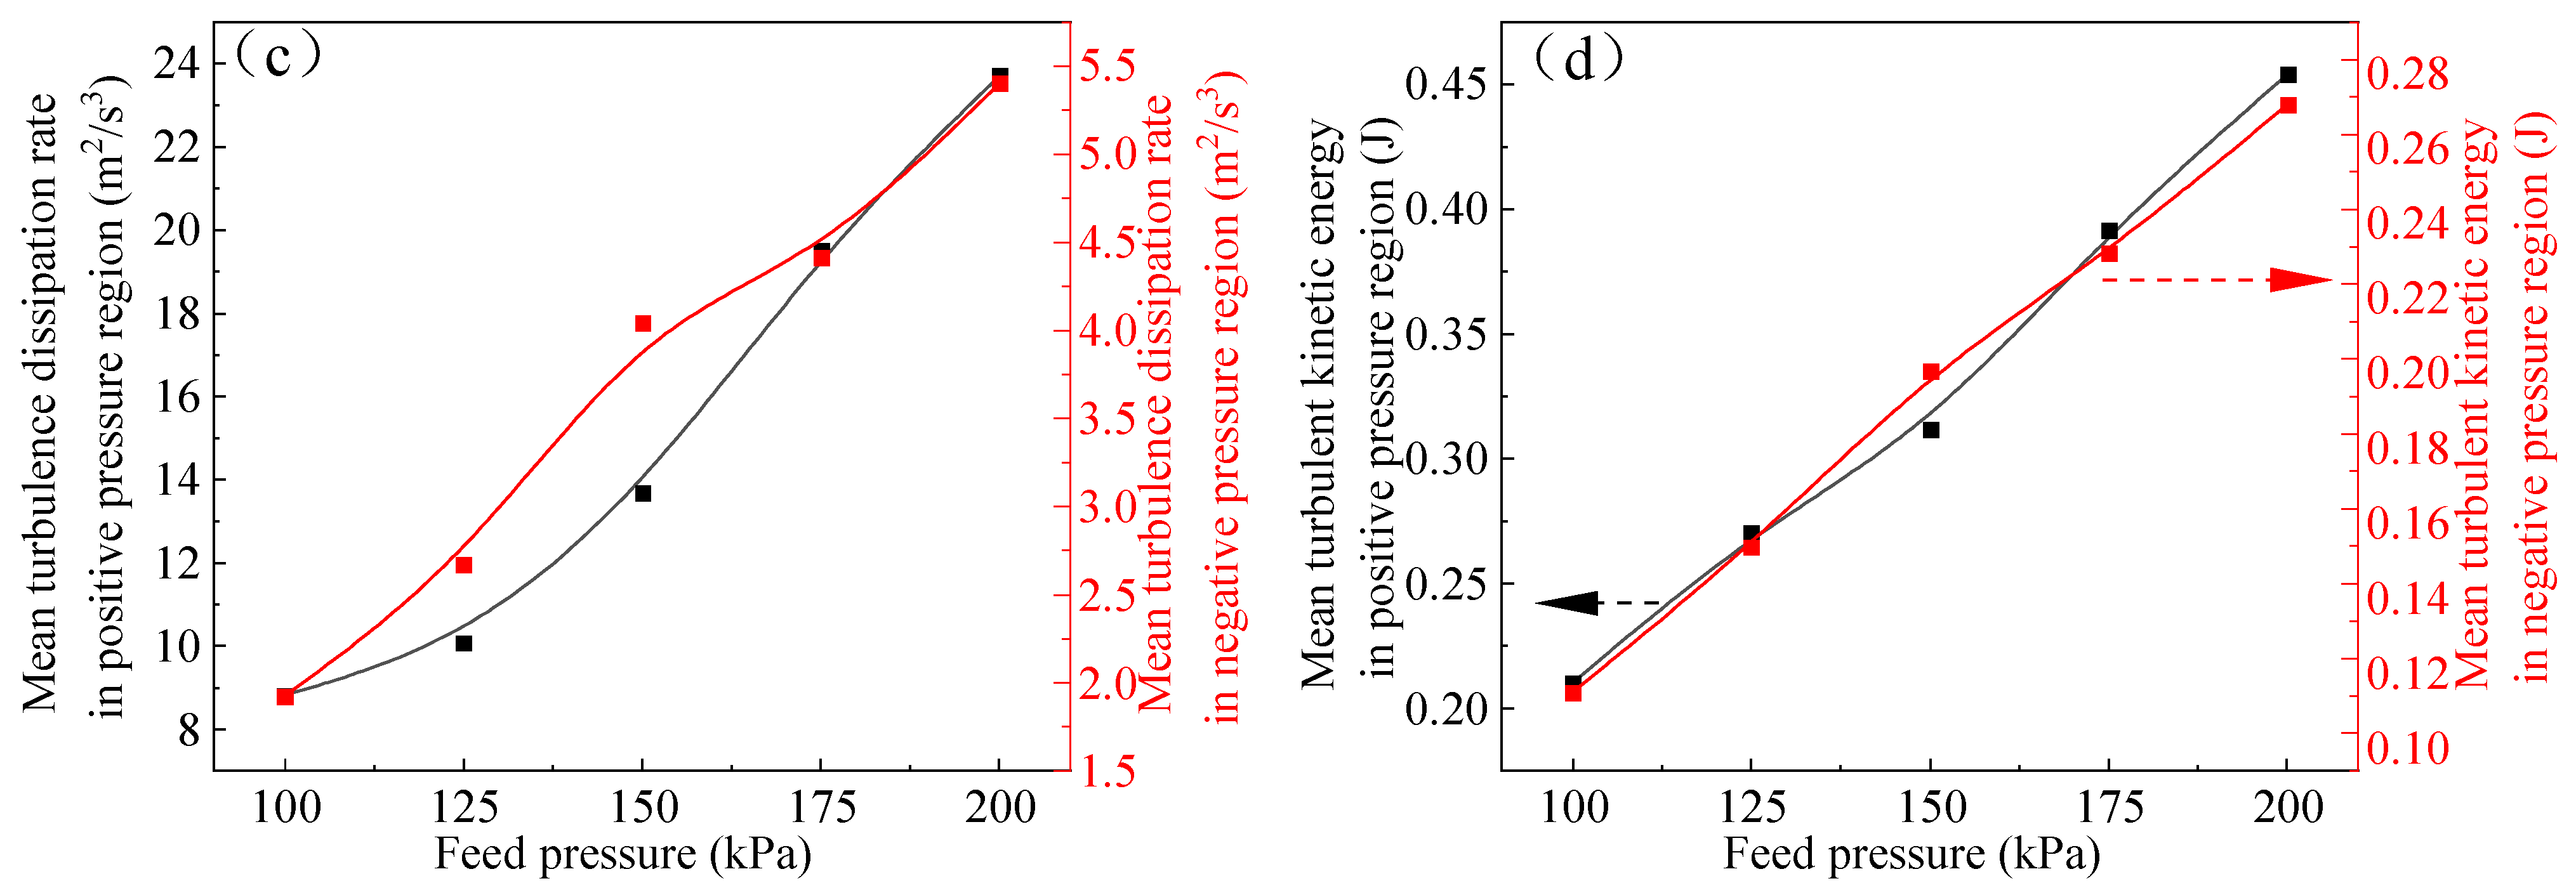
Figure 13 illustrates the effects of feed pressure on the mean pressure (a), mean velocity (b), turbulent dissipation rate (c), and turbulent kinetic energy (d) in the separation zone. As shown in Figure 13a, increasing feed pressure increases the absolute pressure values in both positive- and negative-pressure regions. Figure 13b indicates that the mean fluid velocity along the z-axis increases with increasing feed pressure in both pressure regions. Since higher feed pressure corresponds to an increased flow rate, the fluid velocity within the DMC is enhanced accordingly. Figure 13c,d show that increasing feed pressure increases both the turbulent dissipation rate and turbulent kinetic energy in the positive- and negative-pressure regions.
Effect of Feed Pressure on the Velocity Distribution in the Separation Zone
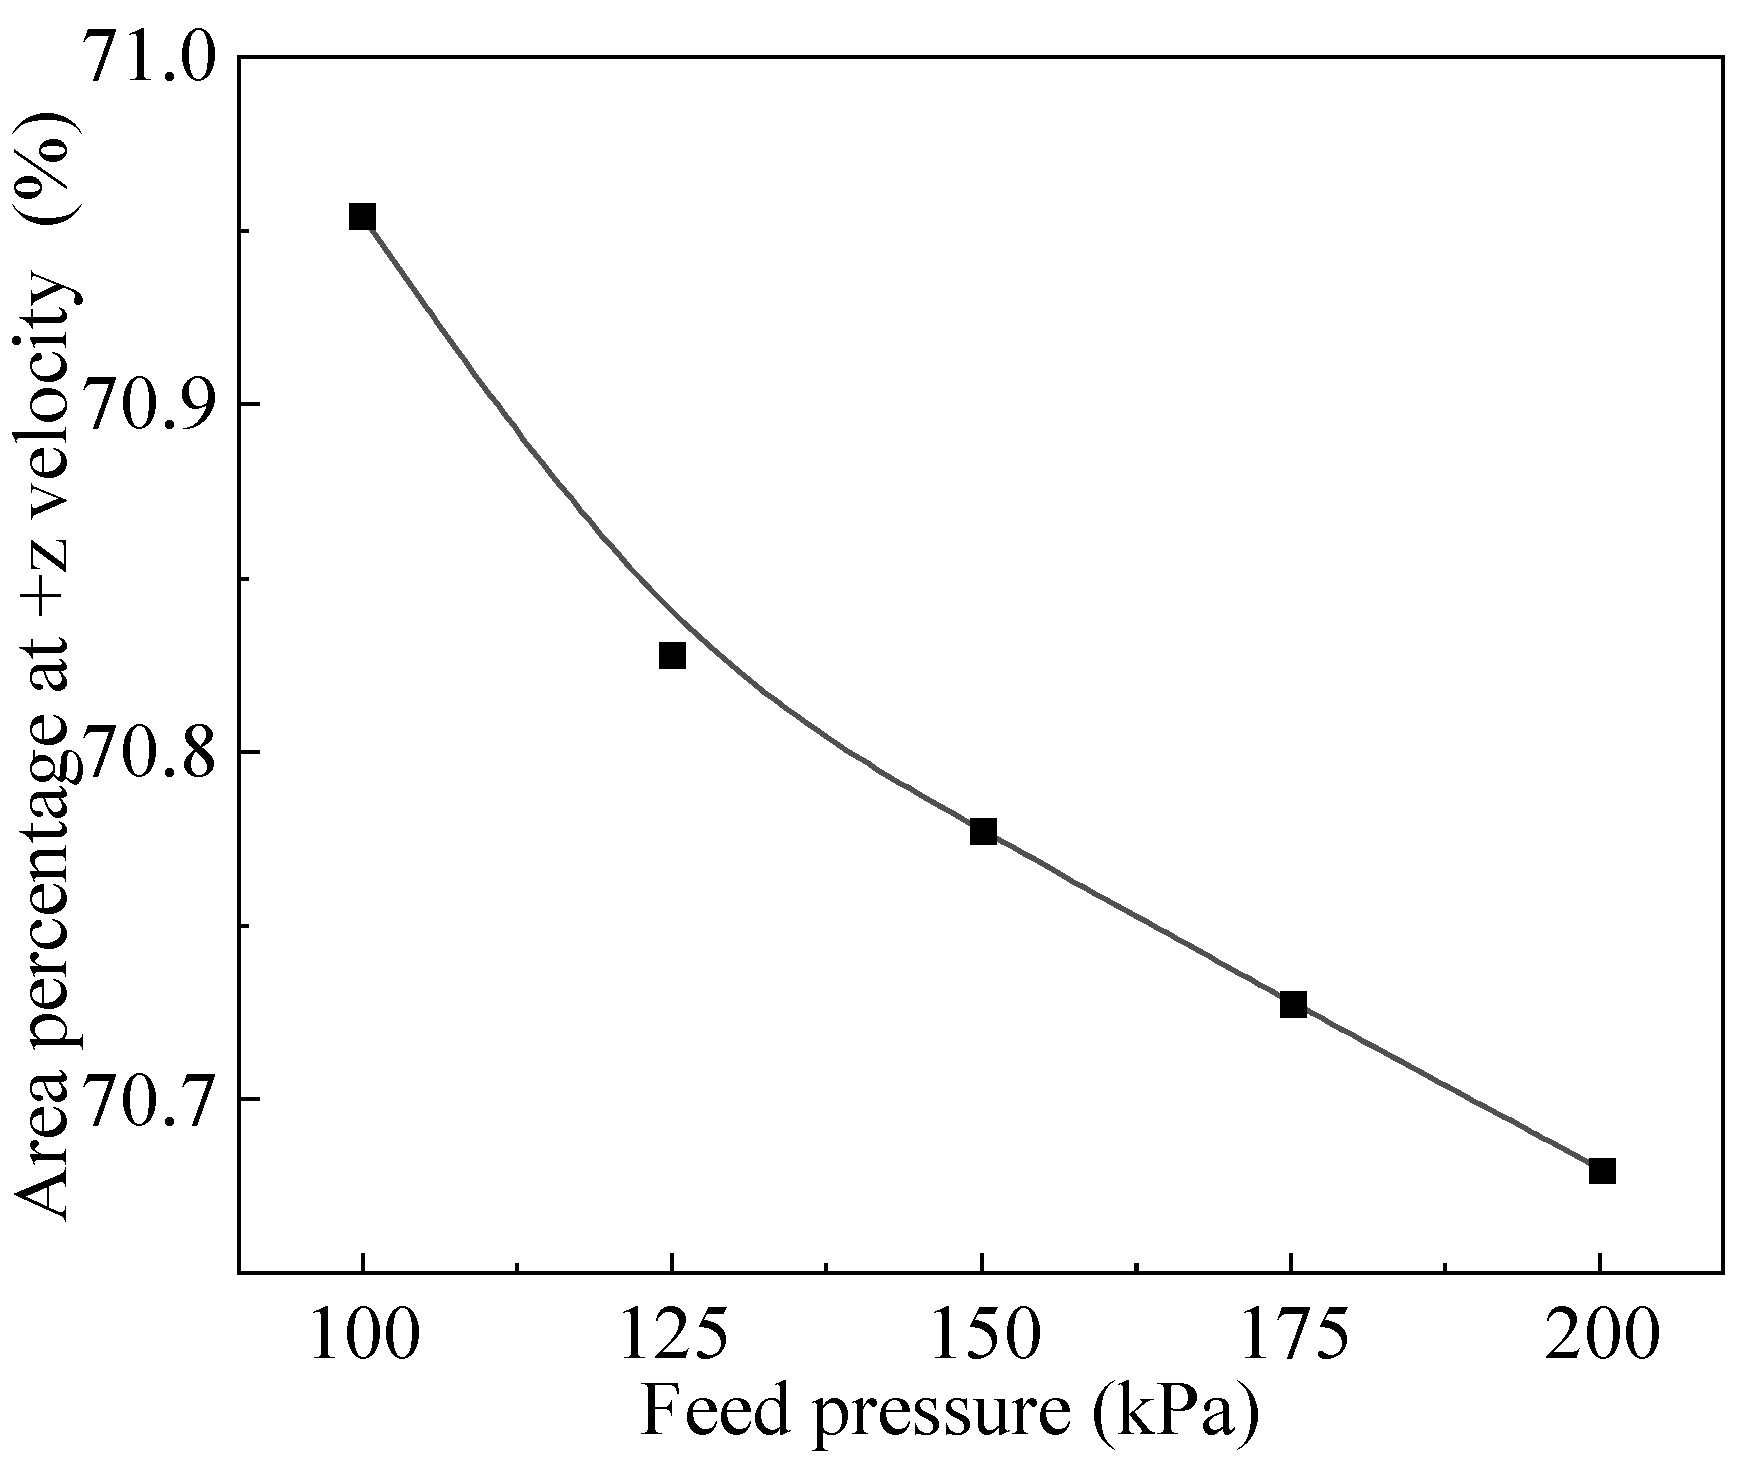
Figure 14 presents the ratio of the +z velocity region area to the total cross-sectional area. At the same feed density, increasing feed pressure decreases the proportion of the +z velocity region and increases the proportion of the −z velocity region within the DMC separation zone. Increasing feed pressure slightly increases the thickness of the downward-moving slurry layer along the inner wall of the DMC.
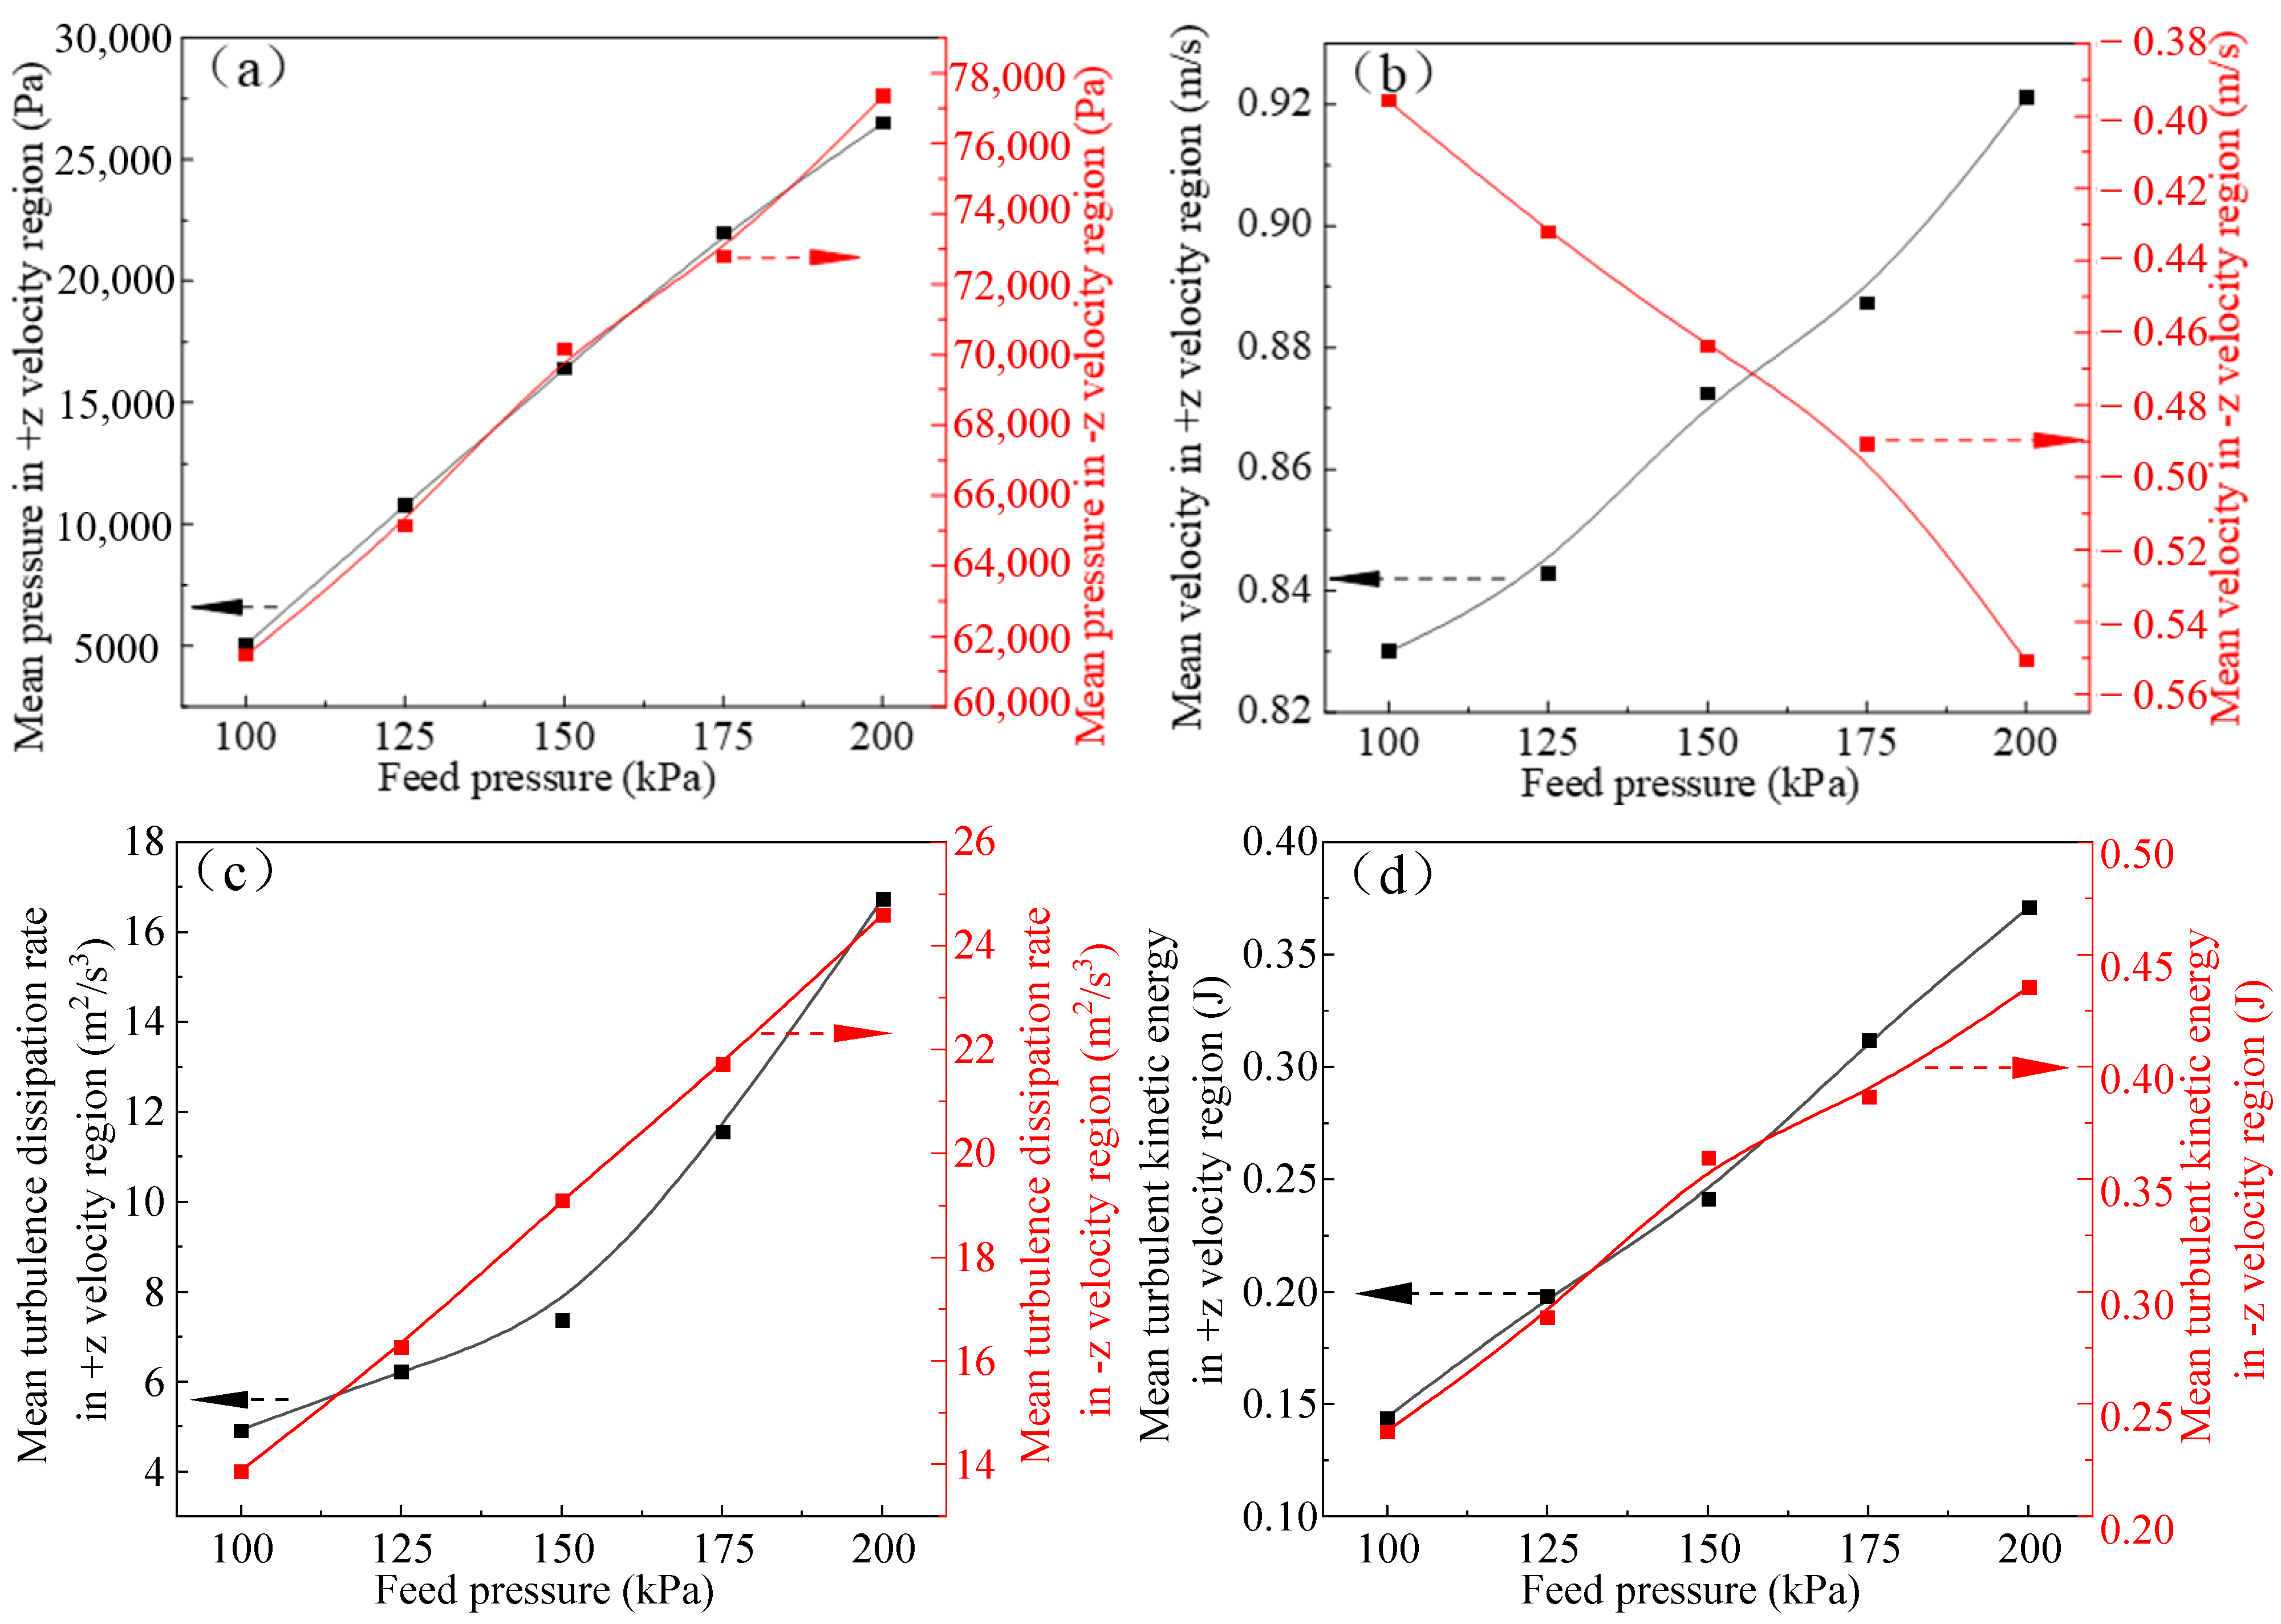
Figure 15 illustrates the effects of feed pressure on the mean pressure (a), mean velocity (b), turbulent dissipation rate (c), and turbulent kinetic energy (d) in different velocity regions of the separation zone.
As shown in Figure 15a, increasing feed pressure significantly increases the pressure in both the +z and −z velocity regions. Figure 15b indicates that higher feed pressure increases the absolute mean velocities in both regions, indicating accelerated fluid movement toward the outlets. This increase in velocity enhances the centrifugal force acting on particles but simultaneously shortens the residence time available for separation. Figure 15c,d demonstrate that increasing feed pressure increases both turbulent dissipation rate and turbulent kinetic energy in different velocity regions, which may negatively influence particle stratification.
Effect of Feed Pressure on Particle Trajectories and Residence Time
The effects of feed pressure on particle trajectories and residence times in the DMC are summarized in Table 5. As observed in Table 5, for 0.5 mm gangue particles, increasing feed pressure decreases the residence time of particles discharged through the overflow. Similarly, for 6 mm spodumene particles, increasing feed pressure reduces the residence time of particles reporting to the underflow. According to the influence of feed pressure on the fluid velocity distribution within the DMC, increased feed pressure accelerates the flow field, resulting in higher particle velocities.
Table 5 further indicates that when the feed pressure exceeds 150 kPa, fine spodumene particles tend to report to the overflow, causing losses of valuable lithium minerals. Furthermore, the proportion of fine spodumene particles entering the overflow increases with increasing feed pressure, which agrees with experimental observations showing higher Li2O grades in tailings at elevated feed pressures. Conversely, when the feed pressure is below 150 kPa, coarse gangue particles are more likely to enter the underflow, resulting in a decrease in concentrate grade. This finding is consistent with experimental results showing lower concentrate grades under lower feed pressure conditions.
Therefore, a feed pressure of 150 kPa provides favorable conditions for separating fine spodumene particles from coarse gangue minerals in the feed.

4. Discussion

The separation performance of the DMC is governed by the combined effects of mineral liberation, density differences, and internal hydrodynamic conditions. The experimental and CFD results indicate that feed density and feed pressure affect particle migration, residence time, and turbulence within the cyclone. Insufficient operating conditions promote the misplacement of gangue minerals into the underflow, whereas excessive density or pressure increases the probability of fine spodumene reporting to the overflow. Therefore, effective DMC separation requires an appropriate balance between gangue rejection and spodumene recovery rather than relying solely on the static density difference between minerals.
The results demonstrate the potential of DMC pre-concentration for rejecting low-density quartz- and feldspar-rich gangue before downstream grinding and flotation, thereby improving the feed quality for subsequent beneficiation and potentially reducing the overall processing load. The consistency between the experimental results and CFD-predicted particle behavior also supports the use of numerical simulation for interpreting DMC separation behavior and optimizing operating conditions. However, the operating window identified in this study is specific to the investigated ore, and representative mineral densities were adopted in the particle simulations rather than sample-specific measured values. Further work is therefore required to evaluate the applicability of the proposed operating conditions to ores with different mineralogical and particle-size characteristics.

5. Conclusions

This study investigated the pre-concentration of spodumene using a D250 dense medium cyclone through actual ore experiments combined with CFD simulations. The main conclusions are as follows:
  • Under the optimal conditions of a feed density of 2200 kg/m3 and a feed pressure of 150 kPa, the Li2O grade was increased from 1.30% in the feed to 5.72% in the concentrate, with a Li2O recovery of 77.23% and a separation efficiency of 60.42%. These results demonstrate the feasibility of DMC pre-concentration for the investigated spodumene ore.
  • CFD simulations showed that feed density and feed pressure significantly affect the pressure field, velocity distribution, and turbulence characteristics within the DMC. At a feed density of 2200 kg/m3, relatively low turbulent kinetic energy was obtained, indicating a more stable flow field favorable for particle separation.
  • Particle trajectory simulations indicated that excessive feed density (>2200 kg/m3) or feed pressure (>150 kPa) increases the tendency of fine spodumene particles to report to the overflow, whereas lower operating conditions promote the misplacement of coarse gangue into the underflow. Appropriate control of feed density and pressure is therefore essential for achieving effective DMC separation.

Author Contributions

Conceptualization, D.L. and B.C.; methodology, B.C. and Z.W.; software, B.C.; validation, B.C. and Z.W.; formal analysis, B.C.; investigation, B.C.; resources, D.L.; data curation, B.C.; writing—original draft preparation, B.C.; writing—review and editing, Z.W. and D.L.; visualization, B.C.; supervision, D.L.; project administration, D.L.; funding acquisition, D.L. All authors have read and agreed to the published version of the manuscript.

Funding

This research received no external funding.

Institutional Review Board Statement

Not applicable.

Informed Consent Statement

Not applicable.

Data Availability Statement

The data presented in this study are available from the corresponding author upon reasonable request.

Conflicts of Interest

Authors Bao Cui and Zonghui Wang were employed by the Xinjiang Kunlun Blue Diamond Mining Development Co., Ltd. The remaining authors declare that the research was conducted in the absence of any commercial or financial relationships that could be construed as a potential conflict of interest.

References

  1. Hasan, M.M.; Haque, R.; Jahirul, M.I.; Rasul, M.G.; Fattah, I.M.R.; Hassan, N.M.S.; Mofijur, M. Advancing energy storage: The future trajectory of lithium-ion battery technologies. J. Energy Storage 2025, 120, 116511. [Google Scholar] [CrossRef] [Scilit]
  2. Tarascon, J.-M.; Armand, M. Issues and challenges facing rechargeable lithium batteries. Nature 2001, 414, 359–367. [Google Scholar] [CrossRef] [Scilit]
  3. Goodenough, J.B.; Kim, Y. Challenges for rechargeable Li batteries. Chem. Mater. 2010, 22, 587–603. [Google Scholar] [CrossRef] [Scilit]
  4. Dunn, B.; Kamath, H.; Tarascon, J.-M. Electrical energy storage for the grid: A battery of choices. Science 2011, 334, 928–935. [Google Scholar] [CrossRef] [Scilit]
  5. Hammed, V.O.; Salako, E.W.; Edet, D.; Ederhion, J.; Keshinro, B.I.; Uwaoma, I.A.; Adeleke, O.J.; Odetoran, A.; Adedokun, O.J.; Makinde, P.F.; et al. Next-generation lithium-ion batteries for electric vehicles: Advanced materials, AI-driven performance optimization, and circular economy strategies. Meas. Energy 2025, 7, 100060. [Google Scholar] [CrossRef] [Scilit]
  6. Manthiram, A. A reflection on lithium-ion battery cathode chemistry. Nat. Commun. 2020, 11, 1550. [Google Scholar] [CrossRef] [Scilit]
  7. Meshram, P.; Pandey, B.D.; Mankhand, T.R. Extraction of lithium from primary and secondary sources by pre-treatment, leaching and separation: A comprehensive review. Hydrometallurgy 2014, 150, 192–208. [Google Scholar] [CrossRef] [Scilit]
  8. Grosjean, C.; Miranda, P.H.; Perrin, M.; Poggi, P. Assessment of world lithium resources and consequences of their geographic distribution on the expected development of the electric vehicle industry. Renew. Sustain. Energy Rev. 2012, 16, 1735–1744. [Google Scholar] [CrossRef] [Scilit]
  9. Yang, M.; Zhong, Y.; Liu, X.; Wang, S.; Qu, T. Review of technologies to extract lithium from hard rock lithium minerals. Miner. Eng. 2025, 232, 109577. [Google Scholar] [CrossRef] [Scilit]
  10. Li, J.; Li, P.; Yan, Q.; Wang, D.; Ren, G.; Ding, X. Geology and mineralization of the Songpan-Ganze-West Kunlun pegmatite-type rare-metal metallogenic belt in China: An overview and synthesis. Sci. China Earth Sci. 2023, 66, 1702–1724. [Google Scholar] [CrossRef] [Scilit]
  11. Tao, H.; Hu, M.X.; Tang, J.L.; Jiang, Z.L.; Zhang, Z.; Gao, J.; Xu, X.W. Metallogenic characteristics of superimposed deformation and mineralization of Dahongliutan granite–pegmatite type lithium deposit belt in West Kunlun, Xinjiang: Constraints from ore structure, 3D imaging technology and chronology. Acta Petrol. Sin. 2024, 40, 553–570. [Google Scholar] [CrossRef] [Scilit]
  12. Wen, J.H.; Dai, H.Z.; Chen, C.H.; Li, X.; Liu, S.B.; Wang, C.H.; Gao, Y. The supply and demand status and resource guarantee degree of lithium in China. Geol. Bull. China 2025, 44, 245–258. [Google Scholar] [CrossRef]
  13. Du, X.F.; Wang, W.; Zhang, Y.F.; Xing, C.H. Distribution, deposit types, and prospecting directions of lithium mineral resources in Xinjiang. Xinjiang Nonferrous Met. 2020, 43, 1–4. [Google Scholar] [CrossRef]
  14. Wang, Z.; Shao, X.Q.; Xia, Y.Z. Research progress on separation and extraction of lithium ores in Xinjiang. Xinjiang Nonferrous Met. 2024, 47, 66–67. [Google Scholar] [CrossRef]
  15. Bu, Y.; Yan, W.; Deng, X.; Huang, S.; Sun, A.; Guan, Q.; Zhou, S.; Peng, W.; Wang, W.; Ge, P.; et al. A review on lithium extraction processes from spodumene and resource utilization of the generated lithium slag. Minerals 2025, 15, 1073. [Google Scholar] [CrossRef] [Scilit]
  16. Yelatontsev, D.; Mukhachev, A. Processing of lithium ores: Industrial technologies and case studies—A review. Hydrometallurgy 2021, 201, 105578. [Google Scholar] [CrossRef] [Scilit]
  17. Swain, B. Recovery and recycling of lithium: A review. Sep. Purif. Technol. 2017, 172, 388–403. [Google Scholar] [CrossRef] [Scilit]
  18. Gao, T.; Fan, N.; Chen, W.; Dai, T. Lithium extraction from hard rock lithium ores (spodumene, lepidolite, zinnwaldite, petalite): Technology, resources, environment and cost. China Geol. 2023, 6, 137–153. [Google Scholar] [CrossRef] [Scilit]
  19. Asif, A.H.; Li, C.; Lim, H.; Sun, H. Australia’s spodumene: Advances in lithium extraction technologies, decarbonization, and circular economy. Ind. Eng. Chem. Res. 2024, 63, 2073–2086. [Google Scholar] [CrossRef] [Scilit]
  20. Chipakwe, V.; Semsari, P.; Karlkvist, T.; Rosenkranz, J.; Chelgani, S.C. A critical review on the mechanisms of chemical additives used in grinding and their effects on the downstream processes. J. Mater. Res. Technol. 2020, 9, 8148–8162. [Google Scholar] [CrossRef] [Scilit]
  21. Opoku, P.A.; Tadesse, B.; Albijanic, B.; Nikoloski, A.N. An overview of coarse particle beneficiation of lithium ores. Sci. Rep. 2025, 15, 29091. [Google Scholar] [CrossRef] [Scilit]
  22. Sahoo, S.K.; Tripathy, S.K.; Nayak, A.; Hembrom, K.C.; Dey, S.; Rath, R.K.; Mohanta, M.K. Beneficiation of lithium-bearing pegmatite rock: A review. Miner. Process. Extr. Metall. Rev. 2024, 45, 1–27. [Google Scholar] [CrossRef] [Scilit]
  23. Kundu, T.; Rath, S.S.; Das, S.K.; Parhi, P.K.; Angadi, S.I. Recovery of lithium from spodumene-bearing pegmatites: A comprehensive review on geological reserves, beneficiation, and extraction. Powder Technol. 2023, 415, 118142. [Google Scholar] [CrossRef] [Scilit]
  24. Napier-Munn, T. The dense medium cyclone—Past, present and future. Miner. Eng. 2018, 116, 107–113. [Google Scholar] [CrossRef] [Scilit]
  25. Das, A.; Sarkar, B. Advanced gravity concentration of fine particles: A review. Miner. Process. Extr. Metall. Rev. 2018, 39, 359–394. [Google Scholar] [CrossRef] [Scilit]
  26. Gibson, C.E.; Aghamirian, M.; Grammatikopoulos, T.; Smith, D.L.; Bottomer, L. The recovery and concentration of spodumene using dense media separation. Minerals 2021, 11, 649. [Google Scholar] [CrossRef] [Scilit]
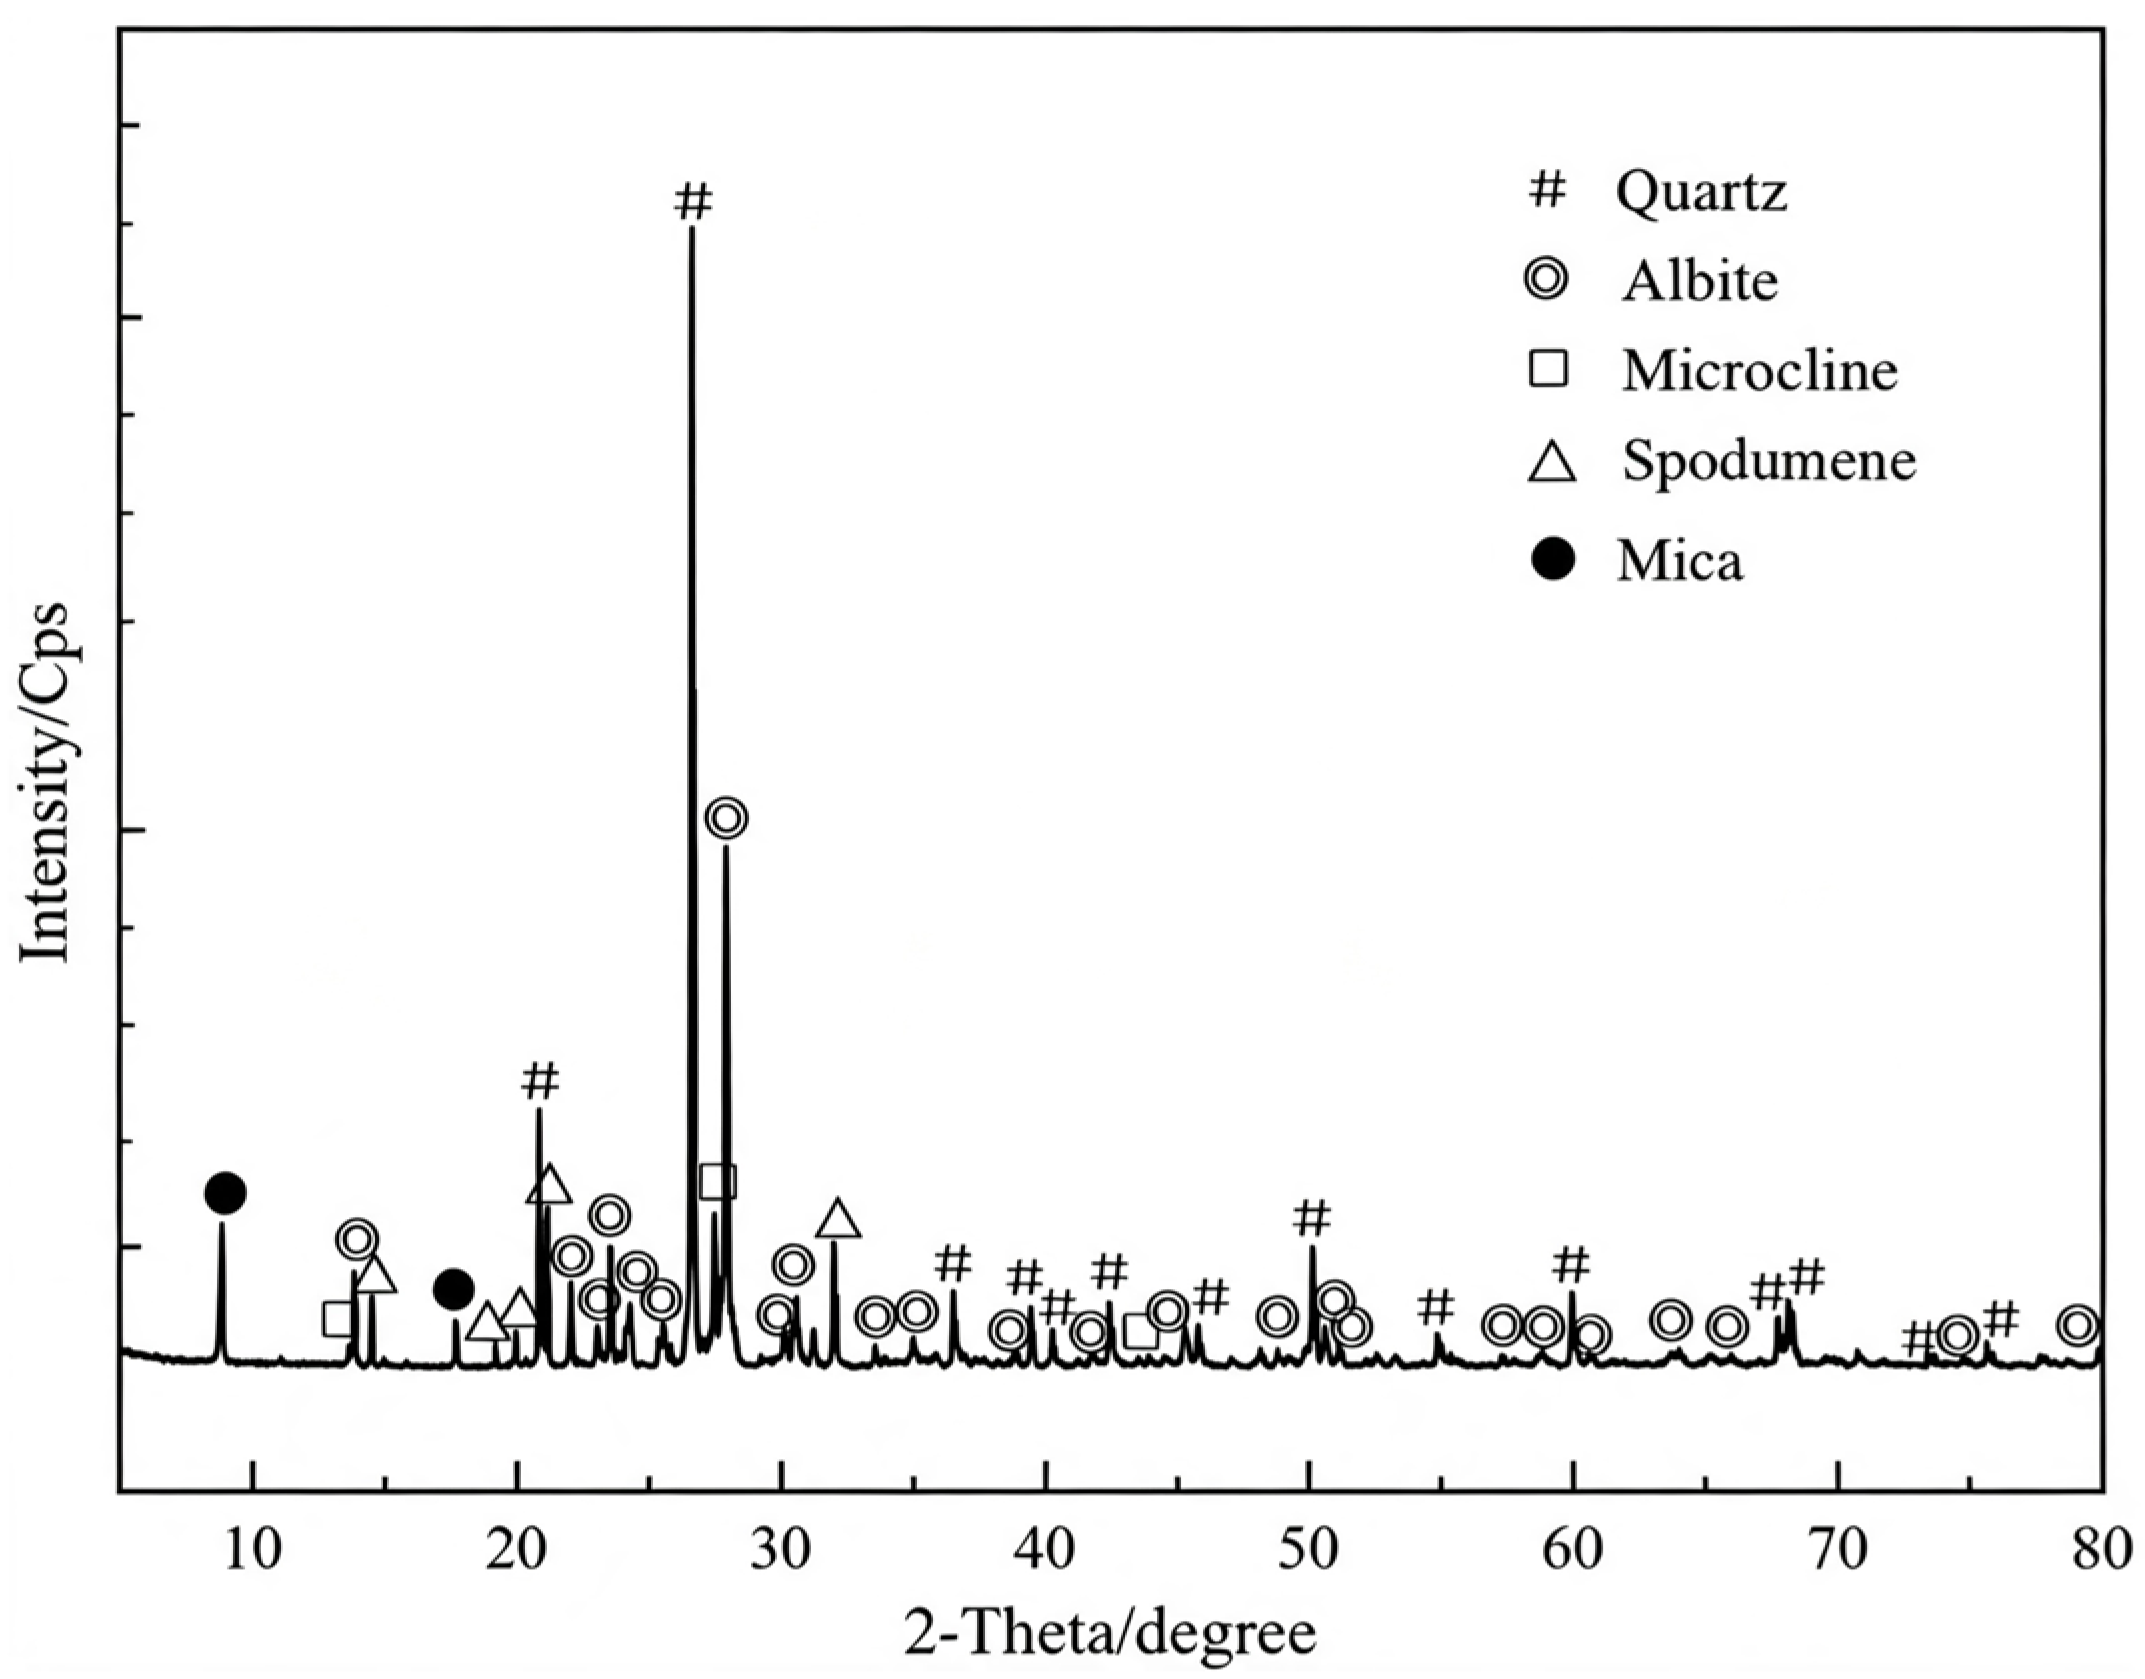
Figure 1. XRD pattern of the raw ore.
Applsci 16 08489 g001
Figure 2. Photographs of experimental equipment and test platform.
Applsci 16 08489 g002
Figure 3. Schematic diagram of the DMC structure.
Applsci 16 08489 g003
Figure 4. Mesh configuration and cross-sectional locations for CFD analysis of the DMC: (a) overall mesh distribution; (b) local mesh refinement in small-feature regions; (c) near-wall mesh structure with inflation layers; and (d) representative cross-sections used for extracting flow-field parameters.
Applsci 16 08489 g004
Figure 5. Polarized light micrographs of the major lithium-bearing minerals: (a–c) plane-polarized light; (d,e) cross-polarized light.
Applsci 16 08489 g005
Figure 6. Effect of feed density on DMC separation performance: (a) variation in Li2O grades in the concentrate and tailings; (b) variation in concentrate yield, Li2O recovery, and separation efficiency.
Applsci 16 08489 g006
Figure 7. Effect of feed pressure on the separation performance of the DMC: (a) Li2O grades of the concentrate and tailings; (b) concentrate yield, Li2O recovery, and separation efficiency.
Applsci 16 08489 g007
Figure 8. Effect of feed density on the proportion of positive-pressure regions in the DMC.
Applsci 16 08489 g008
Figure 9. Effect of feed density on the pressure field and flow characteristics in the DMC: (a) mean pressure in the positive- and negative-pressure regions; (b) mean x-direction velocity in the positive- and negative-pressure regions; (c) mean turbulence dissipation rate in the positive- and negative-pressure regions; (d) mean turbulent kinetic energy in the positive- and negative-pressure regions.
Applsci 16 08489 g009
Figure 10. Effect of feed density on the proportion of +z velocity regions.
Applsci 16 08489 g010
Figure 11. Effect of feed density on the flow-field characteristics in the DMC separation zone: (a) mean pressure, (b) mean velocity, (c) turbulent dissipation rate, and (d) turbulent kinetic energy in the +z and −z velocity regions.
Applsci 16 08489 g011
Figure 12. Effect of feed pressure on the proportion of positive-pressure regions in the DMC.
Applsci 16 08489 g012
Figure 13. Effect of feed pressure on the pressure field and flow characteristics in the DMC: (a) mean pressure in the positive- and negative-pressure regions; (b) mean z-direction velocity in the positive- and negative-pressure regions; (c) mean turbulence dissipation rate in the positive- and negative-pressure regions; (d) mean turbulent kinetic energy in the positive- and negative-pressure regions.
Applsci 16 08489 g013aApplsci 16 08489 g013b
Figure 14. Effect of feed pressure on the proportion of +z velocity regions.
Applsci 16 08489 g014
Figure 15. Effect of feed density on the velocity field in the DMC. (a) Mean pressure in +z velocity region (Pa); (b) Mean velocity in +z velocity region (m/s); (c) Mean turbulence dissipation rate in +z velocity region (m2/s3); (d) Mean turbulent kinetic energy in +z velocity region (J).
Applsci 16 08489 g015
Table 1. Compositional analysis of the experimental feed material.
ComponentLi2OBeOTa2O5Nb2O5SiO2Al2O3CaOMgO
Content1.680.0480.00310.01171.9015.510.500.048
ComponentNa2OK2ORb2OCs2OSnO2FeP2O5
Content3.943.040.120.00970.0500.290.45
Table 2. Particle-size distribution of the crushed raw ore.
Particle Size (mm)Mass Fraction (%)
−6 + 0.927.87
−0.9 + 0.4537.57
−0.45 + 0.17513.25
0.175–0.07411.56
−0.0749.76
Total100.01 *
* The slight deviation from 100% is due to rounding.
Table 3. Quantitative mineral composition of the raw ore determined by MLA (%).
Mineral GroupMineral NameRelative ContentSubtotal
Metallic mineralsTantalo niobite0.020.05
Manganese-iron oxides0.01
Manganese-iron phosphates0.02
Lithium-bearing mineralsSpodumene21.6027.18
Lepidolite (zinnwaldite)4.98
Amblygonite0.35
Elbaite0.25
Gangue mineralsQuartz28.2672.77
Plagioclase33.19
K-feldspar10.90
Amphibole0.06
Chlorite0.01
Apatite0.24
Cassiterite0.05
Calcite0.06
Total100100
Table 4. Effect of feed density on particle trajectories and residence time in the DMC separation zone.
GangueSpodumene
d = 0.5 mmd = 3.0 mmd = 6.0 mmd = 0.5 mmd = 3.0 mmd = 6.0 mm
ρsus = 2120 kg/m3Applsci 16 08489 i001
t = 0.816 s
Applsci 16 08489 i002
t = 12.9 s
Applsci 16 08489 i003
t = 4.24 s
Applsci 16 08489 i004
t = 2.71 s
Applsci 16 08489 i005
t = 2.19 s
Applsci 16 08489 i006
t = 1.50 s
ρsus = 2160 kg/m3Applsci 16 08489 i007
t = 0.646 s
Applsci 16 08489 i008
t = 1.51 s
Applsci 16 08489 i009
t = 6.64 s
Applsci 16 08489 i010
t = 3.07 s
Applsci 16 08489 i011
t = 2.20 s
Applsci 16 08489 i012
t = 1.69 s
ρsus = 2200 kg/m3Applsci 16 08489 i013
t = 0.641 s
Applsci 16 08489 i014
t = 1.47 s
Applsci 16 08489 i015
t = 2.46 s
Applsci 16 08489 i016
t = 3.26 s
Applsci 16 08489 i017
t = 2.33 s
Applsci 16 08489 i018
t = 1.84 s
ρsus = 2240 kg/m3Applsci 16 08489 i019
t = 0.595 s
Applsci 16 08489 i020
t = 1.34 s
Applsci 16 08489 i021
t = 1.60 s
Applsci 16 08489 i022
t = 5.46 s
Applsci 16 08489 i023
t = 2.56 s
Applsci 16 08489 i024
t = 1.94 s
ρsus = 2280 kg/m3Applsci 16 08489 i025
t = 0.544 s
Applsci 16 08489 i026
t = 0.879 s
Applsci 16 08489 i027
t = 1.52 s
Applsci 16 08489 i028
t = 4.00 s
Applsci 16 08489 i029
t = 11.6 s
Applsci 16 08489 i030
t = 2.02 s
Table 5. Effect of feed pressure on particle trajectories and residence time in the DMC separation zone.
GangueSpodumene
d = 0.5 mmd = 3.0 mmd = 6.0 mmd = 0.5 mmd = 3.0 mmd = 6.0 mm
Feed pressure = 100 kPaApplsci 16 08489 i031
t = 0.722 s
Applsci 16 08489 i032
t = 2.40 s
Applsci 16 08489 i033
t = 9.87 s
Applsci 16 08489 i034
t = 5.36 s
Applsci 16 08489 i035
t = 3.36 s
Applsci 16 08489 i036
t = 2.33 s
Feed pressure = 125 kPaApplsci 16 08489 i037
t = 0.699 s
Applsci 16 08489 i038
t = 1.56 s
Applsci 16 08489 i039
t = 7.04 s
Applsci 16 08489 i040
t = 4.39 s
Applsci 16 08489 i041
t = 2.35 s
Applsci 16 08489 i042
t = 1.89 s
Feed pressure = 150 kPaApplsci 16 08489 i043
t = 0.641 s
Applsci 16 08489 i044
t = 1.47 s
Applsci 16 08489 i045
t = 2.46 s
Applsci 16 08489 i046
t = 3.26 s
Applsci 16 08489 i047
t = 2.33 s
Applsci 16 08489 i048
t = 1.84 s
Feed pressure = 175 kPaApplsci 16 08489 i049
t = 0.518 s
Applsci 16 08489 i050
t = 0.856 s
Applsci 16 08489 i051
t = 1.53 s
Applsci 16 08489 i052
t = 2.86 s
Applsci 16 08489 i053
t = 2.27 s
Applsci 16 08489 i054
t = 1.64 s
Feed pressure = 200 kPaApplsci 16 08489 i055
t = 0.436 s
Applsci 16 08489 i056
t = 0.723 s
Applsci 16 08489 i057
t = 1.48 s
Applsci 16 08489 i058
t = 2.07 s
Applsci 16 08489 i059
t = 2.05 s
Applsci 16 08489 i060
t = 1.07 s
Disclaimer/Publisher’s Note: The statements, opinions and data contained in all publications are solely those of the individual author(s) and contributor(s) and not of MDPI and/or the editor(s). MDPI and/or the editor(s) disclaim responsibility for any injury to people or property resulting from any ideas, methods, instructions or products referred to in the content.