1. Introduction
The increasing production and consumption of plastics have turned plastic waste management into a significant environmental challenge for modern society. The growing pile-up of post-consumer plastic waste, alongside concerns about resource depletion and greenhouse gas emissions, has spurred a shift towards circular economy strategies. These strategies advocate for efficient resource use, high-quality recycling, and the recirculation of secondary raw materials. Despite these challenges, plastics are still vital in the packaging sector due to their low cost, light weight, good functional performance, and high processing efficiency. Beverage packaging systems that include polyethylene terephthalate (PET) bottles, high-density polyethylene (HDPE) caps, and polypropylene (PP) labels dominate the rigid packaging market thanks to their effective balance of mechanical performance, manufacturing cost, and recyclability [
1,
2,
3]. Among these materials, PET bottles are some of the most extensively recycled plastic products and have consistently shown lower environmental impacts than glass and aluminum in terms of greenhouse gas emissions, energy consumption, and waste generation [
2,
3,
4].
Life Cycle Assessment (LCA) has emerged as the leading methodology for assessing the environmental performance of packaging systems throughout their entire life cycle. Research has indicated that PET packaging generally has lower environmental burdens than alternative materials [
1,
2,
4]. Meanwhile, HDPE caps and PP labels have been found to be significant contributors to the overall environmental profile of beverage packaging, despite garnering less attention than PET bottles. Enhancements in HDPE manufacturing processes improve energy efficiency and reduce emissions, while PP labels produced from quality recyclates help lower transport-related emissions without sacrificing packaging functionality [
3,
5,
6,
7]. These findings underscore the importance of evaluating the environmental performance of beverage packaging as an integrated system rather than considering its components separately.
Recent studies highlight that the environmental benefits of plastic recycling depend on various technological and methodological factors beyond just comparing virgin and recycled polymers. Factors such as packaging design, the recyclability of individual components, waste collection efficiency, allocation procedures in Life Cycle Assessment, regional recycling infrastructure, and end-of-life management all impact the final environmental performance of plastic packaging systems [
5,
8,
9,
10]. Additionally, the production and disposal of plastic packaging continue to affect several impact categories, including global warming potential, fossil resource depletion, human toxicity, and environmental acidification [
7]. Consequently, reliable environmental assessment requires a comprehensive evaluation of the entire packaging assembly under realistic waste management scenarios.
Attention has recently turned to recycled PET (rPET) for its potential to significantly reduce environmental impacts associated with virgin polymer production. Previous studies indicate that replacing virgin PET with recycled PET can cut environmental impacts by roughly 20–60%, depending on recycling pathways and allocation procedures [
1,
2,
9,
10]. Advances in recycling technologies, such as chemical recycling and improved sorting systems, alongside regulatory measures promoting recycled content and extended producer responsibility, also support the move towards circular packaging systems [
6,
8,
10]. However, LCA results still show notable variability due to differences in system boundaries, allocation methods, electricity mixes, recycling efficiencies, and waste management assumptions, complicating direct comparisons between studies.
While numerous studies have compared PET packaging with alternative materials or assessed complete systems using greenhouse gas emissions and carbon footprint indicators, far fewer have concentrated on cumulative primary energy demand at the level of individual components. Specifically, the combined impact of PET bottles, HDPE caps, and PP labels on the cumulative energy demand of beverage packaging under various end-of-life scenarios has not been fully explored using a consistent methodological framework. This lack of data hampers the identification of component-specific energy hotspots and diminishes the capacity to make evidence-based decisions regarding packaging design, recycling strategies, and resource efficiency in circular economy systems.
Among the indicators commonly applied in Life Cycle Assessment, cumulative energy demand (CED) provides a particularly useful measure of environmental performance because it quantifies the total primary energy required throughout the entire product life cycle while accounting for both renewable and non-renewable energy resources. Consequently, CED enables a consistent comparison of alternative packaging materials and waste management scenarios while providing information directly relevant to sustainable packaging design and circular economy implementation.
To address the identified research gap, the present study quantifies and compares the cumulative energy demand associated with PET bottles, recycled PET (rPET) bottles, HDPE caps, and polypropylene labels throughout their life cycle under recycling and landfill scenarios. The objectives are to identify the most energy-intensive stages of the product life cycle, determine the contribution of individual packaging components to the overall cumulative primary energy demand, and evaluate the potential energy benefits resulting from material recycling. The novelty of this work lies in providing a comprehensive component-level assessment of cumulative energy demand using a consistent Life Cycle Assessment framework under region-specific circular economy conditions. The obtained results provide quantitative evidence that may support packaging manufacturers, recycling industries, and policymakers in optimizing material selection, eco-design strategies, recycling infrastructure, and resource efficiency, thereby facilitating the development of more sustainable circular packaging systems.
2. Materials and Methods
2.1. Object of Analysis
This study presents a comprehensive comparative analysis of the environmental impacts of selected packaging materials—PET and rPET bottles, HDPE caps, and PP labels—throughout their entire life cycle, including production, transportation, and end-of-life management (recycling or landfill).
The analysis includes:
Assessment of the consumption of non-renewable and renewable raw materials (biomass, solar, wind, and hydropower);
Comparison of the impacts of two post-consumer disposal scenarios: recycling and landfill;
Identification of the most energy-intensive stages of the life cycle;
Analysis of the potential environmental benefits of using recycling processes.
2.2. Methodology
2.2.1. Plan of Analysis
This study uses the Life Cycle Assessment (LCA) method in accordance with the guidelines of ISO 14040 [
11] and ISO 14044 [
12], which allows for a comprehensive assessment of the environmental impact of a product throughout its entire life cycle—from raw material extraction to waste management.
The main environmental indicator in this work is CED (Cumulative Energy Demand), which measures the total amount of primary energy consumed during the entire life cycle of a product, divided into:
Non-renewable sources (e.g., fossil, nuclear, biomass);
Renewable sources (e.g., biomass, wind, solar, geothermal, water).
The LCA analysis is based on data from Poland from 2022 to 2024, reflecting local production practices and recycling conditions. The study includes bottles made entirely of PET and rPET, including a mix of light-walled water bottles.
The life cycle inventory (LCI) was developed using a combination of primary data obtained from the analyzed manufacturing company (foreground processes) and secondary background data from the ecoinvent database for upstream processes, following standard LCA practice and the requirements of ISO 14040 and ISO 14044.
2.2.2. LCA Method
Life Cycle Assessment (LCA) is a standardized methodology for evaluating the potential environmental impacts associated with a product, process, or service throughout its entire life cycle—from raw material extraction and production to use and end-of-life management. The methodology follows the principles and framework established in ISO 14040 and ISO 14044 [
11,
12]. LCA involves identifying and quantifying material and energy flows, as well as emissions and waste, and assessing their environmental impacts. It supports decision-making for implementing, modernizing, or decommissioning technologies and can be applied across industries of any size, including mining, food, construction, and waste management [
13,
14].
LCA plays a key role in eco-design, enabling the identification of critical environmental hotspots in packaging components (bottles, caps, labels) and across all life cycle stages. It follows the Life Cycle Thinking (LCT) and Life Cycle Management (LCM) approaches, which promote long-term optimization of products by considering both positive and negative impacts.
The method is standardized internationally through:
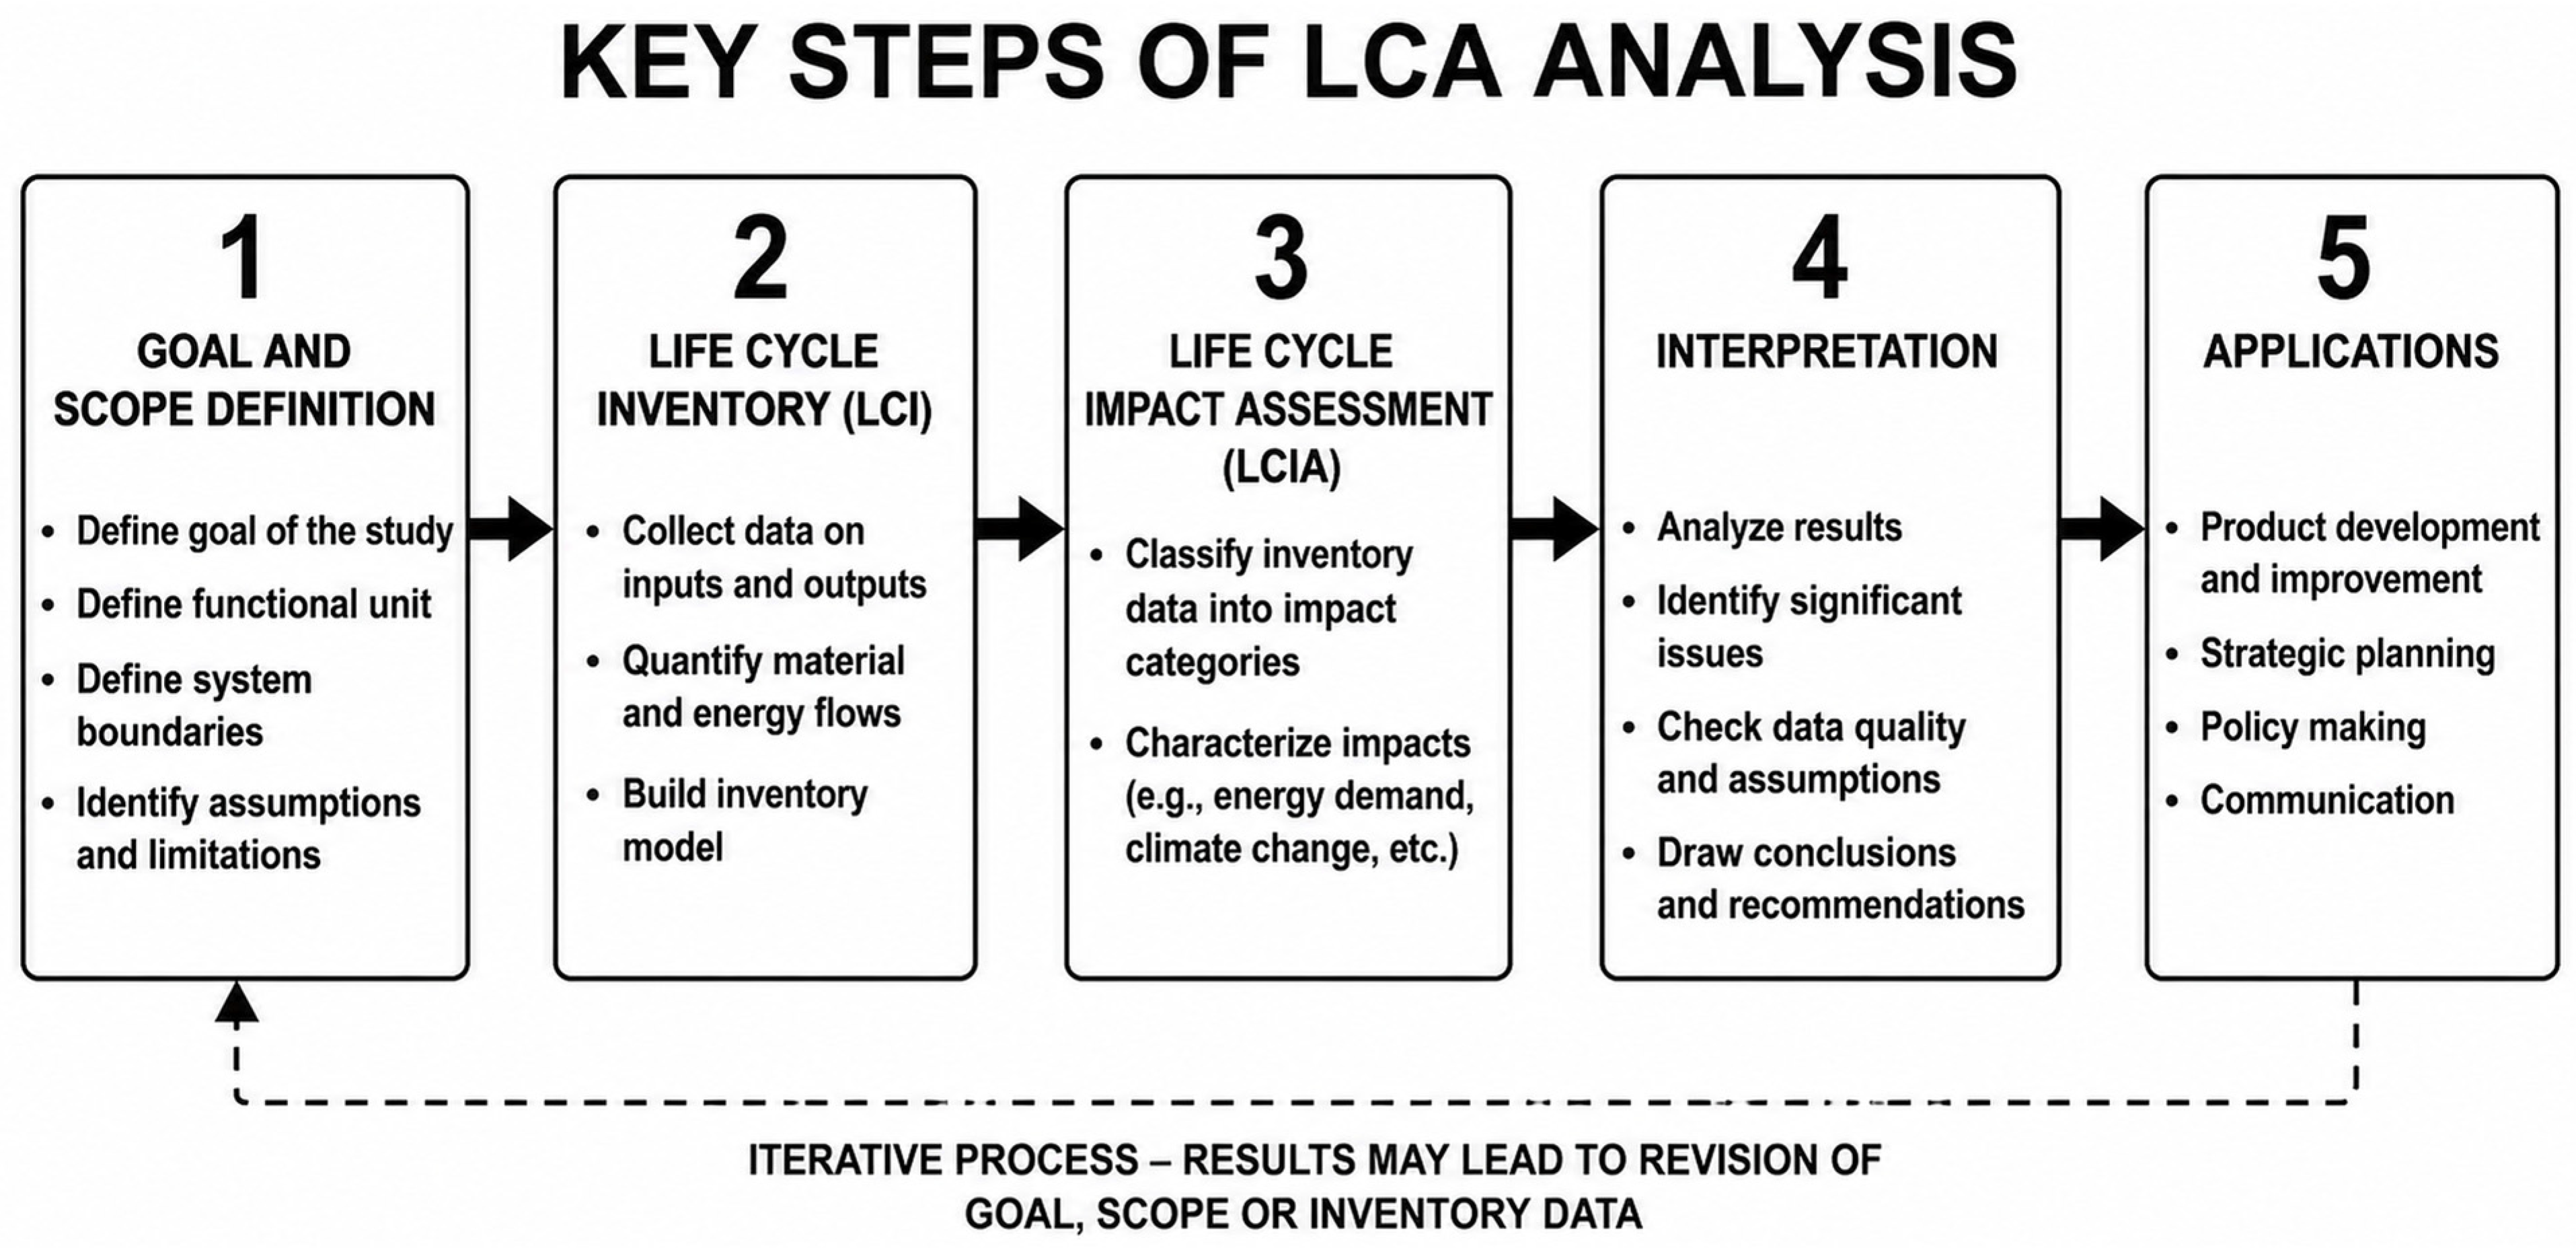
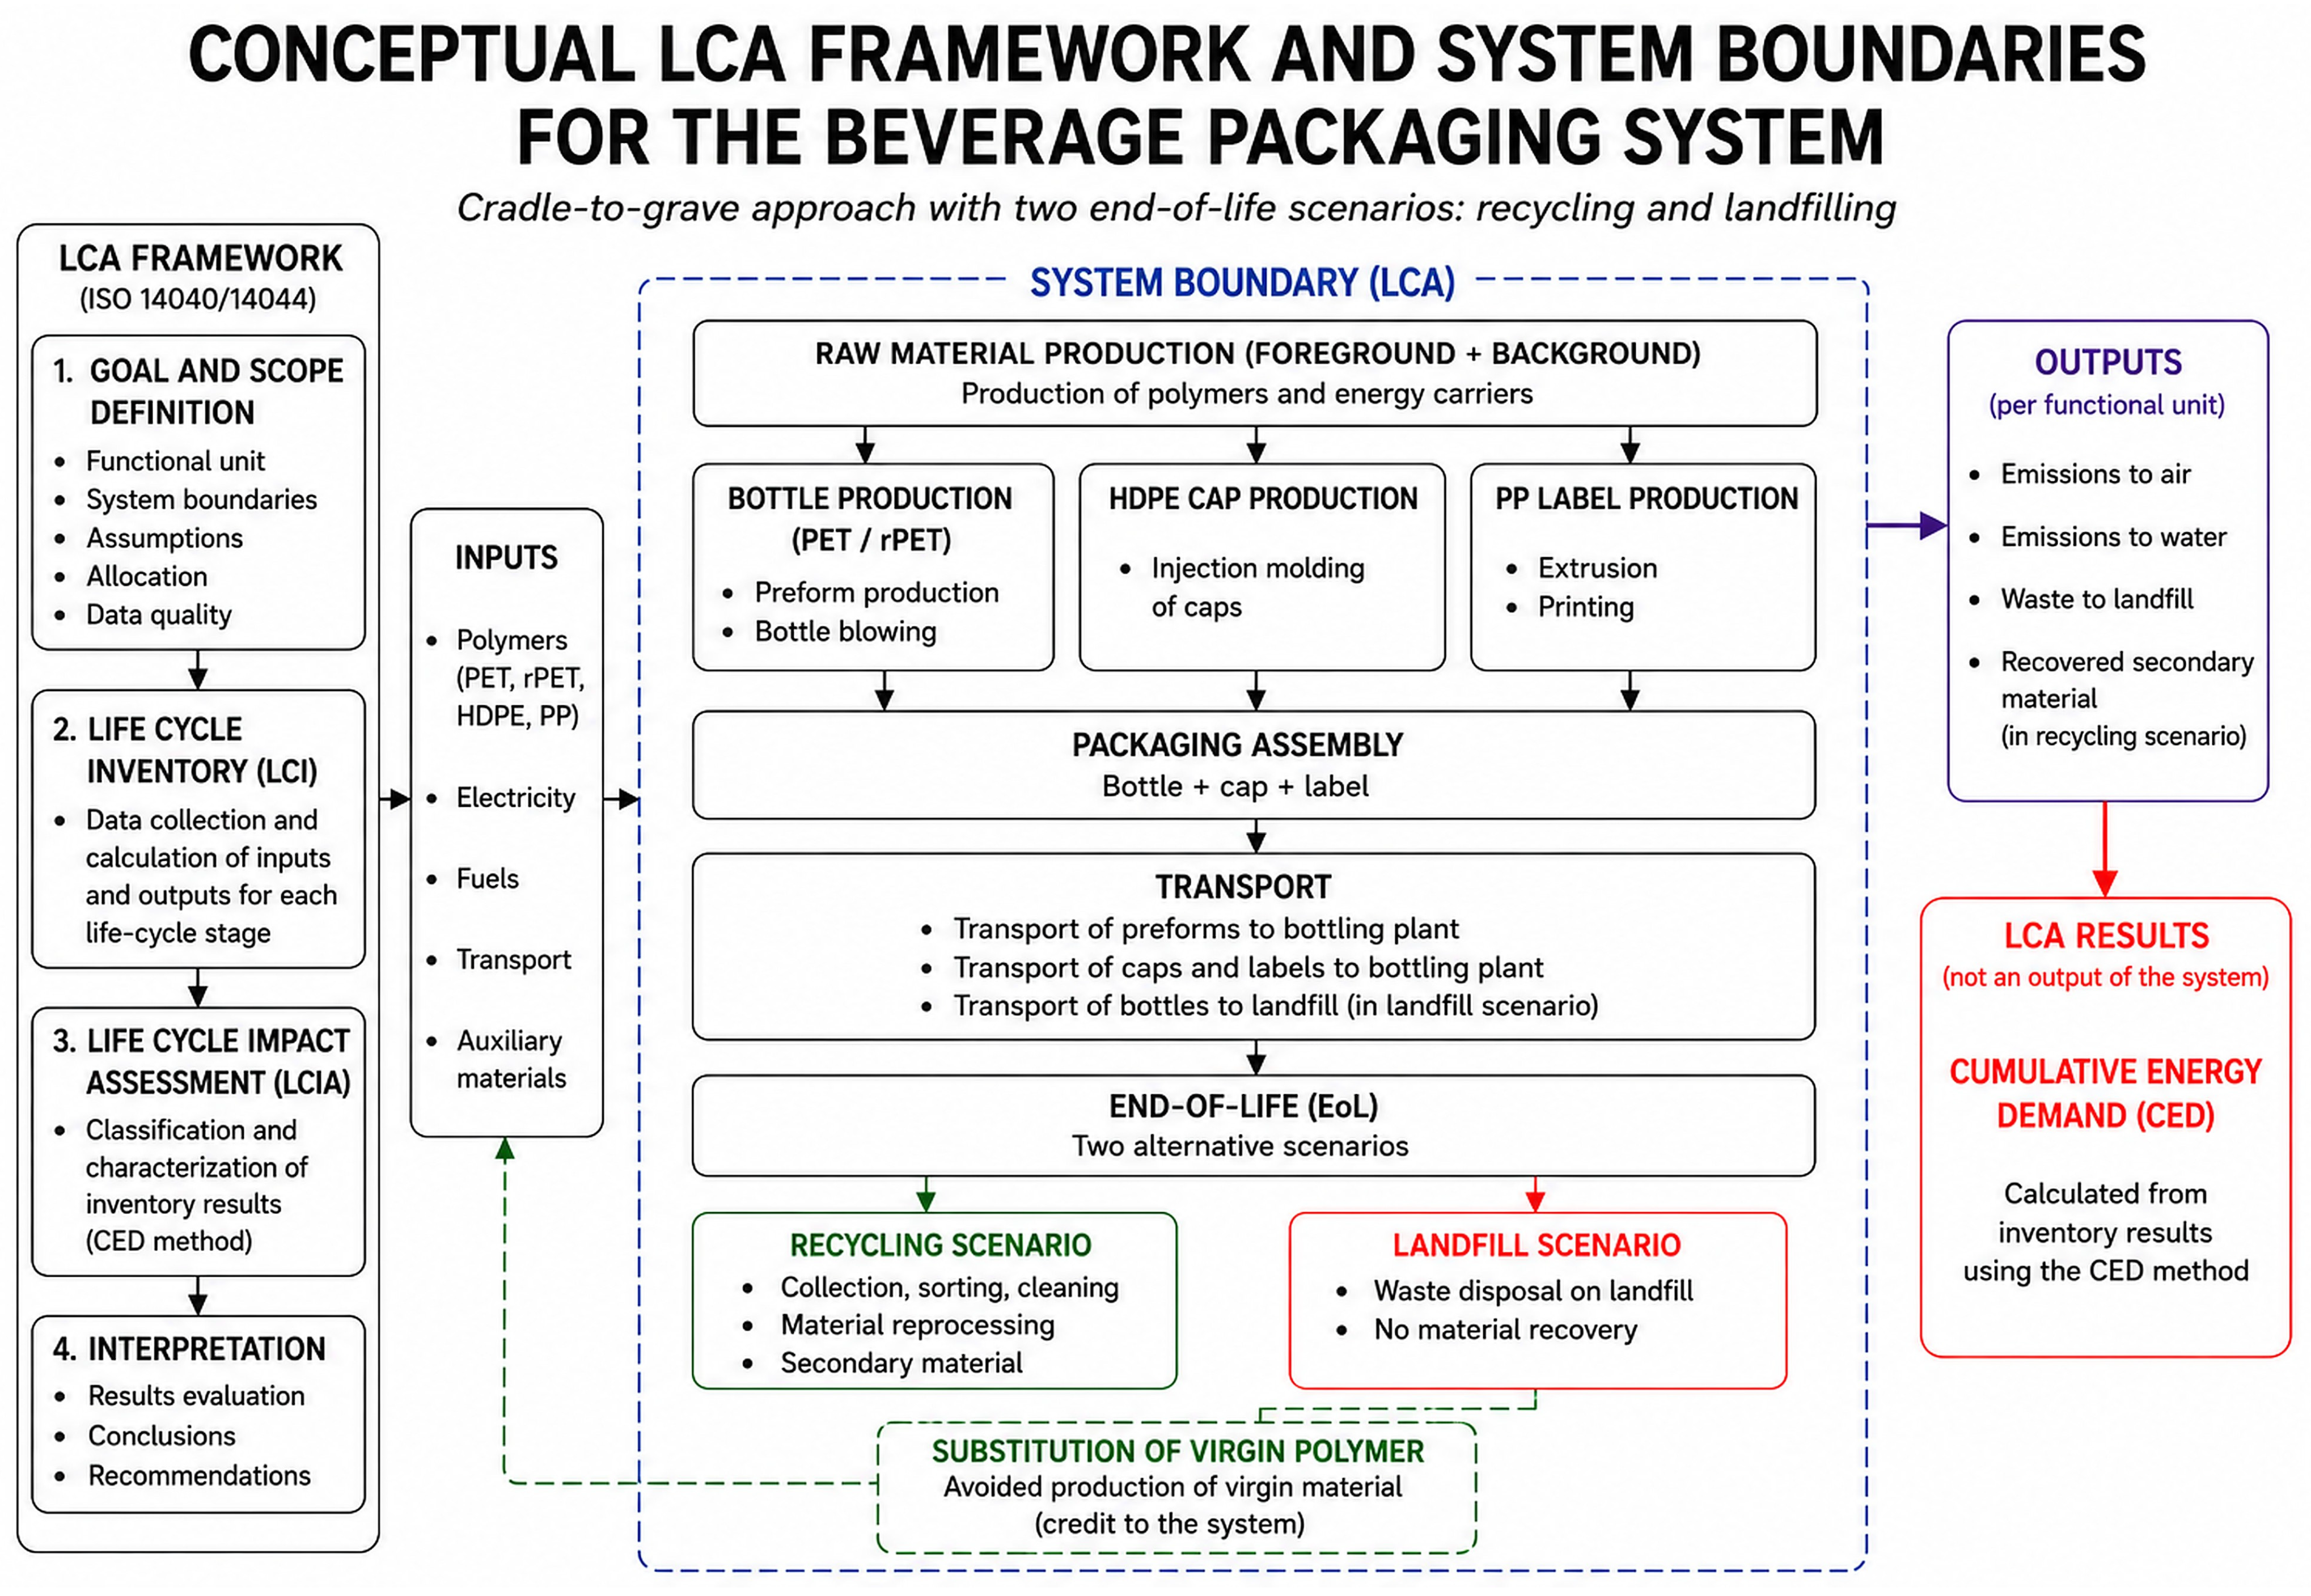
LCA is performed in four main stages: goal and scope definition, life cycle inventory (LCI), life cycle impact assessment (LCIA), and interpretation, providing a structured assessment of potential environmental consequences throughout a product’s life cycle (
Figure 1).
The life cycle impact assessment of the bottle, cap, and label production process was designed to understand and evaluate data for potential environmental impacts. CED (Cumulative Energy Demand) was used as the Life Cycle Inventory (LCI) indicator, i.e., the sum of primary energy inputs per functional unit expressed in MJ. According to ISO 14040 and ISO 14044 standards, the Life Cycle Impact Assessment (LCIA) phase follows the inventory phase and transforms LCI data (e.g., CED) into potential environmental impacts (such as global warming potential). In this work, CED serves as a measure of primary energy demand and is reported in the LCI section. While simultaneously taking into account renewable and non-renewable energy categories, the analysis included a comprehensive assessment of the production process for PET bottles formed by injection stretch blow molding (ISBM) and bottles made from recycled PET (rPET), HDPE caps, and PP labels, as well as transport processes and disposal scenarios for landfill and recycling. The essence of the research was to identify the energy consumption of the processes and analyze the environmental benefits.
2.2.3. Description of Packaging Manufacturing Processes
The analyzed PET and rPET bottles were assumed to be manufactured using the reheat injection stretch blow molding (RHB ISBM) process, which is the dominant industrial technology for beverage bottle production. In this configuration, PET preforms are produced in a separate injection molding process, cooled, and subsequently transported to the blow molding facility, where they are reheated, axially stretched, and biaxially blown into the final bottle shape. The LCA model therefore explicitly includes the energy demand associated with the blow molding (reheat and stretching) stage, while the production of preforms is accounted for via background data for PET and rPET material production.
The system boundaries include energy consumption related to preform reheating, stretching, compressed air generation, and auxiliary equipment directly associated with the blow molding process. Injection molding of preforms is not modeled as a foreground process but is represented through material-specific cumulative energy demand values derived from the life cycle inventory databases, consistent with the RHB ISBM configuration. HDPE bottle caps were modeled as products of conventional injection molding, which is the standard manufacturing process for closures. The energy demand includes polymer processing energy and associated auxiliary operations, while mold manufacturing and machine depreciation were excluded in accordance with ISO 14040 and ISO 14044 cut-off criteria. PP labels were assumed to be manufactured using standard film extrusion followed by printing and cutting operations, representative of commonly used wrap-around or pressure-sensitive labels in beverage packaging. The model includes the energy demand of polymer processing and finishing steps, whereas labeling operations at the filling plant were excluded from the system boundaries [
13,
14,
15].
2.2.4. Functional Unit
A functional unit was defined as packaging 100,000 L of beverage in 100,000 complete 1 L beverage packages (PET or rPET bottle, HDPE cap, and PP label). This functional unit reflects the primary function of the packaging system, namely delivering 100,000 L of beverage to the consumer. The corresponding reference flow consisted of 100,000 PET (or rPET) bottles, 100,000 HDPE caps, and 100,000 PP labels. All inventory data and cumulative energy demand (CED) results were normalized to this functional unit. Unless otherwise noted, all results presented in tables, figures, and the discussion refer to this reference base. The values given for individual packaging components represent their contribution to the total CED of the defined functional unit.
2.2.5. System Boundaries
The technological processes associated with bottle production can be understood as a system that extracts natural resources from the environment, transforms them within its operational boundaries, and ultimately returns solid, liquid, and gaseous waste back into the environment. Resource extraction and waste emissions occur across the entire life cycle of the packaging system, forming a continuous flow of inputs and outputs between the technosphere and the environment. All manufacturing processes, including polymer production, preform extrusion, and bottle blow-molding, generate environmentally relevant emissions and waste streams that are captured within the system boundaries. In the context of life cycle assessment, system boundaries must be defined in both temporal and spatial dimensions. Temporal boundaries correspond to the life cycle phases included in the assessment, while spatial boundaries delineate the individual unit processes—from their starting points to their endpoints—within the industrial production system. These processes occur in a strictly defined sequence and are arranged in a logical order as part of the continuous manufacturing chain. Life cycle stages that do not contribute to environmental burdens, or whose impact is negligible, are excluded from the assessment in accordance with ISO 14040 and ISO 14044 methodological recommendations. Within this study, the system includes all processes from the delivery of preforms to the production facility through their transformation into finished bottles via the blow-molding process. This encompasses the handling, preparation, and internal transport of preforms within the production plant, as well as the integration of ready-made caps and labels into the packaging system. Processes beyond bottle formation, such as beverage filling, labeling, packing, warehousing, consumer use, and retail distribution, were excluded from the system boundaries. Transportation and storage of raw materials prior to their arrival at the production site were also excluded, as their contribution to overall cumulative energy demand is considered marginal. A conceptual representation of the product system analyzed in this study, including system boundaries, material and energy flows, foreground and background processes, functional unit, and alternative end-of-life scenarios, is presented in
Figure 2.
2.2.6. Allocation Rules for Virgin and Recycled Materials
In accordance with the requirements of ISO 14040 and ISO 14044, the specification of allocation rules for recycling processes plays a critical role in the correct interpretation of LCA and CED results, particularly for materials such as rPET or recycled PP. In this study, substitution-based allocation (system expansion/substitution) was applied, assuming that 1 kg of recyclate replaces 1 kg of the corresponding virgin polymer. This assumption follows ILCD recommendations and is consistent with numerous LCA studies on polymer materials.
The following formulation was applied in the CED model:
where
—energy consumed during the recycling process (sorting, washing, drying, regranulation);
—energy required for producing virgin PP or PET;
—1.0–substitution coefficient (1:1).
Thus, the chosen allocation method directly influences the negative CED values observed in the results, as well as the relative similarity between PET and rPET impacts in this study. It is important to emphasize that changing the allocation method may lead to substantially different conclusions, which is consistent with the literature—for example, the cut-off method typically shows substantially greater environmental benefits for rPET than the substitution method.
It should be emphasized that the application of substitution-based allocation (system expansion) may lead to negative CED values in recycling scenarios. This occurs when the avoided primary energy associated with virgin polymer production exceeds the direct energy demand of the recycling processes (sorting, washing, drying, and regranulation). Therefore, negative CED values should be interpreted as net primary energy savings resulting from material substitution, rather than physically negative energy consumption. The interpretation of such results is directly dependent on the selected allocation approach.
2.2.7. CED Model
The CED model allows for the determination of cumulative energy demand. Impact indicators are divided into six impact categories: three non-renewable (nuclear energy, fossil fuels, biomass) and three renewable (biomass, hydropower, solar energy, wind energy, and geothermal energy) [
16]. The CED model quantifies the potential impact of emissions and extractions using so-called midpoint indicators [
17]. Energy demand in the CED model is expressed in MJ [
18]. Cumulative energy demand (CED) of a product is commonly used in life cycle assessment (LCA) to describe the total primary energy associated with a product system over its life cycle, including energy used for raw material extraction, production, use, and end-of-life management. Depending on the methodological convention, primary energy demand may be calculated using different calorific values of energy carriers, and the treatment of water vapor in exhaust gases can affect the result. CED can also be reported separately for renewable and non-renewable energy resources. Frischknecht et al. [
19] discuss the methodological treatment of cumulative energy demand in LCA and the energy harvested approach, emphasizing the need for a consistent definition of primary energy and for distinguishing between renewable and non-renewable energy inputs. Huijbregts et al. [
20] focus specifically on cumulative fossil energy demand as a potential indicator of environmental performance and examine its usefulness for comparing products. Their analysis suggests that fossil energy demand can provide meaningful information about the energy intensity of a product system, including upstream requirements associated with resource extraction and processing, although its interpretation depends on the chosen system boundaries and the specific context of the assessment [
19,
20].
Since much of the methodology for determining CED is very similar to the general life cycle assessment methodology, and due to the important role of the impact of energy demand throughout the life cycle of products or systems, it is considered that CED can be used as an environmental impact indicator, especially for energy generation systems [
19,
20,
21]. Cumulative energy demand results include all renewable and non-renewable energy sources used in bottle production and transportation processes, as well as the energy of raw materials. Process and transport energy includes the direct use of fuels, including the use of fossil fuels, hydropower, nuclear power, solar energy, wind energy, and other energy sources to generate electricity for processes, as well as the energy required for processing and transport during the production process. Raw material energy is the energy value of resources removed from the environment and used as raw materials for the production of disposable bottles [
22,
23,
24,
25]. The present study applies a deterministic LCA framework based on defined life cycle inventory datasets. No probabilistic uncertainty propagation (e.g., Monte Carlo simulation) was performed. Consequently, the results represent point estimates derived from specific inventory assumptions and allocation rules, rather than statistically distributed outcomes with confidence intervals.
It is important to emphasize that the CED serves a dual methodological role in life cycle studies. On the one hand, it serves as a life cycle inventory (LCI) indicator that quantifies the cumulative primary energy consumption throughout a product’s life cycle. On the other hand, because primary energy demand is strongly linked to fossil resource depletion and several environmental impact categories, the CED is widely used as a proxy for environmental performance, particularly in studies focusing on energy-intensive production systems and circular economy strategies. Therefore, although the CED does not replace a full life cycle analysis (LCIA), it provides a solid basis for comparing alternative packaging and end-of-life scenarios from an energy efficiency perspective.
3. Results
3.1. Energy Demand
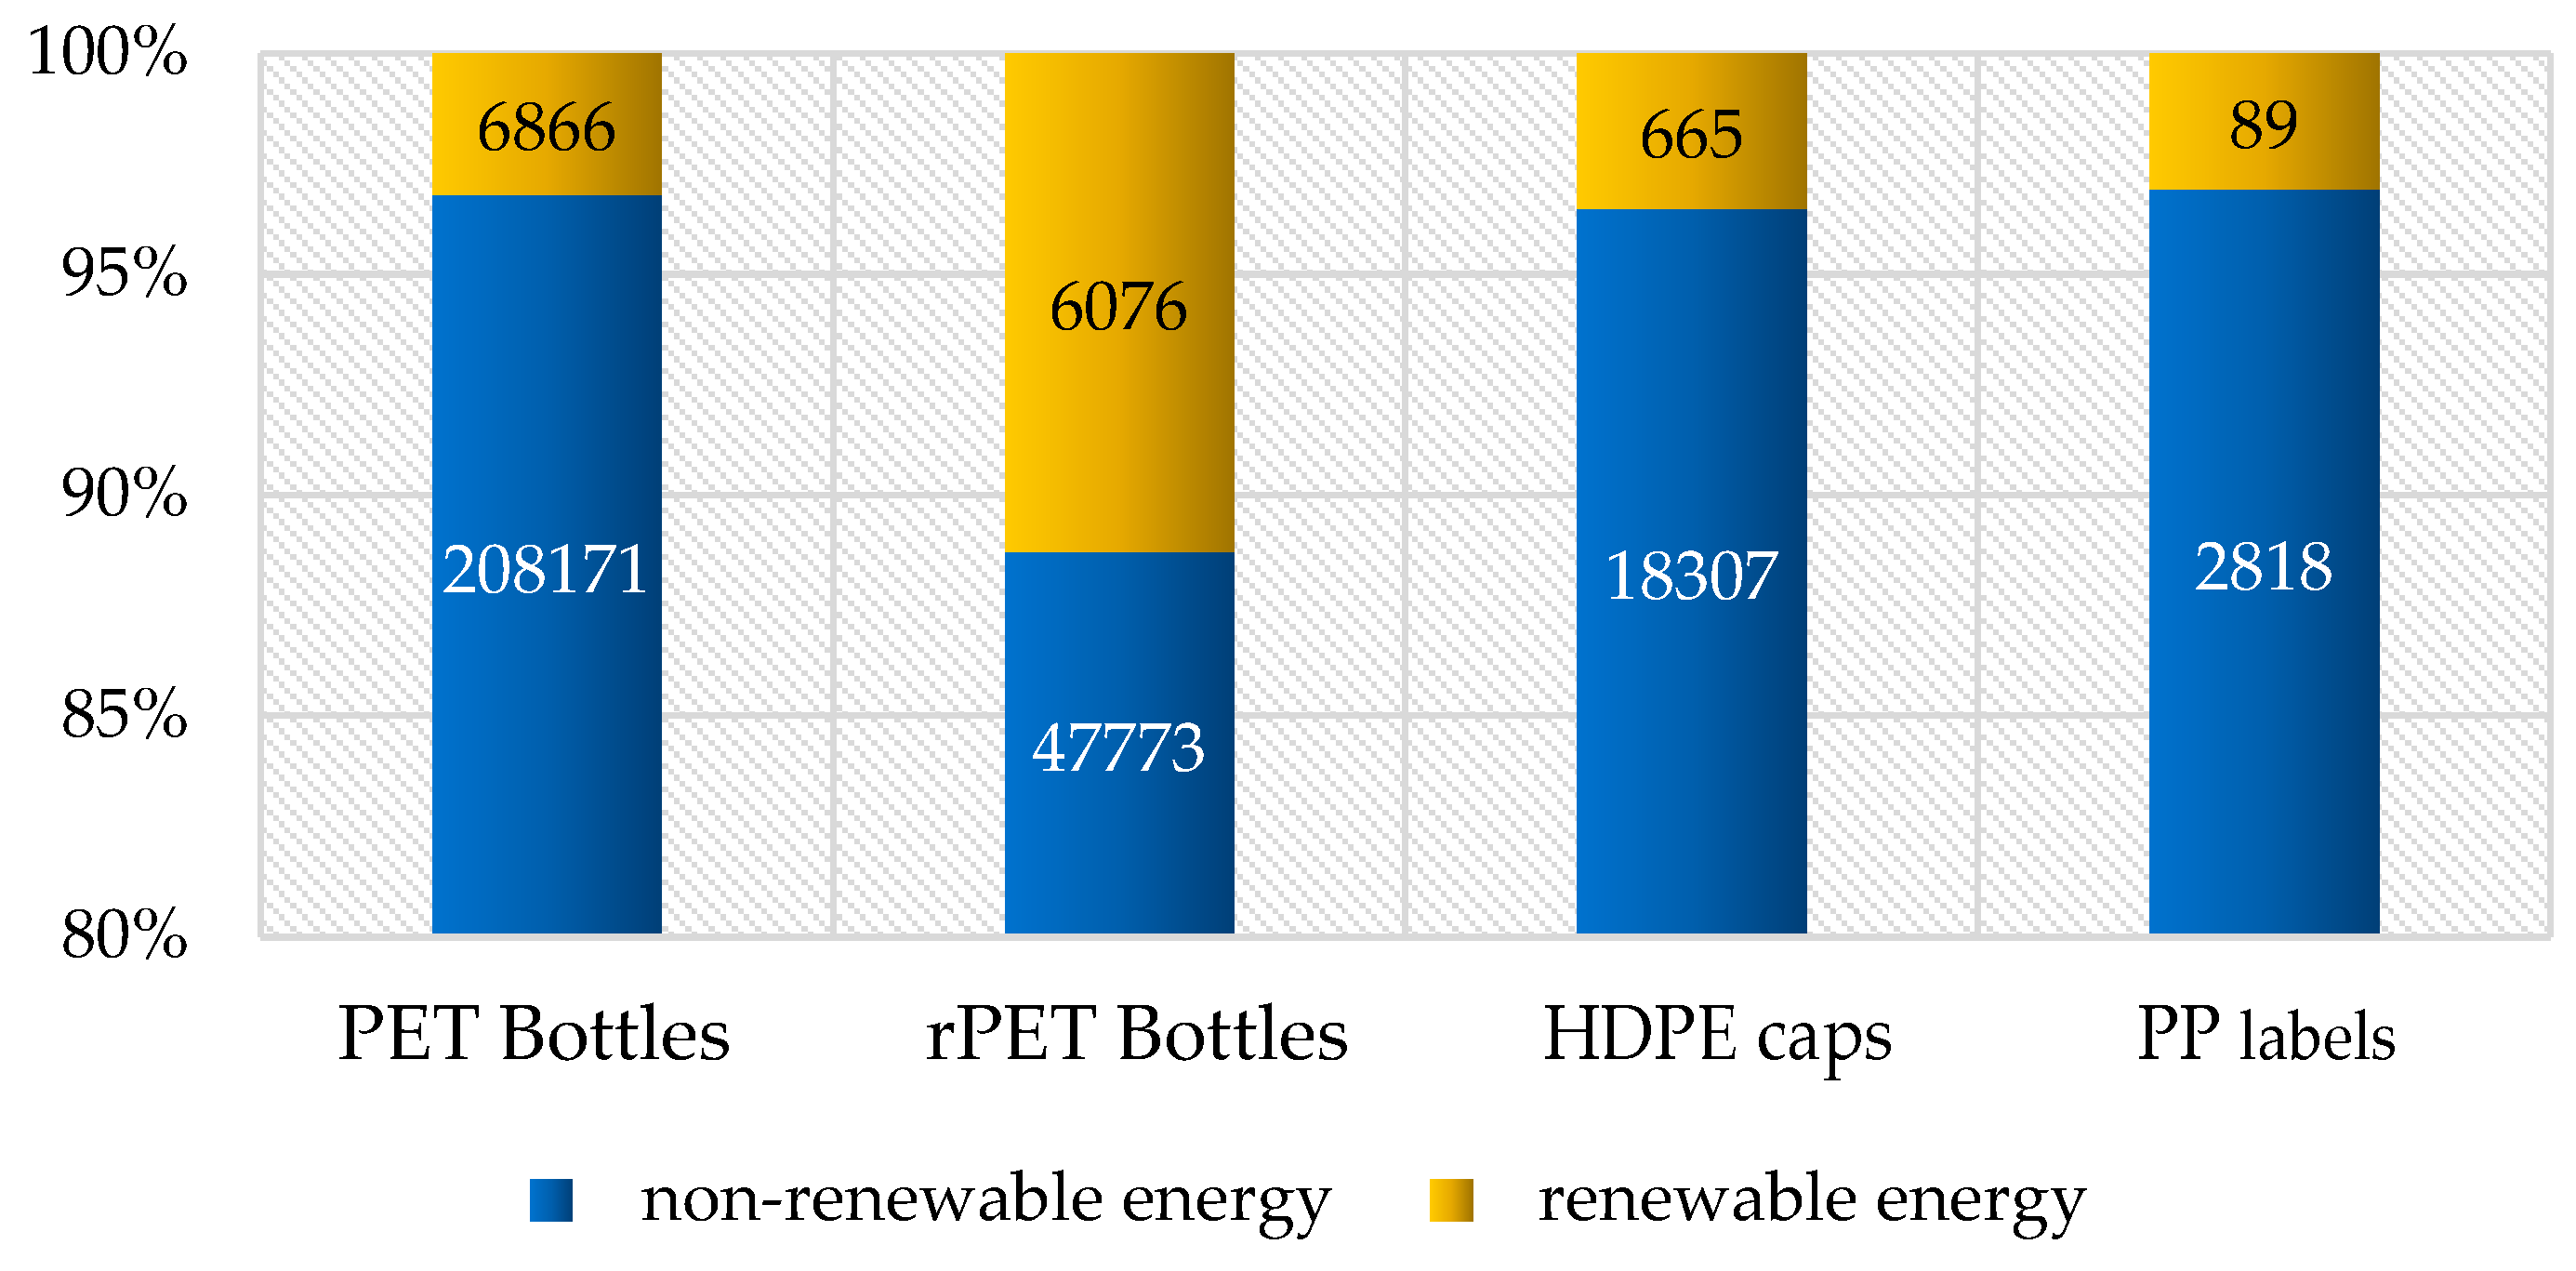
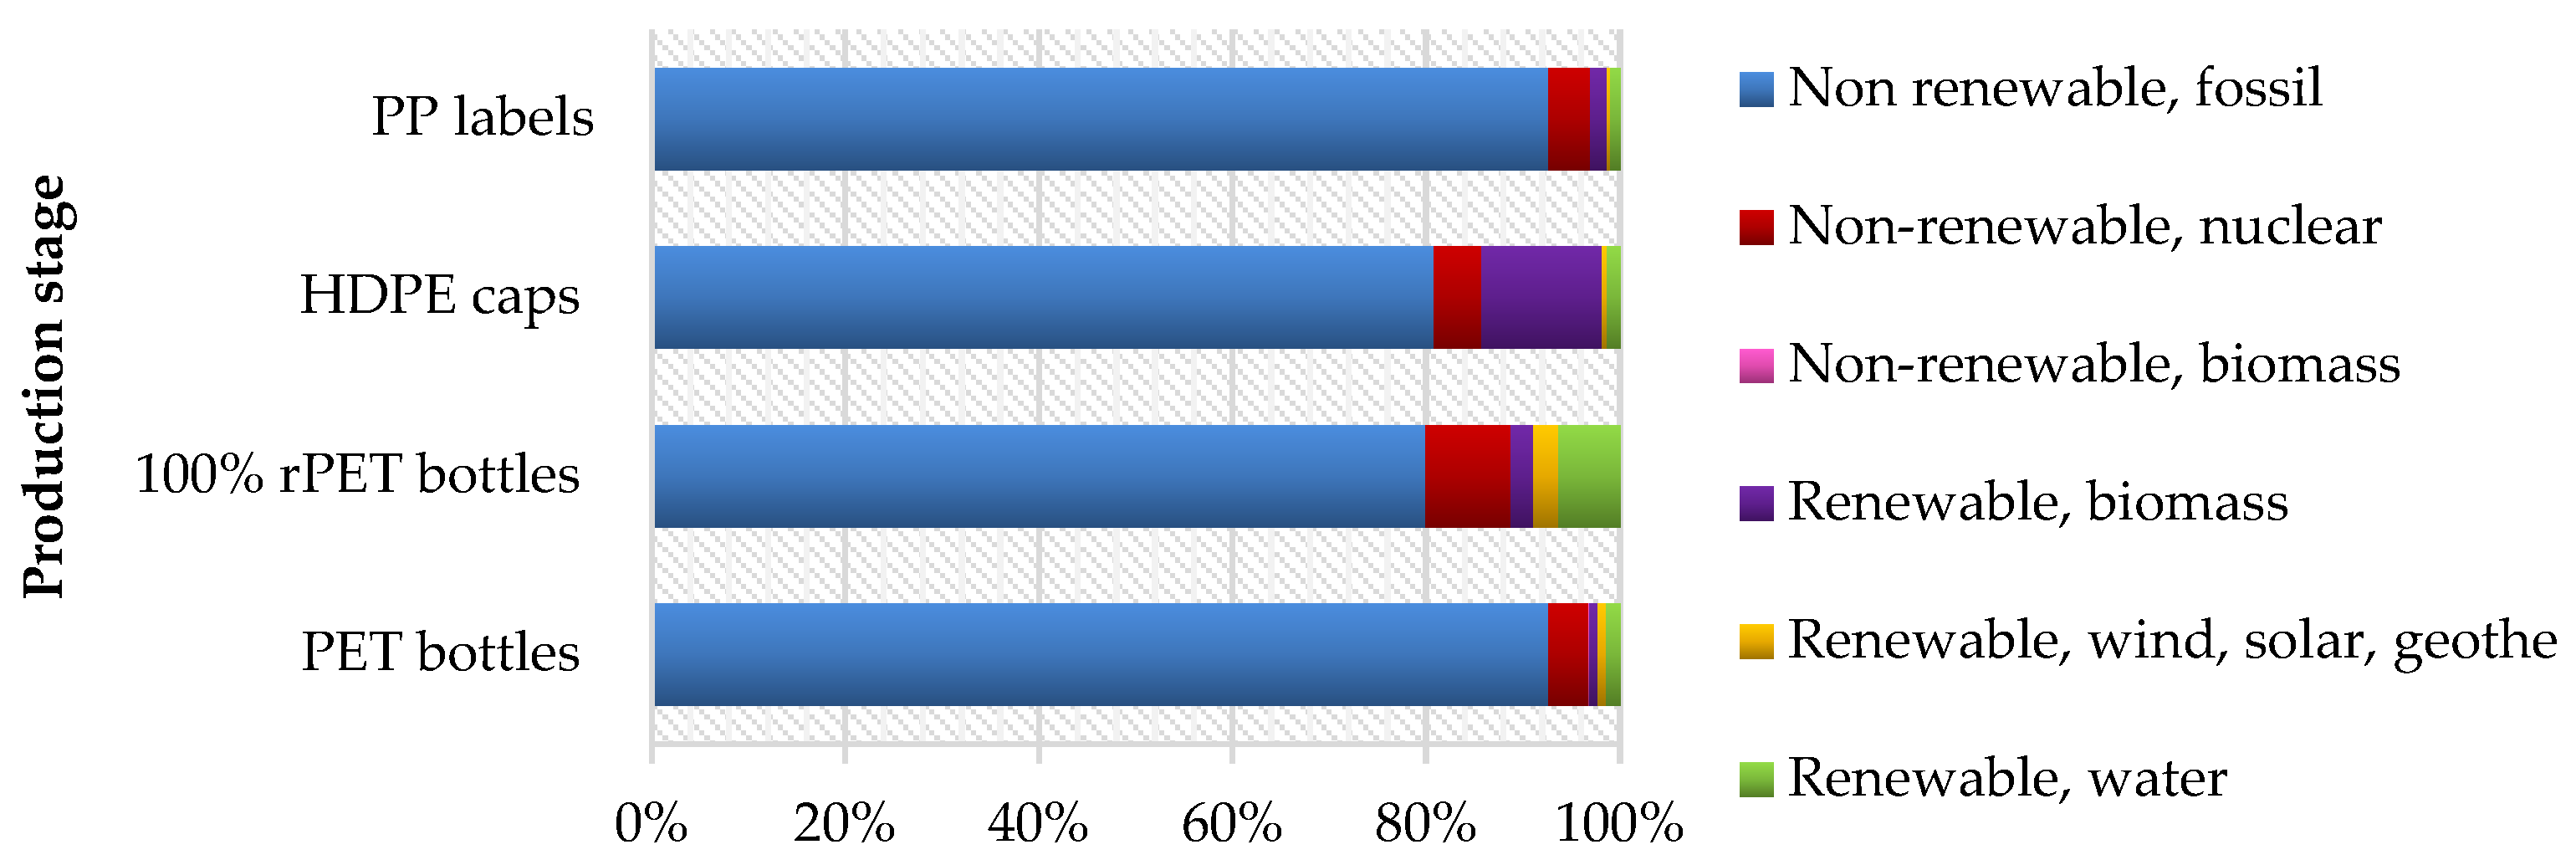
Figure 3 shows the total cumulative energy demand (CED) for the manufacturing of PET bottles, rPET bottles, HDPE caps, and PP labels. Among all packaging components, PP labels showed the highest cumulative energy demand, while rPET bottles showed the lowest values, indicating the energy-saving potential associated with recycled raw materials under the adopted modeling assumptions. Across all packaging components, non-renewable energy sources dominate the total CED. Non-renewable energy accounted for approximately 88–97% of the total CED, which confirms the dominant share of energy from fossil sources throughout the analyzed life cycle (
Figure 3).
The production stage was identified as the dominant factor influencing the cumulative energy demand of all packaging components. Fossil energy accounted for the largest share of primary energy consumption, while transportation accounted for only a small fraction of the total primary energy consumption. Among the components analyzed, PP labels had the highest production-related energy demand, while HDPE caps had the lowest.
Renewable energy sources accounted for a relatively small share of total cumulative energy demand. However, their share was proportionally higher for recycled materials than for virgin polymers, reflecting the energy mix associated with recycling processes. Hydropower was the most important renewable energy source, particularly in rPET production (
Table 1).
Summarizing the cumulative impacts at the manufacturing stage, PP labels have the highest cumulative environmental impact (8.95 × 10
−2 MJ), making them the most burdensome component. PET bottles (6.87 × 10
−2 MJ) and HDPE caps (6.65 × 10
−2 MJ) have a moderate impact. rPET bottles have a slightly lower impact (6.08 × 10
−2 MJ), which may indicate benefits from recycling (
Figure 4).
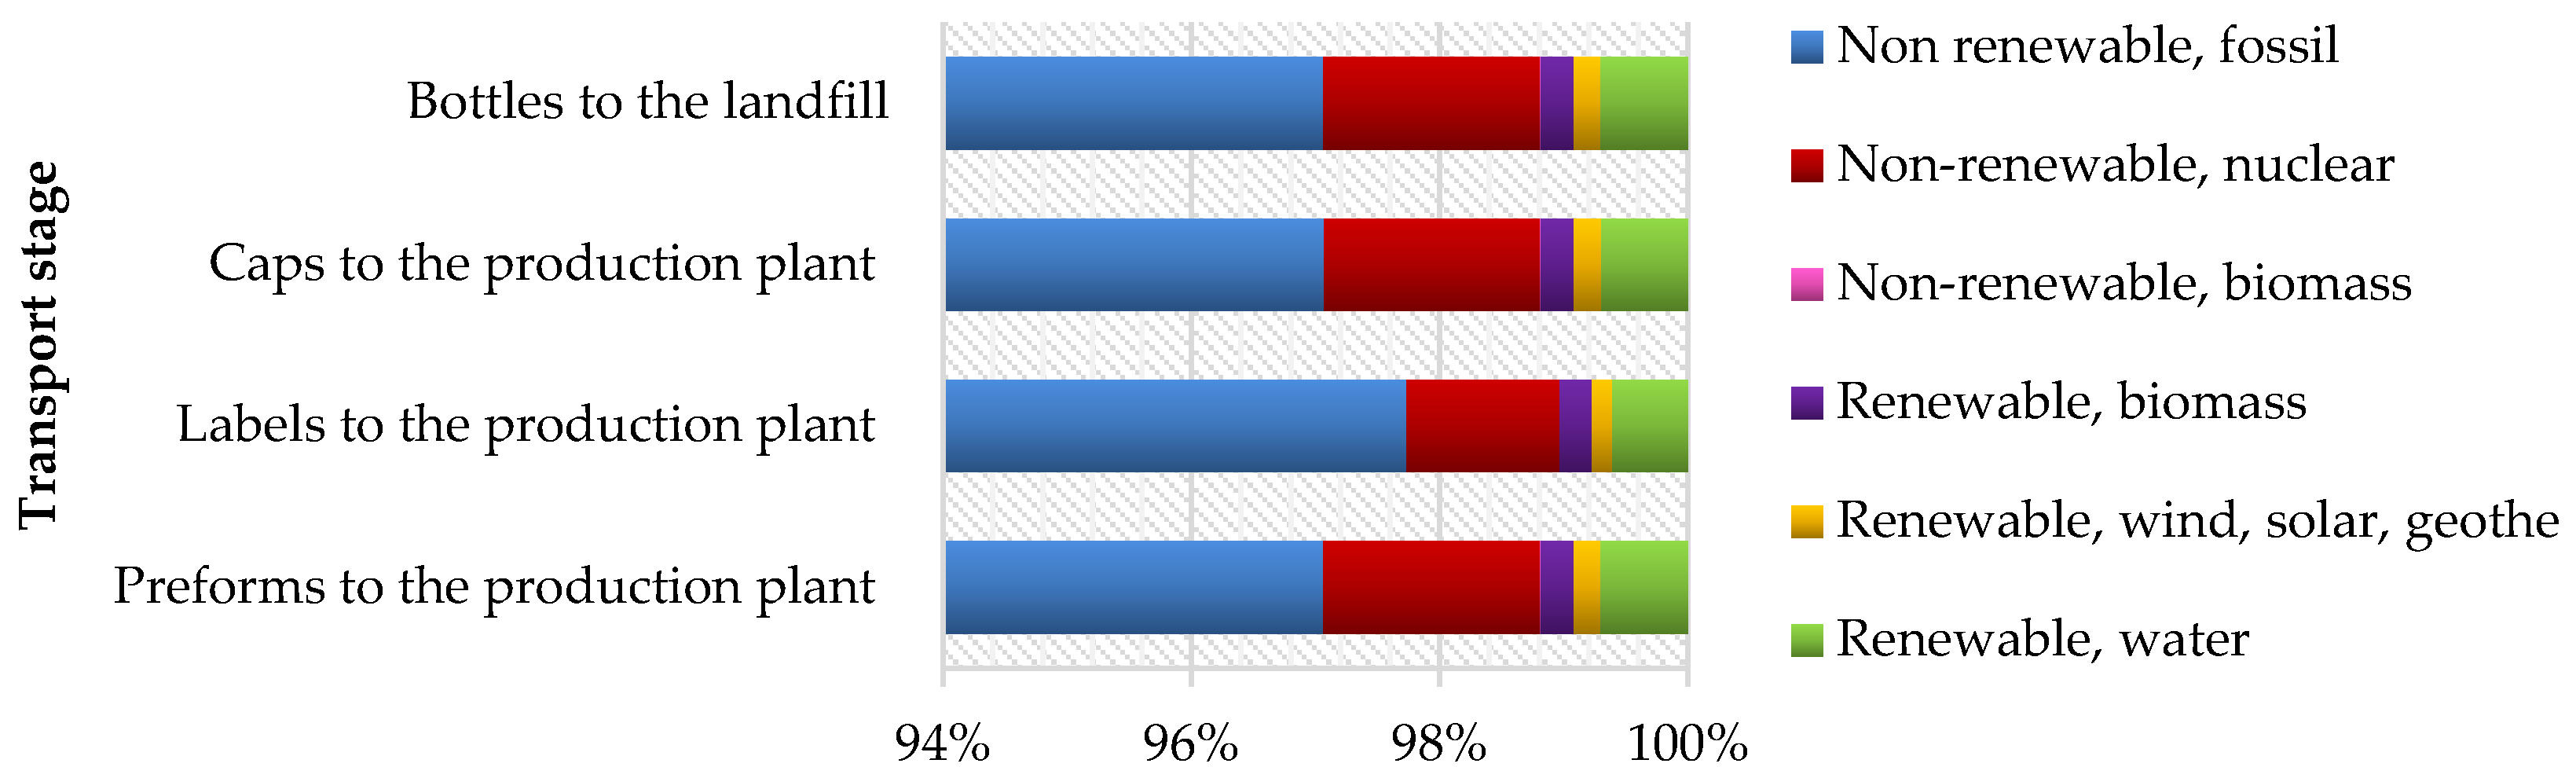
In turn, when analyzing the transport stage, it was noted that the greatest environmental impact is from transport to the production plant (7.49 × 10
−4 MJ). Next comes the bottle to the landfill (4.86 × 10
−4 MJ). The remaining elements have significantly lower values (
Figure 5). The relatively high share of hydropower in the production of recycled PET resulted in a reduced share of non-renewable energy compared to the production of virgin PET.
These results further confirm the need to increase the share of renewable energy in packaging production systems.
Based on the obtained research results, the following comparative relationships and observable trends were identified (deterministic LCA results):
PP labels are the most environmentally harmful of all the elements analyzed—both in terms of non-renewable and renewable energy consumption; It should be noted that this assessment focuses exclusively on cumulative energy demand (CED) and does not include toxicity-related impacts, such as potential heavy metal content (e.g., cadmium in pigments), which would require additional LCIA categories.
Recycled PET (rPET) bottles showed lower total primary energy consumption compared to virgin PET bottles. However, this difference depends on the allocation method used and the regional energy mix included in the life cycle analysis (LCA) model.
Even though transport had a much smaller share than manufacturing, optimizing transport logistics remains important due to the cumulative effects of the supply chain.
3.2. Post-Consumer Development Scenarios
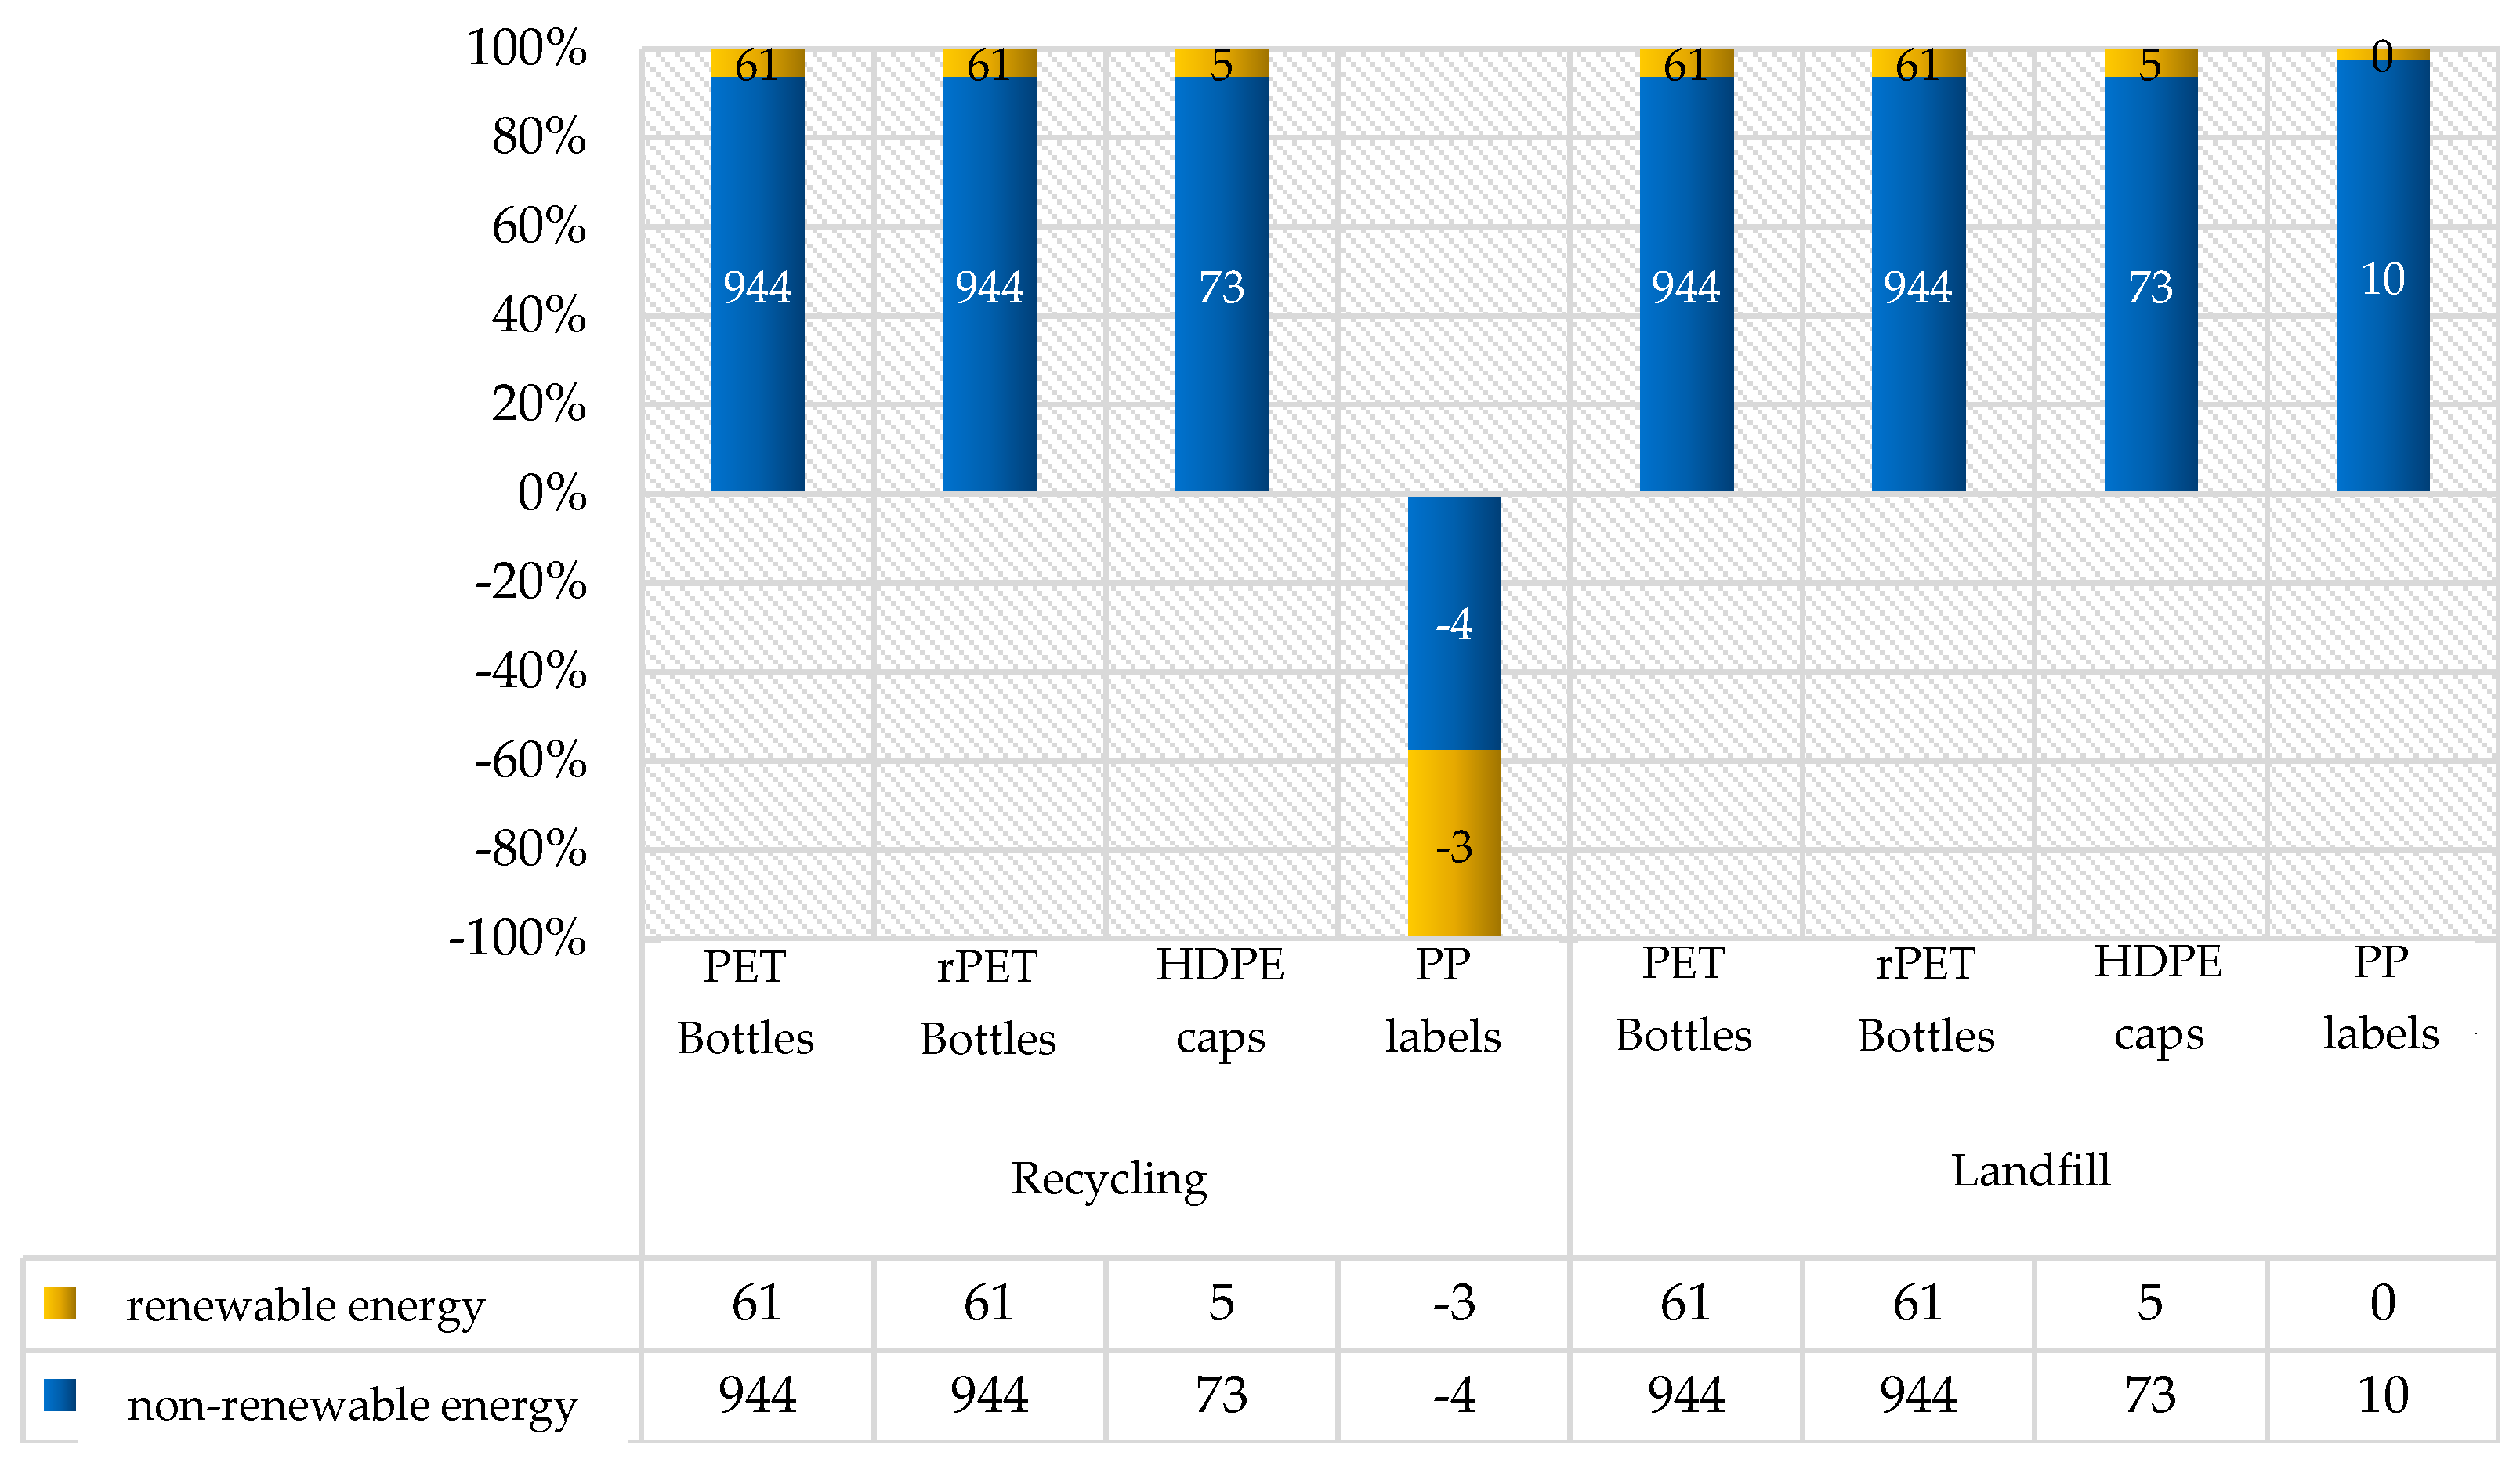
Table 2 presents the impact of two end-of-life scenarios for packaging—recycling and landfill disposal—on natural resource consumption. Bottle production dominated the cumulative energy demand regardless of the end-of-life scenario, while PP labels showed the largest relative differences between recycling and landfill (
Table 2). Unlike bottles and caps, PP labels vary significantly in terms of recycling and landfill disposal, indicating that their overall energy requirements are highly dependent on how they are managed at the end of their life cycle (
Figure 6).
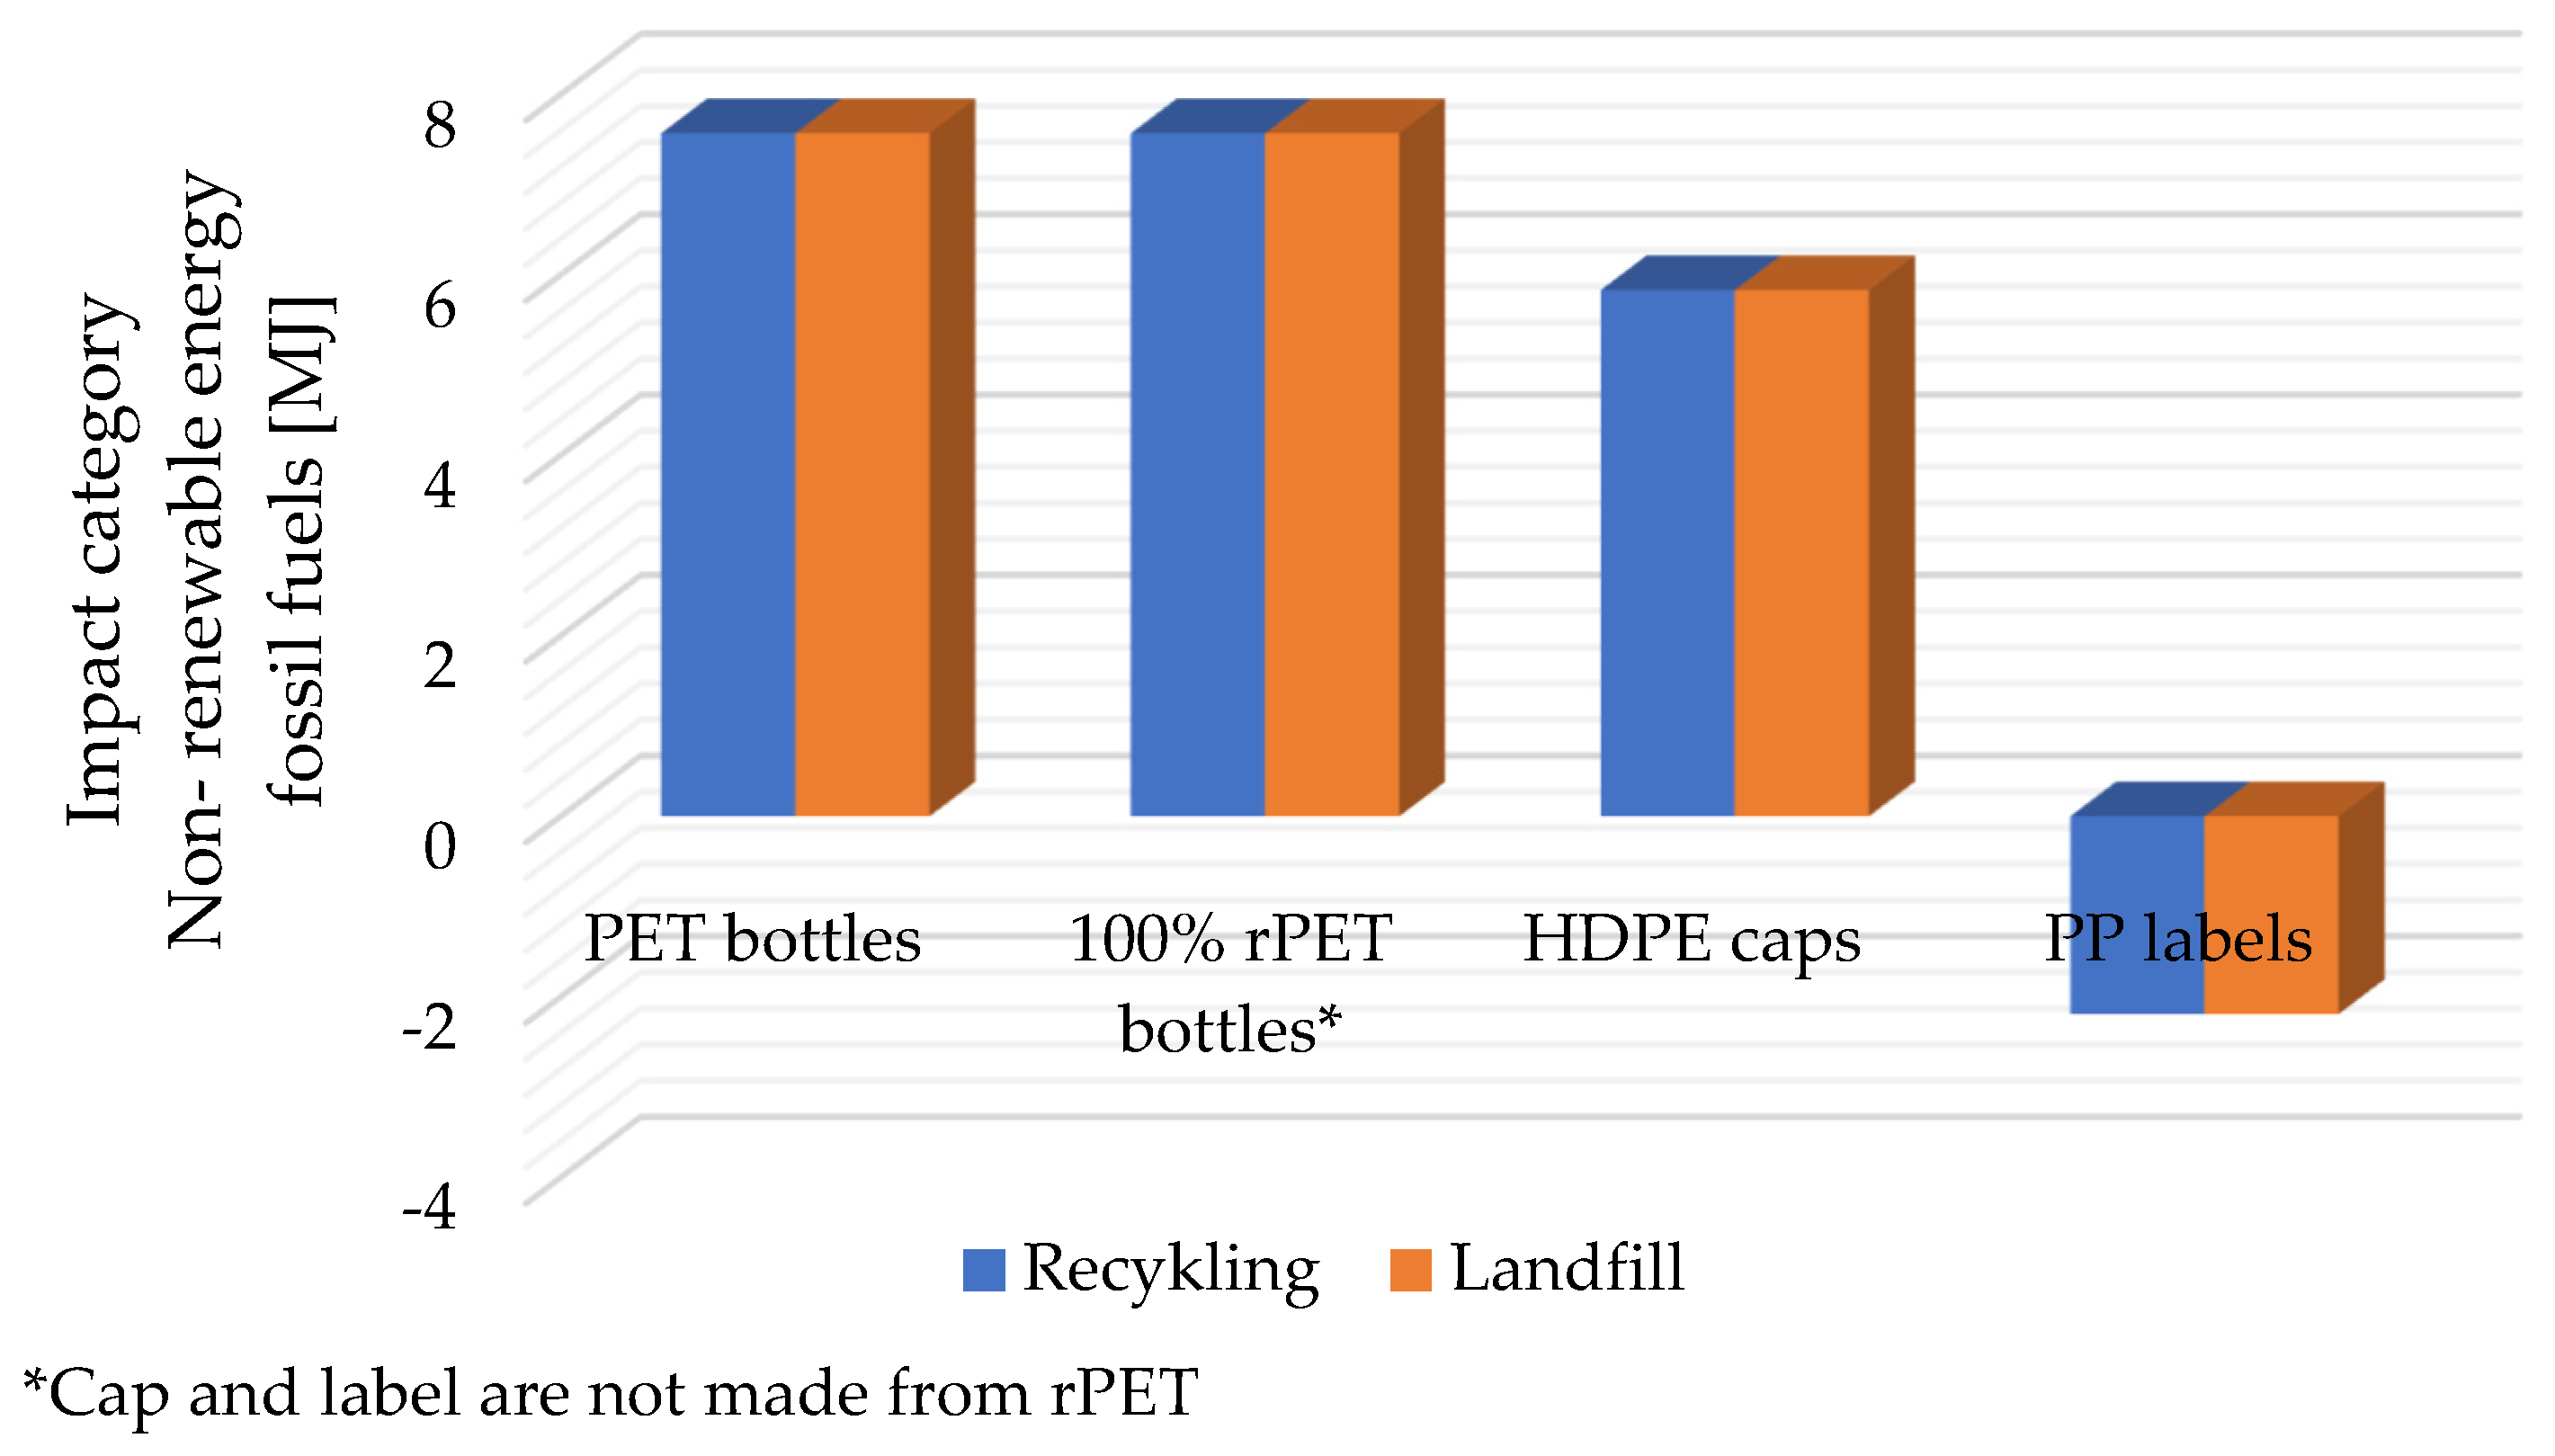
PET and rPET bottles showed almost identical fossil energy demand in both the recycling and landfill scenarios, indicating that, as modelled, end-of-life management had only a limited impact on this impact category (
Table 2;
Figure 7). In contrast, recycling PP labels resulted in negative CED values, indicating net primary energy savings through the recovery of secondary materials. In turn, PP labels stored in landfills generate the highest demand for fossil energy of all packaging components analyzed, which highlights the importance of material recovery. This suggests that recycling PP labels yields the greatest fossil fuel savings. The negative values observed for PP labels in the recycling scenario are a direct consequence of the substitution-based allocation approach applied in this study. Under the 1:1 substitution assumption, recycled material replaces virgin polymer production, and the avoided primary energy demand exceeds the energy required for the recycling process itself. Thus, the negative CED values represent net energy savings within the modeled system boundaries. However, landfilling these labels significantly increased the cumulative demand for primary energy (
Figure 7).
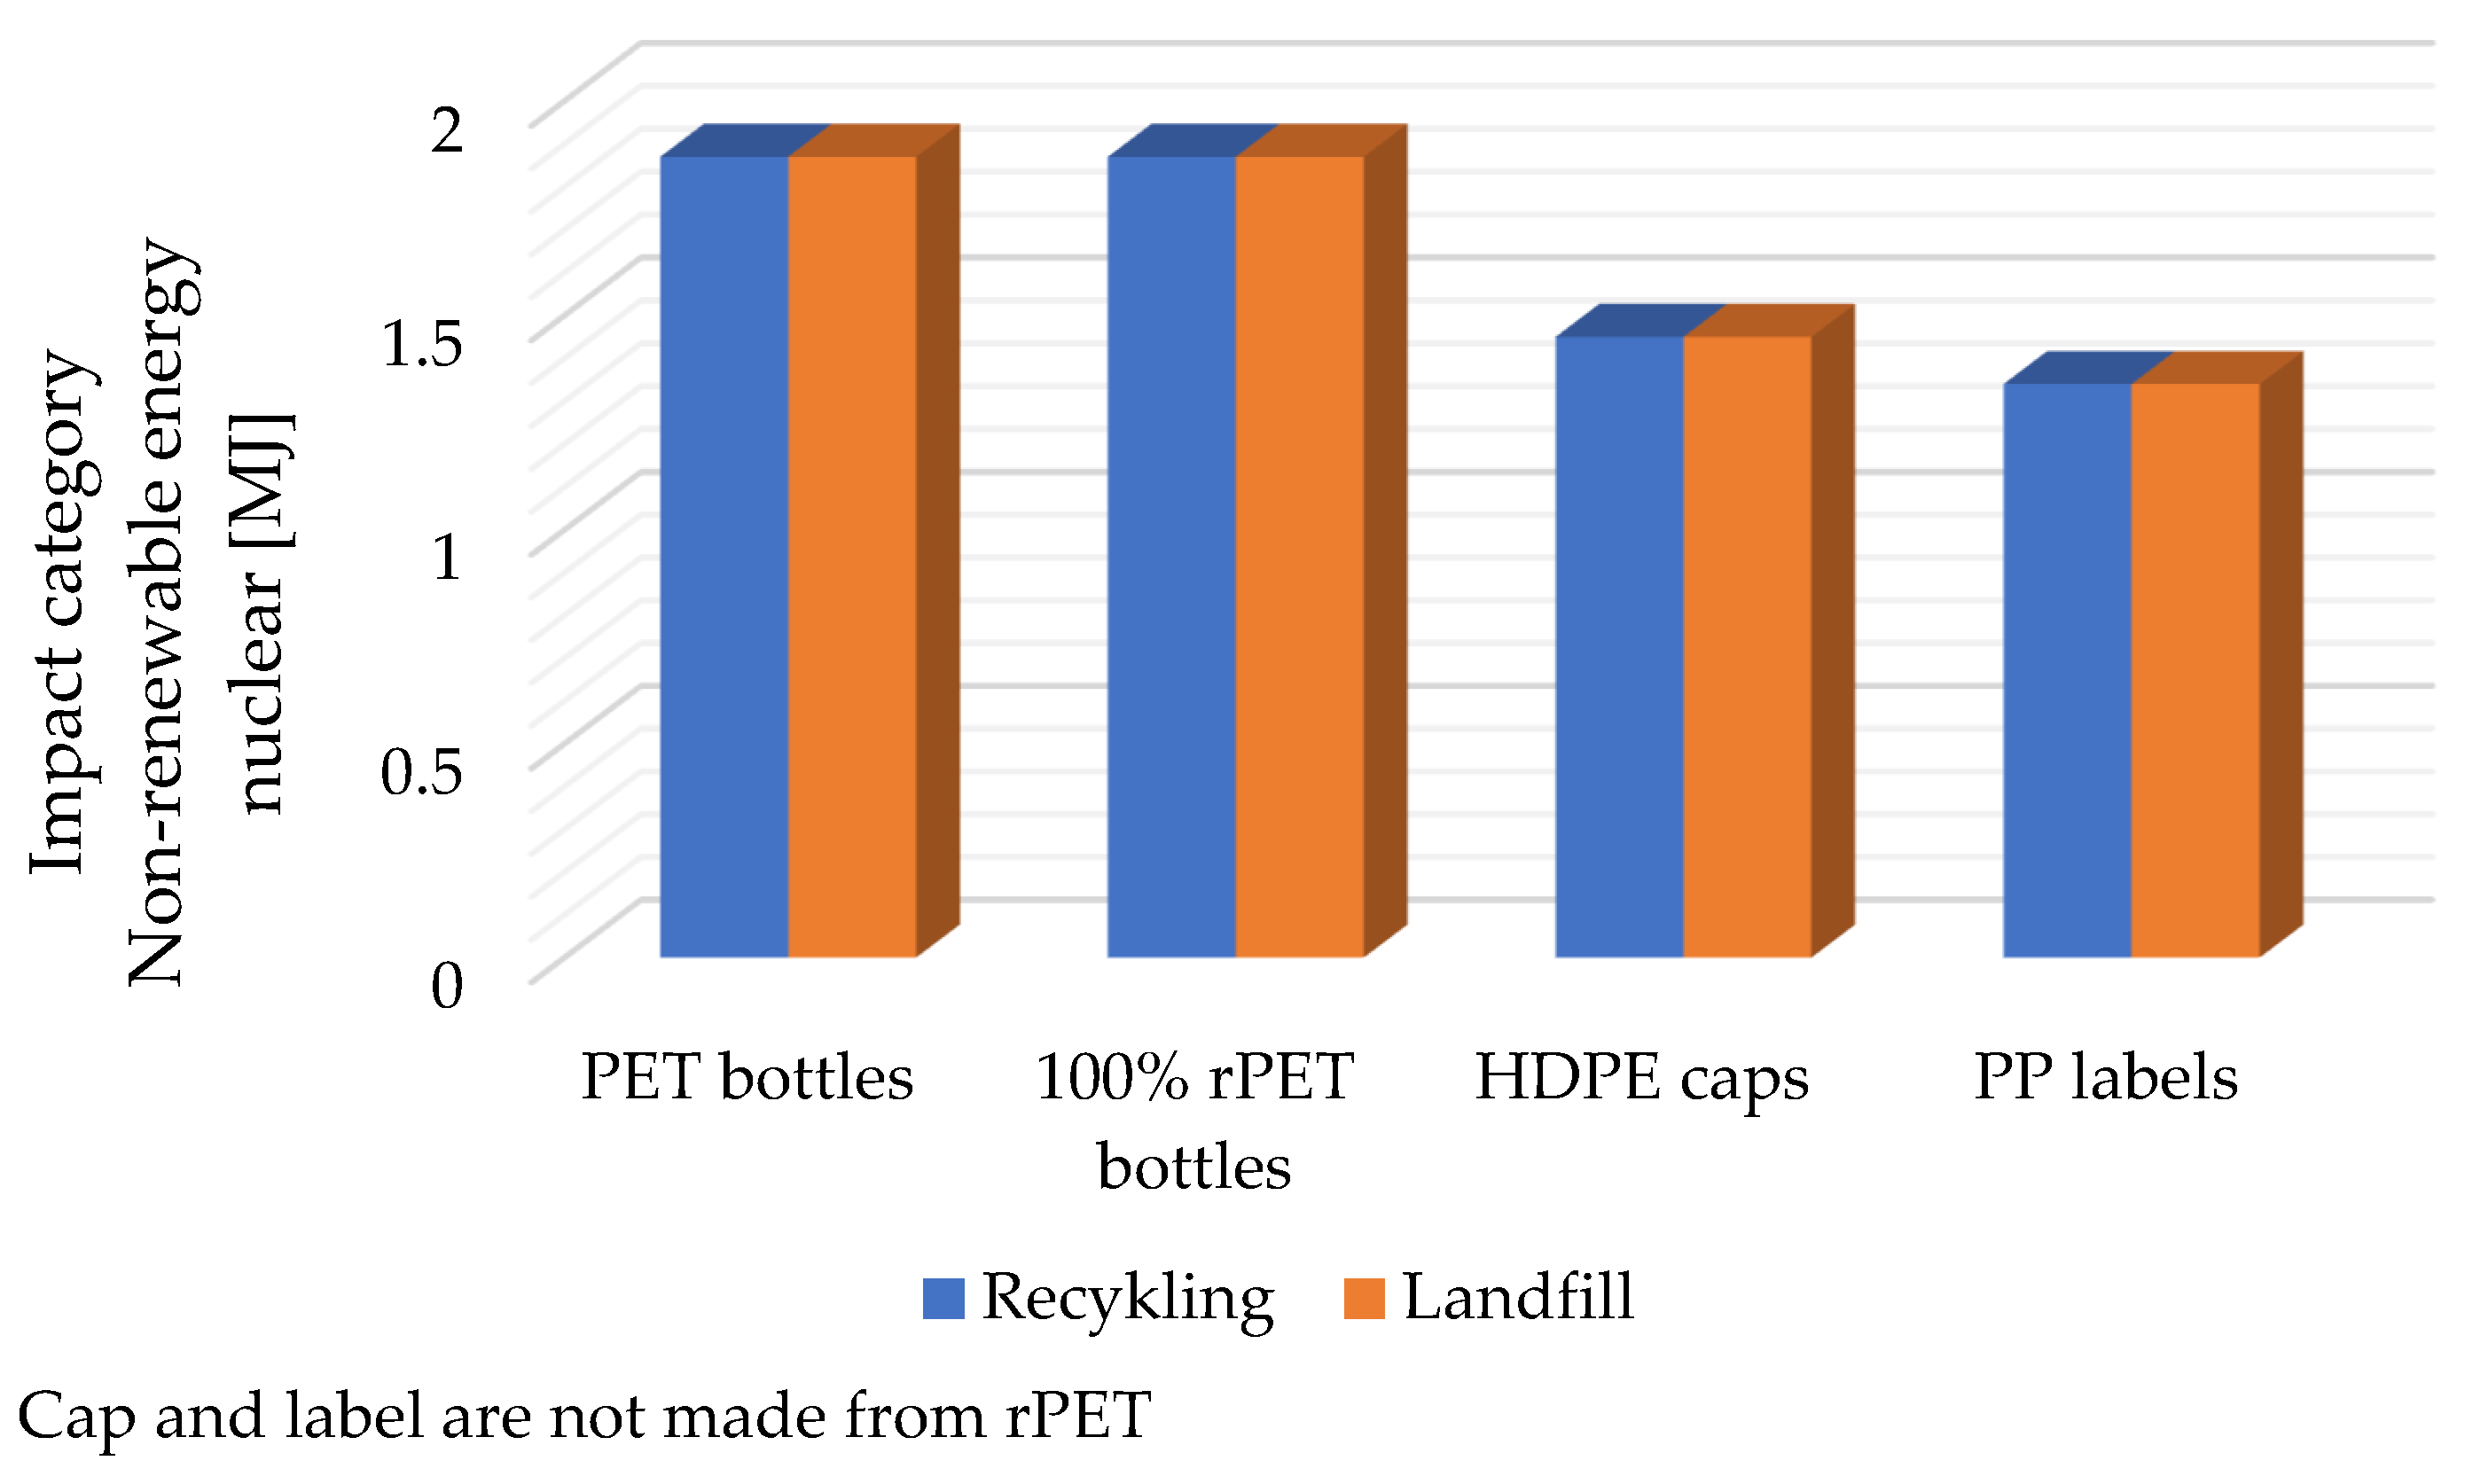
PET and rPET bottles showed identical nuclear energy demand in both recycling and landfill scenarios, indicating that end-of-life management had only a limited impact on this category under the modeling assumptions used (
Table 2;
Figure 8). Recycling polypropylene (PP) labels reduced the demand for nuclear energy, resulting from the net primary energy savings associated with replacing the virgin material. Landfilling, on the other hand, resulted in the highest demand for nuclear energy of all packaging components analyzed. The results indicate that recycling PP labels contributes to the largest reduction in cumulative nuclear energy demand, as illustrated in
Figure 8.
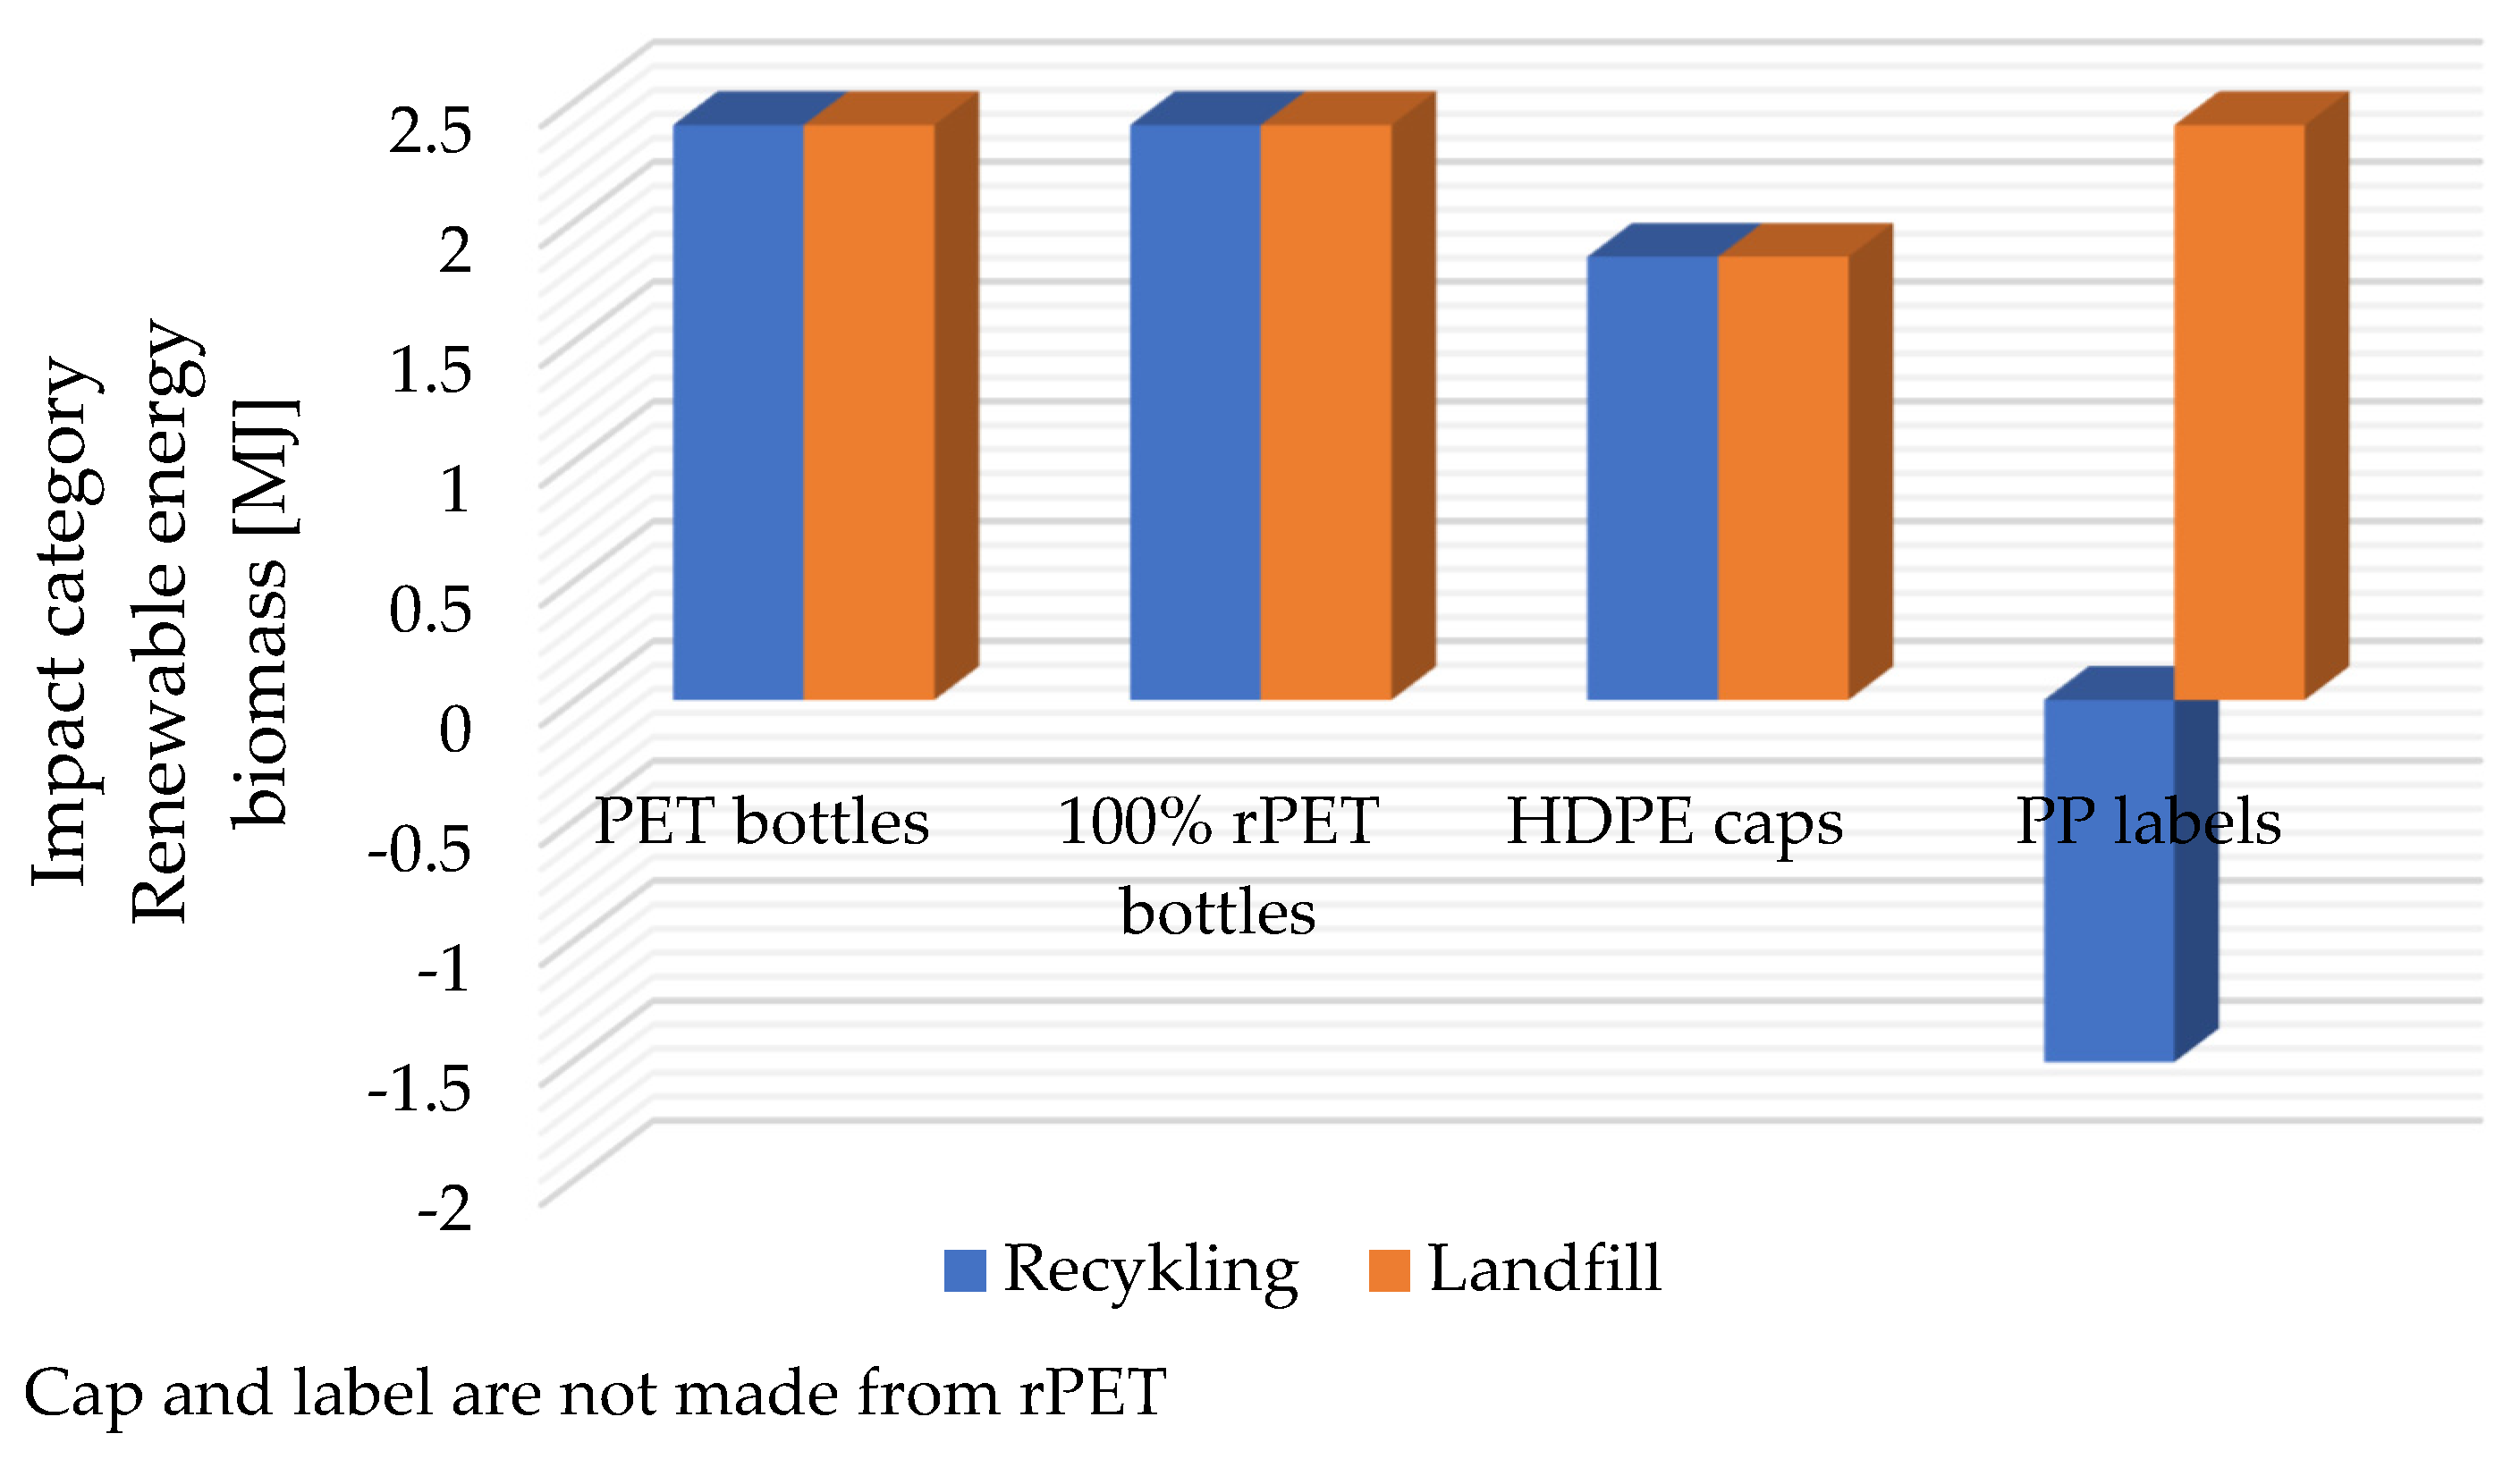
PET and rPET bottles showed the same demand for renewable biomass in both recycling and landfill scenarios. This indicates the limited sensitivity of this category to end-of-life management under the assumed model conditions. Recycling PP labels reduces the demand for renewable biomass, while landfilling increases it. These different approaches demonstrate different energy impacts at the end of the product life cycle. The results suggest that recycling PP labels saves on renewable biomass consumption by replacing virgin materials with secondary raw materials within a comprehensive system (
Figure 9).
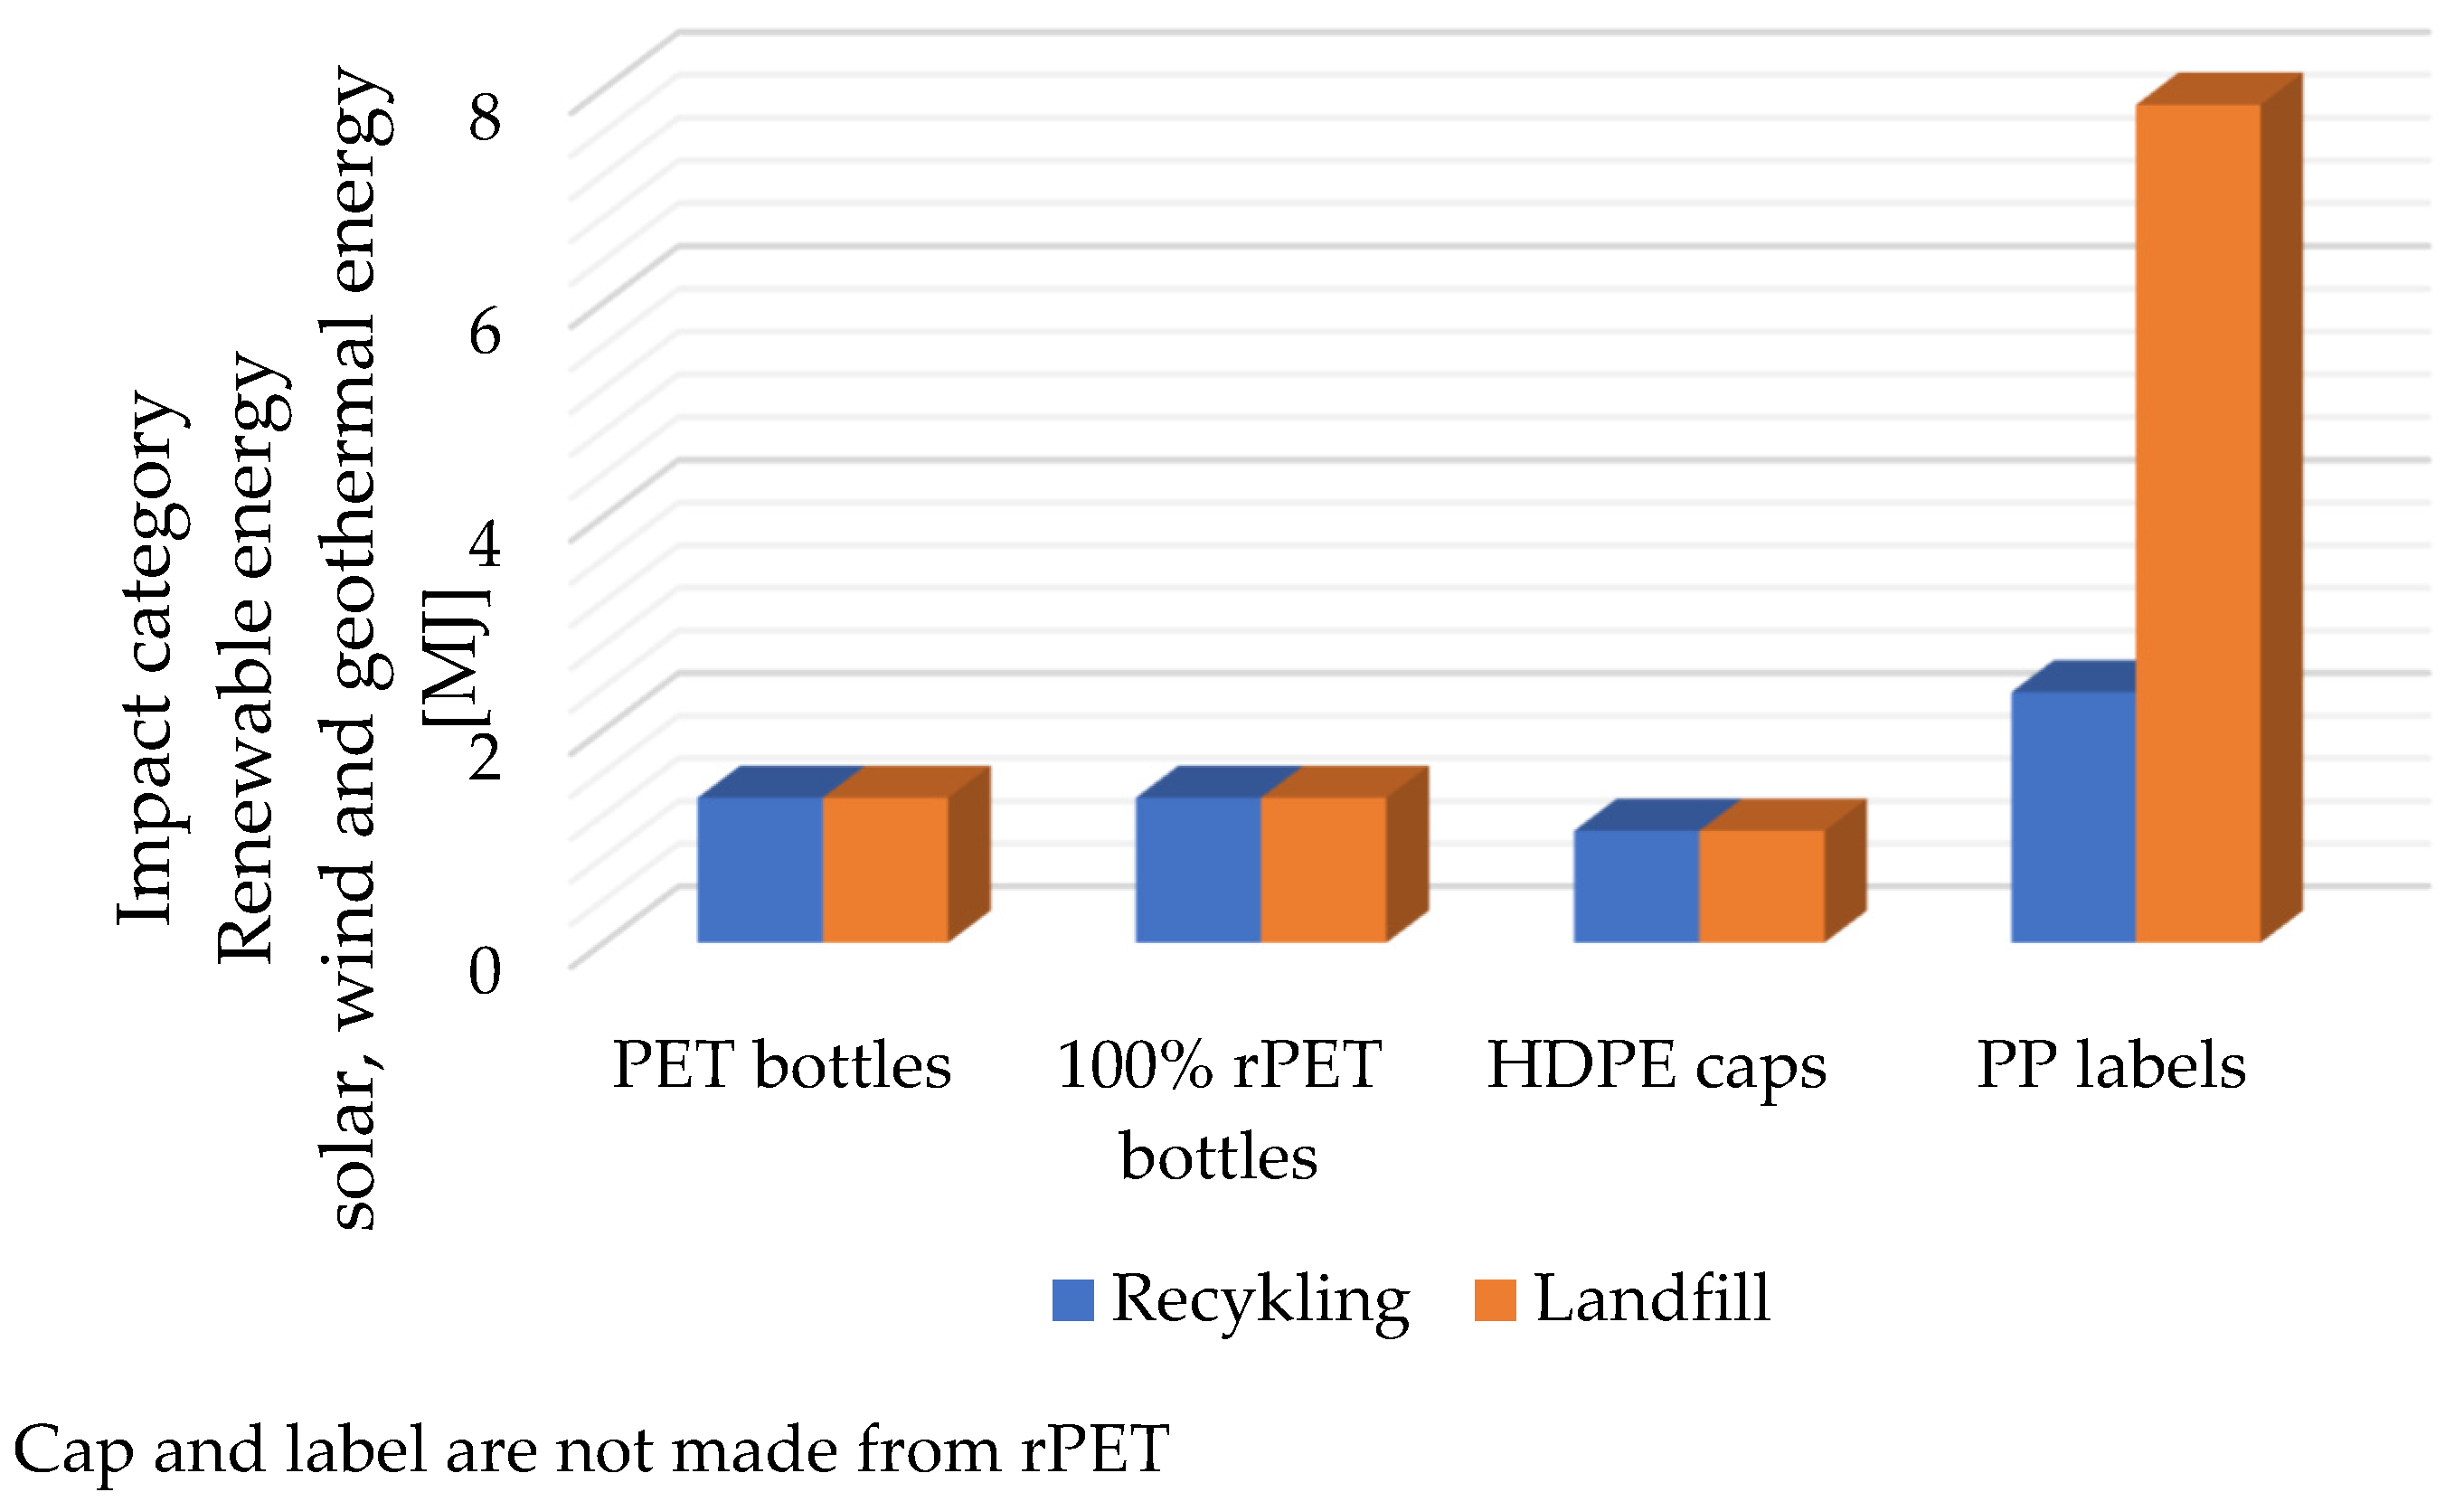
Most packaging components showed comparable cumulative energy demand from renewable solar, wind and geothermal energy sources, regardless of the end-of-life scenario. The exception is PP labels during storage: 7.85 × 10
−1 MJ—a very high impact compared to other packaging. These results indicate that landfill-bound PP labels significantly increase the cumulative demand for renewable solar, wind, and geothermal energy compared to recycling (
Figure 10). As in the previous categories, this difference is due to the substitution-based allocation approach adopted in this study (
Table 2).
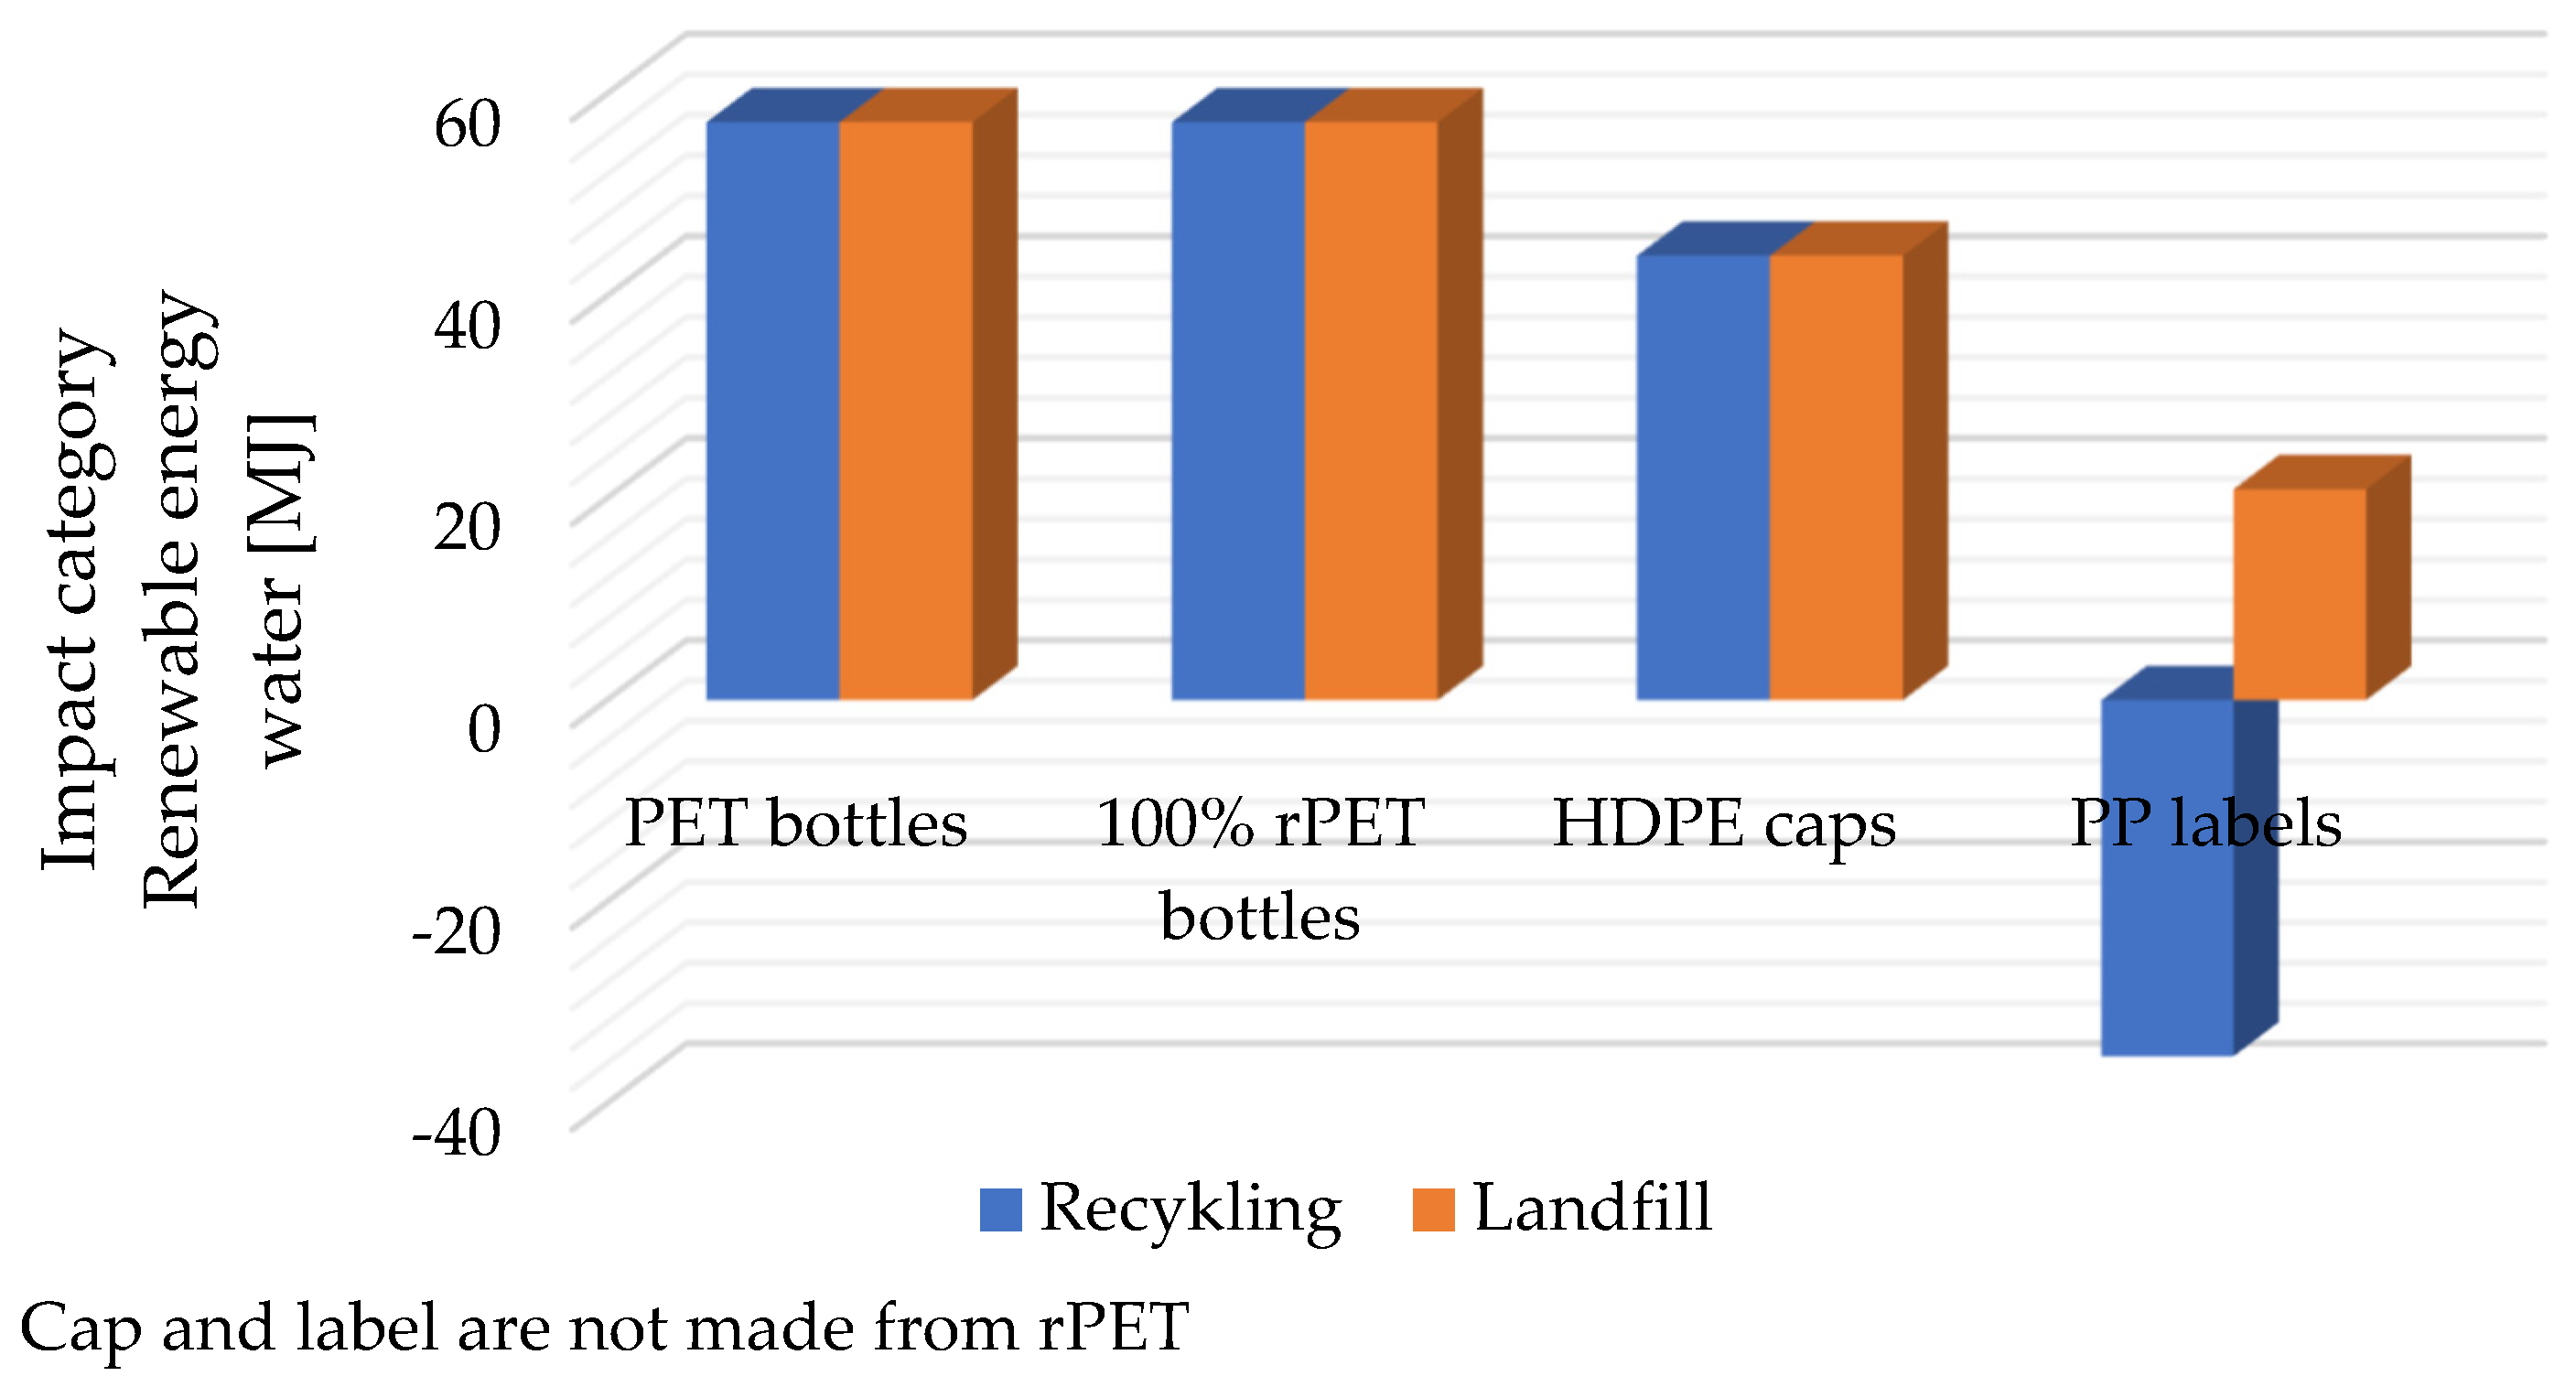
PET and rPET bottles showed identical cumulative hydropower demand in both end-of-life scenarios, indicating a limited impact of waste management strategies under the modeling assumptions adopted. In contrast, recycling PP labels resulted in negative cumulative energy demand, while landfill disposal generated positive values. These results further support the energy benefits of recycling under the substitution-based allocation approach adopted in this study (
Table 2;
Figure 11).
Based on the obtained research results, the following relationships can be identified:
PP labels are most environmentally friendly when recycled—they show the lowest (often negative) values in all raw material consumption categories, which indicates real environmental savings;
Landfilling PP labels has the worst impact—significantly increasing the consumption of fossil fuels, nuclear energy, and renewable energy;
PET and rPET bottles exhibited comparable CED values in both end-of-life scenarios. This observation is specific to the substitution-based allocation approach and the Polish energy mix adopted in this study and should not be generalized to other LCA models;
HDPE caps fare better than PET bottles in terms of lower raw material consumption, but not as well as PP labels.
In light of the presented data, it can be predicted that increasing the level of material recycling could significantly reduce the overall environmental impact of packaging in terms of fossil fuel, water, and energy consumption.
Overall, recycling consistently reduced cumulative energy demand compared to landfill across all CED categories analyzed. The greatest energy savings potential was observed for PP labels, while PET and rPET bottles showed comparable results using the substitution approach in this study. These results provide a basis for discussion of the methodological assumptions and implications for end-of-life management strategies for plastic packaging systems.
4. Discussion
The present results demonstrate that recycling consistently reduces cumulative energy demand relative to landfilling across all analyzed plastic packaging types. However, these results vary depending on the type of packaging material, the end-of-life scenario, and, above all, the methodological assumptions adopted in the life cycle assessment. This highlights the importance of considering the impact of packaging systems not only on the basis of material type but also in the context of the entire life cycle, taking into account waste management practices, electricity sources, and regional allocation procedures.
The reduction in cumulative energy demand in the recycling scenarios is consistent with the results of Ferrara et al. [
2], who demonstrated lower energy demand for systems based on PET recycling compared to landfilling. Singh and Walker [
8] emphasized that plastics recycling efficiency is strongly dependent on recyclate quality and recovery infrastructure. Discrepancies between results may be due to differences in allocation methods, system boundaries, energy mix, and assumptions regarding the quality of the recycled material, confirming that comparisons between LCA studies require caution.
Regional context is crucial for interpreting results. The life cycle inventory takes into account Polish conditions from 2022 to 2024, including the local energy mix and waste management infrastructure. Poland’s energy system, more dependent on fossil fuels than in many Western European countries, results in higher primary energy consumption for both virgin polymer production and recycling processes. These results are representative of the Polish circular economy, not all regions.
Although the absolute cumulative energy demand (CED) values reported in this study are sensitive to regional conditions, the overall ranking of the analyzed scenarios is expected to remain relatively robust. Variations in electricity generation mixes, transport distances, recycling efficiencies, and waste management infrastructure may influence the magnitude of the reported impacts and the differences between individual packaging components, particularly between PET and rPET. Nevertheless, under comparable technological conditions, recycling is generally expected to remain more energy-efficient than landfilling because material recovery reduces the demand for virgin polymer production. Therefore, the numerical results presented in this study should be interpreted as representative of Polish conditions, whereas the overall trends and engineering recommendations are considered applicable to regions with similar production and recycling systems.
4.1. Interpretation of Negative CED Values and Methodological Implications
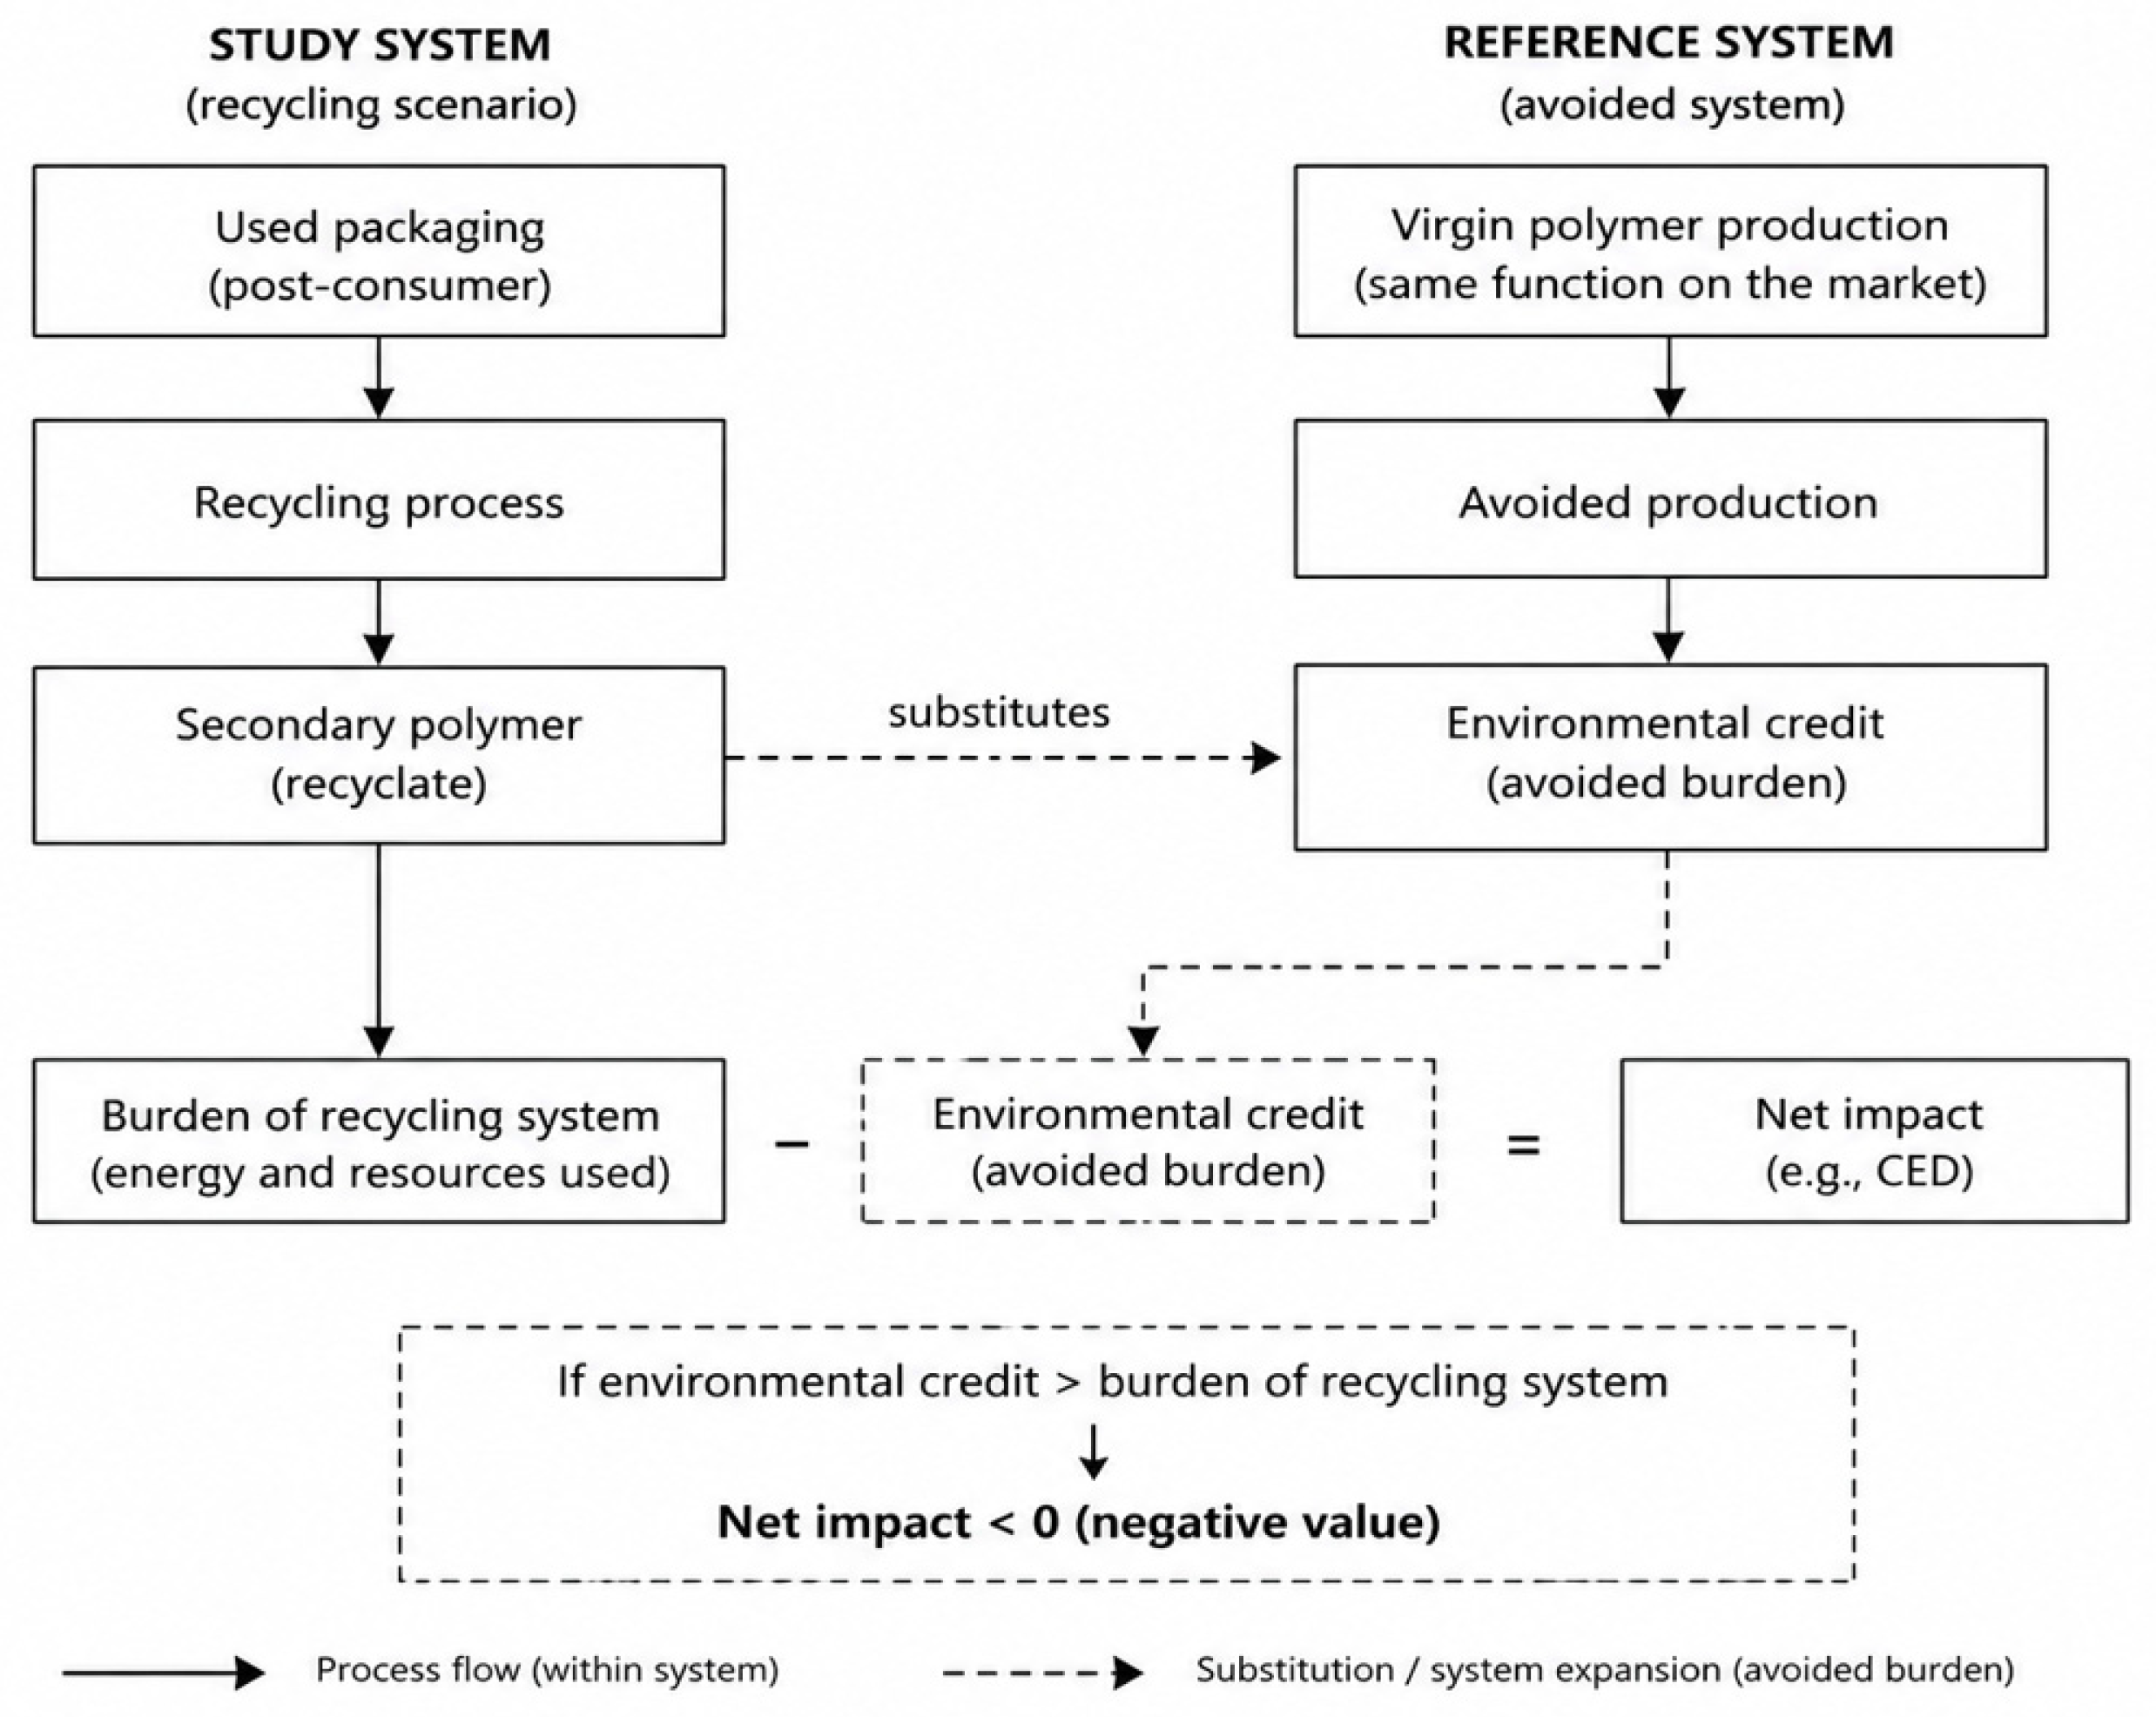
Figure 12 illustrates the principle of system expansion (avoided burden) adopted in the present study. In this approach, secondary polymer obtained through recycling substitutes functionally equivalent virgin polymer production, generating an environmental credit that is subtracted from the burdens associated with collection, sorting, and recycling. Consequently, when the avoided burden exceeds the burden of the recycling system, the resulting cumulative energy demand (CED) becomes negative. This mechanism explains the negative values reported for selected recycling scenarios.
Negative CED values were particularly observed for polypropylene (PP) labels, representing one of the most distinctive outcomes of the analysis. While these results may seem illogical at first glance, they do not imply actual negative energy consumption. Instead, they reflect the methodological principles of life cycle assessment (LCA), where recycled materials receive environmental credits by displacing virgin material production. These values, therefore, do not indicate direct energy savings, but rather avoided burdens.
Similar observations were noted in previous LCA studies using system expansion or substitution-based allocation. Conversely, studies using cutoff-based allocation often show reduced benefits because recycled materials are absorbed by subsequent systems without the allocation of credits resulting from avoided virgin production. The Circular Footprint methodology proposed in the EU Product Environmental Footprint model divides burdens and benefits across product life cycles, generating results intermediate between the substitution and cutoff approaches. These methodological differences demonstrate that meaningful comparisons between recycling scenarios require consistent allocation procedures.
The limited difference between PET and rPET primarily reflects the modelling assumptions adopted in this study rather than intrinsic material properties. Some publications report greater reductions in cumulative energy demand and greenhouse gas emissions for PET recycling compared to the results presented here. Such discrepancies are due to different modeling assumptions, including recycled material quality, substitution rates, collection efficiency, transportation distances, electricity structures, and system boundary definitions. In regions with low-carbon energy systems and efficient collection infrastructure, recycling typically yields greater benefits than those presented in this study. Accordingly, the reported differences should be interpreted within the methodological and regional context of the present assessment.
These findings highlight the importance of methodological principles in lifecycle analysis (LCA): appropriate allocation procedures are a key source of variability in comparative assessments of recycled materials. Therefore, transparent documentation of modeling assumptions is essential for the reproducibility of studies and reliable comparisons within studies supporting circular economy policies. Rather than aiming for uniform numerical values, future assessments should emphasize methodological consistency and make visible the impact of allocation choices on environmental performance outcomes.
4.2. Practical Applications Related to Packaging Design and Circular Economy Strategies
The study findings provide important conclusions about improving the sustainability of plastic packaging systems. Reduced energy demand during recycling confirms that material recovery should be the preferred end-of-life strategy when technically feasible. However, the analysis shows that environmental benefits are not uniform across different packaging components. Therefore, optimization efforts should encompass not only bottles but also smaller components such as caps and labels, which, although often overlooked, significantly contribute to overall system efficiency.
Polypropylene (PP) labels demonstrate the greatest potential for reducing energy demand in recycling scenarios. This suggests that small packaging components can generate significant environmental benefits if effectively recovered and reintroduced into production. Similar observations have been demonstrated in studies that emphasize that improving the recyclability of all packaging components, not just the main body, increases resource efficiency and the quality of secondary raw materials. In eco-design, this emphasizes the importance of selecting compatible materials, facilitating label separation, and improving sorting technologies for the recovery of lightweight polymer fractions.
Analysis of PET and rPET bottles requires further consideration. Although the differences in energy requirements are small according to the assumptions of this study, this does not diminish the environmental value of rPET. The environmental potential of rPET is related to pre-cyclical factors, such as the availability of high-quality recyclate and the efficiency of collection and production of secondary materials. Previous studies show that increasing the recycled content in PET packaging reduces dependence on virgin fossil resources and reduces energy demand throughout the entire life cycle. Strategies that promote high-quality bottle-to-bottle recycling are crucial to achieving circular economy goals. The analysis of HDPE caps highlights that improving recycling efficiency cannot be based solely on material selection. Environmental performance is linked to collection systems, sorting efficiency, and recycling technology that enables the production of high-quality secondary materials. These findings support the need for concerted technological, organizational, and policy actions to achieve higher collection rates and maintain material quality throughout the recycling process. These results are consistent with previous analyses indicating that the environmental performance of HDPE recycling depends largely on collection efficiency, contamination levels, and the quality of secondary material sorting Singh and Walker [
8], Ragaert et al. [
10], In summary, these results support the implementation of integrated circular economy strategies that combine eco-design, efficient collection systems, and advanced recycling technologies, as well as the increased use of recycled polymers in new packaging developments. Future packaging systems should be designed as integrated material systems, where each element contributes to efficient resource use, closing the material life cycle, and reducing the use of virgin fossil resources. Such a systemic perspective is increasingly recognized as crucial for achieving the long-term sustainability goals set in European circular economy policy.
4.3. Study Limitations, Robustness of Results, and Perspectives for Further Research
Although this study provides valuable information on the energy requirements associated with various end-of-life scenarios for plastic packaging, certain methodological limitations must be considered when interpreting the results. The first is the use of deterministic life cycle assessment (LCA) modeling, which means that the results reflect specific scenarios rather than probabilistic distributions of environmental performance. Therefore, the Cumulative Energy Demand (CED) values should be considered as benchmarks based on the modeling assumptions used, rather than absolute measures applicable under all circumstances.
However, the robustness of the conclusions was strengthened by a sensitivity analysis of key energy-related parameters. We found that changes in energy requirements associated with virgin polymer production and recycling processes did not affect the ranking of the considered waste management scenarios, confirming that recycling is preferable to landfilling. This finding increases confidence that the observed trends are not driven by individual values but rather reflect broader relationships between production and material recovery.
Despite this robustness, LCA studies often suffer from sources of uncertainty. These considerations underscore the importance of transparency in model development and caution when comparing figures from different studies.
These differences do not invalidate our conclusions; on the contrary, they confirm that environmental assessments should be considered in a geographical and technological context, and that regional inventories remain crucial for making informed decisions.
Based on these findings, the following recommendations for sustainable packaging design can be proposed (
Table 3):
Among the analyzed packaging components, the rPET bottle exhibited the lowest cumulative energy demand. Compared to a conventional PET bottle, it reduces the environmental impact by approximately 13%. However, the practical implementation of rPET packaging is strongly dependent on the availability and quality of recycled polymer feedstocks. The supply of high-quality rPET is influenced by manufacturing practices, efficiency of collection and sorting systems, regulatory requirements (especially for food-contact applications), and consumer participation in selective waste collection. Previous studies report limited availability of high-quality post-consumer rPET together with variability in its mechanical and chemical properties, restricting its application in food packaging [
8,
10,
18,
25]. Therefore, while the use of rPET should be promoted wherever feasible, its environmental benefits can only be fully realized under well-functioning recycling systems and stable supply chains that ensure sufficient quantity and quality of recycled materials, consistent with circular economy principles.
Avoiding PP labels: Polypropylene (PP) labels generate the greatest cumulative energy demand among the analyzed packaging components, primarily due to high cumulative energy demand. However, the selection of alternative label materials should be based on their overall life cycle performance rather than material type alone. The production of paper labels, for example, may involve high energy and water consumption, particularly for highly processed or coated paper grades [
18,
25]. Therefore, alternatives to PP labels—such as low-processed paper from certified sources or selected bio-based films—should only be considered when they demonstrably improve recyclability of the main packaging material and reduce total life cycle impacts. The primary objective should be to optimize label design and material compatibility within existing recycling systems, rather than to promote unconditional material substitution [
8,
10,
25].
Minimizing the impact of transportation: Transportation-related impacts are strongly influenced by the organization of manufacturing and recycling systems for individual packaging components. In many regions, PET preforms, HDPE caps, and labels are produced in centralized facilities and transported over long distances to bottling plants, while bottle recycling facilities may operate at regional or national scales. As a result, transportation to the production plant and transport to end-of-life treatment facilities can constitute a significant share of cumulative energy demand.
Table 3.
Proposals for actions to reduce the negative impact of the tested packaging made of polymer materials on the environment.
Table 3.
Proposals for actions to reduce the negative impact of the tested packaging made of polymer materials on the environment.
| Area | Action | Potential Effect |
|---|
| Packaging Design | Reduce bottle mass while maintaining mechanical integrity | Reduced material use and lower production-related emissions |
| Recycling | Maximize food-grade rPET content where available | Reduced demand for virgin polymers; lower CED under well-functioning recycling systems |
| Transport | Optimization of supply chains considering regional manufacturing and recycling infrastructure | Reduced transport distances and fossil fuel consumption |
| Labels | Optimization of label design and material compatibility with recycling systems | Improved recyclability of the main packaging material; potential reduction in life cycle impacts |
| Deposit/return systems | Implementation or expansion of return and recycling schemes | Higher collection rates, improved material recovery, reduced landfill disposal |
Therefore, optimizing supply chains should account for regional manufacturing practices and infrastructure. Decentralized or regional production of preforms, caps, and labels, where technically and economically feasible, as well as improved availability of local or regional bottle recycling facilities, can reduce transport distances and associated emissions. The effectiveness of returnable systems and recycling schemes also depends on region-specific collection rates, logistics efficiency, and regulatory frameworks, which vary globally [
8,
10,
18,
25].
5. Conclusions
This study advances current knowledge by providing a component-level life cycle assessment of the cumulative energy demand associated with plastic beverage packaging under alternative end-of-life scenarios. Using the Cumulative Energy Demand (CED) method within the LCA framework, the present study provides a robust assessment of the energy performance of PET bottles, recycled PET (rPET) bottles, HDPE caps, and polypropylene (PP) labels. This complements previous work, which has primarily focused on entire packaging systems or individual materials.
The study results indicate that recycling is the most energy-efficient strategy for all packaging components studied, significantly reducing primary energy demand compared to landfill disposal. The greatest energy savings potential was observed for polypropylene labels, suggesting that even small components can have a significant impact on the overall energy efficiency of packaging systems. These findings underscore the need to consider every component in ecodesign strategies, rather than focusing solely on larger packaging components.
The analysis further indicates that the relatively small differences between PET and rPET bottles should be considered in the context of the methodology adopted in the LCA model. Using an allocation approach based on substitution and taking into account regional energy conditions, both materials exhibited similar cumulative energy demand profiles. Therefore, general conclusions regarding the environmental impact of polymer recycling cannot be drawn without considering the methodological assumptions, allocation procedures, electricity production structures, and recycling system efficiency. This observation highlights the need for transparent reporting of methodologies to enable reliable comparisons between LCA studies.
The present findings demonstrate that achieving sustainable plastic packaging requires a systems-oriented approach that extends beyond material substitution alone. Reducing cumulative primary energy demand requires the simultaneous optimization of packaging design, material selection, collection efficiency, sorting technologies, recycling infrastructure, and the availability of high-quality secondary raw materials. Accordingly, the transition towards circular packaging systems should be regarded as an integrated technological and organizational process rather than a simple material substitution strategy.
The practical implications of these findings are particularly relevant for packaging manufacturers, recycling industries, and policymakers responsible for implementing circular economy strategies. The research provides evidence for the need to focus on closed-loop recycling systems, improving the recovery of lightweight components, and designing packaging that supports efficient material separation and the production of high-quality recyclate. These efforts can significantly reduce dependence on virgin fossil resources while improving resource efficiency throughout the packaging value chain.
However, this study has some limitations that should be considered when interpreting the results. Primarily, the assessment focused on cumulative energy consumption and does not reflect the full environmental profile of packaging systems. Other environmental impact categories, such as climate change, particulate matter formation, human toxicity, and ecotoxicity, were not part of the analysis. Furthermore, a deterministic LCA model with regional data and a substitution approach was used. Therefore, the results depend on the adopted methodologies and may not be directly transferable to regions with different energy mixes or recycling infrastructure.
Future research should expand the current framework by incorporating multi-criteria life cycle assessment, including additional environmental impact categories, uncertainty and sensitivity analyses, and scenario modeling to improve the robustness and comprehensiveness of environmental evaluations. Furthermore, future studies should integrate environmental assessment with techno-economic analysis, circularity metrics, and policy analysis to identify environmentally sound, economically viable, and regionally appropriate pathways for increasing the use of recycled materials. Particular attention should also be given to the development of quantitative eco-design guidelines by assessing the environmental benefits of lightweighting strategies, including different levels of material reduction (e.g., bottle wall thickness or component mass reduction), and evaluating their effects on cumulative energy demand, recyclability, and overall environmental performance within an LCA framework.
In summary, this study demonstrates that reducing the cumulative energy demand of plastic packaging requires an integrated engineering approach encompassing material selection, packaging design, collection logistics, sorting technologies, and recycling processes. In addition to confirming the benefits of recycling, the results provide quantitative evidence that can support engineering decisions during the design and optimization of plastic packaging systems. By identifying packaging components and life cycle stages with the greatest energy savings potential, the study offers practical guidance for developing more resource-efficient packaging solutions and improving the performance of recycling systems. Therefore, the proposed life cycle analysis (LCA) framework provides a valuable engineering tool to support evidence-based design strategies and accelerate the transition to sustainable and circular plastic packaging systems.