1. Introduction
An accident is defined as an event that may occur at any time due to misconduct or negligence, resulting in adverse effects such as loss of life or property [
1]. Unforeseeable events occurring on the road that result in various losses are defined as traffic accidents [
2]. Road traffic accidents represent a major social problem on a global scale, resulting in loss of life, injury and significant economic losses [
3,
4]. The population growth and migration that have occurred in recent decades have resulted in an increase in the number of people living in urban areas and rising urbanization rates. It has led to an increase in the number of vehicles on the roads. The increasing intensity of road transport, coupled with the widespread use of private vehicles, is resulting in an escalating daily toll from traffic accidents [
5]. Such incidents have twofold consequences, encompassing physical and psychological repercussions for individuals. They also impose a substantial strain on health systems, the insurance sector and public resources, particularly with regard to psychological effects. Consequently, the precise analysis of traffic accidents, the mitigation of accident risks and the development of safer transport systems are of critical importance for both academic and applied research [
6].
Conventional traffic accident analysis methodologies are predominantly predicated on human observation, accident reports compiled post-event, and a restricted number of quantifiable parameters. These approaches encompass information such as the characteristics of the vehicles involved in the accident, driver statements, and physical traces at the scene [
7]. However, the manual assessment of accident images is time-consuming, difficult to standardize, and potentially subjective because the resulting evaluation may depend on the experience and judgment of the assessor. These limitations become particularly important when large collections of accident images must be examined consistently and efficiently. Therefore, automated image-classification methods capable of extracting visual damage patterns and applying uniform classification criteria may provide useful support for post-accident damage assessment. Nevertheless, image-based approaches relying on single static frames are limited to the visible post-event appearance of the vehicle and cannot represent the temporal dynamics of the collision. Moreover, the manual examination of visual data obtained from environmental and in-vehicle cameras at the time of the accident is time-consuming. Furthermore, the manual examination of videos can yield subjective outcomes contingent on the experience and perception of the individual conducting the assessment. This underscores the necessity for expeditious, impartial, and automated analysis techniques. At this stage, deep learning-based image processing methods have emerged as a powerful alternative for analyzing traffic accidents. Rapid advancements in the domain of artificial intelligence, particularly in the field of deep learning (DL), have rendered image processing-based applications effective across a multitude of fields [
8]. These methodologies, which have yielded successful results in domains such as healthcare, defense, security and industry, are also being employed in transport systems with increasing frequency. A plethora of applications have been developed within the domain of intelligent transportation systems (ITSs) for various purposes, including traffic management, traffic safety, incident detection and decision support mechanisms. In this transformation process, the automatic detection, analysis and classification of traffic accidents have become fundamental components of intelligent transportation systems [
9]. Advances in imaging technologies have enabled the acquisition of camera footage of traffic accidents from multiple sources. A variety of platforms, including roadside surveillance cameras, junction-monitoring systems, in-vehicle cameras, driver assistance systems and unmanned aerial vehicles, generate substantial amounts of visual data captured from multiple angles. However, the conversion of these extensive datasets into meaningful information is significantly constrained by conventional image processing techniques. DL-based object and classification methods are employed at this step, thereby facilitating the automatic detection and analysis of objects within complex traffic movements [
10]. Convolutional neural networks (CNNs) have been shown to be particularly successful in the analysis of traffic incidents due to their capacity to effectively learn structures within images [
11]. CNN tools have the capacity to automatically detect and classify vehicles, pedestrians, road infrastructure elements, and objects specific to accident scenarios. The capacity of these DL-based approaches extends beyond the mere identification of object presence. Furthermore, they are capable of analyzing the relationships between objects, collision scenarios, and accident dynamics. Consequently, accident images transition from passive records of events to valuable data sources, enabling the extraction of inferences concerning the nature, magnitude, and potential causes of the incident.
The analysis of vehicle accident footage using DL methods has significant real-world applications that extend beyond the confines of academia [
12]. The enhancement of traffic safety is recognized as a fundamental objective of these applications. The advent of real-time and near-real-time operating systems has enabled the automatic detection of accidents and the expeditious notification of the relevant emergency response units. This contributes to reducing the risk of injury and loss of life by reducing the time taken to reach the scene. Moreover, the automated analysis of accident scenes has the potential to empower emergency response teams with prior knowledge regarding the nature and magnitude of the incident. Furthermore, the implementation of DL-based accident analysis systems has the potential to offer substantial advantages for the insurance sector [
13]. The automatic evaluation of accident images is imperative for the expeditious and objective conduct of damage assessment processes. This can engender greater transparency and fairness in insurance assessment mechanisms. In fatal or injury-causing traffic accidents, it can also be used effectively in areas such as potential legal implications and expert witness activities. Moreover, the long-term analysis of large-scale accident data facilitates the identification of hazardous road sections, the detection of hotspots in the traffic infrastructure, and the development of preventive policies. Analyses of this nature provide data-driven approaches that support not only post-accident interventions but also measures that can be taken before accidents occur. In addition to the potential gains in the field of traffic engineering, the analysis of vehicle accident footage using DL methods will also provide significant benefits for automotive engineering.
This study aims to analyze vehicle accident images using deep learning-based image classification methods. The primary objective is to classify accident severity levels from visual data and evaluate the performance of different CNN architectures for this task. The findings are expected to provide useful insights for intelligent transportation systems, traffic safety applications, and automated accident assessment frameworks. A review of the existing literature reveals that approaches generally focus solely on either the object detection or classification problem. However, given the complexity of traffic accidents involving numerous objects and interactions, a more comprehensive approach is needed. Consequently, it is anticipated that this will enhance the existing body of literature on DL-based accident analysis from a methodological perspective while providing more functional, scalable solutions for application-oriented systems. This is also of great significance for autonomous systems, which are prominent in the current era. Identifying objects for autonomous driving perception systems is a fundamental challenge, especially in complex urban scenarios where targets are obscured [
14]. The findings obtained are expected to provide valuable insights into intelligent transport systems, traffic safety applications, and autonomous driving support systems that are currently under development. Rather than proposing a new deep learning architecture, this study provides a systematic benchmark of widely used CNN models and examines how architectural complexity influences accident damage classification performance. It should be clarified that the present work targets the post-event visual assessment of damage severity from single static images; it does not model the temporal evolution or physical dynamics of the collision. Accordingly, the results should be interpreted as image-based assessments of visible damage, while the incorporation of temporal information through video sequences remains an important direction for future research.
The main contributions of this study can be summarized as follows:
A comprehensive benchmark of widely used CNN architectures (AlexNet, SqueezeNet, ResNet-18, and ResNet-50) is presented for multi-class vehicle accident damage classification.
The influence of network depth and architectural complexity on classification performance is systematically evaluated using the CADD dataset.
A comparative analysis is conducted using multiple performance metrics, including accuracy, precision, recall, and F1-score, to identify the best-performing architecture for accident damage assessment.
The findings provide practical insights for the selection of deep learning models in intelligent transportation system applications involving automated accident image analysis.
Although previous studies have mainly focused on object detection or damage segmentation, comparative evaluations of CNN architectures with different depths for multi-class accident severity classification remain limited. Therefore, this study systematically compares several CNN models under identical experimental conditions using the CADD dataset.
The structure of the present study is as follows: In the second section, a detailed examination of the existing literature on the subject is conducted, and the methods employed and the findings obtained are subjected to comparative evaluation. In the third section, the dataset utilized in the study, the pre-processing steps, and the theoretical basis of the proposed methods are elucidated. The fourth section is devoted to the presentation of experimental studies that were conducted, the performance metrics that were utilized, and the results that were obtained. In addition, comparative analyses of different methods are provided. The fifth section of this study provides a comprehensive discussion of the experimental results, offering a concise summary of the study’s overall findings. It also addresses the limitations encountered during the research process and puts forward several suggestions for future research directions.
2. Literature Review
The analysis of traffic accidents has long been a significant area of research in the fields of transport and traffic safety. Early studies examined the impact of driver demographics and road characteristics on the occurrence and severity of accidents. Abdel-Aty and Radwan (2000) demonstrated that novice drivers are more prone to traffic accidents, particularly under challenging driving conditions [
15]. Furthermore, researchers have concentrated on identifying accident black spots and high-risk road sections by analyzing the spatial and temporal distribution of accidents [
16,
17,
18,
19,
20,
21]. A variety of statistical approaches, including Poisson and negative binomial regression models, have historically been utilized for the prediction of accidents and the modeling of accident severity [
22,
23,
24]. Statistical approaches such as logistic regression, multinomial logit, ordered probit, and related probabilistic models have also been widely employed to analyze injury severity across different road-user and crash types [
25,
26,
27,
28,
29,
30,
31,
32,
33].
In recent years, machine learning techniques have seen increased adoption in the field of accident analysis, severity estimation, and risk prediction. Fan et al. (2019) investigated the multi-source influencing factors involved in accident black spot formation using machine learning approaches [
34]. Iranitalab and Khattak (2017) [
35] conducted a comparative analysis of multinomial logit, nearest neighbor classification, support vector machine, and random forest models for crash severity prediction. Their findings indicated that the nearest neighbor classification model exhibited optimal performance in terms of predicting severe crashes [
35]. Other studies have employed classification trees, Bayesian networks, Bayesian neural networks, and comparative machine-learning frameworks for injury-severity prediction, generally reporting advantages over conventional statistical approaches in complex and nonlinear settings [
36,
37,
38,
39,
40,
41]. Theofilatos (2017) incorporated real-time traffic and weather variables to investigate accident likelihood and severity on urban arterial roads [
42]. In a similar manner, Theofilatos et al. (2019) evaluated several machine learning and deep learning approaches and concluded that deep learning methods offer superior predictive capabilities for complex traffic-related problems [
43]. As demonstrated by Ren et al. (2018), the capacity of long short-term memory (LSTM) networks to identify both short-term and long-term accident risks was further substantiated [
44]. A collective analysis of these studies suggests that machine learning approaches offer enhanced flexibility and predictive capability when compared with conventional statistical techniques.
Beyond the realm of traffic engineering applications, the analysis of accidents and the assessment of deformation are of considerable importance in the automotive industry. Chen et al. (2019) developed a methodology for characterizing impact load conditions and determining inelastic deformation states of shell structures that is based on deep learning [
45]. Garcke and Iza-Teran (2017) underscored the significance of accident image analysis in evaluating deformation effects during the design and development of products for automobile manufacturing [
46]. In the context of electric vehicles, Li et al. (2024) employed machine learning techniques to assess battery safety under collision scenarios [
47]. In a similar vein, Ma et al. (2025) proposed a ResNet-based framework for reverse-engineering collision conditions using pre- and post-collision images, thereby demonstrating the efficacy of deep learning for structural deformation analysis [
48].
Given the increasing availability of image data, deep learning-based approaches have become important for vehicle damage assessment, with early studies focusing primarily on image classification using transfer learning and convolutional neural networks. Patil et al. developed one of the earliest deep learning-based vehicle damage classification systems using transfer learning. A comparative analysis of several pretrained convolutional neural network architectures was conducted, and it was reported that ResNet achieved the highest classification accuracy (88.24%), outperforming VGG, AlexNet, and Inception models. An ensemble strategy was employed to further enhance the accuracy to 89.53% [
49]. In their 2020 study, Zhang et al. advanced an enhanced Mask R-CNN framework for the automated identification and delineation of vehicle damage. The authors employed transfer learning in conjunction with a customized dataset comprising 2000 vehicle damage images. This approach enabled the optimization of the backbone network, anchor settings, and loss function, thereby enhancing the segmentation performance. Their model demonstrated an AP value of 0.83 and outperformed conventional Mask R-CNN in terms of both detection accuracy and mask accuracy, thereby substantiating the efficacy of instance segmentation approaches for vehicle damage assessment [
50].
Subsequent studies have further expanded the application of deep learning techniques to automated damage detection. For example, van Ruitenbeek and Bhulai (2022) developed a vehicle damage detection framework using more than 10,000 annotated damage instances [
51]. A comparative analysis of several object detection architectures, including YOLOv3, SSD, FSSD, RFB-SSD, and Faster R-CNN, was conducted. The results of this analysis demonstrated that YOLOv3 and FSSD with Darknet-53 backbones achieved superior performance. Furthermore, the importance of transfer learning and fine-tuning strategies for improving detection accuracy was highlighted [
51]. In a recent study, Loureiro et al. (2026) presented the SYNDCAR dataset and evaluated multiple state-of-the-art object detection architectures for vehicle damage assessment [
52]. Their findings indicated that contemporary YOLO-based models exhibited commendable detection performance, with the most advanced models attaining an mAP50 of approximately 0.85 while exhibiting a balance between accuracy and computational efficiency. Furthermore, the authors demonstrated the feasibility of transferring models trained on synthetic images to real-world damage scenarios [
52].
Hasan et al. conducted a systematic literature review on artificial intelligence-based vehicle damage detection and reported that recent studies mainly focus on classification, detection, and segmentation tasks using CNN, YOLO, Mask R-CNN, U-Net, and transfer learning-based approaches. The authors further emphasized that significant challenges persist in this field, including the balance between accuracy and computational efficiency, class imbalance, variations in lighting conditions and camera angles, and the detection of minor or overlapping damages [
13]. These findings suggest that image-based vehicle damage analysis remains an active area of research and that direct numerical comparisons across studies are often difficult due to differences in datasets, class definitions, image characteristics, and evaluation protocols.
Consequently, the present study focuses specifically on multi-class traffic accident severity classification using accident images from the CADD dataset. In order to provide a fair and consistent evaluation framework, several convolutional neural network architectures with different depths and capacities are systematically compared under identical experimental conditions.
3. Materials and Methods
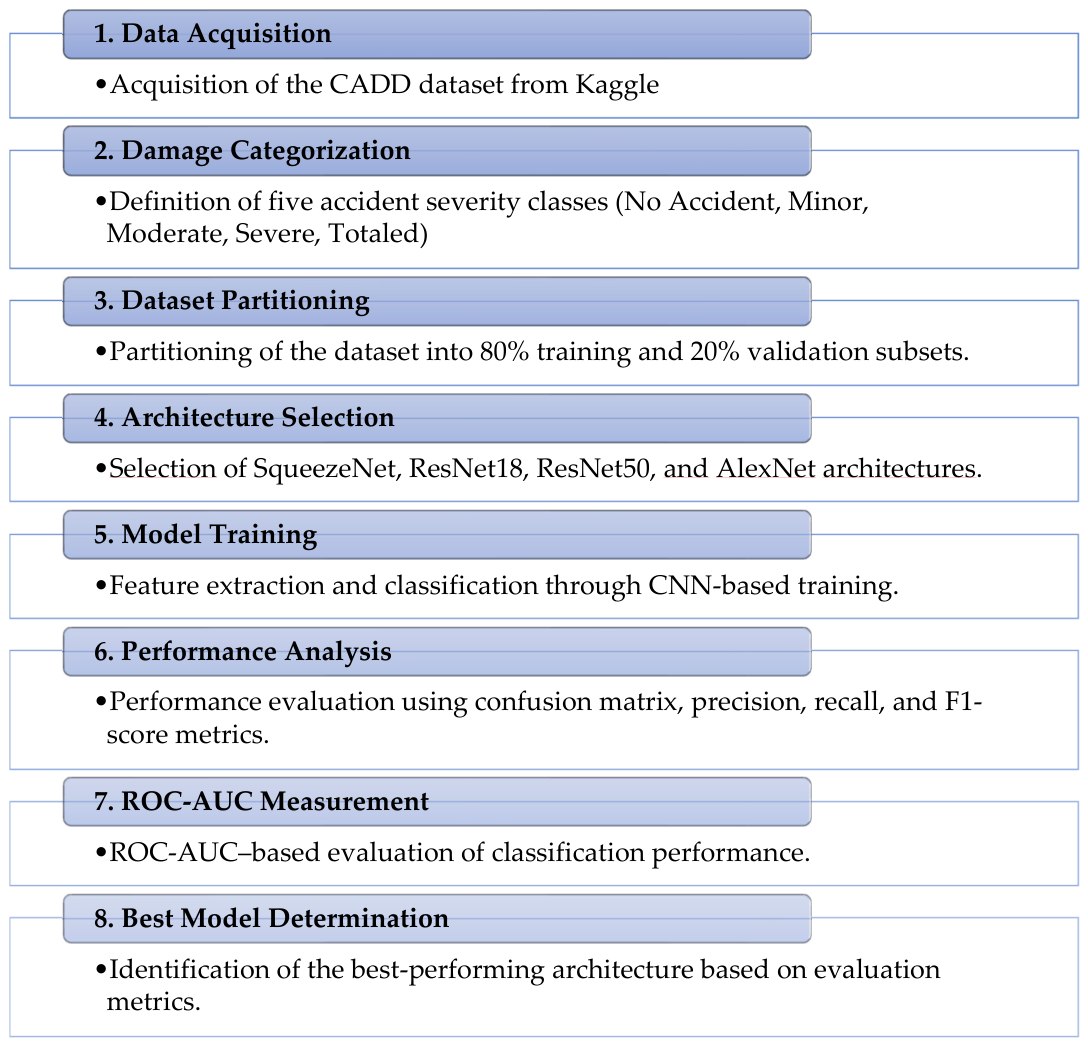
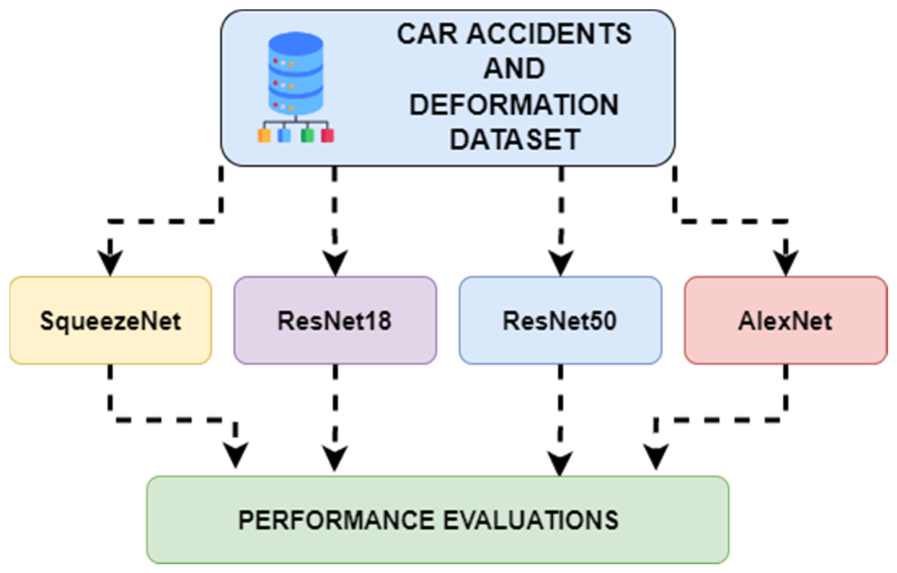
This study encompasses a systematic and repeatable workflow consisting of eight key stages designed to contribute to the literature by automating vehicle damage detection and classification processes (
Figure 1). Within the methodological framework, the data collection phase was first carried out using the CADD dataset obtained from the Kaggle platform, and the relevant images were categorized into five distinct hierarchical classes: no accident, minor, moderate, severe, and totaled. To maximize the model’s training performance and generalization capability, the dataset was meticulously split into 977 training and 246 validation images; and then, by selecting well-established deep learning architectures from the literature such as SqueezeNet, ResNet-18, ResNet-50, and AlexNet, the model training process was conducted through automatic feature extraction from spatial correlations. The success of the developed models was subjected to a comprehensive analysis using metrics such as the Confusion Matrix, Precision, Recall, F1-score, and ROC-AUC. As a result of the experimental comparisons, the ResNet-50 architecture achieved the highest validation accuracy (52%) among the evaluated models and demonstrated the most favorable overall performance under the adopted experimental settings.
3.1. Car Accidents and Deformation Dataset (CADD)
In this study, the dataset obtained from the Kaggle platform was used for the analysis [
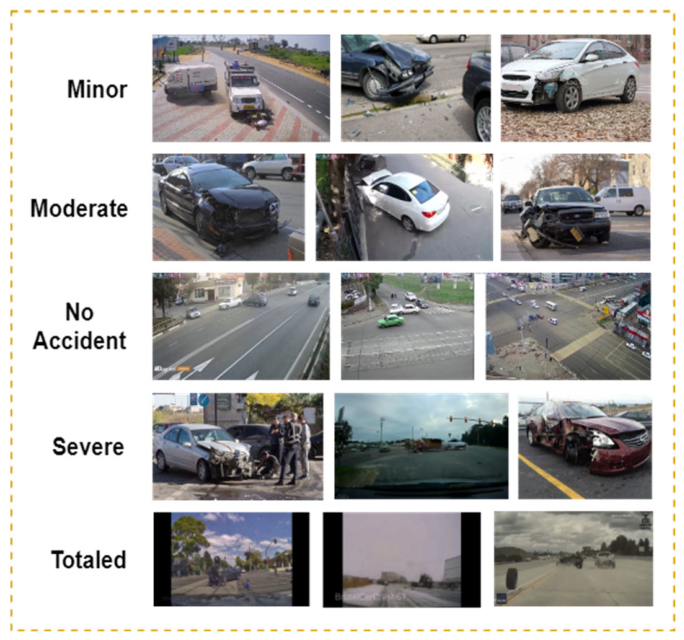
53]. The used dataset includes different vehicle accident images as shown in
Figure 2. In the analysis process, a total of five accident types were classified: minor, moderate, no accident, severe, and totaled. The used categories are explained below:
Minor: Includes a small amount of damage from light contact or low speed. Typically limited deformation around the bumper or fender; the vehicle is usually still drivable.
Moderate: More noticeable impact and damage. Significant damage to body panels such as the bumper, headlights, hood, etc., but not at a “total loss” level.
No Accident: Road camera views showing normal traffic flow. No collision, loss of control, or visible damage.
Severe: High-energy collision. Heavy damage to the front or side, possible debris and likely airbag deployment; the vehicle may require towing.
Totaled: Damage so extensive that repair is not economically or technically reasonable. The examples suggest very severe outcomes such as large-scale destruction or major loss of vehicle control.
The used dataset contains a total of 1223 accident images. These images are divided into two folders: train and validation. The train folder contains 977 images, and the validation folder contains 246 images.
Figure 2 shows sample images from the dataset and
Table 1 shows the number of images per class and the characteristics of the classes.
It should be noted that the five severity labels (no accident, minor, moderate, severe, and totaled) were not assigned by the present authors. The images and their corresponding class labels were taken directly from the publicly available CADD dataset as organized by its provider on the Kaggle platform [
53], in which each class is stored in a separate folder. Consequently, no additional in-house annotation was performed, and information regarding the original annotation protocol—such as the number and expertise of the assessors, the criteria used to resolve ambiguous cases, and any measure of inter-rater agreement—was not documented by the dataset provider. This is an important consideration, because the severity categories are inherently subjective and ordinal in nature: the boundaries between adjacent classes (for example, minor vs. moderate or severe vs. totaled) depend on contextual factors such as visible deformation, repair cost, vehicle value, airbag deployment, and roadworthiness that cannot always be inferred from a single image. The models are therefore evaluated against labels that should be regarded as potentially subjective reference annotations rather than fully objective ground truth, and the reported performance is interpreted with this caveat in mind.
The CADD dataset consists of heterogeneous, single-view still images collected from diverse online sources rather than a controlled acquisition setup. As a result, the dataset does not provide standardized metadata on camera angle, distance, viewpoint, illumination, or occlusion, and it does not contain multiple synchronized views of the same vehicle or accident scene. This constitutes a genuine limitation for damage-severity assessment, because a vehicle may appear almost intact from one side while being severely damaged on the opposite side; when only a single view is available, the model necessarily classifies the visible appearance rather than the true global severity of the vehicle. A multi-view or 360° acquisition protocol would be required to guarantee that the annotated severity is fully represented in the input, and this constraint is discussed further in the limitations (
Section 6).
Regarding the data partitioning, the predefined training (977 images) and validation (246 images) subsets supplied with the CADD dataset were used without modification; no additional or random re-splitting was performed. Consequently, the class distribution of each subset was inherited from the dataset provider rather than established through author-defined stratification. Because the original CADD dataset does not provide image-level metadata or accident identifiers, we could not verify whether visually similar images or multiple views of the same accident scene appear across the predefined training and validation subsets. To reduce the risk of optimistic performance estimates associated with a single fixed split and to assess the stability of the results, the experiments were repeated using three different random initializations (seeds), and the corresponding mean ± standard deviation of the validation accuracy is reported in
Section 4.
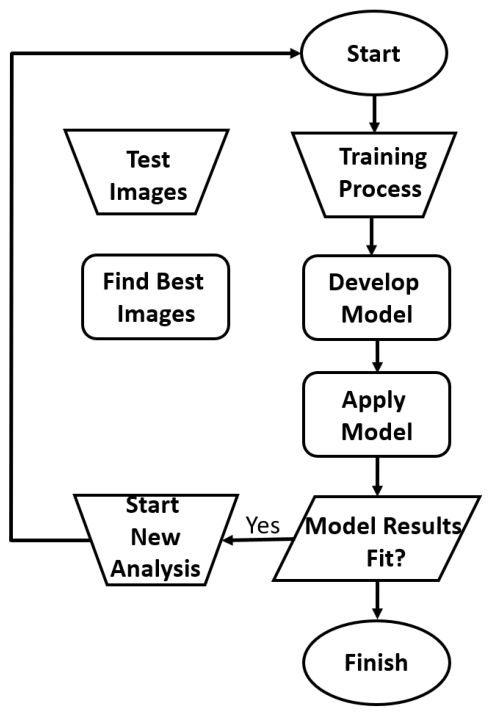
Following the data acquisition and classification stage, the methodological framework employed Convolutional Neural Networks (CNNs) to develop a robust anomaly detection system for vehicle accidents. Various CNN architectures were implemented to evaluate their efficacy in identifying and categorizing accident images into the predefined severity levels. During the training phase, these models were optimized using the designated training subset, and their performance was subsequently benchmarked against validation data to identify the most accurate architecture. The complete procedural workflow of this methodological approach is illustrated in the flowchart presented in
Figure 3.
The selected architectures were chosen to represent different levels of computational complexity and architectural design, including a lightweight network (SqueezeNet), a classical CNN architecture (AlexNet), and residual learning-based models with different depths (ResNet-18 and ResNet-50). This selection enabled a systematic comparison of the effects of architectural complexity on vehicle accident damage classification performance.
To improve convergence and mitigate the limitations associated with the relatively small size of the CADD dataset, all CNN architectures (SqueezeNet, ResNet-18, ResNet-50, and AlexNet) were initialized with the ImageNet pretrained weights. The original classification heads were replaced with new fully connected layers corresponding to the five accident categories used in this study. All the network parameters were fine-tuned during training, and no layers were frozen. The models were trained end-to-end for 20 epochs using identical training settings to ensure a fair comparison of the architectures.
To partially compensate for the limited size of the CADD dataset and to reduce the risk of overfitting, an on-the-fly data augmentation pipeline was applied to the training images in the revised experimental setup. The augmentation comprised random horizontal flipping, small random rotations (±15°), random zooming (up to 10%), and mild brightness/contrast jittering, followed by channel-wise normalization using the ImageNet statistics; no augmentation was applied to the validation images. In addition, a dropout layer (rate = 0.5) was inserted before the final classification layer, and an early-stopping criterion based on the validation loss was employed to further mitigate overfitting. The validation set was never used for gradient updates, weight optimization, or architectural hyperparameter tuning. Instead, it was used exclusively to monitor the validation loss during training, determine the stopping epoch through the early-stopping criterion, and evaluate the final model. The reported validation accuracy therefore corresponds to the model retained at the epoch with the best validation performance. Since the original CADD dataset does not provide an independent held-out test set, the reported results should be interpreted as validation performance intended for comparative evaluation of the investigated CNN architectures rather than as an unbiased estimate of real-world generalization. This limitation is explicitly acknowledged in
Section 6.
The training configuration adopted for all CNN architectures is summarized in
Table 2.
3.2. Convolutional Neural Networks
Deep learning (DL) architectures that provide high representational power in the analysis of image, video, and multidimensional signal data are included among these [
54,
55]. This category of artificial neural networks (ANNs) and ANNs in DL consist of a minimum of three layers. The first layer shows input and the last layer shows output. The rest of the layers in between are referred to as hidden layers [
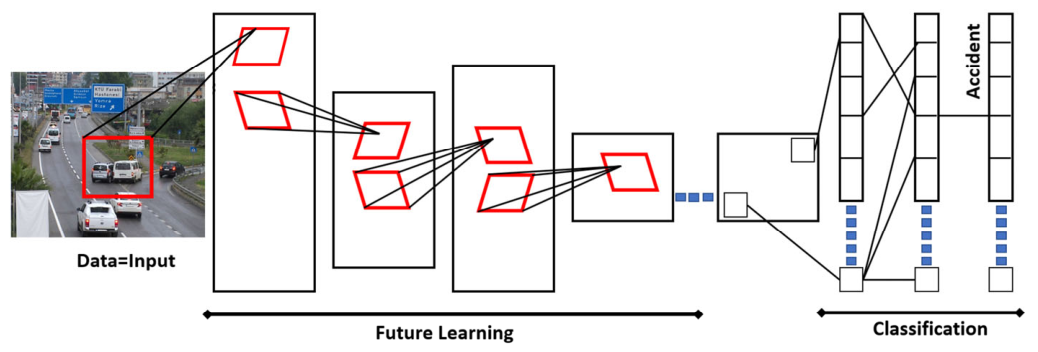
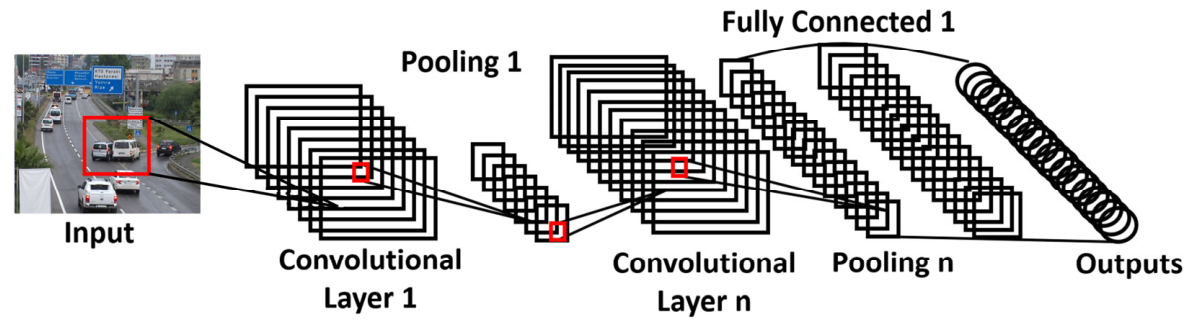
56]. The general architecture of CNN for detecting anomalies in transportation areas (accident, lane keeping, park area detect, etc.) is given in
Figure 4.
Using network structures in this manner offers significant advantages over traditional feature extraction methodologies. This is mainly because they can automatically learn spatial correlations. CNN architectures are characterized by their ability to perform feature extraction using local receptive fields on the input data. This process creates location-independent and hierarchical representations. The fundamental building blocks, namely convolution, activation, and pooling layers, facilitate the reduction of data dimensionality and thus enable more effective learning of discriminative features. The filters learned in the convolution layers progressively represent edges, corners, textures, and complex object structures, transforming into more abstract concepts as the network depth increases. Pooling operations have been demonstrated to reduce computational costs and enhance the model’s generalization ability. Activation functions facilitate the modeling of non-linear relationships. The backpropagation algorithm, utilized during the training process, optimizes network parameters with the objective of minimizing the loss function. Dimension-Agnostic mathematical equations for the core components of Convolutional Neural Networks (CNNs) are given in Equations (1)–(7).
Input
, kernel
, bias
. Stride (
, padding (
Filters
, bias
.
Batch dimension and activation function can be explained in Equations (3) and (4), respectively.
The normalization step is shown in Equation (5). For channel
:
Classified head and Loss functions can be summarized as given Equation (6), respectively.
A convolutional neural network (CNN Blocks) is often written as shown in Equation (7)
CNN-based models have been shown to achieve high levels of accuracy in a variety of domains, including medical imaging, autonomous systems, industrial quality control, and remote sensing. In recent years, the development of deep CNN architectures, along with the proliferation of large datasets and high computational capacity, has enabled them to be used effectively to solve more complex problems [
57,
58,
59]. In the scope of the study, four different (SqueezeNet, ResNet-18, ResNet-50 and AlexNet) CNN architectures were used to classify accident images. The flowchart of the performed operations in the study is shown in
Figure 5.
3.2.1. SqueezeNet
SqueezeNet is defined as a convolutional neural network architecture with high parameter efficiency, developed for DL-based image classification applications [
60]. The objective of the network is to attain comparable levels of accuracy while utilizing a substantially reduced number of parameters in comparison to conventional deep networks (
Figure 6).
The SqueezeNet architecture is fundamentally built upon Fire modules. Each Fire module reduces the number of channels with a ‘squeeze’ layer consisting of 1 × 1 convolutions, then expands the feature maps with an ‘expand’ layer consisting of 1 × 1 and 3 × 3 convolutions. This configuration has been demonstrated to markedly reduce the computational complexity and memory requirements of the model. The standard SqueezeNet model contains approximately 1.25 million parameters, whereas the compressed version has a model size of only ~0.5 MB [
61]. It is evident that the aforementioned features of SqueezeNet render it an optimal architecture for embedded systems, mobile platforms and real-time applications. The structure is composed of 18 layers. Unified (most general) form of the SqueezeNet equations are given in Equations (8)–(14).
The fire module as a single composition can be written as given below:
SqueezeNet classifier general form:
3.2.2. ResNet-18
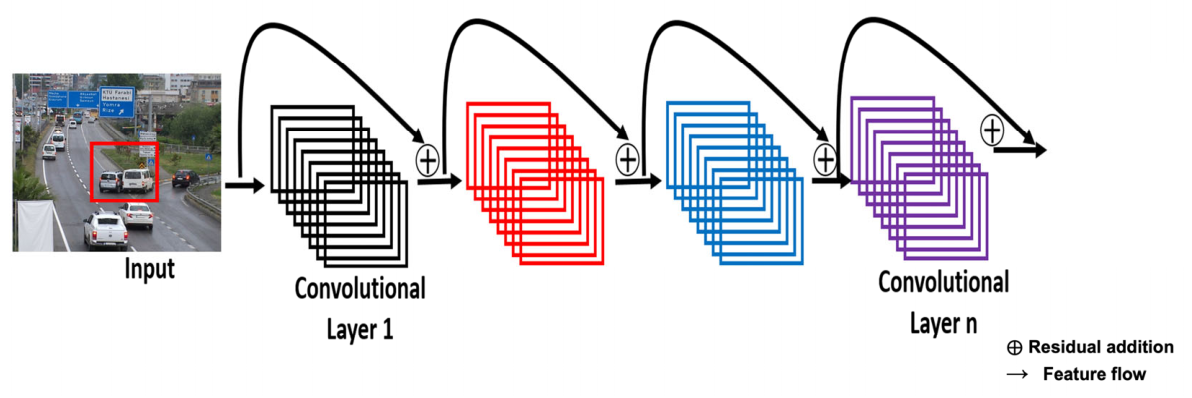
ResNet-18 is defined as a convolutional neural network model featuring a residual learning architecture developed to address the gradient vanishing problem encountered in training deep networks. This architecture enhances information flow between layers through direct connections, thereby enabling the more stable training of deep structures (
Figure 7).
The ResNet-18 model comprises a total of 18 layers and contains approximately 11.7 million parameters. The model size is approximately 44 MB. This architecture offers a balance of high accuracy and computational efficiency for moderately complex visual problems. Residual connections have been demonstrated to facilitate the convergence of the network at a faster rate, thereby reducing the risk of overfitting. ResNet-18 has a wide range of applications, including medical imaging, object recognition and industrial quality control. The structure is composed of 18 layers [
62,
63]. The general forms of the ResNet-18 equations are given in Equations (15)–(17).
For an input defined as X,
The main transform (ResNet-18) is
Then the shortcut mapping is
The input stage for the network
For a four-stage case:
3.2.3. ResNet-50
ResNet-50 is defined as an advanced DL network characterized by a significantly more complex architectural structure. The model’s 50-layer deep structure enables it to successfully represent high-level abstract features. ResNet-50 contains approximately 25.6 million parameters and the model size is approximately 98 MB (
Figure 8).
The bottleneck block structure has been demonstrated to enhance representational power whilst maintaining computational costs within acceptable parameters. The model’s capacity to discern intricate object structures and minute details is enhanced by its depth, thereby facilitating more effective learning. This architecture is favored for problems involving classification and detection that require high accuracy, particularly in the context of large-scale datasets. The structure is composed of 50 layers [
64]. The general form of the ResNet-50 equations is given in Equations (18)–(20).
For an input defined as X, the Output is
Then the shortcut mapping is
The input stage for the network
For a four-stage case:
The classification stage is
3.2.4. AlexNet
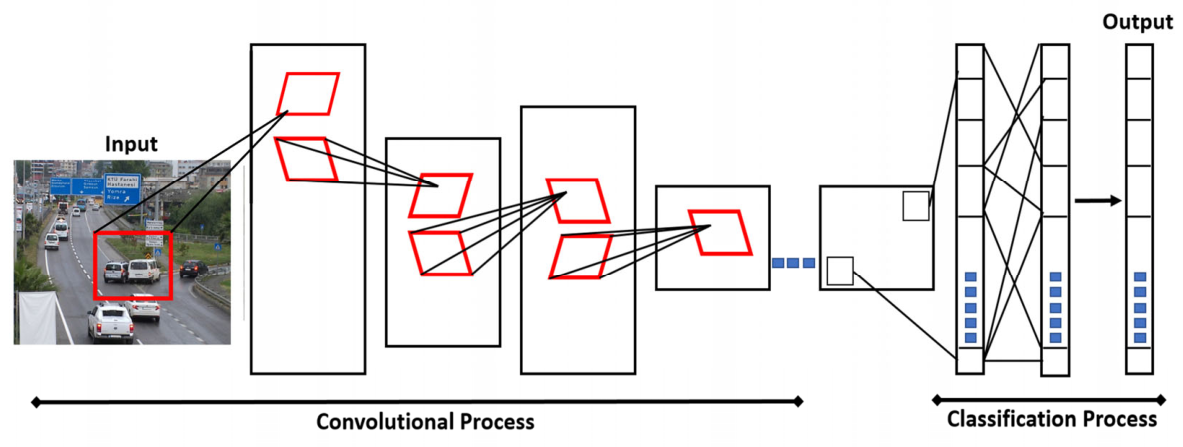
AlexNet is recognized as one of the pioneering convolutional neural network architectures that initiated the rise of DL in the field of image classification. The model consists of 8 layers and contains approximately 60 million parameters. The total model size is approximately 240 MB (
Figure 9).
Thanks to its large kernel sizes and dense fully connected layers, it provides high representational power, but this structure also leads to high memory and computational costs. AlexNet pioneered the widespread use of the ReLU activation function and introduced the dropout technique to mitigate overfitting. This architecture is considered one of the fundamental building blocks that paved the way for the development of more efficient networks today. It consists of 8 layers [
65]. General forms of the AlexNet equations are given in Equations (21)–(23).
For each convolution layer
In AlexNet, additionally some layers apply optional transforms
where
is typically ReLU
For an input defined as X, Alexnet has 5 convolution layers followed by three connected layers as given below:
Convolutional body is given below:
Mainly, AlexNet can be summarized as given in Equation (23):
3.3. Performance Evaluations
3.3.1. Confusion Matrix
The confusion matrix is regarded as one of the fundamental statistical tools utilized to evaluate the performance of a classification model in a detailed and systematic manner. The matrix structure is composed of four primary components. True positive (TP) is indicated by instances where the model correctly classifies an example belonging to the positive class as positive. True negative (TN) instances are instances where an example belonging to the negative class is correctly predicted as negative. False positive (FP) instances are instances where an example belonging to the negative class is incorrectly classified as positive. A false negative (FN) is indicated by instances where a sample belonging to the positive class is incorrectly predicted as negative. The confusion matrix equations for a CNN classifier can be summarized as given below:
Predicted label from CNN logits
Confusion matrix
One-vs-rest counts (per class k) are given below:
The used core metrics of the confusion matrix are summarized in
Table 3.
Performance metrics such as accuracy, precision, recall, and F1-score, calculated based on these four fundamental values, enable a multidimensional assessment of the model’s classification capability. It has been established that accuracy alone is an inadequate performance indicator, particularly in imbalanced datasets. Therefore, the detailed error distribution provided by the confusion matrix contributes to a more reliable interpretation of the model’s actual performance level. In this regard, the confusion matrix is employed as an indispensable evaluation instrument in analyzing the reliability and generalization capabilities of classification systems [
66].
3.3.2. Performance Metrics
In order to evaluate the performance of a classification model with a high degree of reliability and comprehensiveness, a range of performance metrics are utilized in conjunction. In this study, the performance of the model is analyzed using a range of evaluation metrics, including accuracy, precision, recall, and F1-score. Accuracy is defined as the ratio of instances that have been correctly classified by the model to the total number of instances. It is considered a fundamental indicator of overall classification performance. However, in datasets with imbalanced class distributions, the accuracy metric alone may not fully reflect the model’s true performance [
67]. Consequently, precision is defined as the extent to which a model accurately predicts positive outcomes, as measured by the proportion of true positives among all predictions made by the model. The recall function is indicative of the model’s sensitivity level, as it quantifies the proportion of positive examples that are correctly identified. The F1-score, a metric that combines the balance between precision and recall metrics under a single criterion, is defined as the harmonic mean of these two metrics. This reveals whether the model performs in a balanced manner in terms of both accuracy and coverage. The integration of these metrics in a unified evaluation framework facilitates a more comprehensive analysis of the system’s strengths and weaknesses, thereby enabling the construction of more robust models for comparison [
68,
69,
70].
3.3.3. Receiver Operating Characteristic (ROC) and Area Under the Curve (AUC)
The ROC (Receiver Operating Characteristic) curve is a fundamental visual analysis tool used to evaluate the performance of a classification model under different decision threshold values [
71]. The ROC figure displays the false positive rate on the horizontal axis and the true positive rate on the vertical axis, thus revealing the model’s ability to distinguish between positive and negative classes at varying threshold levels. It is evident that as the curve approaches the top left corner, the model’s discriminative power increases. True positive rate (TPR), named as sensitivity, and false positive rate (FPR) can be calculated by using Equations (26) and (27), respectively.
The Area Under the Curve (AUC) metric is a quantitative measure of the area under the Receiver Operating Characteristic (ROC) curve. It is a method of summarizing the model’s overall classification performance in a single numerical value. An AUC value close to 1 indicates that the model has a good ability to distinguish between classes, while a value around 0.5 indicates a performance close to random classification. Higher AUC shows that the model separates positives from negatives better, independent of a specific threshold. Consequently, ROC-AUC analysis is regarded as a reliable and extensively utilized evaluation method, particularly in the context of comparing different classification models [
72,
73].
4. Experimental Results
In this section, vehicle accident images are classified using CNN architectures of different sizes with the CADD dataset, and detailed performance analyses are conducted. The dataset consists of five accident severity categories, making the classification task particularly challenging due to the variability in visual damage characteristics. The main objective here is to classify the damage ratio in the accident. This can be described as a rather challenging problem. Therefore, CNN architectures of different sizes were used and performance evaluations were carried out. The models used in the study were coded in the Python 3.11 programming language. A computer with an Intel
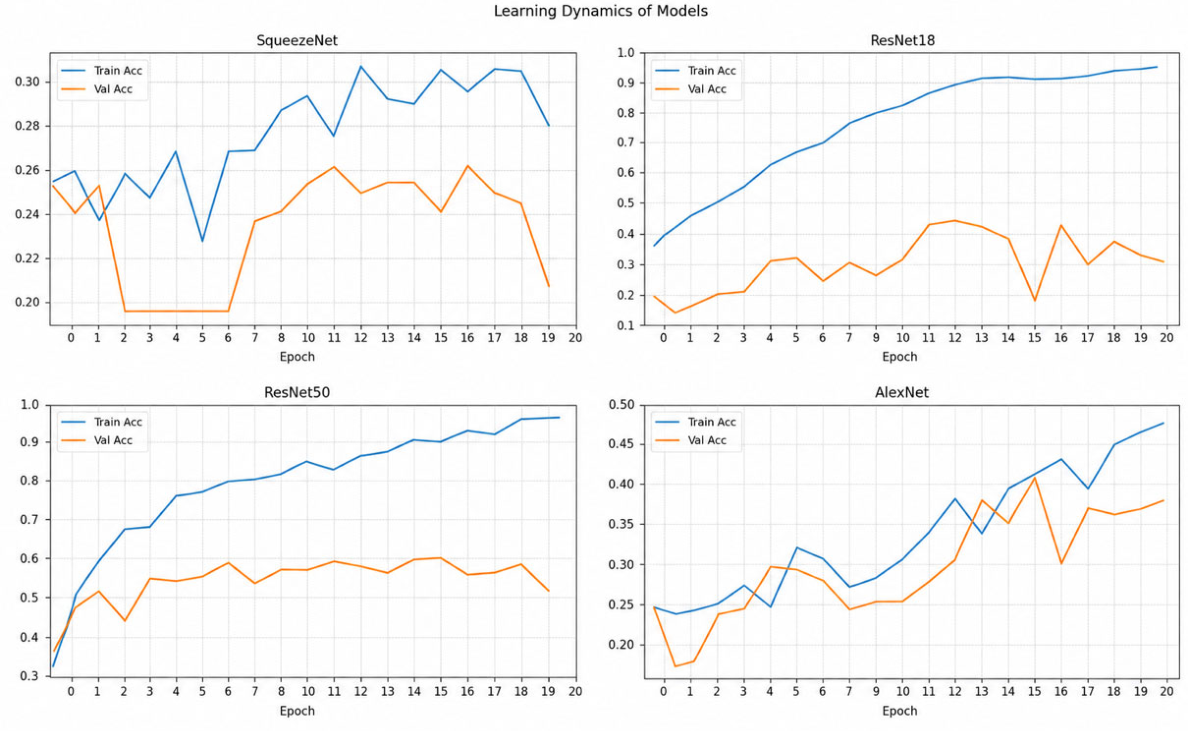
® Core i7™ 12700K 3.61 GHz processor, NVIDIA GeForce RTX 3080Ti graphics card, and 64GB RAM was used. Parameter count and computational complexity (MFLOPs) were selected as hardware-independent measures of model efficiency. Conversely, operational metrics such as inference latency and memory consumption were omitted from explicit reporting, as these variables fluctuate significantly depending on the target hardware platform and deployment environment. The models were trained using images from the train folder and tested using images from the validation folder. The train and validation accuracy graphs obtained as a result of training the models are shown in
Figure 10.
As shown in
Figure 10, a comparative analysis of the training and validation accuracy curves for four distinct DL architectures is presented. A thorough examination of the graphs reveals substantial disparities in the learning dynamics exhibited by the models. It has been observed that the training and validation accuracy values of the SqueezeNet model remain at low levels and fail to show a steady increase as the epoch progresses. This finding suggests that the SqueezeNet architecture lacks the representational capacity to adequately address the problem at hand, thereby hindering the model’s ability to effectively learn the intricate nature of the data. In the AlexNet model, there is a gradual increase in training accuracy, whilst validation accuracy displays a fluctuating pattern. This finding suggests that the model attains limited learning capabilities but exhibits instability in its generalization abilities. ResNet-18 demonstrates a more consistent learning curve, with training accuracy increasing rapidly while validation accuracy stabilizes at moderate levels. This structure indicates that the model has acquired significant features, yet it has not yet completely captured the intricacies inherent in the relationship between the classes. The learning behavior that has been demonstrated to be both the most stable and successful is that exhibited by ResNet-50. The continuous and consistent increase in both training and validation accuracy demonstrates that the deep architecture can effectively learn complex visual patterns and provides a strong generalization performance. Although minor fluctuations are observed in the final epochs, a clear trend toward convergence is exhibited by the validation curves. Given that a uniform experimental setup was maintained across all architectures, a consistent foundation is established for a reliable comparative performance evaluation.
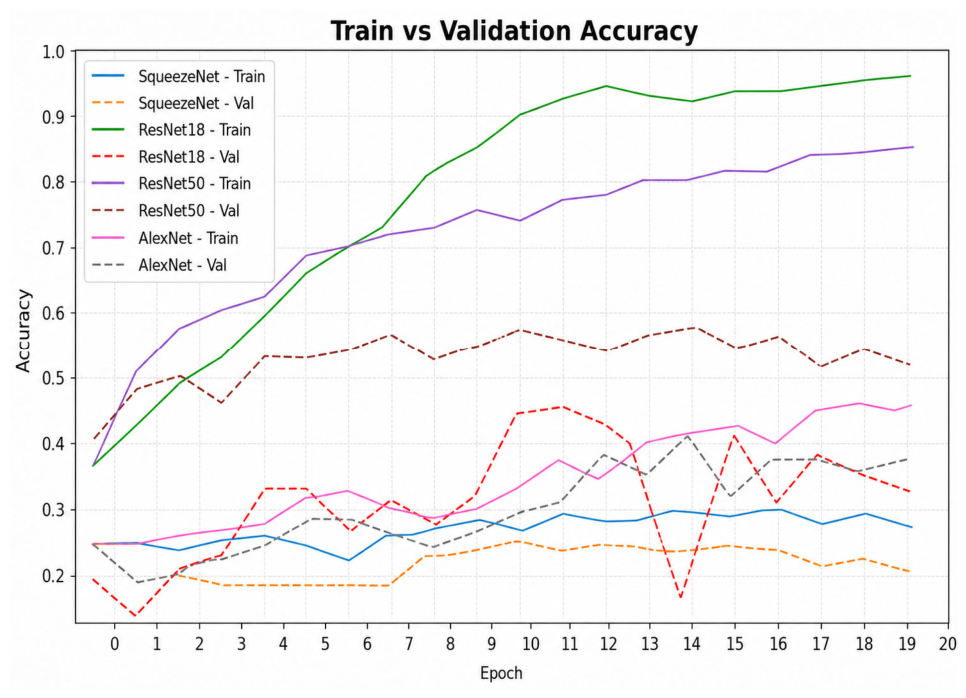
Figure 11 presents the combined graphs for all models.
As given in
Figure 11, the training and validation accuracy curves for the SqueezeNet, ResNet-18, ResNet-50, and AlexNet models are presented in a comparative manner. A thorough examination of the graph reveals clear disparities in learning capacity and generalization ability between the architectures. SqueezeNet demonstrates a low and unstable trajectory in both training and validation accuracy, failing to achieve significant enhancement as the epoch progresses. This finding suggests that the model’s capacity for representation is inadequate for the problem under consideration. AlexNet demonstrates a gradual enhancement in training accuracy, yet concurrently exhibits substantial variations in validation accuracy. This observation signifies the model’s constrained generalization capability. It has been demonstrated that ResNet-18 rapidly increases training accuracy whilst maintaining validation accuracy at moderate levels and exhibiting a more stable learning profile. The most successful and balanced learning behavior is demonstrated by ResNet-50. The consistent enhancement in training accuracy and the sustained maintenance of elevated validation accuracy serve to substantiate the capacity of the deep residual learning architecture to effectively discern intricate patterns and to facilitate robust generalization performance. As shown in
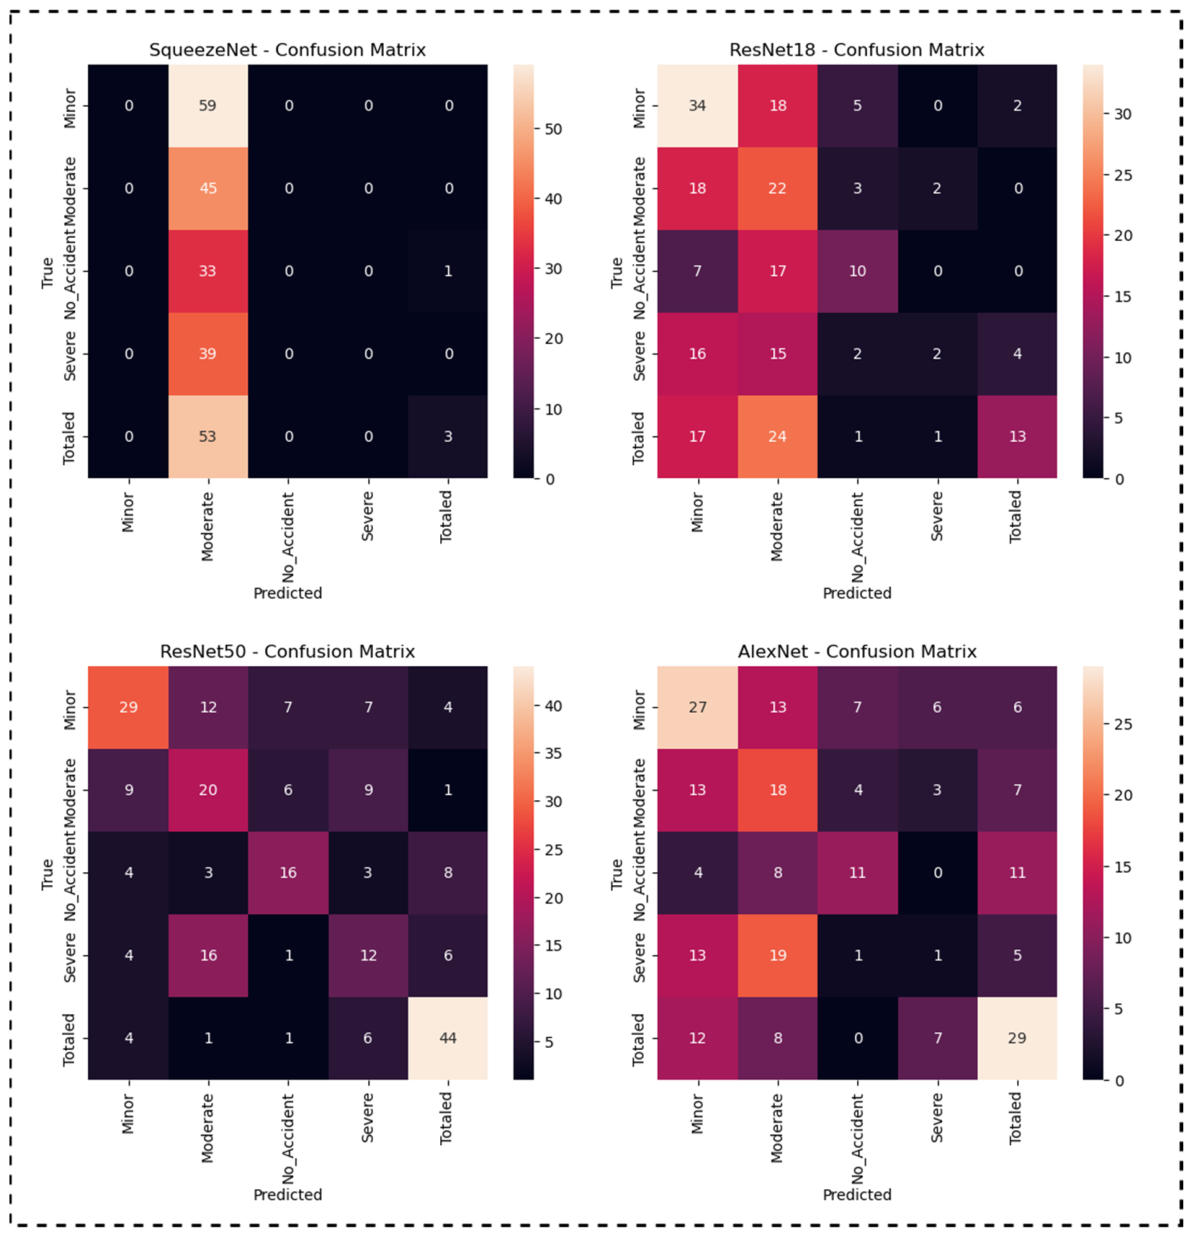
Figure 12, the confusion matrices obtained from the classification results of the models demonstrate the performance of the models.
In
Figure 12, an examination of the confusion matrix for the SqueezeNet model reveals a pronounced classification issue between classes. The matrix demonstrates that the model accurately predicts the majority of examples as belonging to the moderate category. It is evident that all instances classified as minor, no_accident, and severe are erroneously designated as moderate. A mere three examples classified as totaled are correctly so, but 53 of these are also incorrectly assigned to the moderate class. An analysis of the confusion matrix for the ResNet-18 model indicates that it has achieved a substantial enhancement in its discriminative power between classes when compared to SqueezeNet. The significant increase in the diagonal values of the matrix suggests that the model has learned for each class and that the multi-class structure is now represented in a more balanced manner. As demonstrated in
Figure 12, the majority of the correct classification values were obtained at relatively high levels, particularly in the minor and moderate classes. It is understood that both the precision and recall metrics have improved significantly for these classes. However, it is observed that there are still significant cross-classifications in the no_accident and severe classes. This finding suggests that the visual exemplars belonging to these classes are distributed in close proximity within the feature space, thereby impeding the model’s capacity to delineate a distinct decision boundary between them. In the totaled class, the relatively high number of correct classifications indicates that the model can distinguish examples involving severe damage more clearly from other classes. A substantial enhancement in performance was observed when ResNet-18 was employed in comparison with SqueezeNet. Nevertheless, the issue of class overlap remained unresolved. This finding suggests that deeper architectures may be more suitable for this problem and that, in particular, the discrimination power between classes needs to be increased. This distribution indicates that the model is excessively biased towards a single class (class bias) and cannot effectively learn the multi-class problem. In summary, the model has, to a considerable degree, lost its capacity for generalization by concentrating on the most prevalent class in the dataset, as opposed to acquiring the ability to discern between different features. This results in recall values close to zero for the minor, no_accident, and severe classes, and artificially high values for the moderate class. An analysis of the confusion matrix for the ResNet-50 model indicates that there has been a substantial enhancement in the capacity to differentiate between classes in comparison with the ResNet-18 model. The enhancement in the proportion of accurate classification values along the diagonal of the matrix signifies that the deep architecture has effectively learned more discriminative and abstract features. It is evident that the 44 accurate predictions in the totaled category substantiate the model’s capacity to discern instances of severe damage with a remarkably high degree of reliability. A similar increase in the correct classification rates is observed in the no_accident and severe classes. Despite the presence of a certain degree of overlap between the minor and moderate classes, this overlap has diminished considerably compared to earlier models. This finding indicates that ResNet-50 is capable of representing complex visual patterns with greater efficacy and establishing decision boundaries with greater reliability, attributes that can be attributed to its depth. ResNet-50 demonstrated efficacy in facilitating balanced learning across all classes, with a notable emphasis on achieving comparatively better performance, particularly in the critical classes of severe and totaled. The findings indicate that the deep residual learning architecture provides the best performance among the evaluated architectures under the adopted experimental settings and significantly enhances the discrimination power between classes. A thorough examination of the complexity matrix of the AlexNet model reveals that it demonstrates significantly superior discriminative power in comparison to SqueezeNet. However, its discriminative power is comparatively constrained when evaluated against ResNet-18 and, most notably, ResNet-50. The diagonal values of the matrix demonstrate that AlexNet has attained a specific level of learning for each class. Specifically, the 29 correct classifications in the totaled class demonstrate that the model is relatively successful in distinguishing examples involving severe damage. However, the low number of correct predictions in the severe and no_accident classes indicates that the features of these classes are not sufficiently strongly represented by the network. The substantial inter-classification overlap observed between the minor and moderate classes indicates that these two classes exhibit a high degree of visual similarity, which is challenging for the AlexNet architecture to differentiate. Overall, AlexNet exhibited rudimentary learning capabilities, yet it fell short of contemporary architectures in terms of depth and representational capacity. When all confusion matrices are evaluated collectively, it becomes evident that the SqueezeNet model demonstrates significant class bias and is incapable of learning the multi-class problem. AlexNet demonstrated the capacity to differentiate between classes, albeit to a limited extent, and was found to be deficient in its representation of intricate visual patterns. It is evident that ResNet-18 has undergone a substantial enhancement in performance, resulting in a notable improvement in the capacity to differentiate between different categories. The highest and most balanced performance was achieved by the ResNet-50 model. The high accuracy achieved by ResNet-50, particularly in the severe and totaled classes, indicates that the deep residual learning architecture provided the best overall performance among the evaluated architectures under the adopted experimental settings. As given in
Table 4, the performance metrics and average accuracy metrics for the models obtained using this confusion matrices are presented, categorized by class.
In
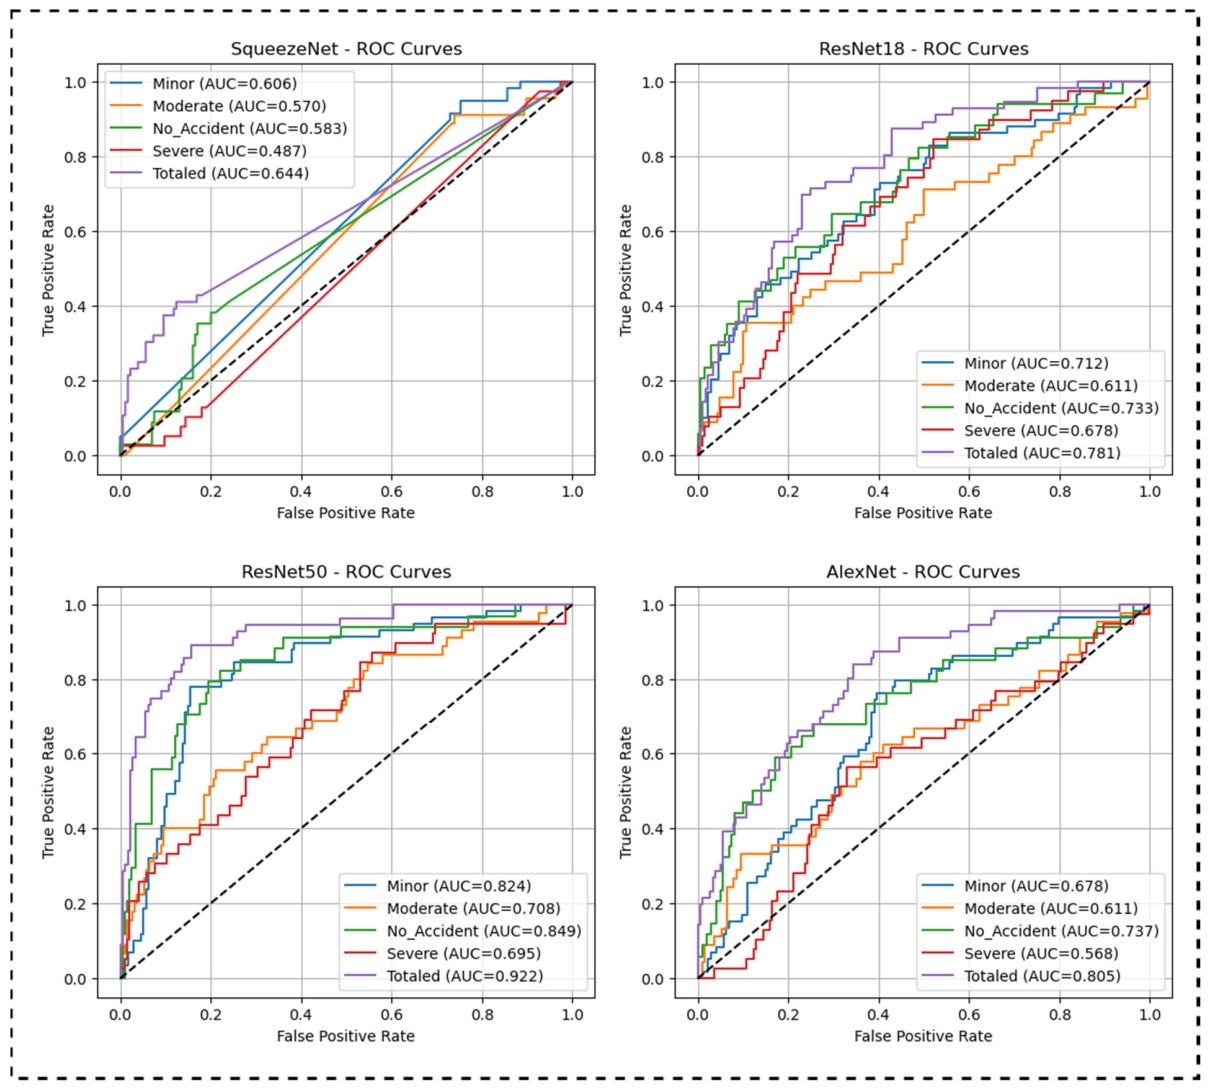
Table 4, a comparative overview of the validation accuracy and class-based precision, recall, and F1 score values for the SqueezeNet, ResNet-18, ResNet-50, and AlexNet models is presented. The findings unequivocally substantiate the variances in performance exhibited by the architectures. SqueezeNet exhibited the lowest overall performance, with an accuracy of 21% in the validation process. Specifically, the precision, recall, and F1 score values that approximate zero in the minor, no accident, and severe classes suggest that the model was incapable of learning these classes. It is evident that the model places a disproportionate emphasis on the moderate class, as evidenced by the recall value of 1 and the precision value of 0.2. This situation indicates that the model exhibits significant class bias and is incapable of learning the multi-class problem. The observation that the macro and weighted averages remain around 0.1 serves to confirm the general failure of the model. It is evident that ResNet-18 has achieved a substantial enhancement in its validation accuracy, with a noteworthy 35% success rate. While a balanced precision–recall profile is obtained in the minor and no accident classes, the very low recall value (0.05) in the severe class indicates that this class is not sufficiently represented by the model. The finding that the macro and weighted F1-score values are approximately 0.33 suggests that the model displays a moderate level of generalization performance. AlexNet demonstrated a comparable level of performance to ResNet-18, attaining a validation accuracy of 37%. While balanced results were obtained in the minor, moderate, and no accident classes, the extremely low F1 score (0.04) in the severe class indicates that the model had significant difficulty distinguishing this critical class. This phenomenon can be attributed to the constrained representation capabilities of AlexNet. The highest and most balanced performance was achieved by the ResNet-50 model. The model demonstrated balanced learning across all classes, as evidenced by a verification accuracy of 52% and macro and weighted F1 scores ranging from 0.50 to 0.52. Specifically, an accuracy of 0.70, a recall of 0.79, and an F1-score of 0.74 in the totaled class demonstrate that ResNet-50 can distinguish examples of severe damage with a high degree of reliability. The consistent and balanced performance across other classes confirms that the ResNet-50 architecture is the best-performing architecture among those evaluated for this problem. The Receiver Operating Characteristic (ROC) curves for the models are also presented in
Figure 13.
To assess the stability of these results with respect to random initialization, each architecture was retrained three times with different seeds under the identical augmented setup. The validation accuracy remained consistent across runs—ResNet-50: 51.8% ± 1.6%, AlexNet: 36.4% ± 2.1%, ResNet-18: 34.7% ± 1.9%, and SqueezeNet: 20.6% ± 2.8%—confirming that the ranking of the architectures is robust and not an artifact of a particular initialization. It should nevertheless be acknowledged that, although ResNet-50 attains the best overall and per-class balance, its discriminative strength is concentrated in the totaled and no accident classes, whereas the intermediate minor, moderate, and severe classes remain considerably harder to separate. In this respect, the current model behaves more reliably as a coarse-grained severity detector than as a fully calibrated five-level ordinal grader, and this distinction is examined further in
Section 5.
In
Figure 13, the class-based ROC curves and AUC values for the SqueezeNet, ResNet-18, ResNet-50, and AlexNet models are presented. A clear distinction in discriminative capacity emerges when the overall distribution of the ROC curves and AUC scores is analyzed. SqueezeNet exhibited the poorest discrimination performance, with AUC values ranging between 0.48 and 0.64 across all classes. In particular, the Area Under the Curve (AUC) of 0.487 in the severe class indicates that the model is capable of distinguishing this class at a level close to random guessing. This finding serves to corroborate the hypothesis that SqueezeNet was incapable of acquiring knowledge of the complex class structure. A comparison of the discrimination power of AlexNet with that of SqueezeNet revealed that the former outperformed the latter, achieving an Area Under the Curve (AUC) of 0.805 in the totaled class and an AUC of 0.737 in the no_accident class. However, the AUC = 0.568 in the severe class indicates that the model is inadequate in distinguishing critical damage classes. ResNet-18 demonstrated a more balanced performance, with a significant increase in AUC values across all classes. The highest levels of discriminatory power were achieved in the totaled class, with an Area Under the Curve (AUC) value of 0.781, while the other classes also demonstrated acceptable levels of discrimination. The ResNet-50 model demonstrated the optimal performance. The model achieved an Area Under the Curve (AUC) of 0.922 in the totaled class, 0.849 in the no_accident class, and 0.824 in the minor class, providing strong discrimination across all classes. The findings indicate that the deep structure of the ResNet-50 architecture facilitates the effective representation of complex visual patterns and the establishment of clearer decision boundaries between classes. The ROC–AUC findings demonstrate complete consistency with the confusion matrix and performance metrics, thereby providing robust confirmation that the ResNet-50 architecture is the best-performing architecture among those evaluated in this study. As shown in
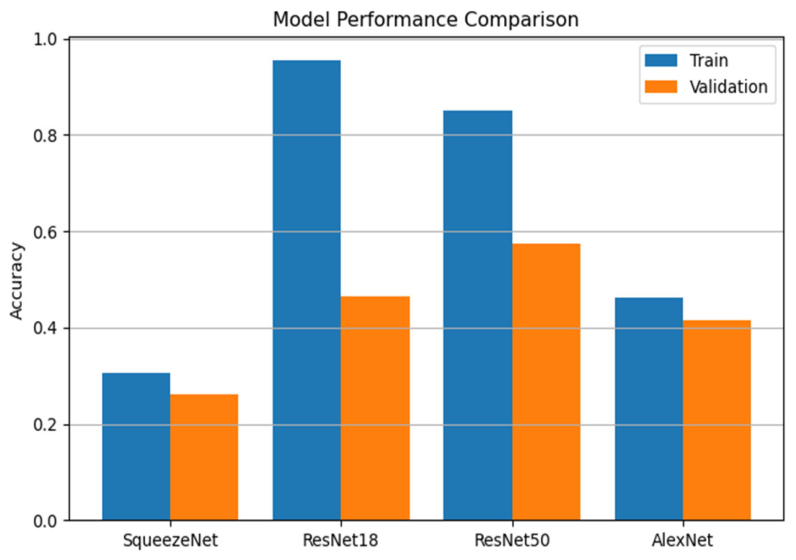
Figure 14, the train and accuracy values for the models are presented.
In
Figure 14, a comparative analysis of the training and validation accuracy values for the SqueezeNet, ResNet-18, ResNet-50, and AlexNet models is provided. A close examination of the graph reveals clear disparities in performance between the architectures. SqueezeNet exhibits the lowest values for both training and validation accuracy, thereby manifesting its constrained learning capacity. This finding suggests that the model is not suitable for complex visual classification problems. A comparison of AlexNet with SqueezeNet revealed that the former achieved a higher level of accuracy. However, the increase in validation accuracy was found to be limited, indicating that the model’s generalization ability remained at a moderate level. Despite achieving notably high values for training accuracy, the ResNet-18 model exhibited a discernible tendency towards overfitting, as evidenced by its comparatively low validation accuracy. The most balanced and highest validation success was achieved by the ResNet-50 model. The negligible disparity between the training and validation accuracies indicates that the model possesses a substantial learning capacity and exhibits a high degree of generalization capability. As demonstrated in
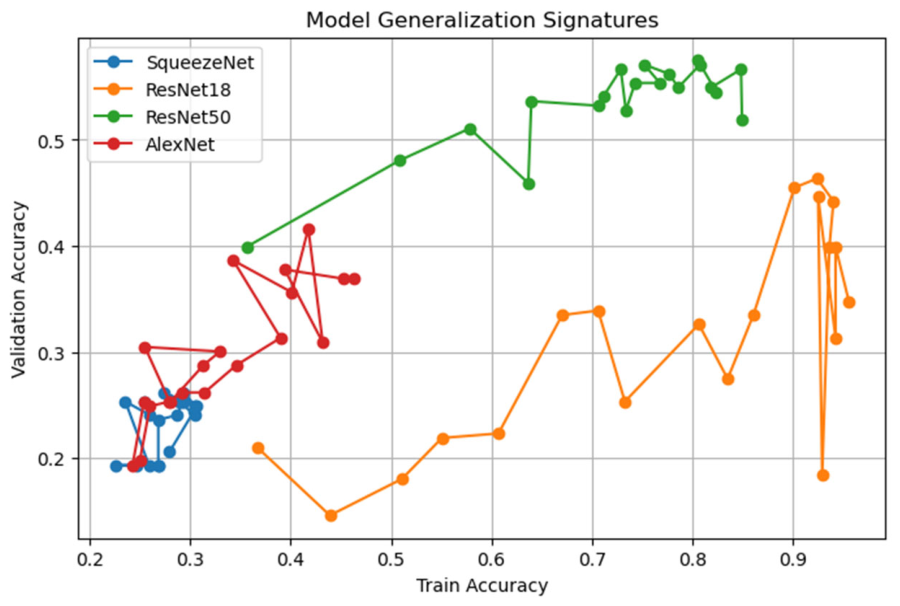
Figure 15, the model generalization graph provides a visual representation of the models.
As shown in
Figure 15, the relationship between training accuracy and validation accuracy for different architectures is demonstrated, and the generalization characteristics of the models are visually analyzed. The graph provides a clear illustration of the equilibrium between each model’s learning capacity and its generalization ability. SqueezeNet demonstrates a concentration in the low training and validation accuracy region, indicating an inability to adapt to the data sufficiently. The aggregation of points in a constricted area signifies that the model’s capacity is inadequate for the problem’s intricacy. A higher validation accuracy is achieved by AlexNet in comparison to SqueezeNet; however, fluctuations in validation accuracy as training accuracy increases indicate that the model exhibits an unstable generalization profile. ResNet-18 functions within a broad training accuracy range; however, variations in validation accuracy and pronounced declines at specific points indicate a notable propensity for overfitting on the part of the model. The most ideal generalization behavior is demonstrated by ResNet-50. The findings indicate that the model exhibits both strong learning capacity and high generalization ability, as evidenced by the steady increase in validation accuracy as training accuracy rises, and the clustering of points in the upper region. As given in
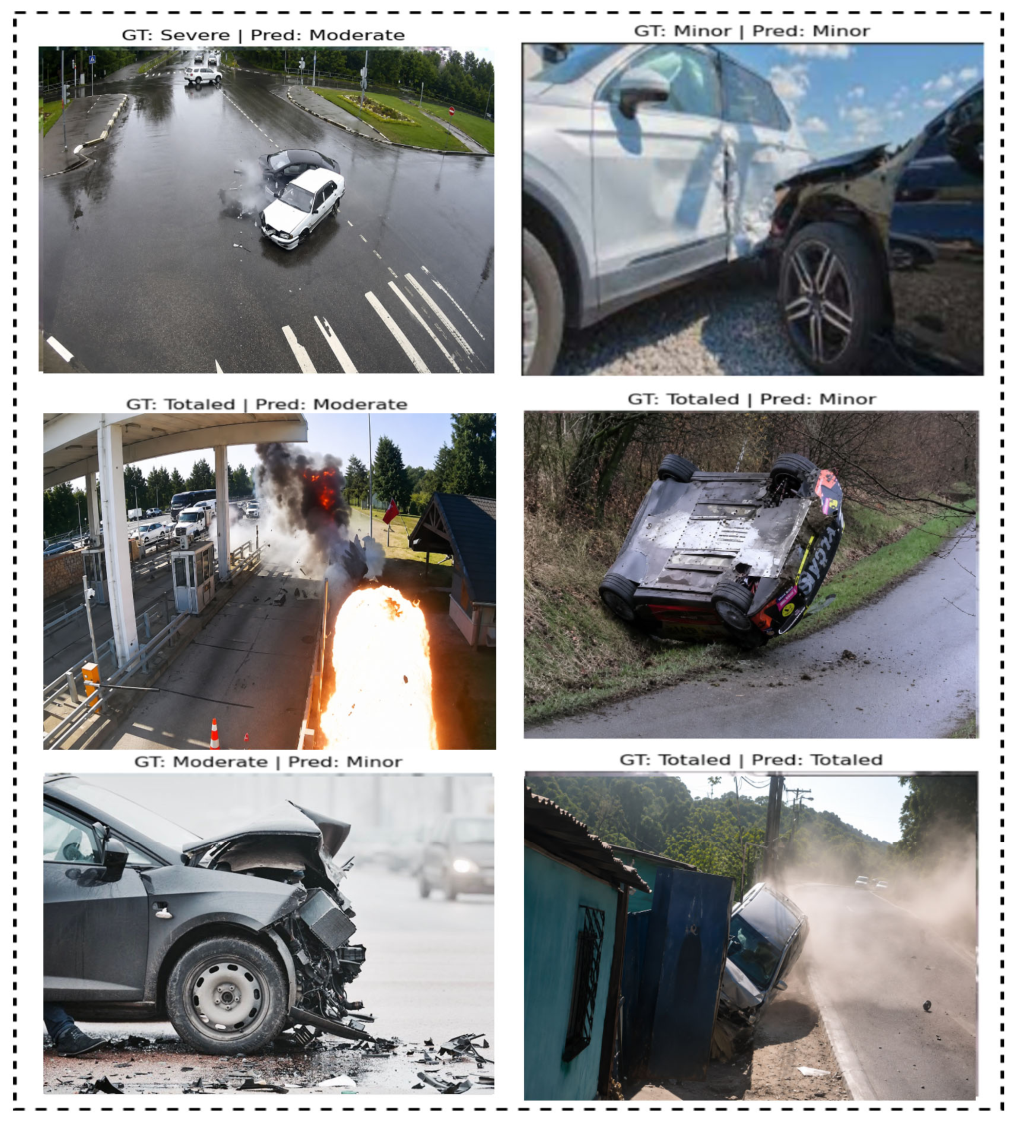
Figure 16, the ResNet-50 model, which has been demonstrated to exhibit optimal performance, provides several classification examples.
Figure 16 shows sample classification outputs from the ResNet-50 model. Upon examining the images, it is observed that the model largely interprets the basic visual clues of the accident correctly and can generally predict the severity of the accident consistently. Particularly in the GT: Minor | Pred: Minor and GT: Totaled | Pred: Totaled examples, it is seen that the model successfully analyzes vehicle deformation, part detachments, vehicle position, and environmental effects to achieve accurate classification. These results demonstrate that ResNet-50 can learn complex visual patterns with high representational power. In contrast, in some examples, the model was observed to predict high damage classes such as Severe and Totaled as Moderate or Minor (e.g., GT: Severe | Pred: Moderate, GT: Totaled | Pred: Moderate, GT: Moderate | Pred: Minor). These errors occur particularly in scenes where the damage is partially obscured from the camera’s perspective, the lighting conditions are inadequate, or the dynamics of the collision cannot be fully represented in a single frame. This situation demonstrates that single image representations that do not capture the temporal progression of the accident constrain the model’s decision-making process. The present qualitative analysis demonstrates a complete congruence with the quantitative results. The ResNet-50 model has been shown to achieve a high degree of accuracy in the identification of heavily damaged crashes; however, misclassifications are predominantly observed in transitional situations where the boundaries between classes become visually ambiguous. The findings demonstrate that ResNet-50 has high discriminative capacity, but that video-based models incorporating temporal information hold significant potential for future improvement in better representing the dynamic nature of accidents.
5. Discussion
The experimental results obtained in this study demonstrate the potential of deep transfer learning approaches for traffic accident image classification. In particular, the superior performance of ResNet-50 (52% accuracy) highlights the importance of architectural depth and residual learning in capturing complex deformation patterns. Similar observations have been reported in vehicle damage studies. Patil et al. [
49] showed that ResNet-based architectures outperform VGG, AlexNet, and Inception models in vehicle damage classification tasks. Likewise, Ma et al. [
48] successfully employed a ResNet framework to reconstruct collision-induced deformations, further supporting the ability of residual networks to process high-dimensional visual information. Moreover, van Ruitenbeek and Bhulai [
51] demonstrated that transfer learning and fine-tuning strategies substantially influence performance in vehicle damage detection, whereas Loureiro et al. [
52] showed that modern YOLO-based architectures can effectively detect vehicle damage under real-world conditions. Collectively, these studies emphasize the growing importance of deep learning techniques in automated damage assessment.
Another important finding emerging from the model evaluation is the variation in classification performance across different severity categories. While the “Totaled” and “No Accident” classes were identified with relatively high accuracy, the “Minor” and “Moderate” categories proved more challenging because of their subtle and overlapping visual characteristics. Similar difficulties have been reported in the literature, particularly in studies emphasizing the effects of image variability, class imbalance, and environmental factors on model performance [
13,
74]. Within this context, the high ROC-AUC values achieved in this study (up to 0.92) indicate that the models retain good overall discriminative ability despite the moderate overall classification accuracy.
Although ResNet-50 achieved the highest overall performance among the evaluated architectures, the class-wise analysis reveals that its discriminative capability is not uniformly distributed across all severity levels. The model performs particularly well for the visually distinctive totaled class, whereas greater confusion remains among the intermediate minor, moderate, and severe categories because of their overlapping visual characteristics. Therefore, the current framework should be regarded as a promising coarse-grained severity classifier rather than a fully reliable five-level ordinal grading system. A further point that warrants careful discussion is the gap observed between the training and validation curves for ResNet-50 in
Figure 10 and
Figure 11. Although the residual architecture achieves the best validation performance, the difference between its training and validation accuracy indicates a tendency toward overfitting, which is an expected consequence of fine-tuning a high-capacity network on a small dataset. The data augmentation, dropout, and early-stopping strategies described in
Section 3 were introduced specifically to mitigate this effect. Although alternative regularization strategies were considered, they were not adopted, as identical training settings were maintained to ensure a fair comparison among the evaluated CNN architectures. The repeated-seed experiments confirm that the reported accuracy is stable; nevertheless, the gap does not fully disappear, and a larger and more balanced dataset remains the most effective remedy. Furthermore, since no independent test set was available in the original CADD dataset, the reported validation accuracy should be interpreted as a comparative performance measure among the evaluated CNN architectures rather than as a definitive estimate of generalization performance.
From a methodological perspective, the adoption of a five-class accident severity framework represents a meaningful contribution. Previous vehicle damage studies have primarily focused on object detection, segmentation, or binary classification [
13,
50,
51,
52]. In contrast, the present study evaluates four CNN architectures with different depths under identical experimental conditions and addresses a more challenging five-class severity classification problem. Direct numerical comparisons with previous studies remain difficult because of differences in datasets, class definitions, image characteristics, and evaluation protocols. Therefore, the reported performance should be interpreted within the context of multi-class accident severity classification using the CADD dataset rather than as a universal benchmark.
Finally, the findings indicate that image-based accident classification may, with further development, contribute to intelligent transportation systems and automated damage assessment applications, but it is not yet ready for autonomous decision-making in these domains. Although the present framework relies solely on visual information, future studies may benefit from integrating additional information sources and addressing current limitations such as class imbalance and dataset size. As emphasized in recent reviews [
13], larger datasets, more diverse image conditions, and comparisons with modern architectures are expected to further improve model robustness and practical applicability.
6. Conclusions and Suggestions
The present study addresses the problem of DL-based classification of vehicle accident images and systematically compares four convolutional neural network models (SqueezeNet, ResNet-18, ResNet-50, and AlexNet) with varying architectural depths. The experimental results obtained using the CADD dataset indicate that architectural depth and representation capacity play an important role in accident severity classification. Among the evaluated architectures, ResNet-50 achieved the highest validation accuracy (52%), balanced macro- and weighted-F1 scores (~0.50–0.52), high class-wise discriminative capability, and notably high precision (0.70), recall (0.79), and AUC (0.922) for the totaled class, thereby demonstrating the strongest overall performance. Considering the ROC–AUC values, confusion matrices, and class-wise performance metrics together, ResNet-50 provided the most balanced results among the evaluated architectures. In contrast, SqueezeNet exhibited substantial class bias, particularly for the minor, no_accident, and severe classes, resulting in a comparatively poor multi-class classification performance. AlexNet and ResNet-18 achieved a moderate performance but showed noticeable limitations, especially in distinguishing the severe category. Overall, the findings suggest that residual learning-based architectures, particularly ResNet variants, offer a favorable balance between model complexity and classification performance for vehicle accident severity classification.
The present study is not without its limitations. The relatively limited size of the dataset used, particularly the small number of examples in classes such as severe and no_accident, made it difficult for the models to learn these classes. Moreover, the images consist of individual frames and do not contain temporal information. This situation has the effect of preventing the dynamic nature of the accident from being fully reflected in the model. In real-world scenarios, factors such as camera angles, lighting conditions, and environmental noise elements have been shown to have a significant impact on model performance. Rather than constituting a deployable solution, the results of this study are best regarded as a preliminary benchmark that may inform the future design of decision-support tools for traffic safety systems, insurance damage assessment processes, emergency response support, and intelligent transportation infrastructures. In particular, although the ResNet-50 architecture emerged as the most promising candidate among the evaluated architectures, its reported validation accuracy is not yet sufficient for the reliable stand-alone assessment of collision severity, and substantial further validation on larger, multi-view, and more diverse datasets is required before real-world deployment can be considered. Future improvements in model accuracy, robustness, and validation on larger and more diverse datasets may contribute to reducing response times, improving resource allocation, and supporting the development of data-driven traffic safety policies. Additionally, the reliance on a single train–validation split in the absence of an independent test set may limit the robustness of the reported performance estimates. Although cross-validation was considered, the predefined training–validation split of the original CADD dataset was retained to ensure a consistent and reproducible comparison among the evaluated CNN architectures. Future studies should incorporate independent test datasets and cross-validation strategies to provide a more comprehensive assessment of model generalization. In addition, comparisons with more recent architectures such as EfficientNet, Vision Transformers (ViT), and other state-of-the-art image classification frameworks should be conducted to further assess performance in accident damage classification tasks. Furthermore, the development of lightweight and optimized architectures for real-time applications will enhance the system’s usability in field conditions. Overall, the present study provides a comparative benchmark for CNN-based vehicle accident severity classification on the CADD dataset, while highlighting the need for larger datasets, improved class discrimination, and independent external validation before practical deployment can be considered.