Article

A Multi-Source Cross-Domain Data Fusion Framework for Ordinal Health-State Assessment: A Reproducible Surrogate Benchmark Motivated by Hydrogen-Cooled Turbogenerators


1
School of Power and Mechanical Engineering, Wuhan University, Wuhan 430072, China
2
Jiangsu Frontier Electric Power Technology Co., Ltd., Nanjing 211102, China
*
Author to whom correspondence should be addressed.
Appl. Sci. 2026, 16(15), 7764; https://doi.org/10.3390/app16157764
Submission received: 14 June 2026 / Revised: 15 July 2026 / Accepted: 24 July 2026 / Published: 4 August 2026
(This article belongs to the Section Electrical, Electronics and Communications Engineering)

Abstract

Real-world fault data for hydrogen-cooled turbogenerators are scarce and largely proprietary, which hinders data-driven health assessment aligned with severity standards. This paper proposes a standards-aligned, multi-source ordinal fusion framework and demonstrates it, as a proof of concept, on a reproducible four-domain surrogate collection. The collection combines public industrial datasets—SKAB (cooling loop), UCI-WWT (water chemistry), CARE Wind Farm A (electrical and thermal conditions)—and a physics-informed hydrogen-side stream derived from Henry’s law and a continuously stirred tank reactor (CSTR) mass balance, joined by paired sampling. The collection is a methodological benchmark, not a validated diagnostic for any specific machine. A dual-head classifier supervised by a hybrid CORN + EMD ordinal loss, a multi-stream fusion backbone, and a calibrated ensemble with per-model temperature scaling are aligned with the four-level GB/T 43188-2023 scheme (Normal/Attention/Abnormal/Serious). All methods are evaluated under a unified protocol (mean ± standard deviation over three seeds; the deterministic calibrated ensemble is reported as a single value). On 600 fused test samples, the ensemble reaches F1-macro 0.5349, Accuracy 0.6717, Cohen’s κ = 0.4713, and quadratic-weighted kappa (QWK) 0.5948, improving F1-macro by +22.4 pp over the strongest full-scale single-source baseline (InceptionTime on CARE, trained under the identical protocol), with larger rank-aware gains (+30.4 pp on κ, +36.2 pp on QWK). It further improves by +8.9 pp over the strongest cross-entropy fusion baseline retrained under the identical protocol. The results support the methodological claim that fusing four heterogeneous monitoring domains under rank-aware ordinal supervision yields coherent, standards-aligned severity grades, offering a reproducible benchmark and methodology whose transfer to real hydrogen-cooled turbogenerators remains to be validated on co-recorded plant data.

1. Introduction

Hydrogen-cooled turbogenerators are widely used in modern power plants and play a central role in centralized power generation, especially in the 300–1000 MW class of thermal and nuclear power plants worldwide. The superior thermal conductivity and the low windage loss of hydrogen together permit considerably higher power densities than air-cooled designs [1,2]. However, to operate safely at machine ratings above 600 MW, the simultaneous integrity of four weakly coupled physical subsystems is required, including: a mechanical cooling loop, in which oil and water pumps circulate coolant through the bearings and stator end-windings; a stator water-chemistry loop, in which deionized water is forced through hollow copper conductors and must satisfy strict specifications on conductivity, pH, and dissolved-oxygen concentration; an electromagnetic and thermal subsystem composed of the rotor field, the stator core, and the slot insulation system [2]; and a hydrogen-side subsystem that is responsible for maintaining casing pressure, for monitoring purity, and for tracking any migration of dissolved hydrogen into the stator coolant [1]. Even a minor fault in any one of these subsystems, such as bearing pump cavitation, a localized increase in water conductivity, an inter-turn short circuit, or a casing micro-leak, may rapidly evolve into stator overheating, insulation breakdown, or a forced outage. Such an outage leads to significant operational losses per event [3] and explains why the condition of every one of the four loops must be tracked simultaneously rather than in isolation. To standardize the evaluation of such conditions, the Chinese national standard GB/T 43188-2023 [4] (Guide for Condition Evaluation of Turbogenerators, effective from 1 April 2024) prescribes a four-level ordinal scheme (Normal/Attention/Abnormal/Serious) that explicitly couples the operational severity with the prescribed maintenance actions. Together with the underlying type-test specification GB/T 7064-2017 [5] for cylindrical-rotor synchronous machines, this rubric defines a regulator-aligned assessment target against which any practical condition-evaluation pipeline for such machines must ultimately be measured if its outputs are to carry regulatory weight. Therefore, the automation of this four-level grading from heterogeneous, multi-rate sensor streams has become an increasingly critical industrial requirement.
In recent years, data-driven condition monitoring of large electrical machines has progressed rapidly, transitioning from univariate threshold checks toward multivariate machine learning frameworks [3,6,7,8]. Classical supervisory control and data acquisition (SCADA)-based bearing-fault studies have demonstrated that even unlabeled operational data can yield useful health indicators [9]. Modern architectures such as TimesNet [10], PatchTST [11], and InceptionTime [12] have been widely adopted as time-series classification benchmarks, and multi-source signal fusion combining vibration, current, and thermal channels has further been shown to often surpass single-channel models on the same task [13]. For synchronous machines, frequency-response analysis combined with deep networks has been applied to stator inter-turn short-circuit detection [14], and recent frameworks have addressed calibration under distribution shift [15]. In the more specific context of hydrogen-cooled turbogenerators, Yang et al. [16] trained a sparse-autoencoder–LSTM model on distributed-control-system records and achieved an 85 h early warning of stator-winding overheating. This is the closest known precedent for the machine class addressed in this work. The broader literature has stressed both the diversity of relevant signal modalities and the persistent challenge of data scarcity [8].
Despite this progress, three challenges remain unresolved for standards-aligned, multi-physics health assessment of hydrogen-cooled turbogenerators. First, real-world fault data of such machines are scarce and proprietary; safety and commercial constraints keep annotated records of dissolved hydrogen, water chemistry, and leak events out of the public domain, and even the closest prior study [16] is trained on a closed corporate dataset that cannot be redistributed. Second, a systematic cross-domain fusion strategy, mapping each subsystem onto a public industrial dataset governed by analogous dynamics and fusing the four into one labeled collection, has not been explored; published alternatives mainly rely on digital-twin domain adaptation for rolling bearings [17,18], which depends on high-fidelity plant models and rarely captures the coupled hydraulic, chemical, electromagnetic, and gas physics. Third, the four-level ordinal grading of GB/T 43188-2023 [4,5] has not yet been implemented within a deep learning framework, to the best of the authors’ knowledge: most multi-source fusion studies treat the severity levels as mutually exclusive classes [13,19,20]. This discards the natural ordering, so that a Serious-as-Normal miss is penalized as lightly as a Serious-as-Abnormal one. Ordinal regression has been studied for offshore wind-turbine faults under few-shot conditions [21] but not combined with multi-source cross-domain fusion in the generator setting, nor with rank-consistent CORN-style losses [22]. Hydrogen-side monitoring data are moreover seldom reported in the open literature, and no prior pipeline has reconstructed this subsystem from first principles using Henry’s law and CSTR mass-balance arguments [23,24,25].
To address these gaps, this paper proposes a multi-source cross-domain ordinal fusion methodology and evaluates it on a reproducible surrogate benchmark whose four domains are mapped—by documented physical and standards-based analogies—onto the subsystems of a hydrogen-cooled turbogenerator. The benchmark is explicitly aligned with GB/T 43188-2023 and developed entirely on publicly available data. We stress at the outset that this study is a methodological proof of concept on surrogate data, not a validated machine-specific diagnostic; external validity to real machines is left to future co-recorded plant data. The main contributions are summarized as follows. (i) A cross-domain analogous-mapping methodology maps each subsystem onto a public industrial dataset governed by analogous dynamics (SKAB for the cooling loop, UCI-WWT for the water chemistry, and CARE Wind Farm A for the electrical-thermal conditions), with the analogy ranging from close for the mechanical and hydrogen-side streams to qualitative for the water chemistry. The methodology further adds a physics-informed hydrogen-side stream from Henry’s law [23] and a CSTR mass balance [24,25] parameterized to GB/T 7064-2017 [5] and DL/T 801-2010 [26]. The four corpora are joined by paired sampling and released as a reproducible four-domain collection. (ii) An ordinal-aware fusion architecture is trained with a hybrid loss combining the rank-consistent CORN ordinal regression [22] with a squared Earth Mover’s Distance term, together with a calibrated ensemble using per-model temperature scaling; a controlled comparison shows temperature scaling alone to be the most reliable, whereas learned class offsets overfit the validation set on larger model pools. (iii) On a held-out four-domain test set, the framework outperforms both the strongest full-scale single-source baseline [12] (InceptionTime) and the strongest cross-entropy fusion baseline retrained under the identical protocol across F1-macro, Accuracy, Cohen’s κ , and quadratic-weighted kappa, with the largest gains on the rank-aware metrics; full results are reported in Section 4, and all code and split files are released for independent verification.
The remainder of this paper is organized as follows. Section 2 introduces the four source domains and the physics-informed hydrogen-side stream. Section 3 presents the ordinal labeling scheme, the proposed dual-head fusion architecture, and the hybrid CORN + EMD loss. Section 4 presents the experimental results and the corresponding discussion. Section 5 concludes the paper.

2. Datasets

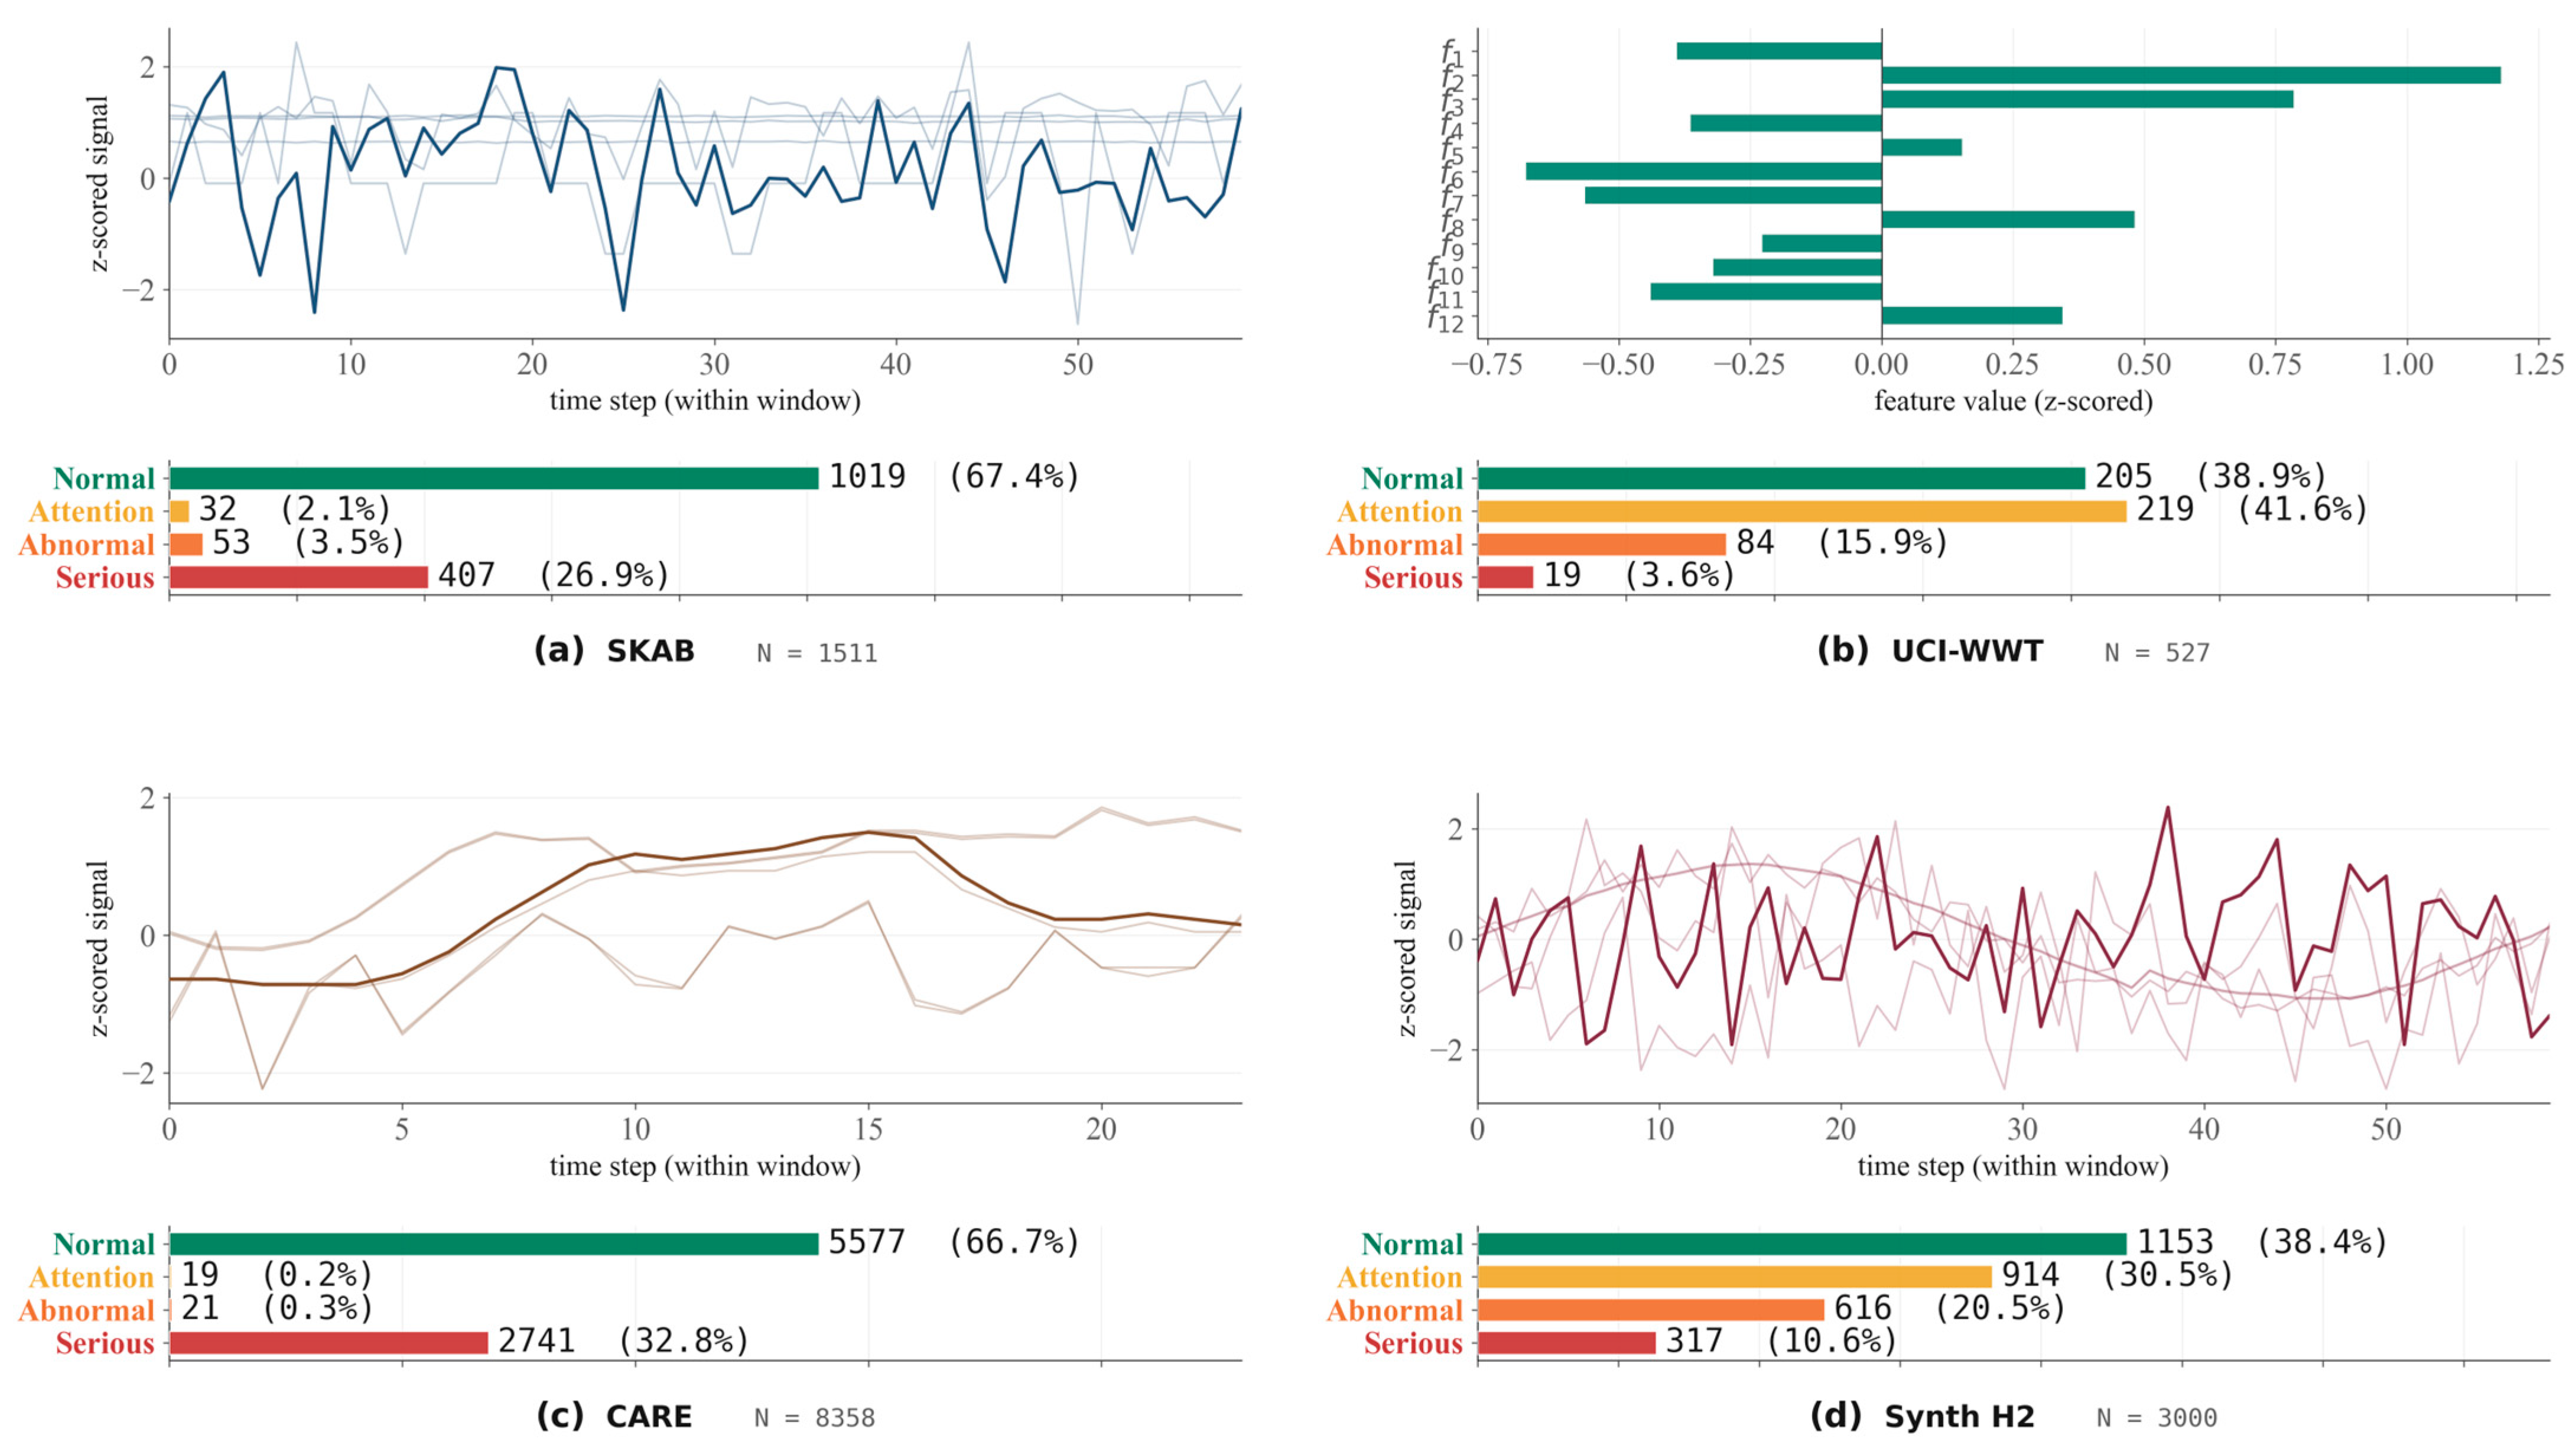
The data collection comprises four datasets that jointly cover the mechanical, chemical, electrical-thermal, and hydrogen-side subsystems of a hydrogen-cooled turbogenerator. Three are drawn from publicly released industrial sources: SKAB v0.9 [27] for the cooling loop, UCI-WWT [28] for the stator water chemistry, and CARE Wind Farm A [29] for the generator electrical and thermal conditions. The fourth (Synth H2) is generated from first principles for the hydrogen side, since field-recorded hydrogen-side data are rarely accessible owing to operational constraints [16]. Each dataset is windowed and labeled with the four-level ordinal scheme of GB/T 43188-2023 [4], and the paired-sampling strategy that combines them into the train/validation/test splits is detailed below. The four-domain layout, with a representative input window and the class-wise sample distribution of each dataset, is summarized in Figure 1, making the heterogeneity of the four sources apparent before any fusion is attempted.
The four corpora differ widely. Figure 1 shows that they differ markedly in sample size (N = 527 to 8358). They differ in class balance (SKAB is dominated by Normal at 67.4%, CARE is bimodal at Normal/Serious, and Synth H2 is sampled to populate all four grades at 0.40 / 0.30 / 0.20 / 0.10 ), and in input modality (three multivariate time series and one tabular snapshot). The four datasets are detailed below as (1)–(4).
(1)
SKAB (mechanical cooling loop). SKAB v0.9 [27], collected from a laboratory water-pump testbed, covers the mechanical cooling loop, since it shares the pump-motor hydraulic dynamics that govern the stator cooling water circuit. Eight channels sampled at 1 Hz (accelerometer RMS, motor current/voltage, pump pressure, coolant/motor temperatures, and flow rate) are divided into 60 s windows with stride 30 s and channel-wise z-score standardization, yielding 1511 windows of shape [ T = 60 , F = 8 ] . The per-window ordinal labels are derived from the anomaly ratio r = 1 T t = 1 T a t via the thresholding described below.
(2)
UCI-WWT (water chemistry). UCI-WWT [28] covers the water-chemistry domain with 527 daily physico-chemical records from a wastewater treatment facility, of which twelve features (conductivity, pH, biochemical oxygen demand (BOD), chemical oxygen demand (COD), suspended solids, sediment, zinc, and flow) are retained. Conductivity and pH overlap qualitatively with the indicators specified in DL/T 801-2010 [26], although the absolute conductivity of municipal wastewater is about two orders of magnitude higher than that of a deionized stator-coolant loop; the per-feature z-score standardization therefore retains the relative variation that drives the ordinal label, as is standard for heterogeneous-scale fusion, while the remaining features have no direct counterpart in a deionized loop (discussed in the validity analysis). Quantities such as BOD, COD, and suspended solids have no physical counterpart in an ultra-pure, deionized stator water loop; UCI-WWT therefore serves as a mathematical surrogate that supplies a heterogeneous tabular stream with an ordinal degradation signal, rather than a replica of the water-chemistry subsystem. Missing values are median-imputed, yielding 527 tabular samples of shape [ F = 12 ] . The per-sample ordinal label is derived from the BOD removal efficiency η = 1 BOD-out / BOD-in . Specifically, the four ordinal levels are obtained by binning η at the fixed thresholds 0.91/0.87/0.80 listed in Table 1, which yields a 205/219/84/19 class distribution for this domain (Figure 1b). Since the label η shares information with the two BOD channels that are also model inputs, UCI-WWT contributes mainly as one heterogeneous tabular stream within the fused task, where the max-aggregation rule bounds the influence of any single domain on the final grade.
(3)
CARE (electrical-thermal SCADA). CARE Wind Farm A [29] covers the electrical-thermal side with 22 SCADA recordings from an onshore Portuguese Wind Farm. The 46 channels available as 10 min averages are processed into 24-point sliding windows (stride 6, 4 h segments) with z-score standardization, yielding 8358 windows of shape [ T = 24 ,   F = 46 ] . As the dataset is released with anonymized channel identifiers, CARE is used as a high-dimensional rotating-machinery SCADA stream that supplies a realistic multivariate electrical-thermal covariance structure and timestamped anomaly ground truth. This is the information the fusion model exploits, rather than a channel-level replica of a turbogenerator. Its event-level Normal/Anomaly labels provide the binary ground truth from which the ordinal levels are derived through the temporal overlap between each window and a labeled event; as with the other proxy domains, this ordinal information enters the fused task under the max-aggregation rule that bounds any single domain’s contribution. Because the native annotation is binary, the CARE domain is strongly concentrated on the Normal and Serious grades (5577/19/21/2741 windows); the two intermediate grades receive only 0.2% and 0.3% of the windows, so this domain contributes to them mainly indirectly, via the max-aggregation rule in the fused label.
(4)
Synth H2 (hydrogen-side stream). Since field-recorded dissolved-hydrogen monitoring data from hydrogen-cooled turbogenerators are rarely accessible owing to safety and commercial constraints [16], a physics-informed domain (Synth H2) is generated from Henry’s law [23]:
C H 2 * ( T ) = H ° e x p Δ s o l H R 1 T 1 T ° p H 2
with H ° = 7.8 × 10 6   m o l   m 3   P a 1 at T ° = 298.15   K and Δ s o l H = 4.4   k J   m o l 1 [23], while the mass transport in the closed cooling loop is described by [25]:
V C ˙ o u t = m ˙ l e a k + Q C i n Q C o u t
where C i n and C o u t are the inlet and outlet dissolved-hydrogen concentrations (mol m 3 ), Q is the coolant volumetric flow rate ( m 3   s 1 ), and m ˙ l e a k is the hydrogen leak rate (mol s 1 ), with C i n treated as the make-up concentration returned through the hydrogen cooler so that the balance reduces to the closed-loop limit when C i n = C o u t ; the effective control volume is V = 1.5 m3, giving a first-order time constant τ = V / Q in the range 45–135 s. The leak bands below are specified in μ g h 1 and converted by m ˙ l e a k = m ˙ μ g / h / ( M H 2 10 6 3600 ) with M H 2 = 2.016 g m o l 1 . The operating envelopes (coolant flow 40–120 t/h, inlet temperature 40–48 °C, hydrogen pressure 0.3–0.5 MPa, purity 96–99.5%) are taken from GB/T 7064-2017 [5] and DL/T 801-2010 [26]. Four leakage severity bands (<50, 50–500, 500–5000, and >5000 μg/h) span approximately one decade each and map onto the four GB/T 43188 grades; the dissolved-hydrogen channels are used as relative-trend indicators rather than absolute-concentration alarms. Sampling these bands with probabilities 0.40 / 0.30 / 0.20 / 0.10 produces 3000 one-hour windows of shape [ T = 60 , F = 10 ] , each carrying ten channels (inlet/outlet dissolved hydrogen, inlet/outlet temperatures, coolant flow and pressure, unit load, hydrogen pressure, purity, and dew point). The gas-side channels (pressure, purity, dew point) are sampled independently within the same operating envelopes. The generation approach follows the digital-twin-driven data augmentation adopted in recent bearing-fault studies [17,18], and the leakage bands are of the same order of magnitude as the dissolved-hydrogen ranges qualitatively described in [16].

3. Methodology

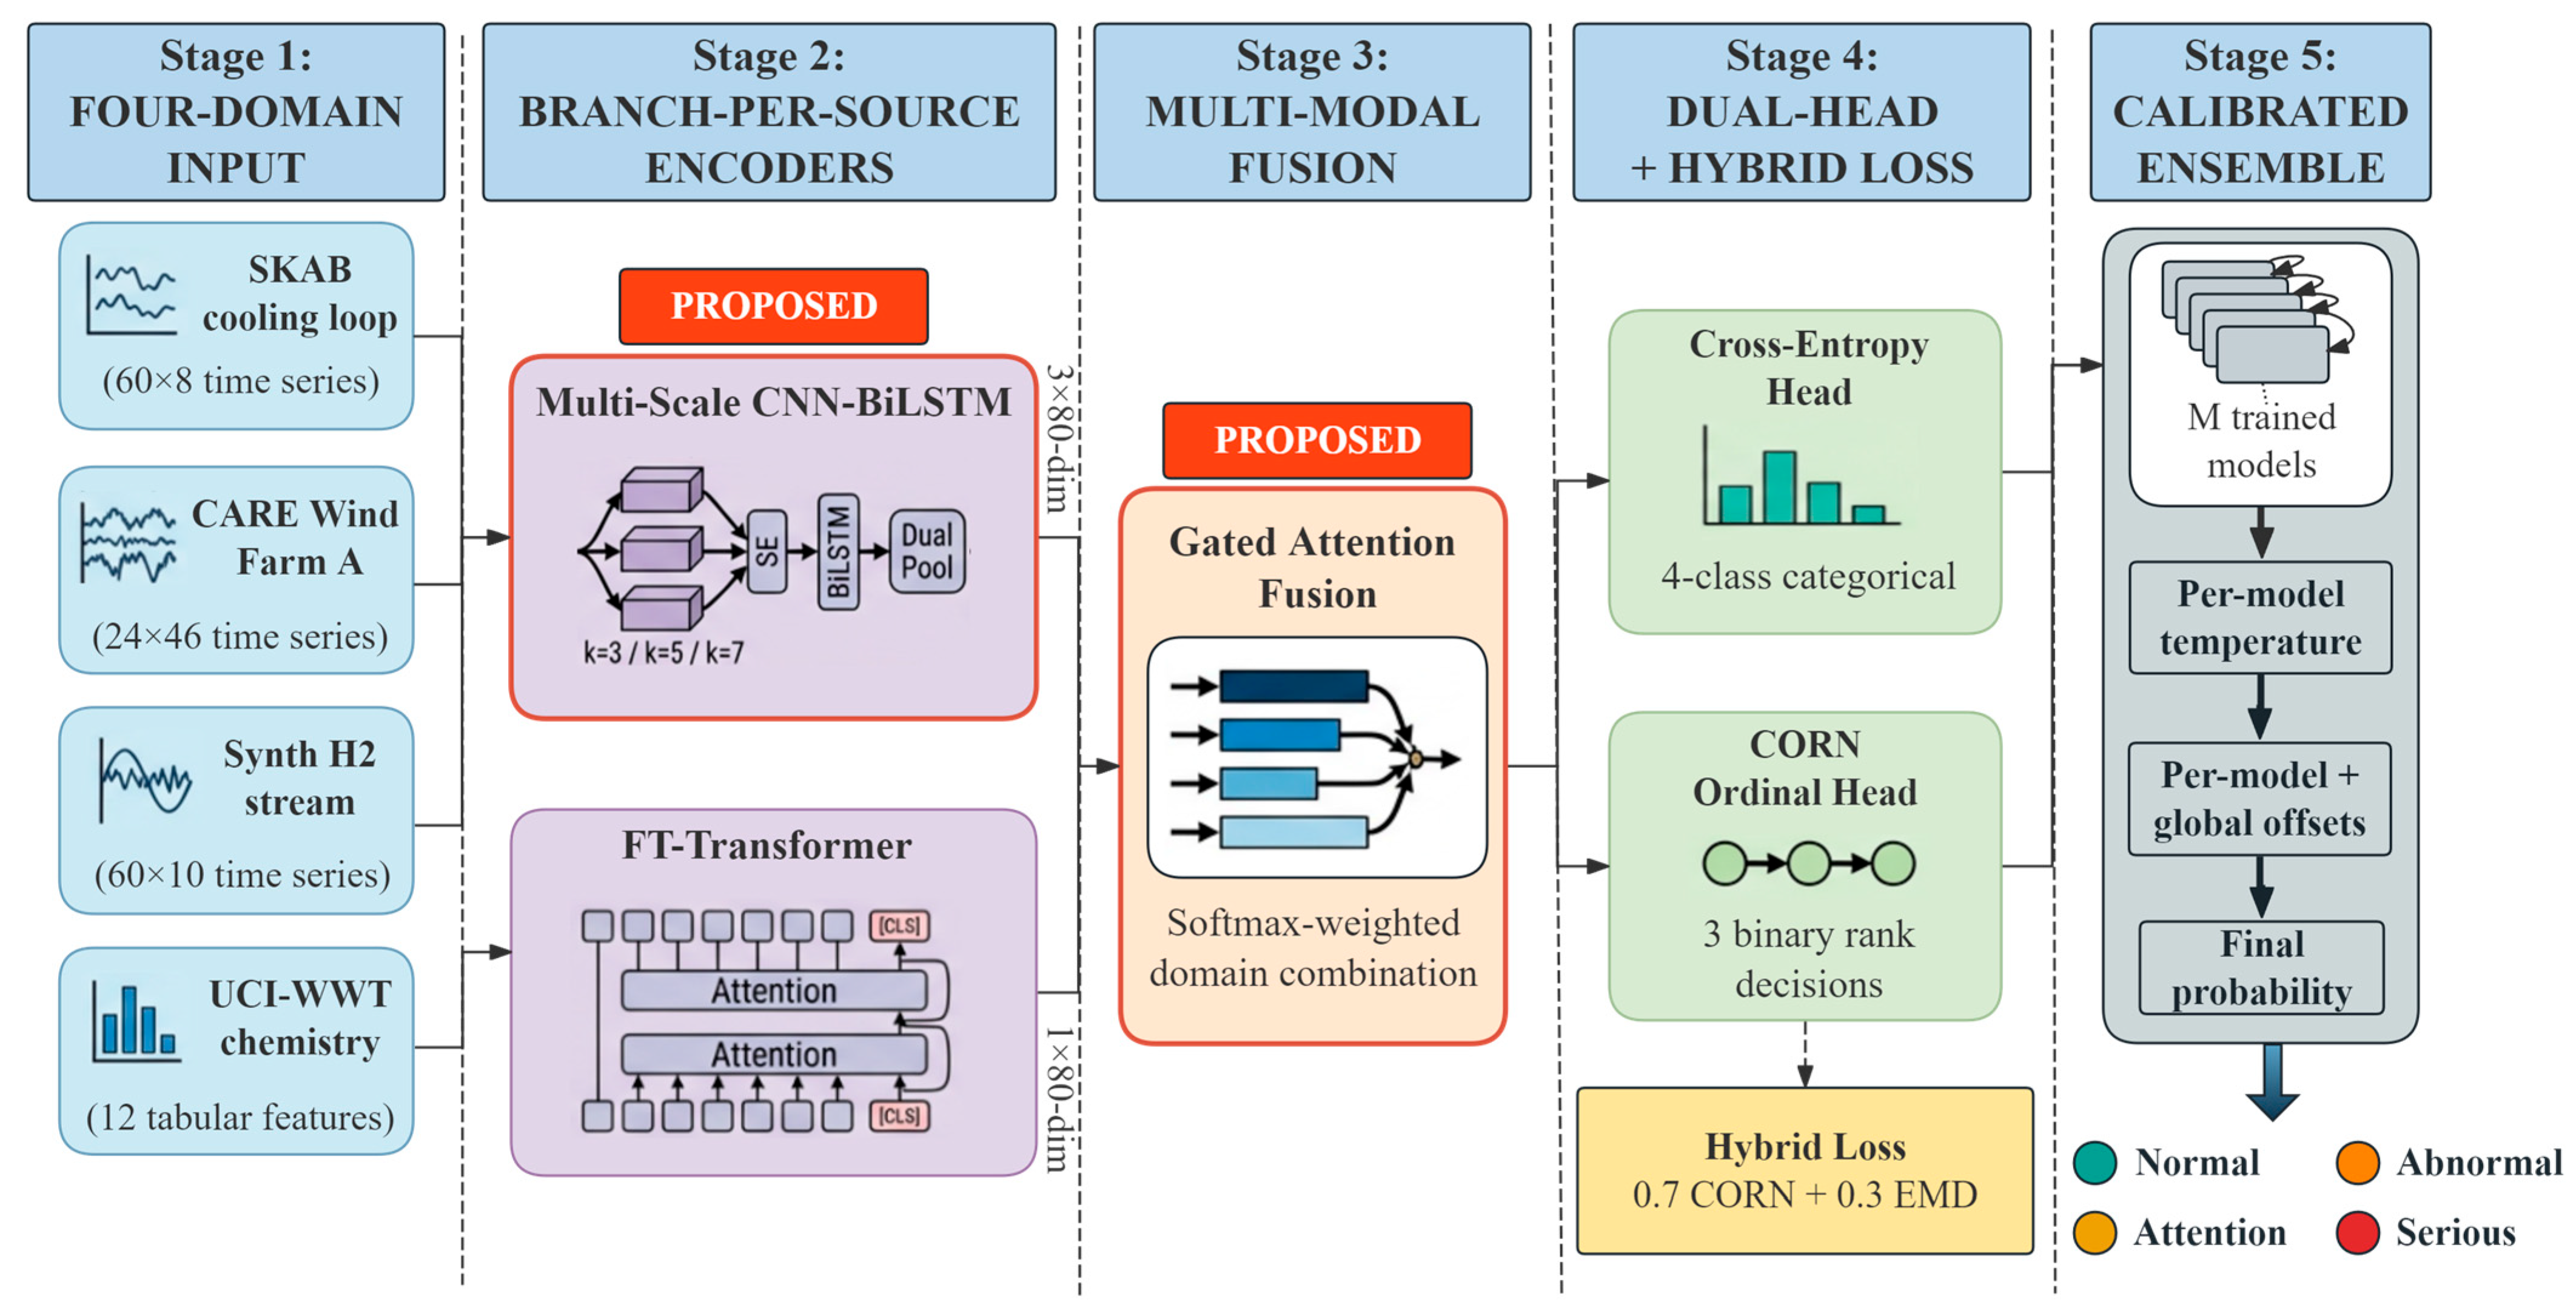
On the basis of the four-domain data collection introduced in Section 2, this section presents the proposed multi-source data fusion framework. The ordinal labeling scheme and data splits are first described, followed by the architecture and loss design, and finally the training, ensemble calibration, and evaluation procedure. As illustrated in Figure 2, the framework consists of three sequential modules: a domain-specific encoder bank, a multi-modal fusion module, and a dual-head classifier comprising a cross-entropy branch and a CORN ordinal branch, followed by a calibrated ensemble that aggregates multiple trained models. Two key design principles are adopted. (i) The four heterogeneous source domains are kept independent at the input stage and are only integrated at the fusion module, thus preserving per-domain semantics and enabling explicit domain-level credit assignment. (ii) The dual-head output couples a standard cross-entropy branch with a CORN ordinal branch over the same fused representation, allowing rank-aware and categorical supervision to be combined without modifying the upstream encoders.
As seen in Figure 2, the raw inputs from the four domains first pass through their respective encoders to produce fixed-length embeddings, which are then fused by the Gated attention module; the fused representation is simultaneously supervised by the cross-entropy head and the CORN ordinal head, and the trained models are finally aggregated through the calibrated ensemble to yield the four-level severity output.

3.1. Data Labeling and Splits

Each domain produces its own four-level label (0 = Normal, 1 = Attention, 2 = Abnormal, 3 = Serious) according to the dataset-specific rules summarized in Table 1. For the three time-series domains (SKAB, CARE, Synth H2), the per-window label is derived from the anomaly ratio r through shared thresholds (0, 0.30, 0.70) that approximate the ordinal cut-offs of GB/T 43188-2023 [4]. For UCI-WWT, the label is instead determined by the BOD removal efficiency η . These per-domain thresholds map four physically different quantities ( r , η , and absolute leakage rate) onto a shared ordinal scale { 0 , 1 , 2 , 3 } ; what the four domains share is therefore the ordinal rank rather than a calibrated physical severity, and this cross-domain commensurability is assumed by construction rather than independently validated. The worst-subsystem aggregation therefore operates on ranks and is not claimed to equalize the physical severity represented by each domain.
It can be observed from Table 1 that the three time-series domains share a unified anomaly ratio threshold structure, while UCI-WWT adopts a domain-specific efficiency metric; the Synth H2 thresholds are set in terms of absolute leakage rate to match the physical severity bands.
The per-domain labels are then combined into a single fused label through paired random sampling across the four domains within each split: for each fused sample, one window (or record) is drawn independently from each domain without requiring temporal alignment. This produces a four-tuple of subsystem-level health states whose fused label follows the worst-subsystem rule. This paired-sampling protocol is a data-construction device under scarcity rather than a reconstruction of genuine cross-subsystem co-occurrence, as discussed in Section 4.5. The fused ordinal label is computed by the worst-subsystem rule
y f u s e d = m a x y s k a b , y u c i , y c a r e , y s y n t h
which follows the GB/T 43188 principle that the overall condition of a generator is governed by its most degraded subsystem. A total of 4200 fused samples are constructed by paired random sampling and partitioned with a 70/15/15 stratified scheme (seed = 42) into 3000/600/600 samples for train/validation/test. The rationale and limitations of this construction are discussed in Section 4.5. The resulting per-split class distribution is summarized in Table 2: the Serious grade dominates, because the worst-subsystem rule of Equation (3) promotes any four-tuple containing a single Serious component straight to that grade. This imbalance directly motivates the imbalance-aware training and rank-aware loss of Section 3.4.
Table 2 reports a class distribution that is heavily skewed towards the Serious grade (~57%), while the Normal grade accounts for only ~6%, reflecting the effect of the max-aggregation rule. This severe imbalance directly motivates the rank-aware hybrid loss described below.

3.2. Multi-Stream Encoder–Fusion Network

Because SKAB, CARE, and Synth H2 are multivariate time series of different length and width while UCI-WWT is a single tabular snapshot, a branch-per-source design is adopted: each domain has a dedicated encoder mapping its raw input to a d -dimensional embedding ( d = 80 unless otherwise noted). This keeps the per-domain feature geometry intact until fusion, rather than forcing all four streams through a shared front end. The five encoder candidates and four fusion heads evaluated in the ablation study are introduced as follows.
(1)
Encoders. The five encoder candidates comprise three time-series variants (for SKAB, CARE, and Synth H2) and two tabular variants (for UCI-WWT). For the three time-series domains, the following three architectures are considered. The first, CNN-LSTM, applies two 1D-convolutional layers (kernel size 3, 32 channels, ReLU) followed by a one-layer bidirectional LSTM and attention pooling, projecting the output to R d . The second, Multi-Scale, extends this design with three parallel convolutions of kernel sizes { 3 , 5 , 7 } , a Squeeze-and-Excitation channel-recalibration block [30], a two-layer BiLSTM, and a dual-pooling aggregation defined in Equation (4):
h ( s ) = P r o j A t t n P o o l ( H ( s ) ) M a x P o o l ( H ( s ) ) , H ( s ) = B i L S T M 2 S E [ C o n v 3 C o n v 5 C o n v 7 ] ( x ( s ) )
The third, Conv-Transformer (1D-conv stem followed by a three-layer Transformer with 4 heads and feedforward width 160), is included as an attention-based variant. For the tabular UCI-WWT domain, the two candidates are a three-layer MLP (hidden dimension 128, Gaussian error linear unit (GELU) activation, dropout 0.2) or an FT-Transformer [31] is used; in the latter, each scalar feature x i is independently tokenized through a learnable linear embedding, and a three-layer Transformer encoder with a prepended [CLS] token aggregates the feature representations.
(2)
Fusion heads. Given the four domain embeddings { h ( 1 ) , , h ( 4 ) } , four fusion strategies of increasing expressiveness are evaluated. The first head, Concat, concatenates the four vectors and passes them through a two-layer MLP to produce h f u s e = M L P ( [ h ( 1 ) h ( 4 ) ] ) . The second head, the Gated multi-modal unit [32], projects each branch through a tanh nonlinearity and combines them with learned softmax-normalized weights g Δ S 1 as in Equation (5):
h ~ ( s ) = t a n h ( W s h ( s ) ) , g = s o f t m a x W g h ~ ( 1 ) h ~ ( 4 ) , h f u s e = s = 1 4 g s h ~ ( s )
The third head, Cross-Attention, stacks the four embeddings as a length-4 sequence with learnable source-position embeddings, processes them through a three-layer Transformer encoder, and mean-pools the output. The fourth head, Attn-Gated, extends Cross-Attention with per-source softmax pooling and layer normalization, as formalized in Equation (6):
α s = s o f t m a x W α h s a t t n , h f u s e = L a y e r N o r m s = 1 4 α s h s a t t n
The four strategies form a parameter ladder (Concat < Gated < Cross-Attention < Attn-Gated), so that the ablation study can isolate the incremental benefit of each successive fusion stage.

3.3. Dual-Head Output and Hybrid Ordinal Loss

Two heads share one representation. From the fused representation h f u s e , the network produces two parallel sets of logits. The cross-entropy head outputs l C E = W C E h f u s e R K ( K = 4 ), supporting the standard and class-rebalanced categorical losses, while the CORN ordinal head outputs l C O R N = W C O R N h f u s e R K 1 , in which each dimension corresponds to a binary rank decision P r ( y > i y i ) . Inference uses a chain rule. The CORN logits are converted into class probabilities through the conditional chain rule of [22], given in Equation (7),
P r ( y = k ) = i = 0 k 1 σ ( l i ) 1 σ ( l k ) , P r ( y = K 1 ) = i = 0 K 2 σ ( l i )
Two rank-aware losses supervise it. The CORN head is trained with both. The CORN loss treats each cumulative rank as an independent binary classification, evaluated only on the samples reaching that rank,
L C O R N = 1 K 1 i = 0 K 2 1 | S i | n S i B C E σ l i n ,   1 [ y ( n ) > i ]
with S i = { n : y ( n ) i } . The squared Earth Mover’s Distance (EMD) loss [33] penalizes the squared gap between the cumulative predicted and target distributions,
L E M D = k = 0 K 1 ( C D F p r e d ( k ) C D F t r u e ( k ) ) 2
The two are then blended. On this basis, the ordinal losses are combined in a fixed proportion to form the proposed hybrid loss,
L C O R N + E M D = 0.7 L C O R N + 0.3 L E M D
with the 0.7/0.3 weighting chosen to prioritize the rank-consistency term while retaining distance-aware regularization. The two terms are complementary: CORN enforces rank consistency but is largely indifferent to error magnitude. EMD, by contrast, is magnitude-sensitive but not rank-consistent. The higher CORN weight therefore preserves the rank-consistency bias while EMD discourages the predicted distribution from drifting far from the true grade. In total, eight loss variants are compared under a single fixed CNN-LSTM + MLP + Concat backbone, so that any difference is attributable to the loss alone: cross-entropy (CE) as the baseline; three ordinal losses, CORN (Equation (8)), EMD (Equation (9)), and the proposed CORN + EMD (Equation (10)); and three imbalance-aware losses, Class-Balanced Focal [34], Balanced Softmax [35], and LDAM [36], together with a triple blend (CORN + LDAM + EMD).

3.4. Training, Ensemble Calibration, and Evaluation Procedure

Four training ingredients are applied jointly to mitigate class imbalance and stabilize convergence: (a) a WeightedRandomSampler with per-sample weight 1 / n y i and num_samples = 4 m a x j n j per epoch; (b) per-sample augmentation of the time-series branches only (Gaussian noise σ = 0.025 , circular time shift ± 5 steps, amplitude scaling in [ 0.85 , 1.15 ] ; Mixup [37] is available but disabled in the reported runs); (c) AdamW (learning rate 5 × 10 4 , weight decay 2 × 10 4 , batch size 64) with 5-epoch warm-up, cosine annealing over 70 epochs, gradient clipping at 3.0, and early stopping on validation F1-macro (patience 18); and (d) three random seeds { 42 , 123 , 2024 } per configuration, implemented in PyTorch 2.6.0 with CUDA 12.4.
Calibration proceeds in four stages. Given M individually trained models producing class-probability vectors p ( m ) Δ K 1 , a four-stage calibration-and-aggregation pipeline is applied to construct the final ensemble. (a) A per-model scalar temperature T m is fitted on the validation set by minimizing the negative log-likelihood, as in Equation (11),
T m = a r g m i n T > 0 n = 1 N v a l l o g s o f t m a x l o g p ( m , n ) T y n
An offset is fitted next. (b) A per-model class-specific log-probability offset o m R K is determined by coordinate-descent grid search maximizing validation F1-macro. (c) The calibrated per-model log-probabilities are combined and renormalized via a geometric mean in probability space, as in Equation (12),
p ¯ f i n a l = s o f t m a x 1 M m = 1 M l o g p ( m ) T m + o m + o g l o b a l
A global offset closes it. (d) A global class offset o g l o b a l is finally fit on the validation-set ensemble output to absorb residual systematic biases; setting o g l o b a l = 0 recovers the three-stage variant. The sub-ensembles are the 26 dual-head models (ours-only), the six legacy single-loss baselines (legacy-only), and the combined 32-model pool. The ours-only pool is intentionally heterogeneous to maximize ensemble diversity: it spans the CNN-LSTM and Multi-Scale encoder backbones, the Concat/Gated/Attn-Gated fusion heads, and three random seeds. It combines the rank-aware ordinal losses (CORN, CORN + EMD, and the CORN + LDAM + EMD blend) with the imbalance-aware losses (Class-Balanced Focal and Balanced Softmax); it further includes eight self-supervised pre-trained variants obtained from a two-stage procedure in which the time-series encoders are first pre-trained with a masked-reconstruction objective on the unlabeled windows and then fine-tuned with the dual-head supervision. The legacy-only pool comprises six fusion models from an earlier architecture generation, built from the {LSTM, CNN-LSTM, Transformer} sequence encoders and the {Concat, Attention} fusion heads and trained with the rank-consistent CORN objective (K−1 cumulative-logit head). Because the geometric-mean aggregation of Equation (12) operates on calibrated probabilities and is agnostic to the loss used to train each member, models trained under different objectives can be combined without inconsistency. A complete inventory of the 32 members (encoder, fusion head, loss, seed, and training stage) is provided in the Supplementary Materials.
All experiments use the fixed 3000/600/600 split. Every method in Table 3—the proposed models and all baselines—is reported as the mean ± standard deviation over the same three random seeds {42, 123, 2024}; the calibrated ensemble, being a deterministic function of its trained members, is reported as a single value. Six metrics are computed (Accuracy, F1-macro, F1-weighted, Cohen’s κ , QWK, and mean absolute error), of which the four most informative (F1-macro, Accuracy, κ , QWK) are tabulated, and the full breakdown is given in the Supplementary Materials. F1-macro and QWK are prioritized over Accuracy under the severe class imbalance, since Accuracy is dominated by the majority Serious grade. QWK instead weights pairwise disagreements by squared distance [22,33] and thus penalizes a Serious-as-Normal miss far more heavily than a Serious-as-Abnormal one, exactly as a severity-grading system requires. The thirteen baselines span four families: (a) classical ML (XGBoost, random forest, logistic regression) on flattened multi-domain features; (b) single-domain deep models (Transformer on SKAB/CARE/Synth H2; MLP on UCI); (c) modern time-series architectures (TimesNet [10], PatchTST [11], and InceptionTime [12]); and (d) multi-source fusion baselines from the earlier architecture generation, retrained under both the cross-entropy and the rank-consistent CORN objectives. All baselines are re-implemented at full scale with parameter counts matched to their original publications and are trained under the protocol of this section; the exact configurations are provided in the released code to support reproducibility.

4. Results and Discussion

The proposed framework is evaluated on the four-domain test set against thirteen baselines, after which controlled ablations isolate the contributions of the ordinal loss, the encoder–fusion configuration, and the calibrated ensemble, and the limitations are then discussed.

4.1. Comparison with State-of-the-Art Methods

Building on the framework and training procedure of Section 3, the proposed framework is first set against thirteen baseline methods on the 600-sample test set (Table 3). Across heterogeneous inputs, the single-domain models (rows 1–6 and 10–11) observe a single subsystem’s input and are trained to predict the machine-level fused grade of Equation (3), whereas the multi-source methods (rows 7–9 and 12–15) are trained on the fused labels obtained by Equation (3).
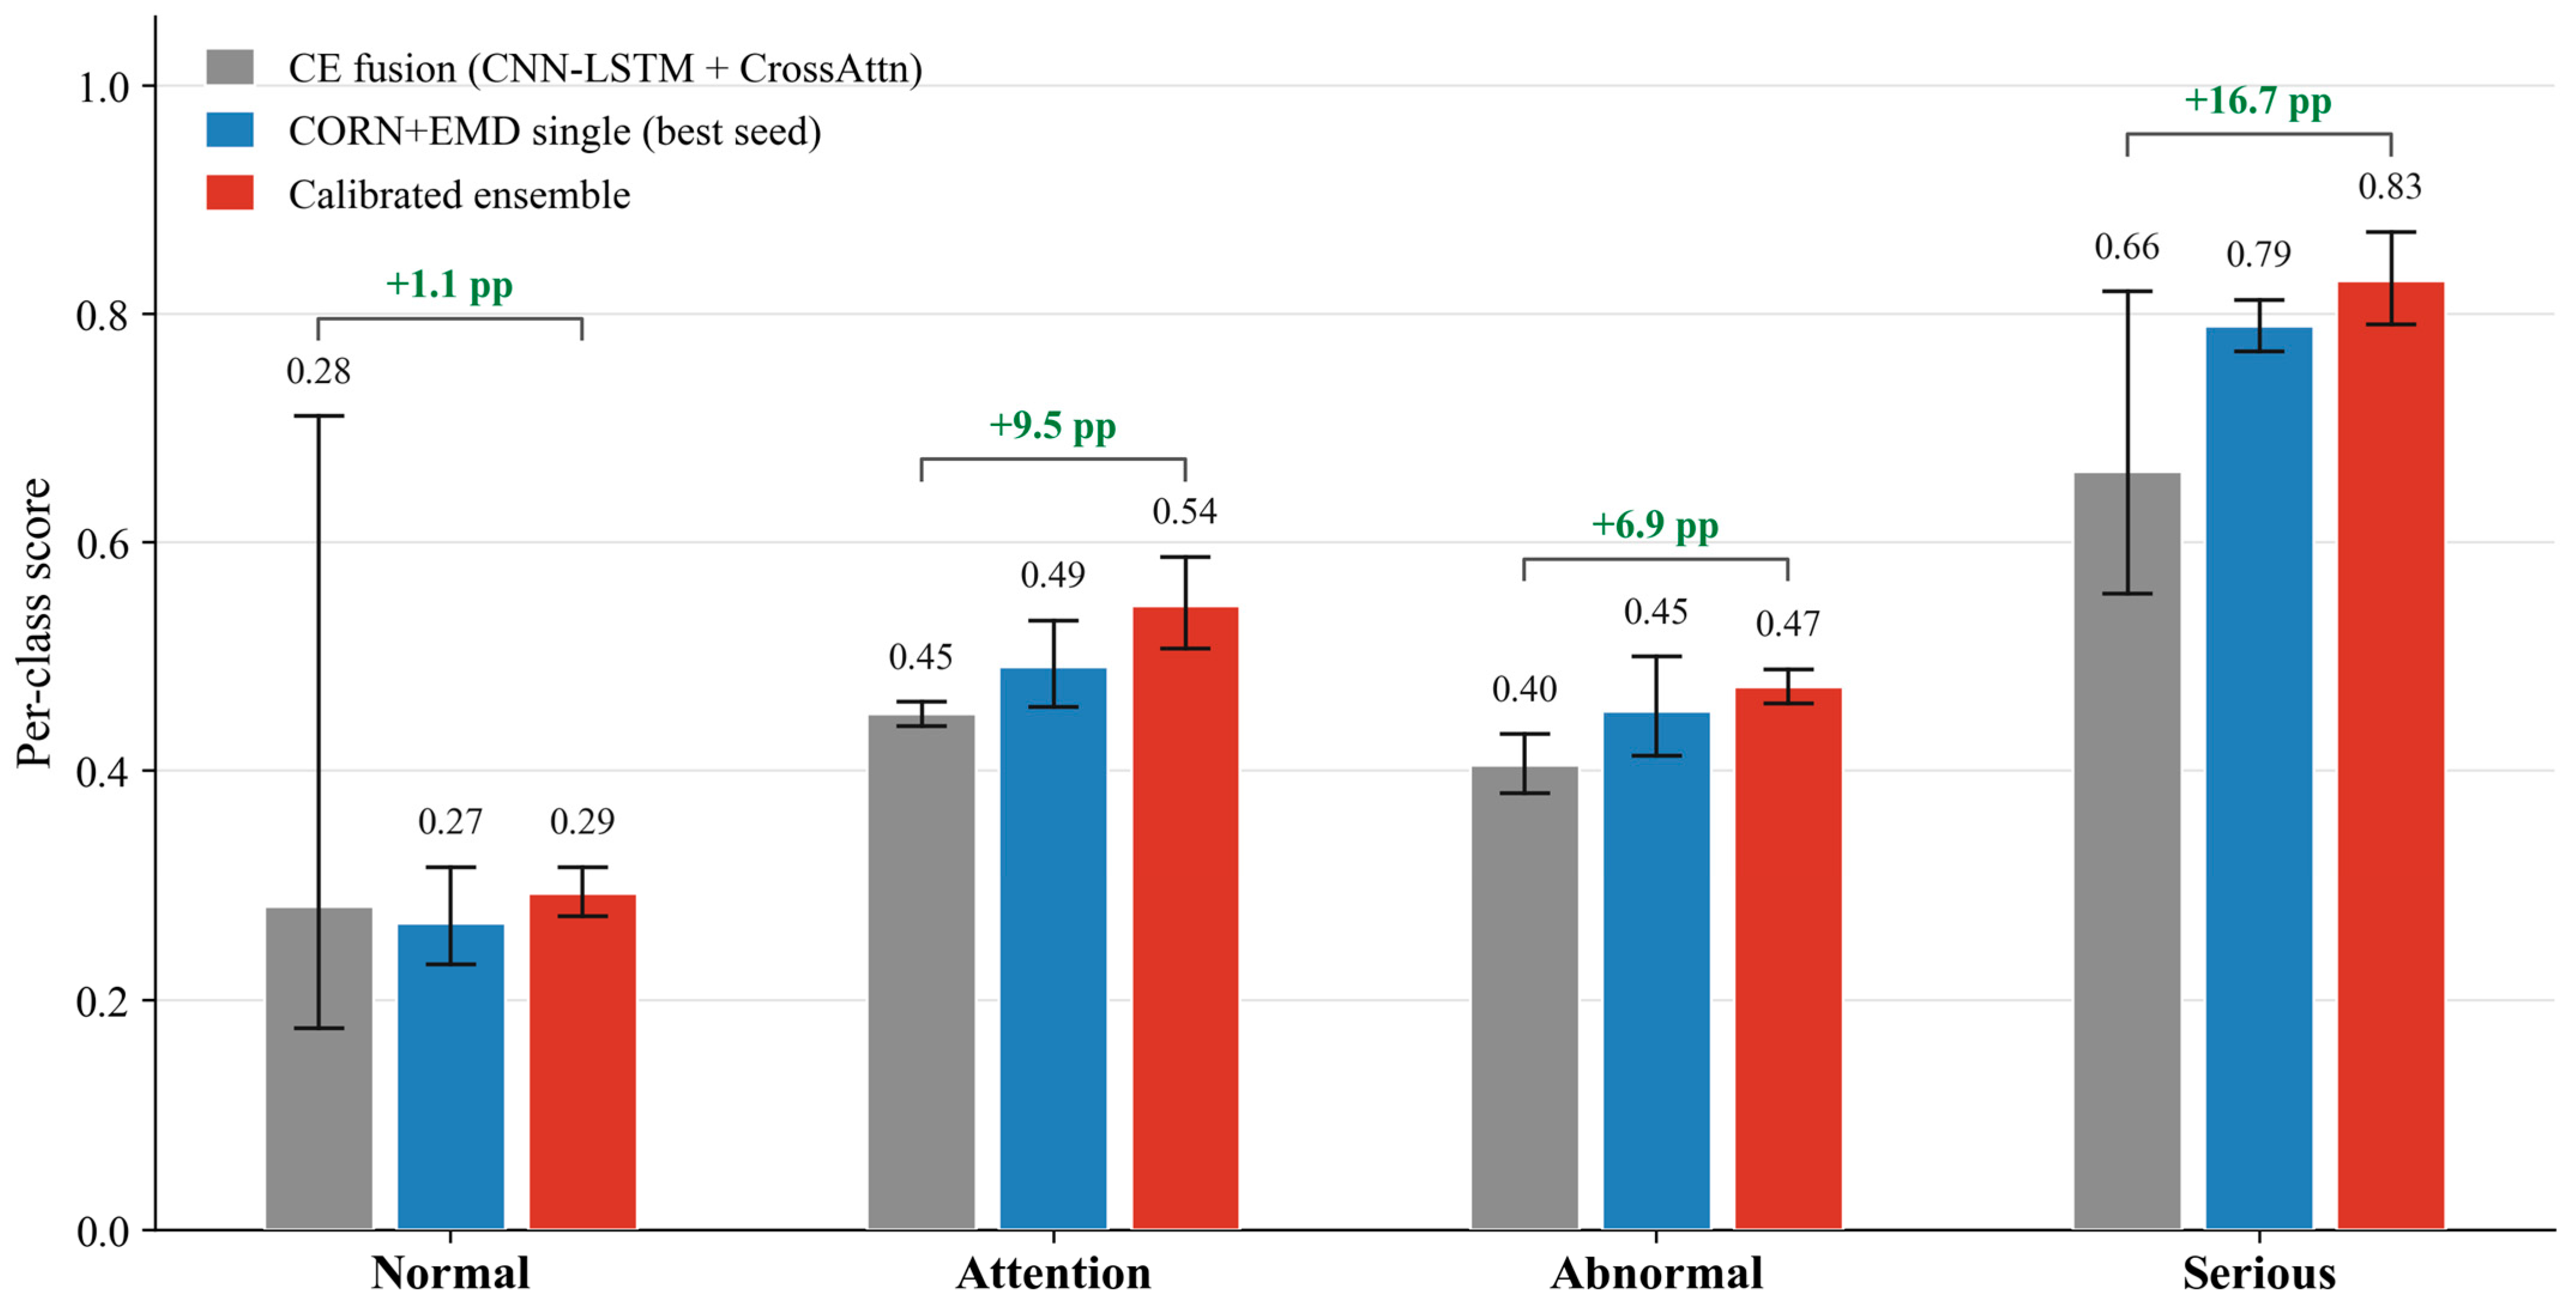
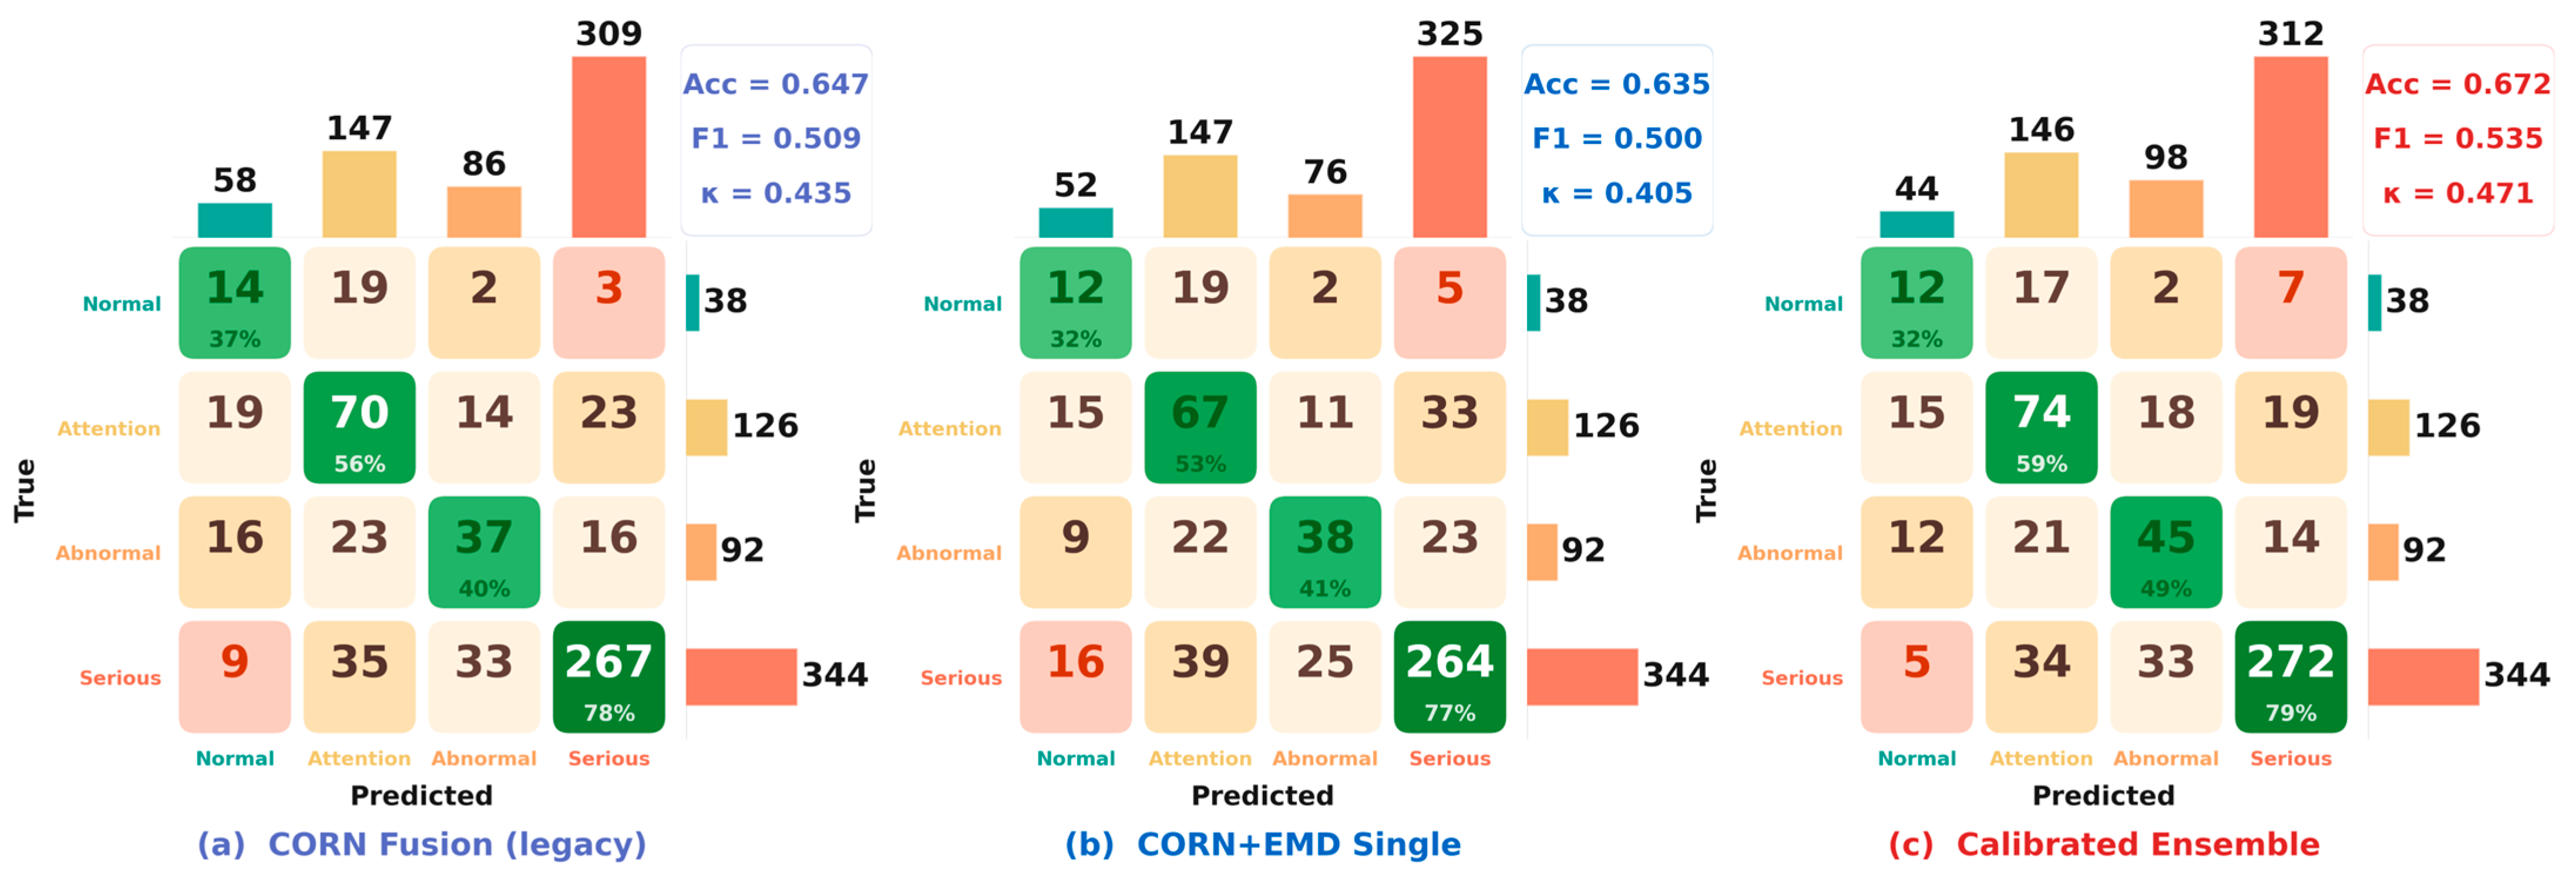
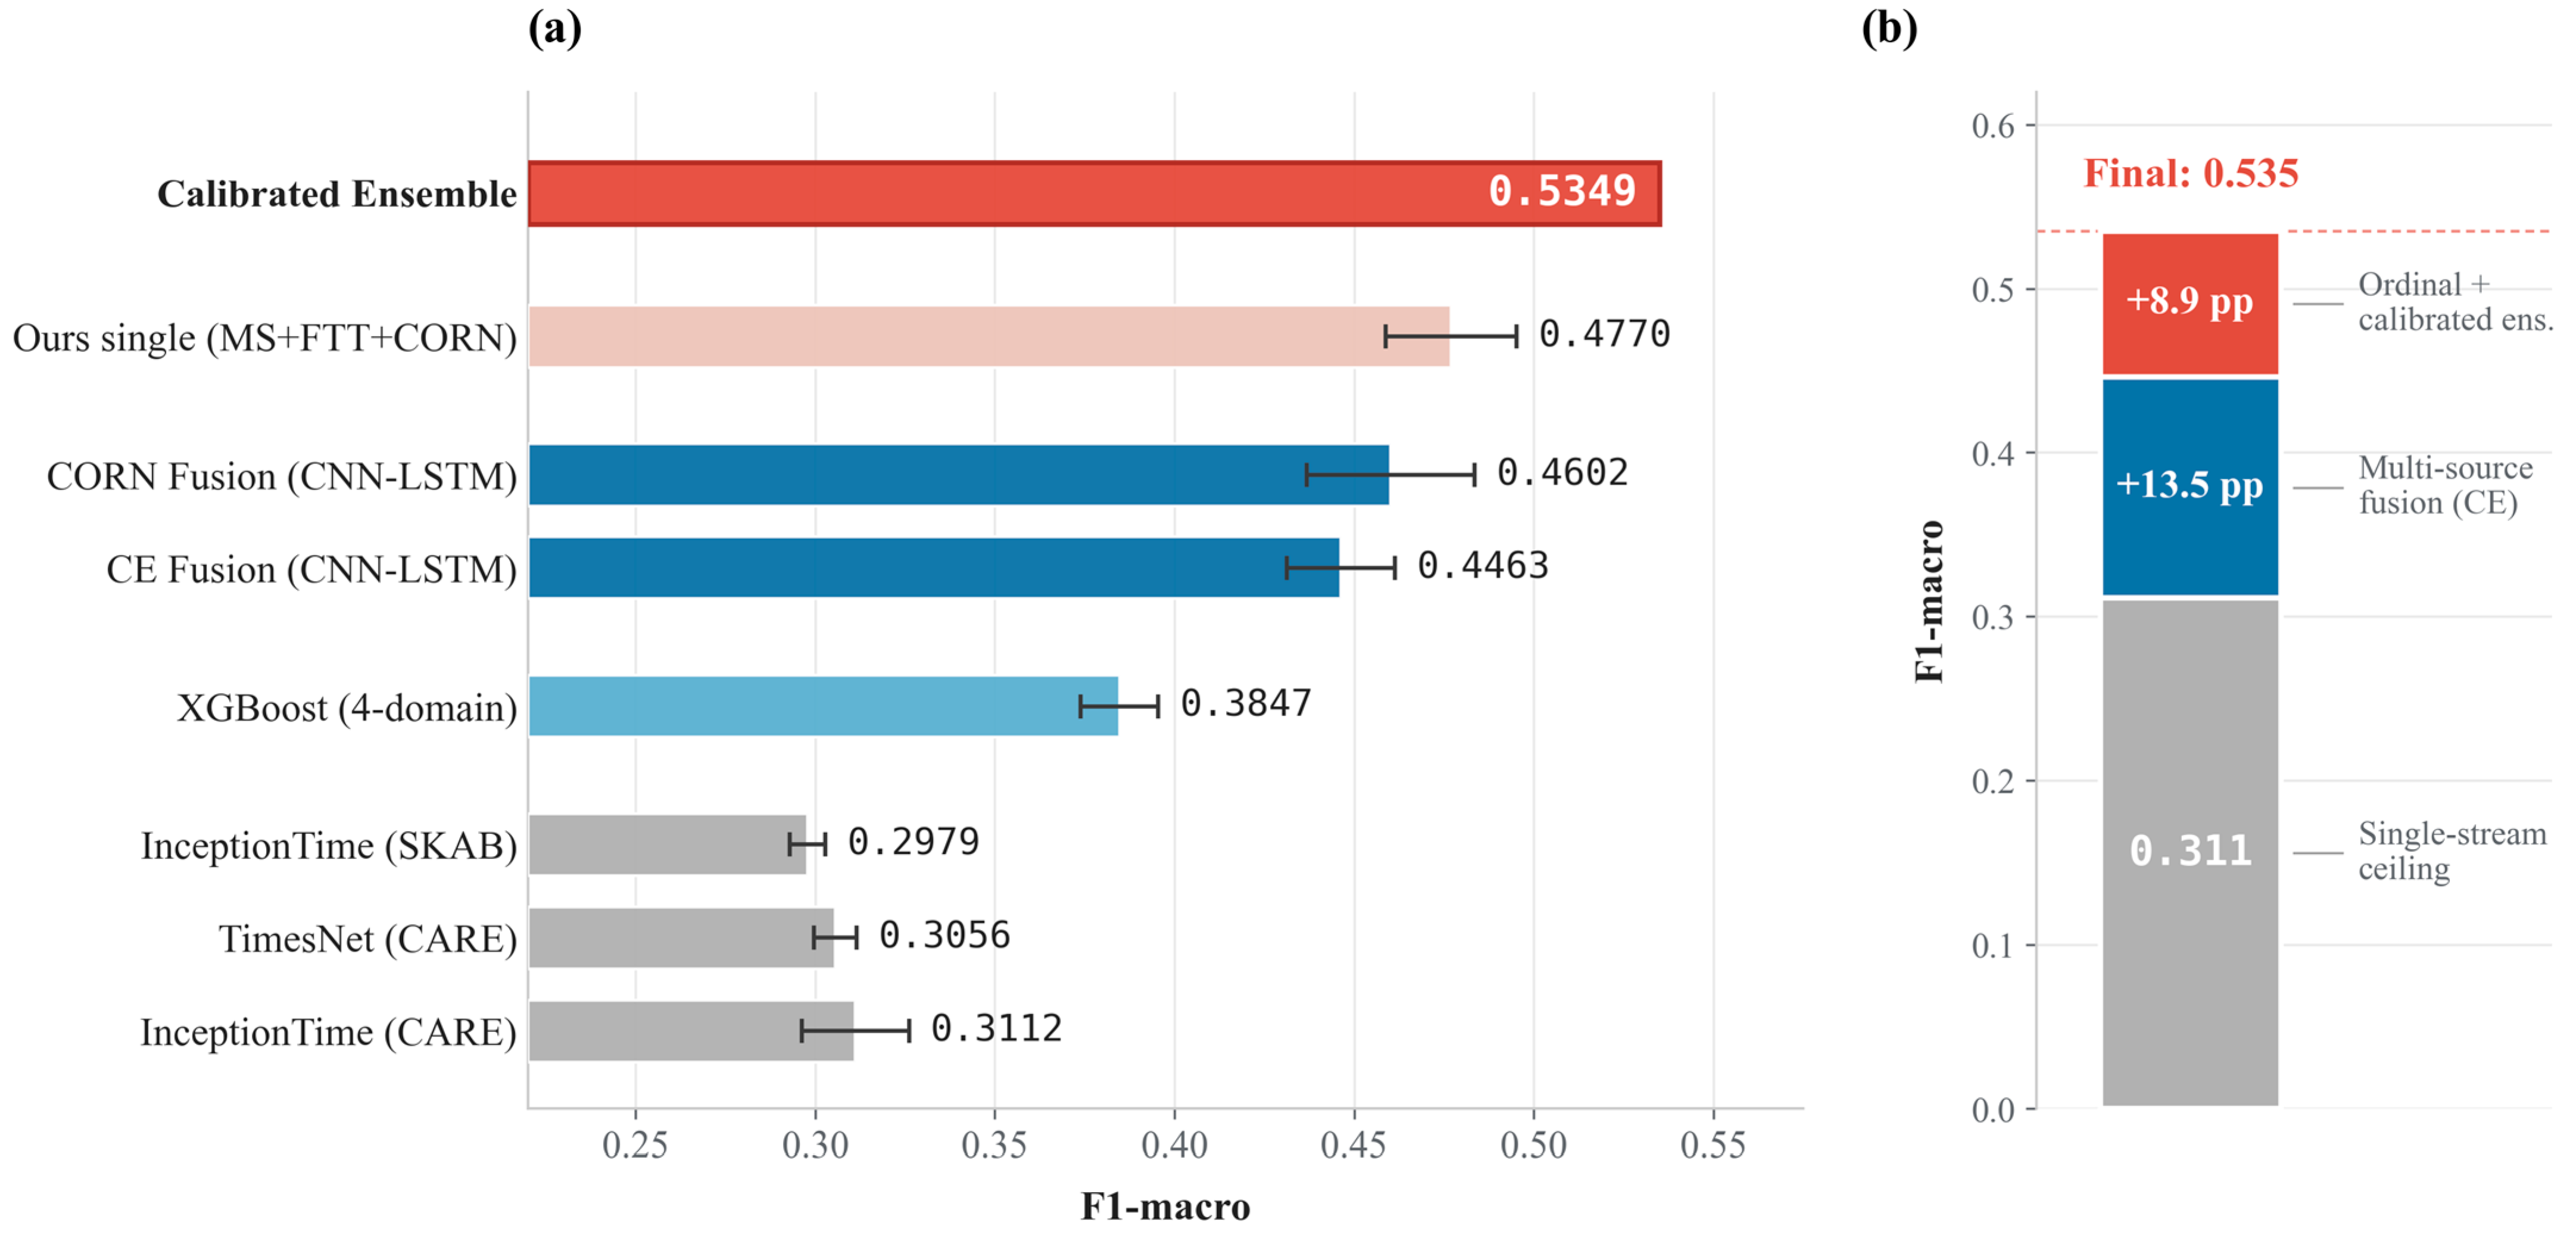
Three observations can be drawn from Table 3. First, the modern SOTA baselines, re-implemented at full scale and trained under the identical protocol of Section 3.4, saturate at F1-macro ≈ 0.31 on a single stream: InceptionTime on CARE reaches only 0.3112 ± 0.0149, and every other single-stream model falls below it. This confirms that no individual subsystem captures the full severity state: each one observes just one of the four weakly coupled physical loops and is therefore blind to degradation originating elsewhere in the machine. Second, plain cross-entropy multi-source fusion already raises this ceiling by ≈13.5 pp (0.4463 ± 0.0151 vs. 0.3112), and rank-aware supervision with calibrated ensembling adds a further ≈8.9 pp (0.5349); the proposed single model reaches 0.4770 ± 0.0183, far above every single-stream method. Notably, the advantage does not rest on ensembling: the strongest single proposed model already exceeds the strongest full-scale single-stream baseline by +16.6 pp. On the same legacy fusion architectures, replacing cross-entropy with the rank-consistent CORN objective improves F1-macro in four of the six configurations (by +1.4 to +2.9 pp), providing seed-averaged evidence for the benefit of ordinal supervision at the fusion level. QWK is reported for all ordinal-supervised models (including the CORN-trained fusion baselines); for the purely cross-entropy and classical baselines, it is omitted because standard cross-entropy does not enforce rank consistency and QWK becomes methodologically meaningful only when the model output encodes a rank-aware severity score. Third, the calibrated ensemble reaches an Accuracy of 0.6717 and, more informatively under the severe class imbalance, an F1-macro of 0.5349, a Cohen’s κ of 0.4713, and a QWK of 0.5948. This represents an absolute improvement of +22.4 pp in F1-macro over the strongest single-stream baseline (InceptionTime on CARE) and +8.9 pp over the strongest cross-entropy fusion baseline. The rank-aware gains are even larger—+30.4 pp on κ and +36.2 pp on QWK—so the ordinal-aware supervision lifts not only the unweighted class balance but, far more pronouncedly, the rank-weighted agreement that matters most for a severity-grading task. In terms of the regulatory target, the QWK of 0.5948 is the most direct quantitative evidence of alignment with the four-level GB/T 43188-2023 scheme, since QWK penalizes each misgrading in proportion to its squared distance on the Normal/Attention/Abnormal/Serious scale. Figure 3 shows the class-wise F1, and Figure 4 the confusion matrices.
From Figure 3, the ensemble improves over the cross-entropy fusion baseline on all four ordinal classes, though by margins that differ sharply from grade to grade. The largest gain is on the dominant Serious class (0.662 → 0.829, +16.7 pp), followed by Attention (+9.5 pp) and Abnormal (+6.9 pp). The minority Normal class (+1.2 pp) remains challenging for both methods at F1 ≈ 0.29: so few examples are available that neither the baseline nor the ensemble can resolve its decision boundary reliably.
Figure 4 reveals that 118 of the 197 ensemble errors (60%) lie at distance 1, that is, on adjacent severity levels. The remaining 79 (40% of the errors, or 13% of all 600 predictions) are misclassified across two or more levels. The majority of errors thus remain confined to neighboring grades, which is precisely what accounts for the gap between κ = 0.4713 and QWK = 0.5948 . The latter metric rewards the model for keeping its mistakes close to the true severity level rather than scattering them across the full ordinal range. The residual distant errors—in particular the 34 Serious windows predicted as Attention—are safety-relevant underestimations that must be addressed before field deployment and are revisited as the priority for real-plant validation in Section 5. The underestimations are the concern. The 22.4 pp F1-macro gap over the strongest single-stream classifier can be attributed to two factors. First, the four domains correspond to different physical failure modes with low mutual information; their combination therefore provides qualitatively richer information than any one stream in isolation. Second, the max-aggregation rule of Equation (3) creates many fused Serious labels whose evidence is absent from any single domain’s observation window, which is precisely why a model restricted to one subsystem cannot, even in principle, recover the worst-subsystem grade that the fused label encodes.

4.2. Ablation Study on the Loss Function

The loss function is ablated with the backbone fixed to CNN-LSTM + MLP + Concat and seed = 42, and eight loss variants are compared, with the per-seed breakdown available in the Supplementary Materials.
First, the standard CORN loss attains F1-macro = 0.4446, and adding the EMD term in the 0.7/0.3 weighting prescribed by Equation (10) raises the F1-macro to 0.4553 (+1.07 pp). More importantly, the F1 of the Normal class is lifted from 0.217 to 0.240, a relative gain of 11% on the smallest class, which confirms the complementary roles of CORN as the rank-consistency term and EMD as the distance-sensitivity term that together pull the hardest minority grade upward rather than sacrificing it to the dominant class. The smallest class gains most. Second, at the single-model level, the strongest imbalance-aware baseline, Balanced Softmax (F1-macro = 0.4617, QWK = 0.4856), slightly exceeds the proposed CORN + EMD (F1-macro = 0.4553, QWK = 0.4616) on both metrics. CORN + EMD is therefore not claimed to dominate Balanced Softmax in single-model terms. It is retained as the ordinal backbone for its explicit rank-consistency guarantee and its conditional chain-rule probability semantics (Equation (7)), which make its outputs interpretable as a monotone severity score; both loss families are then kept as complementary members of the calibrated ensemble (Section 4.4) rather than one being selected over the other.
The triple blend (CORN + LDAM + EMD) unexpectedly degrades performance to F1-macro = 0.4064: the LDAM margin over-penalizes the dominant class under the weighted sampler. The Class-Balanced Focal loss (F1-macro = 0.3967) exhibits a similar pattern. Stacking additional imbalance-aware terms on top of the ordinal objective is therefore counter-productive. The main advantage of the proposed CORN + EMD supervision becomes evident only after ensembling: the calibrated ensemble exceeds the strongest cross-entropy fusion baseline by +8.9 pp on F1-macro as reported in Table 3. It thereby recovers, at the pool level, the margin that no single loss variant secures on its own. The full method-level ablation is shown in Figure 5.
Figure 5 confirms that the calibrated ensemble ranks first on F1-macro, and panel (b) shows that its margin decomposes into a large contribution from multi-source fusion itself (+13.5 pp over the single-stream ceiling) and a smaller but substantial contribution from ordinal-aware supervision with calibrated ensembling (+8.9 pp). The calibrated ensemble also ranks first on Accuracy, κ and QWK in Table 3, so F1-macro = 0.5349 is not a single-metric artifact.

4.3. Ablation Study on the Encoder–Fusion Configuration

Beyond the loss function, the encoder–fusion configuration is examined with the loss fixed to the proposed CORN + EMD, along two design axes: the fusion head that combines the four domain embeddings, and the sequence and tabular encoders that produce them. On the fusion axis, with the encoder held to the lightweight CNN-LSTM + MLP backbone (approximately 0.3 M parameters), the simple Concat head reaches an F1-macro of 0.4553 against 0.4353 for the Gated alternative trained under the same loss and random seed. The Concat configuration stays stable across three seeds (0.444 to 0.473, mean 0.457). Plain concatenation is thus at least as strong as explicit gating once the encoder and the data are both limited (3000 training samples). The additional per-source weighting parameters of the gating mechanism bring no measurable benefit at this scale. This is in line with the known difficulty of training attention-style fusion on small datasets. On the encoder axis, replacing the lightweight backbone with the Multi-Scale sequence encoder and the FT-Transformer tabular branch (approximately 1.6 M parameters) raises the single-model F1-macro to 0.4770 ± 0.0183 (best seed 0.4998). The fusion head is not held fixed across this second comparison, because the strongest large-encoder configuration pairs the richer encoders with a Gated head and no Multi-Scale + FT-Transformer + Concat variant was trained; the improvement therefore cannot be attributed to the encoder in isolation, and instead reflects the joint effect of a more expressive encoder together with its fusion head. The final framework adopts the Multi-Scale + FT-Transformer + Gated configuration on the basis of its highest single-model F1-macro and retains it as one member of the calibrated ensemble, rather than as evidence that any single fusion head is preferable in general. The per-cell numbers and the per-seed breakdown for all the encoder–fusion configurations are released in the Supplementary Materials so that every entry can be independently reproduced.

4.4. Calibrated Ensemble and t-SNE Visualization

With the single-model components characterized in the preceding ablations, this subsection turns to the calibrated ensemble that aggregates them. Three sub-ensembles and four calibration variants are compared in Table 4 to identify the configuration that best balances overall Accuracy and rank consistency.
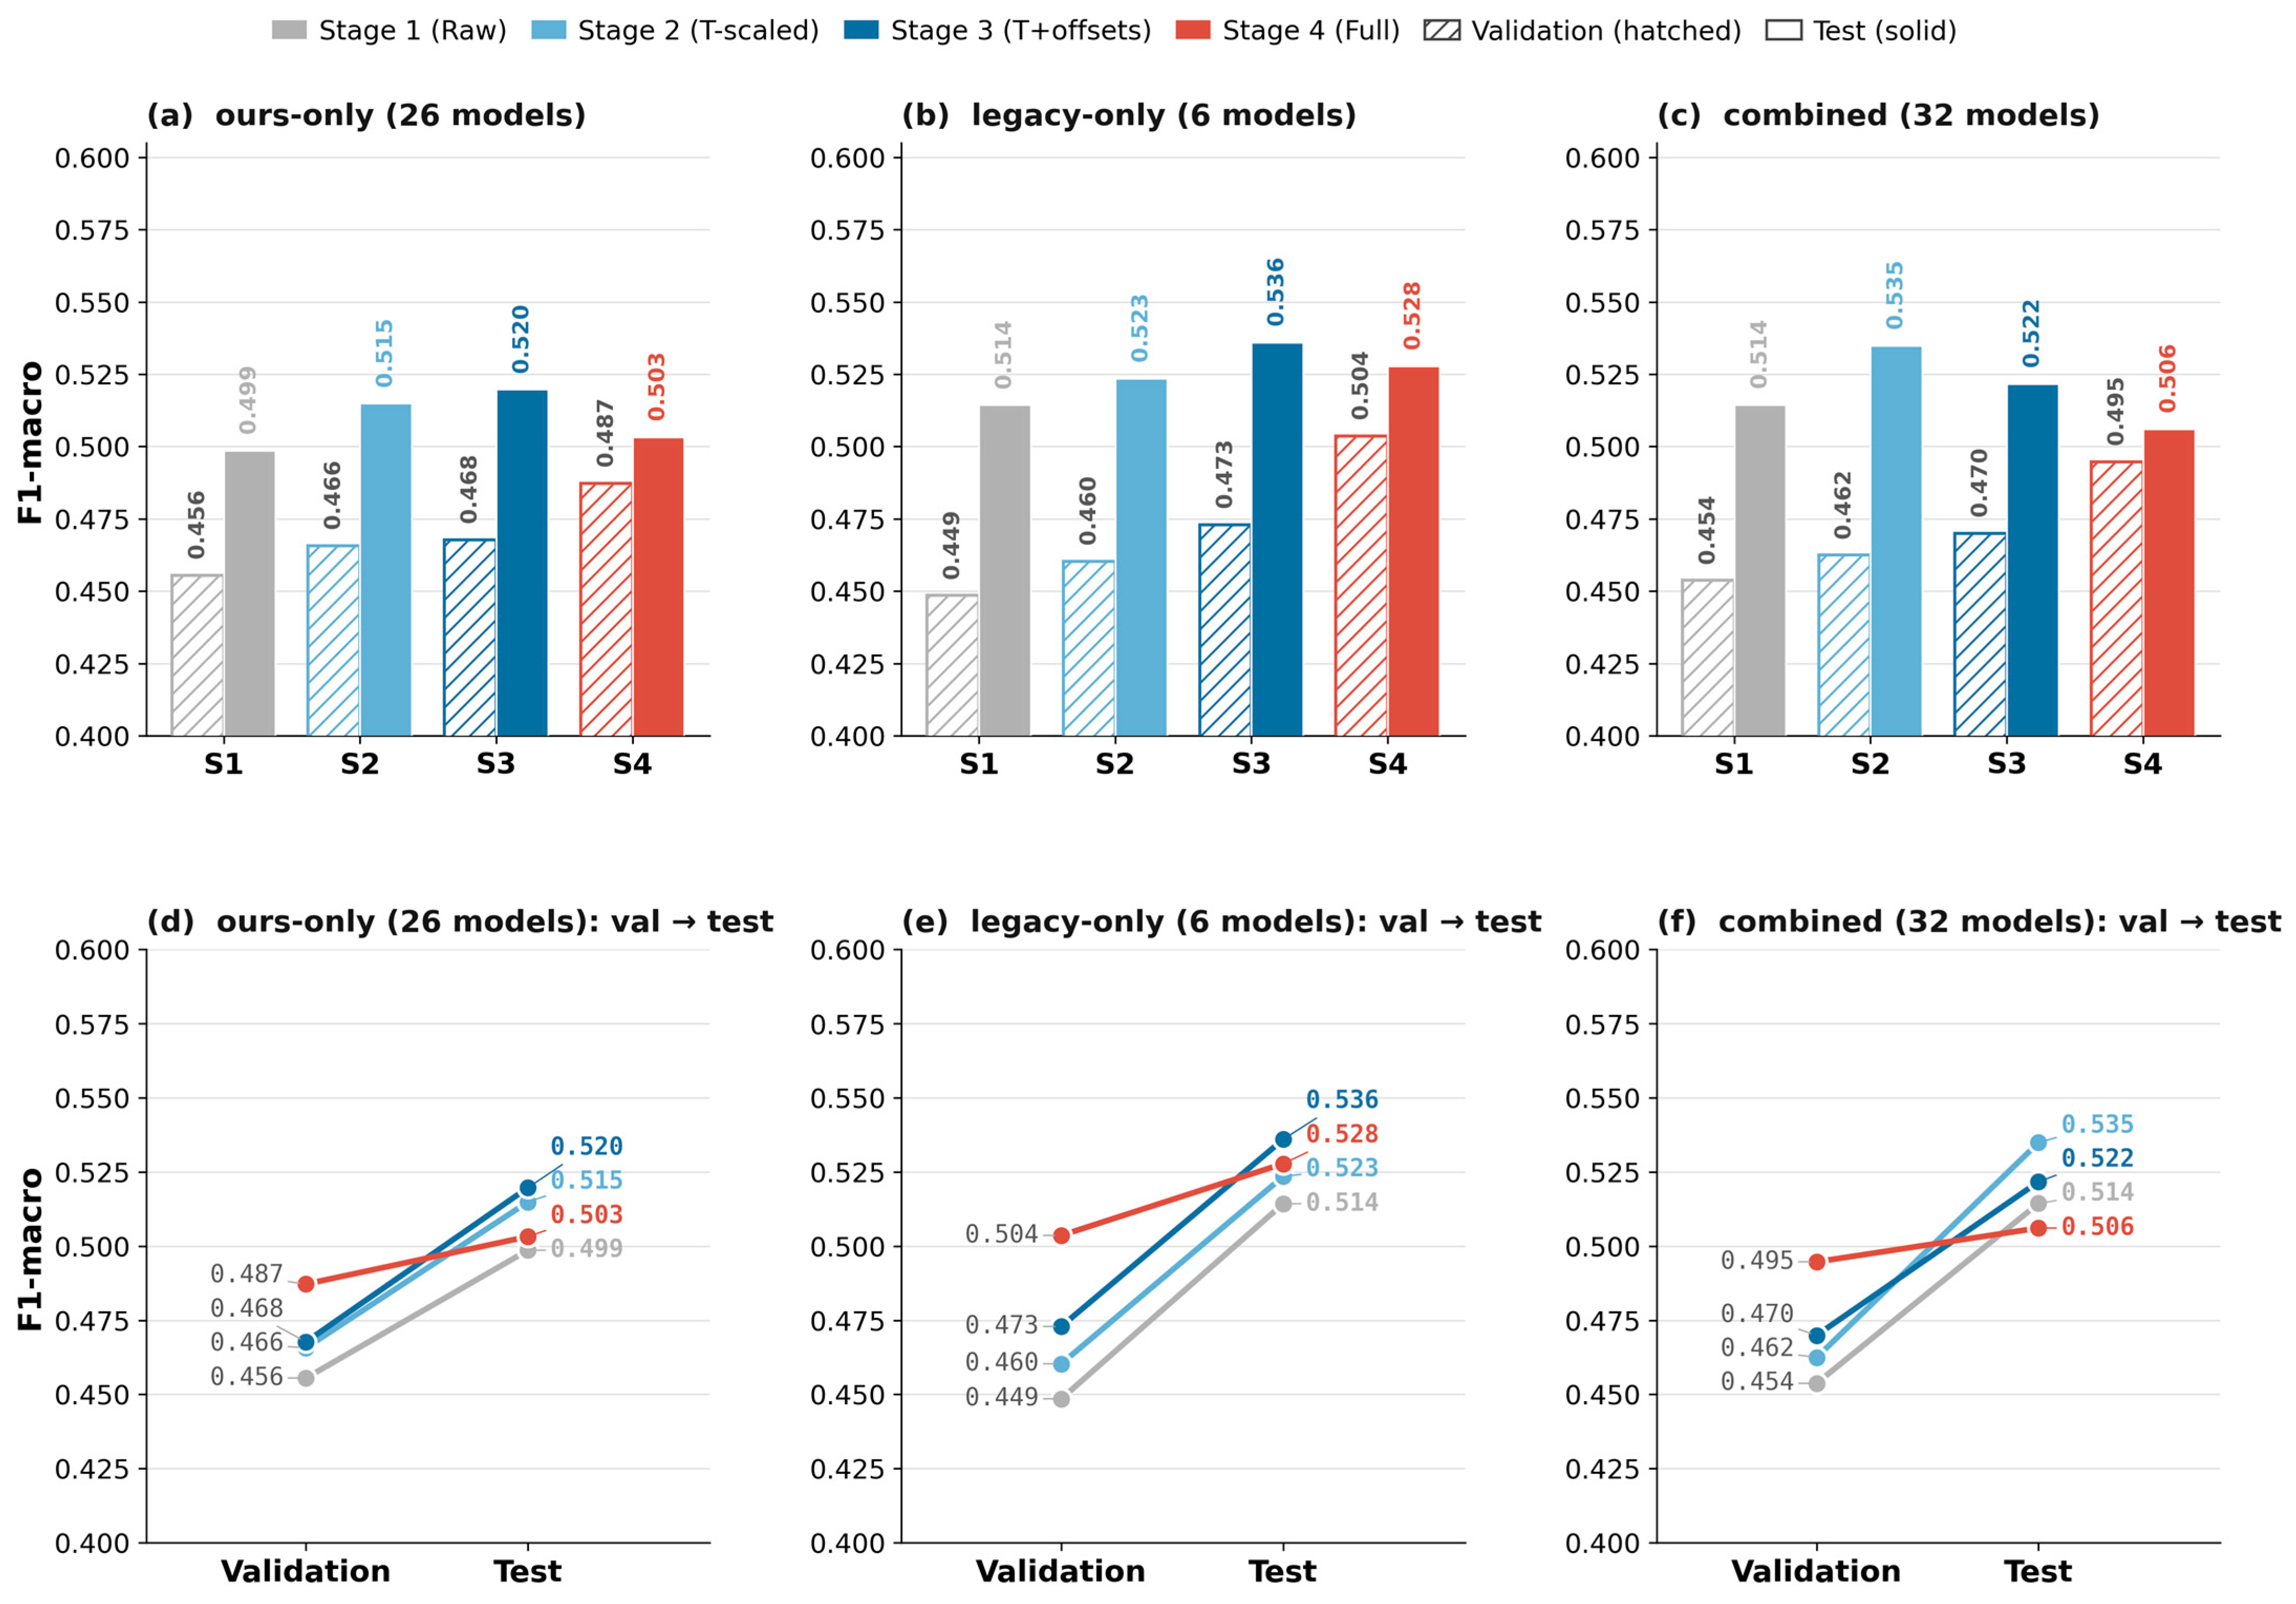
Table 4 shows that temperature scaling alone yields the most consistent results across the three pools, with the combined 32-model pool reaching F1-macro = 0.5349 (Accuracy = 0.6717, κ = 0.4713, QWK = 0.5948), whereas adding per-model class offsets improves only the small legacy pool (0.5235 → 0.5360). It degrades both the ours-only pool and, more markedly, the combined pool (0.5349 → 0.5217)—a pattern that points unambiguously to overfitting as the model count grows. Because each offset vector fits one scalar per class per model on the 600-sample validation set, the degrees of freedom introduced by the offset step grow linearly with the model count while the validation set stays fixed at 600 samples. The calibration therefore begins to memorize validation-specific noise rather than correcting a genuine systematic bias, and the larger the pool, the worse this effect becomes. The validation column of Table 4 makes the mechanism explicit: adding per-model class offsets always raises validation F1—they are fitted by maximizing it—yet degrades test F1 on the combined pool; all calibration parameters are fitted on the validation set, no model selection is performed, and the test set is never touched during ensemble construction. The combined pool with temperature-scaling-only calibration is therefore adopted as the headline configuration, since it uses all available models and performs no selection on the test set. The slightly higher legacy-only + offset value of 0.5360 is obtained by selecting both the pool and the calibration variant on the test set. It is reported here only for completeness rather than as the recommended configuration: a value chosen with hindsight on the evaluation data cannot be claimed as an honest out-of-sample result. The LightGBM stacking baseline (F1-macro = 0.4944) underperforms simple logit averaging, consistent with the limited out-of-fold training data available [38].
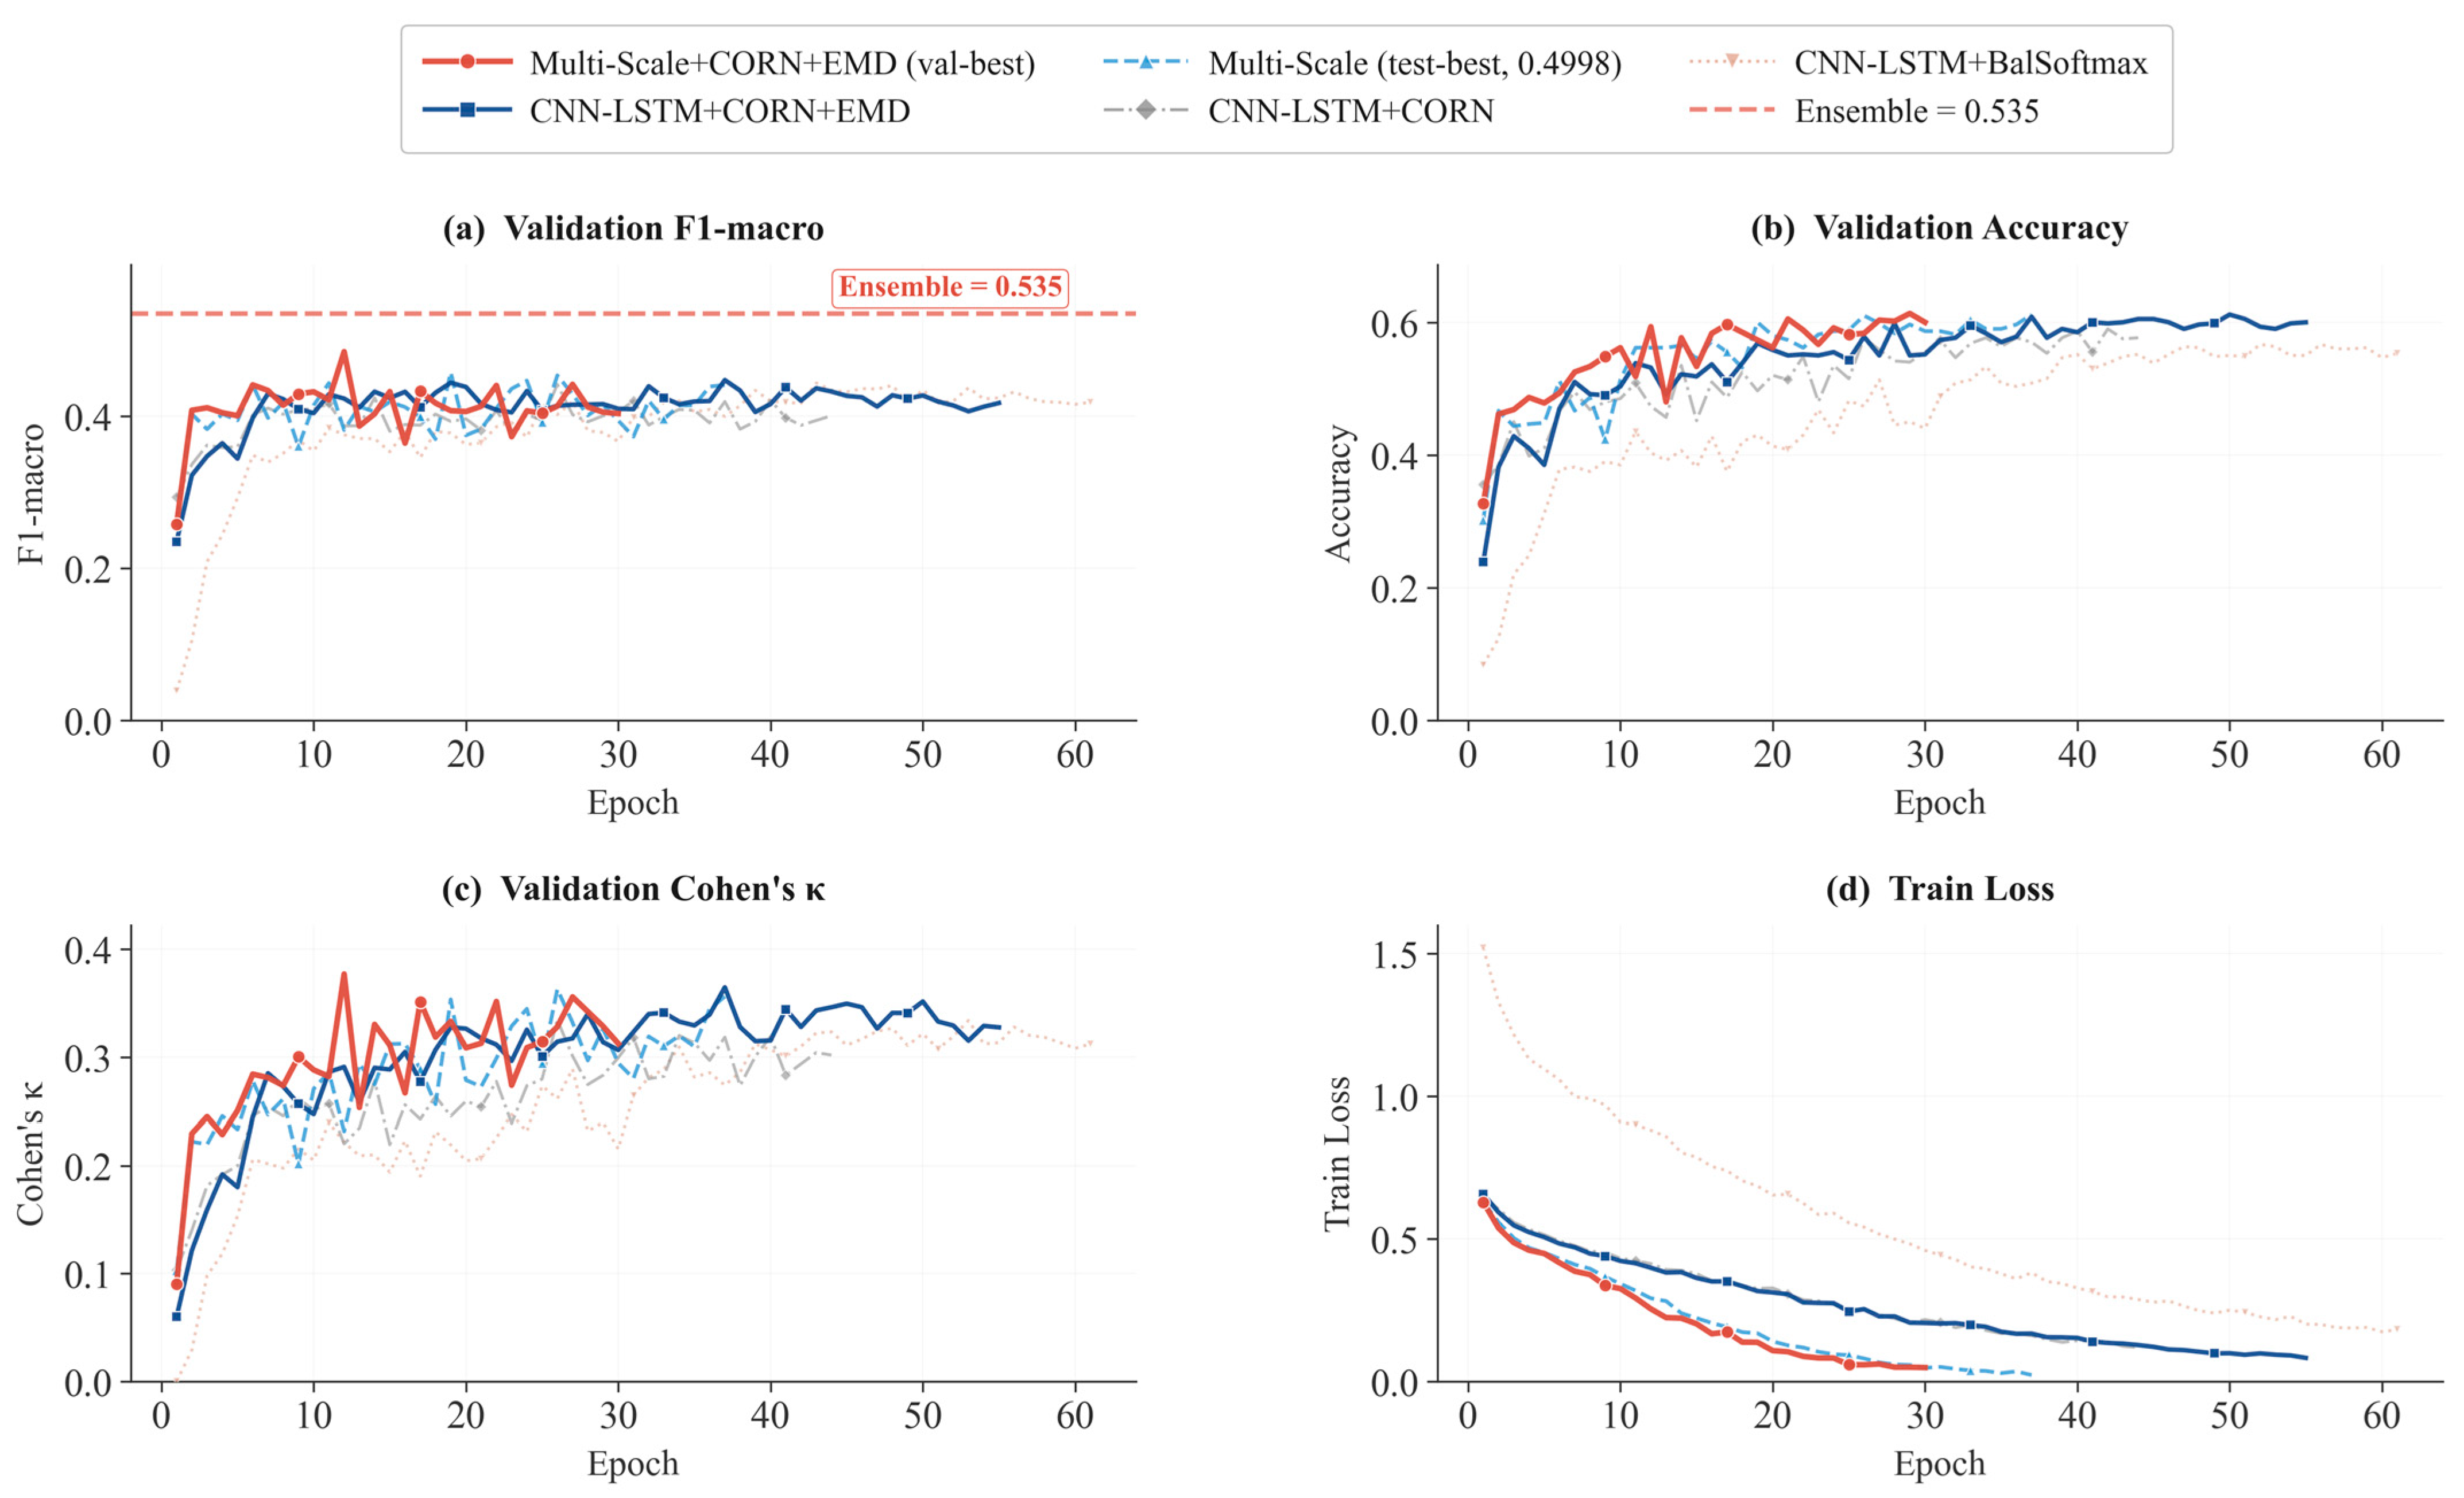
Figure 6 plots the validation F1-macro learning curves of the five strongest single models.
Figure 6 shows that the best single model by validation F1-macro peaks at 0.485 (epoch 12), while the best single model by test F1-macro reaches 0.4998 (seed 2024; the Ours single row of Table 3 reports the three-seed mean 0.4770 ± 0.0183); both lie well below the ensemble reference at 0.5349, which confirms that the ensemble benefit cannot be replicated by any single architecture regardless of the selection criterion.
The calibration behavior across the three sub-ensembles and the four calibration variants is examined in Figure 7.
Figure 7 shows that temperature scaling alone (stage S2) improves the test F1-macro of all three pools, whereas the additional per-model offset step (stage S3) benefits only the small legacy-only pool. The combined pool with temperature scaling, adopted as the main configuration, attains a strong balance across all four metrics without any test-set selection. Panels (d–f) make the mechanism explicit: the offset stages gain on the validation set but give most of that gain back on the test set, and the shortfall grows with the size of the pool.
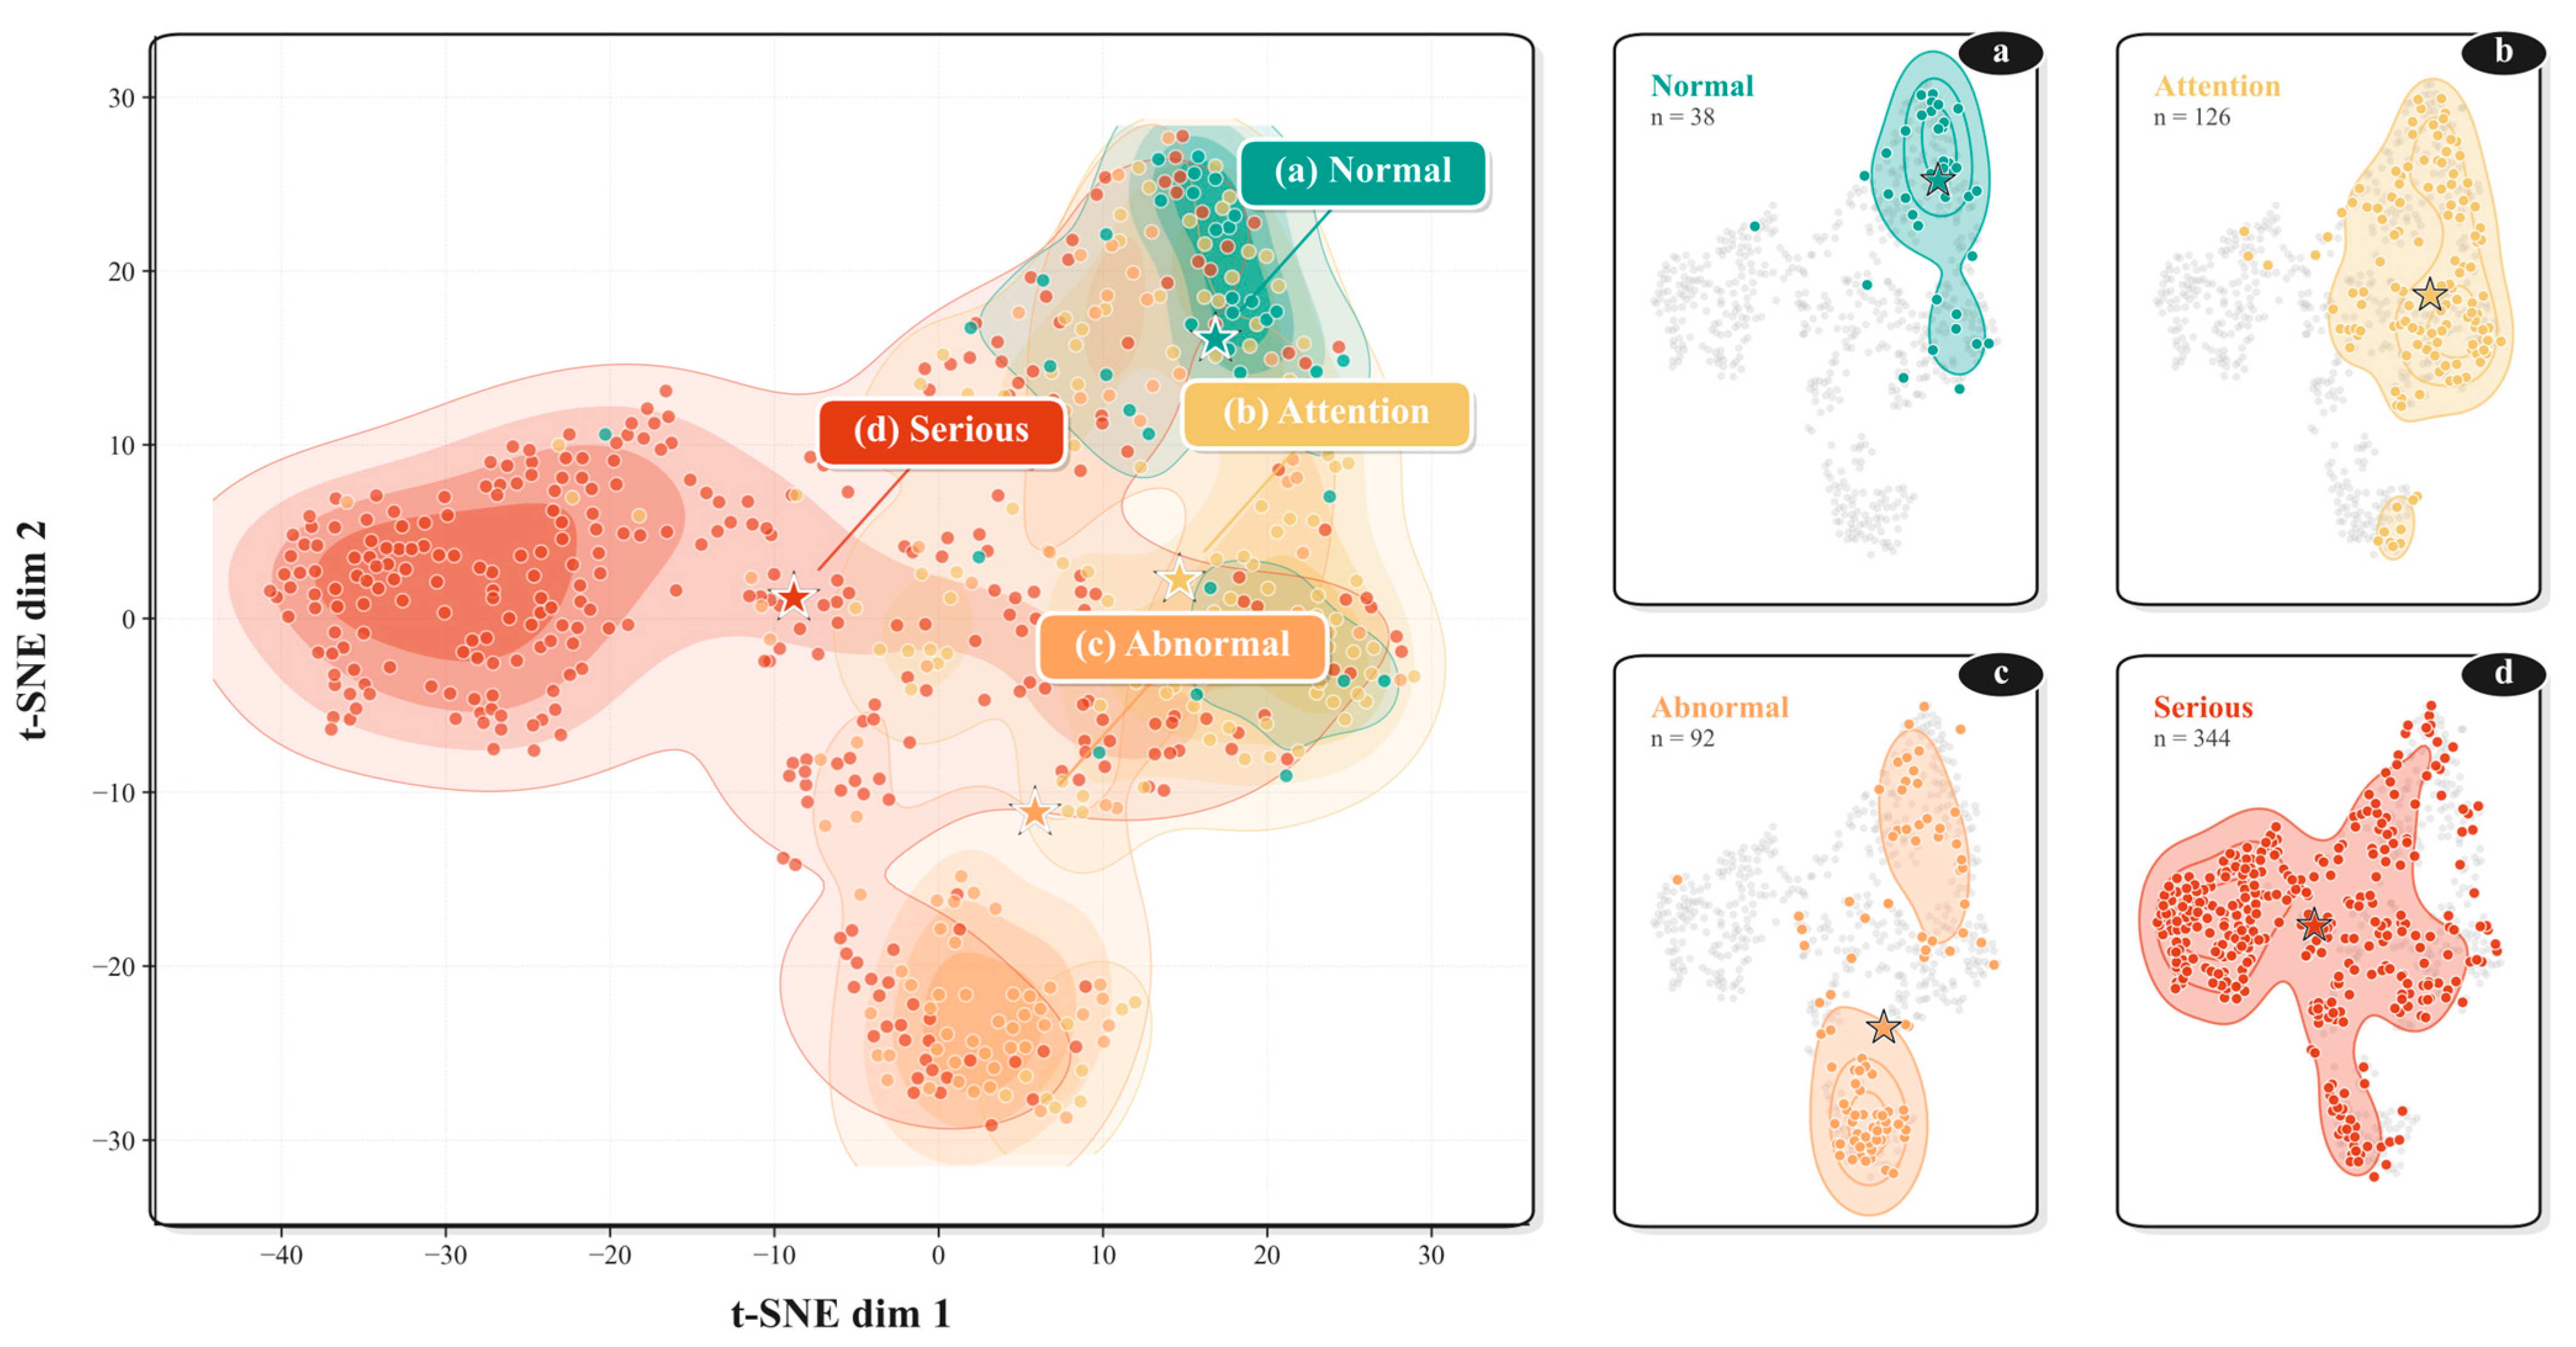
The learned fused representation is examined in Figure 8 through a t-SNE projection.
The severity band is continuous. Figure 8 indicates that the four ordinal classes form a connected severity band rather than isolated clusters, preserving the rank order Normal → Attention → Abnormal → Serious as a continuous path through the t-SNE plane, while the rare Normal ( n = 38 ) and Abnormal ( n = 92 ) classes still occupy distinct lobes despite their small sample counts. Together, this provides visual evidence that the multi-source fusion renders even the long-tail grades geometrically distinguishable rather than collapsing them into the dominant Serious mass. The minority classes stay separable.
Computational cost. The ensemble aggregates 32 members whose sizes range from 0.22 M to 1.62 M parameters (the lightweight CNN-LSTM + MLP + Concat members ≈0.29 M; the Multi-Scale + FT-Transformer + Gated members ≈1.62 M), totaling 19.9 M parameters. On a laptop-class CPU (Apple M5 Pro, 8 threads, PyTorch 2.12), single-sample inference takes 5.8 ms for the largest single member and 95.6 ms for the full 32-member calibrated ensemble (amortized to 28.4 ms per sample at batch 64), with a peak memory footprint of 0.86 GB. Temperature scaling adds one scalar per member and is fitted once on the validation set. The system therefore runs comfortably on a laptop-class CPU, and no GPU is required for inference.

4.5. Scope and Limitations

The scope of the present conclusions is delimited by five considerations. (1) Each source domain shares governing dynamics with a subsystem only to an uneven degree: the correspondence is closest for the mechanical and Synth H2 domains (pump–motor hydraulics and Henry’s law match the target in form). The correspondence is intermediate for the electrical-thermal domain (a wind-turbine SCADA stream, anonymized at the channel level and with different failure modes), and weakest for the UCI-WWT chemistry domain, whose water-treatment origin differs markedly from a deionized stator-coolant loop. The four domains are moreover combined by paired random sampling rather than as co-occurring observations of one machine, so the framework fuses four subsystem-level health indicators into a single grade rather than recovering genuine cross-subsystem coupling; the m a x -aggregation rule of Equation (3) partially offsets the weak chemistry analogy, since the fused label is driven by the worst subsystem. In particular, paired random sampling does not preserve cross-domain causal cascades—e.g., an electrical anomaly inducing a localized thermal rise that subsequently degrades cooling dynamics—so the model learns a constructed algorithmic association rather than genuine coupled co-occurrence. In a live facility, this could inflate the false-alarm rate: the fused grade can be driven by a spurious combination of subsystem states that would not co-occur on a real machine. Conversely, the 34 Serious windows under-graded as Attention in Figure 4 illustrate the cost of missing cross-subsystem corroboration. Deployment therefore requires re-estimating the operating thresholds on co-recorded plant data before any alarm logic is attached. (2) The Synth H2 domain is physics-informed rather than measured, and the m a x rule over-represents the Serious grade in the fused label; although its governing equations follow established parameterizations from GB/T 7064-2017 [5] and DL/T 801-2010 [26] consistent with the ranges in Yang et al. [16], validating it against real plant measurements and re-calibrating the class prior to a fleet-level distribution remain future work. A parameter-sensitivity study (Table 5) perturbs the hydrogen-side generator—Henry’s constant (±10/20%), the solution enthalpy (±20%), the loop time constant (±20%), the temperature envelope (±2 °C), the hydrogen-pressure envelope (±10%), and the sensor-noise level (×1.5). The study regenerates the hydrogen-side observations of the 600 test samples sample-by-sample (identical leak-rate bands, labels, and pairing), and re-evaluates the frozen pipeline. Variations in the physical constants leave every metric unchanged (ΔF1 = 0.0 pp), because the ordinal grades are driven by relative dissolved-hydrogen trends rather than absolute solubility levels; shifts in the operating envelopes act as covariate shift and reduce ensemble F1-macro by at most 3.1 pp (QWK by at most 5.2 pp), leaving the ensemble at ≥0.50 F1-macro—still far above the strongest single-stream baseline (0.3112). The methodological conclusions are therefore insensitive to the hydrogen-side parameterization, while envelope shifts matter most, consistent with the deployment discussion above. (3) All methods are evaluated over the same three seeds {42, 123, 2024} under the unified protocol of Section 3.4. A bootstrap over the 600 test samples (10,000 resamples) yields a 95% confidence interval of [0.485, 0.582] for the ensemble F1-macro, [+17.4, +27.4] pp for the ensemble-vs-strongest-single-stream gap, and [+5.1, +12.6] pp for the ensemble-vs-strongest-CE-fusion gap, all excluding zero; formal multi-seed significance testing (5–10 seeds with paired tests) remains future work. (4) The present evidence constitutes methodological validation on a surrogate benchmark; it does not constitute industrial validation on a hydrogen-cooled turbogenerator. These are distinct claims, and only the former is made here. (5) A stream-ablation study (replacing one domain’s input with matched noise while keeping the fused label, three seeds per setting) quantifies each stream’s contribution to machine-level grading. Ablating CARE costs −14.3 pp F1-macro (0.3338 ± 0.0348), UCI-WWT −13.0 pp (0.3469 ± 0.0047), SKAB −10.2 pp (0.3750 ± 0.0298), and Synth H2 −5.8 pp (0.4191 ± 0.0283) relative to the intact model (0.4770 ± 0.0183). Every stream therefore contributes materially; the sizeable UCI-WWT contribution reflects its role as the sole observer of the water-chemistry ordinal component under the max-aggregation rule—consistent with its ordinal-label-surrogate positioning—rather than any physical fidelity to a deionized coolant loop. A follow-up with additional seeds, paired significance tests, and a planned deployment on a 600 MW unit (re-training only the Synth H2 branch) is left for future work.

5. Conclusions

In this paper, a multi-source cross-domain data fusion framework is proposed and demonstrated as a methodological proof of concept on a reproducible surrogate benchmark, for the four-level ordinal health-state assessment of hydrogen-cooled turbogenerators aligned with GB/T 43188-2023. The study uses an assembled four-domain corpus that spans the mechanical, chemical, electrical-thermal, and hydrogen-side subsystems. The principal contributions and findings are summarized as follows.
(1)
A reproducible four-domain data collection has been constructed from SKAB (mechanical cooling loop), UCI-WWT (water chemistry), CARE Wind Farm A (electrical-thermal SCADA), and a physics-informed hydrogen-side stream derived from Henry’s law and a CSTR mass balance. It is released to provide public data for standards-aligned ordinal diagnosis. A multi-stream fusion network with a dual-head classifier, a hybrid CORN + EMD ordinal loss, and a calibrated ensemble based on per-model temperature scaling is introduced as the modeling counterpart to this data collection.
(2)
On the 600-sample test set, under a unified three-seed protocol against full-scale baselines, the calibrated ensemble achieves F1-macro = 0.5349, Accuracy = 0.6717, κ = 0.4713, and QWK = 0.5948, outperforming all thirteen baselines, with a +22.4 pp F1-macro gain over the strongest full-scale single-stream model (InceptionTime on CARE), +30.4 pp on κ and +36.2 pp on QWK. The margin over the strongest cross-entropy fusion baseline is +8.9 pp (bootstrap 95% CI [+5.1, +12.6] pp). The largest gains appear on the rank-aware indicators, which confirms the methodological value of pairing the CORN + EMD ordinal supervision with calibrated ensembling.
(3)
The ordinal-aware supervision shifts the error structure so that 60% of the errors fall on neighboring severity levels, producing the gap between κ = 0.4713 and QWK = 0.5948. The remaining 13% of all 600 predictions (40% of the errors) still differ from the ground truth by two or more levels, including safety-relevant underestimations of Serious samples. Reducing these distant underestimations is therefore the priority for the planned real-plant validation, since a severity-grading tool intended for a safety-critical asset can tolerate near-miss confusions far more readily than gross underestimations of the most degraded state.
These results are a methodological proof of concept on a reproducible surrogate benchmark, not an industrial validation. Future work will validate the framework on co-recorded real-plant data from the target installation—including validation of the hydrogen-side stream against plant measurements and re-calibration of the class prior—and strengthen the statistical evidence with additional random seeds and formal significance testing.

Supplementary Materials

The following supporting information is available online: the full six-metric per-seed breakdown for all model configurations (all_models_metrics.csv), the processed four-domain split files, and the complete source code, at https://doi.org/10.6084/m9.figshare.32605470.

Author Contributions

Conceptualization, C.Z. and G.Z.; methodology, C.Z.; software, C.Z.; validation, C.Z. and X.H.; formal analysis, C.Z.; investigation, C.Z. and X.H.; resources, G.Z.; data curation, C.Z.; writing, original draft preparation, C.Z.; writing, review and editing, C.Z., X.H. and G.Z.; visualization, C.Z.; supervision, G.Z.; project administration, G.Z.; funding acquisition, G.Z. All authors have read and agreed to the published version of the manuscript.

Funding

This research received no external funding.

Institutional Review Board Statement

Not applicable. This study did not involve human subjects or animals.

Informed Consent Statement

Not applicable.

Data Availability Statement

The four-domain data collection, comprising processed splits for SKAB v0.9, UCI Water Treatment Plant, CARE Wind Farm A, and the physics-informed hydrogen-side stream, together with all source code, pre-processing scripts, and evaluation pipelines, are openly available in figshare at https://doi.org/10.6084/m9.figshare.32605470. The underlying public datasets are available at their original sources: SKAB v0.9 (GPL-3.0) [27], UCI Water Treatment Plant (CC-BY 4.0) [28], and CARE Wind Farm A (CC-BY-SA 4.0) [29]. The physics-informed hydrogen-side stream is reproducible from the governing equations and operating envelopes reported in Section 2 together with the generator script released in the repository. The script fixes the inlet-concentration boundary condition, the molar-mass and density constants used for unit conversion, the integration scheme, and the sensor-noise level and random seed.

Conflicts of Interest

Xuancheng Huang is employed by Jiangsu Frontier Electric Power Technology Co., Ltd. The company had no role in the study design, data collection, analysis, interpretation, manuscript preparation, or decision to publish. The other authors declare no conflicts of interest.

References

  1. Klempner, G.; Kerszenbaum, I. Operation and Maintenance of Large Turbo-Generators; Wiley-IEEE Press: Hoboken, NJ, USA, 2004. [Google Scholar]
  2. Stone, G.C.; Culbert, I.; Boulter, E.A.; Dhirani, H. Electrical Insulation for Rotating Machines, 2nd ed.; Wiley-IEEE Press: Hoboken, NJ, USA, 2014. [Google Scholar]
  3. Khan, M.A.; Asad, B.; Kudelina, K.; Vaimann, T.; Kallaste, A. The Bearing Faults Detection Methods for Electrical Machines—The State of the Art. Energies 2023, 16, 296. [Google Scholar] [CrossRef]
  4. GB/T 43188-2023; Guide for Condition Evaluation of Turbogenerators. National Administration for Market Regulation and National Standardization Administration: Beijing, China, 2023.
  5. GB/T 7064-2017; Specific Requirements for Cylindrical Rotor Synchronous Machines. Standards Press of China: Beijing, China, 2017.
  6. Tshiloz, K.; Djurović, S. State-of-the-Art Techniques for Fault Diagnosis in Electrical Machines: Advancements and Future Directions. Energies 2023, 16, 6345. [Google Scholar] [CrossRef]
  7. Radiuk, P.; Rusyn, B.; Melnychenko, O.; Perzynski, T.; Sachenko, A.; Svystun, S. Criticality Assessment of Wind Turbine Defects via Multispectral UAV Fusion and Fuzzy Logic. Energies 2025, 18, 4523. [Google Scholar] [CrossRef]
  8. Filina, O.A.; Martyushev, N.V.; Malozyomov, B.V.; Tynchenko, V.S.; Kukartsev, V.A.; Bashmur, K.A. Increasing the Efficiency of Diagnostics in the Brush-Commutator Assembly of a Direct Current Electric Motor. Energies 2024, 17, 17. [Google Scholar] [CrossRef]
  9. Li, J.; Li, Q.; Zhu, J. Health Condition Assessment of Wind Turbine Generators Based on Supervisory Control and Data Acquisition Data. IET Renew. Power Gener. 2019, 13, 1343–1350. [Google Scholar] [CrossRef]
  10. Wu, H.; Hu, T.; Liu, Y.; Zhou, H.; Wang, J.; Long, M. TimesNet: Temporal 2D-Variation Modeling for General Time Series Analysis. In Proceedings of the International Conference on Learning Representations (ICLR), Kigali, Rwanda, 1–5 May 2023. [Google Scholar] [CrossRef]
  11. Nie, Y.; Nguyen, N.H.; Sinthong, P.; Kalagnanam, J. A Time Series is Worth 64 Words: Long-term Forecasting with Transformers. In Proceedings of the International Conference on Learning Representations (ICLR), Kigali, Rwanda, 1–5 May 2023. [Google Scholar] [CrossRef]
  12. Fawaz, H.I.; Lucas, B.; Forestier, G.; Pelletier, C.; Schmidt, D.F.; Weber, J. InceptionTime: Finding AlexNet for Time Series Classification. Data Min. Knowl. Discov. 2020, 34, 1936–1962. [Google Scholar] [CrossRef]
  13. Zhang, L.; Zhang, H.; Cai, G. The Multiclass Fault Diagnosis of Wind Turbine Bearing Based on Multisource Signal Fusion and Deep Learning Generative Model. IEEE Trans. Instrum. Meas. 2022, 71, 1–12. [Google Scholar] [CrossRef]
  14. Ding, J.; Zhao, Z. Diagnosis of Stator Inter-Turn Short Circuit Faults in Synchronous Machines Based on SFRA and MTST. Energies 2025, 18, 2142. [Google Scholar] [CrossRef]
  15. Xiao, Y.; Shao, H.; Liu, B. Evaluating Calibration of Deep Fault Diagnostic Models under Distribution Shift. Comput. Ind. 2025, 171, 104334. [Google Scholar] [CrossRef]
  16. Yang, Y.; Zhang, S.; Su, K.; Fang, R. Early Warning of Stator Winding Overheating Fault of Water-Cooled Turbogenerator Based on SAE-LSTM and Sliding Window Method. Energy Rep. 2023, 9, 199–207. [Google Scholar] [CrossRef]
  17. Zhang, Y.; Ji, J.C.; Ren, Z.; Ni, Q.; Gu, F.; Feng, K. Digital Twin-Driven Partial Domain Adaptation Network for Intelligent Fault Diagnosis of Rolling Bearing. Reliab. Eng. Syst. Saf. 2023, 234, 109186. [Google Scholar] [CrossRef]
  18. Yan, S.; Zhong, X.; Shao, H.; Ming, Y.; Liu, C.; Liu, B. Digital Twin-Assisted Imbalanced Fault Diagnosis Framework Using Subdomain Adaptive Mechanism and Margin-Aware Regularization. Reliab. Eng. Syst. Saf. 2023, 239, 109522. [Google Scholar] [CrossRef]
  19. Yang, S.; Yang, P.; Yu, H.; Bai, J.; Feng, W.; Su, Y. A 2DCNN-RF Model for Offshore Wind Turbine High-Speed Bearing-Fault Diagnosis under Noisy Environment. Energies 2022, 15, 3340. [Google Scholar] [CrossRef]
  20. Memari, M.; Shekaramiz, M.; Masoum, M.A.S.; Seibi, A.C. Data Fusion and Ensemble Learning for Advanced Anomaly Detection Using Multi-Spectral RGB and Thermal Imaging of Small Wind Turbine Blades. Energies 2024, 17, 673. [Google Scholar] [CrossRef]
  21. Jin, Z.; Xu, Q.; Jiang, C.; Wang, X.; Chen, H. Ordinal Few-Shot Learning with Applications to Fault Diagnosis of Offshore Wind Turbines. Renew. Energy 2023, 206, 1158–1169. [Google Scholar] [CrossRef]
  22. Shi, X.; Cao, W.; Raschka, S. Deep Neural Networks for Rank-Consistent Ordinal Regression Based on Conditional Probabilities. Pattern Anal. Appl. 2023, 26, 941–955. [Google Scholar] [CrossRef]
  23. Sander, R. Compilation of Henry’s Law Constants (Version 4.0) for Water as Solvent. Atmos. Chem. Phys. 2015, 15, 4399–4981. [Google Scholar] [CrossRef]
  24. Atkins, P.; de Paula, J.; Keeler, J. Atkins’ Physical Chemistry, 11th ed.; Oxford University Press: Oxford, UK, 2018. [Google Scholar]
  25. Fogler, H.S. Elements of Chemical Reaction Engineering, 5th ed.; Pearson: Upper Saddle River, NJ, USA, 2016. [Google Scholar]
  26. DL/T 801-2010; Water Quality and System Technical Requirements for Inner Cooling Water of Large Generators. China Electric Power Press: Beijing, China, 2010.
  27. Katser, I.; Kozitsin, V. Skoltech Anomaly Benchmark (SKAB); Kaggle: Moscow, Russia, 2020. [Google Scholar] [CrossRef]
  28. Poch, M. Water Treatment Plant; UCI Machine Learning Repository: Irvine, CA, USA, 1993. [Google Scholar] [CrossRef]
  29. Guck, C.; Roelofs, C.M.A.; Faulstich, S. CARE to Compare: A Real-World Benchmark Dataset for Early Fault Detection in Wind Turbine Data. Data 2024, 9, 138. [Google Scholar] [CrossRef]
  30. Hu, J.; Shen, L.; Sun, G. Squeeze-and-Excitation Networks. In 2018 IEEE/CVF Conference on Computer Vision and Pattern Recognition; IEEE: New York, NY, USA, 2018; pp. 7132–7141. [Google Scholar] [CrossRef]
  31. Gorishniy, Y.; Rubachev, I.; Khrulkov, V.; Babenko, A. Revisiting Deep Learning Models for Tabular Data. In Advances in Neural Information Processing Systems; NIPS Foundation: San Diego, CA, USA, 2021. [Google Scholar] [CrossRef]
  32. Arevalo, J.; Solorio, T.; Montes-y-Gómez, M.; González, F.A. Gated Multimodal Units for Information Fusion. In ICLR Workshop; OpenReview.net: Toulon, France, 2017. [Google Scholar] [CrossRef]
  33. Hou, L.; Yu, C.-P.; Samaras, D. Squared Earth Mover’s Distance-Based Loss for Training Deep Neural Networks. arXiv 2016, arXiv:1611.05916. [Google Scholar] [CrossRef]
  34. Cui, Y.; Jia, M.; Lin, T.-Y.; Song, Y.; Belongie, S. Class-Balanced Loss Based on Effective Number of Samples. In 2019 IEEE/CVF Conference on Computer Vision and Pattern Recognition (CVPR); IEEE: New York, NY, USA, 2019; pp. 9268–9277. [Google Scholar] [CrossRef]
  35. Ren, J.; Yu, C.; Sheng, S.; Ma, X.; Zhao, H.; Yi, S. Balanced Meta-Softmax for Long-Tailed Visual Recognition. In Proceedings of the Advances in Neural Information Processing Systems, virtual, 6–12 December 2020. [Google Scholar] [CrossRef]
  36. Cao, K.; Wei, C.; Gaidon, A.; Aréchiga, N.; Ma, T. Learning Imbalanced Datasets with Label-Distribution-Aware Margin Loss. In Proceedings of the Advances in Neural Information Processing Systems, Vancouver, BC, Canada, 8–14 December 2019. [Google Scholar] [CrossRef]
  37. Zhang, H.; Cissé, M.; Dauphin, Y.N.; Lopez-Paz, D. Mixup: Beyond Empirical Risk Minimization. In Proceedings of the International Conference on Learning Representations (ICLR), Vancouver, BC, Canada, 30 April–3 May 2018. [Google Scholar] [CrossRef]
  38. Wolpert, D.H. Stacked Generalization. Neural Netw. 1992, 5, 241–259. [Google Scholar] [CrossRef]
Figure 1. Representative input windows (top) and class-wise sample distributions (bottom) for (a) SKAB, (b) UCI-WWT, (c) CARE Wind Farm A, and (d) Synth H2. In the time-series panels (a,c,d), the bold trace denotes the highest-variance channel and the pale traces denote the other five selected channels. Panel (b) shows 12 z-scored features; bar labels report class counts and percentages.
Applsci 16 07764 g001
Figure 2. Overall multi-source data fusion framework: four industrial domains feed dedicated encoders, are merged by the fusion module, supervised with the hybrid CORN + EMD ordinal loss, and aggregated through a calibrated ensemble to produce GB/T 43188 severity grades.
Applsci 16 07764 g002
Figure 3. Per-class F1 across the four GB/T 43188 ordinal levels for the cross-entropy fusion baseline (CNN-LSTM + Cross-Attention), the single best CORN + EMD model, and the calibrated ensemble, with precision–recall whiskers and Δ versus the ensemble.
Applsci 16 07764 g003
Figure 4. Confusion matrices on the 600-sample test set for (a) the CORN-trained legacy fusion baseline (CNN-LSTM + Concat), (b) the single CORN + EMD model, and (c) the calibrated ensemble; cells are shaded by prediction–target ordinal distance.
Applsci 16 07764 g004
Figure 5. Method-level F1-macro ablation: (a) test means ± standard deviations over three seeds, with no error bar for the deterministic ensemble; (b) gains from cross-entropy fusion (+13.5 pp) and ordinal supervision with calibrated ensembling (+8.9 pp) over the single-stream ceiling (0.311).
Applsci 16 07764 g005
Figure 6. Learning curves of the five strongest single models: (a) validation F1-macro, with the dashed reference at F1 = 0.5349 marking the calibrated-ensemble level; (b) validation Accuracy; (c) validation Cohen’s κ; (d) training loss. Curves end at the early-stopping epoch of each model.
Applsci 16 07764 g006
Figure 7. Calibration ablation for (a,d) ours-only, (b,e) legacy-only, and (c,f) combined pools: (ac) validation and test F1-macro; (df) validation-to-test changes. S1, raw; S2, temperature scaling; S3, S2 plus per-model offsets; S4, S3 plus a global offset.
Applsci 16 07764 g007
Figure 8. t-SNE projection of the best single-model embeddings on the 600-sample test set. Panels (ad) highlight Normal (n = 38), Attention (n = 126), Abnormal (n = 92), and Serious (n = 344), respectively; stars mark class centroids (coordinate-wise medians).
Applsci 16 07764 g008
Table 1. GB/T 43188-2023 four-level ordinal mapping rules.
LevelLabelSKAB (r)CARE (r)UCI-WWT (η)Synth (ṁ, μg/h)
Normal0r = 0r = 0η ≥ 0.91ṁ < 50
Attention10 < r ≤ 0.300 < r ≤ 0.300.87 ≤ η < 0.9150 ≤ ṁ < 500
Abnormal20.30 < r ≤ 0.700.30 < r ≤ 0.700.80 ≤ η < 0.87500 ≤ ṁ < 5000
Serious3r > 0.70r > 0.70η < 0.80ṁ ≥ 5000
Table 2. Fused data collection splits and class distribution (stratified seed = 42).
Split N Class 0Class 1Class 2Class 3
Train3000178 (5.9%)625 (20.8%)490 (16.3%)1707 (56.9%)
Validation60050 (8.3%)111 (18.5%)94 (15.7%)345 (57.5%)
Test60038 (6.3%)126 (21.0%)92 (15.3%)344 (57.3%)
Table 3. Comparison with baseline methods on the 600-sample test set (mean ± standard deviation over three seeds; bold = best). The calibrated ensemble is deterministic and reported as a single value.
MethodParamsF1-MacroAccκQWK
InceptionTime [12] (CARE)0.51 M0.3112 ± 0.01490.44720.16740.2331
TimesNet [10] (CARE)4.69 M0.3056 ± 0.00590.43780.16200.2299
InceptionTime (SKAB)0.50 M0.2979 ± 0.00490.45500.11560.1613
TimesNet (SKAB)4.69 M0.2829 ± 0.01240.39170.08640.1254
PatchTST [11] (CARE)4.17 M0.2711 ± 0.01650.37390.04790.0782
InceptionTime (Synth)0.50 M0.2411 ± 0.00760.39440.01130.0398
XGBoost (4-domain)0.3847 ± 0.01080.63940.3366n/a
Random forest (4-domain)0.3826 ± 0.01470.57940.3134n/a
Logistic regression (4-domain)0.3691 ± 0.00000.46170.2144n/a
Transformer (CARE, CORN + EMD)0.10 M0.2905 ± 0.00680.51890.12890.1753
MLP (UCI, CORN + EMD)0.03 M0.2061 ± 0.00630.56390.01820.0381
CNN-LSTM + Cross-Attn + CE (4-domain)0.29 M0.4463 ± 0.01510.53170.3155n/a
CNN-LSTM + Cross-Attn + CORN (4-domain)0.29 M0.4602 ± 0.02330.61110.35610.4558
Ours single (Multi-Scale + FTT + Gated, CORN + EMD)1.62 M0.4770 ± 0.01830.5950 ± 0.03410.3794 ± 0.03000.4929 ± 0.0173
Ours ensemble (combined-32 + T)32 × (0.22–1.62 M)0.53490.67170.47130.5948
Δ vs. InceptionTime (CARE) +22.4 pp+22.5 pp+30.4 pp+36.2 pp
Δ vs. strongest CE fusion +8.9 pp
Table 4. Class-offset calibration across the three sub-pools: validation-set and test-set F1-macro for temperature-only (T) and temperature-plus-per-model-offset calibration (bold = adopted headline configuration). All calibration parameters are fitted on the validation set only.
Sub-EnsembleT-Only (Val)T-Only (Test)T + Offsets (Val)T + Offsets (Test)
ours-only (26 models)0.46570.51490.46770.5197
legacy-only (6 models)0.46030.52350.47290.5360
combined (32 models)0.46240.53490.46990.5217
Table 5. Sensitivity of the frozen pipeline to hydrogen-side generator parameters on the 600-sample test set.
PerturbationEnsemble F1ΔF1 (pp)Ensemble QWKΔQWK (pp)Single-Model ΔF1 (pp)
Nominal0.53490.000.59480.000.00
Henry’s constant ×0.8/0.9/1.1/1.20.53490.000.59480.000.00
Solution enthalpy ×0.8/×1.20.53490.000.59480.000.00
Loop time constant ×0.8/×1.20.53490.000.59480.000.00
Inlet temperature −2 °C/+2 °C0.5069/0.5065−2.80/−2.840.5704/0.5629−2.44/−3.19+0.18/−0.71
H2 pressure ×0.9/×1.10.5251/0.5044−0.98/−3.060.5425/0.5661−5.22/−2.87−0.15/−2.35
Sensor noise ×1.50.5303−0.460.5841−1.06−0.25
Disclaimer/Publisher’s Note: The statements, opinions and data contained in all publications are solely those of the individual author(s) and contributor(s) and not of MDPI and/or the editor(s). MDPI and/or the editor(s) disclaim responsibility for any injury to people or property resulting from any ideas, methods, instructions or products referred to in the content.