Article

Remaining Capacity of LFP and NMC Batteries—Extensive Analysis of Commercially Available BEV Models in European Union


by
Maria Cristea
1,2,*,
Thomas Imre Cyrille Buidin
2,3,
Kivanc Basaran
4,
Ciprian Cristea
1 and
Radu-Adrian Tîrnovan
1
1
Faculty of Electrical Engineering, Technical University of Cluj-Napoca, 26-28 G. Barițiu Street, 400027 Cluj-Napoca, Romania
2
Academy of Romanian Scientists, 3rd Ilfov Street, 030167 Bucharest, Romania
3
Faculty of Automotive, Mechatronics and Mechanical Engineering, Technical University of Cluj-Napoca, 103-105 Muncii Ave., 400641 Cluj-Napoca, Romania
4
Department of Electrical Engineering, Hasan Ferdi Turgutlu Technology Faculty, Manisa Celal Bayar University, 45400 Manisa, Türkiye
*
Author to whom correspondence should be addressed.
Appl. Sci. 2026, 16(15), 7756; https://doi.org/10.3390/app16157756
Submission received: 26 June 2026 / Revised: 24 July 2026 / Accepted: 29 July 2026 / Published: 4 August 2026
(This article belongs to the Special Issue New Trends in Sustainable Energy Technology)

Abstract

The increasing number of new battery electric vehicle (BEV) registrations worldwide and the development of advanced batteries with higher energy density and pack capacity have contributed to large volumes of batteries approaching the end of their first service life. The retired batteries may be repurposed in second-life applications or recycled. The degradation profile of BEVs is a critical determinant in second-life potential of the retired batteries. This study presents a comprehensive analysis of calendar and cycle mechanisms in lithium iron phosphate (LFP) and nickel manganese cobalt oxide (NMC) batteries across 37 commercially available BEV models in the European Union (EU) market. Three scenarios are considered, based on the operational temperature—Scenario I with a 273.15 K, Scenario II with a 298.15 K, and Scenario III with a 318.15 K operational temperature—and two degradation metrics are determined for each analyzed BEV: state-of-health (SoH) and remaining capacity at end-of-life (EoL). The results show that the SoH of both chemistries is highly dependent on the state-of-charge (SoC), temperature, depth of discharge (DoD), and real usable capacity. Moreover, the Tesla Model 3–Premium RWD, Volkswagen ID.3, ID.4, and ID5–GTX, and the Tesla Model Y–Premium AWD all exhibit a remaining capacity between 40 and 77 kWh at EoL, depending on degradation profile, making them a viable option for second-life applications.

1. Introduction

The transition toward a low-carbon energy system depends not only on integrating large-scale renewable energy sources [1], but also on the decarbonization of the transportation sector by promoting carbon-neutral mobility. Beyond their role in reducing carbon dioxide emissions during utilization, electric vehicles (EVs) offer several benefits in comparison to internal combustion engine vehicles, including reduced noise pollution, diversification of energy supply sources, and low operating costs [2].
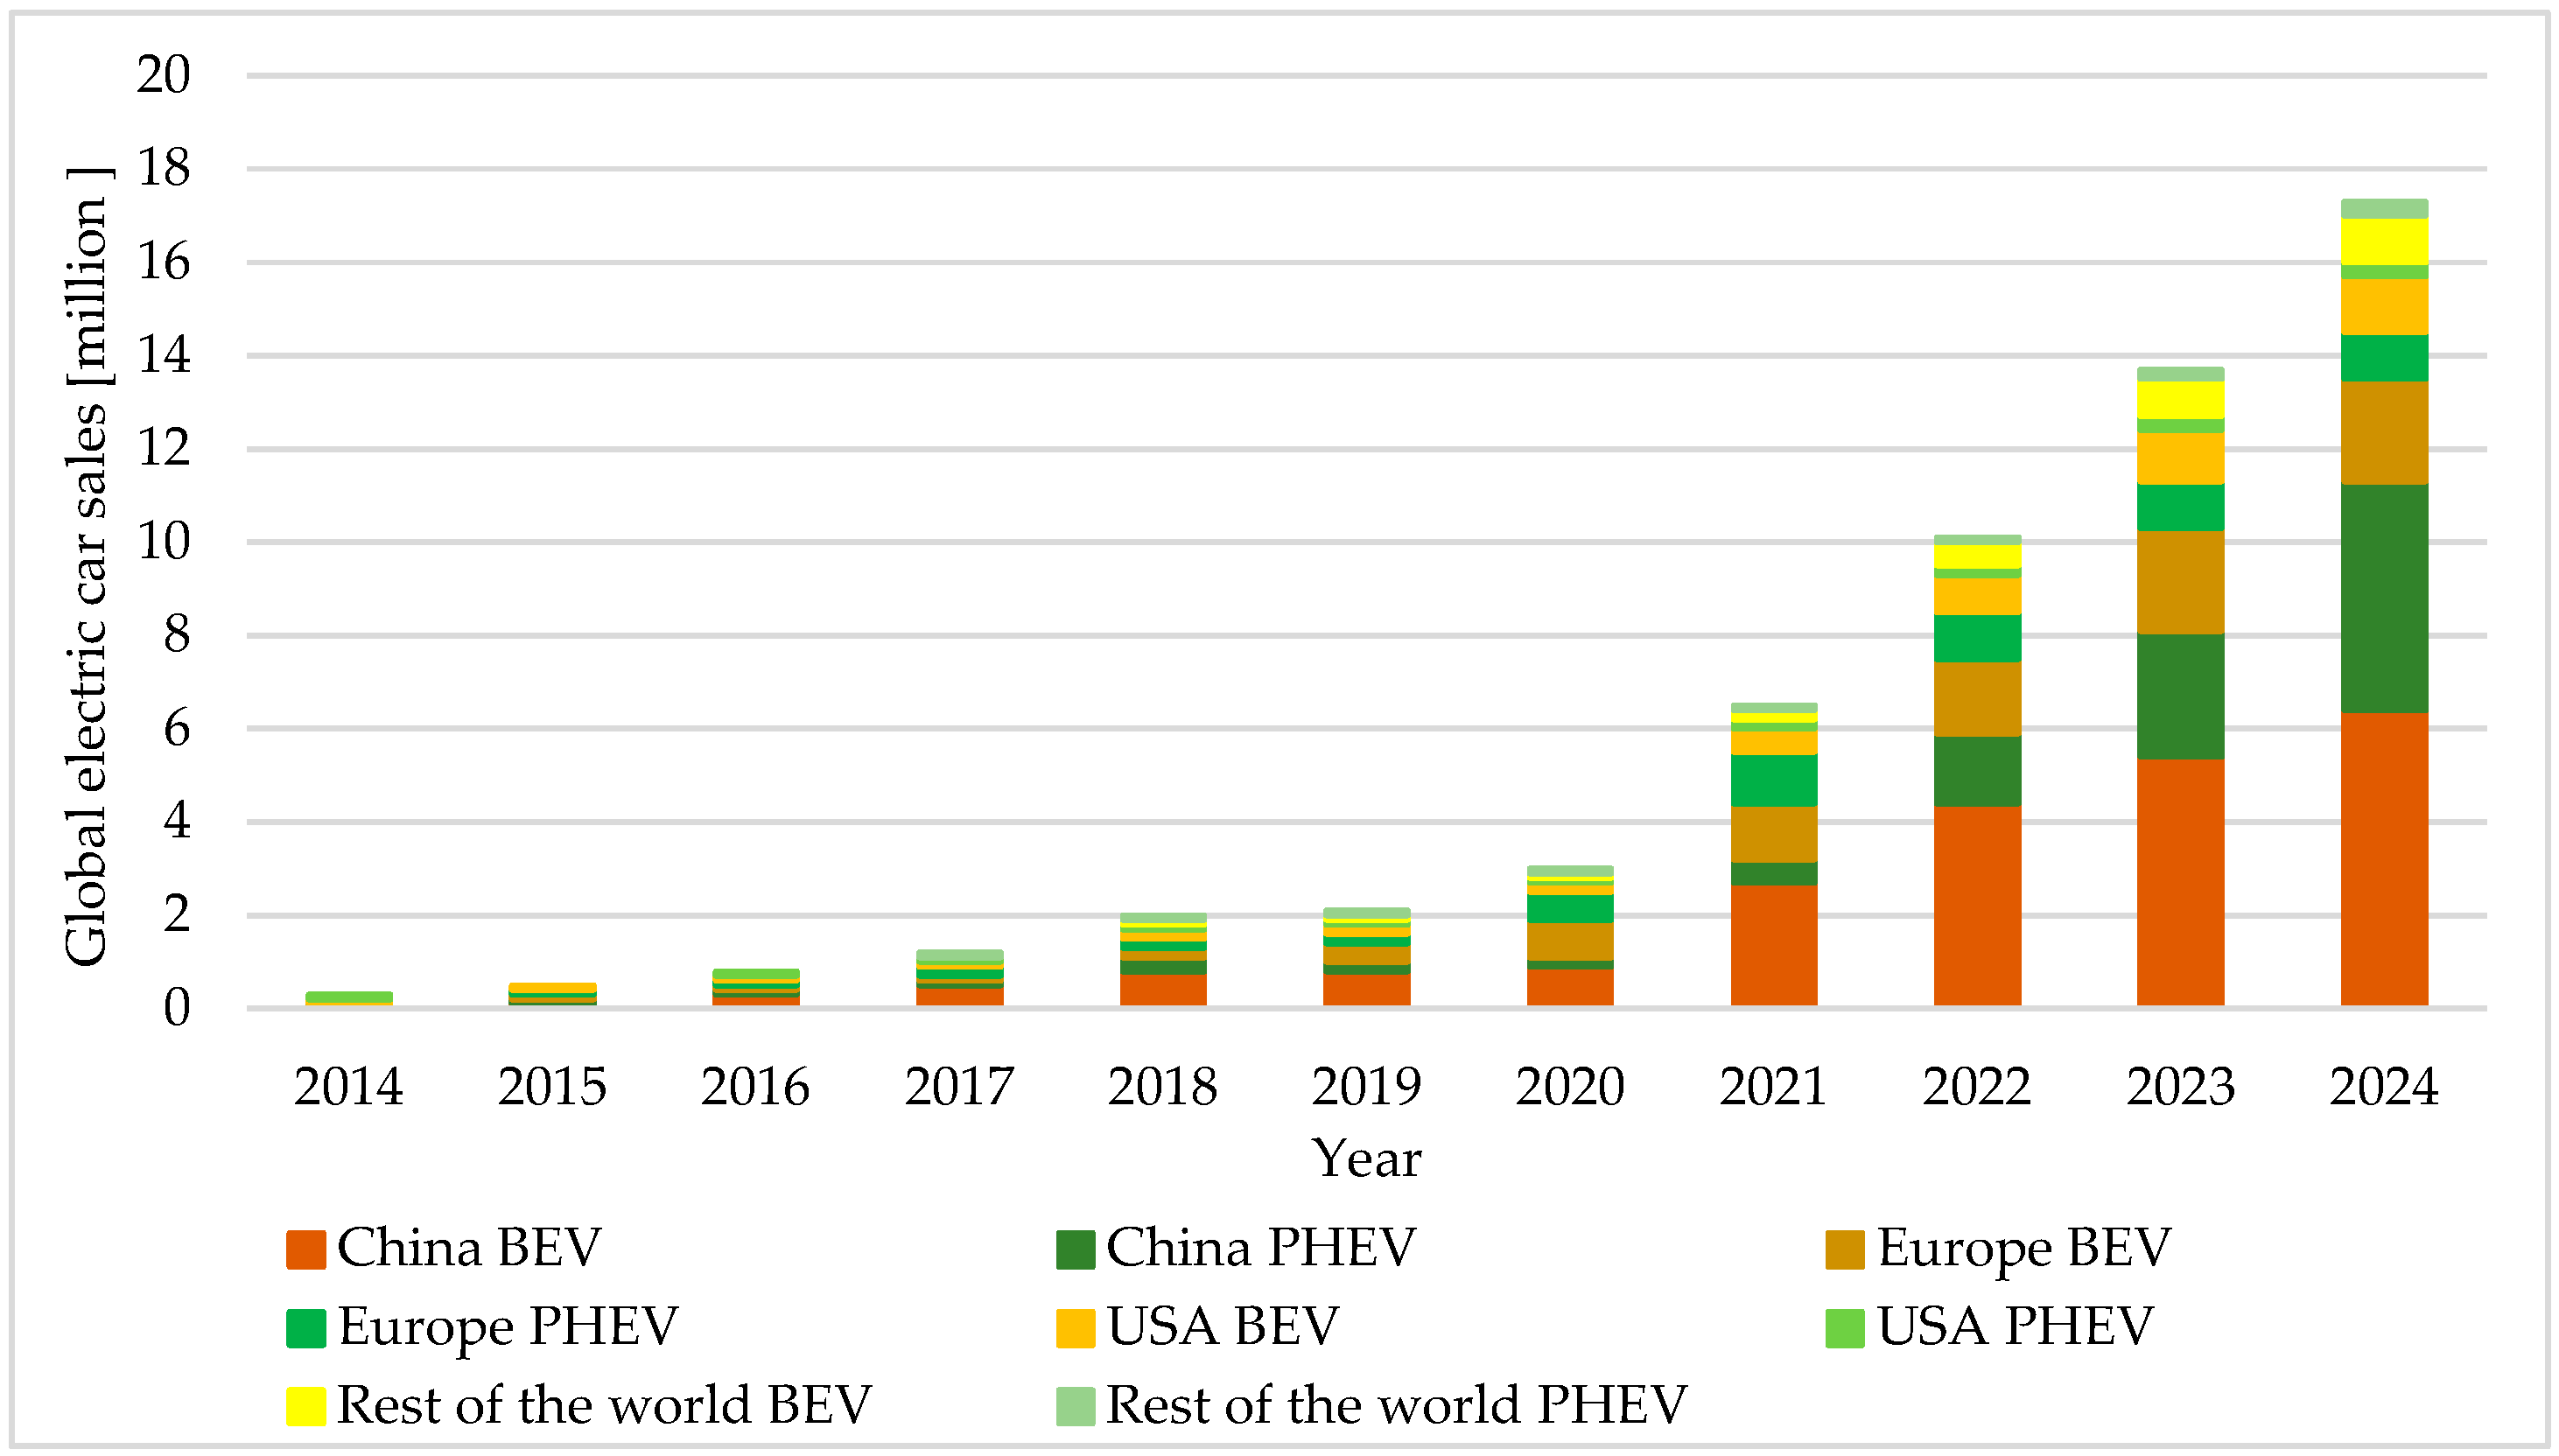
In the last decade, the adoption of EVs has increased significantly worldwide, as presented in Figure 1. EV sales exceeded 17 million units in 2024, with China maintaining its lead in the global market, followed by Europe, as EV adoption expanded across European Union (EU-27) countries. Both plug-in hybrid electric vehicle (PHEV) and battery electric vehicle (BEV) sales increased in recent years, with around one in twenty cars in operation being electric [3].
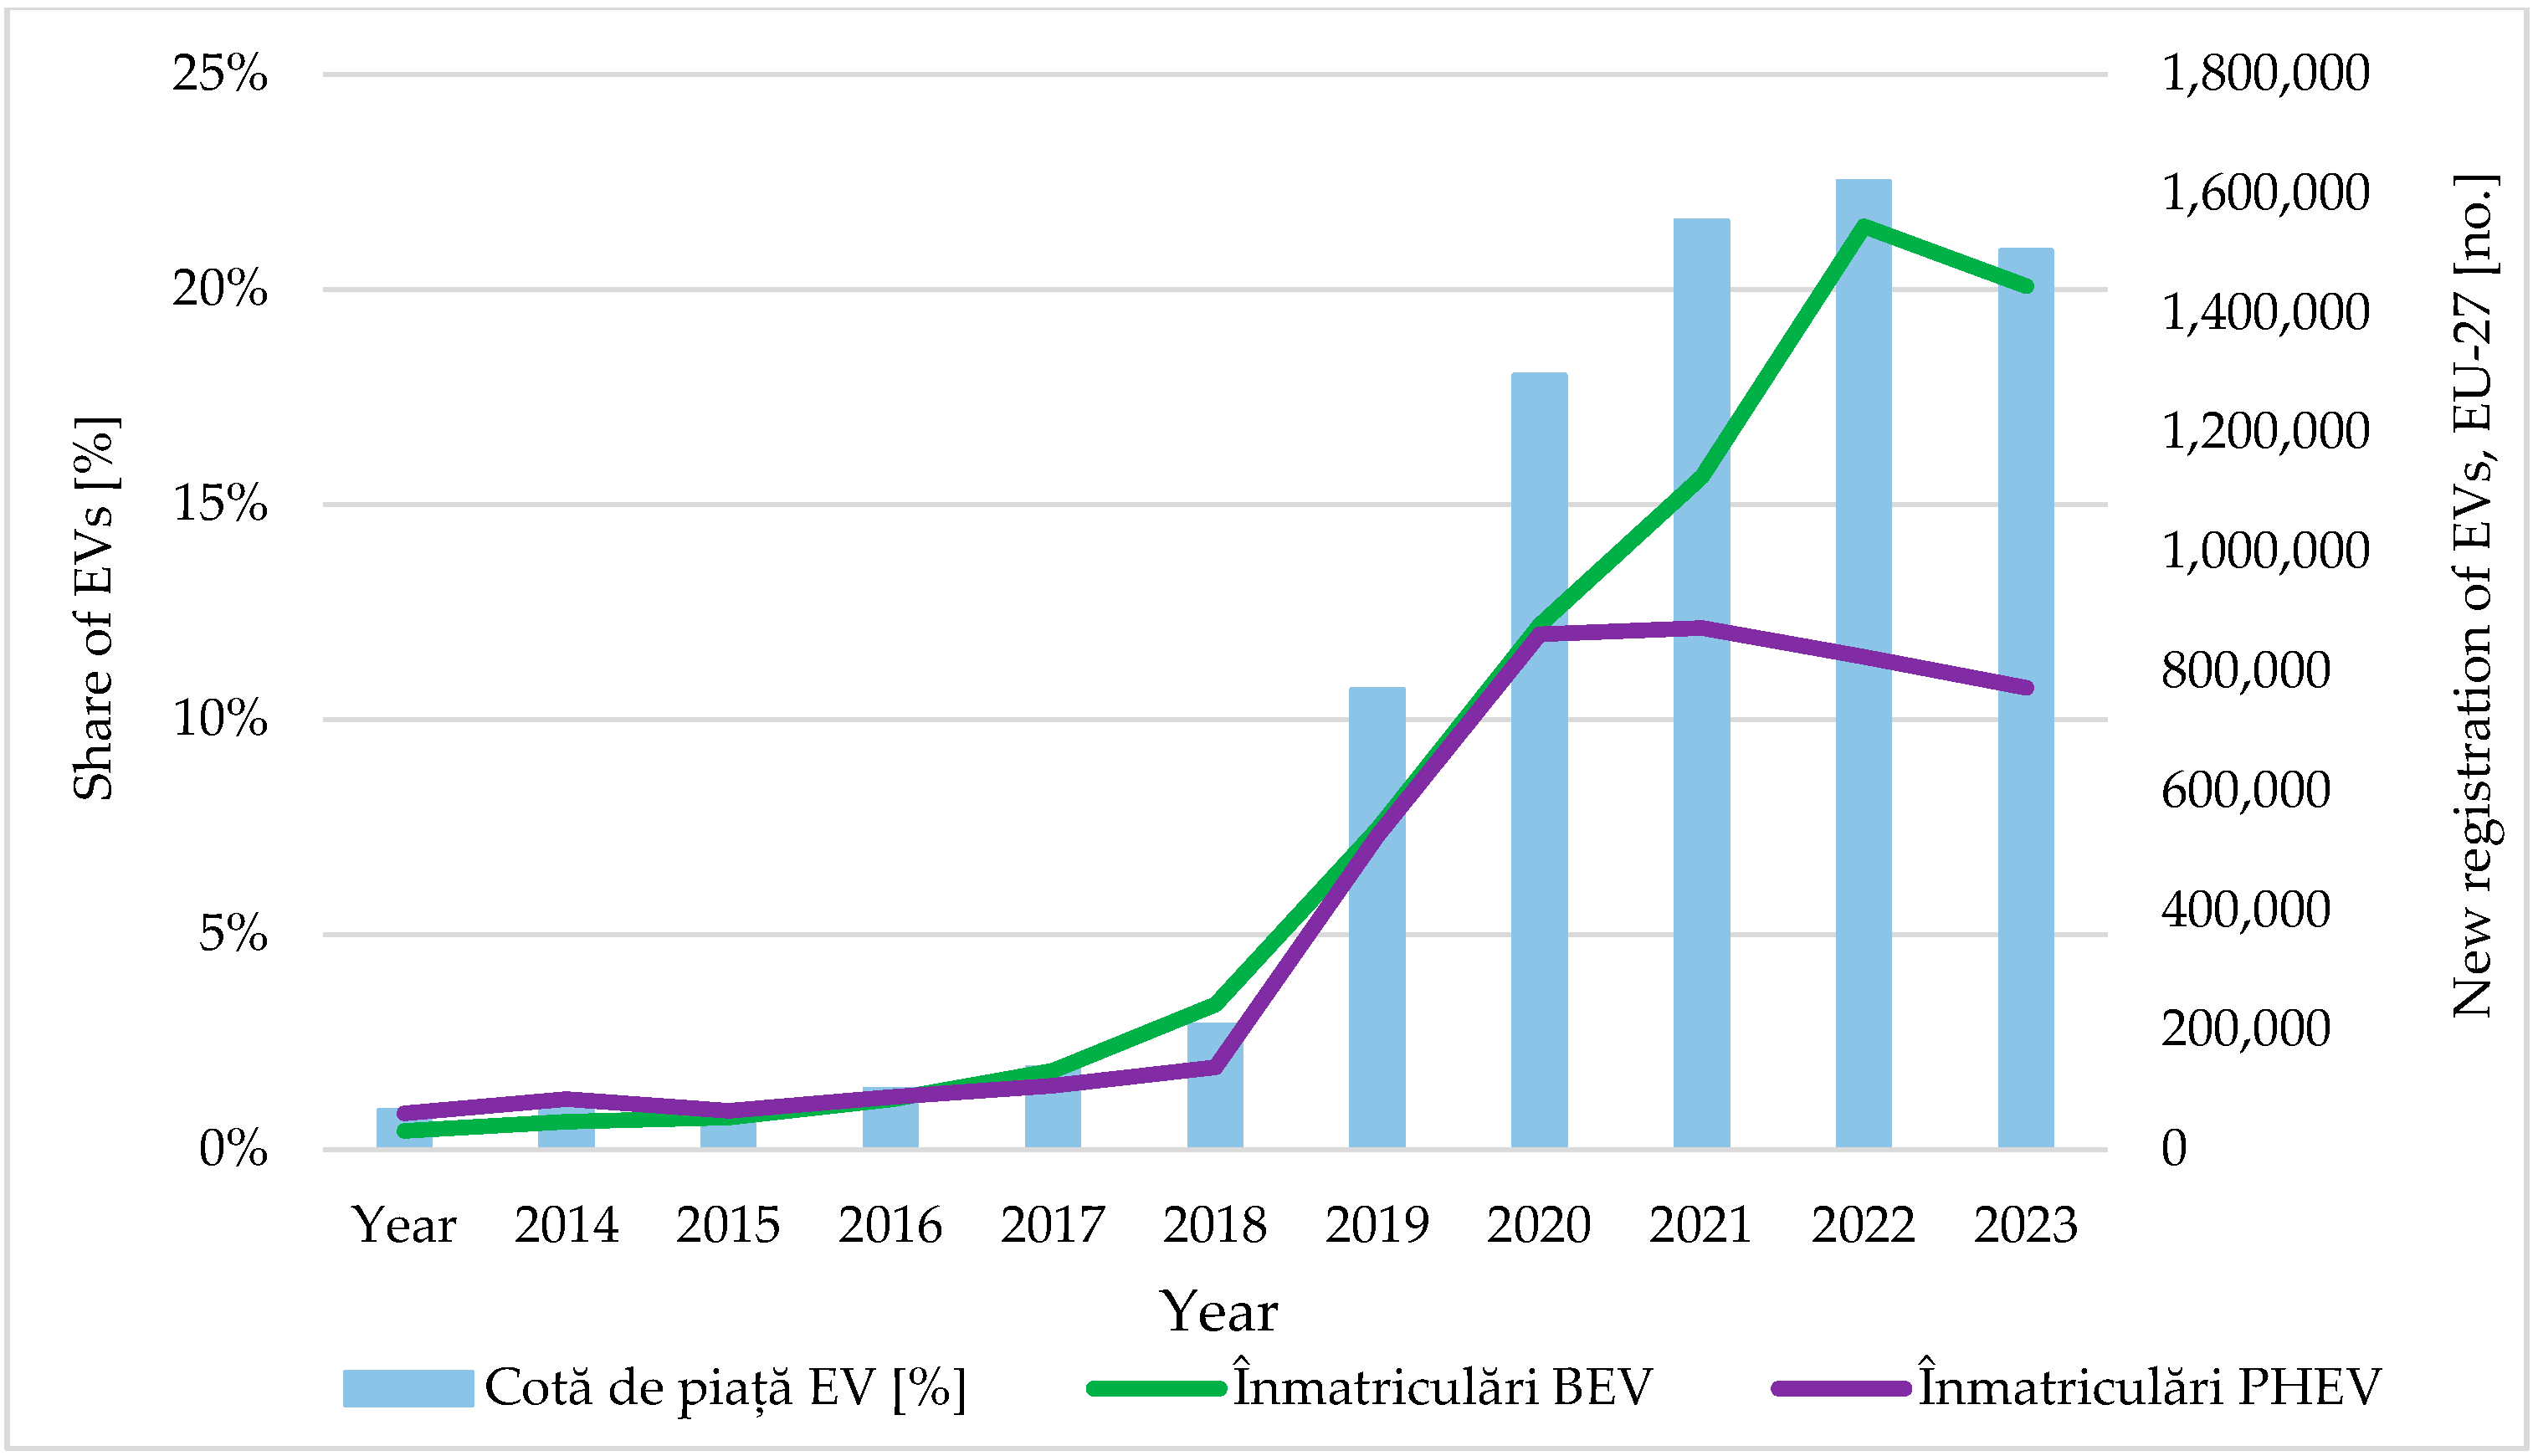
In 2024, passenger EVs accounted for almost 21% of the market share in EU-27 countries, with over 1.4 million new BEV and 800,000 PHEV registrations, as shown in Figure 2. The rapid growth is due to advancements in battery technology and increased range with a single charge, following the development of high-capacity batteries [4].
In EU-27 countries, Germany, France, Belgium, and the Netherlands together accounted for about 65% of all new BEV registrations in 2024, as observed in Figure 3 [4]. Other countries that had a high BEV adoption rate include Sweden, Spain, Italy, Denmark, Portugal, and Austria. Despite significant growth, in 13 out of the 27 EU countries EV sales stalled or decreased as a result of reduced or removed subsidies [3] and new regulations adopted regarding the management of batteries and used batteries [5].
The preferred electrochemical battery technology for BEVs is lithium-ion batteries, due to their high energy density, stable performance considering operating conditions, and long cycle life. Two chemistries dominate the market: lithium iron phosphate (LFP) and nickel manganese cobalt oxide (NMC) [6]. With the surge in BEV adoption, the volume of retired LFP and NMC batteries is increasing, presenting significant recycling challenges, including highly complex disassembly processes and strict safety standards [7], which may lead to high recycling costs.
Considering their degradation over time and use, retired BEV batteries may be repurposed in second-life applications with significant environmental, economic, and grid-stability benefits [8,9]. The progressive degradation of batteries depends on calendar aging, governed by environmental and operational factors, and cycle aging, dominated by operating conditions [6]. The main factors that influence the state-of-health (SoH) of BEV batteries at end-of-life (EoL) are temperature (T), charging/discharging current rate, state-of-charge (SoC), depth of discharge (DoD), and recycling regime [10]. Moreover, the remaining capacity for second-life applications depends also on usable capacity, driving distances, driving behavior, and energy consumption [11], which may vary depending on BEV brand, model, and edition.
This paper investigates the SoH and remaining EoL capacity of retired batteries for the most commercialized BEVs in EU-27 countries, which exhibit a high BEV adoption rate. To the best of the authors’ knowledge, no previous study has performed an extensive analysis of this scale. Nevertheless, several related works have investigated the capacity loss of different BEV models under various conditions, as presented in Table 1. Bilfinger analyzed in [12] the aging of Volkswagen ID.3 Pro and Tesla Model 3 Standard Range Plus batteries under cell-level conditions by performing differential voltage and incremental capacity analyses. The results indicated that after 2 years of usage with mileages of 32,600 km and 26,300 km, respectively, the capacity loss for the analyzed BEVs were 12.1 Ah and 4.9 Ah, respectively, with degradation being present.
Bülow proposed in [13] a SoH forecasting model applied to a fleet of 550 BEVs, using real-world data, based on histogram and accessible features. The results revealed an improvement in forecast performance of 6.1% when transitioning from accessible to histogram features.
Vignesh used in [14] several non-destructive approaches to estimate the battery SoH of the 2011 Nissan Leaf BEV. The methods considered include a capacity-based approach, centered around the impact of the state-of-charge on the actual capacity and nominal capacity; the charging current in constant voltage mode; a differential voltage incremental capacity approach; an integrated voltage approach; a gradual current decrease approach; a differential current in constant voltage mode approach; and an incremental energy analysis approach. The results indicate an estimated SoH between 27% and 48% based on capacity.
Sevdari presented in [15] an empirical analysis of degradation in Renault Zoe batteries. Through a non-invasive CANBUS measurement technique, the influence of usage patterns and calendar aging on NMC batteries were analyzed. The main results reveal that the degradation of a Renault Zoe R90 is from 4.17% to 5.8% after 10,145 to 22,872 km.
Finally, Rosner performed in [16] a detailed analysis of the Tesla Model 3 Standard Range Plus 2020 with a LFP battery, considering vehicle range, efficiency, and operation strategies. Several experimental tests were conducted at the vehicle level, including battery pack teardown, cell-level testing in a thermal chamber, and efficiency mapping of the power unit across different states of charge. The results show that the battery reaches a capacity of 55.2 kWh after 25,716 km.
This study performs an extensive analysis of the most commercialized BEVs in EU-27 countries with a high BEV adoption rate, with the objective of determining the remaining capacity available for second-life applications. The retired batteries studied are from BEV models with more than 100,000 registrations between 2017 and 2024. Based on calendar and cycling aging, the SoH is estimated in three scenarios, taking into account an operational temperature of 273.15 K, 298.15 K, and 318.15 K. Moreover, in each scenario, three driving distances are considered—short-, medium- and long-range—each with different values for the SoC and DoD. The findings of this study can provide valuable information for stakeholders involved in battery reuse in second-life applications, as well as recycling possibilities, by indicating the remaining capacity of the leading models and editions within the best-selling BEVs in EU-27 countries, without resorting to time-consuming test procedures.
The rest of the paper is structured as follows: Section 2 describes the analyzed BEVs and the proposed scenarios based on temperature variations; Section 3 presents the algorithm used to determine the SoH and remaining capacity of the analyzed BEV models; Section 4 shows the results obtained for each analyzed BEV model in the considered scenarios, and finally, in Section 5 of the paper, the conclusions are drawn.

2. Selected BEV Models and Considered Scenarios

In this section, the technical BEV characteristics and specifications are outlined. Next, the considered scenarios for battery degradation are described, each with their own variable parameters.

2.1. Analyzed BEV Models and Their Specifications

In 2024, several EU-27 countries had a high BEV adoption rate, exceeding 40,000 registrations: Germany, France, Belgium, the Netherlands, Sweden, Spain, Italy, Denmark, Portugal, and Austria. Thus, these countries were studied further in this paper. From 2017 to 2024, there were more than 6.5 million new BEV registrations from over 26 manufacturers [17]. The most sold brands, which hold a greater market share, include Tesla (14%), Volkswagen (12%), Renault (8%), BMW (6%), and Hyundai (5%), as presented in Figure 4.
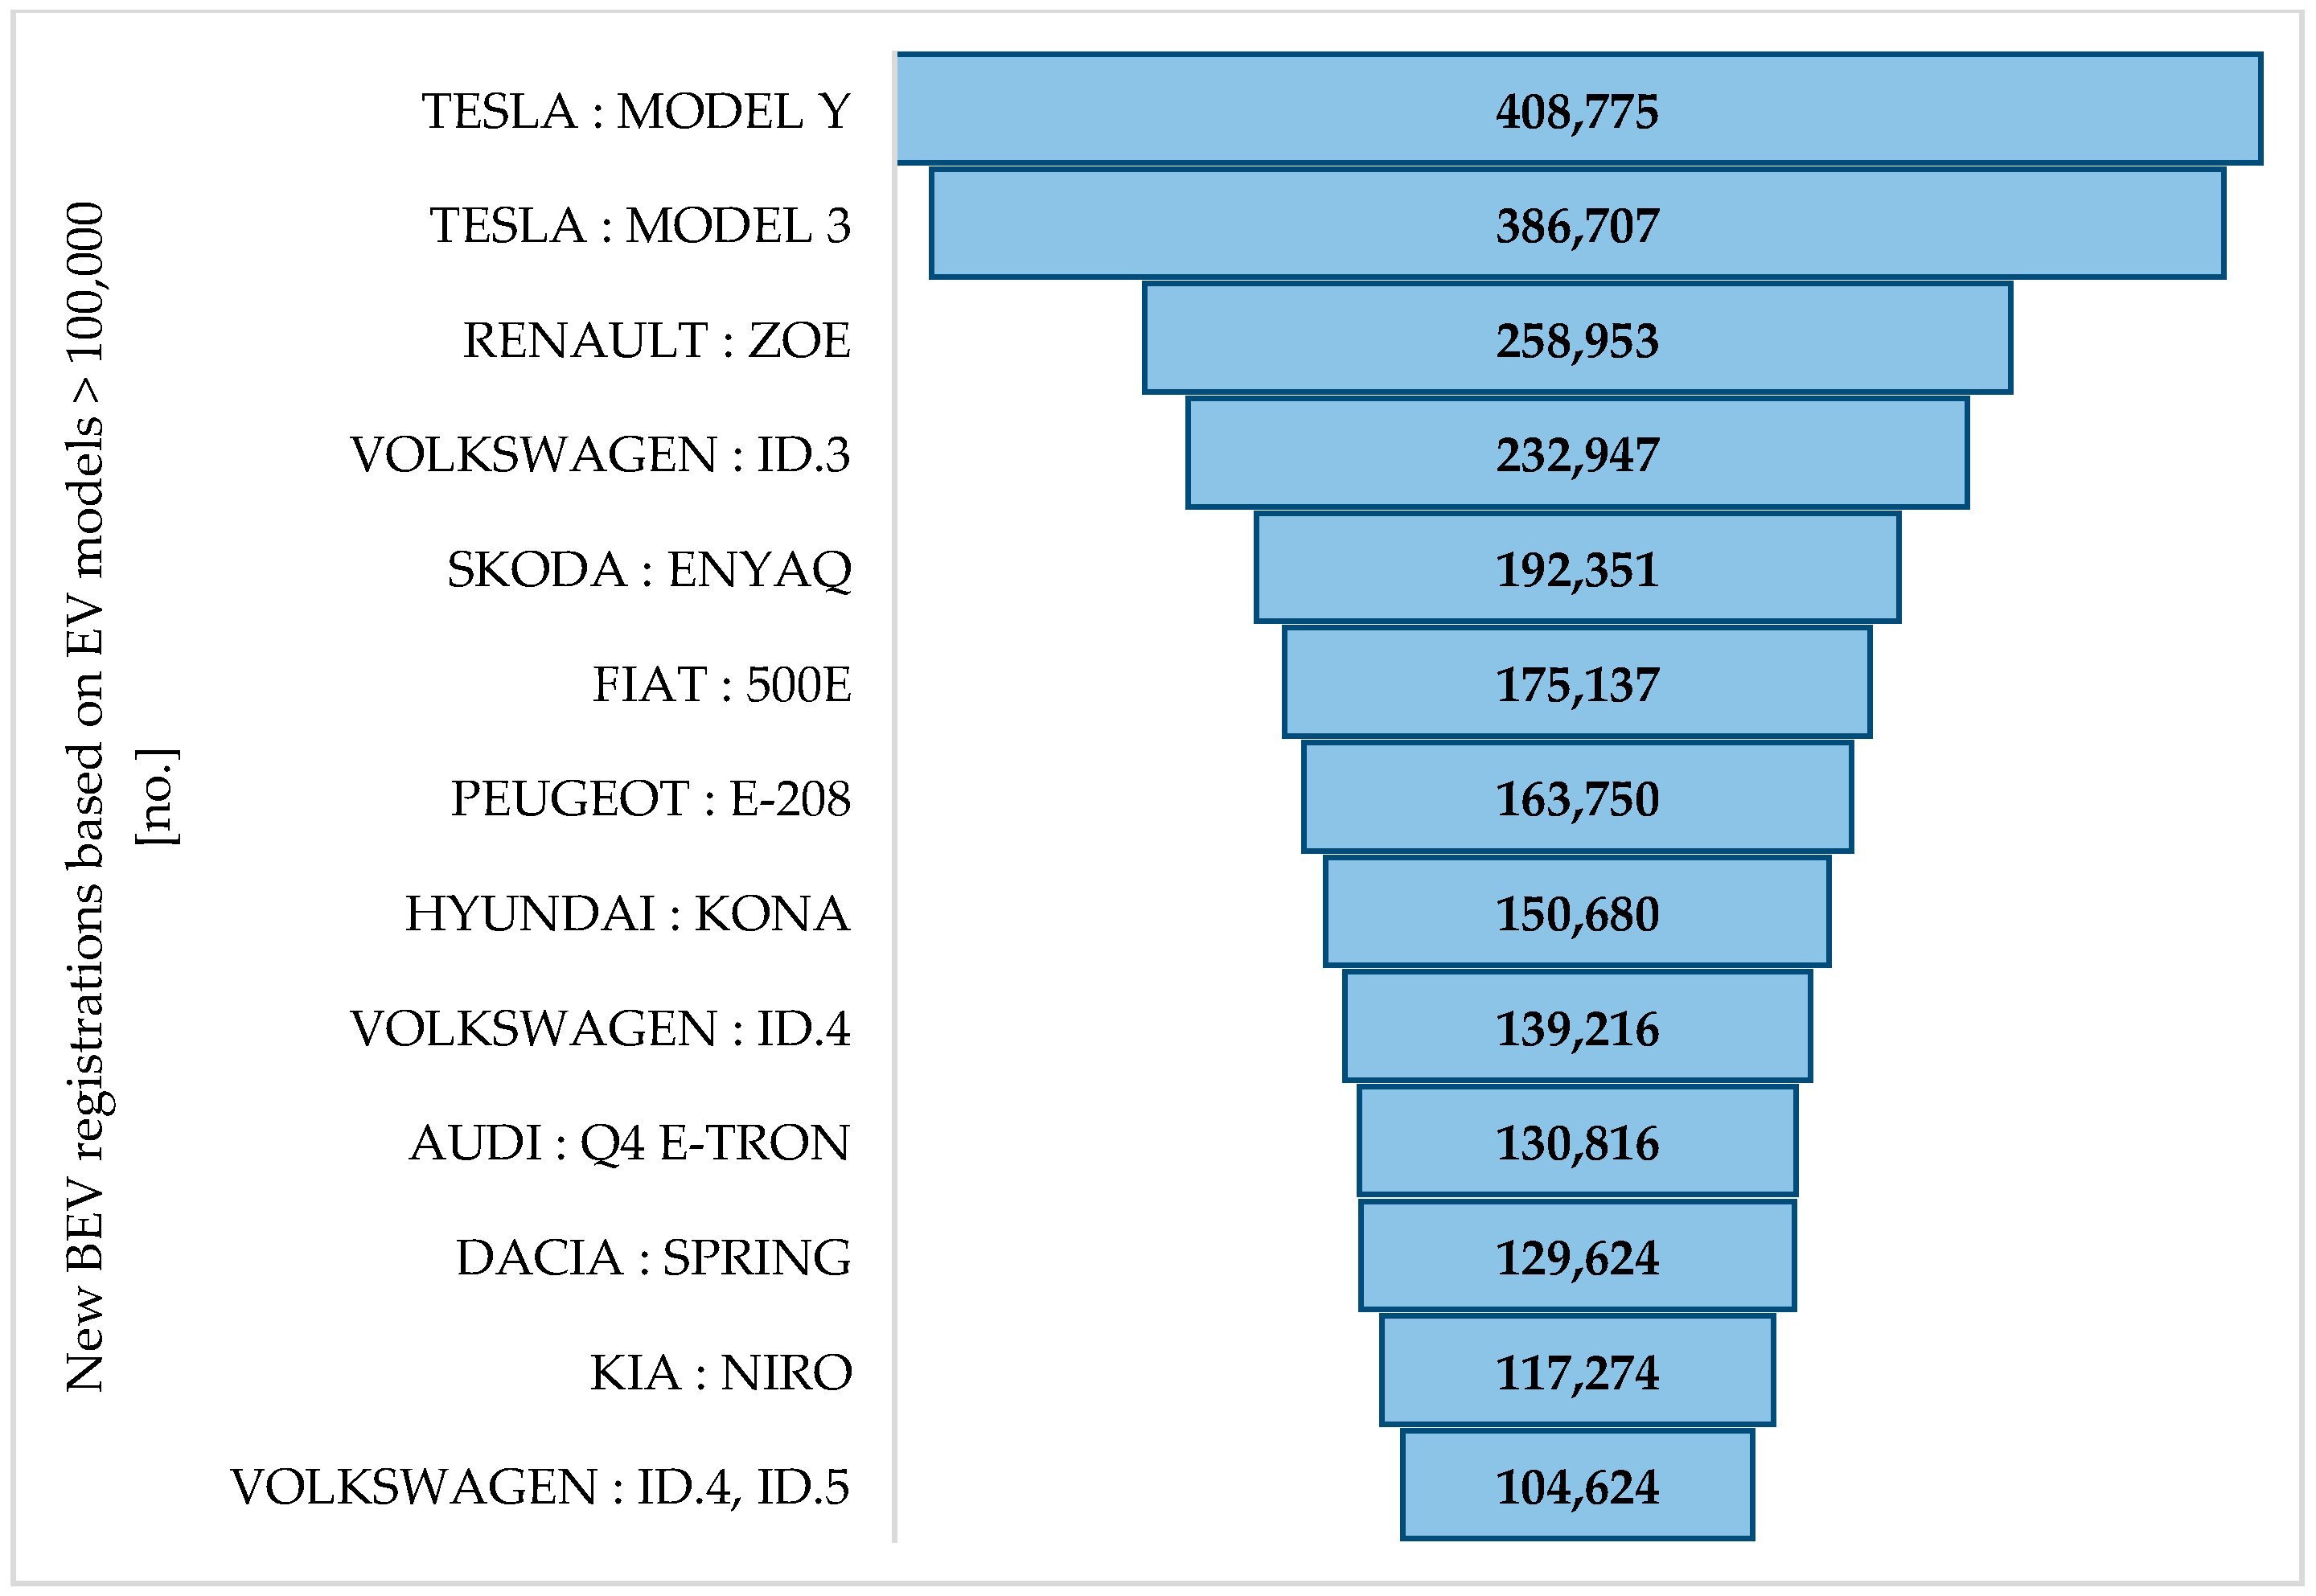
Considering that each brand has introduced several models to the market in recent years, there are over 90 BEV models available for purchase, each with their own technical specifications. Among these, 13 models surpass 100,000 registered BEVs, as presented in Figure 5. The identified BEV models are further analyzed to determine their remaining capacity at EoL. Each model has several editions, differentiated by battery chemistry, usable capacity, vehicle energy consumption, warranty period, and mileage. Ultimately, a total of 37 model editions were subjected to degradation in order to estimate the SoH at EoL.
The technical characteristics of the samples considered are presented in Table 2. As can be observed, the battery chemistry is either LFP or NMC, the usable capacity varies between 21.3 kWh (Fiat: 500E–Hatchback) and 79 kWh (Tesla: Model Y-Premium AWD), and the vehicle consumption ranges from 135 Wh/km (Tesla: Model 3-Standard RWD) to 183 Wh/km (Audi: Q4 E-Tron–45).
Regarding the warranty period, all analyzed samples have 8 years, except the Kia Niro EV and the Kia e-Niro 39, which have 7 years. The warranty mileage varies between 120,000 km for Dacia Spring editions and 192,000 km for Tesla Model Y and Model 3 Premium and Long-Range editions.

2.2. Considered Scenarios for Degradation Estimation

The 37 identified samples were subjected to degradation in three different scenarios based on operational temperature, as presented in Table 3. These scenarios were selected based on the results obtained in a previous study performed by the authors [19], which demonstrates that temperature represents the dominant stress factor, while SoC has a differential influence on the degradation of battery chemistries. At 0 °C, both chemistries retain 100% of their capacity regardless of the SoC level; at 25 °C, the batteries remain viable for second-life applications; and at 45 °C, the chemistries have a different degradation behavior under the same operating conditions.
For the first scenario, a cold climate is considered, with a temperature of 0 °C, or 273.15 K. Low temperatures affect the battery performance, accelerating capacity fade. The second scenario reflects the nominal operating conditions, with a temperature of 25 °C (298.15 K), and represents the predicted degradation behavior. The hot scenario corresponds to warm and arid climates. The temperature is assumed to be 45 °C, or 318.15 K, contributing to accelerating degradation of the battery and significant capacity loss.
In each scenario, three distance ranges are analyzed, with different SoC and DoD values. Short-range routes reflect typical urban and suburban driving patterns, characterized by a SoC of 70% and a DoD of 30%. Medium-range routes represent a mixed driving profile, covering both urban and interurban usage, with an assumed SoC and DoD of 50%. Finally, the long-range route corresponds to extended trips, deeper discharge cycles, and requiring fast-charging sessions. In this case, a SoC of 20% is considered, with a DoD of 80% [20].

3. Calendar and Cycle Aging Models for SoH Estimation

An accurate estimation of a battery’s SoH must account for both aging mechanisms—calendar and cycle degradation. Their combined effects imply accelerated capacity fade and a progressive increase in internal resistance of the battery, shortening the remaining capacity at EoL [21].

3.1. Calendar Aging Model

Calendar aging indicates the gradual degradation of a battery’s SoH due to the passage of time, independently of its operational usage. It depends on the SoC, the T [K] of storing, and warranty period (t [days]) [22]. The main causes are parasitic reactions between the electrode and electrolyte [23], with the degradation rate depending on the chemistry of the battery. Thus, the calendar capacity loss ( Q l o s s c a l [%]) is determined considering different values for α1, α2, α3, and α4 coefficients for LFP and NMC batteries, as presented in Table 4.
The capacity loss due to calendar degradation is determined via Equation (1) [24,25]:
Q l o s s c a l = α 1 · exp α 2 · S o C · e x p α 3 T · t α 4 .
The remaining capacity (Ccal [%]), expressed as a percentage, can be calculated with (2), as follows [26]:
C c a l = 100 Q l o s s c a l .
Finally, the available capacity for second-life applications (RC [kWh]) is determined considering the real usable capacity of the battery (Cnom [kWh]) and the remaining capacity after calendar aging loss:
R C = C n o m · C c a l 100 .

3.2. Cycle Aging Model

Cycle aging indicates the degradation of a battery’s SoH from repeated charging and discharging operations and is influenced by the Cnom, DoD, T, and number of cycles performed (Ncycles [no]) [22]. Mainly, capacity fade due to cycling leads to lithium inventory and active material loss and increased battery impedance [27]. Therefore, cycle capacity loss ( Q l o s s c y c [%]) depends on battery chemistry, with α and β coefficients specific to LFP and NMC. The Q l o s s c y c is expressed in (4) [24]:
Q l o s s c y c = 1 α · exp N c y c l e s · β · f d 1 α · e x p ( N c y c l e s · f d ) ,
where the degradation rate function fd, which depends on the SoC, T, and DoD stress factors (SSoC, ST, SDoD), is given by [24]:
f D = S S o C · S T · S D o D i ,   i   ϵ   { L F P ,   N M C } .
The SoC stress model quantifies the degree of electrochemical stress imposed on the battery at a given SoC level. It is determined considering a fixed parameter kSoC and the reference SoC level, SoCref, by the following expression [24]:
S S o C = e x p · ( k S o C · S o C S o C r e f ) .
The T stress model describes the influences of ambient and operating temperature on battery degradation, quantifying the thermal stress imposed on the electrochemical system. It is grounded in the Arrhenius equation, depending on a fixed parameter kT and the reference T value, Tref, formulated as [24]:
S T = e x p ( k T · ( T T r e f ) · T r e f T ) .
The DoD stress model shows the degree of mechanical and electrochemical stress due to discharge behavior during each cycle. The capacity fade of LFP and NMC chemistries are reflected by different DoD stress models, considering the parameters k1, k2, and k3, determined by (8) and (9) [24]:
S D o D L F P = k 1 · D o D · e x p ( k 2 · D o D ) ;
S D o D N M C = ( k 1 · D o D k 2 + k 3 ) 1 .
The specific and shared cycle degradation parameters of LFP and NMC batteries are reported in Table 5.
The number of cycles performed by the battery, Ncycles, can be determined considering the equivalent full cycle (EFC) and the DoD, formulated as [28]:
N c y c l e s = E F C D o D .
The EFC represents the total accumulated cycles by a battery, defined as complete charge–discharge cycles from 0% to 100% DoD and obtained as a ratio between the battery’s throughput energy (Wbatt [kWh]) and Cnom, as expressed in Equation (11) [29]:
E F C = W b a t t C n o m .
The cumulative Wbatt can be determined based on the total distance traveled over the battery’s operational time, known as battery mileage (Battmi [km]), and the specific energy consumption per unit distance, e [Wh/km] [30]:
W b a t t = B a t t m i · e .
In order to estimate the daily capacity loss caused by both aging mechanisms, the average cycle degradation of the battery in each day ( Q l o s s _ d a y c y c [%]) is given by:
Q l o s s _ d a y c y c = 1 α · exp c y c d a y · β · f d 1 α · e x p ( c y c d a y · f d ) ,
where cycday is the daily cycling degradation, determined as follows:
c y c d a y = N c y c l e s t .

3.3. SoH and Remaining Capacity at EoL

The SoH indicates the degree of degradation experienced by a battery over its operational lifetime due to combined calendar and cycle aging, and describes the remaining capacity at EoL [31]. The metric SoH is equal to 1 for a new battery, when there is not yet any capacity fade, and 0 for a completely degraded battery, as formulated [32]:
S o H = 1 Q l o s s _ t o t ,
where Qloss_tot is the total capacity loss, due to both calendar and cycle aging, given by [26]:
Q l o s s _ t o t = Q l o s s c a l + Q l o s s _ d a y c y c .
Finally, the remaining capacity of the battery, in kWh, available for second-life applications can be determined with Equation (17):
R C E o L = S o H · C n o m .
Under the severe high-temperature scenario, the adopted empirical formulation may predict that the SoH of some battery chemistries reaches zero before the end of the considered simulation period. Within the scope of this study, such results indicate complete loss of usable battery capacity under the adopted modeling assumptions and should be interpreted as scenario-based degradation estimates rather than experimentally validated degradation trajectories for individual BEV model editions.

3.4. Model Assumptions

The proposed degradation assessment is based on a chemistry-level modeling approach. Therefore, the LFP and NMC batteries considered in this study are evaluated using the corresponding calendar and cycle aging parameters reported in Table 4 and Table 5. The model distinguishes between LFP and NMC chemistries, while vehicle-specific differences related to cell manufacturer, detailed cell design, battery management system strategy, cooling architecture, charging protocol, and pack-level thermal control are not explicitly modeled.
Furthermore, Equation (16) combines the separately estimated calendar and cycle capacity losses within an additive empirical formulation. Cumulative interactions between these aging mechanisms, parameter uncertainty, pack-level heterogeneity, and thermal-management energy consumption are not explicitly represented in the present model. These aspects require a more detailed coupled vehicle- and pack-level modeling framework and are therefore considered limitations of the present chemistry-level comparative assessment.
The purpose of this assumption is to provide a consistent comparative framework for estimating the SoH and remaining capacity across the 37 commercially available BEV model editions considered in the study. Accordingly, the results should be interpreted as scenario-based degradation estimates under common chemistry-specific aging parameters, rather than as experimentally validated degradation trajectories for each individual vehicle model. This modeling choice enables a broad market-level comparison of second-life capacity potential across different BEV models, while keeping the analysis reproducible and comparable across all samples. However, the actual degradation behavior of a specific vehicle may differ depending on operating history, charging behavior, thermal management performance, cell supplier, and environmental conditions [33].

4. SoH, Remaining Capacity of BEV Batteries, and Discussion

This section presents the findings obtained for the SoH and available capacity at EoL of the batteries analyzed across all three scenarios. Python 3.13 was used to visualize the obtained findings, employing pandas library for data extraction and matplotlib for generating the plots. The results show the SoH evolution curves obtained for each temperature scenario and distance route for all 37 studied samples.
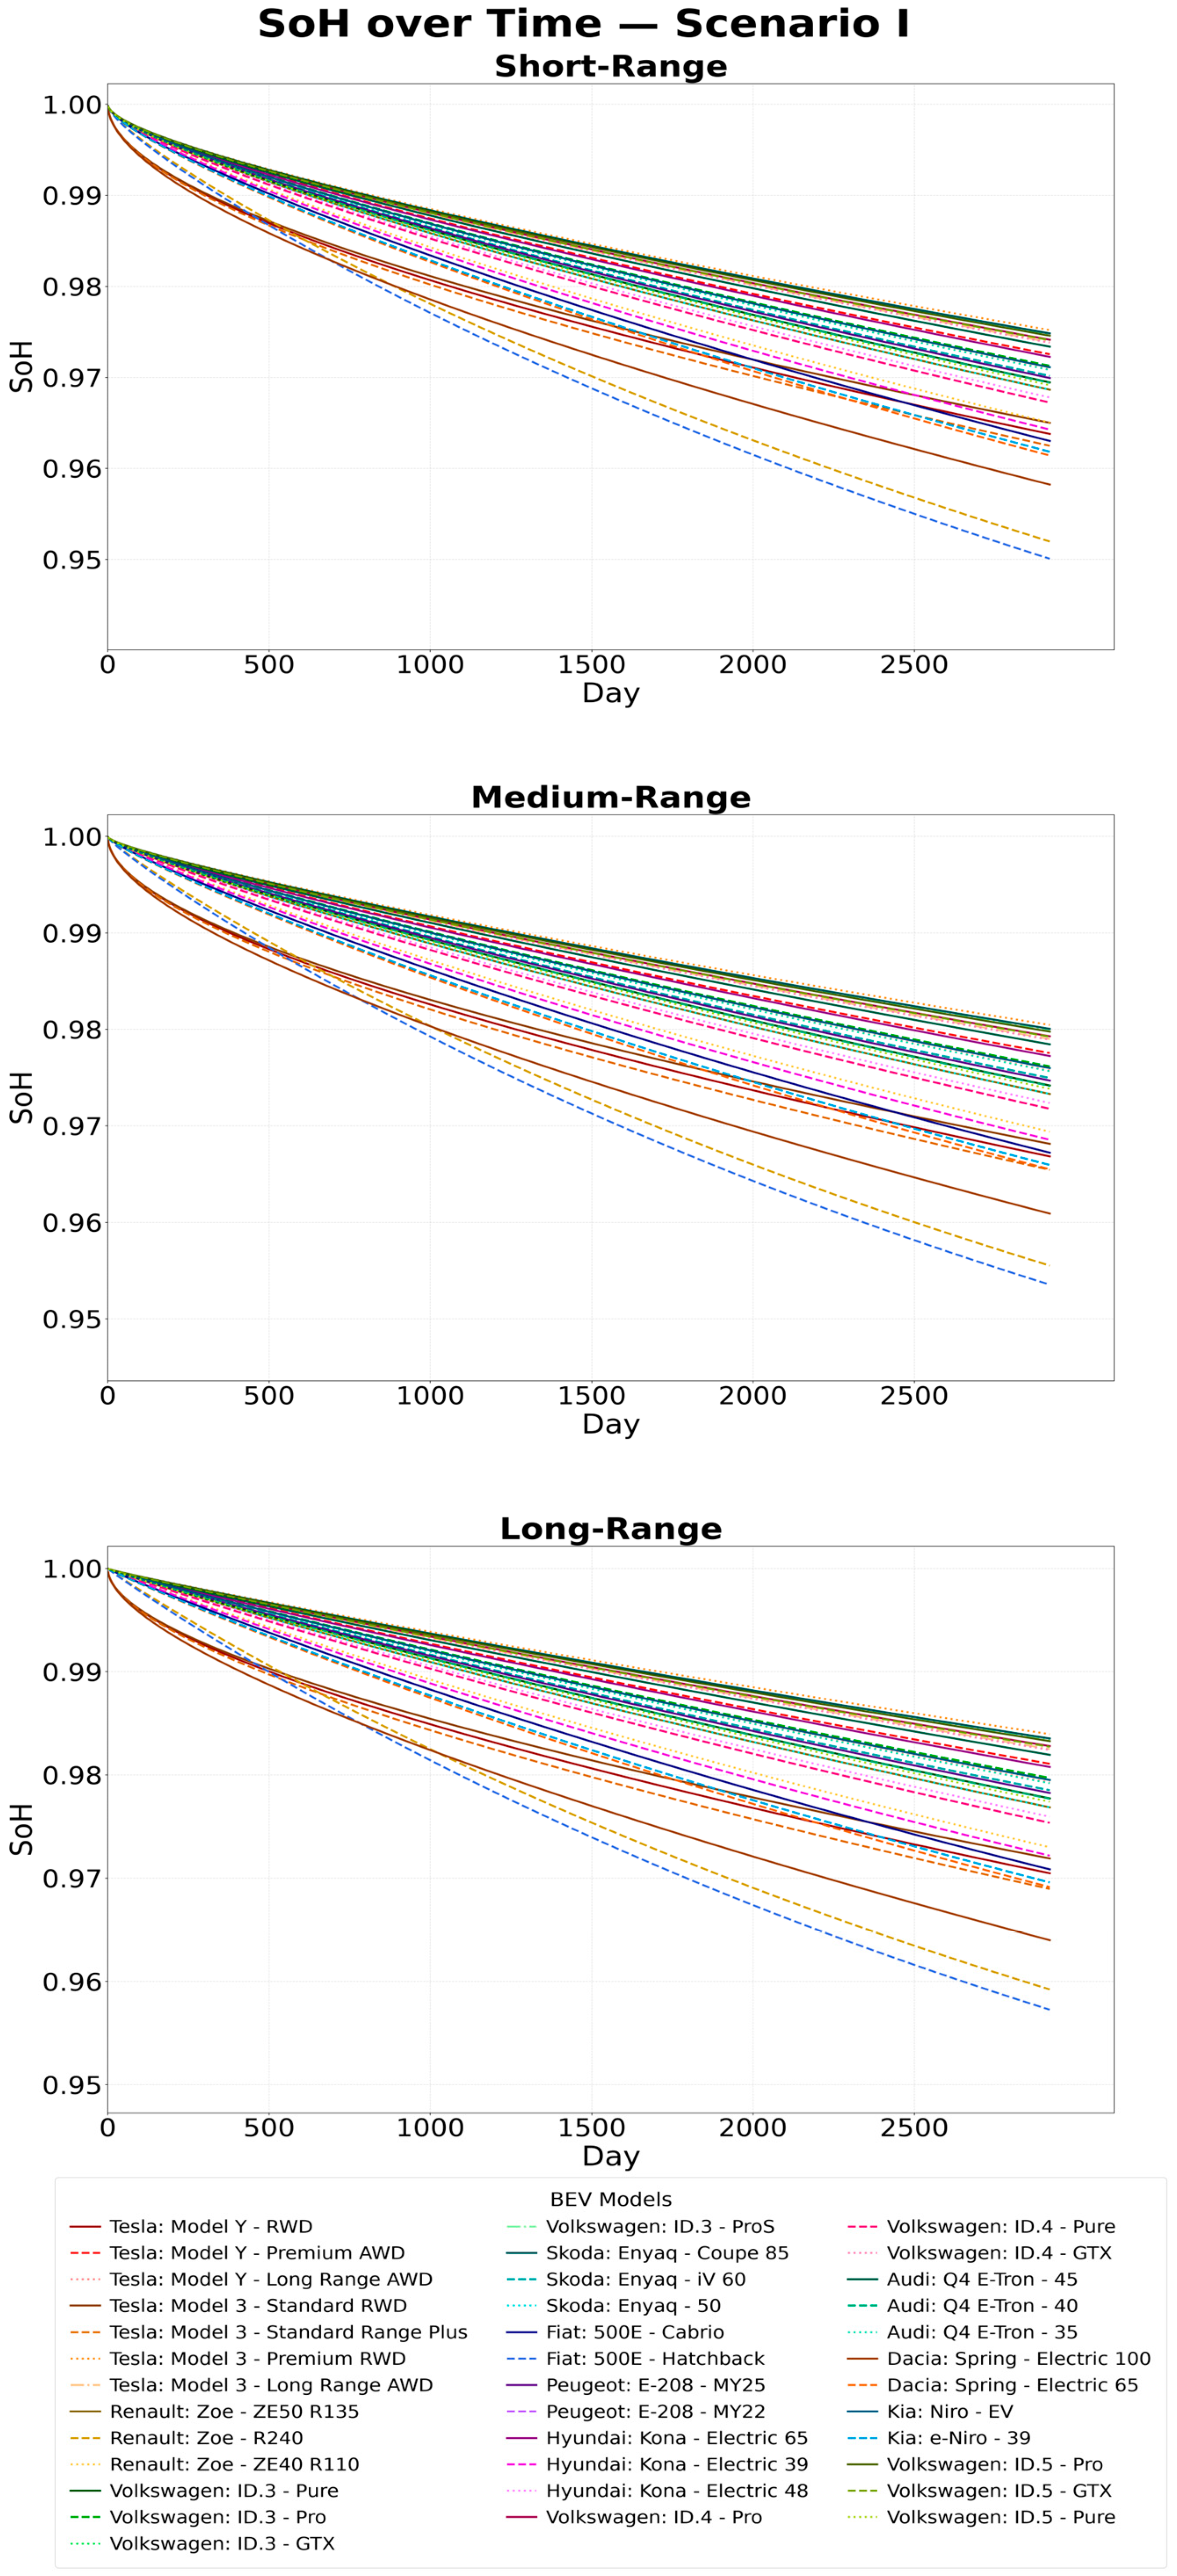
In the first scenario, when T is 273.15 K, the influence of daily driving distance is clearly illustrated in Figure 6. As can be observed, under cold conditions the capacity fading of the batteries is reduced, with the lowest SoH values reported under the short-distance route, defined by a SoC of 70% and a DoD of 30%. These results reflect the findings from the literature, implying that batteries’ SoH is strongly dependent on SoC, with higher values accelerating the degradation [2,6,34]. The BEV models affected more by aging in all routes were the Fiat 500E–Hatchback, Renault Zoe–R240, and the Dacia Spring–Electric 100 due to low real usable capacities of 21.3, 23.3, and 24 kWh, suggesting that SoH is influenced by capacity as well.
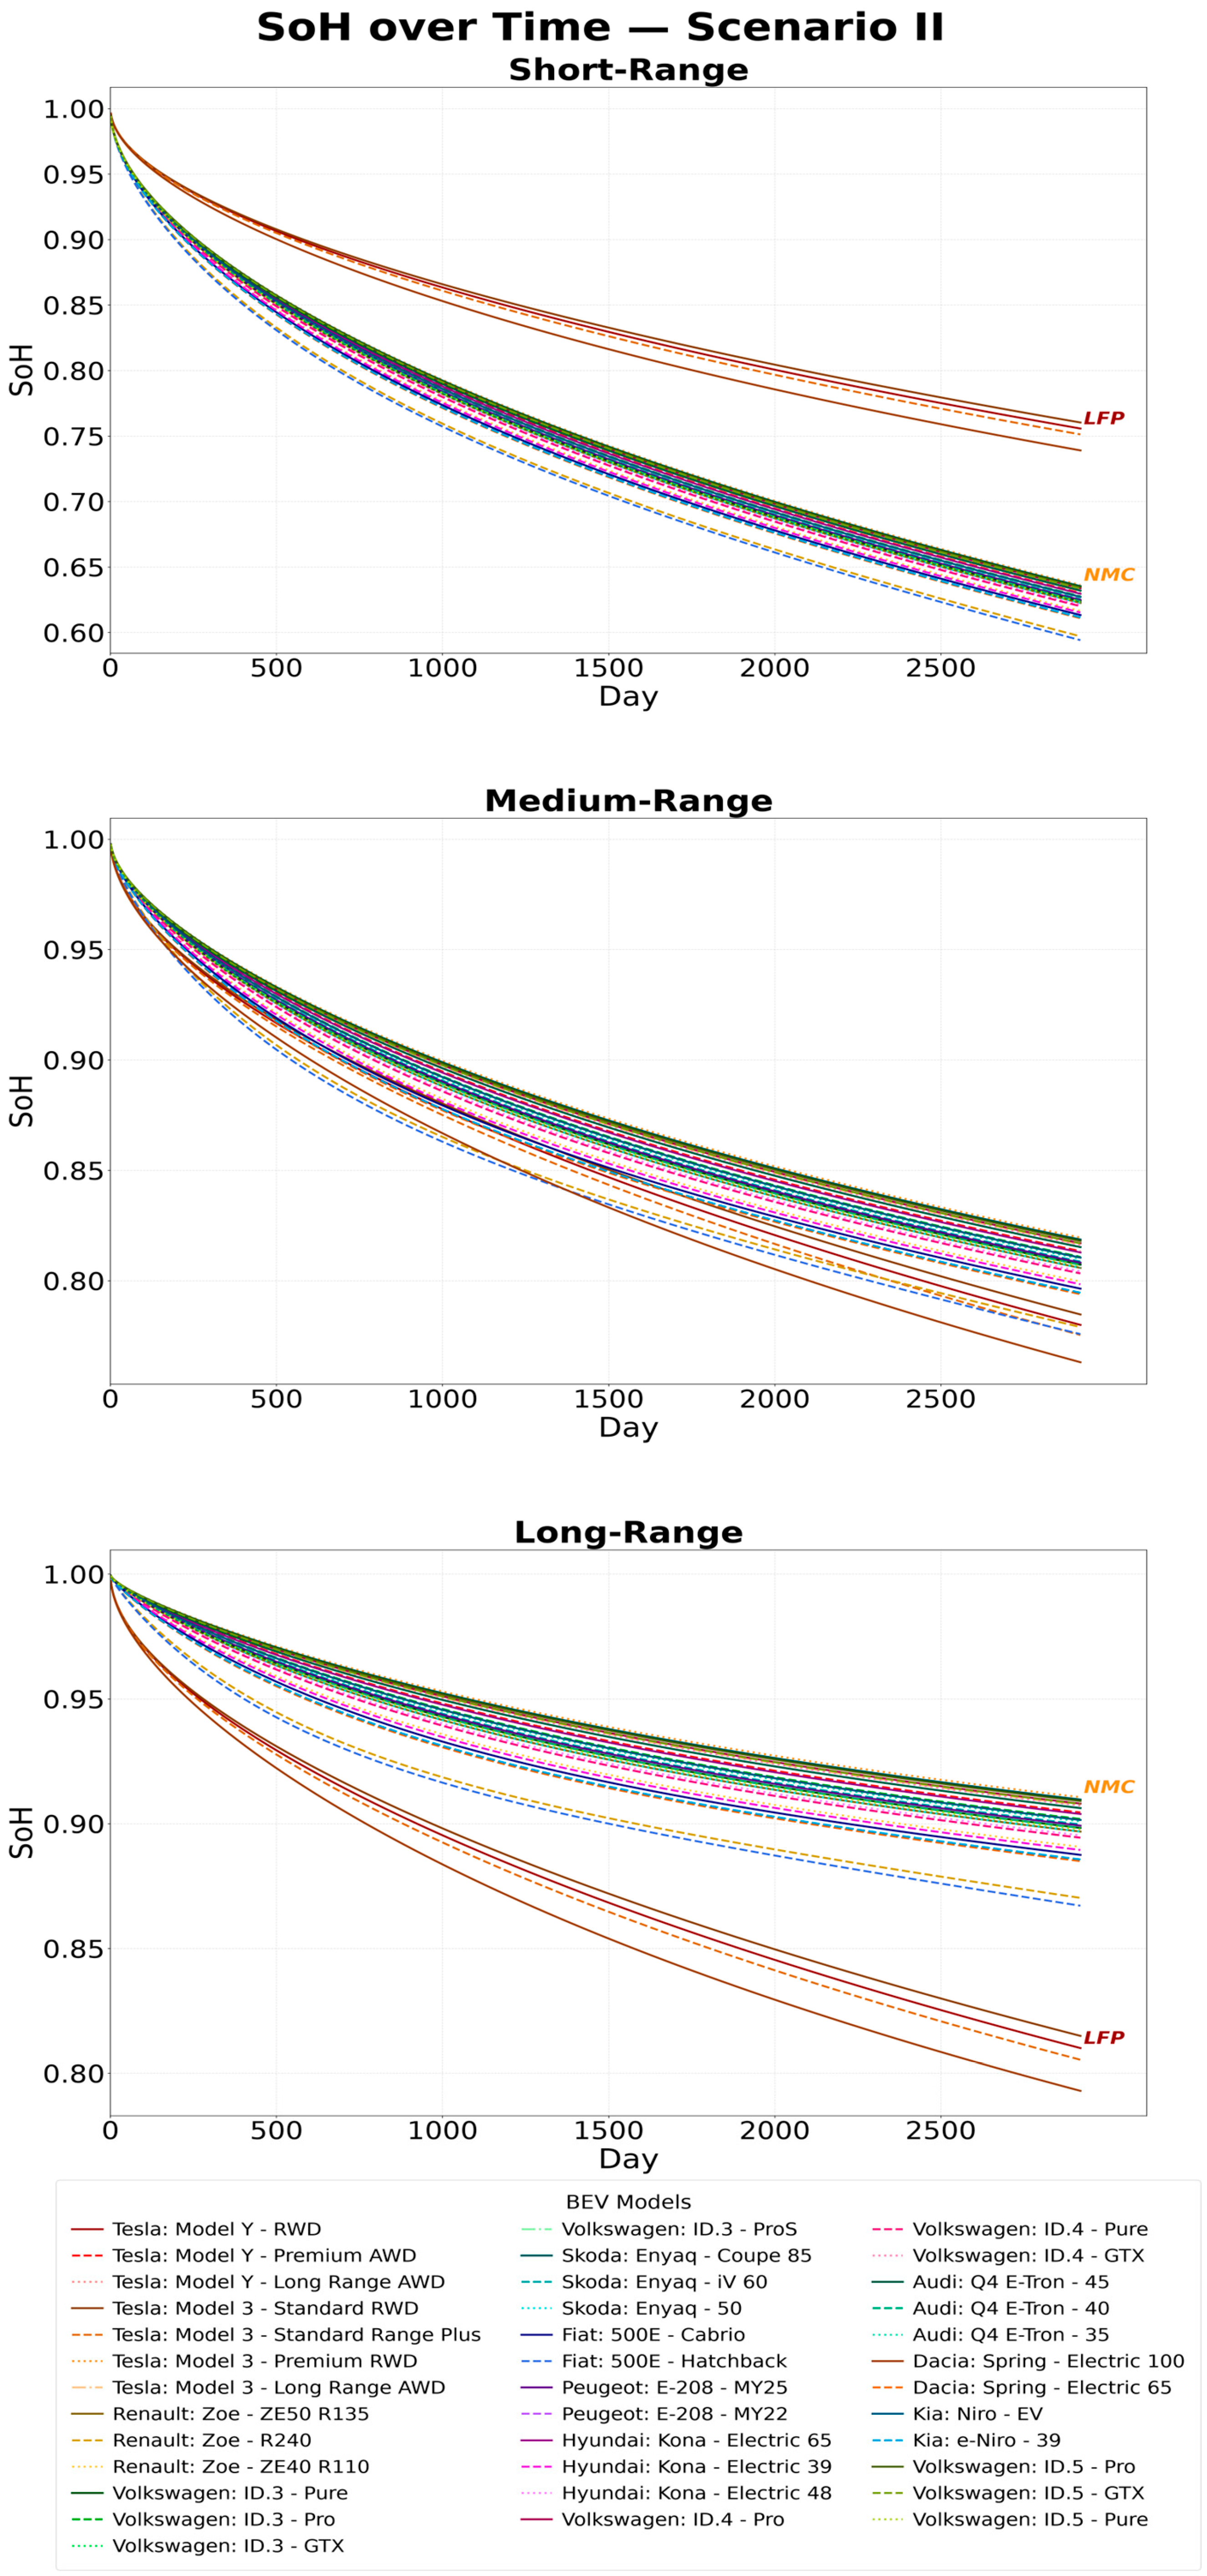
The second scenario is characterized by a T of 298.15 K, considered to be a baseline ambient. The results presented in Figure 7 clearly state the deep connection between SoH and SoC. At elevated SoC levels, in short-range routes, NMC batteries are subjected to considerable degradation, with SoH being below 0.65. From an electrochemical point of view, this is due to cathode instability and microcrack formation, the most common mechanical degradation modes in Ni-rich cathodes when they are nearly fully charged [35]. The LFP batteries were not that affected, with the Tesla Model 3–Standard RWD, the Tesla Model Y–RWD, the Tesla Model 3–Standard Range Plus, and the Dacia Spring–Electric 100 having the highest SoH values, above 0.7. As the SoC declines, the SoH of NMC batteries improves. In long-range routes, with a SoC of 20%, the NMC batteries registered the highest SoH values, above 0.85, even the models with the lowest actual capacity (Fiat 500E–Hatchback and Renault Zoe–R240).
There are also fleet-based degradation studies [36] that use real-world telematics data on over 22,700 electric vehicles, covering 21 different vehicle models, which show that vehicles that habitually spend a lot of time at high SoC levels experience a significant acceleration in battery degradation. The results also show an average annual degradation between 1.8 and 2.3%, depending on the year of recording, which would result in a SoH at the end of the simulated timeframe of 0.81–0.85, which is in good accordance with the results from the second, baseline scenario.
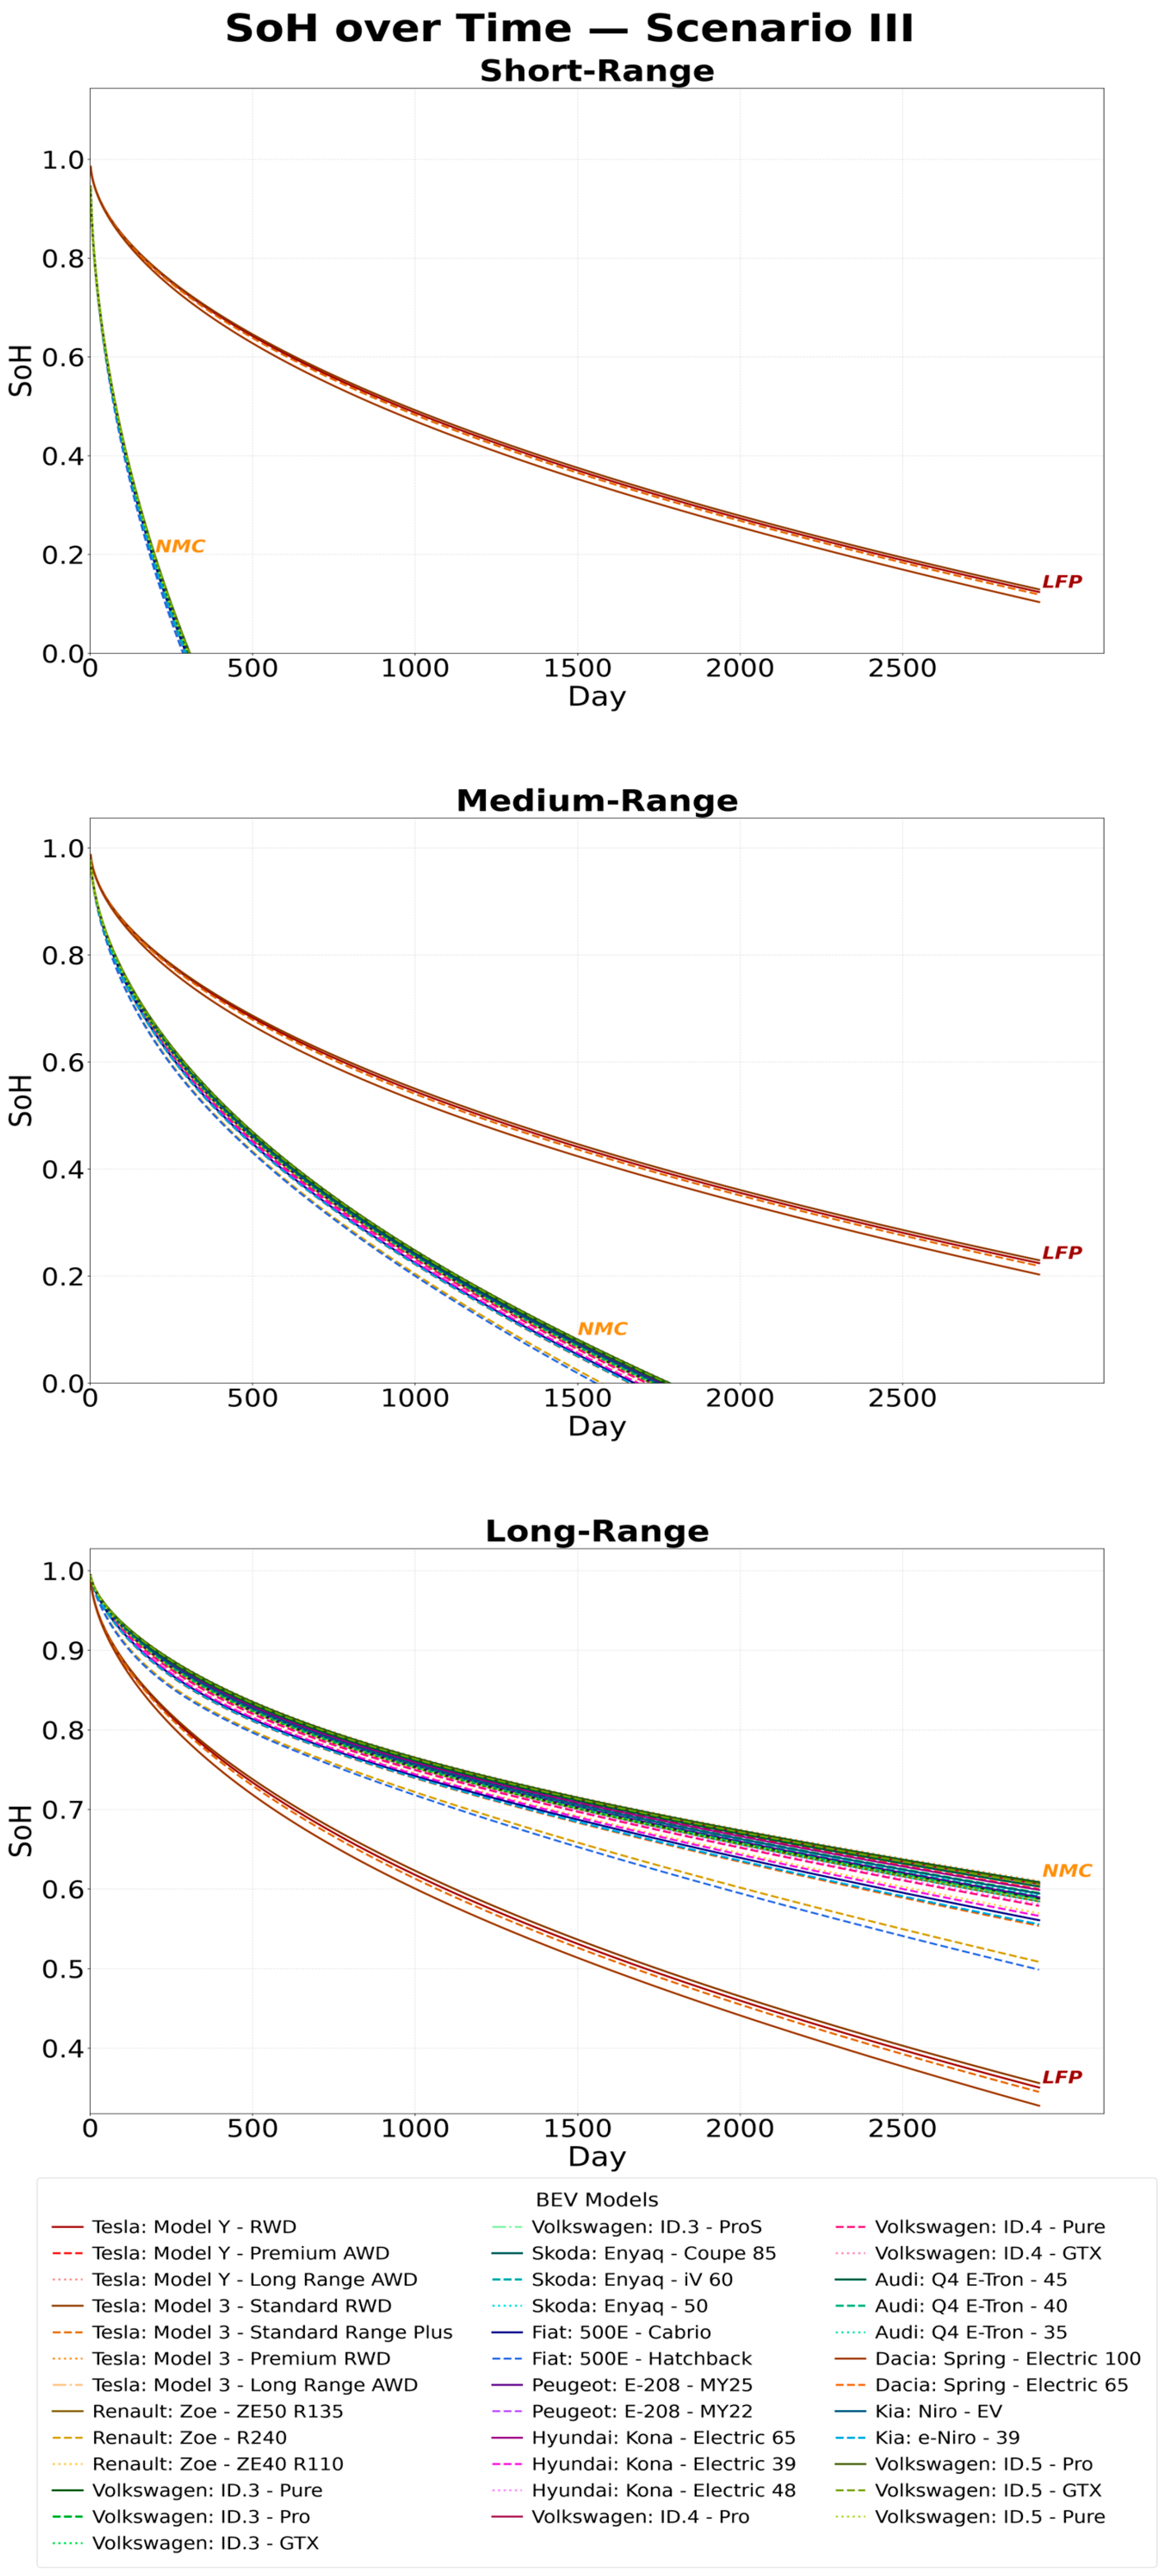
SoH is highly affected by increased temperature in NMC chemistry, as presented in Figure 8. As T rises to 318.15 K, in the third scenario, the NMC batteries’ SoH reaches 0 before the EoL in both short-range and medium-range routes, characterized by a high SoC. In contrast, the LFP batteries exhibit a superior high-temperature stability, with SoH values around 0.2 even at higher SoC rates. These results are consistent with ones from the literature stating the thermal stability of LFP batteries, which is attributed to their intrinsically stable olivine structure, which reduces degradation under thermal stress [37]. When SoC decreases, specific to long-range routes, NMC batteries’ SoH values remain above 0.5, while LFP values fall below 0.4.
The characteristic differences between the two chemistries are systematically analyzed in the literature by comparative experiments [2,38], which highlight the superior thermal stability of LFP batteries, associated with lower heat generation and more efficient heat dissipation under temperature fluctuations, whereas NMC batteries are more susceptible to thermal runaway, structural degradation, and safety-related challenges at elevated temperatures.
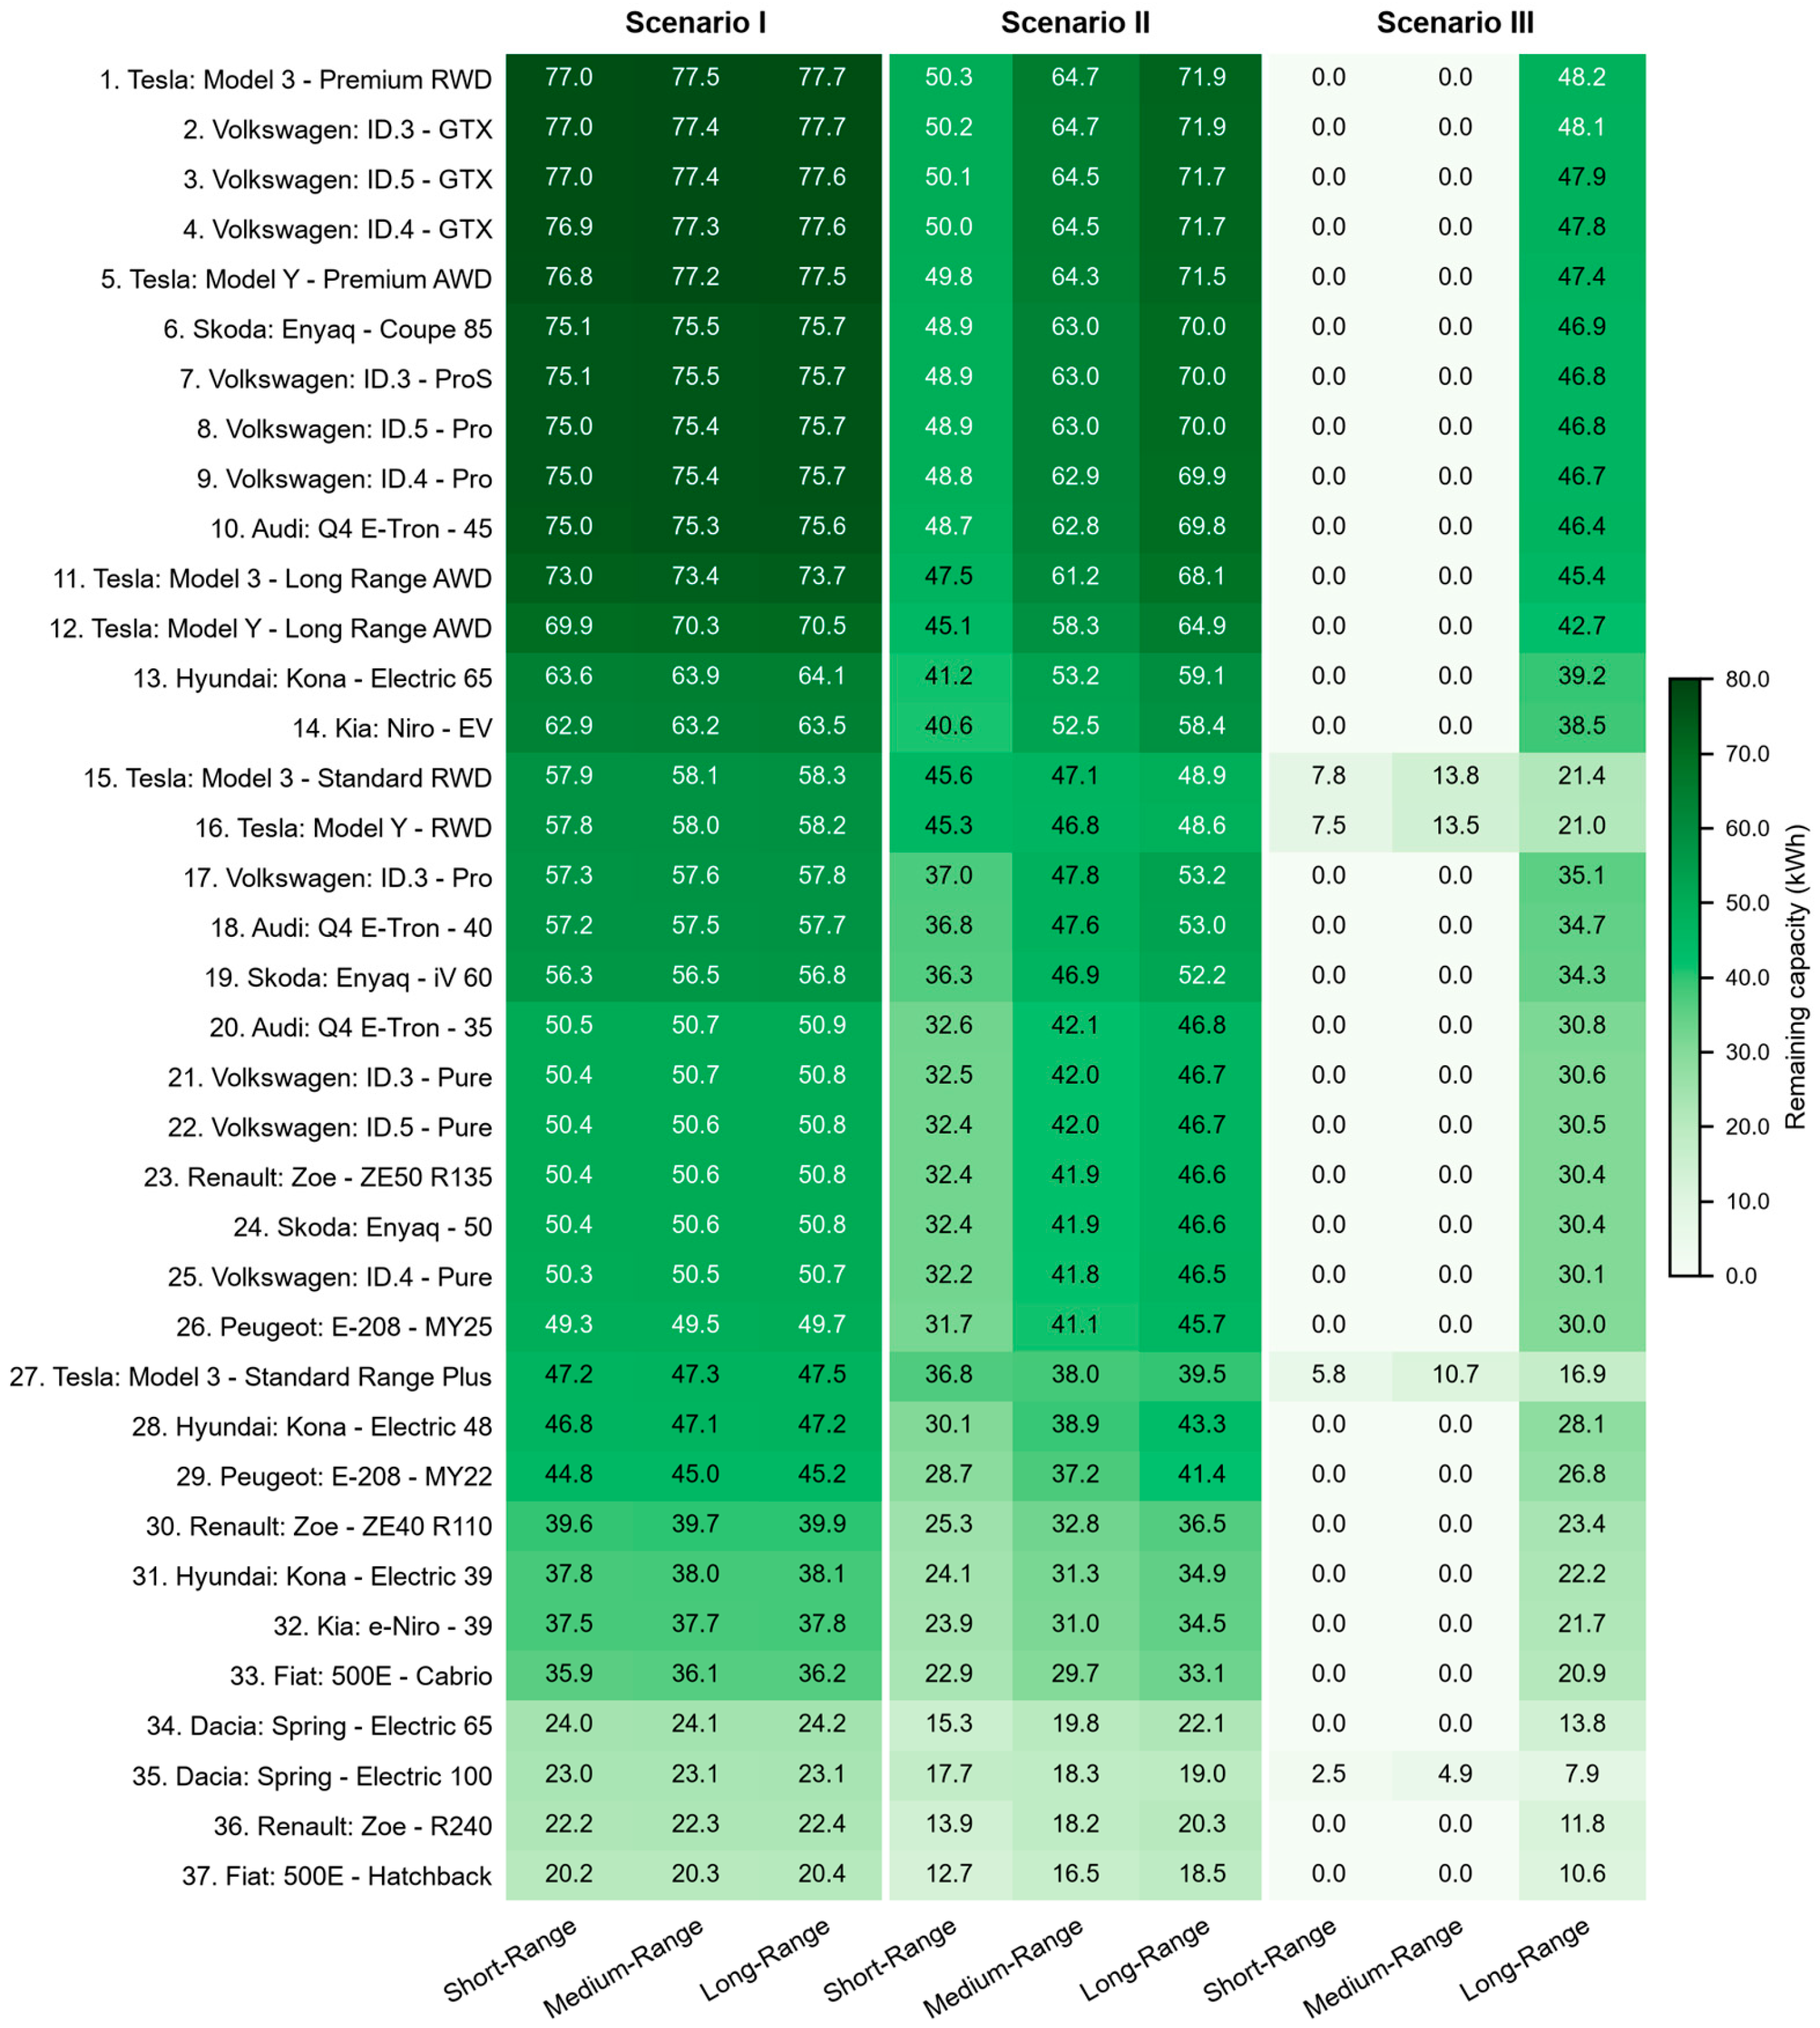
The available capacity at EoL for second-life applications for each studied BEV model is presented in Figure 9. The remaining capacity is dependent on both the SoH and real usable capacity. In the first scenario, the samples studied record elevated values, between 77 and 20 kWh. The top five BEV models are the Tesla Model 3–Premium RWD, the Volkswagen ID.3, ID.4, and ID5–GTX, and the Tesla Model Y–Premium AWD, with a remaining capacity of approximately 77 kWh. At the lower end of the ranking are positioned the Dacia Spring–Electric 65 and 100, the Renault Zoe–R240, and the Fiat 500E–Hatchback, with values between 20 and 24 kWh. Thus, the BEV models with the highest usable capacity tend to maintain a larger available capacity, despite exhibiting a similar degradation.
In the second scenario, when T rises, the available capacity fades for all BEV models. The remaining capacity of the top five BEV models is around 50 kWh for the short-range distance profile, almost 65 kWh for the medium-range one, and above 70 kWh for long-range routes. The lower end of the BEVs’ remaining capacity is between 12 and 15 kWh, 16–20 kWh, and 18–22 kWh for the same cases.
In the third scenario, when T reaches its highest value, the remaining capacity is above 0 only for the BEV models that are equipped with LFP batteries, considering short- and medium-range routes. These BEV models are the Tesla Model 3–Standard RWD, the Tesla Model Y–RWD, the Tesla Model 3–Standard Range Plus, and the Dacia Spring–Electric 100, with available capacities between 3 and 14 kWh. In long-range routes, the ranking is similar to the other two scenarios, with a remaining capacity between 10 kWh for the tail-end models and 48 kWh for the ones near the top.
These findings highlight the importance of real usable capacity, battery chemistry, and both calendar and cycle aging conditions in determining the second-life suitability of retired BEV models. The stress factors considered in both aging mechanisms exhibit a strong influence on the battery’s remaining capacity, influencing their repurpose in second-life applications. Moreover, there are other factors that should be considered in second-life suitability, such as internal resistance, which limits power capability and increases heat generation under load, and the economic feasibility of reuse, which depends on the costs of testing, disassembly, and re-certification relative to the remaining service life.

5. Conclusions

This study presents an extensive analysis of LFP and NMC batteries across 37 commercially available BEVs in the European Union. The main objective was to estimate the SoH and the available capacity for second-life applications of the retired batteries from analyzed BEV models. Three scenarios were considered based on operational temperatures of 273.15 K, 298.15 K, and 318.15 K. In each scenario, three driving profiles were taken into account, each with different values for the SoC and DoD: a short-range distance, with 70% SoC and 30% DoD; medium-range routes, with 50% SoC and DoD; and a long-range distance, defined by 20% SoC and 80% DoD. The 37 samples analyzed were subjected to both calendar and aging mechanisms, governed by SoC, temperature, and DoD stressors.
The results revealed that BEV batteries present an accelerated degradation at high temperatures and SoC values, particularly NMC chemistry, which is strongly dependent on these parameter variations. LFP batteries exhibit improved thermal stability, but an accelerated capacity fade at high SoC. Moreover, the findings show that the BEV models equipped with the highest usable battery capacities tend to present larger available capacity at EoL than smaller packs, despite being subjected to equivalent fade rates. At the top of the obtained ranking is the Tesla Model 3–Premium RWD, the Volkswagen ID.3, ID.4, and ID5–GTX, and the Tesla Model Y–Premium AWD with a consistent remaining capacity across the considered scenarios, with values around 77 kWh for the first scenario, 50–72 kWh for the second one, and 0–48 for the last one, where the combination of a high temperature and SoC accelerates the degradation.
Overall, this work provides a degradation benchmark based on BEV market data that can support vehicle manufacturers in their decision to repurpose or recycle retired BEV batteries. The uncertainty of remaining capacity prediction is reduced by integrating the validated electrothermal aging models with real-world duty-cycle data, improving the reliability of BEV battery repurposing decisions. The results presented in this work should be interpreted within the scope of the adopted empirical degradation modeling framework. The analysis is based on chemistry-specific calendar and cycle aging models and provides comparative estimates of SoH and remaining capacity under the operating scenarios considered. Ultimately, the predicted degradation trends may differ from the aging behavior of individual vehicles operating under different real-world driving patterns, charging strategies, thermal management systems, and environmental conditions. Experimental validation using measured degradation data from commercially operated BEVs will further strengthen the applicability of the proposed framework and represent an important direction for future research.

Author Contributions

Conceptualization, M.C. and T.I.C.B.; methodology, M.C.; validation, M.C., K.B. and T.I.C.B.; formal analysis, M.C. and C.C.; investigation, M.C., K.B. and C.C.; resources, M.C., K.B. and R.-A.T.; data curation, M.C. and T.I.C.B.; writing—original draft preparation, M.C., K.B., T.I.C.B. and C.C.; writing—review and editing, M.C., K.B., T.I.C.B., C.C. and R.-A.T.; visualization, M.C., K.B. and C.C.; supervision, K.B. and R.-A.T.; project administration, M.C. All authors have read and agreed to the published version of the manuscript.

Funding

This research received no external funding.

Institutional Review Board Statement

Not applicable.

Informed Consent Statement

Not applicable.

Data Availability Statement

The original contributions presented in this study are included in the article. Further inquiries can be directed to the corresponding author.

Acknowledgments

This research was supported by the Academy of Romanian Scientists, grant number: 413/15.03.2025—Modeling and optimal sizing of solar energy storage systems through the sustainable integration of electric vehicle batteries using artificial intelligence techniques.

Conflicts of Interest

The authors declare no conflicts of interest.

References

  1. Kulpa, J.; Olczak, P.; Stecuła, K.; Sołtysik, M. The Impact of RES Development in Poland on the Change of the Energy Generation Profile and Reduction of CO2 Emissions. Appl. Sci. 2022, 12, 11064. [Google Scholar] [CrossRef]
  2. Yarimca, G.; Cetkin, E. Review of Cell Level Battery (Calendar and Cycling) Aging Models: Electric Vehicles. Batteries 2024, 10, 374. [Google Scholar] [CrossRef]
  3. IEA. Global EV Outlook 2025; International Energy Agency: Paris, France, 2025. [Google Scholar]
  4. European Environment Agency. New Registrations of Electric Cars in Europe. Available online: https://www.eea.europa.eu/en/analysis/indicators/new-registrations-of-electric-vehicles (accessed on 21 June 2026).
  5. European Union. Regulation (EU) 2023/1542 of the European Parliament and of the Council of 12 July 2023 Concerning Batteries and Waste Batteries, Amending Directive 2008/98/EC and Regulation (EU) 2019/1020 and Repealing Directive 2006/66/EC; European Union: Brussels, Belgium, 2023; Volume 191. [Google Scholar]
  6. Yang, Z.; Li, X.; Li, J.; Li, H.; Shi, J.; Fan, X.; Cong, Z.; Feng, X.; Yang, X.-G. Study on Influencing Factors of Calendar Aging and Cycle Aging of LFP Batteries. Appl. Sci. 2025, 15, 12749. [Google Scholar] [CrossRef]
  7. Zabihi, A.; Siano, P.; Basaran, K.; Lazaroiu, G.C. Second-Life Batteries as Enablers of Sustainable Electric Vehicle Infrastructure: Opportunities and Future Directions. IEEE Access 2026, 14, 45626–45647. [Google Scholar] [CrossRef]
  8. Hu, X.; Deng, X.; Wang, F.; Deng, Z.; Lin, X.; Teodorescu, R.; Pecht, M.G. A Review of Second-Life Lithium-Ion Batteries for Stationary Energy Storage Applications. Proc. IEEE 2022, 110, 735–753. [Google Scholar] [CrossRef]
  9. Li, D.; Hu, Q.; Jiang, W.; Dong, H.; Song, Z. Integrated Power and Thermal Management for Enhancing Energy Efficiency and Battery Life in Connected and Automated Electric Vehicles. Appl. Energy 2025, 396, 126213. [Google Scholar] [CrossRef]
  10. Wang, Y.; Zhou, Z.; Botterud, A.; Zhang, K.; Ding, Q. Stochastic Coordinated Operation of Wind and Battery Energy Storage System Considering Battery Degradation. J. Mod. Power Syst. Clean Energy 2016, 4, 581–592. [Google Scholar] [CrossRef]
  11. Etxandi-Santolaya, M.; Canals Casals, L.; Corchero, C. Extending the Electric Vehicle Battery First Life: Performance beyond the Current End of Life Threshold. Heliyon 2024, 10, e26066. [Google Scholar] [CrossRef] [PubMed]
  12. Bilfinger, P.; Rosner, P.; Schreiber, M.; Kröger, T.; Gamra, K.A.; Ank, M.; Wassiliadis, N.; Dietermann, B.; Lienkamp, M. Battery Pack Diagnostics for Electric Vehicles: Transfer of Differential Voltage and Incremental Capacity Analysis from Cell to Vehicle Level. eTransportation 2024, 22, 100356. [Google Scholar] [CrossRef]
  13. Von Bülow, F.; Wassermann, M.; Meisen, T. State of Health Forecasting of Lithium-Ion Batteries Operated in a Battery Electric Vehicle Fleet. J. Energy Storage 2023, 72, 108271. [Google Scholar] [CrossRef]
  14. Vignesh, S.; Che, H.S.; Selvaraj, J.; Tey, K.S. State of Health Indicators for Second Life Battery through Non-Destructive Test Approaches from Repurposer Perspective. J. Energy Storage 2024, 89, 111656. [Google Scholar] [CrossRef]
  15. Sevdari, K.; Marinelli, M.; Pastorelli, F. Overview of EV Battery Types and Degradation Measurement for Renault Zoe NMC Batteries. In Proceedings of the 2024 International Conference on Renewable Energies and Smart Technologies (REST), Prishtina, Kosovo (UNMIK), 27–28 June 2024; IEEE: New York, NY, USA, 2024; pp. 1–5. [Google Scholar]
  16. Rosenberger, N.; Rosner, P.; Bilfinger, P.; Schöberl, J.; Teichert, O.; Schneider, J.; Abo Gamra, K.; Allgäuer, C.; Dietermann, B.; Schreiber, M.; et al. Quantifying the State of the Art of Electric Powertrains in Battery Electric Vehicles: Comprehensive Analysis of the Tesla Model 3 on the Vehicle Level. World Electr. Veh. J. 2024, 15, 268. [Google Scholar] [CrossRef]
  17. Electric Vehicle Registrations in Europe: 15 Countries, Majority of BEV Market. Available online: https://eu-evs.com/ (accessed on 22 November 2025).
  18. EV Database. Available online: https://ev-database.org/ (accessed on 28 November 2025).
  19. Cristea, M.; Cristea, C.; Niste, D.-F.; Tîrnovan, R.-A. The Influence of Temperature and State-of-Charge on Calendar Aging in LFP and NMC EV Batteries. In Proceedings of the 2026 Advanced Topics on Measurement and Simulation (ATOMS), Cluj-Napoca, Romania, 13–15 May 2026; IEEE: New York, NY, USA, 2026; pp. 1–4. [Google Scholar]
  20. Nogueira, T.; Magano, J.; Sousa, E.; Alves, G.R. The Impacts of Battery Electric Vehicles on the Power Grid: A Monte Carlo Method Approach. Energies 2021, 14, 8102. [Google Scholar] [CrossRef]
  21. Roy, A.; Movahedi, H.; Siegel, J.B.; Stefanopoulou, A.G. Empirical Modeling of Degradation in Lithium-Ion Batteries and Validation in Complex Scenarios. IFAC-Pap. 2023, 56, 457–462. [Google Scholar] [CrossRef]
  22. Saldaña, G.; Martín, J.I.S.; Zamora, I.; Asensio, F.J.; Oñederra, O.; González-Pérez, M. Empirical Calendar Ageing Model for Electric Vehicles and Energy Storage Systems Batteries. J. Energy Storage 2022, 55, 105676. [Google Scholar] [CrossRef]
  23. Krupp, A.; Beckmann, R.; Diekmann, T.; Ferg, E.; Schuldt, F.; Agert, C. Calendar Aging Model for Lithium-Ion Batteries Considering the Influence of Cell Characterization. J. Energy Storage 2022, 45, 103506. [Google Scholar] [CrossRef]
  24. Liu, C.; Xu, Z.; Zhou, J.; Yuan, Y.; Ma, K.; Yuan, M. Deep Reinforcement Learning-Based Energy Scheduling for Green Buildings with Stationary and EV Batteries of Heterogeneous Characteristics. Appl. Energy 2026, 409, 127463. [Google Scholar] [CrossRef]
  25. Nájera, J.; Arribas, J.R.; De Castro, R.M.; Núñez, C.S. Semi-Empirical Ageing Model for LFP and NMC Li-Ion Battery Chemistries. J. Energy Storage 2023, 72, 108016. [Google Scholar] [CrossRef]
  26. Frambach, T.; Liedtke, R.; Figgemeier, E. Battery Sizing of 48 V Plug-in Hybrids Considering Calendar and Cycle Degradation. J. Energy Storage 2023, 60, 106681. [Google Scholar] [CrossRef]
  27. Naumann, M.; Spingler, F.B.; Jossen, A. Analysis and Modeling of Cycle Aging of a Commercial LiFePO4/Graphite Cell. J. Power Sources 2020, 451, 227666. [Google Scholar] [CrossRef]
  28. Liu, Y.; Peng, Q.; Liu, T.; Gu, T.; Yang, Y. A Power Ramp Rate Tolerant Control of Photovoltaic-Battery Energy Storage Systems for Battery Aging Alleviation. J. Energy Storage 2025, 131, 117421. [Google Scholar] [CrossRef]
  29. Semmelmann, L.; Konermann, M.; Dietze, D.; Staudt, P. Empirical Field Evaluation of Self-Consumption Promoting Regulation of Household Battery Energy Storage Systems. Energy Policy 2024, 194, 114343. [Google Scholar] [CrossRef]
  30. Li, D.; Sun, Q. Prediction of Remaining Driving Range for Electric Vehicles Based on IVY Feature Selection and Parameter Optimization of KAN. J. Clean. Prod. 2025, 527, 146680. [Google Scholar] [CrossRef]
  31. Yang, Y.; Ye, Y.; Cheng, Z.; Ruan, G.; Lu, Q.; Wang, X.; Zhong, H. Life Cycle Economic Viability Analysis of Battery Storage in Electricity Market. J. Energy Storage 2023, 70, 107800. [Google Scholar] [CrossRef]
  32. Zhou, Y.; Liu, Z.; Ruan, Y.; Tian, Y.; Li, K.; Zhang, H. Optimization on Control Strategy for CO2-Based Dual-Cooling Thermal Management System in Electric Vehicles. Energy 2026, 343, 139804. [Google Scholar] [CrossRef]
  33. Miao, Y.; Li, M.; Li, X.; Wang, J.; Qin, Z.; Tang, X. A Reconfigurable Dual-Core R290 Vehicular Thermal Management System Featuring a Variable Area Thermal Unit: Experimental Evaluation and Thermodynamic Analysis. Energy Convers. Manag. 2026, 357, 121452. [Google Scholar] [CrossRef]
  34. Keil, P.; Schuster, S.F.; Wilhelm, J.; Travi, J.; Hauser, A.; Karl, R.C.; Jossen, A. Calendar Aging of Lithium-Ion Batteries: I. Impact of the Graphite Anode on Capacity Fade. J. Electrochem. Soc. 2016, 163, A1872–A1880. [Google Scholar] [CrossRef]
  35. Arif, N.A.; Mekhilef, S.; Seyedmahmoudian, M.; Stojcevski, A. Degradation in Li-Ion Batteries and Capacity Decline under Different Cycling Conditions: A Comprehensive Review. J. Energy Storage 2026, 154, 121270. [Google Scholar] [CrossRef]
  36. EV Battery Health: Key Findings from 22,700 Vehicle Data Analysis. Available online: https://www.geotab.com/blog/ev-battery-health/ (accessed on 23 July 2026).
  37. Habib, M.I. Comparative SOH Diagnosis and Forecasting of LFP and NMC Lithium-Ion Batteries in Electric Vehicles under Realistic Operating Conditions. Int. J. Electr. Comput. Eng. Res. 2025, 5, 7–15. [Google Scholar] [CrossRef]
  38. Assi, M.; Amer, M. A Comparative Analysis of Lithium-Ion Batteries Using a Proposed Electrothermal Model Based on Numerical Simulation. World Electr. Veh. J. 2025, 16, 60. [Google Scholar] [CrossRef]
Figure 1. Global EV sales from 2014 to 2024 [3].
Applsci 16 07756 g001
Figure 2. New EV registrations in EU-27 countries in 2014–2024 [4].
Applsci 16 07756 g002
Figure 3. Newly registered BEVs and PHEVs by country in 2024 [4].
Applsci 16 07756 g003
Figure 4. Market share of the BEV brands registered in EU-27 countries.
Applsci 16 07756 g004
Figure 5. BEV models with new registrations higher than 100,000 across 2017–2024.
Applsci 16 07756 g005
Figure 6. SoH results under cold temperature conditions (Scenario I) for all analyzed BEV samples.
Applsci 16 07756 g006
Figure 7. SoH results under Scenario II conditions (baseline ambient) for the 37 BEV samples.
Applsci 16 07756 g007
Figure 8. SoH results under hot temperature conditions (Scenario III) for the BEV samples analyzed.
Applsci 16 07756 g008
Figure 9. Remaining capacity at EoL for all studied BEV models.
Applsci 16 07756 g009
Table 1. Related work summary: estimating degradation of retired BEV batteries.
Related WorkBEV ModelBattery ChemistryBattery CapacityDegradation ModelKey Findings
[12]Volkswagen ID.3 ProNMC60.6 kWhDifferential voltage and incremental capacity analysis
-
After 2 years: energy dropped to 55 kWh, SoH decreased to 94.9%, capacity loss of 12.1 Ah;
Tesla Model 3 Standard Range PlusLFP57 kWh
-
After 2 years: energy dropped to 55.1 kWh, SoH decreased to 105%, capacity loss of 4.9 Ah.
[13]Fleet of 550 BEVsLithium-ion-SoH forecasting, with proposed model developed based on histogram featuresImprovement in performance of up to 6.1% when switching from accessible features to histogram-based features.
[14]Nissan Leaf 2011 modelNMC65 AhNon-destructive methodsSoH ranges from 27% to 48% based on capacity.
[15]Renault ZoeNMC44.1 kWhNon-invasive CANBUS measurement techniqueDegradation ranging from 4.17% to 5.8% after 10,145 to 22,872 km.
[16]Tesla Model 3 SR 2020LFP53.6 kWhExperimental tests performed at the vehicle level Aged vehicle capacity of 55.2 kWh after 25,716 km.
Table 2. Technical specifications of the analyzed BEV models [18].
BEV Model EditionBattery ChemistryUsable Capacity [kWh]Warranty Period [Years]Warranty Mileage [km]Vehicle Consumption [Wh/km]
Tesla: Model Y-RWDLFP608160,000160
Tesla: Model Y-Premium AWDNCM798192,000166
Tesla: Model Y-Long Range AWDNCM728192,000169
Tesla: Model 3-Standard RWDLFP608160,000135
Tesla: Model 3-Standard Range PlusLFP498160,000153
Tesla: Model 3-Premium RWDNMC798192,000136
Tesla: Model 3-Long Range AWDNMC758192,000143
Renault: Zoe-ZE50 R135NMC528160,000168
Renault: Zoe-R240NMC23.38160,000161
Renault: Zoe-ZE40 R110NMC418160,000161
Volkswagen: ID.3-PureNMC528160,000160
Volkswagen: ID.3-ProNMC598160,000162
Volkswagen: ID.3-GTXNMC798160,000168
Volkswagen: ID.3-ProSNMC778160,000166
Skoda: Enyaq-Coupe 85NMC778160,000164
Skoda: Enyaq-iV 60NMC588160,000171
Skoda: Enyaq-50NMC528160,000168
Fiat: 500E-CabrioNMC37.38160,000162
Fiat: 500E-HatchbackNMC21.38160,000158
Peugeot: E-208-MY25NMC50.88160,000152
Peugeot: E-208-MY22NMC46.38160,000162
Hyundai: Kona-Electric 65NMC65.48160,000168
Hyundai: Kona-Electric 39NMC39.28160,000160
Hyundai: Kona-Electric 48NMC48.48160,000164
Volkswagen: ID.4-ProNMC778160,000173
Volkswagen: ID.4-PureNMC528160,000182
Volkswagen: ID.4-GTXNMC798160,000182
Audi: Q4 E-Tron-45NMC778160,000183
Audi: Q4 E-Tron-40NMC598160,000182
Audi: Q4 E-Tron-35NMC528160,000147
Dacia: Spring-Electric 100LFP248120,000150
Dacia: Spring-Electric 65NMC258120,000156
Kia: Niro-EVNMC64.87150,000168
Kia: e-Niro-39NMC397150,000167
Volkswagen: ID.5-ProNMC778160,000167
Table 3. Considered scenarios for SoH estimation.
Distance RangeColdBaselineHot
T [K]SoC [%]DoD [%]T [K]SoC [%]DoD [%]T [K]SoC [%]DoD [%]
Short-range273.15 7030298.157030318.157030
Medium-range273.155050298.155050318.155050
Long-range273.152080298.152080318.152080
Table 4. Calendar degradation coefficients for LFP and NMC batteries [24].
CoefficientLFPNMC
α1 5.98 · 10 6 1.14 · 10 12
α20.694.7
α3 6.46 · 10 3 10.8 · 10 3
α40.50.5
Table 5. Cycle degradation parameters for LFP and NMC batteries [24].
ParameterLFPNMC
k1 9.05 · 10 6 1.47 · 10 4
k21.4−1.65
k30 3.61 · 10 2
α 5.75 · 10 2
β 1.21 · 10 2
Tref [K]298.15
SoCref0.5
kSoC1.04
kT 6.93 · 10 2
Disclaimer/Publisher’s Note: The statements, opinions and data contained in all publications are solely those of the individual author(s) and contributor(s) and not of MDPI and/or the editor(s). MDPI and/or the editor(s) disclaim responsibility for any injury to people or property resulting from any ideas, methods, instructions or products referred to in the content.