1. Introduction
Indoor humidity has a significant influence on the comfort of living environments and human health. A previous study reported that a relative humidity range of 40–60% is suitable for human habitation [
1]. However, conventional humidity regulation methods are often associated with energy waste and deterioration of indoor air quality. In contrast, passive moisture-regulating materials provide an energy-saving and efficient solution, as they can automatically regulate moisture in response to changes in ambient humidity without additional energy consumption [
2]. Therefore, such materials have important research significance and application potential. Various passive moisture-regulating materials have been investigated for indoor humidity control, including zeolites, diatomite, and clay minerals, owing to their porous structures and moisture adsorption–desorption capabilities. Beyond zeolites, hygroscopic building materials have been investigated for their capacity to attenuate indoor relative-humidity fluctuations through cyclic moisture uptake and release. Osanyintola and Simonson experimentally characterized the moisture-buffering capacity of hygroscopic building materials and examined its implications for building energy consumption [
3]. For cementitious materials, Collet and Pretot [
4] quantified the dynamic moisture-buffering behavior of sprayed hemp concrete, Wu et al. [
5] proposed an ultimate moisture buffering value for characterizing composite porous mortars, and Ren et al. [
6] developed a cement-based indoor-wall composite with enhanced humidity-adsorption capacity. These studies indicate that passive humidity regulation depends on moisture-storage capacity, vapor-transfer characteristics, material configuration, and cyclic exposure conditions. Among these materials, clinoptilolite possesses an excellent porous structure, and its framework remains stable during water adsorption and desorption, enabling effective moisture exchange with the surrounding environment [
7]. Accordingly, zeolite powder is regarded as a typical passive moisture-regulating material.
To improve its moisture-regulating performance, zeolite powder usually requires modification. Common modification methods for zeolite powder include acid treatment, alkali treatment, ion-exchange modification, and thermal modification. Acid treatment can significantly increase the specific surface area and Si/Al ratio of zeolite, resulting in superior adsorption performance for water vapor, formaldehyde, and toluene. An increase in ambient temperature can shorten the moisture-regulation equilibrium time, while humidity variation has only a limited influence on the moisture-regulation time. Moreover, the gas adsorption performance of zeolite is closely related to its specific surface area, pore volume, and Si/Al ratio [
8,
9]. Organosilane impregnation treatment may reduce the water absorption and pozzolanic activity of zeolite [
10], thereby adversely affecting its moisture-regulating performance. Thermal treatment can remove organic matter and carbonate impurities from zeolite channels, thereby enlarging the pore size, improving pore structure and pore-size distribution, and enhancing pore connectivity [
11,
12]. It can also improve the pozzolanic activity of zeolite powder. In addition, mechanical activation has been reported to shorten the setting time of cement paste and promote heat release during cement hydration [
13]. These effects can enhance the adsorption capacity of zeolite powder for water molecules and its saturated water-storage capacity, thereby improving its moisture-regulating performance.
In recent years, machine learning methods have been widely applied to the performance prediction of cement-based materials. The properties of concrete materials are jointly affected by multiple factors, including the water-to-binder ratio, aggregate composition, mineral admixtures, age, and curing conditions. These factors exhibit significant nonlinear coupling relationships, making it difficult for traditional empirical formulas and single-factor experimental methods to fully characterize the underlying mapping mechanisms. Owing to its strong nonlinear fitting ability, self-learning capability, and generalization performance, the multilayer perceptron (MLP) has been widely used for predicting the performance of complex engineering materials [
14]. Abellán-García [
15] developed a four-layer MLP model to predict the compressive strength of ultra-high-performance concrete (UHPC), incorporating various supplementary cementitious materials and aggregate particle-size factors as model inputs. The results showed that the MLP could accurately describe the nonlinear relationship between complex constituents and strength. Ren et al. [
16] combined an MLP with the Beetle Antennae Search (BAS) algorithm to establish a BAS-MLP model for the unified prediction of the load-bearing capacity of rectangular concrete-filled steel tubular columns under different loading conditions, demonstrating the applicability of MLP models in predicting structural performance involving multiple coupled parameters. In addition, Zhang et al. [
17] used support vector regression, MLP, and one-dimensional convolutional neural networks to predict the free chloride concentration in fly ash concrete, indicating that MLP also has potential for predicting the durability and transport properties of concrete. Recent artificial intelligence (AI) studies have further extended this approach to transport-related durability indicators. Al Fuhaid and Alanazi [
18] compared multiple machine-learning algorithms for predicting the chloride diffusion coefficient of concrete containing supplementary cementitious materials, whereas El-Mir et al. [
19] predicted water penetration depth from mixture composition, age, and compressive strength. These studies demonstrate that data-driven models can capture nonlinear relationships associated with ionic and liquid-water ingress; however, these transport processes differ from the reversible water-vapor adsorption and desorption investigated in moisture-regulating concrete.
To further improve the prediction accuracy of MLP models, several studies have combined them with intelligent optimization algorithms. Moayedi et al. [
20] optimized MLP model parameters using the evaporation-rate water cycle algorithm and equilibrium optimizer to predict the compressive strength of high-performance concrete, and the results showed that the optimized MLP model achieved higher prediction accuracy than the conventional MLP model. Ma et al. [
21] optimized MLP networks using the artificial bee colony algorithm, grasshopper optimization algorithm, shuffled frog-leaping algorithm, and salp swarm algorithm, thereby realizing effective prediction of concrete compressive strength. Zhao et al. [
22] introduced the teaching–learning-based optimization algorithm and shuffled complex evolution algorithm into MLP models, further verifying that intelligent optimization algorithms can enhance the learning and generalization capabilities of MLP models for nonlinear relationships in concrete performance. Berradia et al. [
23] used MLP-Bat (Bat Algorithm) and MLP-TLBO (Teaching-Learning-Based Optimization) models to predict the strength of concrete columns confined by carbon fiber-reinforced polymer (CFRP) and transverse steel reinforcement, further demonstrating that MLP and its optimized variants can serve as effective tools for predicting structural and material performance.
Overall, MLP networks can learn complex mapping relationships between input parameters and target performance from sample data in the absence of explicit theoretical formulas, making them suitable for predicting concrete performance under the combined effects of multiple factors. The moisture-regulating performance of modified zeolite concrete is jointly influenced by the water-to-cement ratio, sand ratio, and zeolite powder content. Its moisture adsorption and desorption behavior is governed by multiple coupled factors, including pore structure and connectivity, moisture migration, surface adsorption and pore-water storage, and the hydration state of the cementitious matrix, resulting in nonlinear and hysteretic responses during wetting and drying processes [
24,
25]. Therefore, in this study, the water-to-cement ratio, sand ratio, and modified zeolite powder content are used as input variables, while the unit-area moisture absorption is used as the output variable. An MLP neural network prediction model is established to analyze and predict the moisture-regulating performance of modified zeolite concrete under different mix proportions, providing a theoretical basis for its engineering application.
Although previous studies have extensively investigated modification techniques for zeolite powder, existing studies have primarily examined the moisture regulation of zeolite-based modified materials, the internal-curing and hydration effects of zeolite in cementitious systems, and mechanical or thermal modification at the cement-paste level. However, these studies do not quantify the reversible moisture adsorption–desorption behavior of concrete containing thermally modified clinoptilolite or determine the coupled effects of the water-to-cement ratio, sand ratio, and zeolite replacement level on unit-area moisture absorption and adsorption–desorption hysteresis. Therefore, the available powder- and paste-level findings cannot directly guide mixture design for moisture-regulating concrete. In the present study, natural clinoptilolite zeolite powder was therefore modified by thermal treatment and incorporated into concrete as an equal-mass partial replacement of cement. The incorporation of zeolite reduces cement consumption and may therefore contribute to lower carbon emissions, providing a potentially more sustainable option for functional building materials. Previous studies on neural networks and optimization algorithms for predicting the performance of cement-based materials have demonstrated that neural network models and intelligent optimization algorithms can be effectively applied in the field of civil engineering. However, the models reviewed above primarily predict compressive strength, structural bearing capacity, chloride transport, or liquid-water penetration rather than reversible vapor exchange; therefore, they cannot be directly transferred to the prediction of the moisture-regulation response investigated here. In this study, an MLP network and a mapping-improved Mountain Gazelle Optimizer (MMGO) are used to predict the moisture-regulating performance of concrete containing modified zeolite powder. The MMGO is employed as an outer-loop optimizer for selected MLP hyperparameters, while the network architecture and activation functions are predefined. The weights and biases of each candidate MLP model are determined during internal network training. Distinct from previous studies focusing on zeolite modification, internal curing, or hydration behavior, this study systematically evaluates the moisture adsorption–desorption response of thermally modified clinoptilolite concrete to coupled mix-proportion parameters and develops a Synthetic Minority Over-sampling Technique (SMOTE)-MMGO-MLP model for predicting unit-area moisture absorption.
3. Results and Discussion
3.1. Effect of Thermal Modification on the Composition of Zeolite Powder
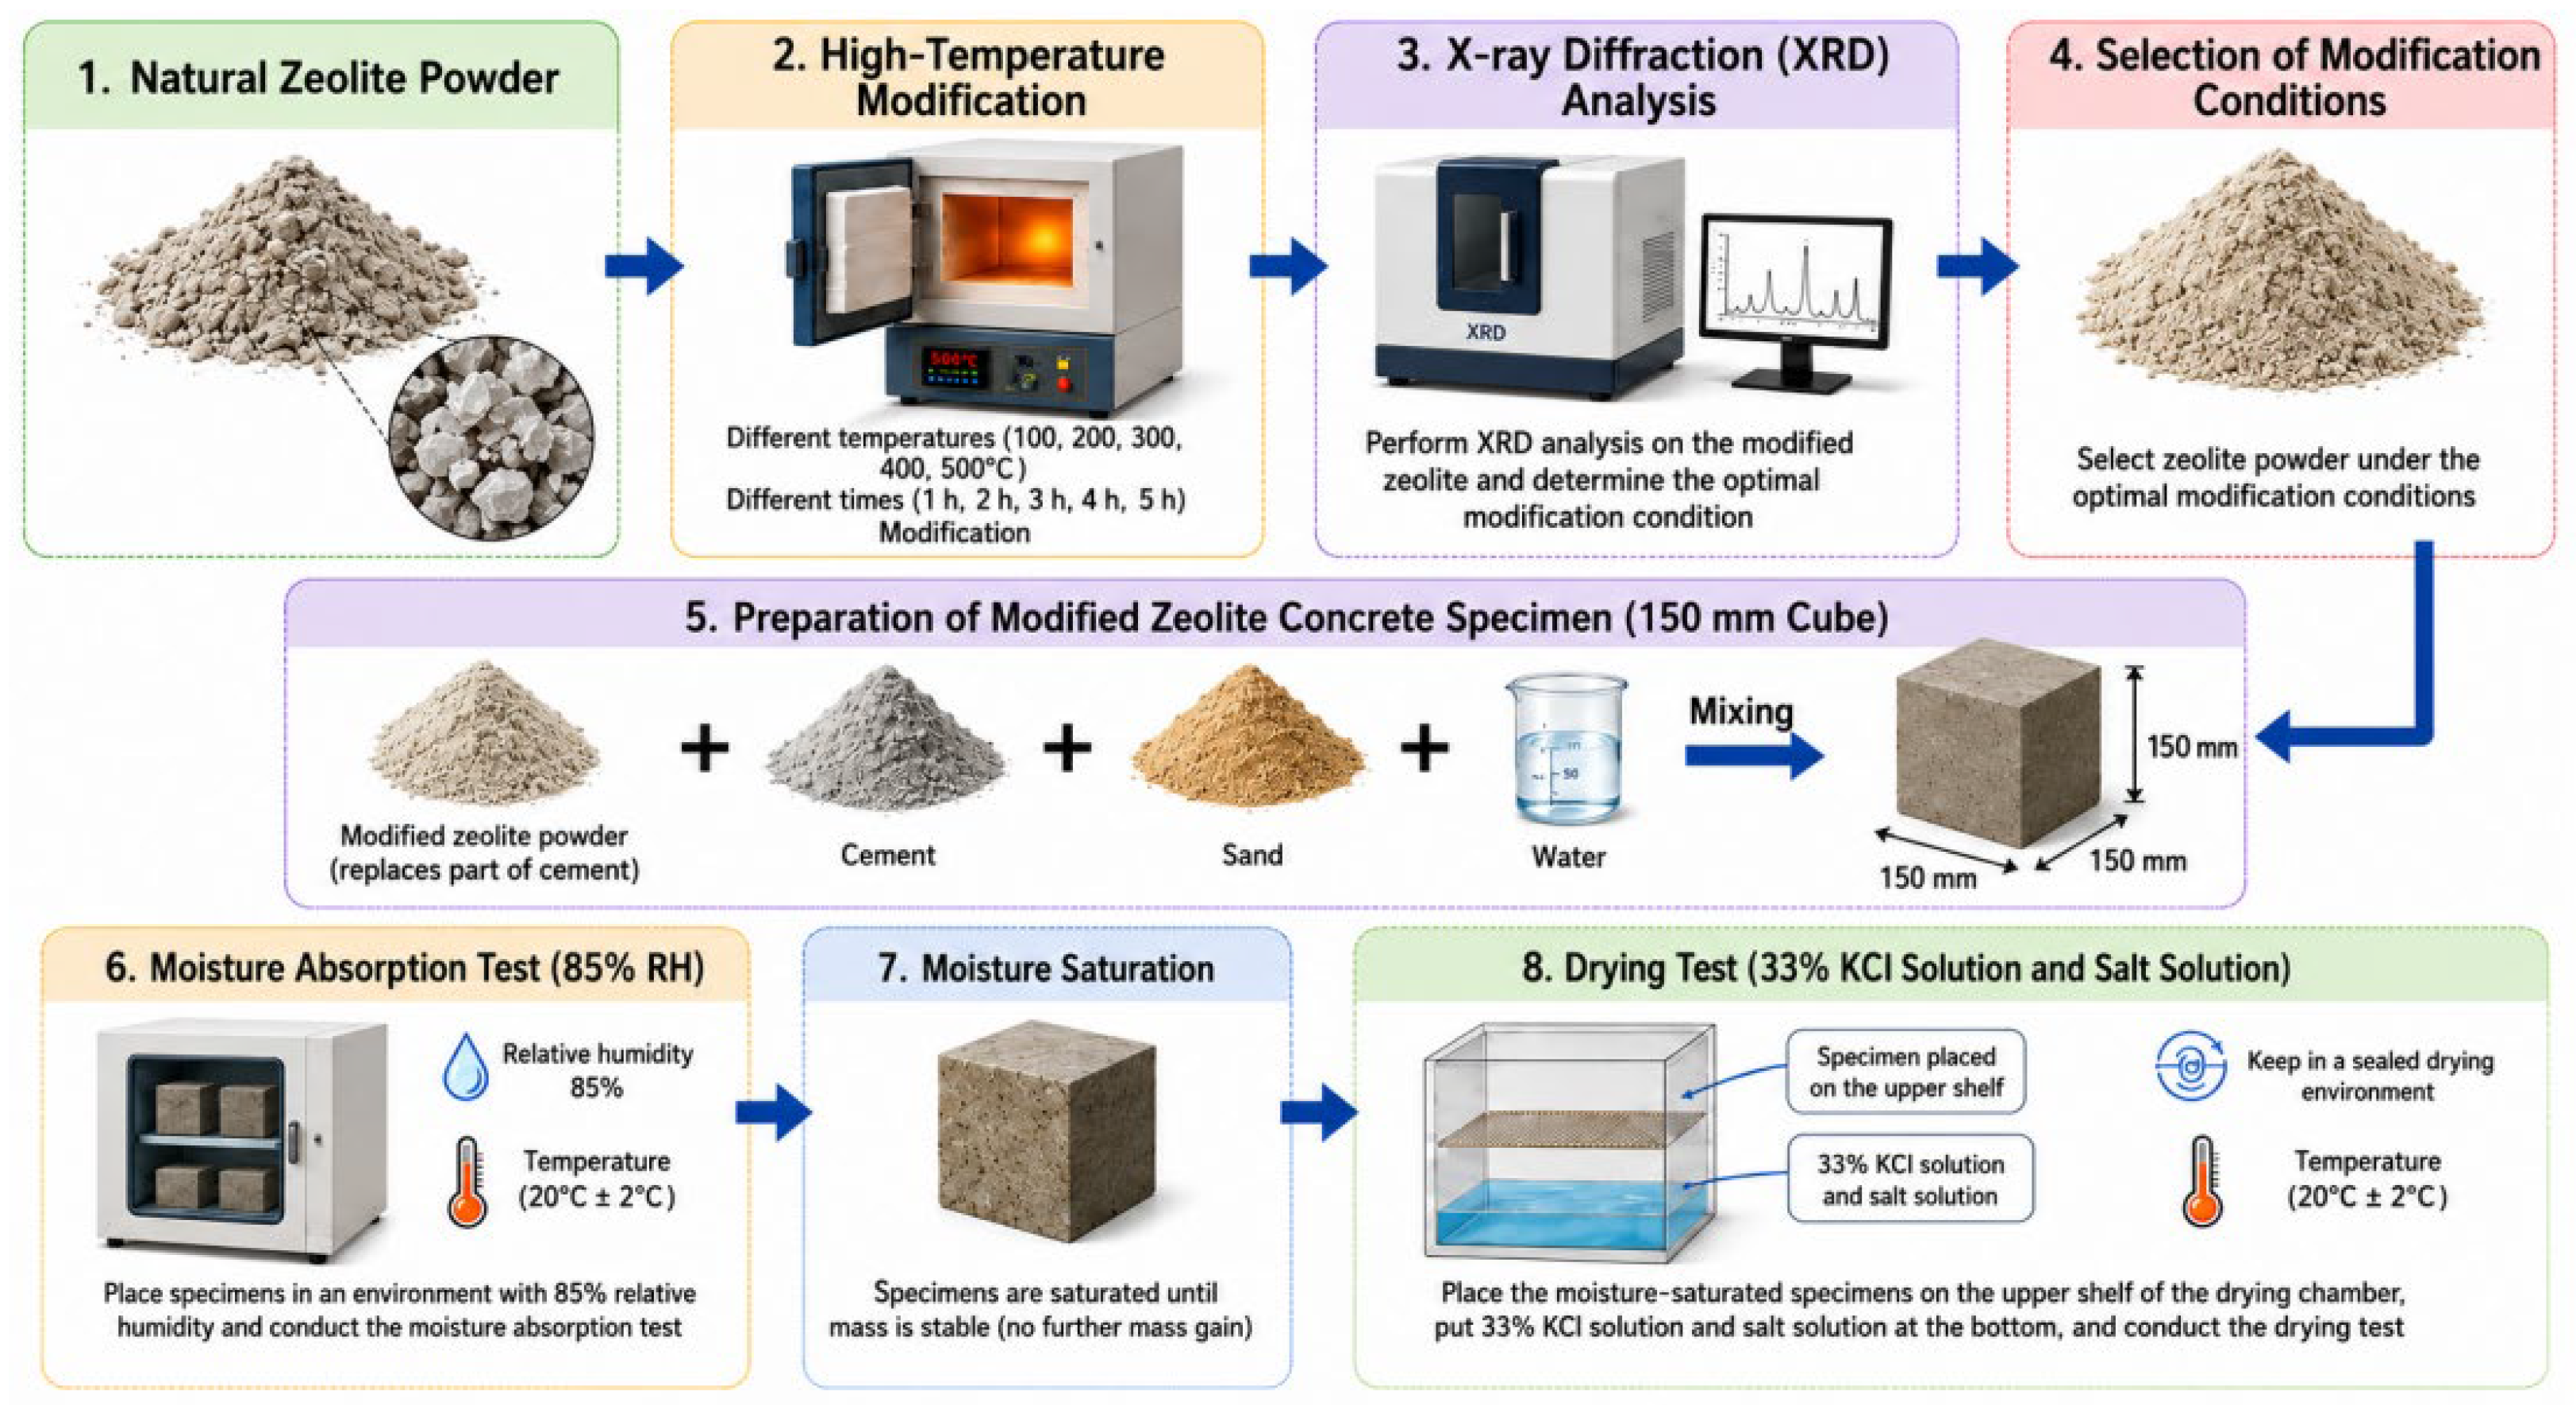
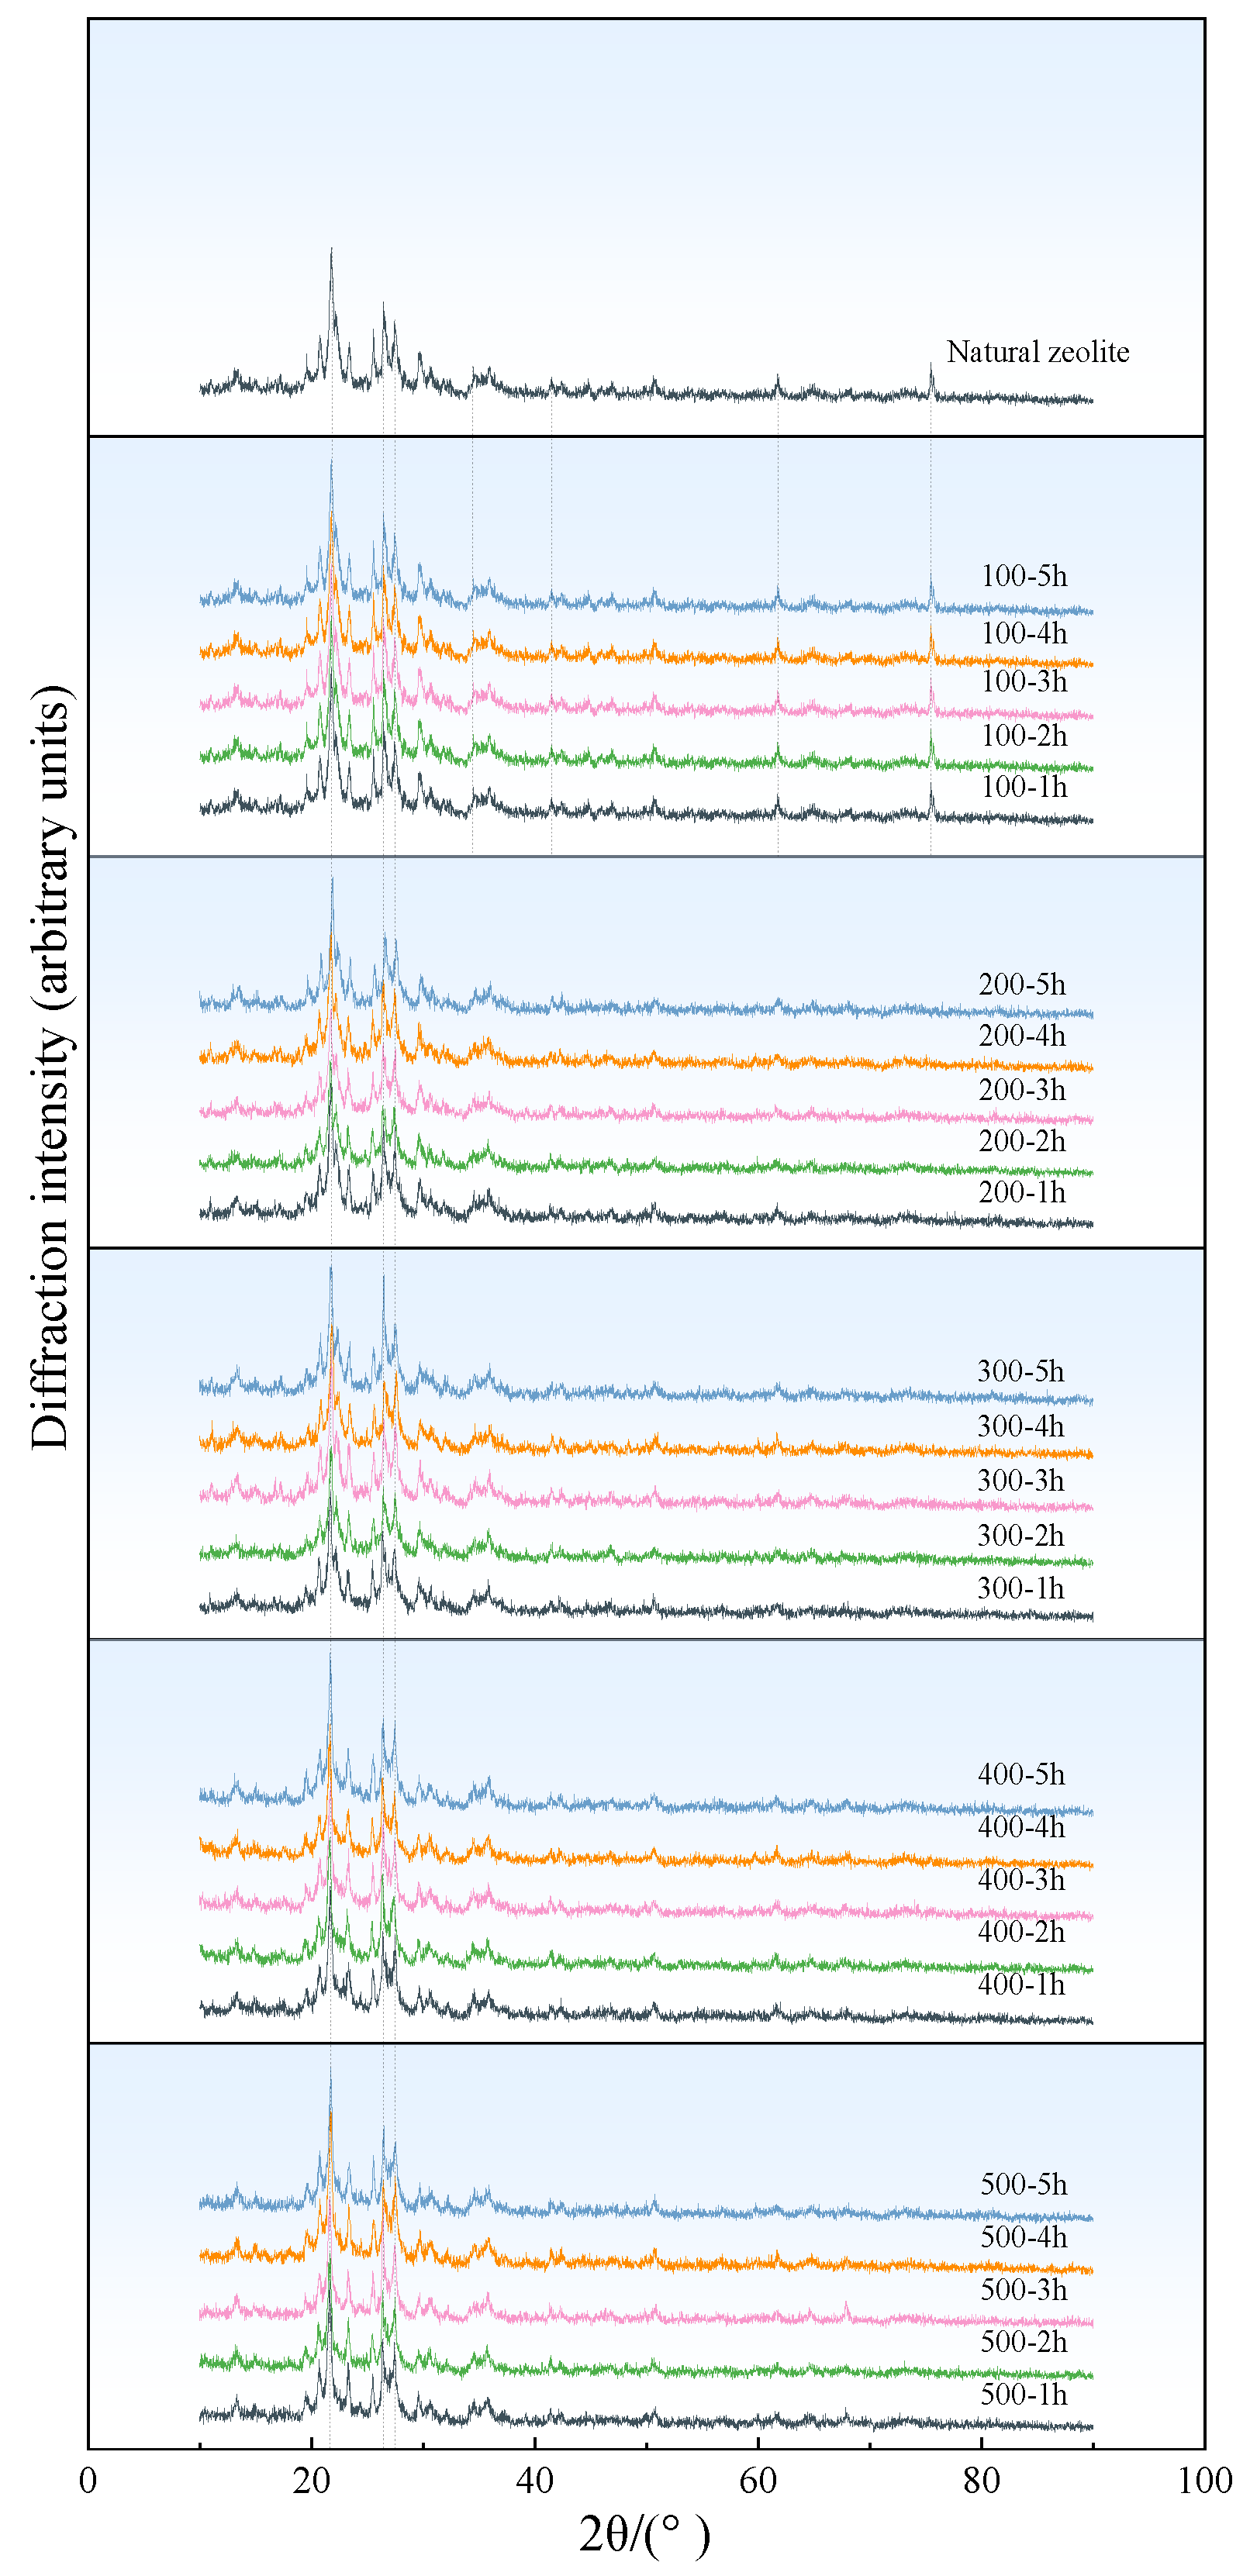
In this study, natural zeolite powder was modified by thermal treatment. Five heating temperatures, namely 100 °C, 200 °C, 300 °C, 400 °C, and 500 °C, were set, and five corresponding holding times of 1 h, 2 h, 3 h, 4 h, and 5 h were adopted for the thermal modification of natural zeolite powder. Subsequently, X-ray diffraction tests were performed on the zeolite powder samples obtained under different thermal-treatment conditions. Changes in the diffraction patterns before and after treatment were then evaluated.
As shown in the XRD patterns in
Figure 3, changes in the intensity and visibility of several diffraction peaks were observed with increasing thermal-treatment temperature and holding time. Similar temperature-dependent changes in the XRD patterns of thermally treated clinoptilolite have been reported in previous studies, where dehydration and thermally induced structural adjustment affected the diffraction characteristics, while more pronounced structural deterioration occurred at higher temperatures [
33,
34]. In the present study, the diffraction peaks near 2θ values of 34.436°, 41.497°, 61.880°, and 75.449° gradually weakened or became indistinct under some treatment conditions. Meanwhile, the characteristic clinoptilolite peaks near 2θ values of 21.859°, 26.467°, and 27.450° remained clearly identifiable. The sample treated at 500 °C for 2 h exhibited the clearest and relatively sharp clinoptilolite diffraction peaks among the investigated conditions. These observations indicate that the diffraction characteristics of the clinoptilolite phase remained readily identifiable under this treatment condition.
3.2. Effect of Thermal Modification on the Moisture-Regulating Performance of Zeolite Powder
The moisture-regulating performance of zeolite powder is closely related to its pore characteristics, surface adsorption sites, and the adsorption–desorption behavior of water molecules within its channels. Previous studies have shown that heating promotes the removal of physically adsorbed and channel water from clinoptilolite and can alter its accessible porosity and surface area, although the magnitude and direction of these changes depend on the zeolite source and thermal-treatment conditions [
33,
35]. These thermally induced changes may affect the accessibility of water molecules to the internal adsorption space and consequently influence the moisture absorption and desorption performance of zeolite powder.
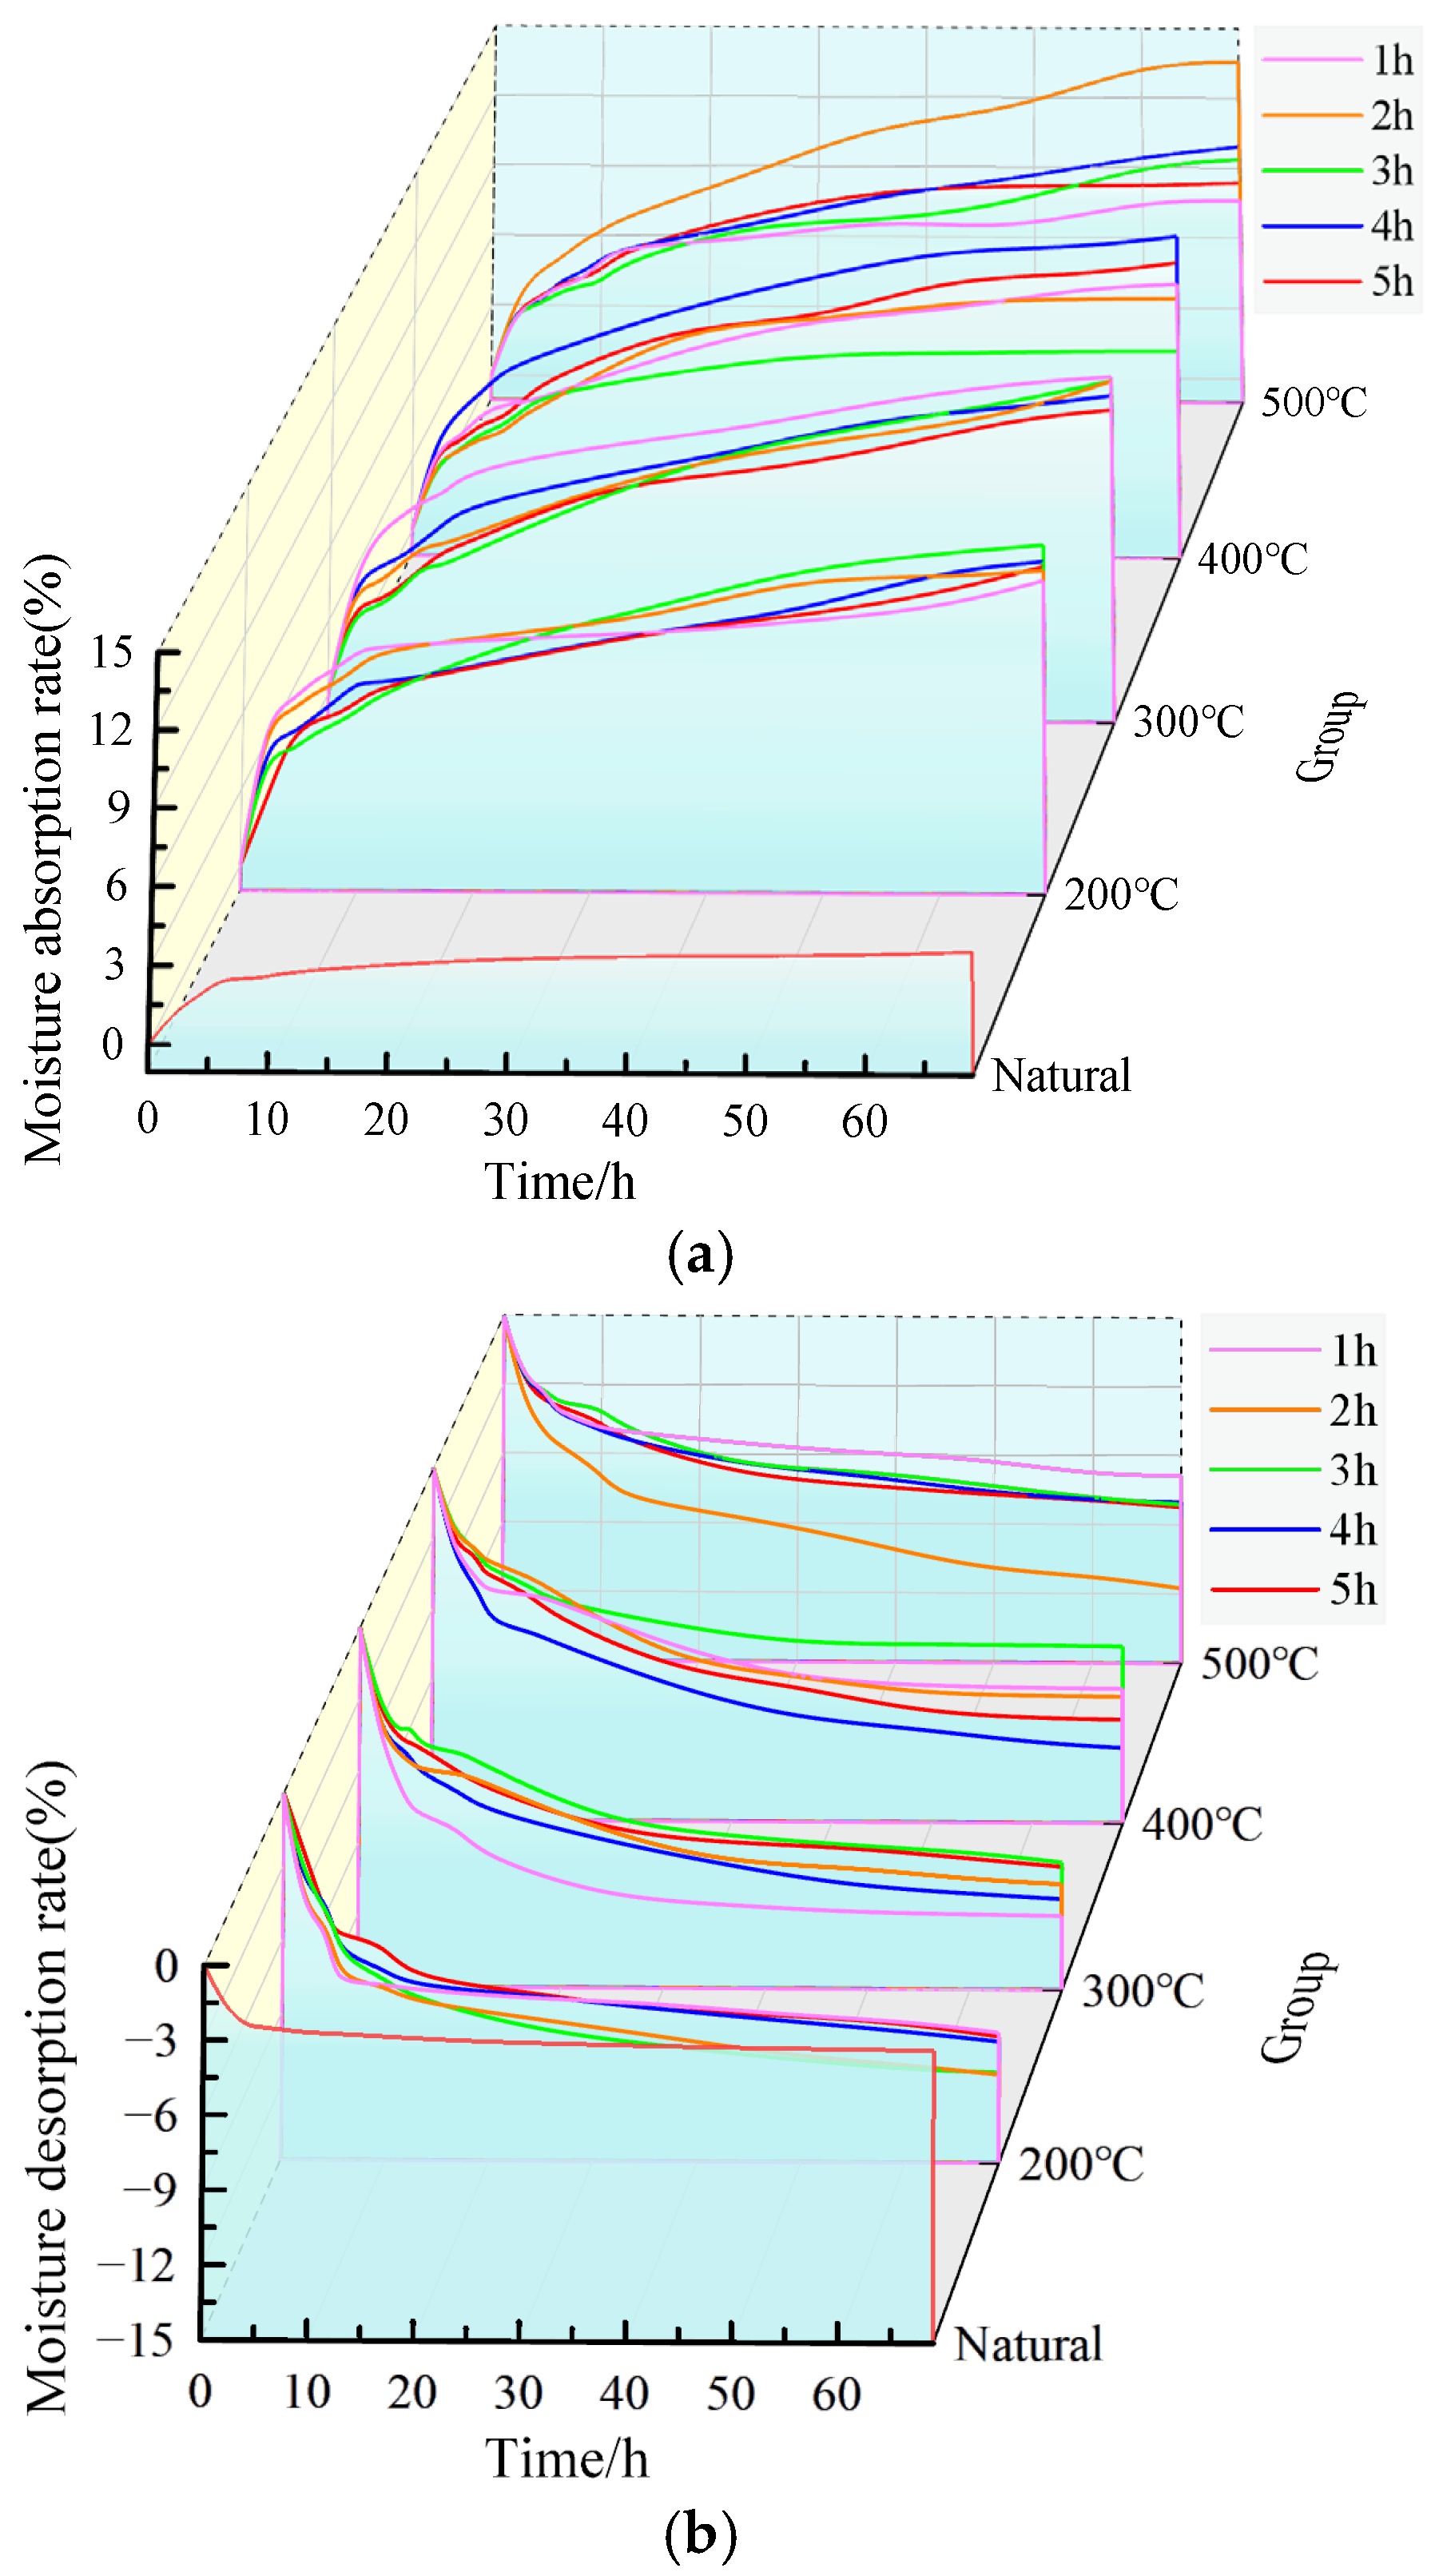
As shown in
Figure 4, the maximum moisture absorption rate and maximum moisture desorption rate of natural zeolite powder were 3.90% and 3.50%, respectively. After thermal modification, the measured moisture absorption and desorption capacities of all thermally treated zeolite powder groups were higher than those of natural zeolite powder. Among them, the zeolite powder treated at 500 °C for 2 h exhibited a maximum moisture absorption rate of 13.60%, approximately 3.49 times that of natural zeolite powder. Its maximum moisture desorption rate reached 11.73%, approximately 3.35 times that of natural zeolite powder. The measured moisture absorption and desorption rates of thermally modified zeolite powder were higher than those of natural zeolite powder. However, its moisture-regulating performance did not continuously increase with increasing temperature and holding time. A possible explanation is that the effect of thermal treatment is jointly influenced by temperature and duration. Insufficient treatment may lead to incomplete pore activation, whereas excessive treatment may cause framework dehydroxylation, pore-wall shrinkage, or even micropore collapse, resulting in reduced adsorption performance. Therefore, the improvement in the moisture-regulating performance of zeolite powder by thermal modification may be associated with the balance between pore-channel purification and framework stability.
Based on the combined XRD and moisture absorption–desorption results, the sample treated at 500 °C for 2 h exhibited the clearest and relatively sharp clinoptilolite diffraction peaks and the highest measured moisture absorption and desorption rates among the investigated conditions. Therefore, 500 °C for 2 h was selected as the optimal heat-treatment condition within the investigated experimental range, and the zeolite powder prepared under this condition was used in the subsequent concrete tests.
3.3. Moisture-Regulating Performance of Zeolite Concrete
The moisture-regulating performance of zeolite concrete may be related to the combined effects of the pore structure of the cement matrix, the adsorption characteristics of zeolite powder, and the interactions among the constituent materials. Ordinary concrete mainly relies on gel pores, capillary pores, and pores in the aggregate–paste interfacial transition zone formed by cement hydration products for moisture absorption and desorption. However, because of its uneven pore-size distribution and limited effective adsorption sites, its moisture-regulating capacity is restricted to some extent. After natural zeolite powder is incorporated, porous mineral components with a microporous structure and hydrophilic characteristics are introduced into the concrete, which may provide additional storage space for water molecules. In addition, the secondary pozzolanic reaction may generate additional calcium silicate hydrate (C–S–H) gel [
36], refine the pore structure, and improve the compactness of the interfacial transition zone, thereby potentially forming a pore network more favorable for moisture adsorption and transport.
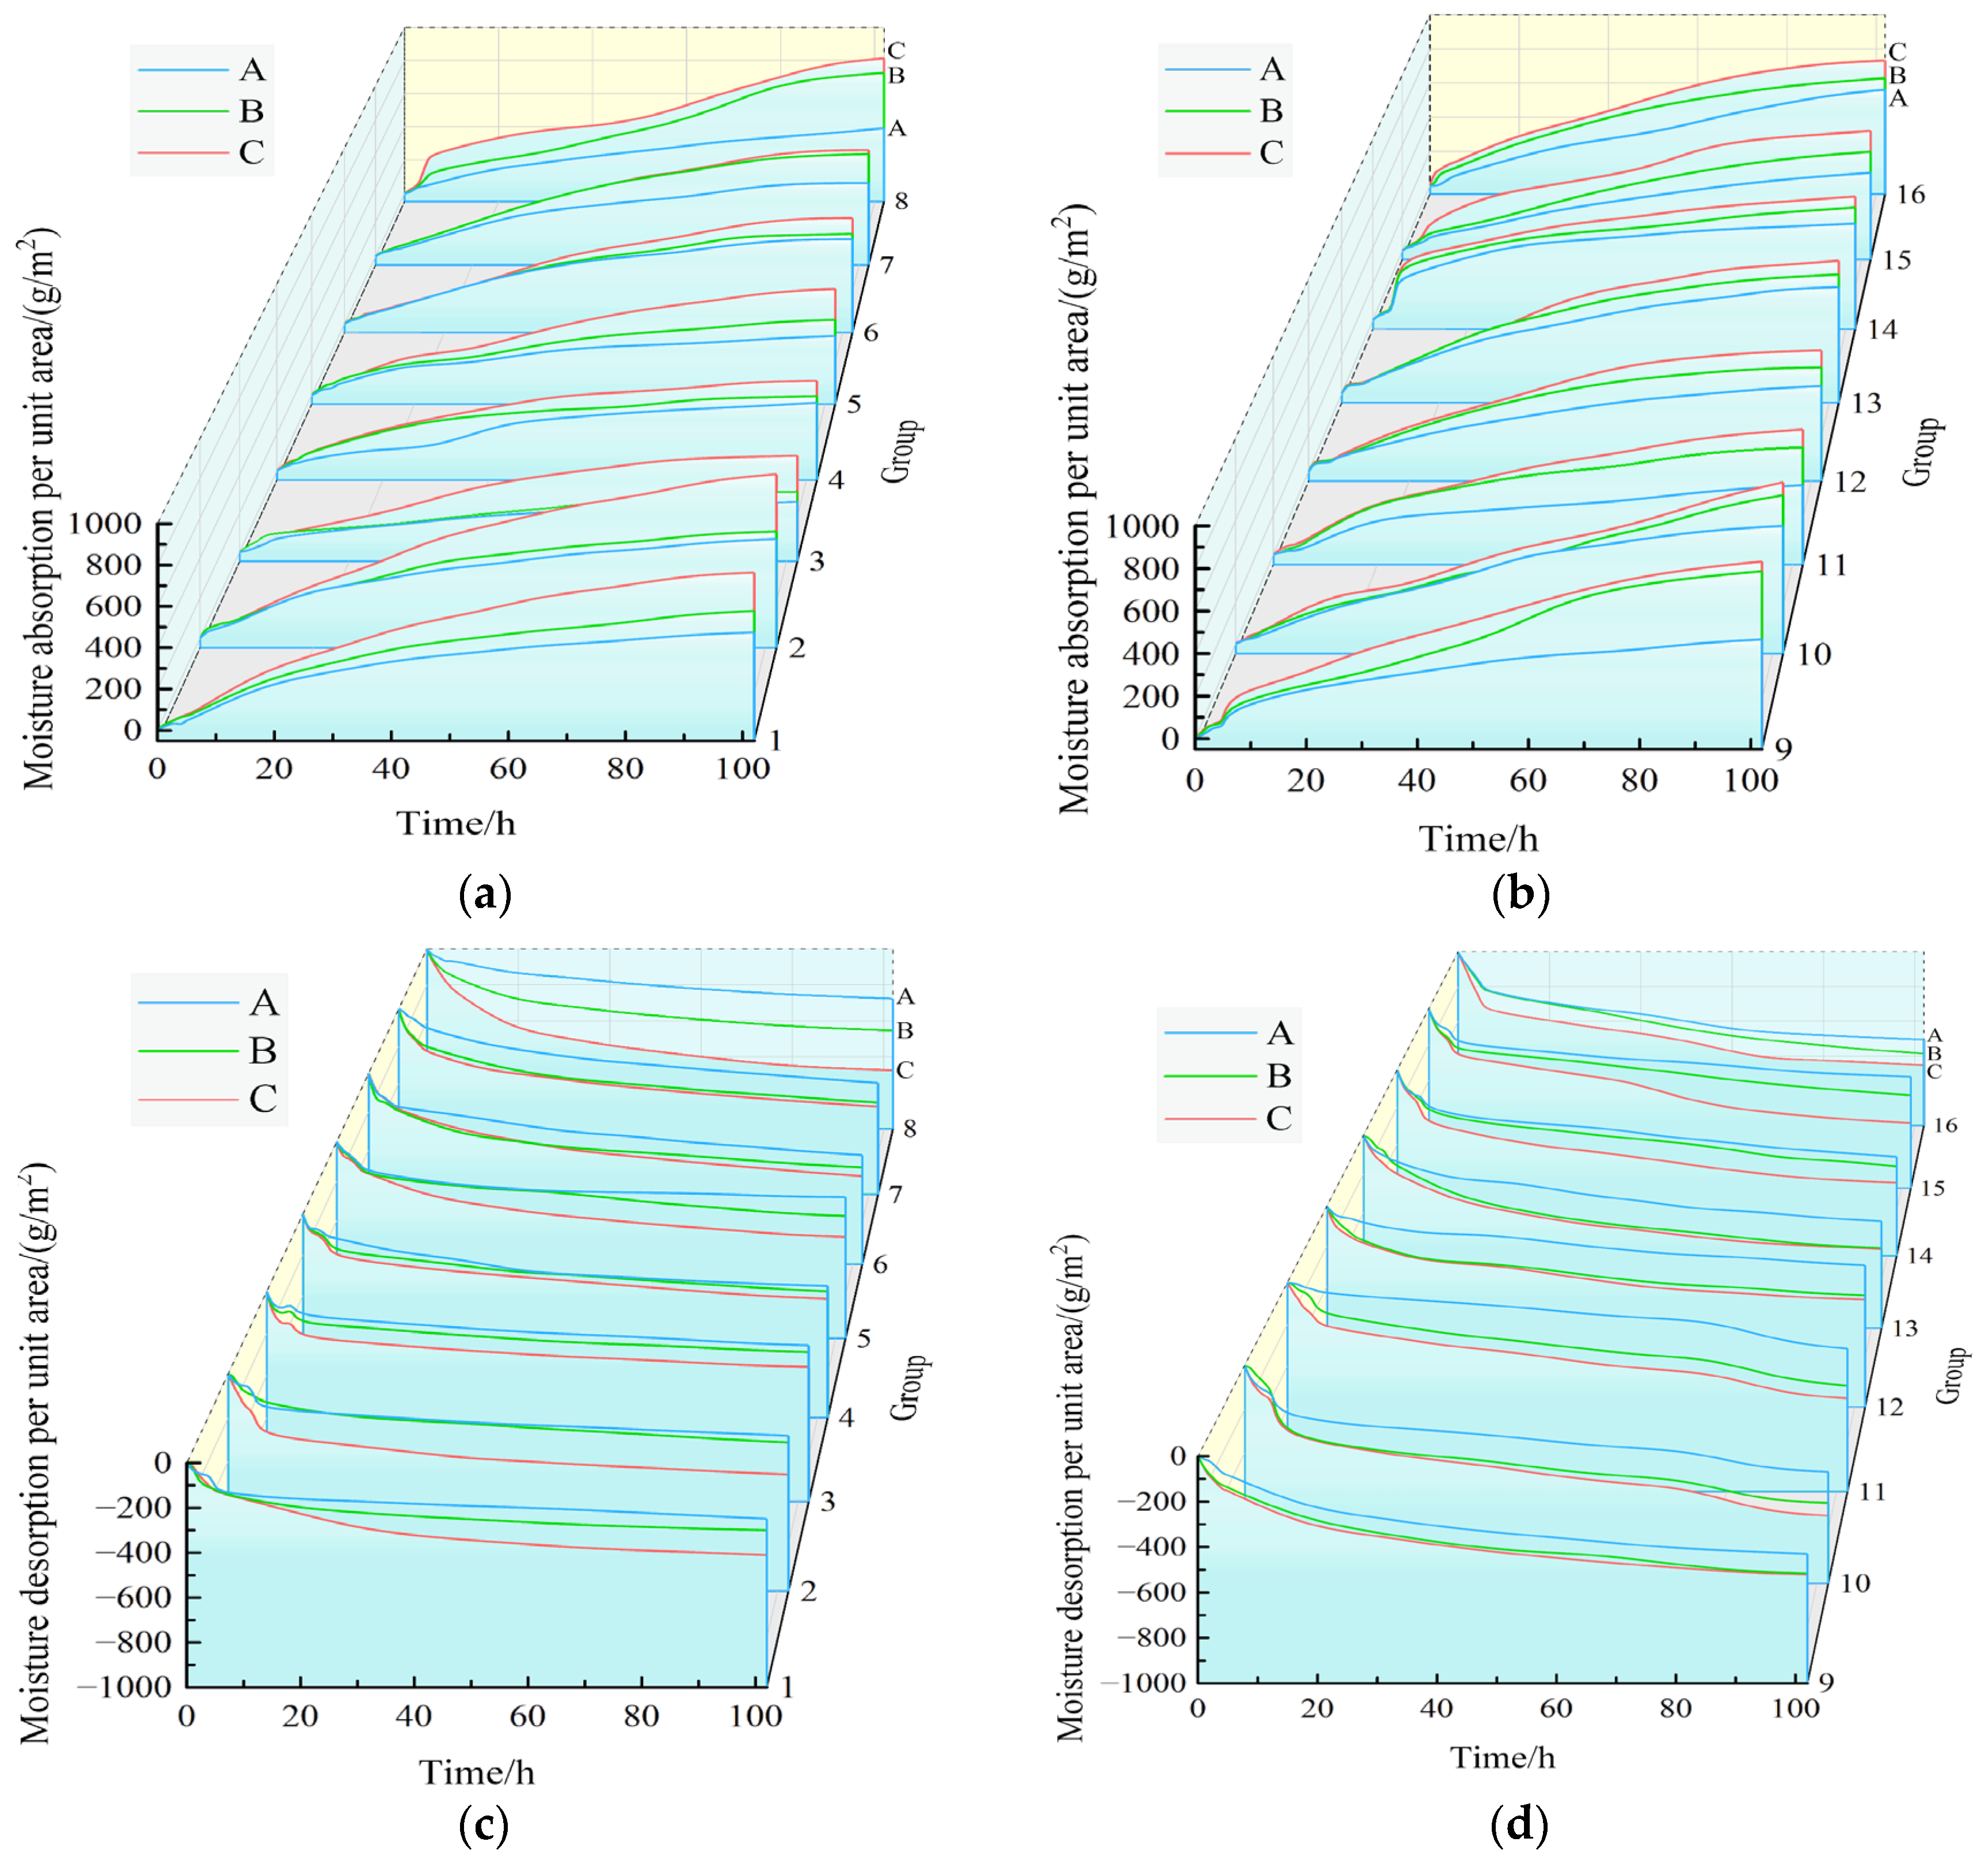
The test results are shown in
Figure 5. The average unit-area moisture absorption values of the concrete without zeolite powder in Group A, the natural zeolite powder concrete in Group B, and the modified zeolite powder concrete in Group C were 448.12 g/m
2, 569.72 g/m
2, and 678.99 g/m
2, respectively. The average unit-area moisture absorption of Group C was approximately 51.52% and 19.18% higher than those of Groups A and B, respectively. The average unit-area moisture desorption values of the three groups were 365.19 g/m
2, 460.19 g/m
2, and 537.19 g/m
2, respectively. The average unit-area moisture desorption of Group C was approximately 47.10% and 16.73% higher than those of Groups A and B, respectively. The present results were also compared with published studies. Vejmelková et al. [
27] reported that a 20% natural-zeolite replacement level provided a favorable balance of hygrothermal and engineering properties, whereas the present study identified 15% as favorable for maximizing unit-area moisture absorption and 20% for reducing the absorption-desorption hysteresis ratio. The above percentage increases were calculated from the group-average values and are presented as descriptive comparisons of the measured moisture absorption and desorption performance. These results indicate that the incorporation of zeolite powder was associated with higher measured moisture storage capacity, while thermal modification was associated with a further increase in the measured moisture-storage performance of zeolite powder concrete. In terms of individual test results, the maximum unit-area moisture absorption of Group C reached 831.85 g/m
2, which was higher than the maximum values of Group B, 786.67 g/m
2, and Group A, 572.59 g/m
2. This further indicates that the concrete containing modified zeolite powder exhibited higher measured moisture absorption performance under the investigated conditions. This improvement may be associated with the removal of part of the impurities and adsorbed water from zeolite pore channels during thermal treatment, which may reopen blocked pores, improve pore accessibility, and expose more polar surface sites. After modified zeolite powder is incorporated into concrete, the micropores of zeolite and the capillary-pore system of the cement matrix may jointly form a multiscale pore environment. In this possible pore environment, micropores may contribute mainly to moisture adsorption, while larger pores and capillary pathways may facilitate moisture migration and release, helping the concrete exhibit both moisture absorption and desorption capacities.
In addition, the water-to-cement ratio, sand ratio, and zeolite powder content do not act independently; rather, they may jointly influence the pore volume, pore-size distribution, and pore connectivity within concrete. At an appropriate mix proportion, zeolite adsorption and storage, the pore characteristics of the cement matrix, and aggregate-related transport pathways may collectively contribute to the overall moisture-regulating performance. However, when the zeolite powder content is relatively high, the amount of hydration products may decrease due to the equal-mass replacement of cement, and changes in the pore structure may occur, which may affect the moisture absorption and desorption processes. Therefore, the improvement in the moisture-regulating performance of concrete by thermally modified zeolite powder has an appropriate range. A possible explanation involves the enhanced adsorption capacity of zeolite powder, changes in the pore structure of the cement matrix, and altered moisture migration pathways.
3.4. Calculation and Analysis of Experimental Results
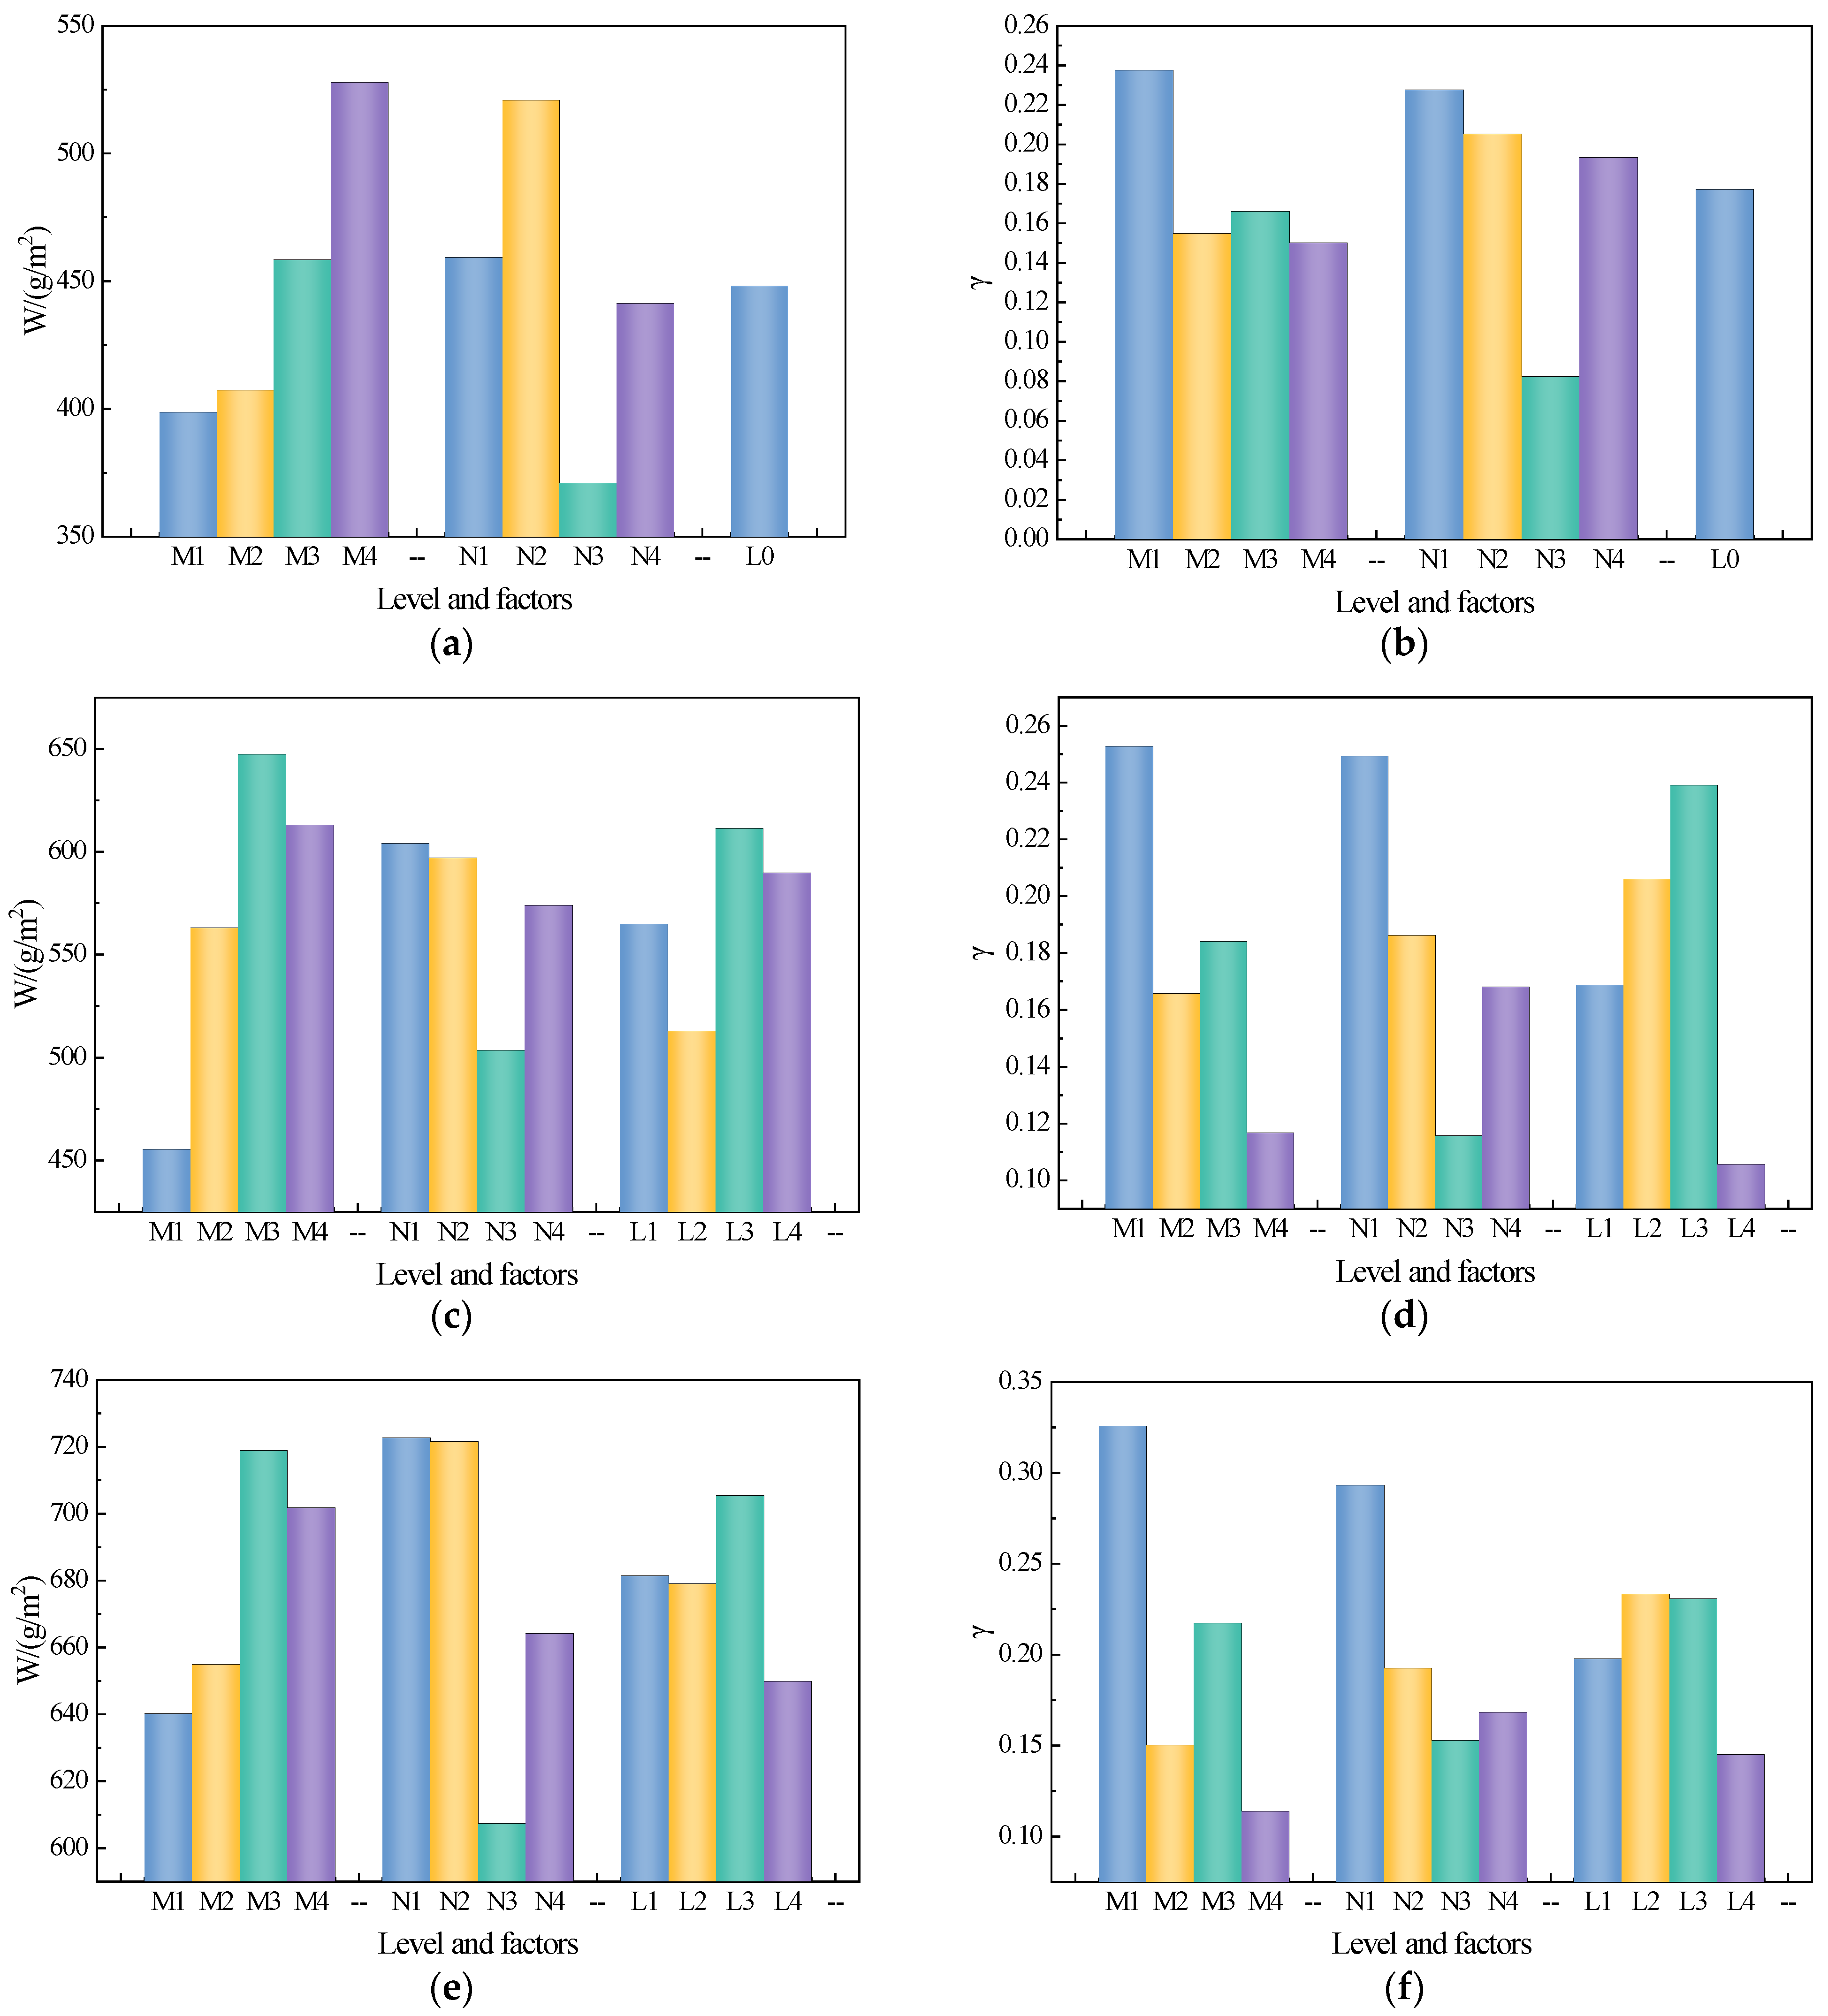
Based on the orthogonal test results, visual and range analyses were conducted on the unit-area moisture absorption and unit-area moisture absorption-desorption hysteresis ratio of the concrete without zeolite powder in Group A, the natural zeolite powder concrete in Group B, and the modified zeolite powder concrete in Group C. For each factor, the mean response at each level was calculated, and the range value
R, defined as the difference between the maximum and minimum level means, was used to compare the relative influence of the factors. Trend diagrams showing the effects of various factors on moisture-regulating performance were plotted, as shown in
Figure 6. The corresponding range-analysis results for unit-area moisture absorption are summarized in
Table 4. For unit-area moisture absorption, a larger value indicates a stronger moisture adsorption and storage capacity of concrete in a high-humidity environment. For the unit-area moisture absorption–desorption hysteresis ratio, a smaller value indicates that the adsorbed moisture is more easily released, reflecting better moisture desorption capacity and humidity-response reversibility.
The range-analysis results show that, for Group B, the range values of the water-to-cement ratio, sand ratio, and zeolite powder content were 191.85, 100.37, and 98.52 g/m2, respectively. Therefore, the order of influence on unit-area moisture absorption was water-to-cement ratio > sand ratio > zeolite powder content. For Group C, the corresponding range values were 78.80, 115.37, and 55.59 g/m2, respectively, giving the order sand ratio > water-to-cement ratio > zeolite powder content. The results indicate that thermal modification changed the relative sensitivity of moisture absorption to the investigated mixture parameters.
As shown in
Figure 6a,b, the results of Group A show that the moisture-regulating performance of concrete without zeolite powder was mainly affected by the water-to-cement ratio and sand ratio. The optimal combination for unit-area moisture absorption was M4N2L0, corresponding to a water-to-cement ratio of 0.51, a sand ratio of 38%, and no zeolite powder. The favorable combination for minimizing the unit-area moisture absorption–desorption hysteresis ratio was M4N3L0, corresponding to a water-to-cement ratio of 0.51, a sand ratio of 40%, and no zeolite powder. These results confirm that the moisture-regulating performance of the control concrete was primarily governed by the water-to-cement ratio and sand ratio within the investigated range.
As shown in
Figure 6c–f, the results of Groups B and C show that natural zeolite powder concrete and modified zeolite powder concrete exhibited the same optimal factor combination for unit-area moisture absorption, namely M3N1L3, corresponding to a water-to-cement ratio of 0.46, a sand ratio of 36%, and a zeolite powder content of 15%. For the unit-area moisture absorption–desorption hysteresis ratio, both groups also exhibited the same optimal combination, M4N3L4, corresponding to a water-to-cement ratio of 0.51, a sand ratio of 40%, and a zeolite powder content of 20%. The identical favorable combinations obtained for Groups B and C indicate that the three mixture parameters influenced the moisture-regulating response in a coupled manner. The water-to-cement ratio and sand ratio were associated with the matrix and moisture-transport pathways, whereas the zeolite content contributed to the measured moisture-storage response.
The favorable combination for moisture absorption was not identical to that for the hysteresis ratio, indicating that greater moisture uptake does not necessarily correspond to better moisture-release performance. Moisture absorption is related to available adsorption and storage space, whereas the hysteresis ratio reflects the ease of moisture release. Therefore, practical mix-proportion optimization should balance moisture absorption capacity and desorption reversibility according to engineering requirements.
The visual analysis showed that Groups B and C had the same favorable factor combinations, while Group C exhibited higher measured moisture-regulating performance. Overall, the water-to-cement ratio, sand ratio, and zeolite powder content had a coupled influence within the investigated range. The M3N1L3 combination was more favorable for achieving higher unit-area moisture absorption, whereas M4N3L4 was more favorable for reducing the unit-area moisture absorption–desorption hysteresis ratio.
3.5. Compressive Strength of Zeolite Concrete
The 28-day compressive strengths of the three concrete groups are presented in
Table 5. Across the 16 investigated mixture proportions, the compressive strengths of the control concrete, natural-zeolite concrete, and thermally modified-zeolite concrete ranged from 30.4 to 49.5 MPa, 30.4 to 48.1 MPa, and 30.0 to 47.7 MPa, respectively. Their corresponding mean values were 40.05, 39.43, and 39.24 MPa.
Compared with the control concrete, the mean compressive strengths of the natural-zeolite and thermally modified-zeolite concrete decreased by approximately 1.55% and 2.02%, respectively. The mean difference between the natural-zeolite and thermally modified-zeolite groups was only approximately 0.48%. For the individual mixture proportions, the thermally modified-zeolite concrete exhibited a higher compressive strength than the natural-zeolite concrete in some cases and a lower strength in others. Therefore, thermal modification did not produce a consistent increase or decrease in compressive strength.
The variation in compressive strength was more strongly associated with the water-to-cement ratio than with the condition of the zeolite powder. In all three groups, the mixtures with lower water-to-cement ratios generally exhibited higher compressive strengths, whereas the strength decreased as the water-to-cement ratio increased. The range analysis similarly indicated that the water-to-cement ratio was the dominant factor affecting compressive strength, while the effects of sand ratio and zeolite content were comparatively smaller.
Overall, within the investigated mixture range, the incorporation of thermally modified zeolite caused only a limited change in the average 28-day compressive strength compared with both the control and natural-zeolite concrete. The use of thermally modified zeolite therefore did not result in a pronounced systematic loss of compressive strength under the investigated conditions.
4. Model Prediction
4.1. Multilayer Perceptron Model
Artificial neural networks have become widely used nonlinear data modeling methods because of their self-organization, self-learning ability, and capability to approximate arbitrary nonlinear mappings. Their theoretical basis is inspired by the information-processing mechanism of biological neural networks [
37]. The multilayer perceptron (MLP) is a typical feedforward neural network, generally consisting of an input layer, one or more hidden layers, and an output layer. Neurons in different layers are connected by weights and biases. Input information is transmitted to the output layer after nonlinear transformation through the hidden layers, thereby approximating complex mapping relationships between input variables and target variables. Previous studies have shown that MLP models are well suited to predicting the performance of civil engineering materials, particularly for nonlinear regression problems under the coupled effects of multiple factors [
38].
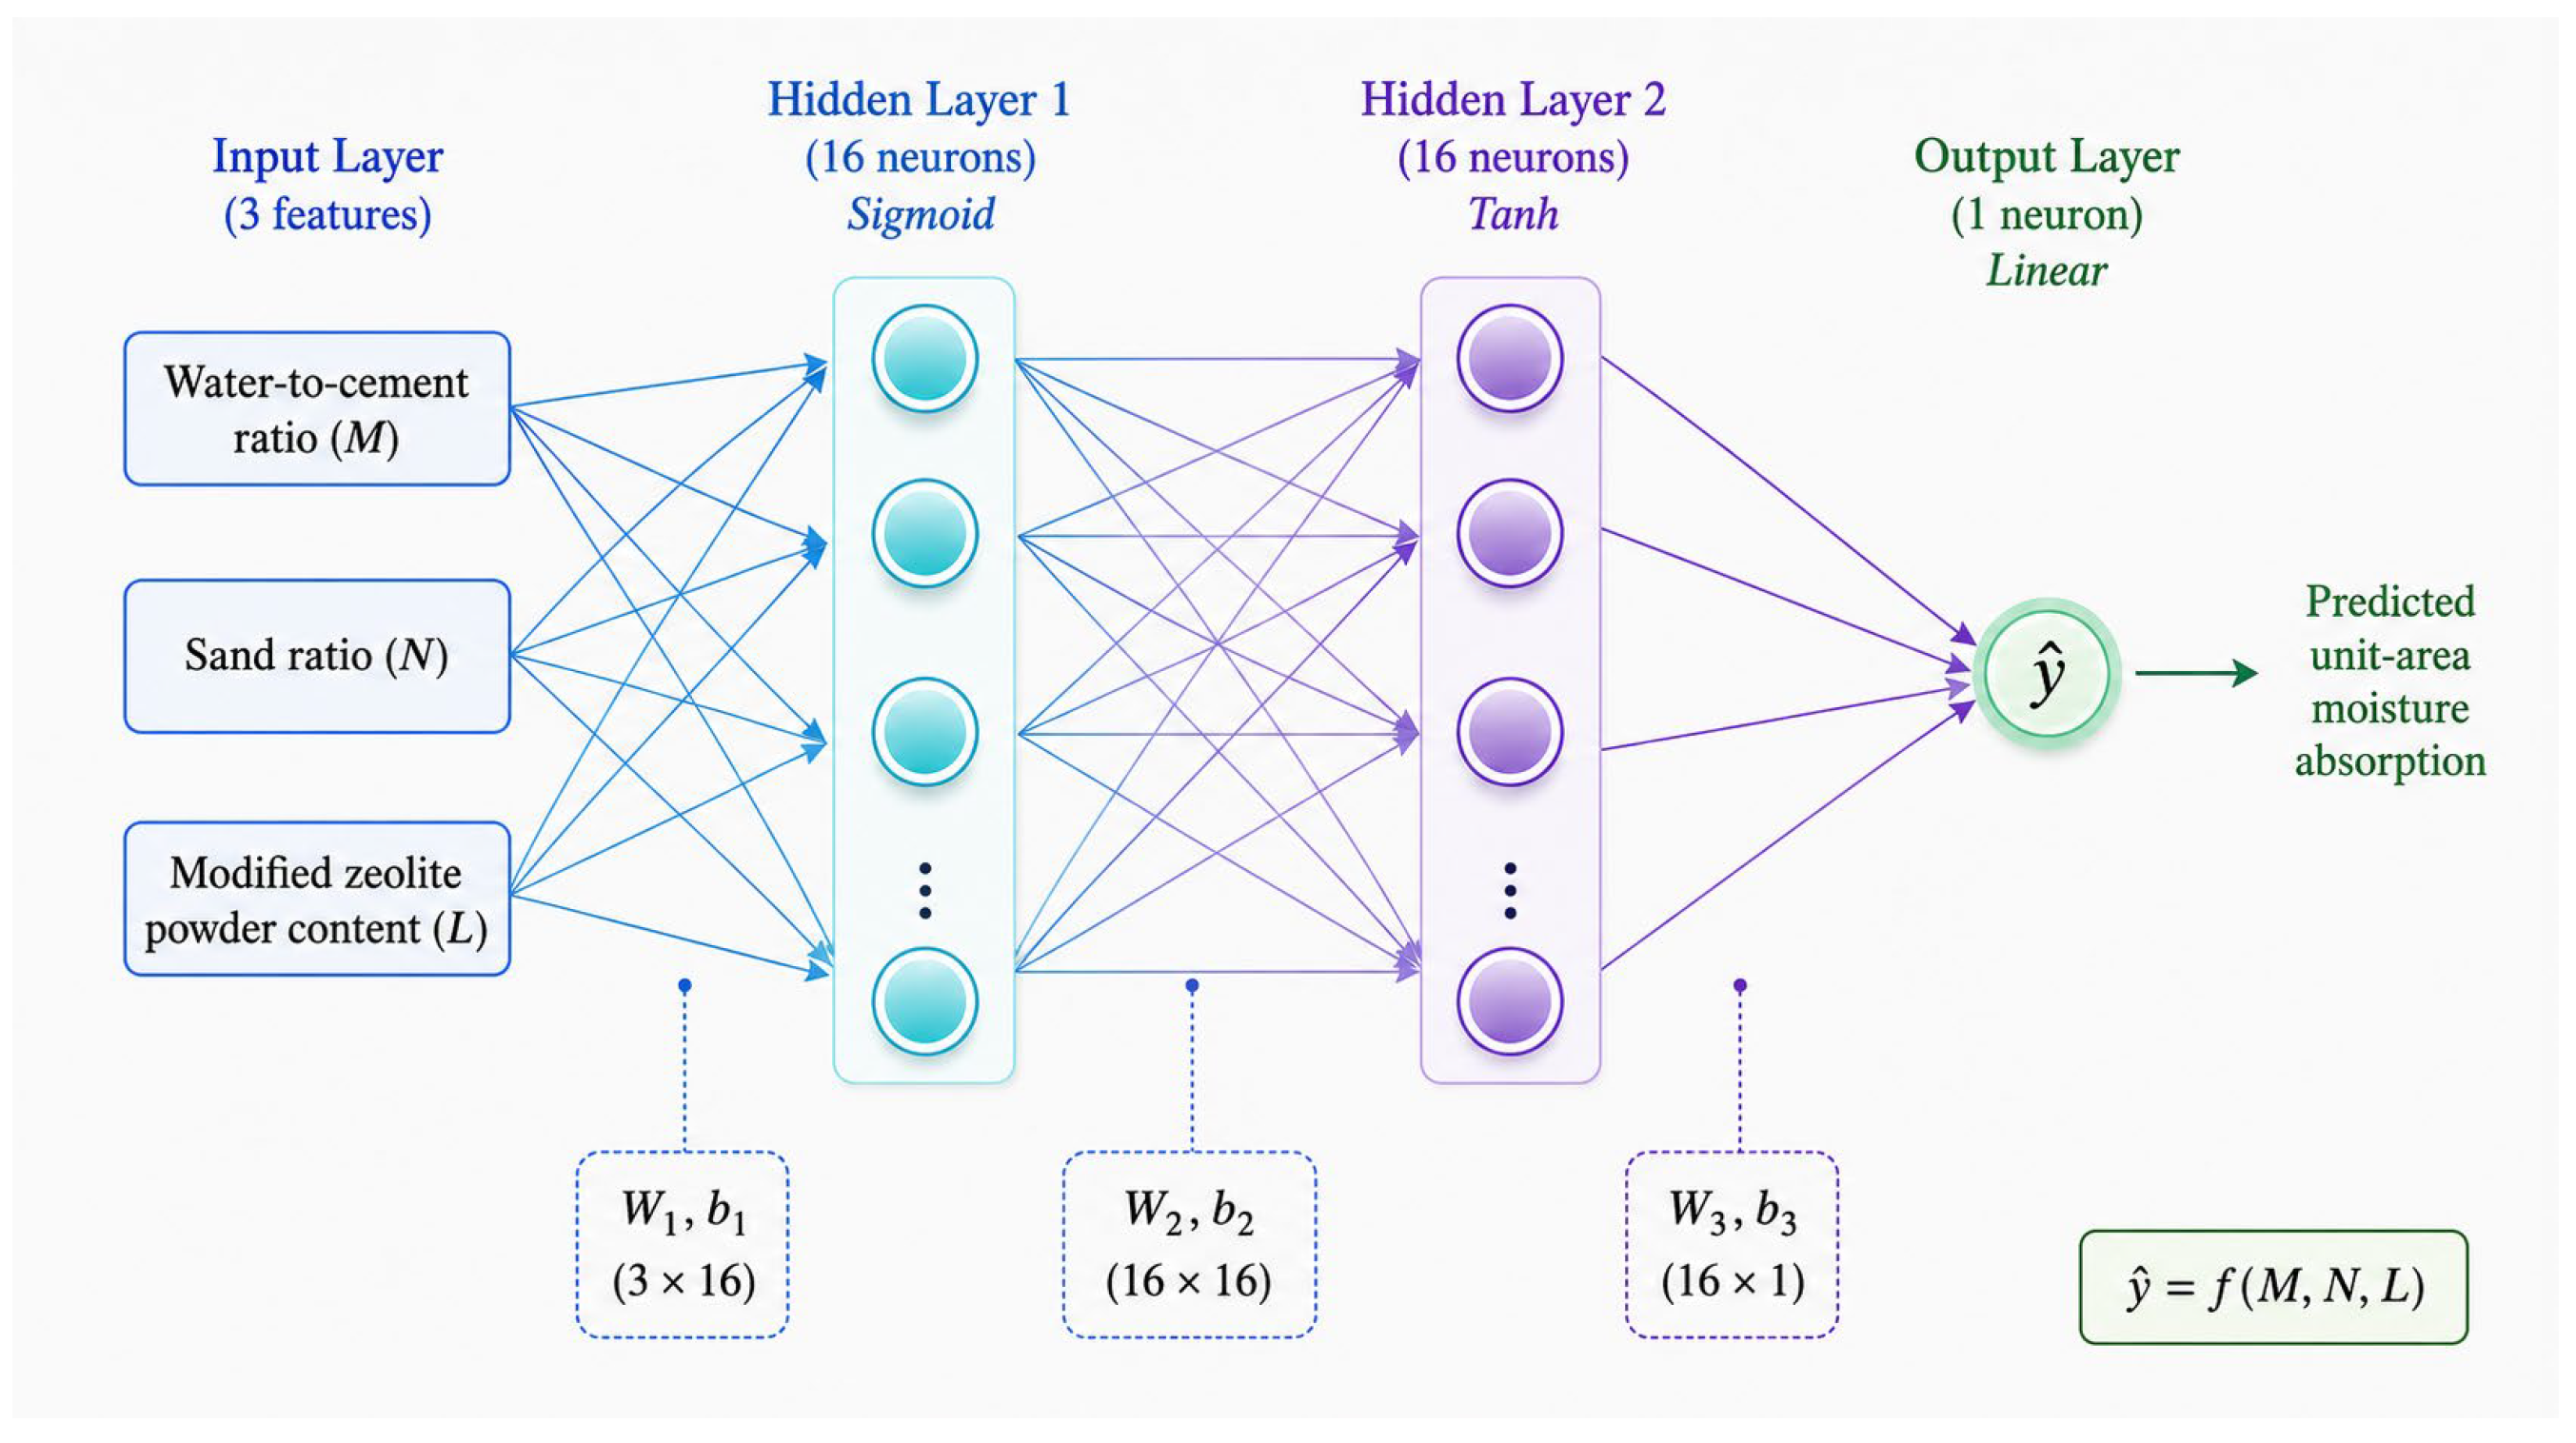
Figure 7 shows the schematic structure of the MLP network. In an MLP network, the input and output of the
j-th neuron in the
l-th layer can be expressed as follows:
where
is the connection weight between the i-th neuron in the (
l − 1)-th layer and the
j-th neuron in the
l-th layer;
is the corresponding bias term;
is the output of the preceding layer; and
is the activation function. In the present study, the network weights and biases were estimated by minimizing the regression loss using the internal training solver of MATLAB R2024b’s fitrnet function. This internal network-training process was distinct from the outer MMGO optimization procedure.
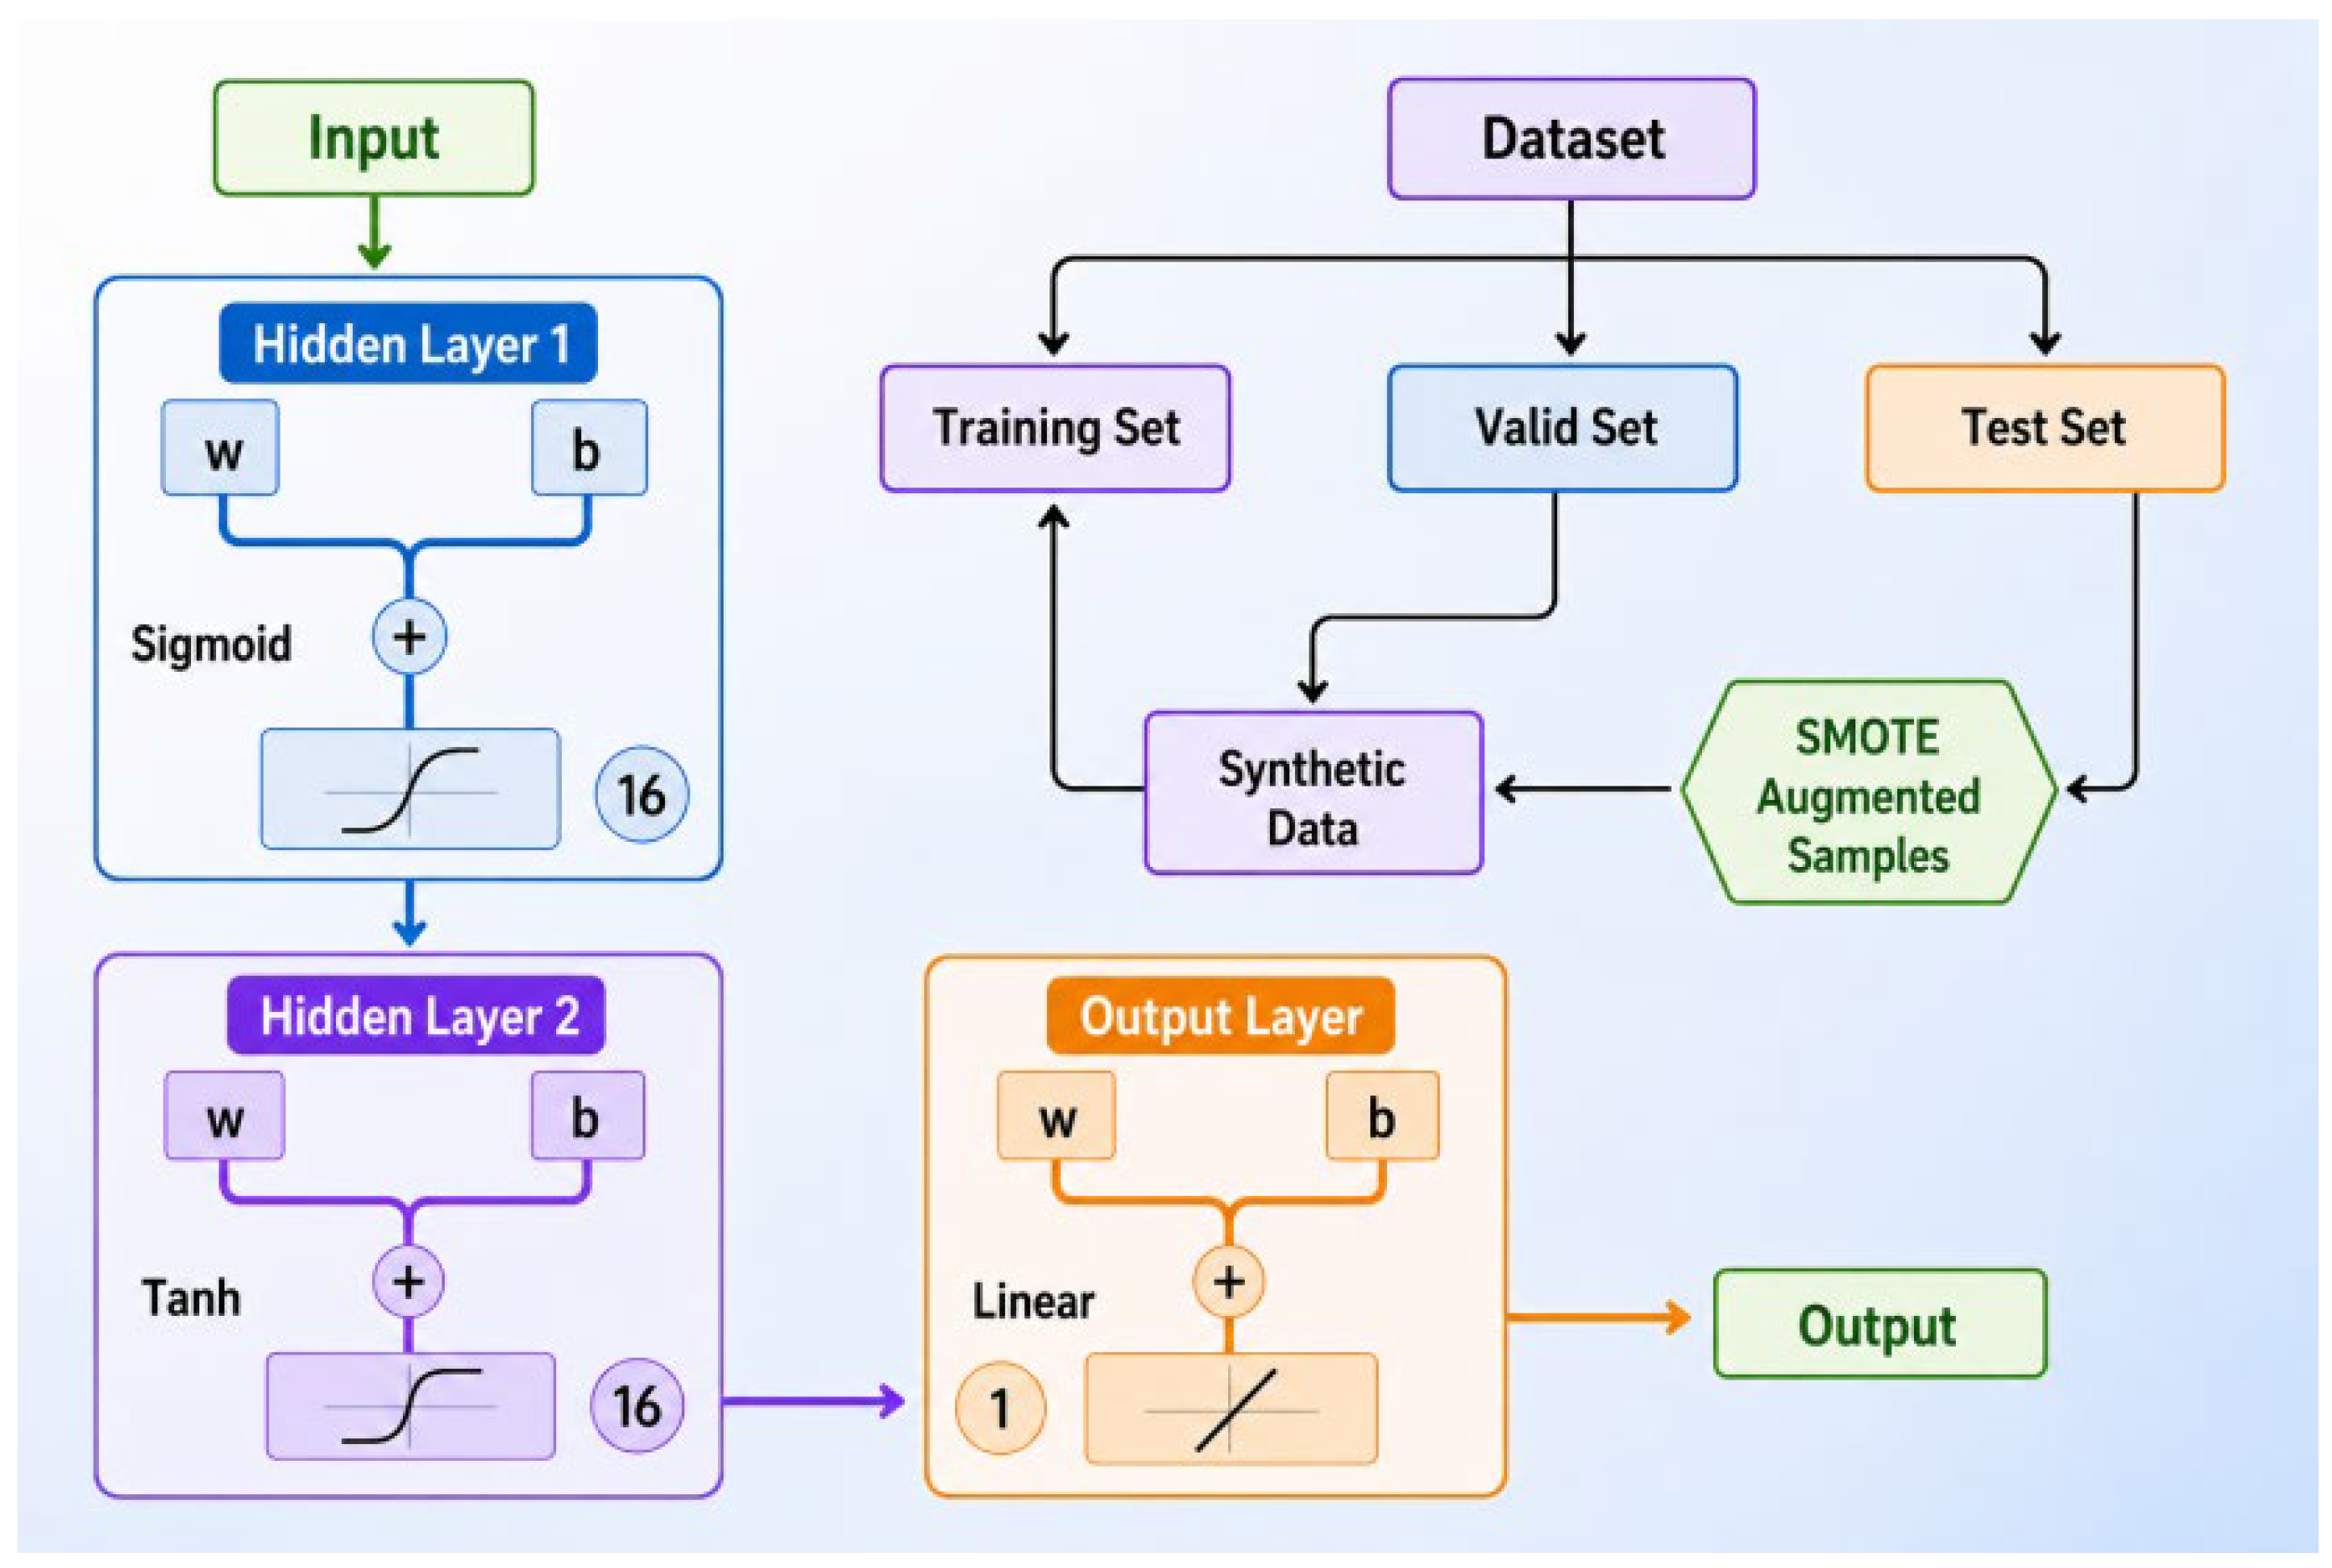
In this study, the water-to-cement ratio, sand ratio, and modified zeolite powder content were used as input variables, while the unit-area moisture absorption of thermally modified zeolite concrete was used as the output variable. A three-input and one-output MLP prediction model was established. The network architecture was predefined as two hidden layers with 16 neurons in each layer. The first and second hidden layers used Sigmoid and Tanh activation functions, respectively, while the single-neuron output layer used a linear activation function. The number of hidden layers, the number of neurons, and the activation functions were fixed and were not included in the MMGO optimization variables. Its mathematical mapping relationship can be expressed as follows:
where
ŷ is the unit-area moisture absorption predicted by the MLP model; (M), (N), and (L) represent the water-to-cement ratio, sand ratio, and modified zeolite powder content, respectively; and
denotes the weights and biases of the predefined MLP architecture. Since the moisture-regulating performance of modified zeolite concrete is jointly affected by the pore structure of the cement matrix, the adsorption capacity of zeolite pores, moisture migration paths, and hydration reactions of cementitious materials, the variables are expected to exhibit nonlinear relationships. Therefore, the MLP model can effectively learn the intrinsic relationship between different mix proportion parameters and moisture absorption.
4.2. Dataset Establishment and Sample Augmentation
In this study, the machine learning dataset was established based on the orthogonal experimental results. Each sample consisted of input variables and an output variable. The input variables were the water-to-cement ratio, sand ratio, and modified zeolite powder content, while the output variable was the corresponding unit-area moisture absorption of the specimen. Since the experimental data were obtained from a limited number of orthogonal tests, the sample size was relatively small. However, MLP training generally requires a sufficient number of samples. If the original samples were directly used for training, the model might overfit local data, thereby reducing its prediction stability for unknown mix proportions. Therefore, the Synthetic Minority Over-sampling Technique (SMOTE) was adapted for the present regression task to augment the original dataset.
The original experimental dataset contained 32 samples, including 16 mixtures from Group A and 16 mixtures from Group C. A total of 637 synthetic samples were generated through interpolation-based augmentation, resulting in an augmented dataset of 669 samples. The pooled augmented dataset was randomly shuffled and divided into training, validation, and test sets at a ratio of 8:1:1, corresponding to 535, 67, and 67 samples, respectively. In the present implementation, sample augmentation was performed before dataset splitting, after which the augmented dataset was randomly shuffled and divided into training, validation, and test subsets. The reported model performance therefore represents prediction within the investigated mixture-design range and the present data-processing framework.
SMOTE was originally developed to address class-imbalance problems. Its basic principle is to generate new synthetic samples through linear interpolation between existing samples and their neighboring samples, thereby expanding the sample space and improving the model’s ability to learn the data distribution [
39]. In the regression prediction task of this study, SMOTE was not used for class balancing; instead, its nearest-neighbor interpolation principle was adapted to generate synthetic regression samples by simultaneously interpolating the input variables and the continuous output. Interpolation was performed simultaneously in both the input-variable space and the output-variable space to ensure that the newly generated samples still conformed to the variation trend of the original experimental data. For an original sample (
), one sample was randomly selected from its
k nearest neighbors (
), and a new synthetic sample was generated according to the following equations:
where
and
are the input-variable vectors of the original sample and its neighboring sample, respectively;
and
are the corresponding unit-area moisture absorption values; and
λ is a random number between 0 and 1. The samples generated by this method are located between the original sample and its neighboring sample. This approach can expand the dataset while avoiding the distortion of data distribution that may result from completely random sample generation.
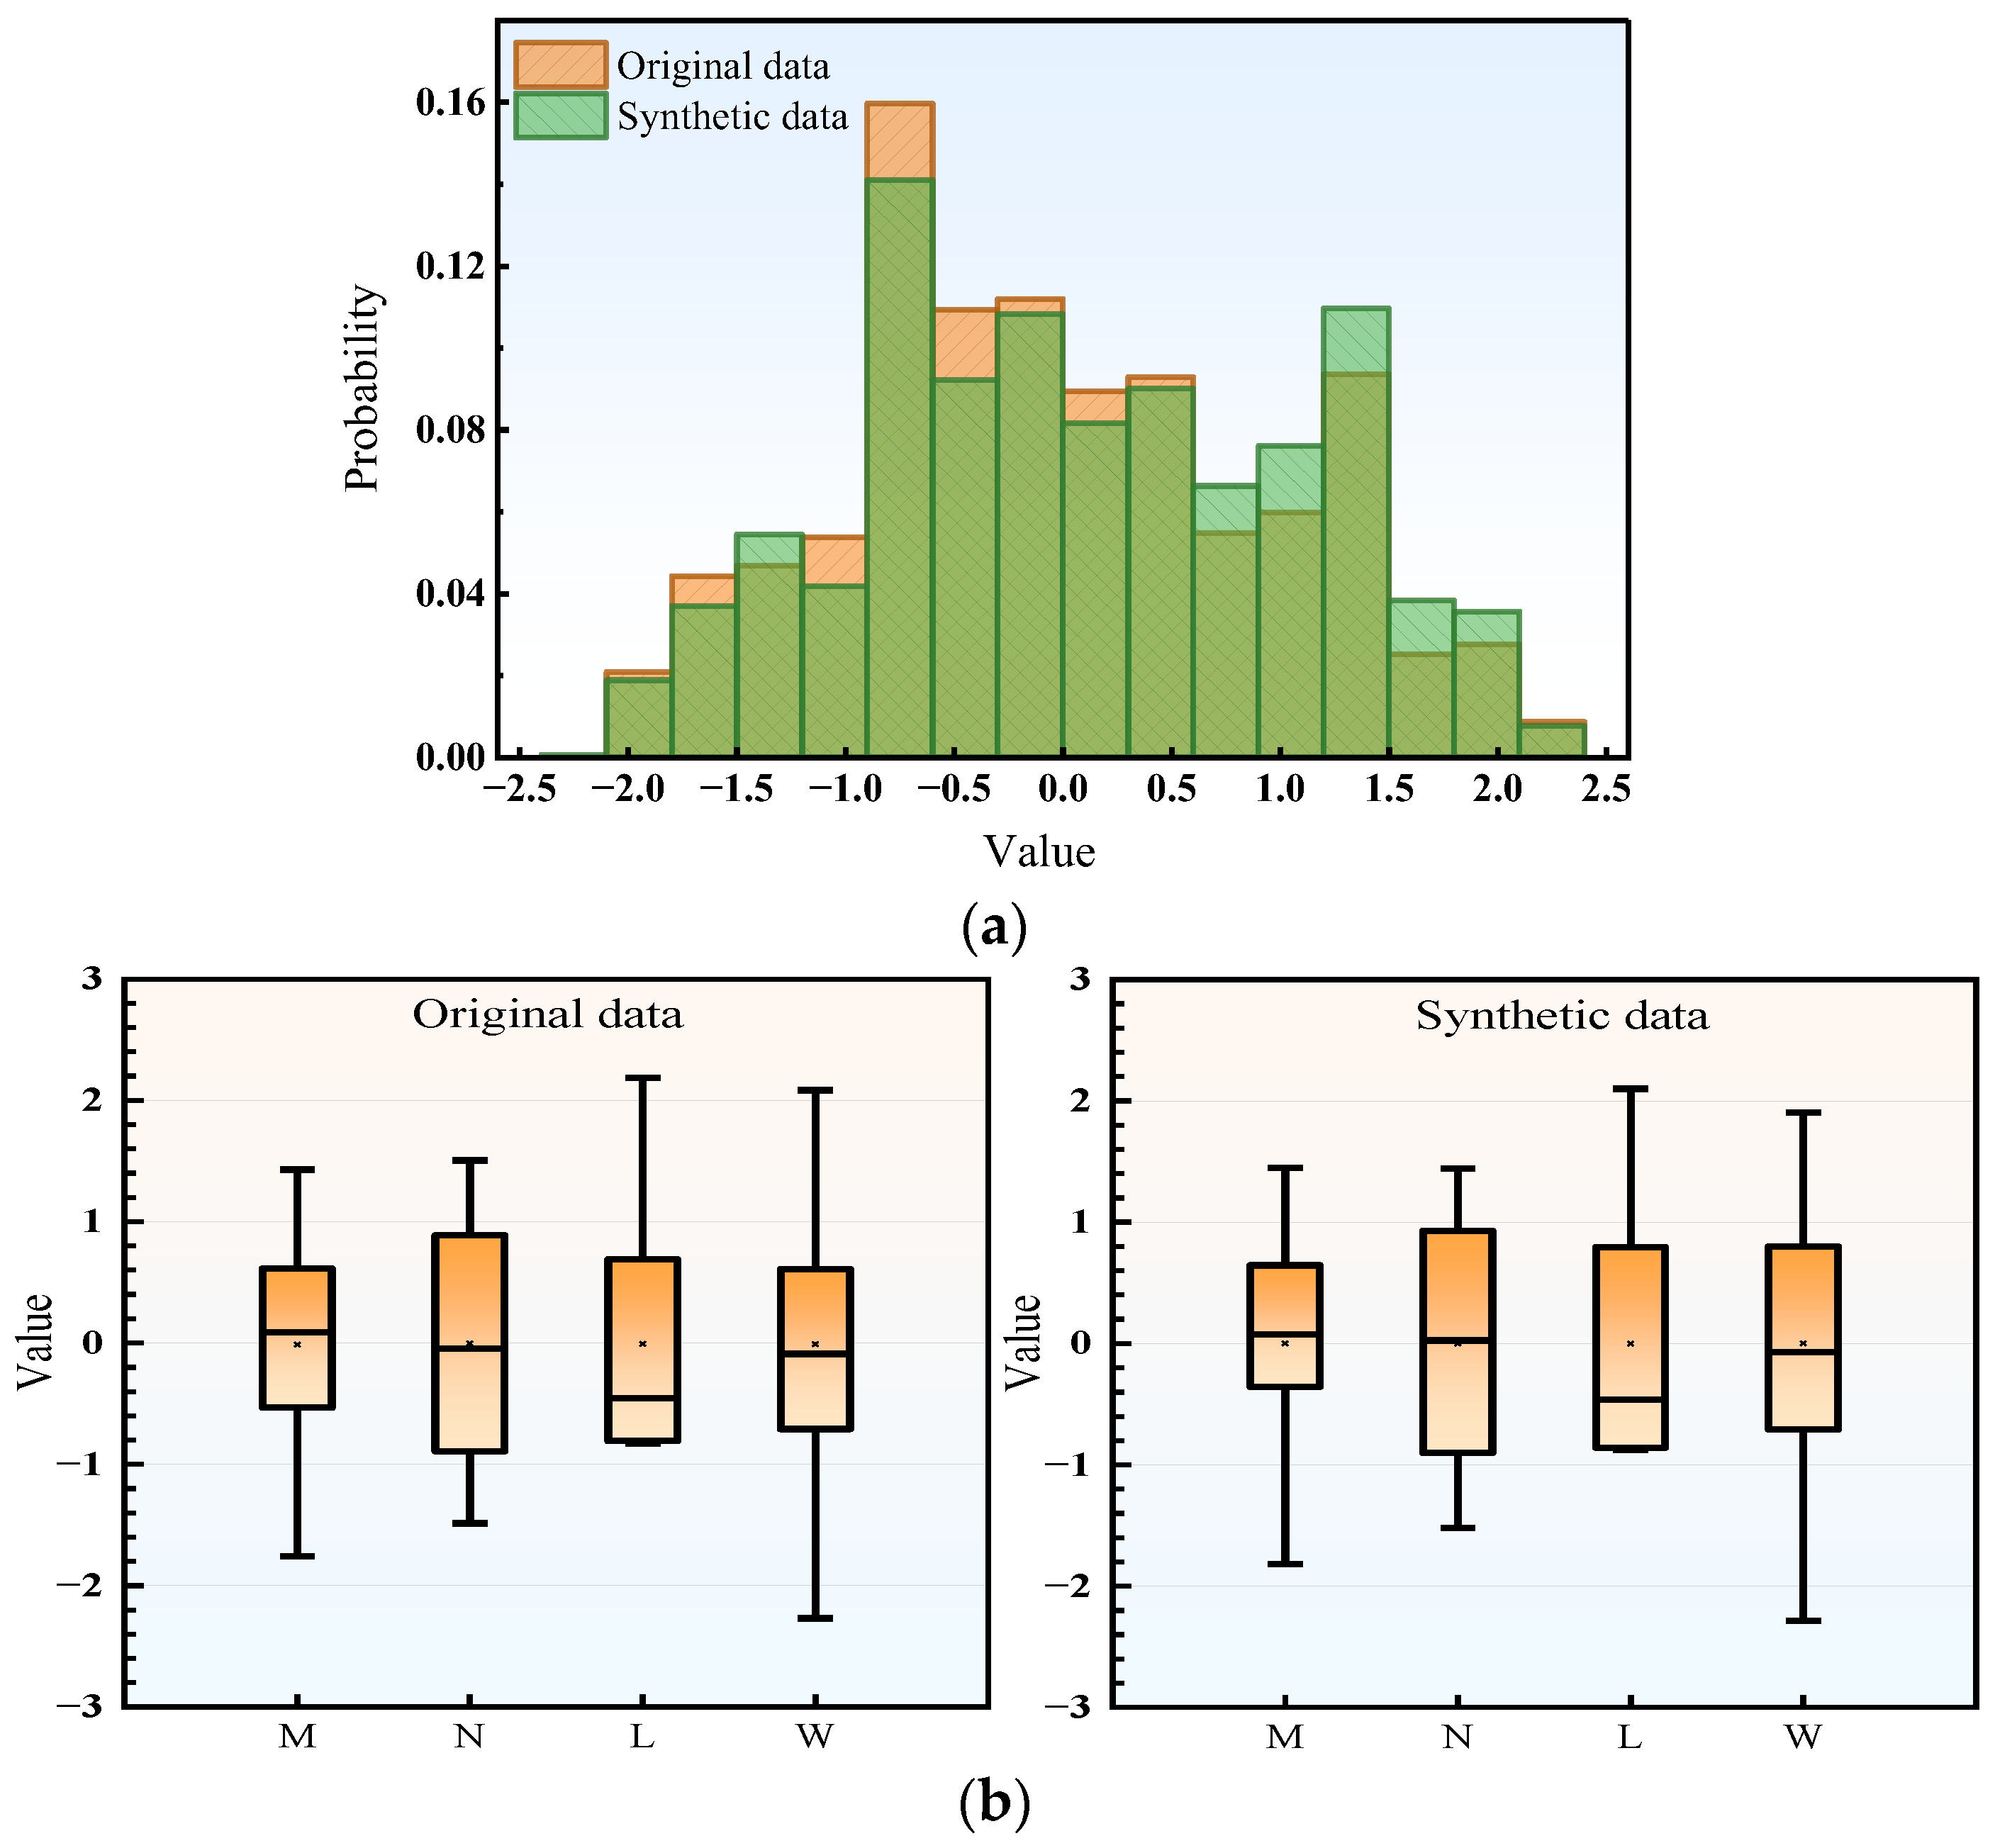
During the sample augmentation process, the ranges of the generated water-to-cement ratio, sand ratio, and zeolite powder content were constrained to ensure the physical rationality of the synthetic samples and to prevent them from exceeding the parameter ranges of the experimental design. The distributions of the original and synthetic samples were then compared, as shown in
Figure 8. The superimposed histograms and box plots of the original and synthetic data show that the overall distribution of the augmented samples was consistent with that of the original samples, without obvious abnormal outliers. This indicates that the SMOTE method can increase the sample size while maintaining the statistical characteristics of the original data, thereby providing a larger dataset for subsequent MLP training.
4.3. Construction and Parameter Optimization of the MLP Model
After dataset augmentation, the samples were divided into training, validation, and test sets at a ratio of 8:1:1. The training set was used for MLP parameter learning, the validation set was used for fitness evaluation and model selection during the MMGO optimization process, and the test set was used for the final evaluation of model performance. To eliminate the influence of dimensional differences among different input variables on model training, the input variables were normalized before model training:
where
x′ is the normalized variable value;
x is the original variable value; and
and
are the minimum and maximum values of the variable in the dataset, respectively.
In this study, the MLP architecture was predefined as two hidden layers with 16 neurons each, using Sigmoid and Tanh activation functions, respectively. These architectural settings were not included in the mapping-improved Mountain Gazelle Optimizer (MMGO) search space. MMGO was employed as an outer-loop optimizer for the selected model hyperparameters. For each candidate hyperparameter setting generated by MMGO, the corresponding MLP weights and biases were estimated using the internal training solver of MATLAB’s fitrnet function, and the validation-set RMSE was returned as the MMGO fitness value. The maximum number of internal MLP training epochs was set to 70, and the batch size was set to 50. A fixed learning rate was not manually specified because the iterative step size was determined internally by the training algorithm. The training process terminated when the maximum number of 70 epochs was reached or when the internal convergence criterion was satisfied.
The Mountain Gazelle Optimizer (MGO) is a swarm intelligence optimization algorithm inspired by the social behavior of mountain gazelles. This algorithm realizes global exploration and local exploitation in the search space by simulating the behaviors of territorial males, maternity herds, bachelor male groups, and foraging migration [
40]. In MGO, each mountain gazelle individual represents a candidate solution, and the population continuously updates individual positions to search for the optimal solution. The initialization process can be expressed as follows:
where
is the
i-th candidate solution;
lb and
ub are the lower and upper bounds of the parameter search space, respectively; and
r is a random number between 0 and 1.
However, the standard MGO still has certain limitations, such as insufficient population diversity, a relatively limited search range, unbalanced search abilities among different groups, and possible premature convergence or local stagnation in complex multimodal problems [
41]. To overcome these limitations, MMGO introduces a chaotic mapping mechanism based on MGO. The mapping function is used to improve the initial population or random variables during the search process, making the population distribution in the search space more uniform and enhancing the algorithm’s global search ability and capacity to escape local optima. Referring to the MMGO method proposed by Lai et al., the logistic map was adopted in this study for improvement, which can be expressed as follows [
42]:
where
is the chaotic variable at the
n-th iteration, and
μ is the control parameter.
When
μ = 4 and
, the logistic map can generate a chaotic sequence with good ergodicity. This sequence can be mapped into the MLP parameter search space as follows:
where
is the value of the
j-th parameter in the i-th candidate solution; and
and
are the lower and upper bounds of the
j-th parameter, respectively.
The MMGO population size was set to 5, and the maximum number of evolutionary iterations was set to 3. The Bayesian optimization procedure was also conducted for 3 iterations. The validation-set RMSE was adopted as the fitness function. The best fitness values obtained during the three MMGO iterations were 0.1432, 0.1312, and 0.1268, respectively. The optimization terminated when the prescribed maximum number of iterations was reached.
Previous benchmark studies have reported that MMGO can improve population diversity and global exploration relative to the standard MGO [
42]. In the present study, MMGO was adopted as the optimizer of the complete prediction framework; however, the individual contribution of the mapping strategy relative to the standard MGO was not separately evaluated.
The workflow of the MMGO-MLP model was as follows. First, the original experimental data were normalized and augmented using SMOTE. Second, the augmented dataset was divided into training, validation, and test sets. Third, MMGO generated candidate values for the selected MLP hyperparameters using a population size of 5. For each candidate setting, an MLP with the fixed 16–16 hidden-layer architecture was trained using the internal fitrnet solver, and the validation-set RMSE was calculated as the fitness value. The candidate population was updated for three evolutionary iterations. Finally, the MLP model corresponding to the best hyperparameter setting was retained, and its prediction performance was evaluated using the test set. The overall model architecture and optimization workflow are shown in
Figure 9.
4.4. Performance Comparison of Different Prediction Models
4.4.1. Ablation Analysis of the Model Components
To evaluate the individual and combined contributions of sample augmentation and MMGO optimization, an ablation analysis was conducted using four model configurations: (a) a plain MLP trained using the 32 original experimental samples; (b) an MLP trained using the augmented dataset without MMGO optimization; (c) an MMGO-optimized MLP trained using the original experimental dataset; and (d) the complete augmented MMGO-MLP model. The same input variables, output variable, basic network architecture, data-partitioning strategy, and performance metrics, including mean absolute error (MAE), root mean square error (RMSE), and coefficient of determination (R
2), were used to ensure comparability among the four configurations. The results are presented in
Table 6.
As shown in
Table 6, the plain MLP produced an MAE of 25.5563 g/m
2, an RMSE of 30.8455 g/m
2, and an R
2 of 0.9704. After sample augmentation was introduced without MMGO optimization, the MAE and RMSE decreased to 17.6618 g/m
2 and 27.8294 g/m
2, respectively, indicating that the increased sampling density improved the average prediction error, although the R
2 decreased slightly to 0.9626.
When MMGO optimization was applied to the original dataset, the MAE and RMSE were further reduced to 16.4678 g/m2 and 21.9562 g/m2, respectively. However, the corresponding R2 was 0.9402, indicating that MMGO primarily reduced the absolute prediction errors in this configuration but did not improve all evaluation indicators simultaneously.
The complete augmented MMGO-MLP model achieved the lowest MAE and RMSE, 14.5509 g/m2 and 19.6264 g/m2, respectively, together with the highest R2 of 0.9814. Compared with the plain MLP, the complete model reduced the MAE and RMSE by approximately 43.06% and 36.37%, respectively. These results indicate that sample augmentation and MMGO optimization provided complementary improvements when they were combined, whereas neither component independently improved every evaluation metric.
4.4.2. Comparison with Baseline Regression Models
To evaluate the applicability of the MLP model in predicting the unit-area moisture absorption of thermally modified zeolite concrete, it was compared with decision tree regression (DTR), least squares boosting (LS Boost), and random forest regression (RFR) models. MAE, RMSE, and R2 were used as the model-performance evaluation indicators.
DTR, LS Boost, and RFR are commonly used machine learning regression models. Decision tree regression establishes prediction relationships by recursively partitioning the sample data and is characterized by a simple and interpretable structure. LS Boost improves model accuracy by combining multiple weak learners and continuously correcting prediction errors. Random forest regression consists of multiple decision trees and improves model stability and generalization ability through ensemble averaging.
The prediction results of different models on the test set are shown in
Table 7. As shown in
Table 7, the MLP model exhibited good prediction performance on the test set. Its MAE and RMSE were lower than those of the other comparison models, and its R
2 was the highest, indicating that the MLP model could more accurately fit the relationship between mix proportion parameters and unit-area moisture absorption. The prediction results of the decision tree model were relatively close to those of the MLP model, but its overall accuracy was slightly lower. The LS Boost and random forest models showed relatively larger errors, indicating that these models were less accurate for the present prediction task under the investigated data conditions.
Overall, the moisture-regulating performance of thermally modified zeolite concrete is jointly affected by factors such as the water-to-cement ratio, sand ratio, and zeolite powder content, and there is a certain nonlinear coupling relationship among these factors. The MLP model has strong nonlinear mapping capability and can effectively learn the complex relationship between input parameters and unit-area moisture absorption. Therefore, the MLP model was selected in this study for prediction and analysis of the moisture-regulating performance of thermally modified zeolite concrete.
4.5. Training and Performance Evaluation of the MLP Model
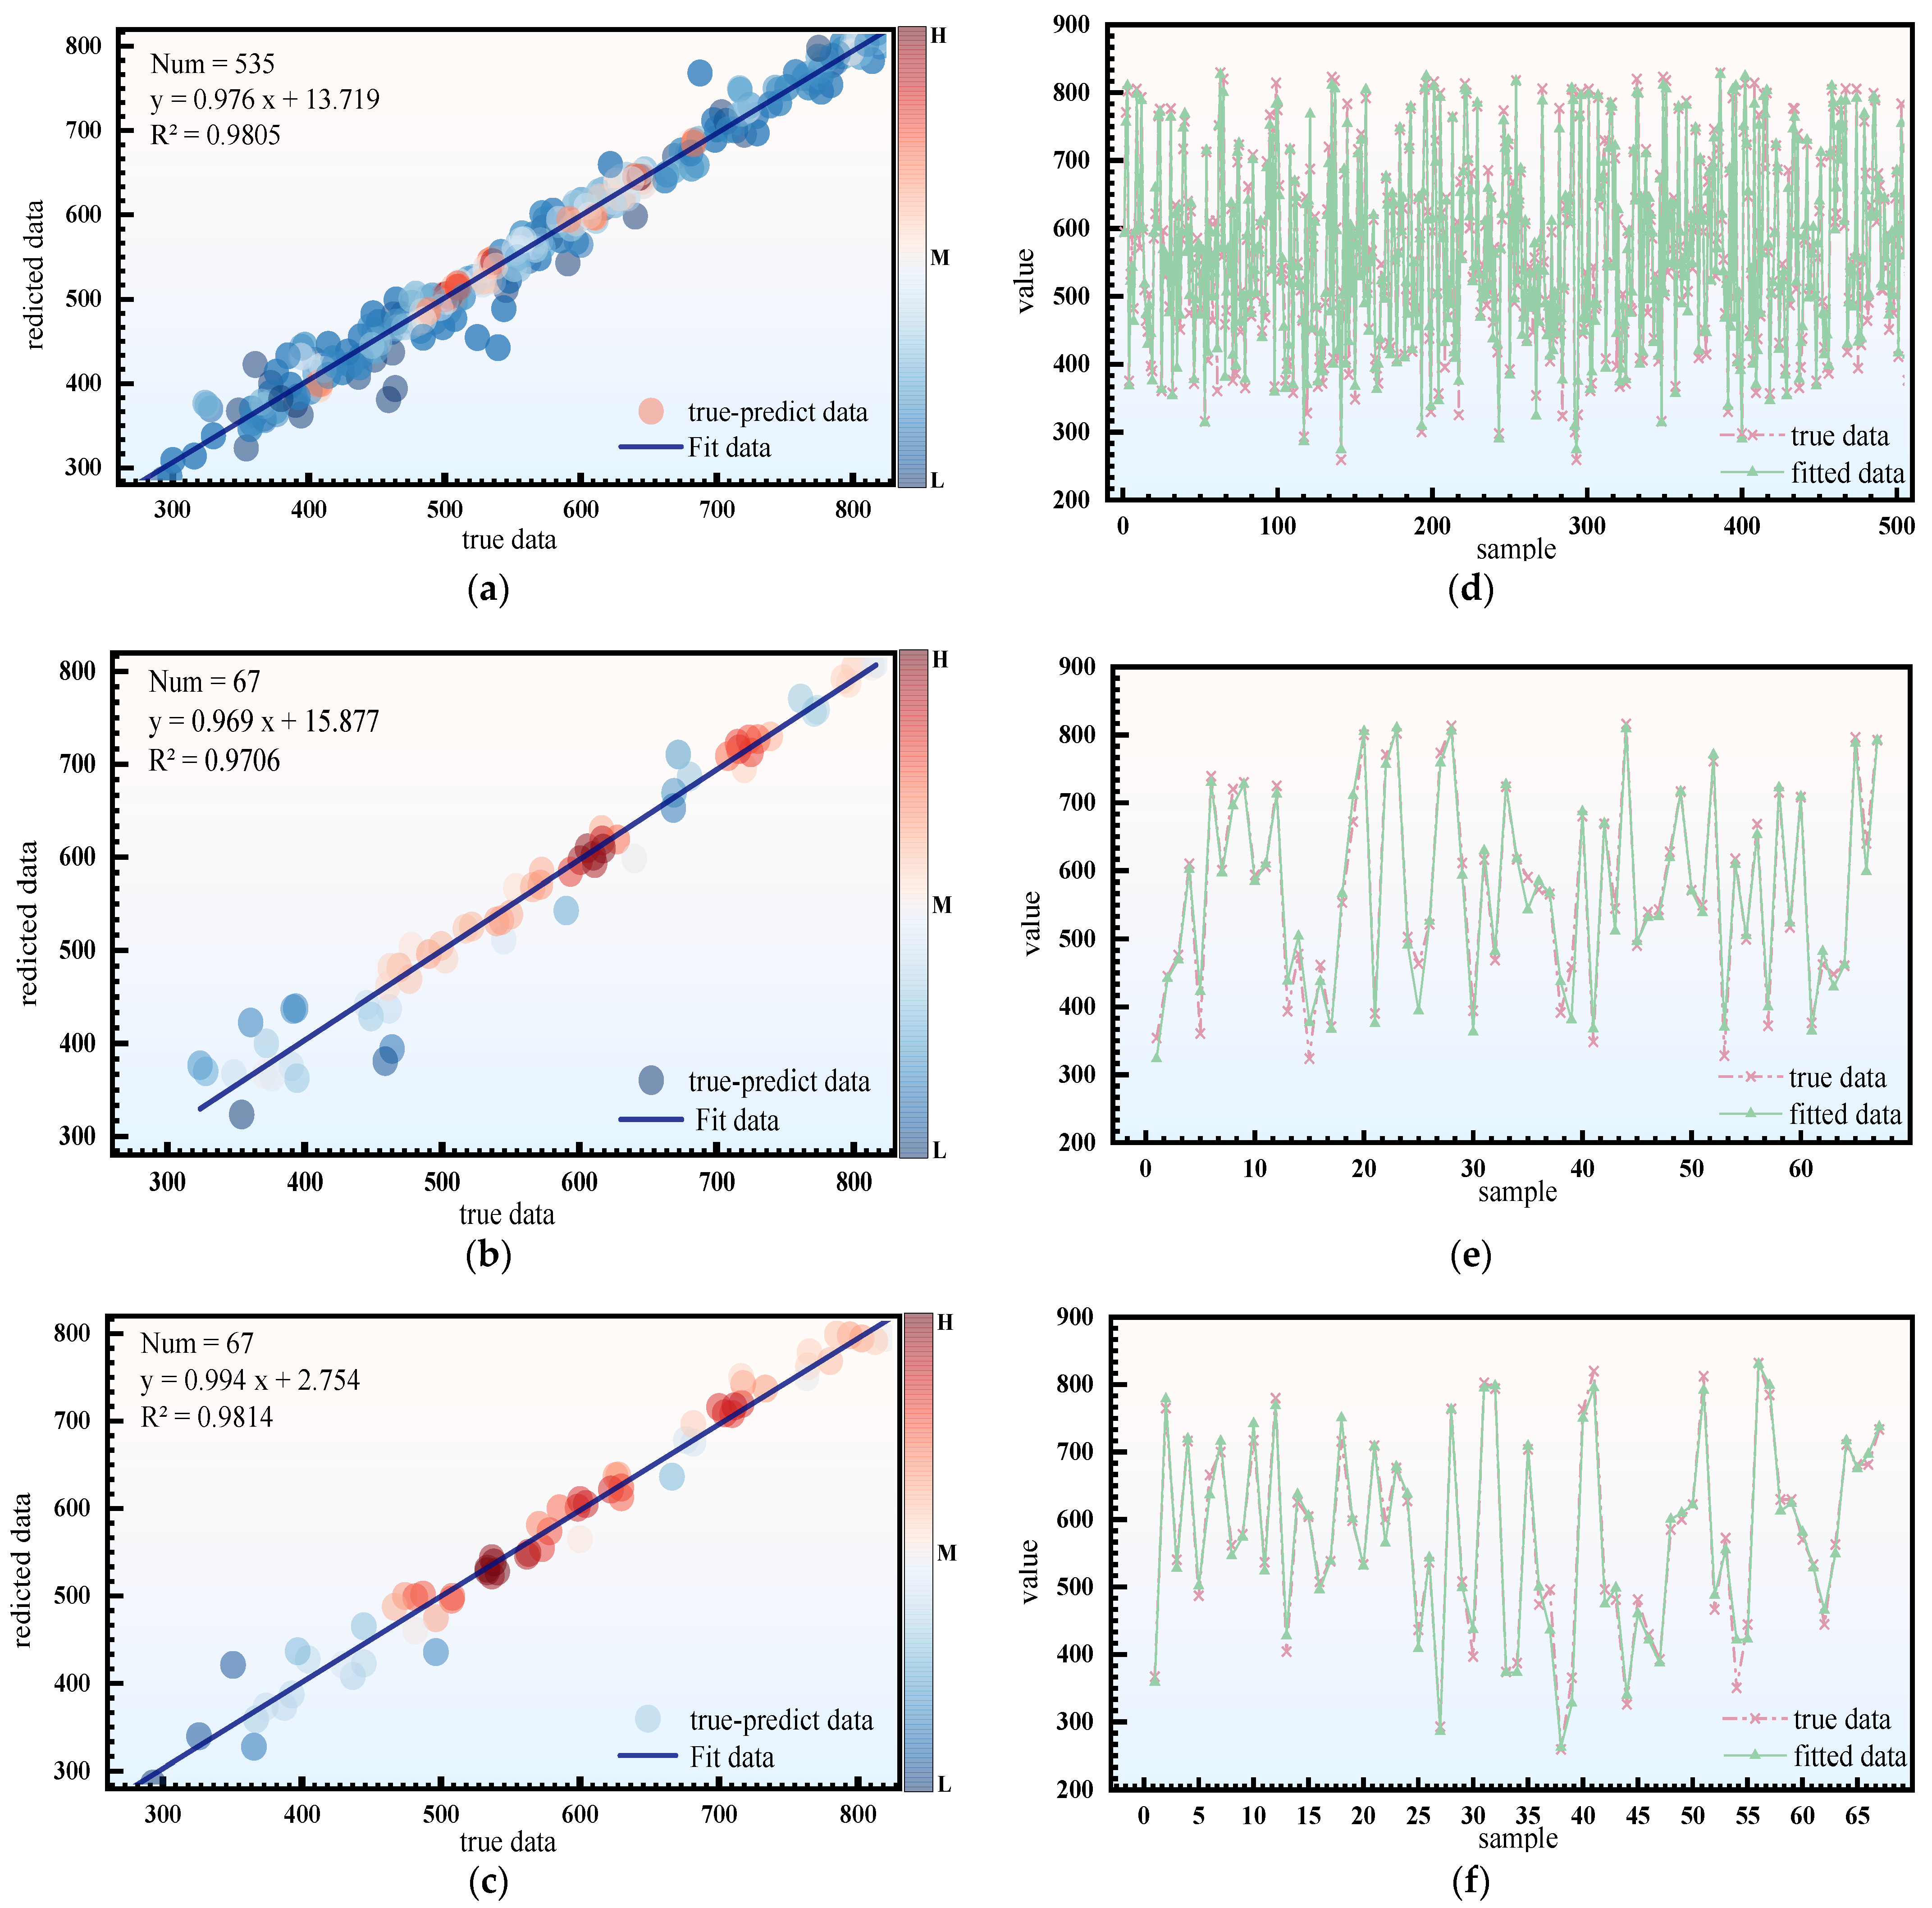
Based on the optimal parameters obtained through MMGO optimization, the MLP model was trained and its prediction performance was evaluated on the training, validation, and test sets. The density plots of the model training results and the comparison plots of predicted and experimental results are shown in
Figure 10. The evaluation indicators included mean absolute error (MAE), mean absolute percentage error (MAPE), root mean square error (RMSE), and coefficient of determination (R
2). Their calculation formulas are as follows:
where
is the experimental value;
is the predicted value;
is the mean experimental value; and n is the number of samples. Smaller MAE and RMSE values indicate lower prediction errors. A smaller MAPE value indicates a smaller relative error, while an R
2 value closer to 1 indicates a stronger ability of the model to explain the variation pattern of the experimental data.
As shown in
Table 8, the R
2 values of the MLP model on the training, validation, and test sets were 0.9805, 0.9706, and 0.9814, respectively, all of which were close to 1. This indicates that the model could accurately describe the nonlinear relationship between mix proportion parameters and unit-area moisture absorption. The MAE values of the training, validation, and test sets were 12.9001, 16.8939, and 14.5509, respectively, while the RMSE values were 18.6453, 24.2130, and 19.6264, respectively, indicating that the overall prediction errors were small. The MAPE values were 0.0251, 0.0359, and 0.0287, respectively, suggesting that the relative prediction errors were low. The relatively close metrics indicate that no pronounced train–validation performance gap was observed under the present data partition. However, because the original experimental dataset was small, overfitting cannot be completely excluded, and further validation using a larger independent dataset is required.
Figure 10 shows that the predicted values and experimental values of the training, validation, and test sets were in good agreement overall, and the data points were mainly distributed near the ideal fitting line. This indicates that SMOTE-based sample augmentation and MMGO-based parameter optimization can effectively improve the learning ability of the MLP model for small-sample nonlinear data. For thermally modified zeolite concrete, its moisture-regulating performance is jointly affected by the water-to-cement ratio, sand ratio, and modified zeolite powder content. Traditional empirical formulas are difficult to use for accurately describing the coupling effects among these factors. In contrast, the MMGO-MLP model established in this study can capture complex nonlinear patterns through a data-driven approach and achieve high-accuracy prediction of unit-area moisture absorption. Therefore, this model can serve as an effective tool for rapid evaluation of moisture-regulating performance and mix proportion optimization design of thermally modified zeolite concrete.