1. Introduction
Over the past decade, microplastics have emerged as a major focus within the medical and public health communities due to their ubiquity in the environment. Microplastics (MPs) and nanoplastics (NPs) are defined according to the size of the synthetic polymers, with microplastics having a diameter smaller than 5 mm and nanoplastics ranging from 1 to approximately 1000 nm in diameter [
1]. It is well-established that MPs are a significant contributor to global pollution; they are insoluble in water and non-biodegradable, allowing them to persist in the environment for extended periods of time [
1]. As larger plastic materials degrade, MPs and NPs can accumulate in the air, water, and soil and therefore in food systems, eventually cycling their way back from human waste and entering the human body. This extensive distribution of plastics in the environment facilitates entry into organisms through multiple pathways, including inhalation, consumption and absorption through skin contact [
2].
The detrimental effects of MPs and NPs on marine life are well documented, with studies demonstrating harmful effects of these pollutants on development, endocrine function, growth and reproductive systems across many aquatic species [
3]. However, more recently, attention has shifted toward their implications for human health. MPs have been detected in breast milk, blood, saliva, urine, semen and feces, as well as many organs including the lungs, liver, kidney and colon [
3,
4]. Once accumulated in the human body, microplastics have the potential to lead to a wide range of adverse health outcomes including cancer, cardiovascular disease, asthma, inflammatory bowel disease and several neurological disorders [
4,
5].
As research continues to elucidate the effects of MPs on human health, it is imperative that dental practitioners recognize the role that dentistry, and orthodontics in particular, may play in contributing to the overall microplastic burden. Orthodontic treatment relies heavily on plastic-based materials, including polyurethane (PU), acrylic resin, and polyethylene terephthalate glycol (PETG), and polymethyl methacrylate (PMMA). These materials are commonly used to fabricate various orthodontic appliances such as clear aligners, Hawley and Essix retainers, elastomeric ties, rubber band elastics, powerchains and occlusal guards [
6,
7].
As the entry point to the digestive tract, the oral environment is uniquely suited to degrade materials through both chemical and mechanical mechanisms. Salivary enzymes contribute to chemical degradation, while mastication subjects materials to repetitive mechanical loading. Consequently, any plastic appliance placed in the oral cavity for prolonged periods of time is subject to these degradative forces and is likely to undergo material breakdown. In recent years, increased esthetic demands from orthodontic patients have driven a substantial rise in clear aligner therapy, which relies on thermoplastic materials. The use of Invisalign alone has increased from 7.5 million patients globally in 2019 to roughly 20 million patients in 2025 [
8], a trend that is expected to continue growing. In addition to active orthodontic treatment, plastic appliances are routinely used in retention, with many retainers prescribed for lifelong wear. Taken together, orthodontic materials may represent an understudied and potentially significant source of prolonged microplastic exposure.
Preliminary studies have demonstrated that orthodontic aligners release MPs and NPs with routine use [
6]. However, relatively few investigations have characterized the extent and nature of microplastic release from retentive orthodontic appliances. To date, studies by Quinzi et al., focusing on clear aligners [
6], and Fang et al., focusing on orthodontic elastics [
7], are two of the only investigations examining the contribution of orthodontics to the global microplastic burden. These studies are limited by their isolated subsets of orthodontic appliances and therefore do not fully capture the cumulative contribution of the field. Additionally, these studies use Raman Microspectroscopy analysis in conjunction with scanning electron microscopy (SEM) to identify particles. This technique can be laborious, identifying each particle with manual inspection, and subjective as the inspector is determining which particles are artifacts or not. Surface roughness studies have also been performed, but these do not directly quantify microplastic release. To date, no study has comprehensively evaluated multiple orthodontic appliances using automated chemical characterization, which represents a significant gap in the literature. Laser-directed infrared spectroscopy (LDIR) was therefore chosen for this study to achieve greater result outputs and reduce subjectivity of particle analysis [
9]. Accordingly, the present in vitro pilot study aims to quantify and characterize microplastic particles recovered after exposure of multiple orthodontic appliances to artificial saliva under calibrated agitation conditions intended to approximate clinically relevant wear patterns, using automated physical and chemical characterization by LDIR.
To accomplish these aims, the Department of Orthodontics at an academic dental institution has access to a wide range of orthodontic appliances, including clear thermoplastic aligners, in-house aligners, Hawley appliances and occlusal guards. Additionally, a collaborating environmental health laboratory with access to laser-directed infrared spectroscopy (LDIR) equipment was instrumental for both physical and chemical characterization of microplastics released from orthodontic materials. The findings of this study are intended to establish a reproducible framework for detecting and characterizing microplastic particles released from orthodontic materials under controlled conditions, and to support future investigations aimed at quantifying variability, refining exposure models, and evaluating alternative materials with reduced environmental and biological impact.
2. Materials and Methods
2.1. Materials
The artificial saliva used in this study was obtained from Biochemazone (BZ324) (Leduc, AL, Canada) and consisted of calcium chloride dihydrate, potassium chloride, urea, sodium chloride, sodium phosphate monobasic dihydrate, sodium sulfide nonahydrate, water, mucin and a buffered solution at a pH of 6.8.
An STL file of a single subject’s maxillary dentition with 14 teeth (no 3rd molars present) was generated using an iTero scanner (Align Technology Inc., San Jose, CA, USA). No humans or human data were used in this study. The subject exhibited no restorations, minimal occlusal wear, and minimal crowding. Use of the de-identified intraoral scan was approved by the Institutional Review Board (IRB) of the study institution (Harvard University Area Institutional Review Board—IRB exempt protocol IRB25-1324, date 17 November 2025). This STL file was submitted to the following manufacturers for fabrication of the orthodontic appliances listed below:
Invisalign SmartTrack aligner (Align Technology Inc., San Jose, CA, USA);
Zendura FLX aligner (Bay Materials LLC., Fremont, CA, USA);
Essix A+ PETG retainer (Great Lakes Orthodontics, Towanda, NY, USA);
Biocryl flat-plane occlusal guard (Great Lakes Orthodontics, Towanda, NY, USA);
Hawley retainer (Great Lakes Orthodontics, Towanda, NY, USA).
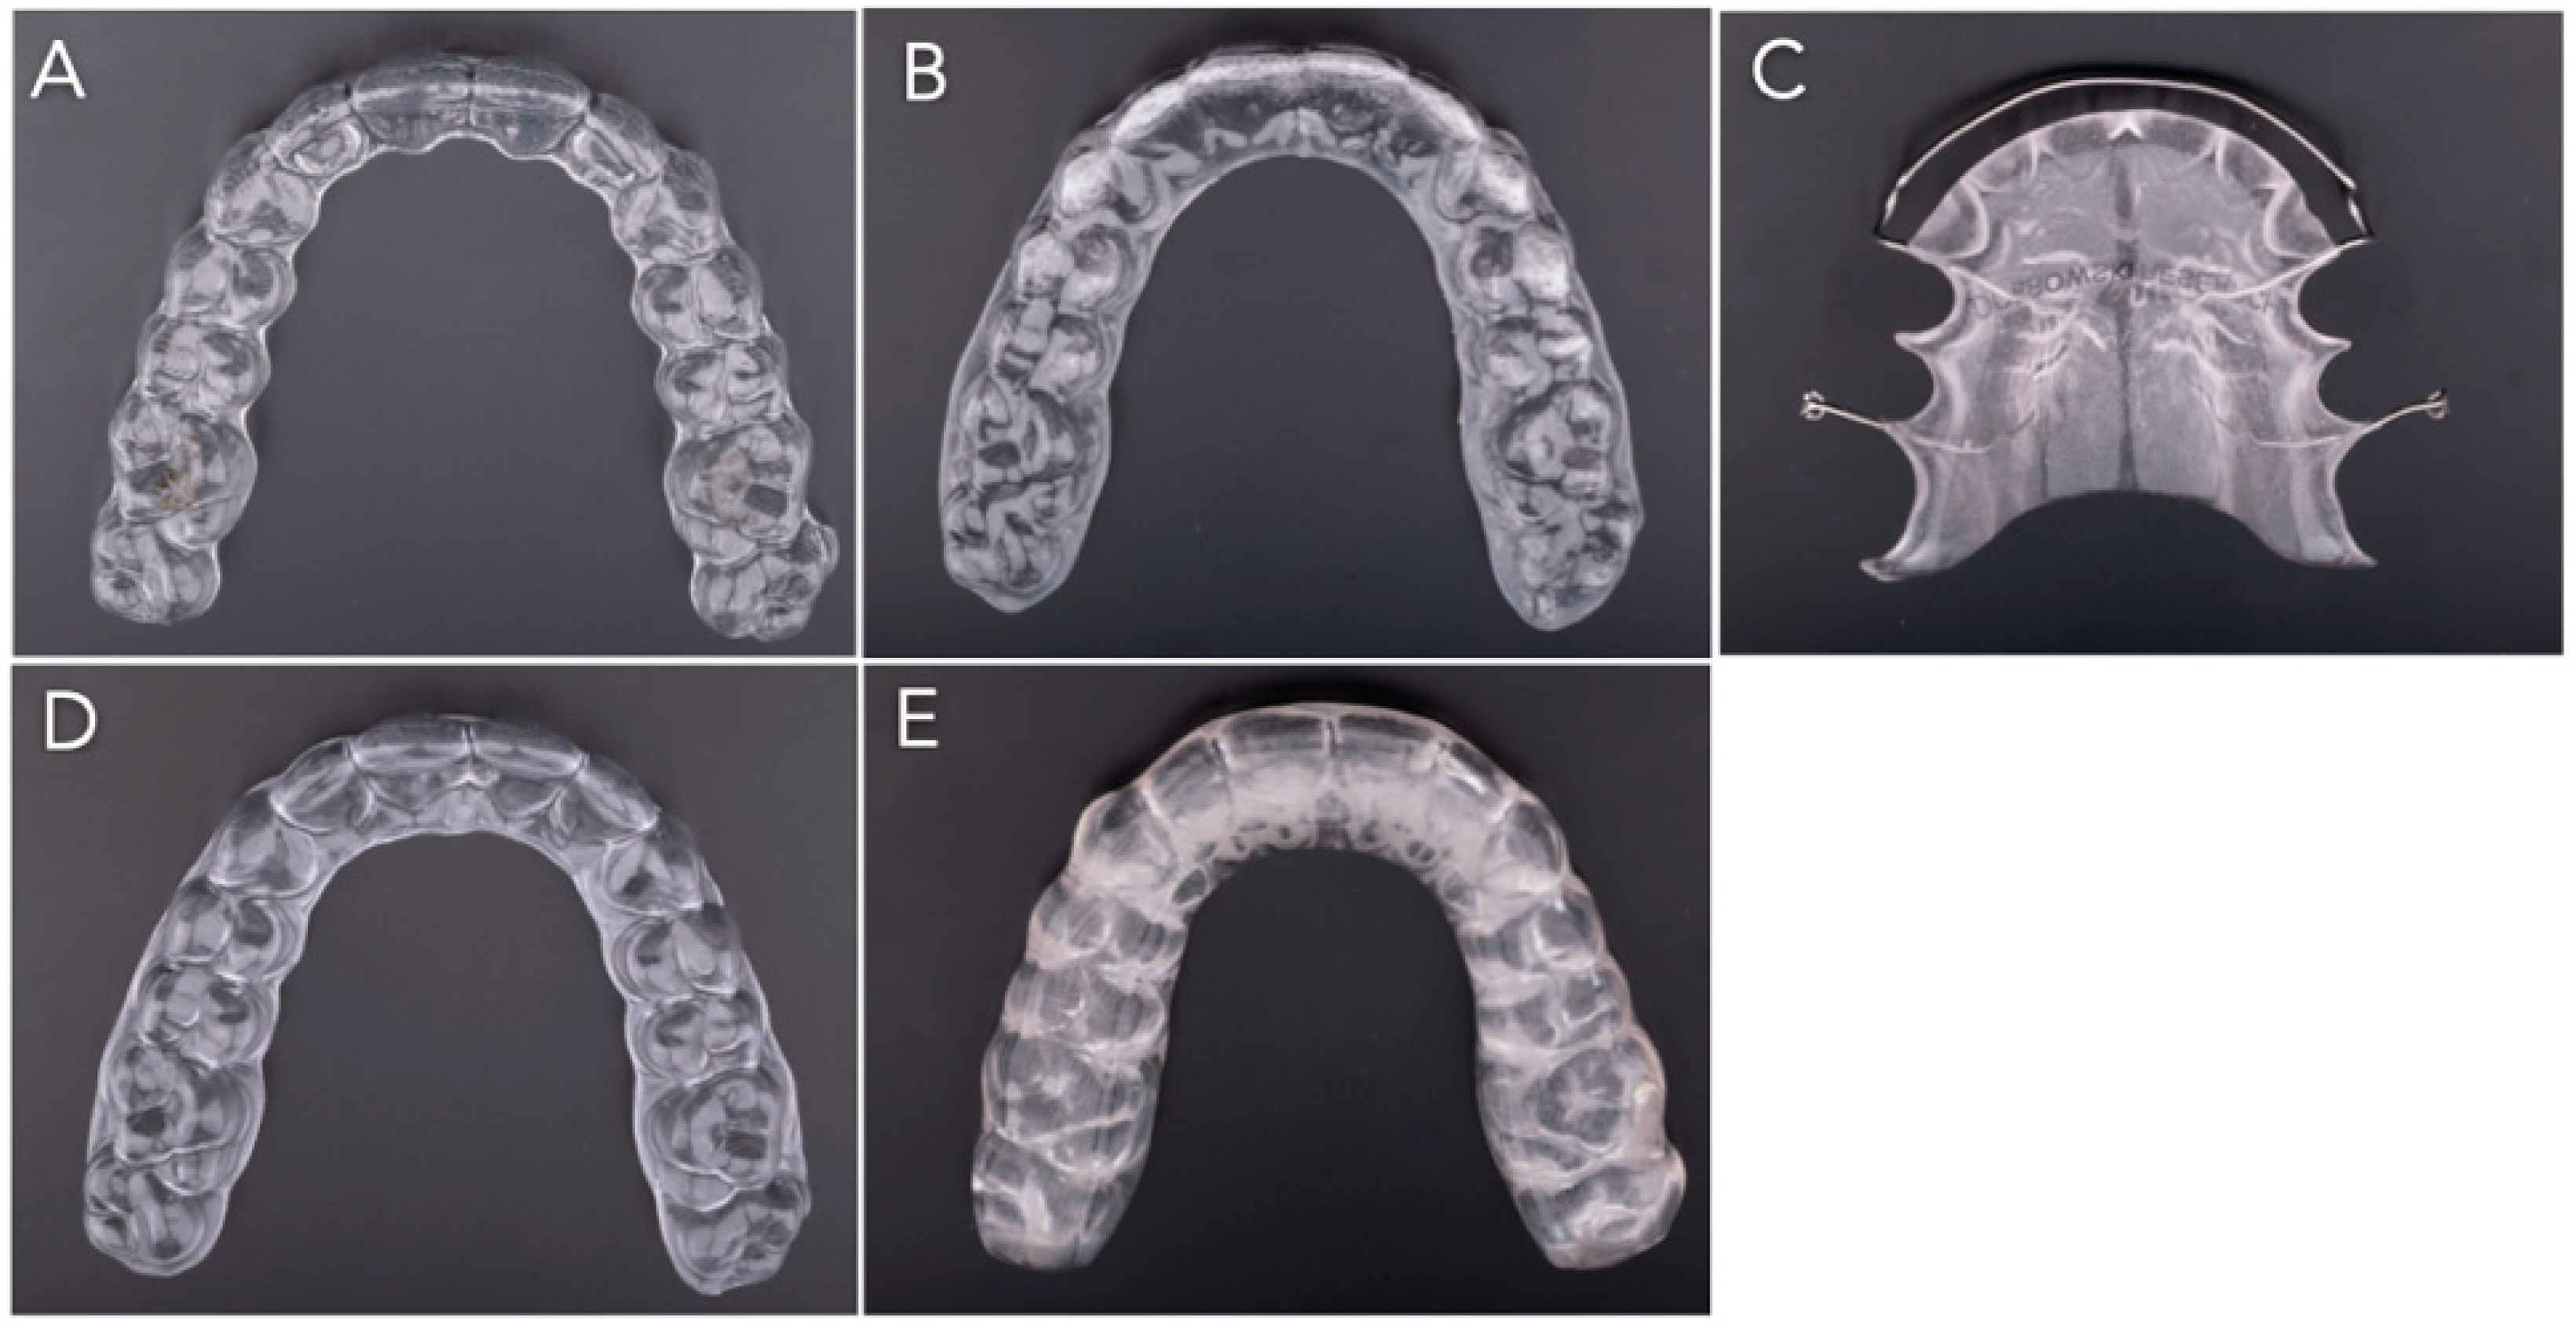
Zendura aligners were fabricated in-house at the study institution following manufacturer guidelines using a universal pressure thermoforming unit. Images of the appliances are portrayed in
Figure 1.
Five maxillary orthodontic appliances were fabricated from a standardized digital model. “Shorthand” labels were used for internal reference. For data management and statistical analysis, appliances were also assigned analysis identifiers (T1–T5) as described in the Methods Section.
2.2. Experimental Design
This in vitro study evaluated microplastic particle recovery from five orthodontic appliances under simulated intraoral conditions. To maintain consistency across appliance types, only maxillary appliances were evaluated. Each appliance was sectioned along the midline between the central incisors (labial to palatal). Following sectioning, all appliance segments were briefly rinsed with ethanol, followed by a rinse with deionized water. The segments were then placed in separate closed glass containers and allowed to air-dry prior to immersion in artificial saliva to minimize carryover of debris from handling/sectioning and to reduce potential airborne contamination during drying.
Each half was immersed in 50 mL of artificial saliva within a covered glass beaker and maintained at 37 °C on a magnetic stirring hot plate (Joanlab MHS-6Pro, oan Lab Equipment Co., Ltd., Huzhou, China). Appliances listed in
Table 1 were categorized into two wear-equivalent conditions based on typical clinical wear recommendations: a nighttime wear-equivalent condition (retainers and nightguard; 8 h) and a full-time wear-equivalent condition (aligners; 20 h). Previous studies have shown that aligners are most effective when worn 20–22 h/day [
10], while nighttime retainer wear is most commonly prescribed for approximately 8 h per day [
11]. Based on the reported spontaneous swallowing of 0.98/min [
12], and taking into account the amount of time patients are recommended to wear each appliance, agitation was performed at 50 rpm (the lowest speed setting available on the magnetic stirring hot plate). The magnetic stirring bar was calibrated to the following: 50 rpm for 10 min (500 rotations) for the nighttime group and 50 rpm for 24 min (1200 rotations) for the fulltime group, intended to approximate the number of swallowing events over 8 h and 20 h periods, respectively. Control samples containing only artificial saliva were subjected to the same protocols.
This calibrated agitation protocol was applied once daily for 14 consecutive days, after which samples were collected for analysis. The agitation protocol was designed as a standardized, reproducible mechanical perturbation model rather than a direct replication of intraoral biomechanics. The selected rotation speeds and cycle counts were informed by estimates of swallowing frequency and intermittent intraoral contact events, providing a controlled framework to induce material–fluid interaction and facilitate particle release for detection. This approach prioritizes internal consistency across appliance types over exact physiologic simulation. At the endpoint, each container was agitated to suspend particles, and a 1 mL aliquot of the supernatant was collected for analysis. The aliquot was analyzed from the 50 mL exposure volume to enable standardized, high-resolution LDIR analysis within instrument throughput constraints. Following endpoint agitation to homogenize the suspension, the aliquot was treated as a representative subsample of the exposure medium. Accordingly, particle counts are reported per analyzed volume and interpreted as relative recovery metrics rather than whole-sample totals. No scaling assumptions were applied to estimate full-volume totals in the full 50 mL exposure volume from the 1 mL aliquot.
Multiple precautions were implemented to minimize microplastic contamination throughout experimentation. The only unavoidable potential source of contamination was the artificial saliva itself, which was supplied in plastic containers; this was accounted for through the inclusion of artificial saliva-only control samples processed in parallel at each timepoint (8 h and 20 h). Control results are reported for transparency and were not used for inferential comparisons. Filtration blanks and air blanks were not performed in this pilot study; therefore, no blank subtraction/correction was applied. Additional potential laboratory sources of polymer contamination were considered, including sample handling tools, filtration materials, the absence of a laminar flow hood/flowbox, and ambient airborne particulates. To mitigate these risks, all sample handling was performed using glassware where possible, with minimized plastic contact during post-exposure processing. All glassware was cleaned using dishwashing detergent, triple-rinsed with ethanol, followed by a final rinse with filtered deionized water. For LDIR analysis, several precautionary measures were also taken, including wearing only cotton lab coats and nitrile gloves, cleaning lab benches and forceps with 70% ethanol before and after use, using only glass serological pipettes and rinsing funnels with acetone before and after use to remove any potential microplastic contaminants.
2.3. Laser-Directed Infrared Spectroscopy (LDIR) and Data Analyses
Following exposure, the collected 1 mL aliquots were filtered onto a gold-coated filter, which was then mounted on the microplastics 25 mm filter holder, for LDIR analysis. LDIR was used to (i) enumerate particles meeting quality criteria, (ii) measure particle size (reported as Diameter_µm) and particle shape (eccentricity), and (iii) assign polymer type by spectral matching to a reference library. Cellulosic, chitin, coal, natural polyamide, and the false positive alkyl varnish particles were excluded from analysis. Particles with spectral match quality scores < 0.7 were considered unreliable and excluded. Alkyl varnish with spectral match quality score > 0.7 was further analyzed using line analyses to confirm spectral matching. Those with minimal spectral matching were considered false positive and were excluded in the final analyses. Spiked polyethylene beads and alkyd varnish were used for LDIR calibration and quality assurance. The effective detection threshold of the LDIR workflow is approximately 20 µm; smaller microplastics and nanoplastics were below the detection limit and not evaluated. Each particle was treated as one observation with continuous outcomes (Diameter_µm, Eccentricity) and an ordinal eccentricity category (A–D) designated as follows for the eccentricity value of each particle: <0.5 = (spherical) = A; 0.5–0.8--> moderately elongated = B; >0.8--> highly elongated = C; ≥0.9--> fiber/filament = D.
2.4. Statistical Analysis
Statistical analyses were performed in R (v4.4.2) [
13]. R packages used were stats (base), dplyr, tidyr, ggplot2, and FSA. For data management and statistical analysis, appliances were assigned internal identifiers (T1–T5) corresponding to
Table 1 as follows: T1 = SmartTrack Aligner, T2 = Zendura Aligner, T3 = Essix A+ PETG retainer, T4 = Flat-Plane Biocryl nightguard, and T5 = Hawley retainer. These identifiers were used only in the underlying data table and R code; results are reported using the appliance names. Because distributions were not assumed to be normal and sample sizes were highly unbalanced across polymer types, nonparametric methods were used. Within a single aligner, differences across polymer types were evaluated using Kruskal–Wallis tests; when omnibus tests suggested differences, Dunn’s post-hoc comparisons with Holm adjustment to control for multiple testing were performed (FSA (v0.10.1) in R (v4.4.2) package). For polymer-stratified comparisons between aligners (SmartTrack vs. Zendura), Wilcoxon rank-sum tests were used and Hodges–Lehmann location-shift estimates with 95% confidence intervals were reported [
14]. For eccentricity categories (A–D), 2 × k contingency tables were analyzed using Fisher’s exact test when feasible; when sparse cells or structural zeros made asymptotic chi-square unreliable, Pearson chi-square tests with Monte Carlo–simulated
p-values (20,000 replicates) were used. Within each outcome family (Diameter_µm or Eccentricity),
p-values across polymer-stratified aligner comparisons were adjusted using Holm’s method. Data handling and summaries were performed using dplyr/tidyr, and figures were produced with ggplot2. Because only one appliance was tested per appliance type and control particle counts were very low, inferential results are interpreted as exploratory particle-level comparisons within these experimental runs rather than population-level estimates for each appliance type.
4. Discussion
This in vitro study demonstrates the feasibility of recovering and chemically characterizing microplastic particles from multiple orthodontic appliances under controlled experimental conditions. Polymer identification by LDIR indicated multiple polymer types across conditions, and polymer composition differed by appliance. However, controls contained very few particles in the analyzed aliquots, indicating low-level background contamination and limiting the extent to which controls could be used for distribution comparisons of particle size or shape.
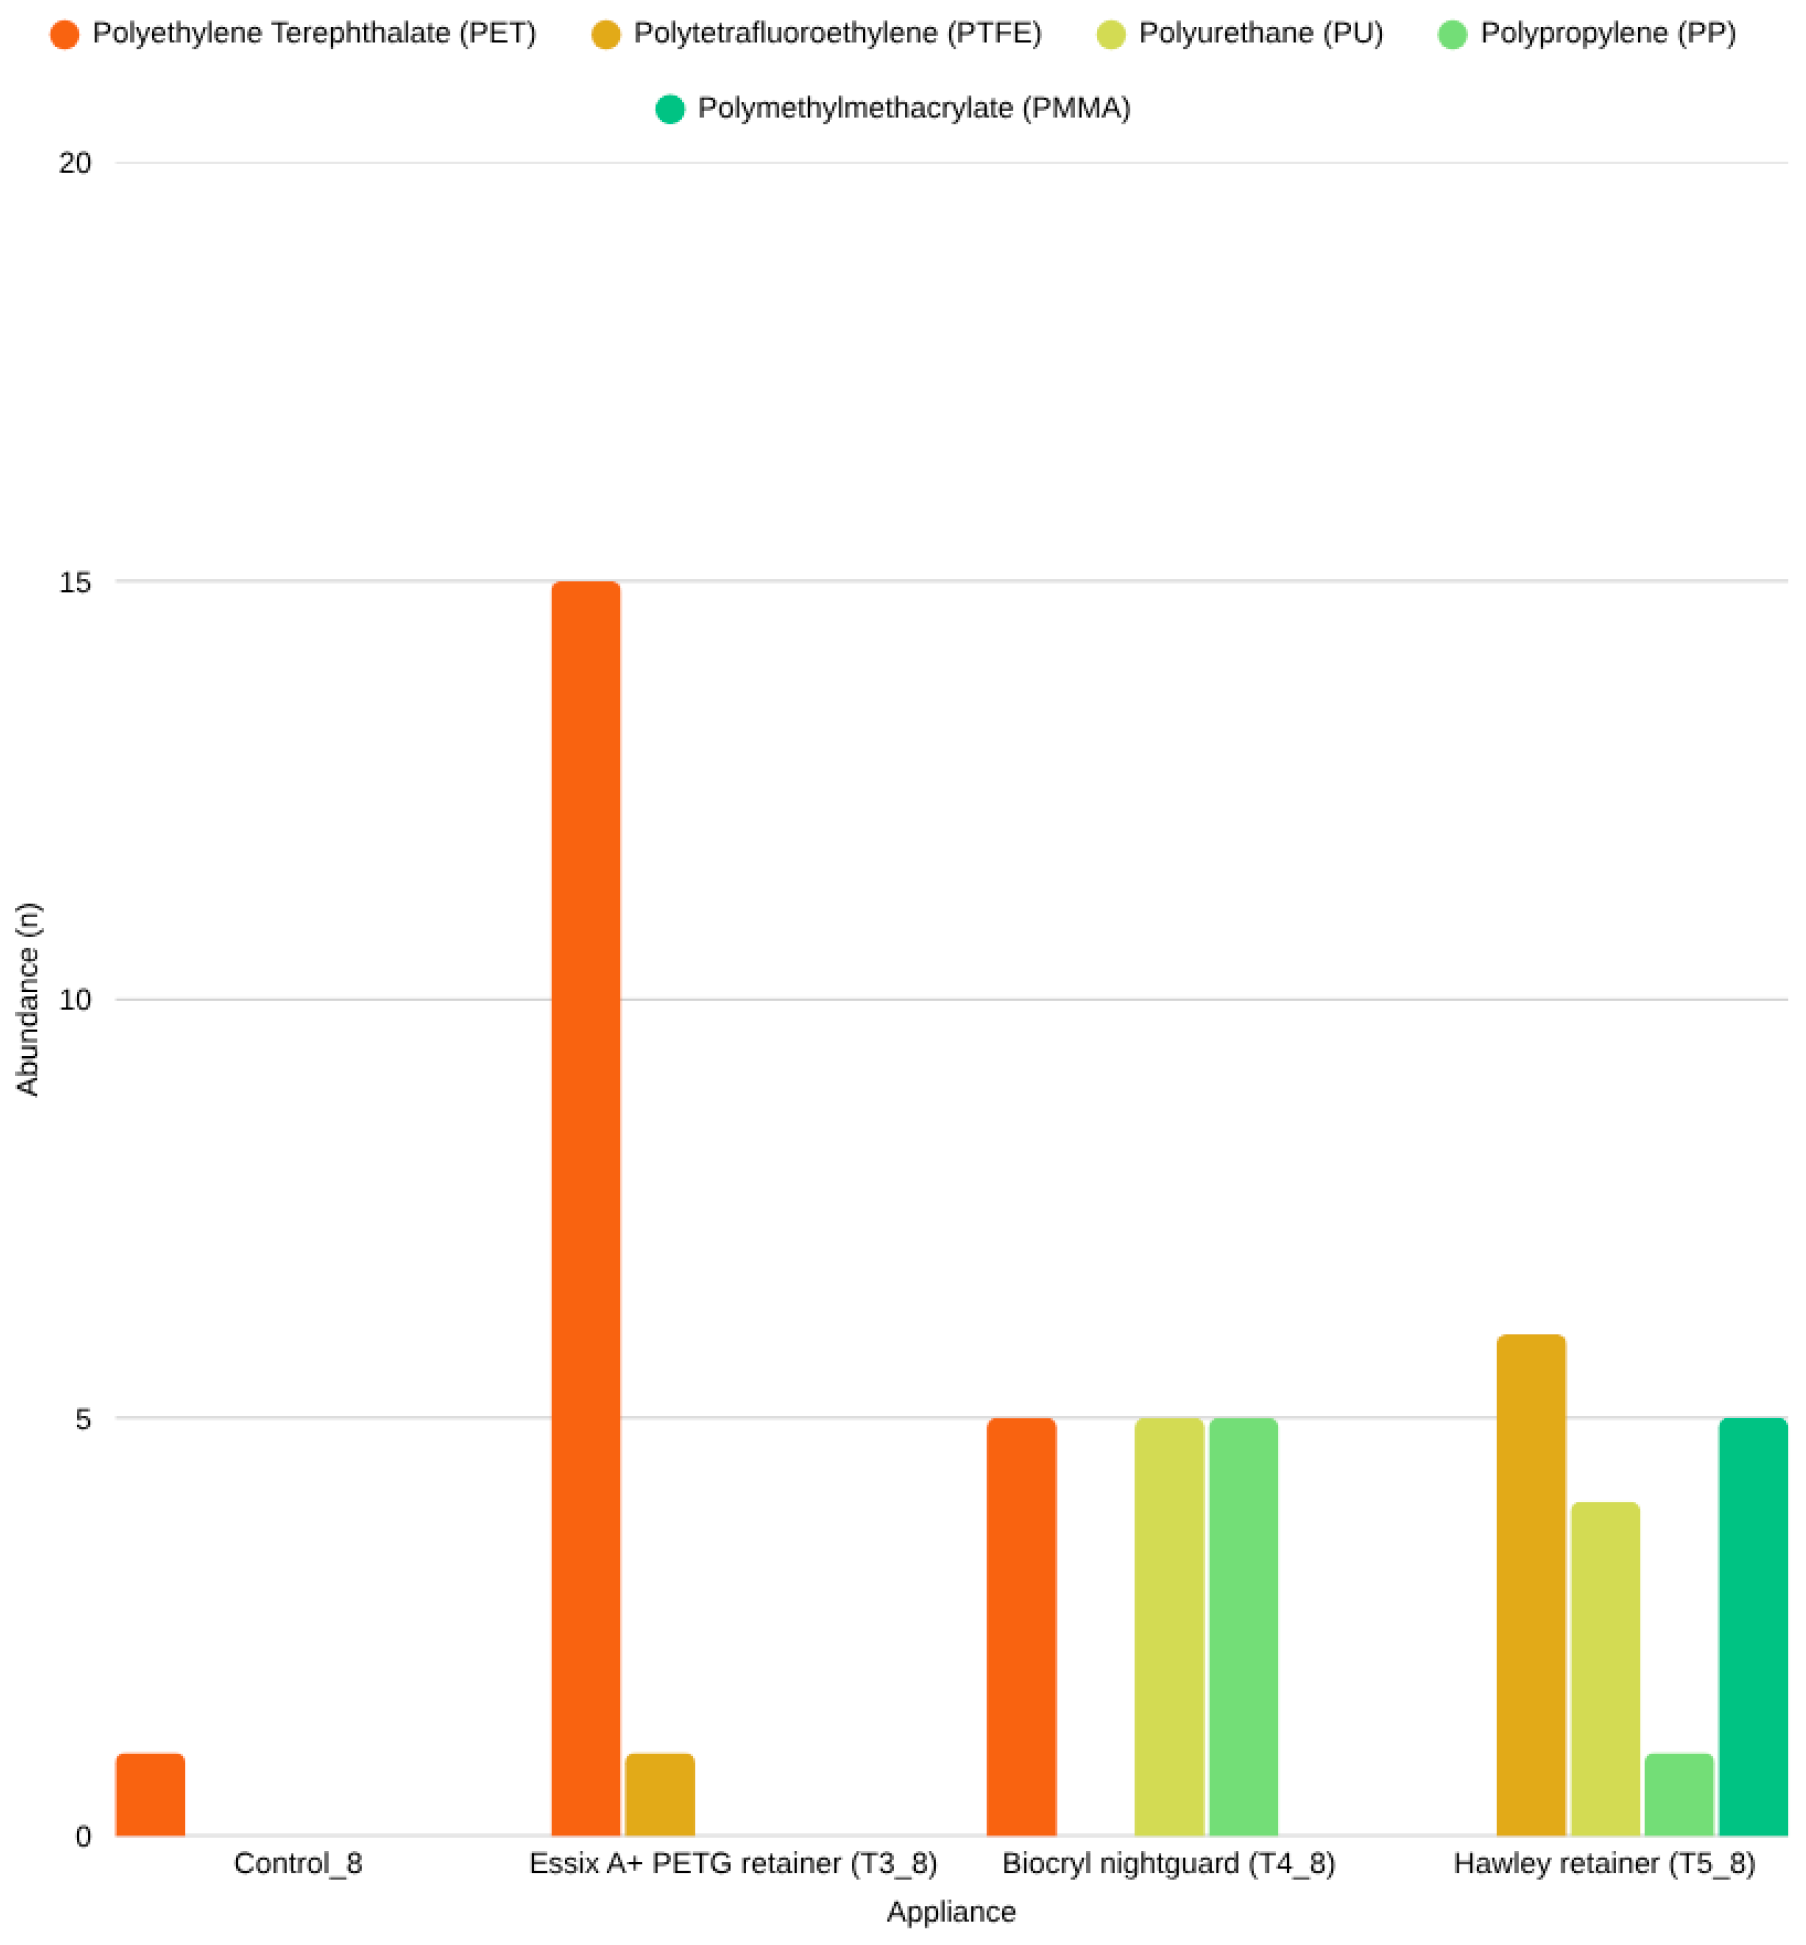
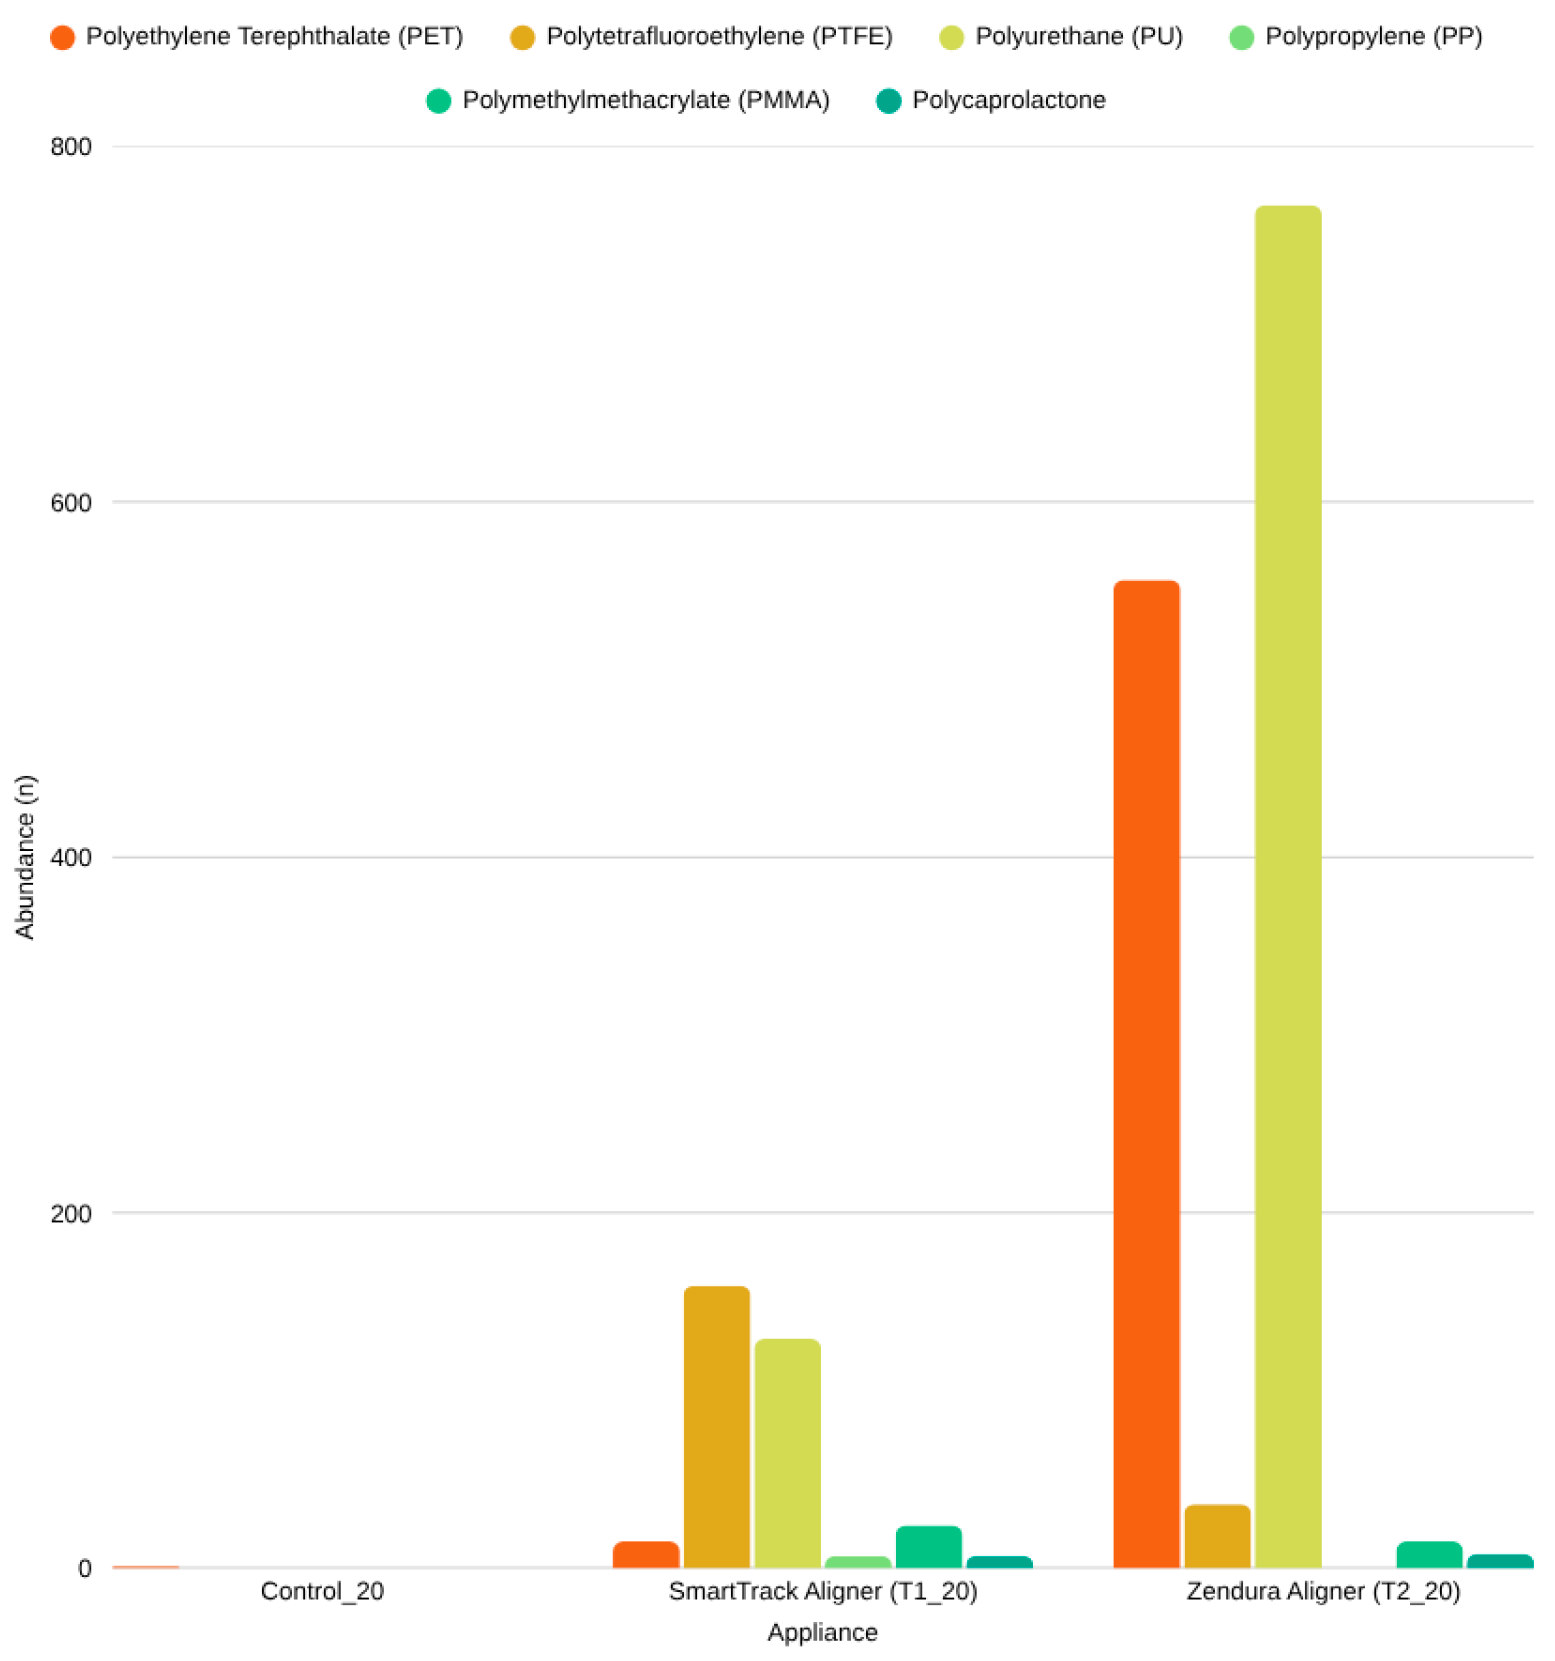
A key descriptive finding is that particle recovery in the analyzed 1 mL aliquot was higher for the two aligner systems at the full-time wear-equivalent condition (SmartTrack: 341 particles; Zendura: 1382 particles) than for controls (Control_8: 1 particle; Control_20: 3 particles) and higher than the nighttime wear-equivalent appliances (11–16 particles across T3–T5). Because each appliance type was represented by a single appliance and particles are nested within that appliance, these differences are interpreted as descriptive observations from these experimental runs rather than population-level estimates of appliance-type effects. Importantly, these findings do not support quantitative inference regarding in vivo exposure levels.
Within the full-time wear-equivalent condition, polymer-stratified comparisons between SmartTrack and Zendura showed no differences in particle eccentricity (continuous) or eccentricity category distributions (A–D) after multiplicity correction. For particle diameter, an unadjusted difference was observed for PU particles (SmartTrack yielding smaller PU particle diameters than Zendura), but this did not remain statistically significant after Holm correction across polymer-specific comparisons. Comparisons involving Polycaprolactone were particularly imprecise due to small sample sizes (n = 7–8). Overall, these results suggest that, within the constraints of this dataset, particle shape characteristics were broadly similar between aligner systems when comparisons were made within polymer type.
For nighttime wear-equivalent appliances (Essix PETG retainer, Biocryl nightguard, Hawley retainer), particle counts per analyzed aliquot were similar (11–16 particles) and diameter/eccentricity summaries were broadly comparable across T3–T5. Polymer identification patterns differed by appliance (e.g., PET-dominant for the PETG retainer; mixed polymer classifications for the Hawley appliance). PTFE was detected in controls and multiple appliance conditions; because PTFE-coated components (e.g., stir bars) are common in laboratory workflows, a procedural/background contribution is plausible, and PTFE findings should be interpreted cautiously.
The low particle counts observed in controls, combined with overlapping polymer types (e.g., PTFE), support a low but non-zero background contamination profile. These findings underscore the importance of interpreting polymer-specific results within a contamination-aware framework, particularly for polymers commonly used in laboratory equipment.
Clinical and toxicological interpretation of particle counts per mL is not supported by this in vitro pilot design. The present results reflect standardized particle recovery in a subsampled aliquot (1 mL of 50 mL) and only particles above the effective LDIR threshold (~20 µm). Health relevance, if any, is likely to depend on the full particle size distribution (including <20 µm), dose and residence time, polymer chemistry and additives, and host factors; therefore, these findings should not be interpreted as evidence of harm. From a mitigation perspective, future work should evaluate manufacturing/finishing processes, alternative materials, and cleaning protocols that may reduce particle generation, and should incorporate replicate appliances, procedural blanks (including filtration and air blanks), and additional oral-relevant conditions (e.g., thermal cycling, enzymatic exposure, and biofilm).
This study has some limitations. First, the in vitro design cannot fully replicate the complexity of the oral environment, including enzymatic activity, biofilm formation, thermal cycling, salivary flow, and heterogeneous mechanical loading. Second, because particle counts were derived from a subsampled aliquot and a single appliance per type, the data do not support extrapolation to whole-sample totals, total particles recovered in the full exposure volume, or patient-level exposure. Likewise, the agitation protocol may not provide a completely homogenous mixture for the 1 mL aliquot sampling. In addition, although appliances were briefly rinsed with ethanol, rinsed with deionized water, and air-dried in separate closed glass containers prior to immersion, sectioning/cutting may still generate edge debris and could contribute to recovered particles; future work should include sectioning-only controls and/or unsectioned comparisons (where feasible) to quantify this contribution. Control particle counts were very low, allowing controls to contextualize background contamination but not to support stable distribution comparisons. Because filtration blanks and air blanks were not included and no blank subtraction/correction was applied, background contamination and polymer source attribution (including PTFE detected in controls and samples) cannot be fully resolved; polymer-specific findings, particularly for polymers commonly present in laboratory workflows, should therefore be interpreted cautiously. While higher particle recovery in appliance conditions relative to controls suggests that the tested appliances likely contributed to recovered particles in these runs, future experiments should strengthen source attribution by incorporating additional procedural blanks and collecting reference spectra directly from unused appliance materials. Finally, LDIR has an effective detection threshold near 20 µm, so smaller microplastics and nanoplastics were not evaluated. These larger particles can leach and break down into smaller particles; however, nanoparticles, with their ability to cross membrane barriers, can have larger risks for human health and should be studied in depth as well.
Future work should incorporate multiple appliances per type and repeated control samples, enabling mixed-effects modeling to account for clustering of particles within appliances and improving generalizability. Incorporating mass-balance approaches or full-volume filtration may better relate subsampled particle recovery to whole-sample (full-volume) totals. Additional timepoints and oral-relevant conditions (thermal cycling, enzymatic conditions, biofilm) would strengthen inferences about real-world patient exposure.




 ,
,