Article

Toward Smart Agriculture: A Novel Environmentally Enriched Multimodal Deep Learning Framework for Olive Peacock Spot Disease Stage Classification and Severity Estimation

by
Zaer S. Abu-Hammour
1,2,*,
Mohammad F. Al Mashagbeh
1,
Noor M. AlSmadi
1,
Enas N. Altalla
1,
Anwar B. Ayasrah
1,
Hamza A. Alnasra
1 and
Issam H. Almanasir
1
1
Department of Mechatronic Engineering, The University of Jordan, Amman 11942, Jordan
2
College of Engineering, Amman Arab University, Amman 11953, Jordan
*
Author to whom correspondence should be addressed.
Appl. Sci. 2026, 16(15), 7669; https://doi.org/10.3390/app16157669
Submission received: 13 June 2026 / Revised: 27 July 2026 / Accepted: 28 July 2026 / Published: 2 August 2026

Abstract

Olive cultivation is one of the most economically important agricultural activities in the Mediterranean region, yet its productivity is significantly threatened by olive peacock spot, caused by the fungus Cycloconium oleaginum. This disease reduces photosynthetic activity, induces premature defoliation, deteriorates fruit quality, and causes considerable yield losses. Although deep learning has significantly improved automated plant disease diagnosis, most existing approaches rely solely on leaf images and overlook environmental factors that influence disease development and progression. This study proposes an environmentally enriched multimodal deep-learning framework that integrates RGB images of olive leaves with heterogeneous environmental descriptors, including meteorological conditions, soil characteristics, rainfall-derived moisture indicators, vegetation indices, and environmental stress variables obtained from authoritative public data sources. Visual features are extracted using a fine-tuned ResNet50 convolutional neural network, while environmental descriptors are modeled using a multilayer perceptron (MLP). The extracted features are fused at the feature level to simultaneously perform seven-stage disease classification and continuous estimation of lesion coverage and leaf yellowing within a unified multi-task learning framework. Unlike synchronized field-sensor datasets, the proposed dataset combines publicly available olive leaf images with representative environmental observations, providing a reproducible proof-of-concept for multimodal disease diagnosis. Results demonstrate that incorporating environmental information substantially improves disease-stage recognition, achieving an accuracy of 97.77%, a macro F1-score of 0.9809, and a weighted F1-score of 0.9776. The proposed framework also achieved accurate severity estimation, with a mean MAE of 1.29%, RMSE values of 4.86% and 4.75%, and R 2 values of 0.957 and 0.969 for lesion coverage and leaf yellowing, respectively. These findings demonstrate the potential of multimodal deep learning to support precision agriculture and intelligent disease monitoring systems.

1. Introduction

The olive tree (Olea europaea L.) is one of the oldest cultivated perennial crops in human history and remains one of the most economically important fruit trees throughout the Mediterranean basin. Olive cultivation extends across nearly sixty countries and occupies approximately 10.4 million hectares worldwide, while Mediterranean countries account for the great majority of global olive production [1,2]. Besides its economic importance for olive oil and table olive production, olive cultivation contributes significantly to rural employment, sustainable agriculture, biodiversity conservation, landscape preservation, and soil stabilization, making it an essential component of both regional economies and environmental sustainability [3,4].
The increasing worldwide demand for olive products has intensified the need for sustainable orchard-management strategies capable of maximizing productivity while minimizing environmental impact. Modern olive production therefore seeks not only high yield but also improved fruit and oil quality, reduced pesticide and fertilizer consumption, optimized irrigation, and environmentally responsible agricultural practices [5,6]. Achieving these objectives requires continuous monitoring of tree health and the early identification of diseases before significant economic losses occur.
Among the numerous factors affecting olive production, fungal and bacterial diseases represent some of the most significant biological threats. Olive trees are susceptible to several economically important diseases, including olive peacock spot, anthracnose, olive knot, Cercospora leaf spot, and Verticillium wilt, all of which may reduce tree vigor and fruit production while increasing orchard-management costs [7,8]. Depending on the pathogen and infection severity, these diseases may negatively affect photosynthetic activity, vegetative growth, flowering, fruit set, and ultimately olive yield and oil quality.
Among olive diseases, olive peacock spot (olive leaf spot) is one of the most widespread and destructive foliar diseases affecting olive orchards worldwide. The disease is caused by Venturia oleaginea (Castagne) Rossman & Crous, while Cycloconium oleaginum, Spilocaea oleagina, and Fusicladium oleagineum are historical or anamorphic names for the same pathogen. Disease development is favored by mild-to-cool temperatures and humid conditions, where prolonged leaf wetness promotes conidial germination, penetration, and infection.
Unlike many agricultural diseases with relatively distinct symptom boundaries, olive peacock spot progresses through successive stages of lesion expansion, chlorosis, tissue deterioration, and defoliation. Initial symptoms appear as small, circular, dark-green to black lesions on the upper leaf surface that gradually enlarge and develop concentric rings surrounded by yellow or chlorotic halos, producing the characteristic “peacock-eye” appearance. As infection progresses, chlorophyll concentration and photosynthetically active leaf area decrease, photosynthetic efficiency declines, and premature leaf abscission may occur, ultimately reducing tree vigor, flowering, fruit set, crop yield, and olive oil production under severe infections [9,10].
Consequently, disease severity should be regarded as a continuous pathological process rather than a simple healthy-versus-infected classification problem. This distinction is particularly important in precision agriculture because orchard-management decisions depend strongly on disease severity and prevailing environmental conditions. Mild infections may require preventive monitoring and cultural management practices, whereas severe infections often necessitate timely fungicide application and immediate intervention to minimize economic losses. Therefore, quantitative disease-severity estimation offers considerably greater practical value than conventional categorical disease recognition alone [11].
Traditionally, disease diagnosis has relied on visual inspection by experienced agronomists, farmers, or plant pathologists. Although expert assessment can be reliable when symptoms are clearly visible, manual diagnosis is inherently subjective, labor-intensive, time-consuming, and difficult to apply consistently across large commercial orchards. Moreover, early disease symptoms are frequently subtle and may be confused with nutritional deficiencies, abiotic stress, physiological disorders, insect damage, or mechanical injury. On the other hand, laboratory-based confirmation methods improve diagnostic reliability but require sample collection, specialized equipment, trained personnel, and considerable processing time, making them unsuitable for continuous large-scale orchard monitoring. These limitations have motivated the development of rapid, objective, and automated systems for olive disease detection and severity assessment [12,13].

2. Related Work

2.1. Image-Based Olive Disease Recognition

Deep learning has substantially advanced automatic olive-disease recognition by replacing manually designed descriptors with learned visual representations. Among the earliest studies devoted specifically to olive-leaf diseases, Uğuz and Uysal developed a convolutional neural network for distinguishing healthy leaves, olive peacock spot, and damage caused by Aculus olearius [14]. Their results demonstrated the effectiveness of deep feature extraction for olive-disease classification and established an important benchmark for subsequent research. Nevertheless, the task was formulated as conventional image classification, without explicitly representing disease progression, quantifying symptom severity, or incorporating environmental factors associated with fungal development.
To improve the interpretability of image-based diagnosis, Uğuz subsequently introduced a Single Shot Detector framework for localizing peacock-spot lesions on olive leaves [15]. In contrast to whole-image classification, lesion detection identifies the spatial positions of symptomatic regions and can therefore provide useful visual evidence for the predicted diagnosis. However, object localization does not necessarily quantify the proportion of affected leaf tissue or distinguish among fine-grained disease-severity stages. Moreover, the model remains dependent exclusively on visual information and cannot account for environmental conditions that may influence symptom development.
Bruno et al. proposed an adaptive ensemble of two EfficientNet-B0 models to improve prediction robustness while maintaining computational efficiency suitable for practical agricultural applications [16]. Their findings showed that combining complementary CNN predictions can provide more stable classification than relying on an individual network. However, the framework remained focused on categorical image recognition and did not incorporate soil, meteorological, vegetation, or moisture-related variables.
A different balance between predictive performance and computational cost was investigated by Ksibi et al., who developed the MobiRes-Net architecture by combining characteristics of MobileNet and ResNet50 [17]. The proposed lightweight model demonstrated the feasibility of deploying olive-disease recognition systems on resource-constrained platforms. Despite this practical advantage, the diagnostic formulation was still single-modal and classification-oriented, without continuous severity estimation or explicit modeling of environmental context.
Recent studies have also extended olive-disease monitoring from individual leaves to orchard-scale imagery. Sarantakos et al. combined unmanned aerial vehicle imagery with convolutional neural networks and Vision Transformers to support large-scale monitoring of olive orchards [18]. UAV-based acquisition can increase spatial coverage and reduce the effort required for manual field inspection. Nevertheless, aerial imagery primarily captures visual canopy-level manifestations and does not, by itself, explicitly represent the soil and atmospheric conditions associated with pathogen development.
Collectively, these studies confirm that CNNs, lightweight architectures, ensembles, object detectors, UAV imaging, and Vision Transformers can provide accurate and operationally useful olive-disease recognition. However, most existing approaches remain centered on visual diagnosis and produce either categorical disease labels or lesion locations. Comparatively less attention has been given to the joint prediction of fine-grained disease stages, lesion coverage, and leaf-yellowing percentage, particularly within a framework that combines visual evidence with environmental descriptors.
Table 1 summarizes the main differences between representative image-based olive-disease studies and the framework developed in this work.

2.2. Multimodal Artificial Intelligence for Plant Disease Diagnosis

Plant-disease development is influenced by interacting visual, biological, meteorological, and edaphic factors. A single image may capture visible symptoms at the time of acquisition, but it does not necessarily represent the environmental conditions that promoted infection, symptom expansion, or plant stress. Multimodal artificial intelligence addresses this limitation by combining images with complementary information such as environmental measurements, soil properties, temporal sensor observations, textual symptom descriptions, multispectral data, thermal imagery, or remote-sensing products.
Lee et al. proposed a multimodal crop-disease diagnosis framework that combines RGB images with environmental measurements acquired in smart-farm environments [19]. Their approach used meteorological observations, including temperature, humidity, and dew point, collected at short temporal intervals before image acquisition. Visual features were extracted using a convolutional neural network, whereas the temporal environmental measurements were modeled using a Long Short-Term Memory network. The fusion of the two modalities improved disease-recognition performance relative to an image-only formulation, demonstrating that environmental measurements can provide complementary diagnostic information.
The present study shares the general principle that visual symptoms should be interpreted together with environmental context; however, its data formulation and prediction objectives differ from those of Lee et al. Their framework relied on locally acquired measurements temporally synchronized with individual images, while the present study constructs environmentally enriched image records using regional and seasonal descriptors obtained from public repositories. These repositories include NASA Power for atmospheric variables, SoilGrids and WoSIS for soil-related properties, Copernicus/ERA5 products for climatic and moisture-related information, and Sentinel-2 products for vegetation-related indicators. Accordingly, the environmental variables used in the present work should be interpreted as contextual regional–seasonal covariates rather than as direct sensor readings taken simultaneously from the exact tree represented in each image.
The two studies also differ in predictive scope. Lee et al. primarily addressed general crop-disease classification, whereas the present framework targets olive peacock spot and simultaneously predicts a seven-stage disease category, lesion coverage percentage, and leaf-yellowing percentage. Furthermore, the present work includes an explicit workflow for environmental-variable extraction, feature engineering, image–environment matching, feature selection, duplicate control, and prevention of information leakage during dataset partitioning.
Wu et al. introduced PlantIF, a multimodal semantic interactive fusion framework that integrates plant images with textual semantic information through graph-based reasoning [20]. In PlantIF, the non-image modality represents semantic knowledge related to disease names, botanical characteristics, and symptom descriptions. This approach improves the interaction between visual observations and conceptual disease knowledge. However, textual semantics and numerical environmental covariates serve fundamentally different purposes. PlantIF emphasizes semantic reasoning between images and disease descriptions, whereas the present study investigates whether meteorological, soil, vegetation, moisture, and stress-related descriptors can complement visual features in olive peacock spot assessment.
Albahli proposed AgriFusionNet, a lightweight multimodal architecture integrating RGB or multispectral imagery with environmental and Internet-of-Things sensor information for plant-disease recognition [21]. The model employed an EfficientNetV2-B4-based design and demonstrated that heterogeneous sensing modalities can be combined while maintaining comparatively efficient computation. This work further supports the relevance of multimodal learning in precision agriculture. Nevertheless, its objective was general plant-disease recognition rather than olive-specific, fine-grained, multi-task severity assessment.
Other multimodal agricultural studies have explored combinations of RGB, hyperspectral, multispectral, thermal, remote-sensing, and sensor-based information. These studies collectively demonstrate that heterogeneous modalities may describe complementary aspects of crop condition. At the same time, their applicability depends strongly on the spatial and temporal correspondence among modalities. Directly synchronized measurements provide strong sample-level correspondence but require dedicated field infrastructure. Public geospatial and climatic repositories offer greater accessibility and reproducibility, although their variables generally represent contextual conditions at regional, grid, or seasonal scales rather than exact tree-level measurements.
The proposed framework belongs to the latter category. It does not claim that the environmental values constitute synchronized measurements from each photographed leaf. Instead, it evaluates a proof-of-concept strategy in which real-source environmental descriptors are matched to olive-leaf images according to available regional and temporal information. This formulation is intended to investigate the potential value of environmental context while maintaining a transparent distinction between contextual matching and direct sensor synchronization.
Table 2 compares the proposed framework with representative multimodal plant-disease approaches.

2.3. Critical Synthesis, Research Gap, and Study Motivation

The reviewed literature reveals substantial progress in automated plant- and olive-disease diagnosis. Deep CNNs have improved visual feature extraction, transfer learning has reduced the need for training models entirely from scratch, ensemble methods have strengthened predictive stability, lightweight architectures have supported deployment on constrained devices, and UAV- and Transformer-based systems have extended disease monitoring to larger spatial scales. Multimodal plant-disease studies have further demonstrated that non-image information can complement visual evidence when the additional modalities are appropriately selected and matched.
Despite this progress, three interconnected limitations remain particularly relevant to olive peacock spot assessment.
First, representative olive-disease systems are predominantly image-based. Such models can learn discriminative patterns associated with visible lesions, discoloration, and texture changes, but they do not explicitly include the environmental conditions associated with disease development. This omission is important because fungal infection and symptom progression are influenced by interacting atmospheric, soil, moisture, and vegetation conditions. Environmental information should not replace image evidence, but it may provide complementary contextual signals that improve the representation of disease state.
Second, most previous olive-disease studies formulate diagnosis as binary classification, multi-class disease recognition, or lesion detection. These outputs are useful for identifying the presence or type of disease, but they provide limited information about progressive symptom intensity. In practical disease management, distinguishing among multiple levels of infection may be more informative than producing a single infected/non-infected label. Moreover, continuous estimates of lesion coverage and leaf yellowing can provide quantitative information that is not fully represented by a categorical disease stage alone.
Third, relatively few studies combine fine-grained classification and continuous symptom estimation within one multimodal, multi-task framework. Disease stage, lesion coverage, and yellowing percentage are related but non-identical indicators. Joint learning can allow the shared representation to capture common disease characteristics while preserving task-specific outputs. However, such a formulation requires careful control of label consistency, image duplication, feature-selection leakage, and dataset partitioning.
A further methodological gap concerns the use of publicly accessible environmental repositories. Smart-farm systems can provide synchronized sensor measurements, but such infrastructures are not available for many existing plant-image datasets or production environments. Public sources such as NASA Power, SoilGrids, WoSIS, Copernicus/ERA5, and Sentinel-2 provide an alternative source of real environmental information. Nevertheless, matching these products to images must be described cautiously because the resulting variables represent contextual regional–seasonal conditions rather than exact measurements from the photographed tree. The scientific value of this approach therefore depends on transparent matching rules, leakage prevention, and an explicit acknowledgement of its spatial and temporal limitations.
Motivated by these gaps, the present study develops an environmentally enriched multimodal deep-learning framework for olive peacock spot assessment. The framework combines RGB olive-leaf images with selected meteorological, soil, moisture, vegetation, and environmental-stress descriptors through feature-level fusion between a ResNet50 image branch and a multilayer perceptron numerical branch. The fused representation is optimized within a multi-task architecture to produce three complementary outputs:
1.
Classification of olive peacock spot into seven ordered disease-severity stages;
2.
Regression-based estimation of lesion coverage percentage; and
3.
Regression-based estimation of leaf-yellowing percentage.
The contribution of the study is therefore not limited to replacing one image-classification backbone with another. Instead, it investigates a broader diagnostic formulation that combines fine-grained staging, continuous symptom quantification, and environmental contextualization. In addition, the study establishes a reproducible workflow for constructing an environmentally enriched real-source fused dataset, selecting numerical features using training data only, controlling near-duplicate images before dataset partitioning, and comparing the complete fusion model with appropriate single-modal and reduced-feature baselines.
The proposed framework should be interpreted as a proof of concept rather than as evidence of universal field generalization. Its regional–seasonal environmental matching provides contextual information but does not substitute for synchronized tree-level sensing. Consequently, external evaluation across independent orchards, seasons, cultivars, imaging devices, and environmental conditions remains necessary. Future synchronized data collection will also be important for determining the extent to which tree-level sensor measurements improve upon regional and seasonal environmental descriptors.
Within these stated boundaries, the study addresses a comparatively underexplored intersection of olive-disease recognition, environmental data fusion, fine-grained severity staging, and multi-task quantitative symptom estimation.


3. Methodology of the Proposed Framework

The proposed framework consists of two complementary learning branches operating simultaneously on heterogeneous modalities. The first branch processes RGB leaf images using a fine-tuned ResNet50 convolutional neural network. The second branch processes environmental descriptors using a multilayer perceptron. Unlike image-only systems, both feature representations are fused before prediction, enabling the neural network to exploit correlations between visual disease symptoms and environmental conditions.

3.1. Image Processing Workflow

3.1.1. Image Collection and Cleaning

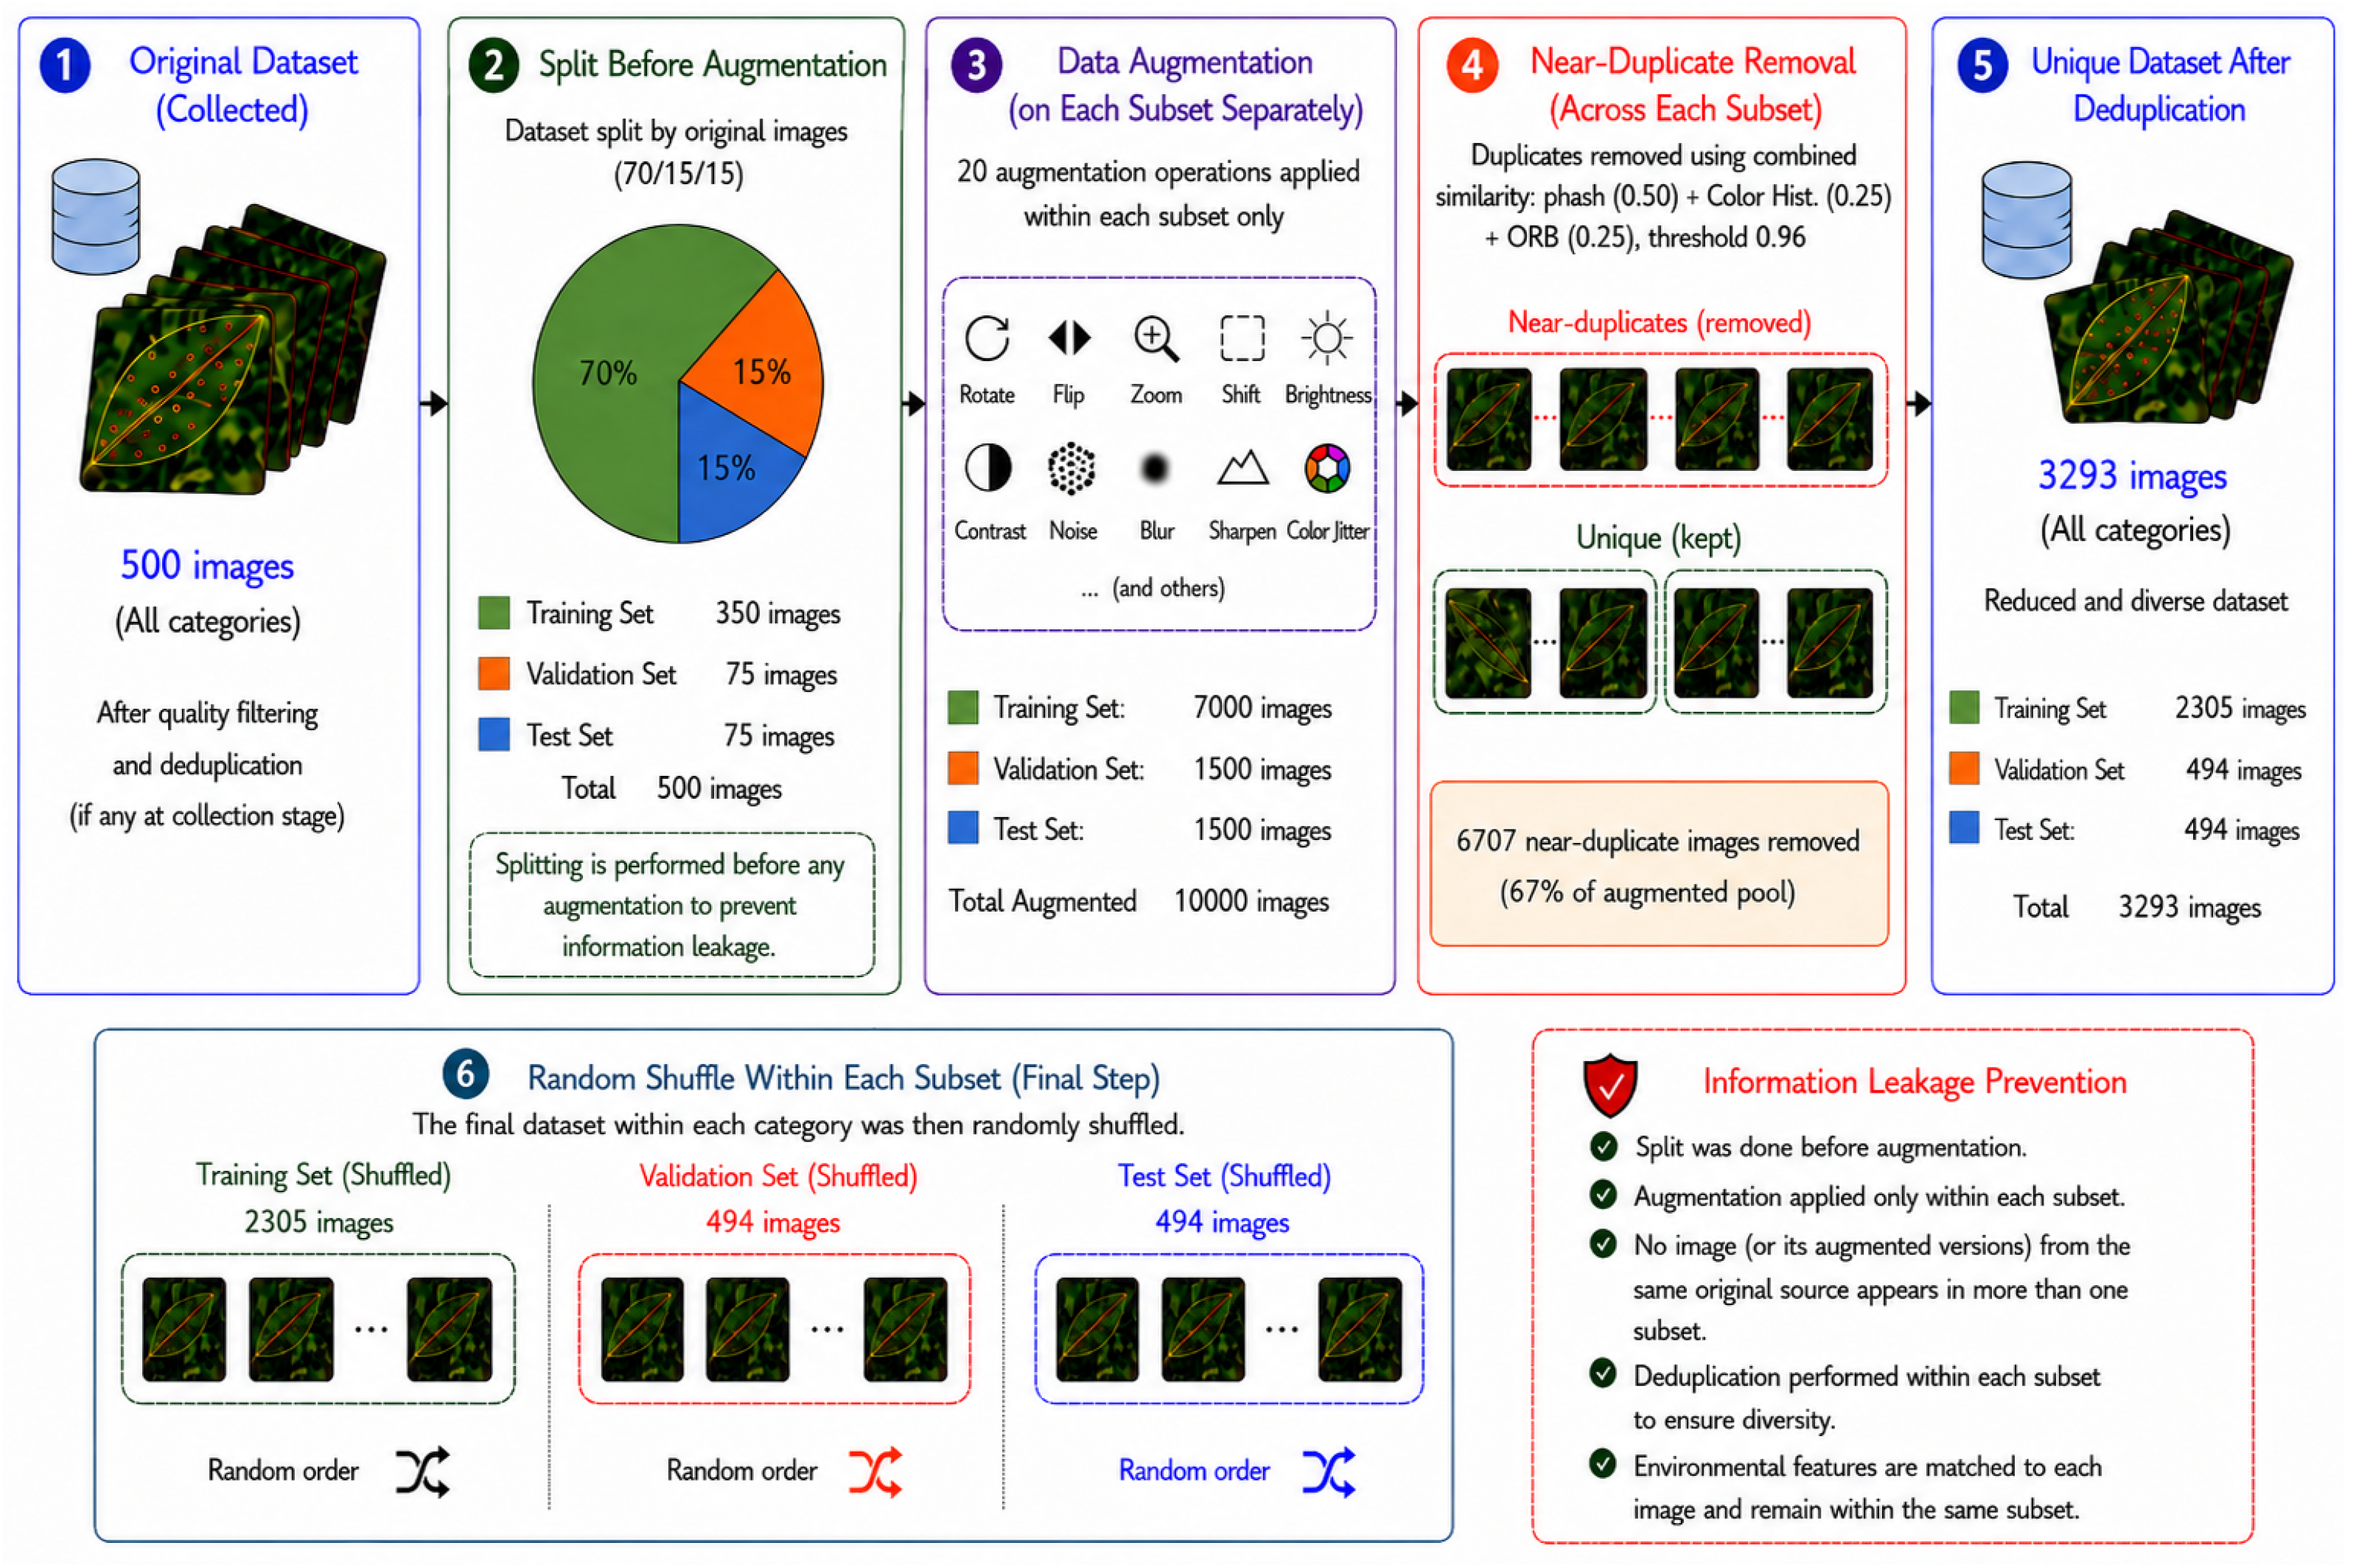
The data set preparation process began with 500 original olive-leaf images representing all seven disease-severity categories from multiple open source datasets. Each image has its own geographical location and temporal information. A comprehensive quality assessment was performed to remove corrupted, unreadable, severely blurred, irrelevant, duplicate, and near-duplicate images, ensuring a high-quality dataset for subsequent analysis. Each retained image was assigned a unique identifier to facilitate traceability and data management while preserving its original annotations, including the disease-severity category, lesion coverage percentage, yellowing percentage, and the corresponding environmental feature vector. This preprocessing step ensured data integrity, consistency, and reliable labeling for model development and evaluation. The dataset follows five distinct photographic styles that reflect common field observation practices, as shown in Table 3.

3.1.2. Disease Progression Stages and System Parameters

Because no universally accepted disease-stage classification exists for olive peacock spot, a seven-level severity scale (Stages 0–6) was developed for this study based on visual symptom progression and the proportion of the leaf surface occupied by lesions. The classification was adapted from published olive leaf spot severity assessment methods [22] while being tailored to the present dataset. Therefore, the dataset consists of seven distinct disease stages representing the progression of peacock spot infection in olive leaves. Each stage corresponds to a specific severity level, ranging from healthy leaves to severely infected cases. A detailed description of these stages is provided in Table 4.

3.1.3. Image Splitting

Table 5 presents the partitioning of the 500 original images at the source-image level using a stratified 70:15:15 split for the training, validation, and testing sets. A 70/15/15 partition was adopted because it is one of the most widely used data-splitting strategies in deep learning and machine learning applications [23,24]. This allocation provides a practical balance between maximizing the amount of data available for model training while preserving independent validation and testing subsets for unbiased model selection and final performance evaluation. Accordingly, 70% of the dataset was allocated to training, whereas the remaining 30% was divided equally into validation (15%) and testing (15%). The partition was generated reproducibly using a fixed random seed. Because the present implementation employs a record-level random split, future work will investigate source-grouped partitioning and repeated stratified cross-validation to provide a more conservative assessment of model generalization.

3.1.4. Subset Augmentation

Apply the augmentation pipeline separately to the training, validation, and testing subsets as shown in Table 6 using an augmentation factor of twenty per source image. Permissible transformations include rotation, biologically appropriate flipping, zooming, translation, brightness and contrast adjustment, controlled noise, mild blur, sharpening, color jitter, cropping, and small affine transformations. Transformations must preserve the disease symptoms.

3.1.5. Duplication Removal

To reduce redundancy and prevent information leakage across the training, validation, and testing subsets, near-duplicate detection was performed on the complete augmented image collection before the final dataset partitioning. Each pair of images i and j was evaluated using a hybrid similarity measure that combines perceptual-hash similarity, color-histogram similarity, and local-feature correspondence.
The hybrid similarity score is
S combined = 0.50 S pHash + 0.25 S hist + 0.25 S ORB
where
  • S combined : the final similarity score between two images after combining the three similarity measures.
  • S pHash : the similarity between the two images based on perceptual hashing.
  • pHash : perceptual hash, which represents the visual appearance of an image using a compact binary code.
  • S hist : the similarity between the color histograms of the two images.
  • hist : the image color histogram.
  • S ORB : the similarity between the two images based on ORB feature matching.
  • ORB : Oriented fast and Rotated brief, which is a local-feature detection and description method.
The perceptual-hash similarity was calculated as
S pHash ( i , j ) = 1 d H ( h i , h j ) L ,
where h i and h j are the perceptual hashes of images i and j, respectively; d H ( h i , h j ) is the Hamming distance between the two hashes; and L is the total hash length in bits. Thus, identical perceptual hashes produce S pHash = 1 , whereas increasing differences between the hashes reduce the similarity score toward zero.
The color-histogram component S hist , denotes the normalized similarity between the color distributions of images (i) and (j). A color histogram represents the distribution of image pixels across different color or intensity ranges. The similarity score was obtained by comparing the normalized histograms of the two images and scaling the result to the interval ([0, 1]), where values close to (1) indicate highly similar overall color distributions and values close to (0) indicate substantial color differences. A value close to 1 indicates that the two images have highly similar color distributions, whereas a value close to 0 indicates substantial differences between their color distributions.

3.1.6. Final Image Construction

An image pair is considered a near duplicate when
S combined 0.96 .
When two images exceed the 0.96 similarity threshold, the sharper or less distorted representative is retained while the redundant image is removed. Following this filtering process, the number removed images was 6707 iamge. The final number of retained images is calculated as
N retained = N augmented N removed = 10 , 000 6707 = 3293 .
Thus, 6707 near-duplicate images, corresponding to approximately 67.07 % of the augmented dataset, are removed. The final retained dataset consists of 3293 images, as presented in Table 7, with the images distributed among the training, validation, and testing subsets.

3.1.7. Dataset Shuffling

The retained training, validation, and testing subsets are independently shuffled using a fixed random seed to ensure reproducibility. This step randomizes the ordering of samples within each subset while preserving the original data partitioning. No image is transferred or exchanged between the training, validation, and testing subsets during the shuffling process. Maintaining fixed subset boundaries prevents data leakage and ensures a fair evaluation of the trained model. The resulting shuffled subsets are then used for subsequent model training and performance assessment.

3.1.8. Leakage Prevention Controls

To ensure a reliable and unbiased evaluation, several data leakage prevention measures are applied throughout the dataset preparation pipeline. These controls maintain strict separation between the training, validation, and testing subsets while preserving the independence of the evaluation data. The following procedures are implemented to prevent leakage across subsets, including image-level, feature-level, and environmental-record leakage.
1.
Splitting original images before augmentation.
2.
Applying augmentation only within the assigned subset.
3.
Preserving the source-image identifier for every augmented image.
4.
Preventing versions of the same source image from appearing in different subsets.
5.
Performing near-duplicate filtering independently within each subset.
6.
Restricting feature selection, hyperparameter tuning, and early stopping procedures to the training and validation subsets only.
7.
Calculating feature importance using the training subset only.
8.
Fitting numerical-feature normalization parameters using the training subset only.
9.
Applying the training-derived normalization parameters to validation and testing data.
10.
Keeping each environmental record in the same subset as its corresponding image.
The complete image processing workflow is illustrated in Figure 1. The workflow summarizes all major preprocessing stages, including dataset splitting, augmentation, source-image tracking, near-duplicate removal, and final subset preparation. It also highlights the applied controls to maintain strict separation between the training, validation, and testing subsets throughout the entire pipeline. These procedures ensure that no image, feature information, or associated environmental record is unintentionally shared across subsets, providing a reliable foundation for model training and evaluation.

3.2. Environmental Data Sources

One of the principal scientific contributions of this work is the integration of heterogeneous environmental descriptors obtained from multiple authoritative public repositories with olive-leaf imagery. Every numerical feature incorporated into the proposed multimodal framework was derived from internationally recognized scientific databases, thereby ensuring traceability, reproducibility, and methodological transparency. To preserve the integrity of the multimodal records, each environmental feature vector was permanently linked to its corresponding image through a unique sample identifier. This image–environment association was maintained throughout the entire processing pipeline, including image collection, augmentation, duplicate removal, dataset partitioning, shuffling, model training, validation, and testing. During augmentation, all images generated from the same source image inherited the identical associated environmental descriptor vector, ensuring that visual transformations did not alter or detach the corresponding numerical context. Consequently, each multimodal sample remained a consistent image–environment pair at every stage of the workflow.

3.2.1. NASA Power Meteorological Database

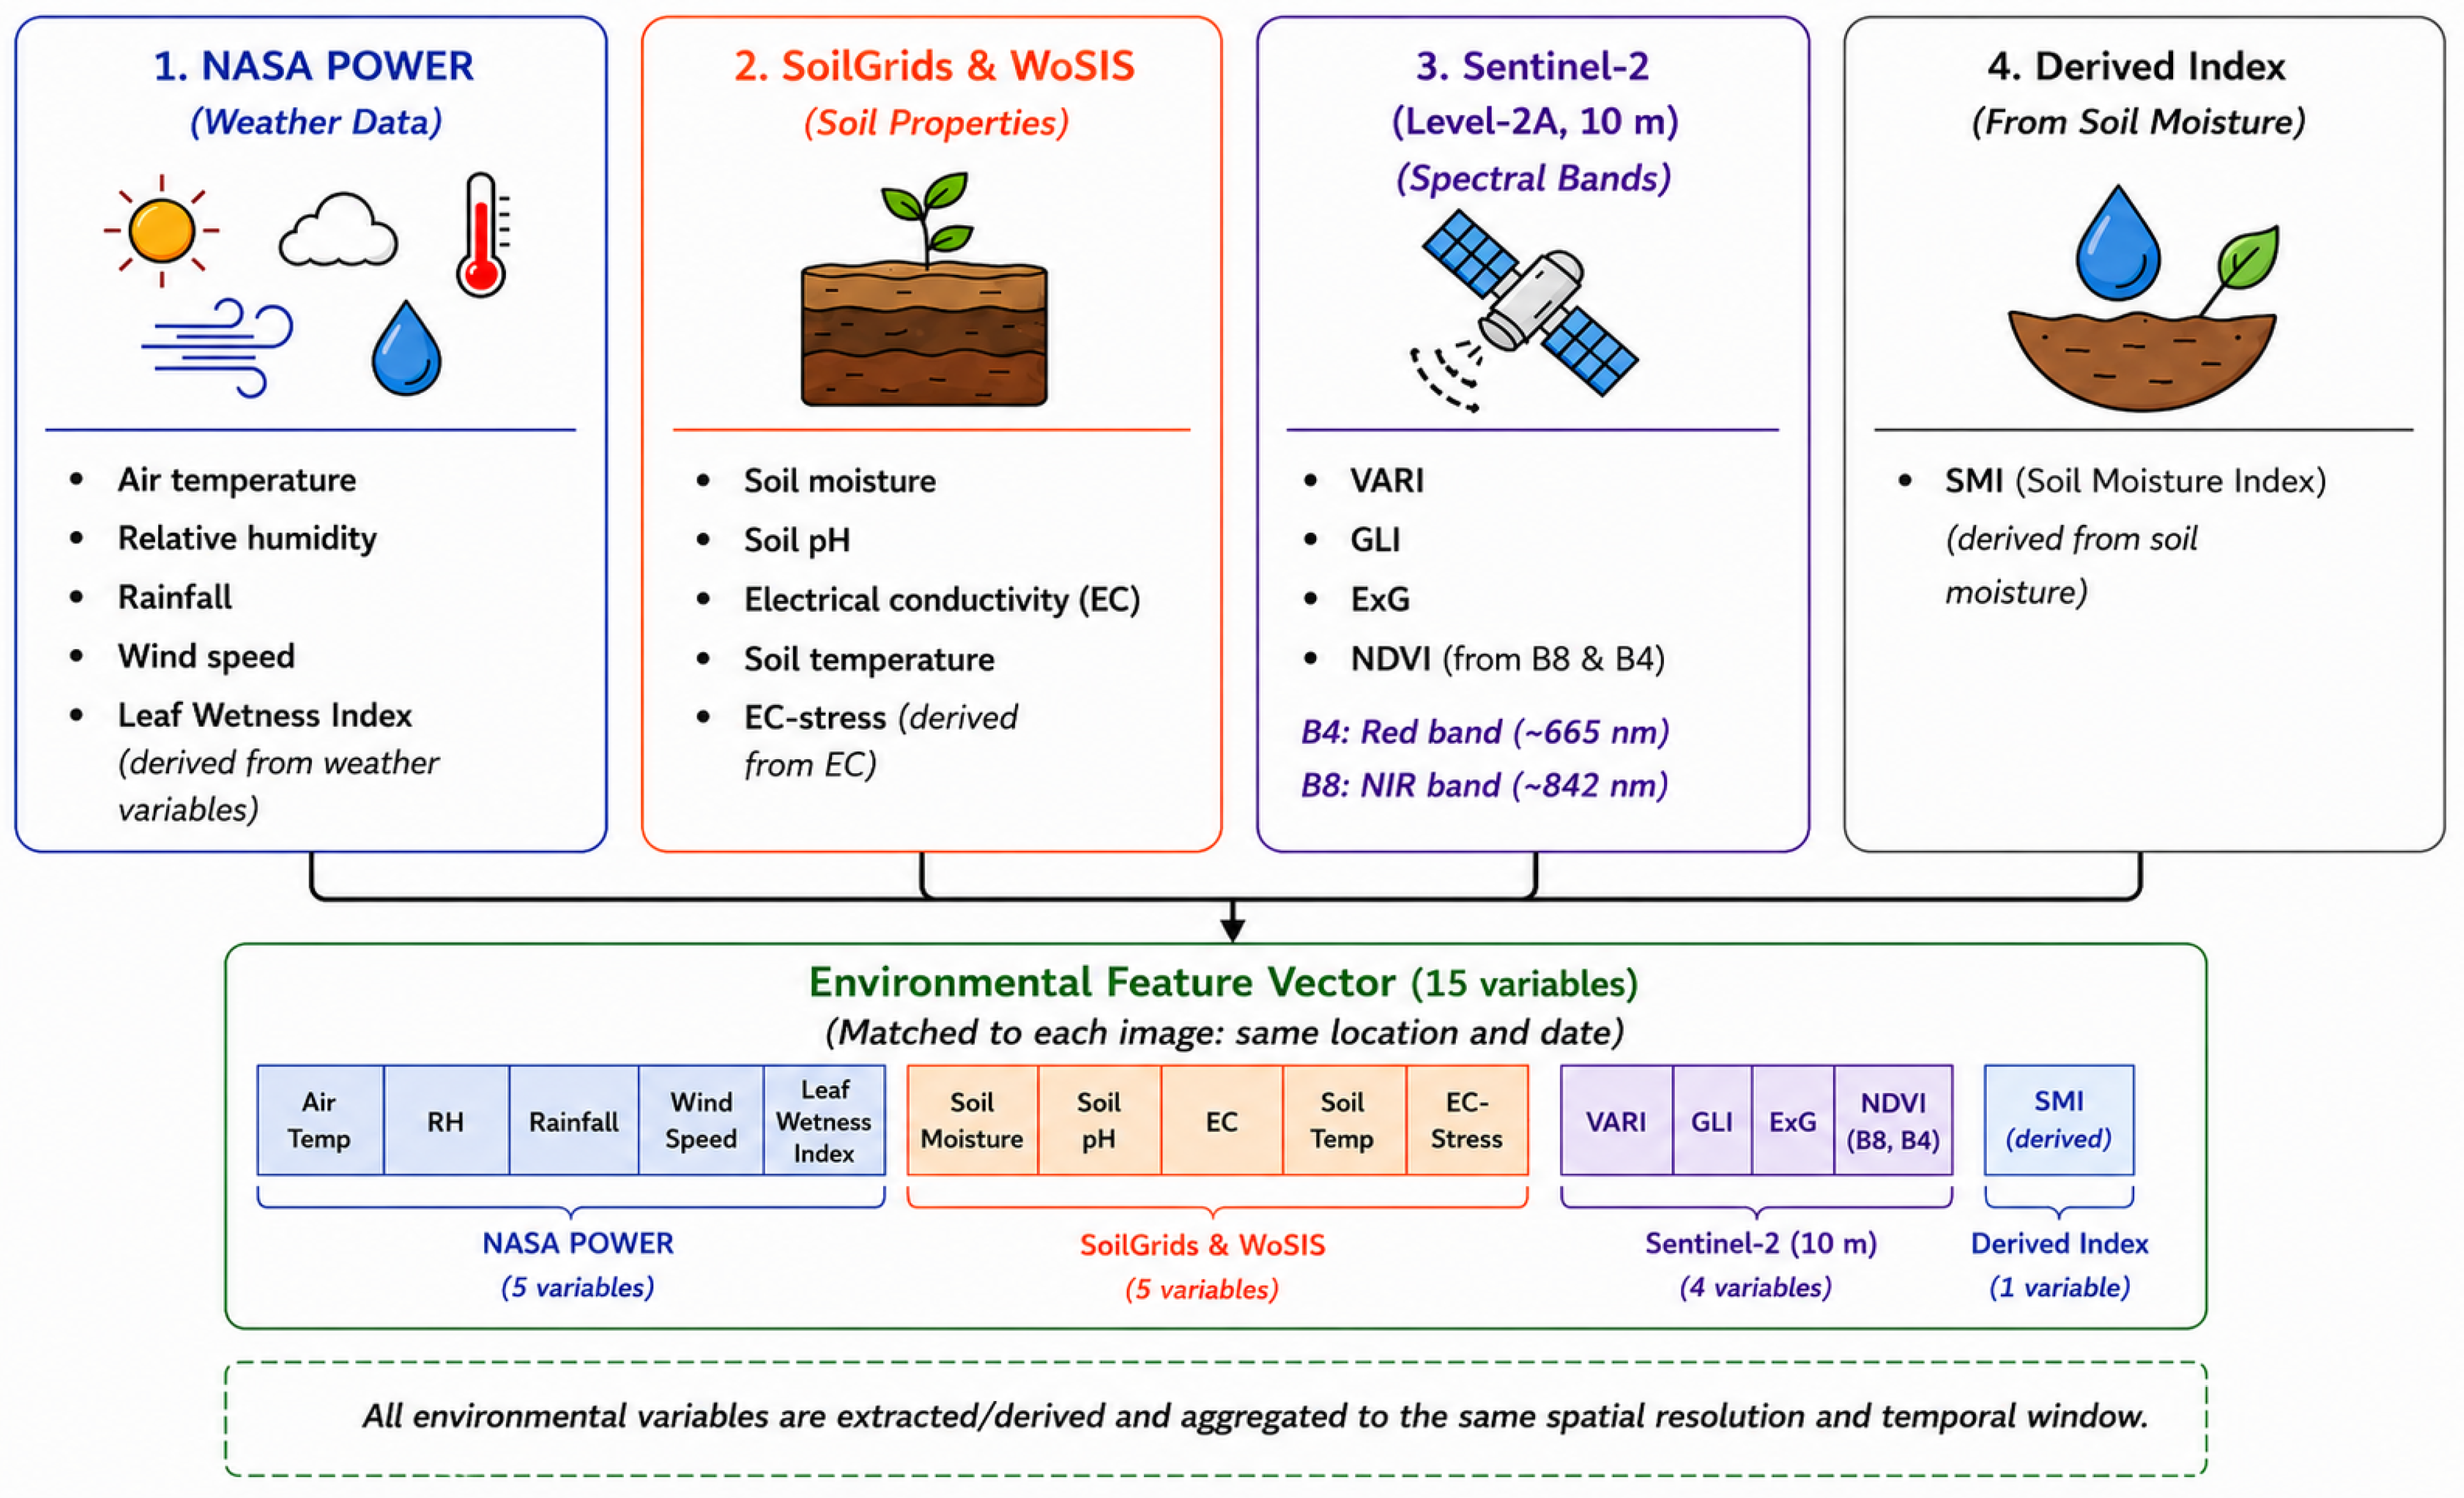
Five principal variables were obtained from NASA Power [25] that include air temperature, relative humidity, rainfall, wind speed, and the derived leaf wetness. These variables influence fungal metabolism, spore dispersal, canopy drying, and evaporation. Table 8 presents the key atmospheric variables considered in this study and explains their relevance to fungal development. By outlining their ranges and biological significance, the table demonstrates how these factors collectively create conditions that may favor progression.

3.2.2. SoilGrids Digital Soil Repository

Digital soil information was obtained from SoilGrids [26]. These variables characterize the edaphic conditions that can influence fungal development both directly and indirectly through their effects on soil water availability, microbial activity, nutrient accessibility, salinity stress, root functioning, and overall tree physiological condition. Soil moisture and soil temperature affect water availability and biological activity within the root zone, while soil pH regulates nutrient solubility and availability. Electrical conductivity reflects soil salinity, and the derived EC-stress index represents the potential physiological stress imposed on the tree under elevated salinity conditions.
Table 9 outlines the main soil-related variables incorporated into the dataset, including their measurement units, observed ranges, and corresponding interpretations.

3.2.3. Sentinel-2 Multispectral Imagery

Sentinel-2 multispectral imagery provides observations extending beyond the visible spectrum into the near-infrared and red-edge wavelengths [27]. From the spectral reflectance of olive leaves, the Vegetation Atmospherically Resistant Index (VARI), Green Leaf Index (GLI), Excess Green Index (ExG), Normalized Difference Vegetation Index (NDVI), and Salinity Moisture Index (SMI) were calculated [28].
Table 10 summarizes these vegetation and stress indices, including their abbreviations, value ranges, and practical applications. Together, they provide complementary information on vegetation greenness, photosynthetic activity, water availability, and salinity-related stress, supporting the assessment of olive tree health and disease susceptibility.
The environmental repositories and the corresponding extracted feature groups are summarized schematically in Figure 2, while their sources, accessibility, and processing are given in the Table 11.

3.3. Environmental Feature Reduction

Before the numerical branch was trained, the original 15 features were reduced to 10. Feature importance was evaluated using a neural-network weight-based analysis of the numerical MLP branch. After model training, the weight matrix of the first fully connected layer, which connects the numerical input variables to the hidden neurons, was extracted. This was repeated five times. The average importance scores were derived from the first fully connected layer of the trained MLP. For every feature, mean absolute weight, maximum absolute weight, L 2 norm, and weight variance were normalized and averaged as
F I i = M A W i + M A X i + L 2 i + V A R i 4 .
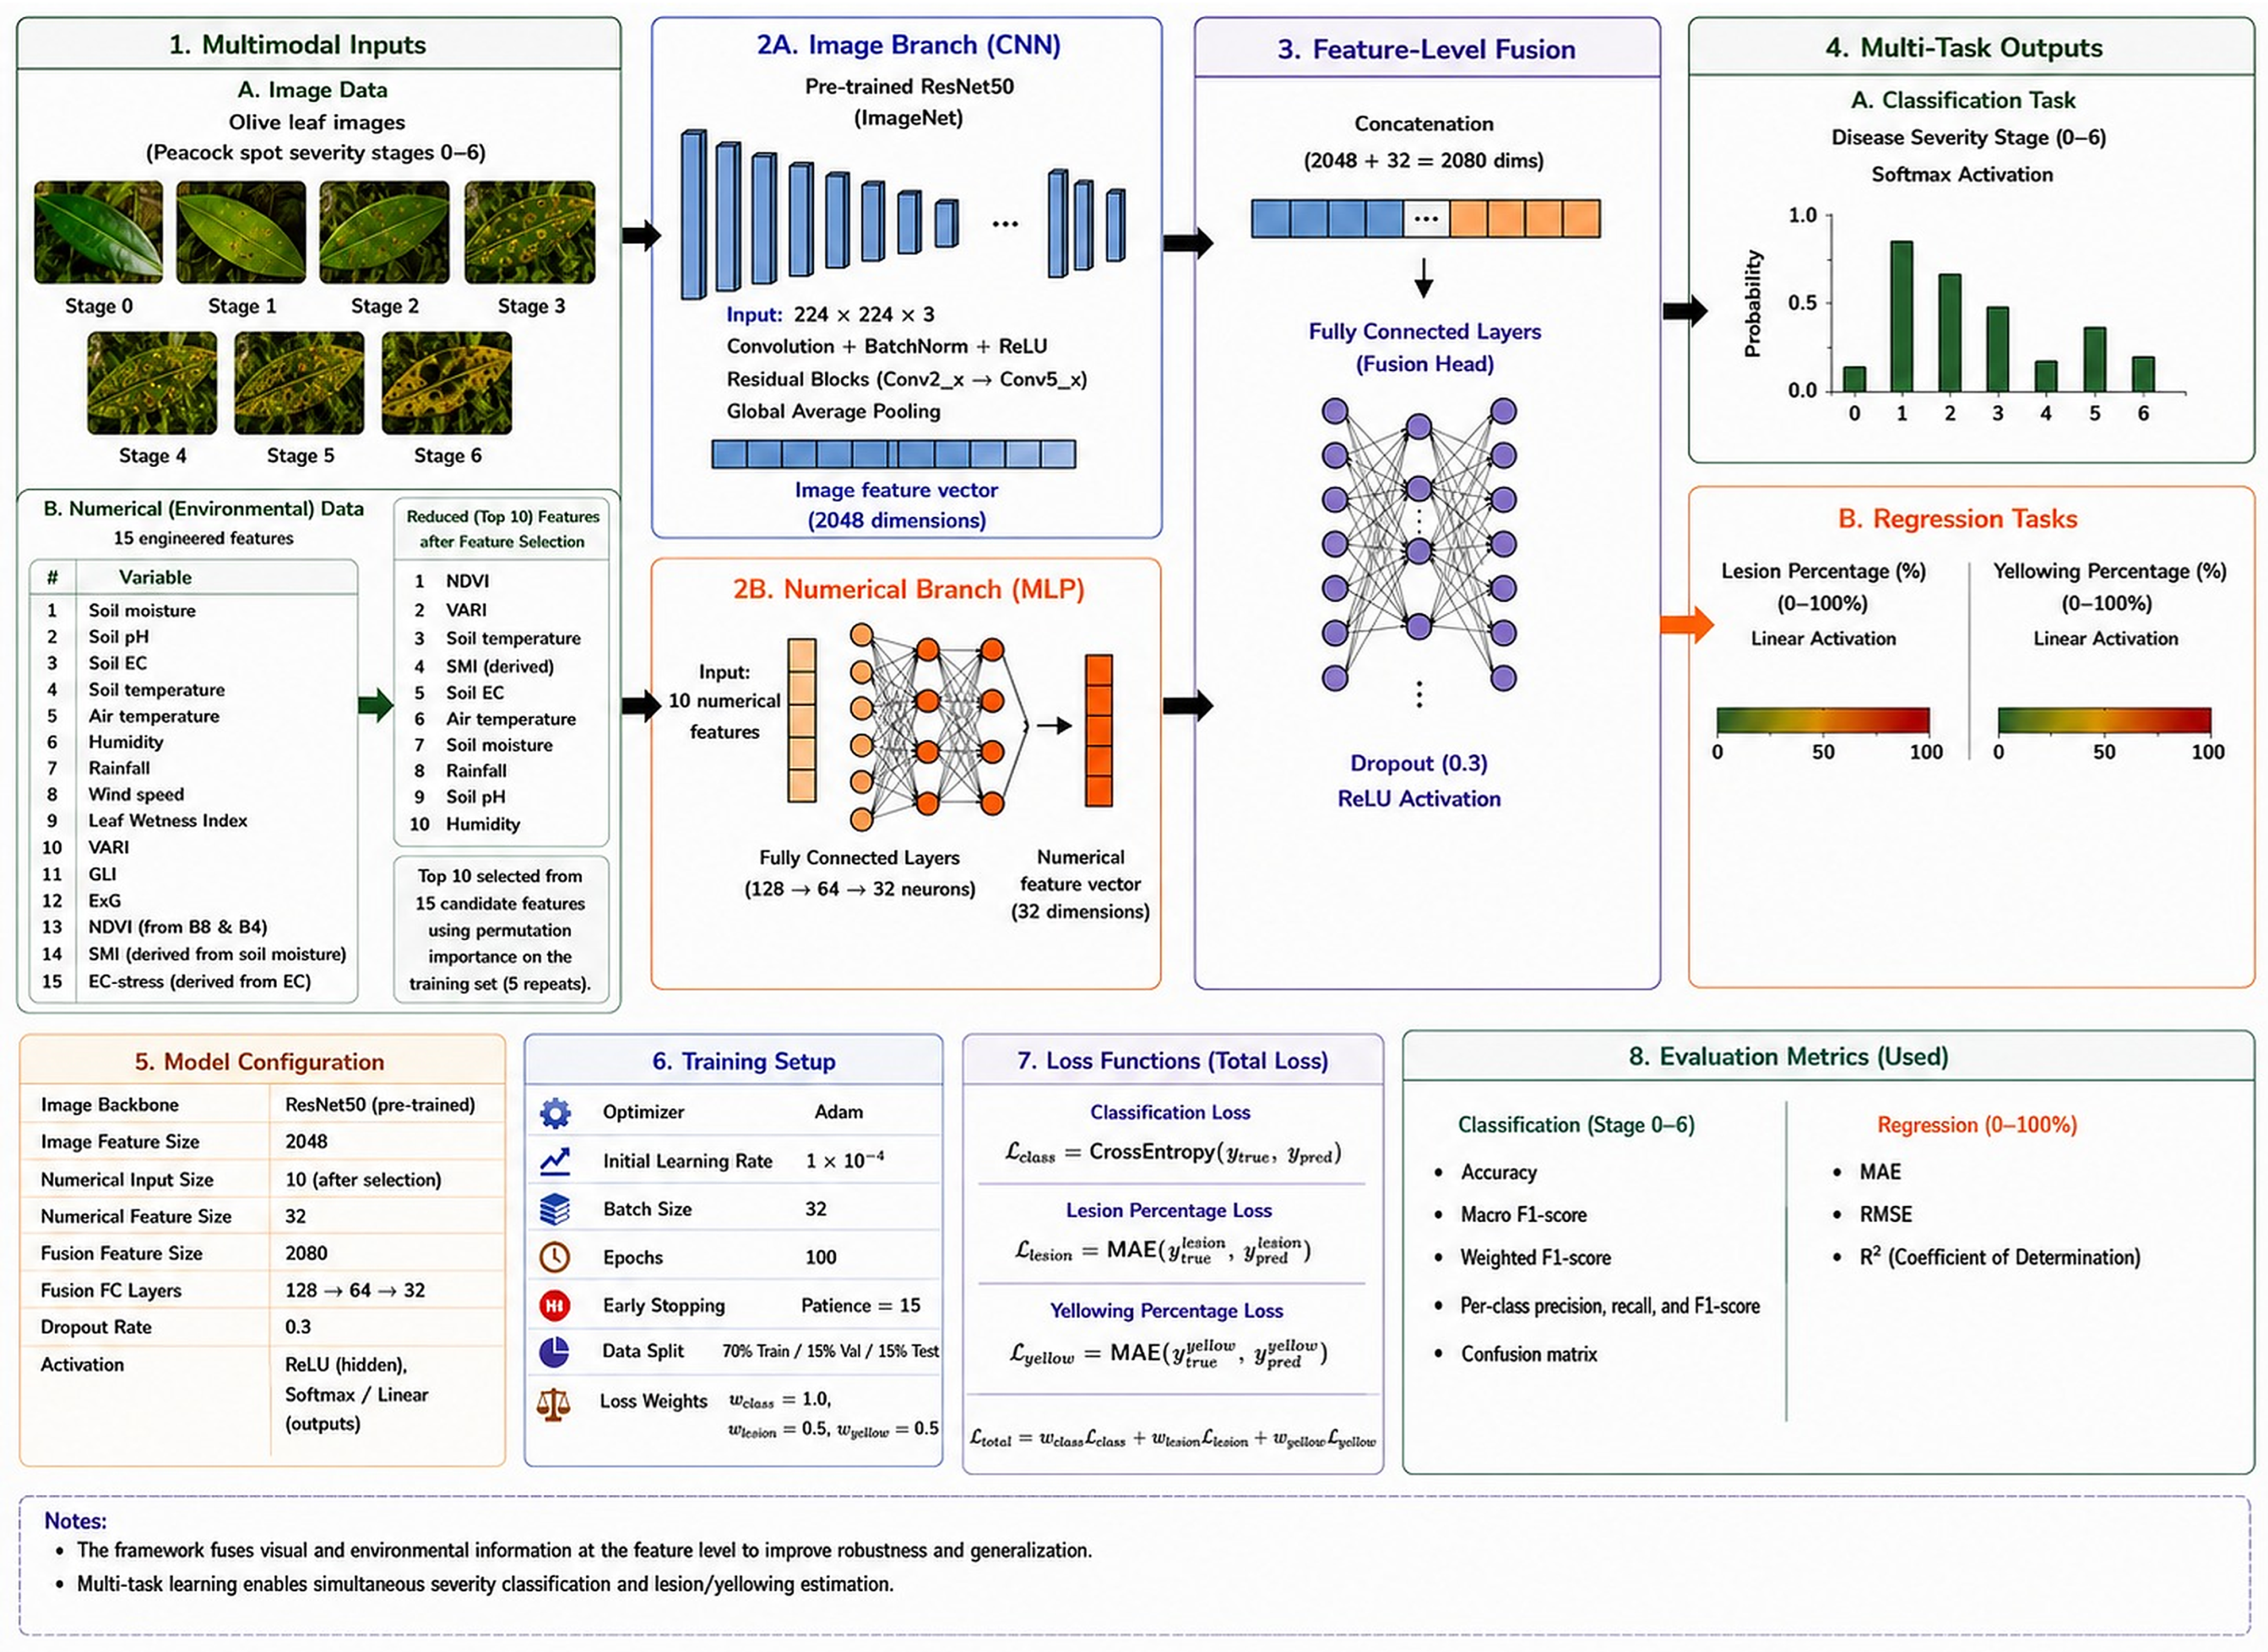
The 10 selected features are NDVI, VARI, soil temperature, SMI, soil EC, air temperature, soil moisture, rainfall, soil pH, and humidity. Wind speed, Leaf Wetness Index, GLI, ExG, and EC-stress are removed. Consequently, the numerical input dimensionality is reduced from 15 to 10 before the data enter the multilayer perceptron. This feature-reduction step decreases model complexity, removes weak or redundant variables, and helps limit overfitting. Table 12 summarizes the 10 selected environmental descriptors and their corresponding importance rankings.

3.4. Modal Fusion

The proposed system combines olive leaf images with numerical environmental and engineered variables to classify disease severity and estimate symptom percentages. The image dataset contains olive leaves representing seven disease stages, ranging from Stage 0 for healthy leaves to Stage 6 for very severe infection. In parallel, the numerical dataset initially contains 10 candidate variables: NDVI, VARI, soil temperature, SMI, soil EC, air temperature, soil moisture, rainfall, soil pH, and humidity. Each image within the data set is attached with its environmental description. The summary of the input data and feature reduction is shown in Table 13.
Each olive leaf image is resized to 224 × 224 × 3 pixels and supplied to an ImageNet-pre-trained ResNet50 network. The image passes through convolutional layers, batch-normalization operations, ReLU activations, residual blocks, and global average pooling. This process produces a 2048-dimensional image feature vector. In parallel, the 10 selected numerical variables are supplied to a multilayer perceptron containing fully connected layers with 128, 64, and 32 neurons. The numerical branch produces a 32-dimensional feature vector. The 2048-dimensional image representation and the 32-dimensional numerical representation are concatenated to form a 2080-dimensional fused feature vector. This fused vector is processed by fully connected layers containing 128, 64, and 32 neurons. ReLU activation is used in the hidden layers, and dropout with a rate of 0.3 is applied to reduce overfitting as shown in Table 14.
The final shared representation is connected to three output heads. The first head performs seven-class disease-severity classification using softmax activation. The second head estimates lesion percentage on a continuous scale from 0% to 100%, and the third estimates yellowing percentage over the same range. Linear activation is used for both regression outputs.
As shown in Table 15, the model is trained using the Adam optimizer with an initial learning rate of 1 × 10 4 , a batch size of 32, and a maximum of 100 epochs. The dataset is divided into 70% training, 15% validation, and 15% testing subsets. Early stopping with a patience of 15 epochs is applied. The total loss combines cross-entropy for severity classification with mean absolute error for lesion and yellowing estimation. The classification loss is assigned a weight of 1.0, while the lesion and yellowing losses are each assigned a weight of 0.5.
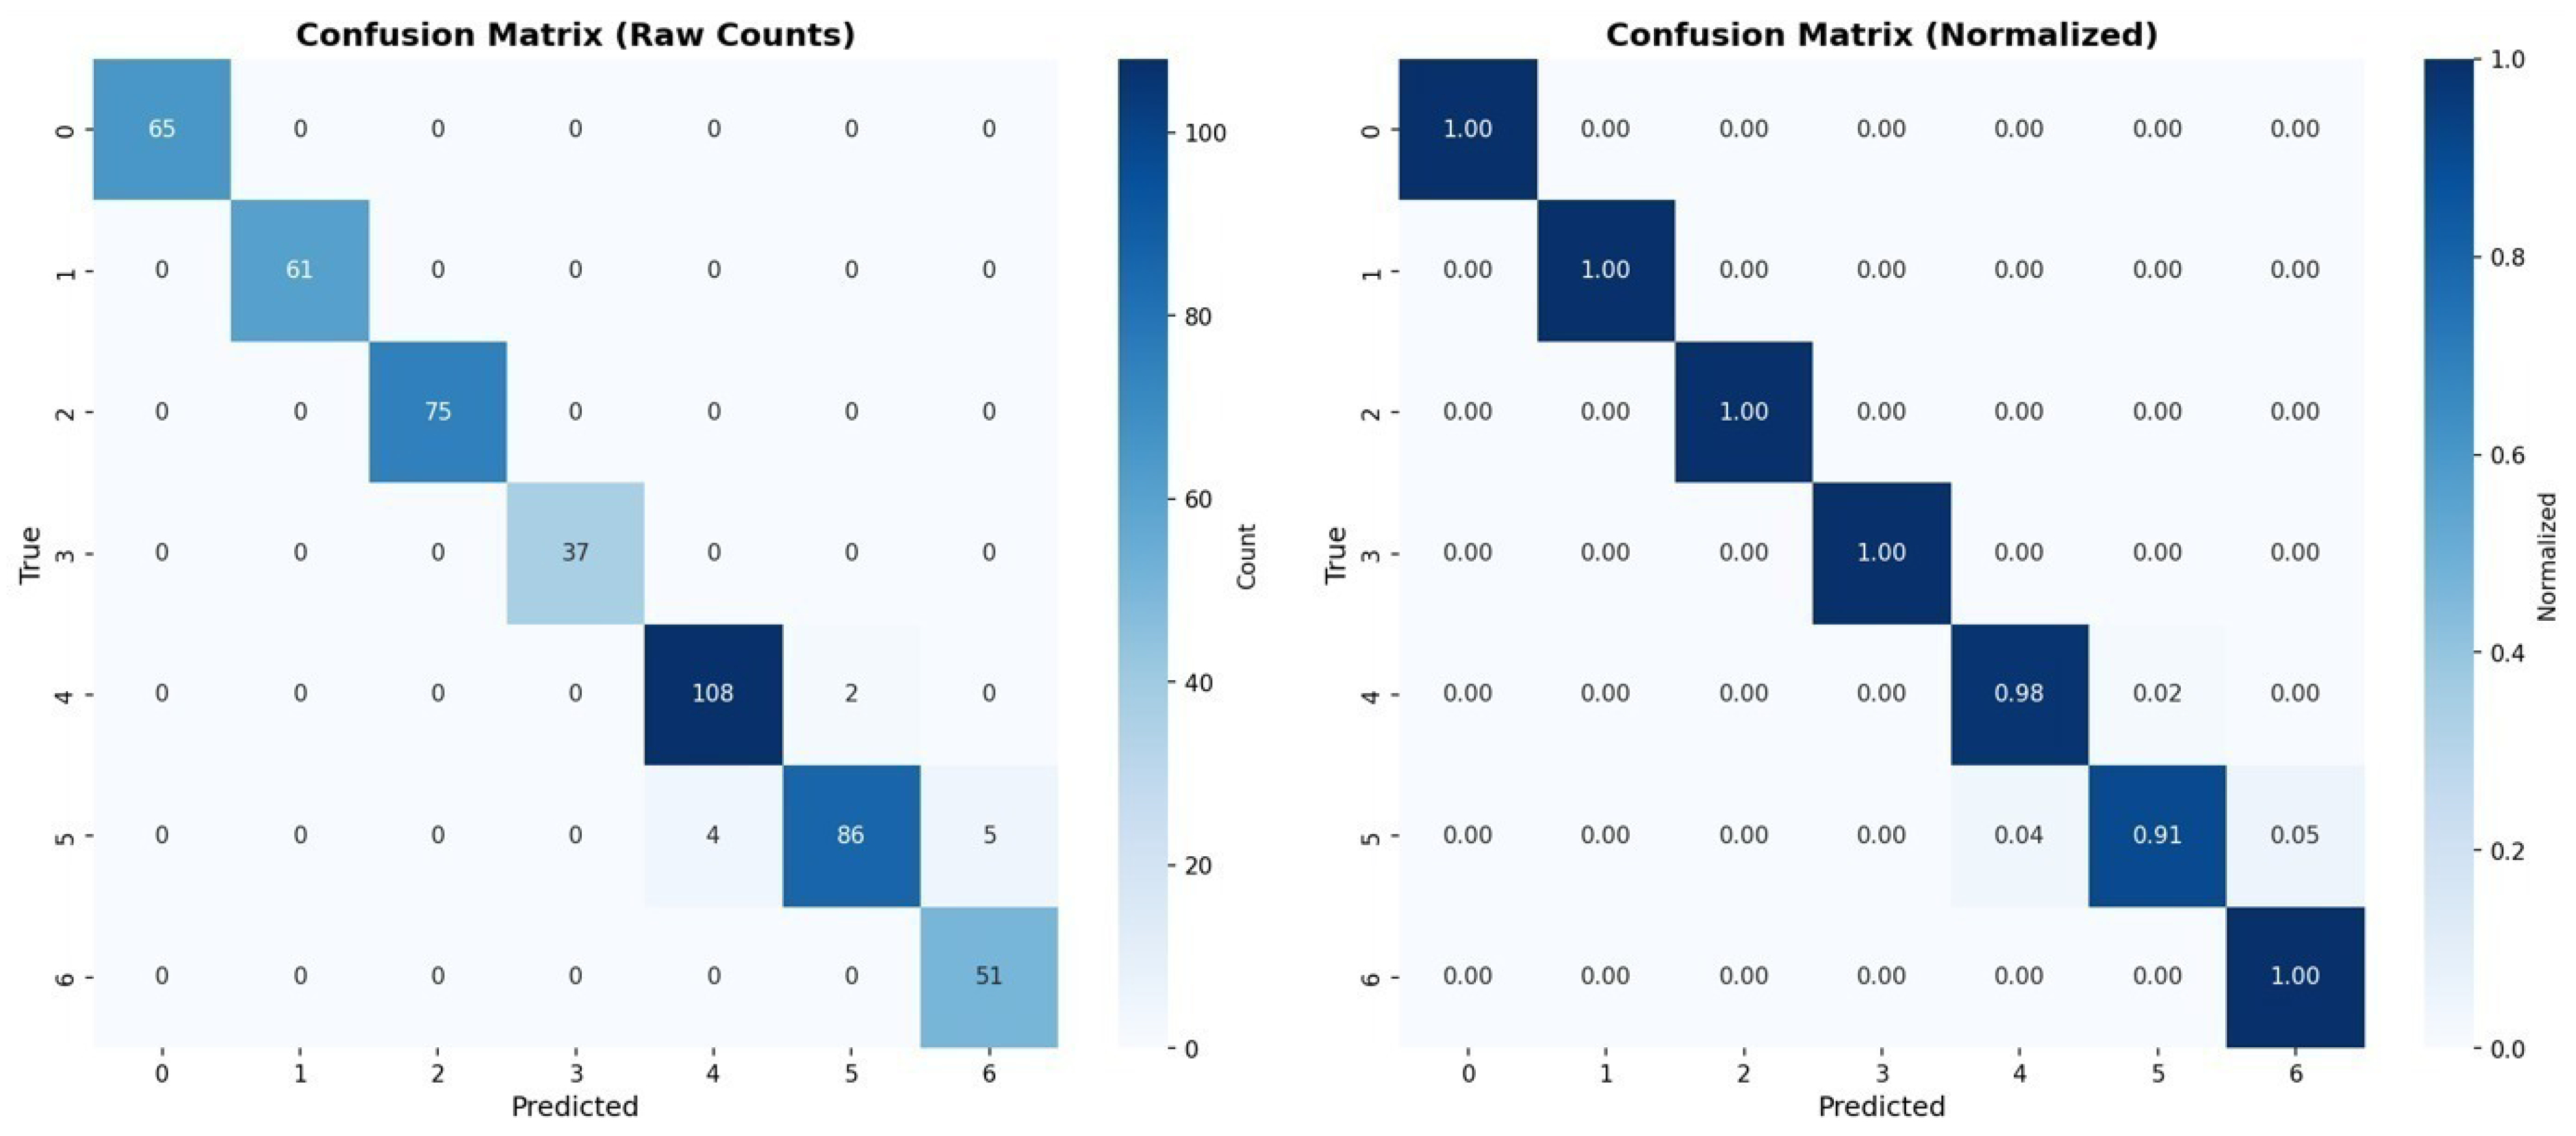
Classification performance is evaluated using accuracy, Macro F1-score, Weighted F1-score, and raw and normalized confusion matrices. Regression performance is evaluated using MAE, RMSE, and R 2 . The confusion matrix shows that the remaining classification errors are concentrated between Stages 4, 5, and 6, which are adjacent advanced severity stages with closely related visual symptoms. Overall, the framework integrates visual disease characteristics with environmental information at the feature level and supports simultaneous disease-stage classification, lesion-percentage estimation, and yellowing-percentage estimation as presented in Table 16.
The overall architecture of the proposed hybrid multimodal deep learning framework is shown in Figure 3. The Figure illustrates the integration of the image-based feature extraction branch and the numerical feature processing branch, followed by feature-level fusion and multi-task prediction. The framework demonstrates how heterogeneous input sources are combined to improve severity classification and regression-based estimation tasks. This unified architecture enables simultaneous analysis of visual symptoms and environmental factors for comprehensive olive leaf disease assessment.

4. Results and Discussion

4.1. Classification Performance Metrics

Classification performance was evaluated using class-wise precision, recall, and F1-score, together with macro-averaged F1-score, weighted F1-score, and overall accuracy. Precision measures the proportion of samples predicted as belonging to a given disease stage that were classified correctly, whereas recall measures the proportion of actual samples from that stage that were successfully identified. The class-wise F1-score represents the harmonic mean of precision and recall and therefore provides a balanced assessment when either false-positive or false-negative predictions are present. Macro F1-score was calculated by averaging the F1-scores of all seven disease stages with equal importance, making it particularly useful for assessing performance independently of class frequency. In contrast, weighted F1-score averages the class-specific F1-scores according to the number of samples in each class and therefore reflects the influence of the observed class distribution. Overall accuracy represents the proportion of correctly classified samples across the entire test set. Considering these metrics together provides a more comprehensive evaluation than accuracy alone, particularly when the disease-stage classes are not equally represented.
As seen in Table 17, the model achieved an overall classification accuracy of 97.77%, with a macro-averaged F1-score of 0.9809 and a weighted F1-score of 0.9776. These results indicate consistently strong performance across both the majority and minority disease stages.
The confusion matrix presented in Figure 4 demonstrated perfect classification performance for Stages 0–3, while all 11 misclassifications were concentrated within the more advanced stages (Stages 4–6). Specifically, two Stage 4 samples were classified as Stage 5, four Stage 5 samples were classified as Stage 4, and five Stage 5 samples were classified as Stage 6. No Stage 6 sample was missed, resulting in a recall of 1.00 for the severe stage, although its precision was slightly reduced because some Stage 5 samples were assigned to this class.
This error pattern is consistent with the visual progression of peacock spot disease. Early stages are more visually separable because they range from healthy leaves to limited and clearly localized symptoms. In contrast, Stages 4–6 share increasingly similar lesion density, yellow halos, discoloration, and necrotic patterns. Therefore, the remaining errors occurred only between neighboring advanced stages rather than between clinically distant disease categories. This agreement between the confusion matrix and the defined disease progression supports the internal consistency of the seven-stage labeling system.
The few misclassifications that occurred were confined to the moderate and strong infection stages, which are expected to share highly similar visual symptoms and environmental characteristics. In contrast, no biologically implausible predictions were observed. For example, healthy leaves were never classified as severe infections, nor were severely infected leaves classified as early disease stages.
Table 18 provides a detailed breakdown of the model’s performance at the individual class level, enabling a closer examination of how the classifier behaves across different disease severity categories. The results reveal a stable performance distribution among the seven classes, with all categories achieving high precision, recall, and F 1 -score values. This indicates that the model maintains effective discrimination capability across the severity spectrum rather than relying on strong performance from only a subset of classes. The consistency between the precision and recall values for most stages suggests a well-balanced classification behavior, with limited bias toward over-predicting or under-detecting specific severity levels. These findings further demonstrate the reliability of the proposed framework for fine-grained disease severity recognition and confirm its ability to capture subtle differences among the defined classification stages.

4.2. Regression Performance Metrics

The regression performance of the proposed model was evaluated by estimating disease severity using the continuous variables of lesion coverage and yellow leaf coverage. Performance was assessed using mean absolute error, root mean square error, and the coefficient of determination. MAE was selected as the primary evaluation metric because it directly represents the average prediction error in percentage points, making it more interpretable and practical for disease severity assessment and monitoring. RMSE was included to measure the magnitude of prediction errors with greater sensitivity to large deviations, while R 2 was used to quantify how well the model explained the variance in the target variables.
Table 19 summarizes the regression performance of the proposed model for estimating lesion coverage and yellowing percentage. The model achieved low prediction errors for both targets, with MAE values of 1.16% and 1.42% for lesion coverage and yellowing percentage, respectively, indicating that the average estimation error was close to one percentage point. The corresponding RMSE values of 1.25% and 1.52% further demonstrate that large prediction errors were infrequent. In addition, the high R 2 values of 0.95 for lesion coverage and 0.94 for yellowing percentage indicate that the model explained more than 94% of the variance in the ground-truth measurements. Overall, these results demonstrate that the proposed model provides accurate and reliable disease severity estimation for both lesion coverage and leaf yellowing.
Despite the excellent classification performance, the relatively limited number of original images (500 samples) naturally raises concerns regarding potential overfitting. Image augmentation cannot generate completely independent biological observations, and therefore the effective diversity of the dataset remains fundamentally constrained by the 500 original images.
This problem was solved using different scenarios related to the internal structure of the deep learning model. First, several deep learning methodological decisions were adopted to minimize this risk. Most importantly, the dataset was first divided into independent training, validation, and testing subsets before any augmentation procedures were performed. Data augmentation was subsequently applied separately within each subset, thereby preventing augmented versions of the same source image from appearing across multiple subsets. Near-duplicate image removal based on perceptual hashing, color-histogram similarity, and ORB feature matching was additionally employed to improve diversity within the augmented dataset. Consequently, the final model evaluation was performed using samples originating from source images that were never used during model training, substantially reducing the possibility of direct information leakage. Second, additional regularization strategies further contribute to mitigating overfitting tendencies. The use of an ImageNet-pretrained ResNet50 backbone reduces the dependence on learning all visual representations exclusively from the limited olive disease dataset. Furthermore, dropout regularization, early stopping based on validation performance, controlled augmentation procedures, and feature selection performed exclusively on the training subset collectively improve model robustness and restrict memorization of image-specific characteristics.
From a machine-learning perspective, the incorporation of complementary environmental information is particularly beneficial when image data is limited. The additional modality provides discriminative cues that may improve the separability of visually similar severity stages while simultaneously reducing the model’s dependence on extremely large image collections. Although the proposed multimodal representation cannot replace the need for larger and more diverse datasets, it substantially increases the information content associated with each individual sample. Consequently, the environmental variables contribute not only to improved classification performance but also to increased robustness of the learned decision boundaries by distributing the learning process across both visual and environmental representations. This complementary learning mechanism may partially mitigate the tendency toward overfitting that frequently accompanies limited image datasets by reducing the reliance on memorizing image-specific characteristics.
Accordingly, the reported results should be interpreted as strong proof-of-concept evidence obtained under the adopted experimental protocol rather than definitive evidence of universal field generalization. Independent external validation involving additional orchards, cultivars, seasons, imaging devices, and environmental conditions remains an important direction for future work.

5. Limitations and Future Work

Although the proposed multimodal deep learning framework achieved promising performance in peacock spot disease detection and severity estimation, several limitations remain. The dataset exhibits class imbalance across disease stages, with some stages being underrepresented, which may affect the model’s performance on minority classes. In addition, distinguishing between adjacent disease stages remains challenging because of high visual similarity. The regression outputs, particularly leaf yellowing estimation, are also sensitive to image noise, illumination variation, and background complexity, which may introduce uncertainty into severity prediction.
Another limitation of this study is the relatively limited dataset size. The proposed approach was developed using 500 images, which were collected and used due to data availability constraints. Expanding the dataset in future work would likely improve model performance and enhance its generalization capability.
Future research will focus on expanding the dataset by incorporating more real-world field samples and improving the balance among disease-stage classes. Advanced training strategies, such as focal loss and adaptive class-weighting methods, may also be investigated to further address class imbalance and improve classification performance for visually similar disease stages.
In addition, future studies may explore the development of a comprehensive inoculate–monitor–detect–treat experimental framework under controlled and regulated field conditions. In this framework, supervised inoculation zones could be established in selected areas of large-scale olive farms, followed by continuous monitoring of disease development and spread using image-based, environmental, soil, and spatiotemporal data. The final stage would involve automated disease detection and targeted treatment strategies. Such an environment could support the creation of an integrated spatiotemporal disease database containing comprehensive information on disease occurrence, progression, environmental drivers, and treatment response. This platform would open new research directions for smart agriculture, precision olive disease management, and large-scale decision-support systems for crop protection.

6. Conclusions

This paper presented an environmentally enriched multimodal deep-learning framework for olive peacock spot disease-stage classification and quantitative severity estimation. The framework combines RGB leaf imagery with regional–seasonal environmental descriptors and uses ResNet50–MLP feature fusion to predict seven disease stages, lesion coverage, and yellowing percentage.
The results demonstrate internal feasibility under the prepared evaluation protocol, achieving high classification accuracy and precise severity estimation, highlighting the value of multimodal data fusion for plant disease assessment. Furthermore, the study established a transparent and reproducible methodology by leveraging publicly available environmental datasets rather than synchronized field measurements, providing a practical proof of concept for multimodal agricultural intelligence. The proposed framework offers a scalable foundation for precision agriculture applications that combine satellite observations, environmental monitoring, and computer vision for improved crop health management. Accordingly, the proposed framework should be viewed as a proof of concept, with its findings demonstrating methodological feasibility rather than universal applicability under diverse field conditions. Broader deployment requires synchronized field data and independent external validation.

Author Contributions

Conceptualization, Z.S.A.-H. and M.F.A.M.; Methodology, Z.S.A.-H. and M.F.A.M.; Software, N.M.A., E.N.A., A.B.A., H.A.A. and I.H.A.; Validation, N.M.A., E.N.A., A.B.A., H.A.A. and I.H.A.; Formal analysis, M.F.A.M., E.N.A., I.H.A. and H.A.A.; Investigation, M.F.A.M., N.M.A., A.B.A., H.A.A. and I.H.A.; Resources, N.M.A., A.B.A., H.A.A. and I.H.A.; Data curation, E.N.A., A.B.A. and H.A.A.; Writing—original draft, M.F.A.M.; Writing—review & editing, Z.S.A.-H. and M.F.A.M.; Visualization, M.F.A.M.; Supervision, Z.S.A.-H.; Project administration, Z.S.A.-H. All authors have read and agreed to the published version of the manuscript.

Funding

This research received no external funding.

Institutional Review Board Statement

Not applicable.

Informed Consent Statement

Not applicable.

Data Availability Statement

Restrictions apply to the availability of the datasets presented in this study. The datasets are not publicly available because they contain proprietary research materials and are being retained to protect the authors’ intellectual property rights and potential future commercialization. Requests for access may be directed to the corresponding author. They will be considered on a case-by-case basis, subject to institutional approval and the execution of an appropriate data-use or confidentiality agreement.

Conflicts of Interest

The authors declare no conflicts of interest.

References

  1. Cardoni, M.; Mercado-Blanco, J. Confronting Stresses Affecting Olive Cultivation from the Holobiont Perspective. Front. Plant Sci. 2023, 14, 1261754. [Google Scholar] [CrossRef] [Scilit] [PubMed]
  2. Food and Agriculture Organization of the United Nations. Olive: Crop Information. 2026. Available online: https://www.fao.org/land-water/databases-and-software/crop-information/olive/en/ (accessed on 18 July 2026).
  3. Food and Agriculture Organization of the United Nations. Importance of Olive Production and Olive Tree By-Products. 2026. Available online: https://www.fao.org/4/X6545E/X6545E01.htm (accessed on 18 July 2026).
  4. Food and Agriculture Organization of the United Nations. Assisi–Spoleto Olive Groves: Globally Important Agricultural Heritage System. 2026. Available online: https://www.fao.org/giahs/giahs-around-the-world/italy-assisi-spoleto-olive-groves/ (accessed on 18 July 2026).
  5. Zipori, I.; Erel, A.; Yermiyahu, U.; Ben-Gal, A.; Dag, A. Sustainable Management of Olive Orchard Nutrition: A Review. Agriculture 2020, 10, 11. [Google Scholar] [CrossRef] [Scilit]
  6. International Olive Council. Production Techniques in Olive Growing; International Olive Council: Madrid, Spain, 2007. [Google Scholar]
  7. Nigro, A.; Schena, L.; Pentimone, I. Symptomatology of Major Fungal Diseases on Olive and Their Management. Austin J. Environ. Toxicol. 2022, 8, 1043. [Google Scholar] [CrossRef] [Scilit]
  8. Australian Olive Association. Olive Diseases and Agri-Chem and IPM Control Options: Significant Fungal Diseases of the Olive Tree Canopy. 2021. Available online: https://australianolives.com.au/wp-content/uploads/2021/02/Significant-Diseases-of-Olives_February-2021.pdf (accessed on 18 July 2026).
  9. Buonaurio, R.; Almadi, L.; Famiani, F.; Moretti, C.; Agosteo, G.E.; Schena, L. Olive Leaf Spot Caused by Venturia oleaginea: An Updated Review. Front. Plant Sci. 2023, 13, 1061136. [Google Scholar] [CrossRef] [Scilit] [PubMed]
  10. University of California Statewide Integrated Pest Management Program. Peacock Spot—Olive. 2026. Available online: https://ipm.ucanr.edu/agriculture/olive/peacock-spot/ (accessed on 18 July 2026).
  11. Adawi, A.; Jarrar, S.; Almadi, L.; Alkowni, R.; Gallo, M.; D’Onghia, A.M.; Buonaurio, R.; Famiani, F. Effectiveness of Low Copper-Containing Chemicals Against Olive Leaf Spot Caused by Venturia oleaginea. Agriculture 2022, 12, 326. [Google Scholar] [CrossRef] [Scilit]
  12. Upadhyay, A.; Chandel, N.S.; Singh, K.P.; Chakraborty, S.K.; Nandede, B.M.; Kumar, M.; Subeesh, A.; Upendar, K.; Salem, A.; Elbeltagi, A. Deep Learning and Computer Vision in Plant Disease Detection: A Comprehensive Review. Artif. Intell. Rev. 2025, 58, 92. [Google Scholar] [CrossRef] [Scilit]
  13. Ahmed, N.; Asif, H.M.S.; Saleem, G. Leaf Image-Based Plant Disease Identification Using Color and Texture Features. arXiv 2021, arXiv:2102.04515. [Google Scholar]
  14. Uğuz, S.; Uysal, N. Classification of olive leaf diseases using deep convolutional neural networks. Neural Comput. Appl. 2021, 33, 4133–4149. [Google Scholar]
  15. Uğuz, S. Automatic olive peacock spot disease recognition system development by using single shot detector. Sak. Univ. J. Comput. Inf. Sci. 2020, 3, 158–168. [Google Scholar] [CrossRef] [Scilit]
  16. Bruno, A.; Moroni, D.; Martinelli, M. Efficient deep learning approach for olive disease classification. In Proceedings of the 2023 18th Conference on Computer Science and Intelligence Systems (FedCSIS), Warsaw, Poland, 17–20 September 2023; pp. 889–894. [Google Scholar]
  17. Ksibi, A.; Ayadi, M.; Soufiene, B.O.; Jamjoom, M.M.; Ullah, Z. MobiRes-Net: A Hybrid Deep Learning Model for Detecting and Classifying Olive Leaf Diseases. Appl. Sci. 2022, 12, 10278. [Google Scholar] [CrossRef] [Scilit]
  18. Sarantakos, T.; Gutierrez, D.M.J.; Amaxilatis, D. Olive leaf infection detection using the cloud-edge continuum. In Proceedings of the International Symposium on Algorithmic Aspects of Cloud Computing; Springer: Cham, Switzerland, 2023; pp. 25–37. [Google Scholar]
  19. Lee, H.; Park, Y.S.; Yang, S.; Lee, H.; Park, T.J.; Yeo, D. A deep learning-based crop disease diagnosis method using multimodal mixup augmentation. Appl. Sci. 2024, 14, 4322. [Google Scholar] [CrossRef] [Scilit]
  20. Wu, X.; Zhang, J.; Zou, Z.; Chen, C.; Yu, Y.; Yu, P.; Xiao, Y.; Wang, Q.; Kandegama, W.; Hao, G. PlantIF: Multimodal Semantic Interactive Fusion via Graph Learning for Plant Disease Diagnosis. Plant Phenomics 2025, 8, 100132. [Google Scholar] [CrossRef] [Scilit] [PubMed]
  21. Albahli, S. AgriFusionNet: A Lightweight Deep Learning Model for Multisource Plant Disease Diagnosis. Agriculture 2025, 15, 1523. [Google Scholar] [CrossRef] [Scilit]
  22. Hamzaoui, H.; Maafa, I.; Choukri, H.; Bakkali, A.E.; Houssaini, S.E.I.E.; Razouk, R.; Aziz, A.; Louahlia, S.; Habbadi, K. Assessment of peacock spot disease (Fusicladium oleagineum) in olive orchards through agronomic approaches and UAV-based multispectral imaging. Horticulturae 2025, 11, 46. [Google Scholar] [CrossRef] [Scilit]
  23. Géron, A. Hands-On Machine Learning with Scikit-Learn, Keras, and TensorFlow; O’Reilly Media, Inc.: Santa Rosa, CA, USA, 2022. [Google Scholar]
  24. Goodfellow, I.; Bengio, Y.; Courville, A.; Bengio, Y. Deep Learning; MIT Press: Cambridge, MA, USA, 2016; Volume 1. [Google Scholar]
  25. NASA Langley Research Center. Prediction of Worldwide Energy Resources (POWER) Data Access Viewer. Available online: https://power.larc.nasa.gov/data-access-viewer/ (accessed on 17 July 2026).
  26. ISRIC—World Soil Information. SoilGrids Documentation. 2026. Available online: https://docs.isric.org/globaldata/soilgrids/ (accessed on 17 July 2026).
  27. European Space Agency. Sentinel-2 User Handbook. 2015. Available online: https://sentinels.copernicus.eu/documents/247904/685211/Sentinel-2_User_Handbook (accessed on 17 July 2026).
  28. Gitelson, A.A.; Kaufman, Y.J.; Stark, R.; Rundquist, D. Novel algorithms for remote estimation of vegetation fraction. Remote Sens. Environ. 2002, 80, 76–87. [Google Scholar] [CrossRef] [Scilit]
  29. Copernicus Climate Change Service. ERA5-Land Hourly Data from 1950 to Present. 2019. Available online: https://cds.climate.copernicus.eu/datasets/reanalysis-era5-land (accessed on 17 July 2026).
  30. NASA Earthdata. Soil Moisture Active Passive (SMAP). 2015. Available online: https://www.earthdata.nasa.gov/data/platforms/space-based-platforms/smap (accessed on 17 July 2026).
  31. NASA Goddard Space Flight Center. Global Land Data Assimilation System (GLDAS). Available online: https://ldas.gsfc.nasa.gov/gldas (accessed on 17 July 2026).
  32. Copernicus Land Monitoring Service. Soil Moisture and Soil Water Index Products. Available online: https://land.copernicus.eu/en/products/soil-moisture (accessed on 17 July 2026).
  33. ISRIC—World Soil Information. WoSIS Soil Profile Database Documentation. 2026. Available online: https://docs.isric.org/globaldata/wosis/ (accessed on 17 July 2026).
  34. OpenLandMap. OpenLandMap Long-Term Soil pH in Water. 2019. Available online: https://stac.openlandmap.org/ph.h2o_usda.4c1a2a/collection.json (accessed on 17 July 2026).
  35. Food and Agriculture Organization of the United Nations. Global Map of Salt-Affected Soils. 2021. Available online: https://openknowledge.fao.org/handle/20.500.14283/cb7247en (accessed on 17 July 2026).
  36. NASA Goddard Space Flight Center. Famine Early Warning Systems Network Land Data Assimilation System (FLDAS). Available online: https://ldas.gsfc.nasa.gov/fldas (accessed on 17 July 2026).
  37. Copernicus Climate Change Service. ERA5 Hourly Data on Single Levels from 1940 to Present. 2018. Available online: https://cds.climate.copernicus.eu/datasets/reanalysis-era5-single-levels (accessed on 17 July 2026).
  38. Climate Hazards Center, University of California, Santa Barbara. CHIRPS: Rainfall Estimates from Rain Gauge and Satellite Observations. Available online: https://www.chc.ucsb.edu/data/chirps (accessed on 17 July 2026).
  39. National Aeronautics and Space Administration. Global Precipitation Measurement Mission Data. 2018. Available online: https://gpm.nasa.gov/data (accessed on 17 July 2026).
  40. U.S. Geological Survey. Landsat Data Access. Available online: https://www.usgs.gov/landsat-missions/landsat-data-access (accessed on 17 July 2026).
  41. NASA Goddard Space Flight Center. Moderate Resolution Imaging Spectroradiometer (MODIS) Data. Available online: https://modis.gsfc.nasa.gov/data/ (accessed on 17 July 2026).
  42. Planet Labs PBC. PlanetScope Documentation. 2026. Available online: https://docs.planet.com/data/imagery/planetscope/ (accessed on 17 July 2026).
Figure 1. Summary of image processing workflow.
Applsci 16 07669 g001
Figure 2. Environmental data sources and feature extraction.
Applsci 16 07669 g002
Figure 3. Overall architecture of the proposed hybrid multimodal deep learning framework.
Applsci 16 07669 g003
Figure 4. Confusion matrix of the proposed classification model.
Applsci 16 07669 g004
Table 1. Qualitative comparison of representative olive-disease recognition studies and the proposed framework.
StudyInput ModalityMain MethodMain OutputDistinction from the Present Work
Uğuz and Uysal [14]RGB leaf imagesCNNDisease classImage-only classification without fine-grained severity stages, environmental descriptors, or continuous severity estimates
Uğuz [15]RGB leaf imagesSSD detectorLesion localizationLocalizes symptomatic regions but does not jointly estimate seven-stage severity, lesion percentage, and yellowing percentage
Bruno et al. [16]RGB leaf imagesEfficientNet-B0 ensembleDisease classImproves classification robustness but does not integrate environmental information or quantitative symptom estimates
Ksibi et al. [17]RGB imagesMobiRes-NetDisease classLightweight single-modal architecture with a categorical diagnostic output
Sarantakos et al. [18]UAV imageryCNN and Vision TransformerOrchard-scale disease recognitionExtends spatial coverage but remains primarily image-driven and does not perform leaf-level multi-task severity estimation
Proposed frameworkRGB leaf images and environmental descriptorsResNet50–MLP feature-level fusionSeven-stage classification and continuous lesion/yellowing estimationEnvironmentally enriched, olive-specific multi-task formulation; regional–seasonal matching requires future validation using synchronized field observations
Table 2. Comparison with representative multimodal plant-disease diagnosis frameworks.
FrameworkModalitiesNon-Image InformationMain OutputMain Distinction from the Proposed Framework
Multimodal Mixup Augmentation [19]RGB images and synchronized environmental measurementsTemperature, humidity, dew point, and temporal meteorological observationsGeneral crop-disease classificationUses locally synchronized smart-farm measurements; does not perform olive-specific seven-stage classification with lesion and yellowing regression
PlantIF [20]Plant images and textSemantic symptom, botanical, and disease descriptionsPlant-disease classificationUses textual–semantic reasoning rather than numerical soil, weather, moisture, vegetation, and stress descriptors
AgriFusionNet [21]RGB/multispectral imagery and environmental sensingIoT and environmental sensor informationGeneral plant-disease recognitionAddresses general disease recognition without olive-specific multi-task severity estimation
Proposed frameworkOlive-leaf RGB images and environmental descriptorsRegional–seasonal weather, soil, moisture, vegetation, and stress variables from public repositoriesSeven-stage classification, lesion regression, and yellowing regressionOlive-specific, environmentally enriched multi-task formulation based on contextual public-data matching
Table 3. Distribution of photography styles with their percentages.
Photography StylePercentage %
Standard Field Close-Up33.0%
Angled Close-Up23.1%
Branch-Attached Close-Up25.3%
Shadowed/Partially Lit12.1%
Morning-Light Warm Tone6.6%
Table 4. Peacock spot disease stages and their actual percentages.
StageNameAppearancePercentage %
0HealthyNo spots11.88%
1Very Early1–2 dark specks14.38%
2Early3–6 lesions13.13%
3MildSpots with halos8.13%
4ModerateMerged lesions22.50%
5StrongNecrotic patches18.75%
6SevereMajor breakdown11.25%
Table 5. Image splitting information.
SubsetPercentageOriginal Images
Training70%350
Validation15%75
Testing15%75
Total100%500
Table 6. Augmented image distribution.
SubsetAugmented Images
Training7000
Validation1500
Testing1500
Total10,000
Table 7. Final retained dataset distribution.
Final SubsetImages
Training2305
Validation494
Testing494
Total3293
Table 8. Atmospheric parameters, ranges, and significance for fungal development.
ParameterUnitRangeSignificance
Air Temperature°C21.8–31.4Optimal fungal growth
Relative Humidity%52–71High humidity favors spores
Rainfall (24 h)mm0.1–3.2Wet periods promote infection
Wind Speedm/s1.2–4.2Disperses spores
Leaf Wetness Index0–10.31–0.66Prolonged leaf moisture
Table 9. Soil parameters, units, ranges, and interpretations used in the dataset.
ParameterUnitRangeInterpretation
Soil Moisture0–10.17–0.31Volumetric water content
Soil pHpH7.0–7.8Neutral to slightly alkaline
Electrical ConductivityμS/cm390–1180Salinity indicator
Soil Temperature°C19.5–26.5Root zone temperature
Salinity Stress Index-0.15–0.81Salt stress
Table 10. Vegetation and stress indices with abbreviations, ranges, and applications.
IndexAbbreviationRangeApplication
Visible Atm. Resistant IndexVARI0.12–0.34Vegetation greenness
Green Leaf IndexGLI0.08–0.30Green coloration
Excess Green IndexExG0.15–0.39Vegetation differentiation
Normalized Diff. Veg. IndexNDVI0.23–0.59Photosynthetic activity
Soil Moisture IndexSMI0.30–0.65Water availability
Table 11. Summary of data sources, accessibility, and processing steps for the 15 environmental variables before feature selection and reduction.
FeatureMain SourceAccessibilityReady After Download or CalculatedAlternative SourcesAccessibilityMathematical Derivation or Processing If Calculated
Soil MoistureERA5-Land [29] (Volumetric Soil Water Layer 1, 0–7 cm)Free/Open (CC-BY)Ready after extractionSMAP [30], GLDAS [31], Copernicus SWI [32], field probeMixedCoordinate/date extraction and temporal aggregation.
Soil pHSoilGrids [26] (pH in water)Free/OpenReady after extractionWoSIS [33], OpenLandMap [34], laboratory testMostly freeApply SoilGrids scaling factor.
Electrical ConductivityWoSIS EC observations [33]Free/OpenPoint observationsFAO salt-affected-soil maps [35], EC sensorMixedSpatial matching/interpolation and unit harmonization.
Soil TemperatureERA5-Land Soil Temperature Level 1 [29]Free/OpenReady after extractionGLDAS [31], FLDAS [36], field sensorMixed T ° C = T K 273.15 .
Air TemperatureNASA Power [25] (2-m)Free/OpenReadyERA5 [37], weather stationMixedTemporal averaging.
Relative HumidityNASA Power [25] (2-m)Free/OpenReadyERA5 [37], weather stationMixedTemporal aggregation only.
RainfallNASA Power precipitation [25]Free/OpenReadyERA5-Land [29], CHIRPS [38], GPM [39]MixedDaily values or P 24 h = i P i .
Wind SpeedNASA Power [25]Free/OpenReadyERA5 [37], anemometerMixedAverage over selected temporal window.
Leaf Wetness IndexDerived from NASA Power [25] and/or ERA5-Land [29]Free/Open inputsCalculatedLeaf wetness sensorSensor paid LWI = α RH ˜ + β P ˜ γ T ˜ δ W ˜ , α + β + γ + δ = 1 .
VARIRGB olive-leaf imagesExisting datasetCalculatedRGB camera, Sentinel-2 RGB bands [27]Mixed VARI = G R G + R B .
GLIRGB olive-leaf imagesExisting datasetCalculatedRGB camera, Sentinel-2 RGB bands [27]Mixed GLI = 2 G R B 2 G + R + B .
ExGRGB olive-leaf imagesExisting datasetCalculatedRGB camera, Sentinel-2 RGB bands [27]Mixed ExG = 2 g r b .
NDVISentinel-2 Level-2A (B8 and B4) [27]Free/OpenCalculatedLandsat 8/9 [40], MODIS [41], PlanetScope [42]Mixed NDVI = B 8 B 4 B 8 + B 4 .
SMIDerived from ERA5-Land soil moisture [29]Free/Open inputsCalculatedSMAP [30], Copernicus SWI [32]Mixed SMI = θ θ min θ max θ min .
EC-stressDerived from WoSIS EC observations [33]Free/Open inputsCalculatedFAO salt-affected-soil maps [35], EC sensorMixed EC stress = E C E C min E C max E C min .
Table 12. Summary of environmental feature reduction.
FeatureImportance Score
NDVI79.60
VARI78.31
Soil temperature75.48
SMI73.33
Electrical conductivity72.80
Air temperature70.80
Soil moisture70.50
Rainfall69.75
Soil pH60.42
Relative humidity53.47
Table 13. Summary of input data and feature reduction.
ComponentDescription
Image inputOlive leaf images labeled into severity Stages 0–6.
Original numerical input15 environmental and engineered candidate features.
Feature-selection methodPermutation importance calculated on the training subset only.
RepetitionsFive repeated importance calculations, followed by averaging.
Selected numerical input10 highest-ranked features.
Selected featuresNDVI, VARI, soil temperature, SMI, soil EC, air temperature, soil moisture, rainfall, soil pH, and humidity.
Excluded featuresWind speed, Leaf Wetness Index, GLI, ExG, and EC-stress.
Dimensional reduction 15 10 numerical features before the MLP branch.
Table 14. Model architecture.
ComponentConfiguration
Image backboneImageNet-pre-trained ResNet50.
Image input size 224 × 224 × 3 .
Image feature vector2048 dimensions after global average pooling.
Numerical MLP input10 selected features.
Numerical MLP layers 10 128 64 32 .
Numerical feature vector32 dimensions.
Feature-level fusionConcatenation of image and numerical vectors.
Fusion vector size 2048 + 32 = 2080 dimensions.
Fusion head 2080 128 64 32 .
Hidden activationReLU.
Dropout0.3.
OutputsOne seven-class classification head and two regression heads.
Output activationsSoftmax for classification; linear for lesion and yellowing regression.
Table 15. Training and loss configuration.
ItemSetting
OptimizerAdam.
Initial learning rate 1 × 10 4 .
Batch size32.
Maximum epochs100.
Early stoppingPatience of 15 epochs.
Data split70% training, 15% validation, and 15% testing.
Classification lossCross-entropy.
Lesion lossMean absolute error (MAE).
Yellowing lossMean absolute error (MAE).
Loss weights w c l a s s = 1.0 , w l e s i o n = 0.5 , w y e l l o w = 0.5 .
Total loss L t o t a l = L c l a s s + 0.5 L l e s i o n + 0.5 L y e l l o w .
Table 16. Outputs and evaluation metrics.
TaskOutput and Evaluation
Severity classificationPredicts Stage 0–6 using softmax activation.
Classification metricsAccuracy, Macro F1-score, Weighted F1-score, raw confusion matrix, and normalized confusion matrix.
Lesion regressionPredicts lesion percentage from 0% to 100% using linear activation.
Yellowing regressionPredicts yellowing percentage from 0% to 100% using linear activation.
Regression metricsMAE, RMSE, and coefficient of determination ( R 2 ).
Observed confusion patternRemaining errors are concentrated mainly among adjacent advanced stages 4, 5, and 6.
Table 17. Overall classification performance of the proposed multimodal framework.
MetricValue
Overall accuracy97.77%
Weighted precision97.83%
Weighted recall97.77%
Weighted F 1 -score97.76%
Macro F 1 -score98.09%
Table 18. Per-class performance for seven-stage olive peacock spot classification.
StageSupportPrecisionRecall F 1 -Score
0651.00001.00001.0000
1611.00001.00001.0000
2751.00001.00001.0000
3371.00001.00001.0000
41100.96430.98180.9730
5950.97730.90530.9399
6510.91071.00000.9533
Table 19. Regression performance for lesion coverage and yellowing estimation.
TargetMAE (%)RMSE (%) R 2
Lesion coverage1.161.250.95
Yellowing percentage1.421.520.94
Disclaimer/Publisher’s Note: The statements, opinions and data contained in all publications are solely those of the individual author(s) and contributor(s) and not of MDPI and/or the editor(s). MDPI and/or the editor(s) disclaim responsibility for any injury to people or property resulting from any ideas, methods, instructions or products referred to in the content.