Article

Study on the Interaction Between Surrounding Rock and Support in High-Stress Soft Rock Roadways Based on Rock Rheological Properties

1
Shandong Water Conservancy Vocational College, Rizhao 276826, China
2
Guizhou Panjiang Clean Coal Co., Ltd., Panzhou 553537, China
3
Key Laboratory of Deep Coal Resource Mining, China University of Mining and Technology, Ministry of Education, Xuzhou 221116, China
*
Authors to whom correspondence should be addressed.
Appl. Sci. 2026, 16(15), 7668; https://doi.org/10.3390/app16157668
Submission received: 4 July 2026 / Revised: 28 July 2026 / Accepted: 31 July 2026 / Published: 2 August 2026

Abstract

High-stress soft rock roadways in deep underground engineering often exhibit significant time-dependent deformation due to strong rheological behavior of surrounding rock. To investigate the deformation characteristics and support effect, a composite viscoelastic constitutive model considering anchored and unanchored rock zones is established based on the Maxwell rheological framework. The equivalent stiffness contribution of rock bolts is incorporated to characterize the interaction between support and surrounding rock. Analytical solutions of radial displacement and creep rate are derived using viscoelastic theory and Laplace transform methods. The effects of bolt spacing, bolt length, and burial depth on the rheological response are analyzed. Numerical simulations based on FLAC3D creep analysis and field monitoring data are used to verify the proposed model. Results show that decreasing bolt spacing effectively reduces long-term deformation, while bolt length has a diminishing effect beyond a critical anchorage length. Increasing burial depth significantly increases creep rate and total deformation. The numerical results agree well with theoretical predictions (R2 ≈ 0.985), and field measurements show a relative error within 10%. The proposed model effectively describes the long-term deformation trend of high-stress soft rock roadways and provides a theoretical reference for support design under similar conditions.

1. Introduction

High-stress soft rock roadways are widely encountered in deep underground engineering such as coal mining and tunneling [1,2]. With increasing mining depth, the in-situ stress environment becomes significantly more complex [3], which leads to pronounced time-dependent deformation of surrounding rock [4]. Under high-stress conditions, the surrounding rock typically exhibits strong rheological behavior, including creep and stress relaxation [5,6], which seriously threatens roadway stability and long-term safety [7].
In recent decades, extensive research has been conducted on the mechanical behavior of soft rock masses [8]. It has been widely recognized that rheological effects play a dominant role in deep roadway deformation evolution [9,10]. Classical viscoelastic models such as the Maxwell model have been used to describe primary creep behavior [11], while Kelvin and Burgers models are often applied to capture both transient and steady-state deformation stages [12,13]. However, these models still have limitations in describing complex interaction mechanisms under high-stress conditions [14].
With the development of underground support technology, rock bolts and anchor cables have been widely adopted in engineering practice [15]. Classical rock reinforcement theories, including the suspension theory [16], composite beam theory, and surrounding rock reinforcement theory, have provided important theoretical foundations for understanding the interaction between bolts and surrounding rocks [17]. These reinforcement systems can effectively improve the equivalent stiffness of surrounding rock [18,19,20] and significantly reduce long-term deformation [21]. Experimental and field studies have shown that bolting systems play a critical role in controlling creep deformation [22]. However, most existing studies still analyze either the rock mass or the support system separately [23], and the coupling mechanism between them remains insufficiently understood [24].
Numerical simulation methods such as FLAC3D and finite element modeling have been widely used to investigate excavation-induced deformation [25,26]. These methods are effective in reproducing general deformation trends [27], but discrepancies between numerical results and field observations still exist under complex geological conditions [28]. In particular, the integration of rheological behavior with support–rock interaction remains a challenge in current numerical frameworks [29].
Recently, increasing attention has been given to coupled rheological models considering support effects and stress redistribution [30]. Some studies have proposed composite constitutive models to better describe time-dependent deformation behavior of surrounding rock [31]. Nevertheless, difficulties still exist in parameter identification and engineering application of these models [32]. Therefore, further improvement in theoretical modeling and validation is still required [33,34].
Based on previous studies on rock rheology and support interaction mechanisms [35], this study develops a composite viscoelastic constitutive model considering both anchored and unanchored rock zones [36]. The Maxwell rheological framework is combined with equivalent reinforcement effects of bolt systems. Analytical derivation, numerical simulation, and field data comparison are jointly used to analyze the long-term deformation behavior of high-stress soft rock roadways [37].
The Maxwell rheological framework is adopted to describe the time-dependent deformation behavior, while the reinforcement effect of bolts is incorporated into the constitutive relationship of the anchored zone. Analytical solutions of radial displacement and creep rate are derived, and the influences of bolt spacing, bolt length, and burial depth are quantitatively investigated. Numerical simulations and field monitoring data are further employed to evaluate the applicability of the proposed model for high-stress soft rock roadways.

2. Rheological Constitutive Model and Theoretical Analysis of Surrounding Rock

2.1. Rheological Model Considering Relaxation Time and Basic Assumptions

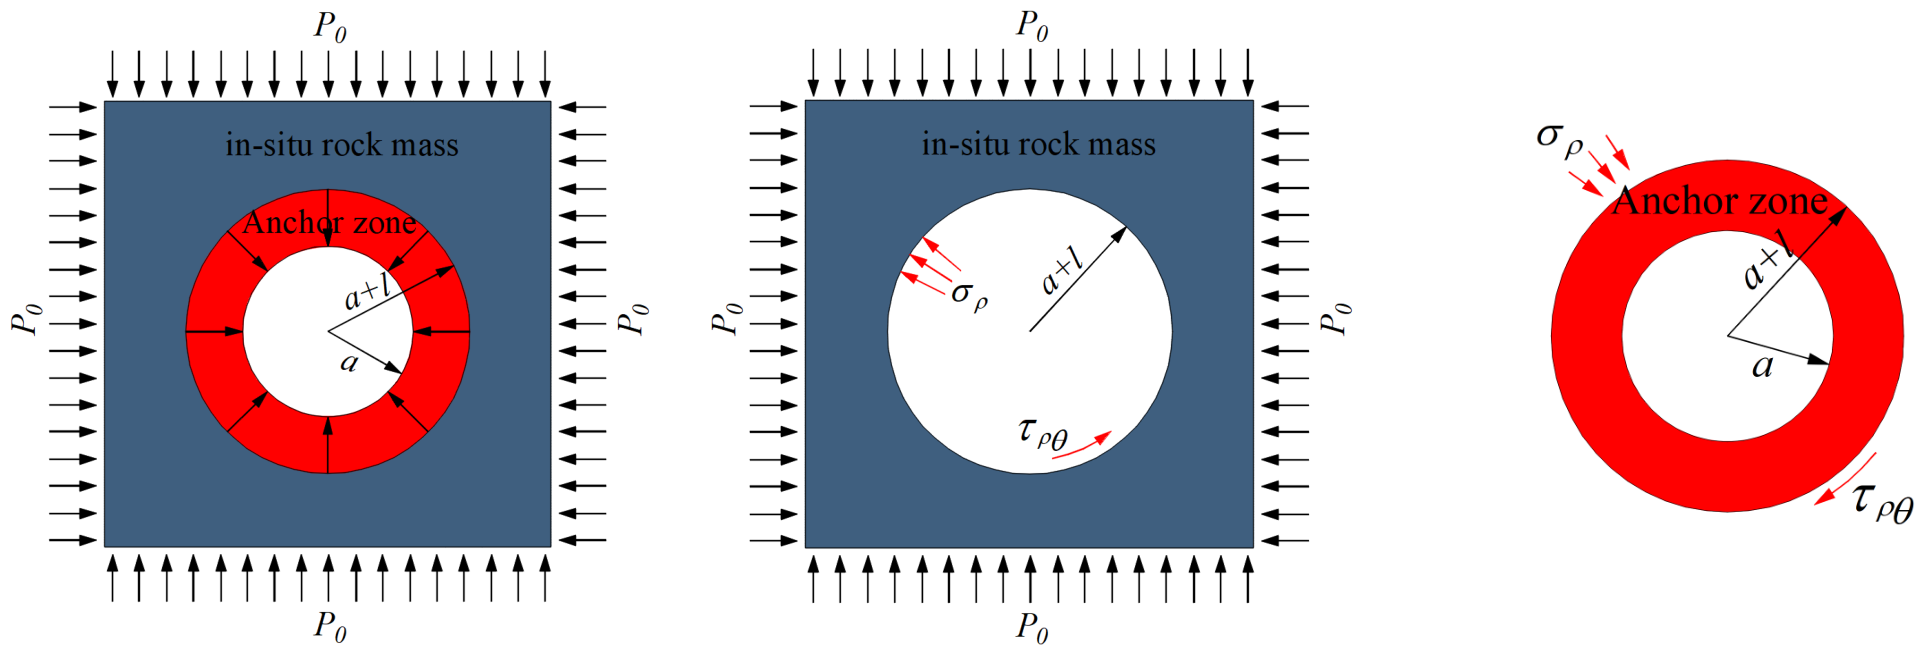
Considering that the deformation behavior of deep soft rock roadways is mainly controlled by the high in-situ stress and excavation-induced stress redistribution, an isotropic linear viscoelastic circular tunnel model is adopted to describe the time-dependent deformation characteristics of the surrounding rock. The self-weight of the rock mass within the influence zone is neglected because its contribution to the stress field is relatively small compared with the high-initial-stress conditions considered in this study. In addition, the original rock stress is assumed to be isotropic and hydrostatic, which is a commonly adopted assumption in analytical solutions for surrounding rock deformation problems [38]. Based on these assumptions, the problem is simplified into an axisymmetric plane strain problem, and the mechanical model of the surrounding rock is established, as shown in Figure 1.
It should be noted that the proposed model is developed within the framework of linear viscoelastic theory. Although it can effectively describe the creep deformation behavior of soft rock surrounding rocks, irreversible plastic deformation and damage evolution under extremely high-stress conditions are not explicitly considered. In practical engineering, crack propagation, strain localization, and plastic failure may occur. Therefore, future research will focus on establishing an elastoplastic–viscoplastic coupled model to improve the prediction capability for large deformation and failure of deep soft rock roadways.
In the figure, σ represents the applied stress acting on the surrounding rock, and θ represents the angular coordinate measured from the reference direction of the roadway section.
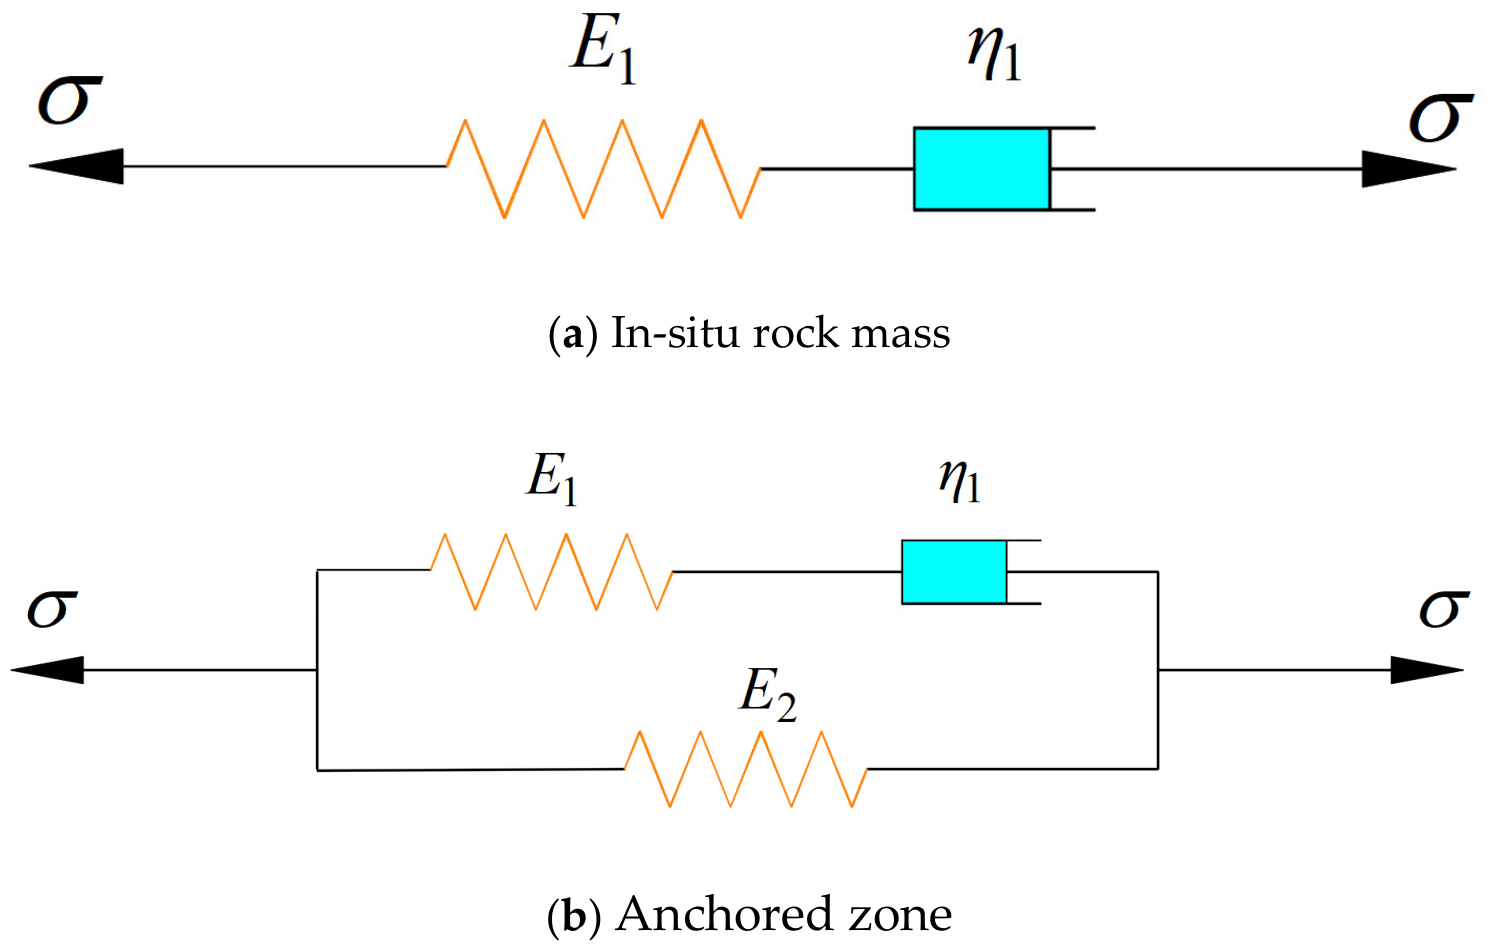
The surrounding rock of high-stress soft rock roadways has significant rheological properties, including obvious stress relaxation, sustained steady-state creep, and low elastic stiffness [39,40]. For the unanchored original rock mass, deformation under high stress consists of both instantaneous elastic response and, more prominently, time-dependent rheological deformation. Hence, the Maxwell model is used to describe the original rock zone. In the anchored zone, rock bolts essentially increase the elastic stiffness of the surrounding rock and suppress its rheological deformation. The parallel elastic element (E2) undergoes instantaneous elastic deformation and provides elastic resistance, sharing part of the surrounding rock stress, thereby lowering the stress level on the Maxwell component and slowing the development of viscous flow. For this reason, a composite constitutive model combining a Maxwell body and an elastic element (E2) in parallel is adopted for the anchored zone, as illustrated in Figure 2a,b.
Compared with other classical rheological models, the Maxwell model is more suitable for describing the long-term deformation characteristics of high-stress soft rock surrounding rocks. The Kelvin–Voigt model mainly describes delayed elastic deformation and cannot effectively represent stress relaxation behavior. The Burgers model can describe instantaneous deformation, attenuation creep, and steady creep stages, but it involves more parameters, increasing the difficulty of parameter identification. Fractional derivative models have advantages in describing complex nonlinear creep behavior; however, their parameters generally lack clear physical meanings and require sufficient experimental data for calibration.
In this study, the surrounding rock of deep soft rock roadways mainly exhibits stress relaxation and continuous creep characteristics after excavation. Therefore, the Maxwell model is adopted for the unanchored zone. For the anchored zone, the reinforcement effect of bolts is considered by introducing an additional elastic element in parallel with the Maxwell body, which represents the increased stiffness and instantaneous resistance provided by the anchorage system.
For the viscoelastic model of the surrounding rock shown in Figure 2, the equivalent elastic modulus per unit area of rock mass contributed by rock bolts:
E 2 = K b S
where: Kb is the axial stiffness of the rock bolt, Kb = Eb·Ab, and the rock mass area controlled by each bolt is S = a1·b1. Combining with Equation (1) yields
E 2 = E b A b a 1 b 1
E 2 = n E b A b
where: Eb—Elastic modulus of the bolt rod (MPa);
Ab—Cross-sectional area of the bolt rod (m2);
a1—Bolt spacing (m);
b1—Bolt row spacing (m);
n—Support density of bolts/cables, n = 1/a1b1.
The constitutive equations for the anchored rock mass and the in-situ rock mass are respectively
σ + η E 1 σ ˙ = E 2 ε + η ( E 1 + E 2 ) E 1 ε ˙
σ + η E 1 σ ˙ = η ε ˙
where: E1—Elastic modulus of the in-situ rock mass (Maxwell model) (MPa);
η—Viscosity coefficient (MPa·d)).

2.2. Analytical Solution of Viscoelastic Displacement of Roadway Surrounding Rock

According to the correspondence principle, to obtain the viscoelastic displacement solution for the surrounding rock of the roadway, its elastic solution must first be determined [41]. The corresponding elastic radial stress and displacement are respectively
σ ( r ) = B i D i r 2
u i ( r ) = 1 + v i E i ( 1 2 υ i ) B i r + D i r
where i = m, y represent the anchored zone and the in-situ rock zone, respectively.
Boundary conditions for the anchored zone:
r = a ,               σ m = 0 r = a + l ,        σ m = 0   ( S t r e s s   a t   t h e   i n t e r f a c e   b e t w e e n                                                   t h e   t w o   r e g i o n s ,   t o   b e   d e t e r m i n e d )
For the in-situ rock zone,
r = a + l , σ y = P r , σ y = P 0
Substituting Equations (8) and (9) into Equation (6), respectively, yields B i and D i :
( W h e n   i = y ) B y = P 0 D y = ( P 0 P ) ( a + l ) 2 ( W h e n   i = m ) B m = P ( a + l ) 2 l ( 2 a + l ) D m = P · a 2 ( a + l ) 2 l ( 2 a + l ) ( B i , D i )
Using the displacement continuity condition at the interface r = a + l, i.e., (um(a + l) = uy (a + l)) (where P can be obtained from Equation (7)).
P = 2 E m l ( 1 + ν y ) ( 1 ν y ) ( 2 a + l ) P 0 E y ( 1 + ν m ) ( 1 2 ν m ) ( a + l ) 2 + a 2 + ( 1 + ν y ) E m l ( 2 a + l )
Then, according to the displacement continuity condition at the interface, P can be obtained from Equation (7) and finally the radial displacement of the anchored zone is obtained as
u m ( r ) = 2 ( 1 + ν y ) ( 1 ν y ) P 0 ( 1 + ν m ) ( a + l ) 2 · ( 1 2 ν m ) r + a 2 r E y · ( 1 + ν m ) ( 1 2 ν m ) ( a + l ) 2 + a 2 + E m l ( 2 a + l ) ( 1 + ν y ) E y
Assuming that both the anchored rock mass and the in-situ rock mass exhibit elastic volumetric deformation and viscoelastic distortional deformation, the viscoelastic relationships of the material functions for the two are respectively
P m ( S ) = 1 + η E 1 S Q m ( S ) = E 2 + η E 1 + E 2 E 1 S P m ( S ) = 1 Q m ( S ) = 3 K 1
P y ( S ) = 1 + η E 1 S Q y ( S ) = η S P y ( S ) = 1 Q y ( S ) = 3 K 2
where K 1 and K 2 are the bulk moduli of the anchored rock mass and the in-situ rock mass, respectively (MPa), K 1 = E m 3 ( 1 2 ν m ) and K 2 = E y 3 ( 1 2 ν y ) . Considering the anchored zone as a composite medium consisting of the surrounding rock and reinforcement materials, the equivalent medium constants can be analyzed based on composite mechanics theory [42]. The difference between ν m and ν y is very small, and v m = v y = v is adopted.
The Laplace transform of Equation (12) is
u m ( r , s ) = 2 P 0 ( s ) ( a + l ) 2 3 P m Q m 2 P m Q m + P m Q m · ( a + l ) 2 r + a 2 r 1 P y Q y P y Q y 2 P y P y + P y Q y Q y P y 3 P m Q m 2 P m Q m + P m Q m · ( a + l ) 2 + a 2 + Q m P m ( 2 a + l ) l
Substituting Equations (13) and (14) into Equation (15), we get
u m ( r , s ) = 2 P 0 ( s ) ( a + l ) · 9 K 1 a 2 · 2 3 K 2 + η s E 1 2 E 1 + 2 3 K 2 · 1 + η E 1 s r 2 2 + η s ( E 1 + 2 ) E 1 η s 9 K 1 ( a + l ) 2 + a 2 ( 6 K 1 + E 2 ) + η a 2 E 1 6 K 1 + E 1 + E 2 s + E 2 + η ( E 1 + E 2 ) E 1 s ( 2 a + l ) l ( 6 K 1 + E 2 ) + η E 1 6 K 1 + E 1 + E 2 s
And after rearrangement, we obtain
u m ( r , s ) = 2 P 0 ( s ) ( a + l ) 2 · ( E 1 + η S ) 3 K 1 E 1 + η 3 K 1 + 2 E 1 S η s 6 K 2 + E 1 r · S 6 K 2 E 1 6 K 2 + E 1 + S . E 1 3 r 2 E 2 + a 2 6 K 1 + E 2 + η 2 r 2 E 1 + E 2 + a 2 6 K 1 + E 1 + E 2 S S + A 2 2 A 3 + A 2 2 4 A 1 A 3 2 A 3 S + A 2 2 A 3 A 2 2 4 A 1 A 3 2 A 3
where l—Bolt length (m);
r—Radial coordinate (m);
S—Laplace transform variable;
A1A2A3—Intermediate calculation coefficients, where:
A 1 = l E 1 2 E 2 ( 2 a + l ) 6 K 1 + E 2 A 2 = η · E 1   3 E 1 E 2 ( a + l ) 2 + a 2 E 1 ( 6 K 1 + E 2 ) + l ( 2 a + 1 ) ( E 1 + E 2 ) ( 6 K 1 + E 2 )                 + l E 2 ( 2 a + l ) ( 6 K 1 + E 1 + E 2 ) A 3 = η 2 · 3 E 1 ( a + l ) 2 ( E 1 + E 2 ) + a 2 E 1 6 K 1 + E 1 + E 2 + l ( 2 a + l ) ( E 1 + E 2 ) 6 K 1 + E 1 + E 2
Using the residue calculation method in complex function theory, the inverse Laplace transform of Equation (17) is obtained as
u m ( r , t ) = P 0 E 1 2 ( a + l ) 2 3 r 2 E 2 + a 2 ( 6 K 1 + E 2 ) A 11 r + A 4 A 5 S 2 e s 2 t + A 6 A 7 S 3 e s 3 t + A 8 A 9 S 4 e s 4 t
where: A 4 , A 5 , A 6 , A 7 , A 8 , A 9 —intermediate variables in the residue calculation; S 2 , S 3 , S 4 —characteristic roots (time exponential factors), where:
S 2 = 6 K 2 E 1 η 6 K 2 + E 1 ,   S 3 = A 2 2 A 3 A 2 2 4 A 3 2 A 1 A 3 ,   S 4 = A 2 2 A 3 + A 2 2 4 A 3 2 A 1 A 3 A 4 = 2 P 0 ( a + l ) 2 ( E 1 + η S 2 )   3 K 2 E 1 + η 3 K 2 + 2 E 1 S 2 · E 1 3 r 2 E 2 + a 2 6 K 1 + E 2 + η 3 r 2 ( E 1 + E 2 ) + a 2 6 K 1 + E 1 + E 2 S 2   A 5 = η · A 3 r 6 K 2 + E 1 ( S 2 S 3 ) ( S 2 S 4 ) A 6 = 2 P 0 ( a + l ) 2 ( E 1 + η S 3 )   3 K 2 E 1 + η 3 K 2 + 2 E 1 S 3 · E 1 3 r 2 E 2 + a 2 6 K 1 + E 2 + η 3 r 2 ( E 1 + E 2 ) + a 2 6 K 1 + E 1 + E 2 S 3   A 7 = η · A 3 r 6 K 2 + E 1 ( S 3 S 2 ) ( S 3 S 4 ) A 8 = 2 P 0 ( a + l ) 2 ( E 1 + η S 4 )   3 K 2 E 1 + η 3 K 2 + 2 E 1 S 4 · E 1 3 r 2 E 2 + a 2 6 K 1 + E 2 + η 3 r 2 ( E 1 + E 2 ) + a 2 6 K 1 + E 1 + E 2 S 4   A 9 = η · A 3 r 6 K 2 + E 1 ( S 4 S 2 ) ( S 4 S 3 )
By differentiating Equation (18) with respect to t, the radial rheological rate is obtained as
V m ( r , t ) = u m ( r , t ) t = A 4 A 5 e S 2 t + A 6 A 7 e S 3 t + A 8 A 9 e S 4 t

3. Analysis of the Influence of Support Parameters on the Rheological Deformation of Surrounding Rock

To systematically reveal the influence of various support parameters on the long-term rheological behavior of the surrounding rock, the control variable method is adopted. The effects of bolt length, bolt spacing (both longitudinal and transverse), and roadway burial depth on the rheological rate and deformation of the surrounding rock are analyzed. Considering the typical deformation observation period during the service life of soft rock roadways, 2 years (730 days) is selected as the representative time node for long-term deformation analysis, while the analysis period is extended to 1000 days to more comprehensively reflect the long-term evolution trend of deformation.

3.1. Influence of Bolt Spacing and Row Spacing on the Rheological Response of Surrounding Rock

The quantitative parameters are shown in Table 1.
The rheological parameters of surrounding rock, including elastic modulus E1 and viscosity coefficient η, were determined based on previous creep tests of similar soft rock materials and engineering experience. Considering the difference between laboratory conditions and field conditions, these parameters were further verified by comparing theoretical calculations with numerical simulation and field monitoring results.
It should be noted that the parameters E1, η, and a used in this study correspond to the actual engineering conditions. The roadway radius a is determined by the roadway design, while E1 and η represent the intrinsic rheological properties of the surrounding rock. Therefore, these parameters are kept constant to ensure that the proposed model accurately describes the deformation behavior of the investigated roadway.
Variables: Bolt spacing and row spacing: 0.5–1 m.
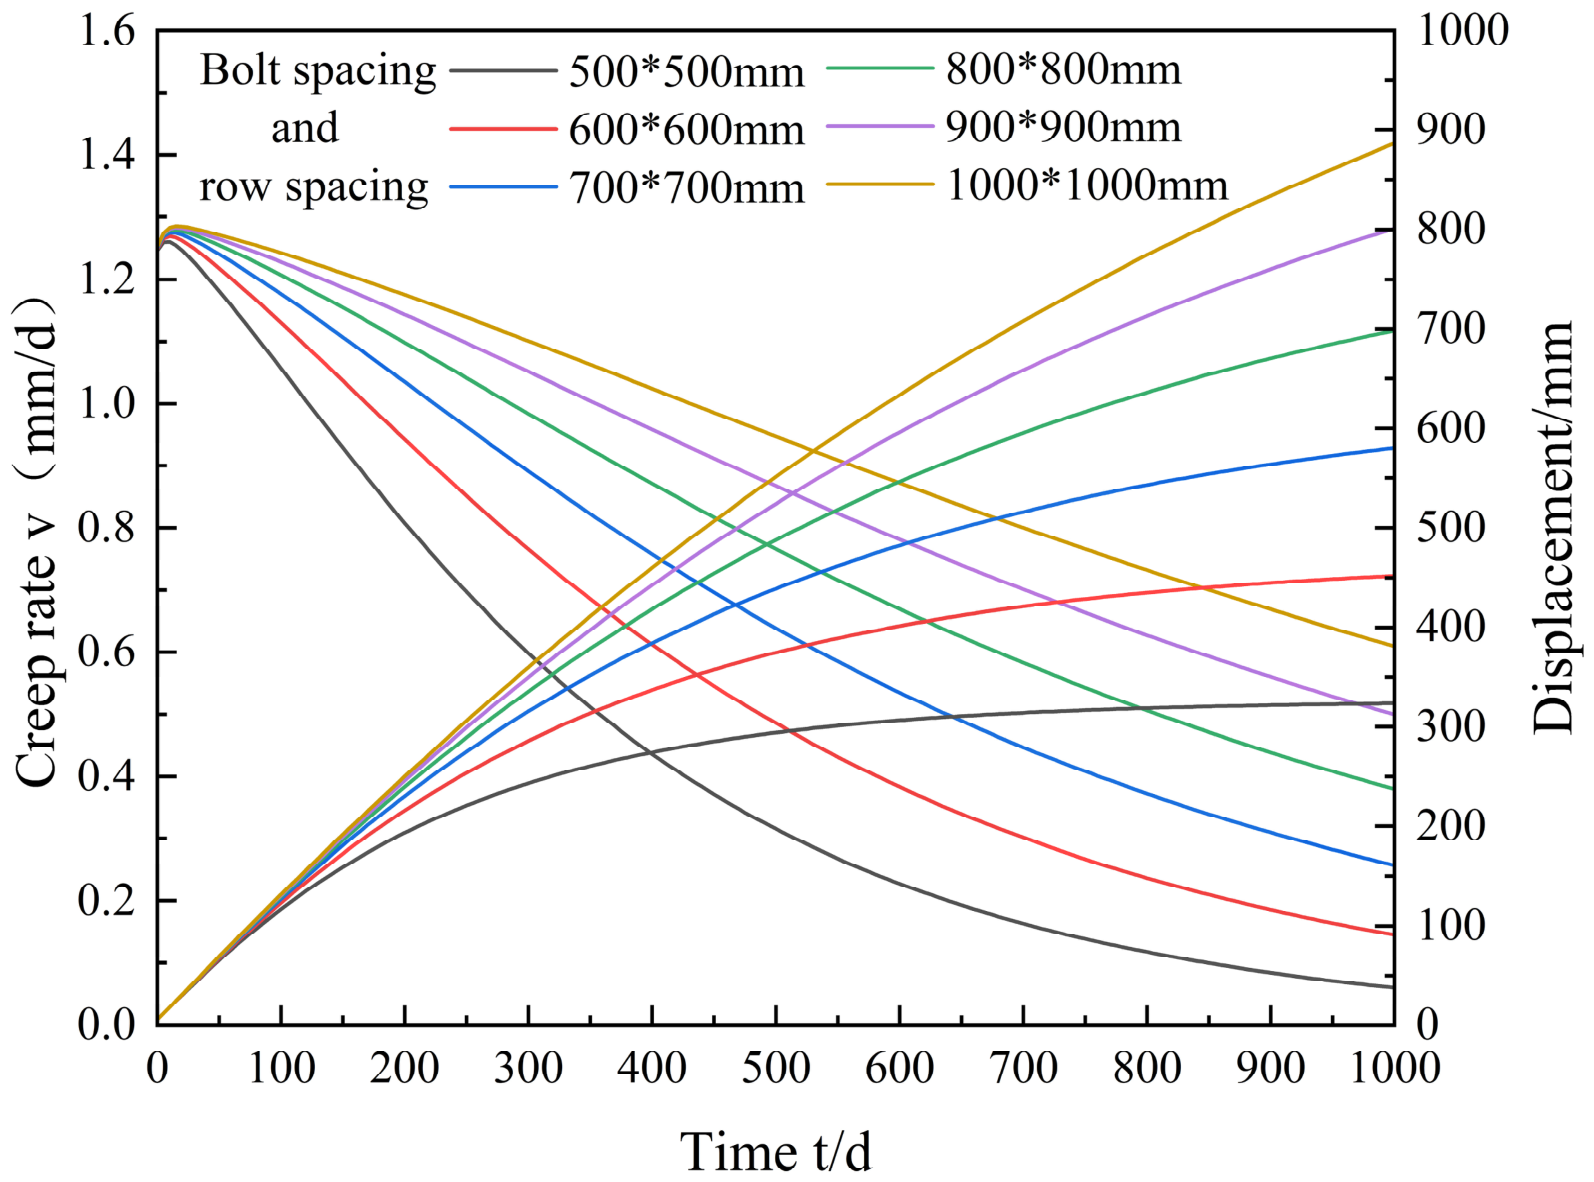
Substituting the quantitative parameters from Table 1 and the varying bolt spacing/row spacing into Equations (18) and (19), respectively, the radial displacement u(a,t) and the rheological rate v(a,t) at the tunnel wall (r = a) are calculated. The displacement and rate curves under different spacing/row spacing are plotted, as shown in Figure 3.
The relationship between roadway deformation amount, deformation rate, and bolt spacing/row spacing is presented in Table 2.
When the bolt spacing is 800 × 800 mm, the initial rheological rate is 1.25 mm/d, which decays to 0.423 mm/d after 730 days, a reduction of 66.2%, and the total displacement at 730 days is 608.49 mm. The larger the bolt spacing, the slower the decay of the rheological rate of the surrounding rock, and the surrounding rock remains in a high rheological state for a long time, leading to a nonlinear increase in total displacement with increasing spacing. Conversely, the smaller the bolt spacing, the faster the rheological deformation is suppressed, significantly reducing displacement accumulation.

3.2. Influence of Bolt Length on the Rheological Response of Surrounding Rock

The quantitative parameters are shown in Table 3.
Variable: Bolt length from 1 to 3.2 m.
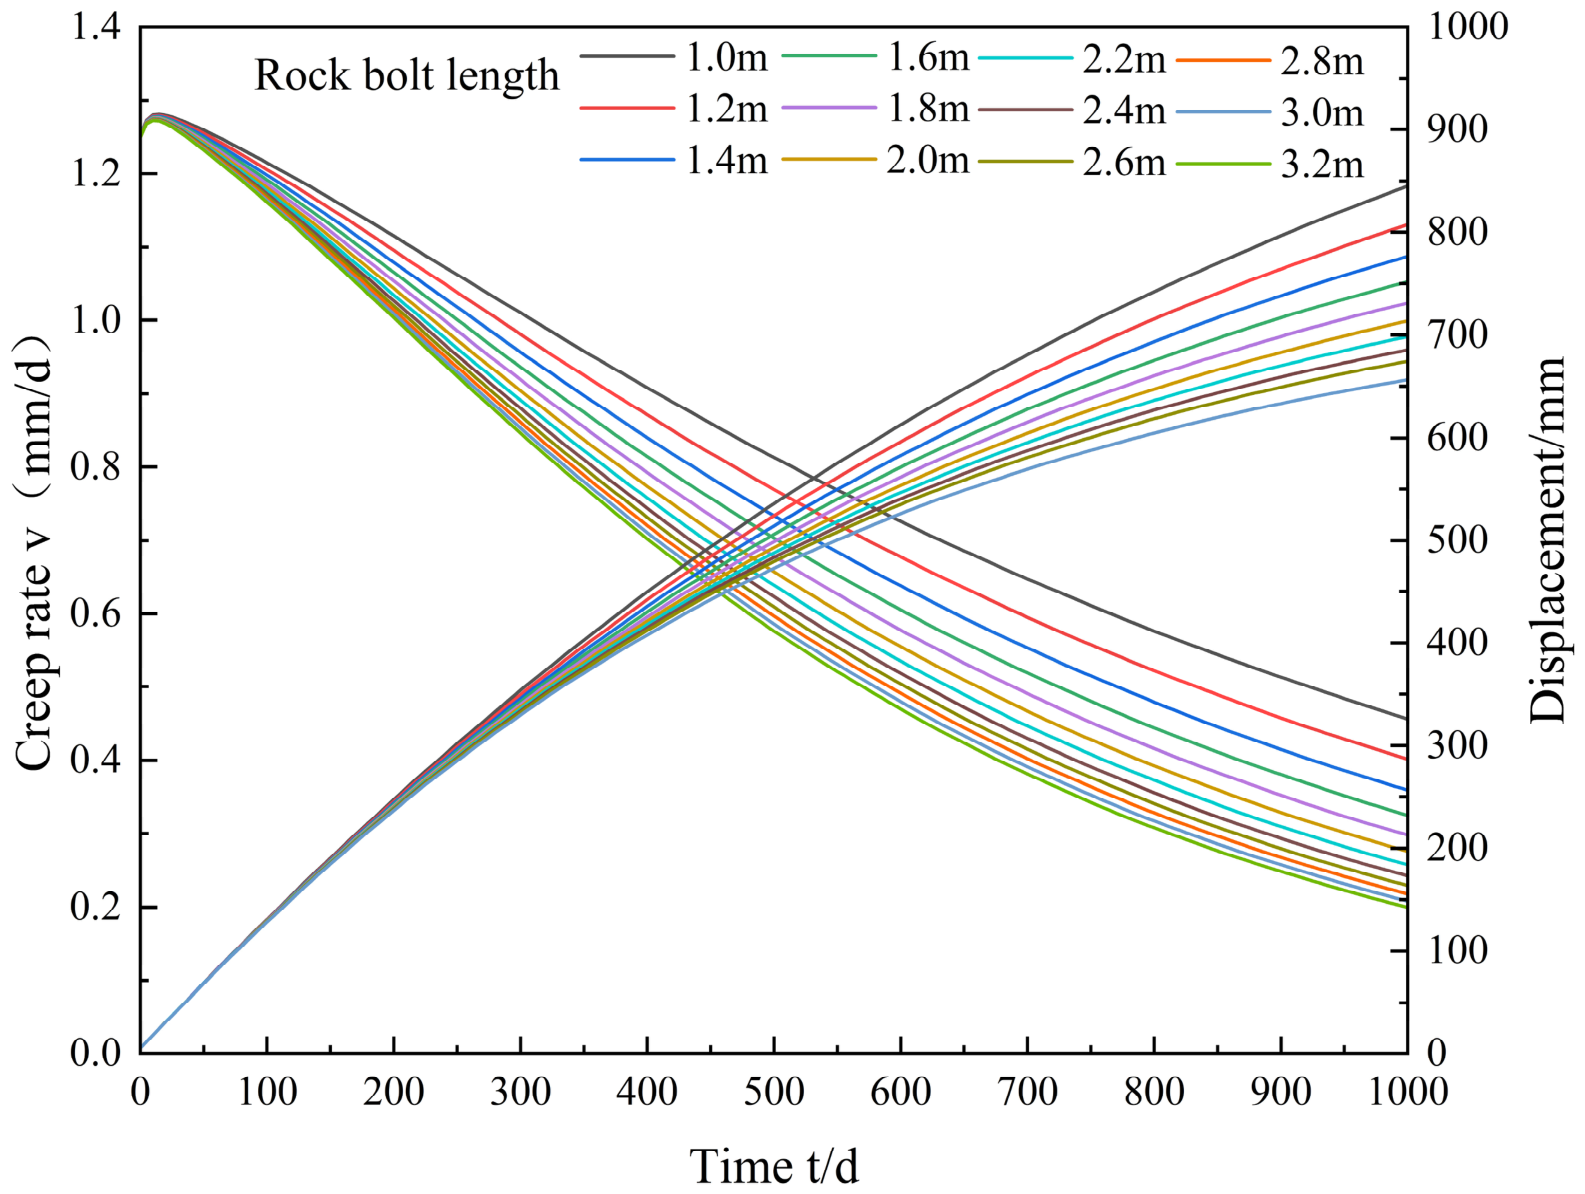
Similarly, we substitute the quantitative parameters from Table 3 and the varying bolt length into Equations (18) and (19), respectively, to calculate the radial displacement u(a,t) and the rheological rate V(a,t) at the tunnel wall (r = a). The displacement and rate curves under different bolt lengths are plotted, as shown in Figure 4.
The relationship between roadway deformation amount, deformation rate, and bolt length is presented in Table 4.
Bolt length has a relatively small effect on the initial rheological rate: it is 1.252 mm/d at 1.0 m and 1.249 mm/d at 3.2 m, a decrease of only 0.27%. However, its influence on long-term rheological behavior is significant: the rheological rate at 730 days drops from 0.625 mm/d at 1.0 m to 0.357 mm/d at 3.2 m, a reduction of 42.8%; the total displacement at 730 days decreases from 700.21 mm to 575.66 mm, a reduction of 124.55 mm. The data also show that as bolt length increases, the reduction in displacement follows a pattern of diminishing marginal returns: from 1.0 m to 2.0 m, each 0.2 m increase in bolt length results in a displacement reduction of about 10–23 mm; beyond 2.4 m, each additional 0.2 m reduces displacement by only 5–9 mm, indicating that the critical effective anchorage length is approximately 2.4 m.

3.3. Influence of Roadway Burial Depth on the Rheological Response of Surrounding Rock

Considering that actual roadways often have a dip angle due to topography or mining panel layout, the burial depth varies significantly along the strike. To investigate the influence of burial depth on the rheological behavior of the surrounding rock, the burial depth is taken as a variable to analyze the rheological response of the surrounding rock.
The quantitative parameters are shown in Table 5.
Variable: Roadway burial depth from 400 to 600 m.
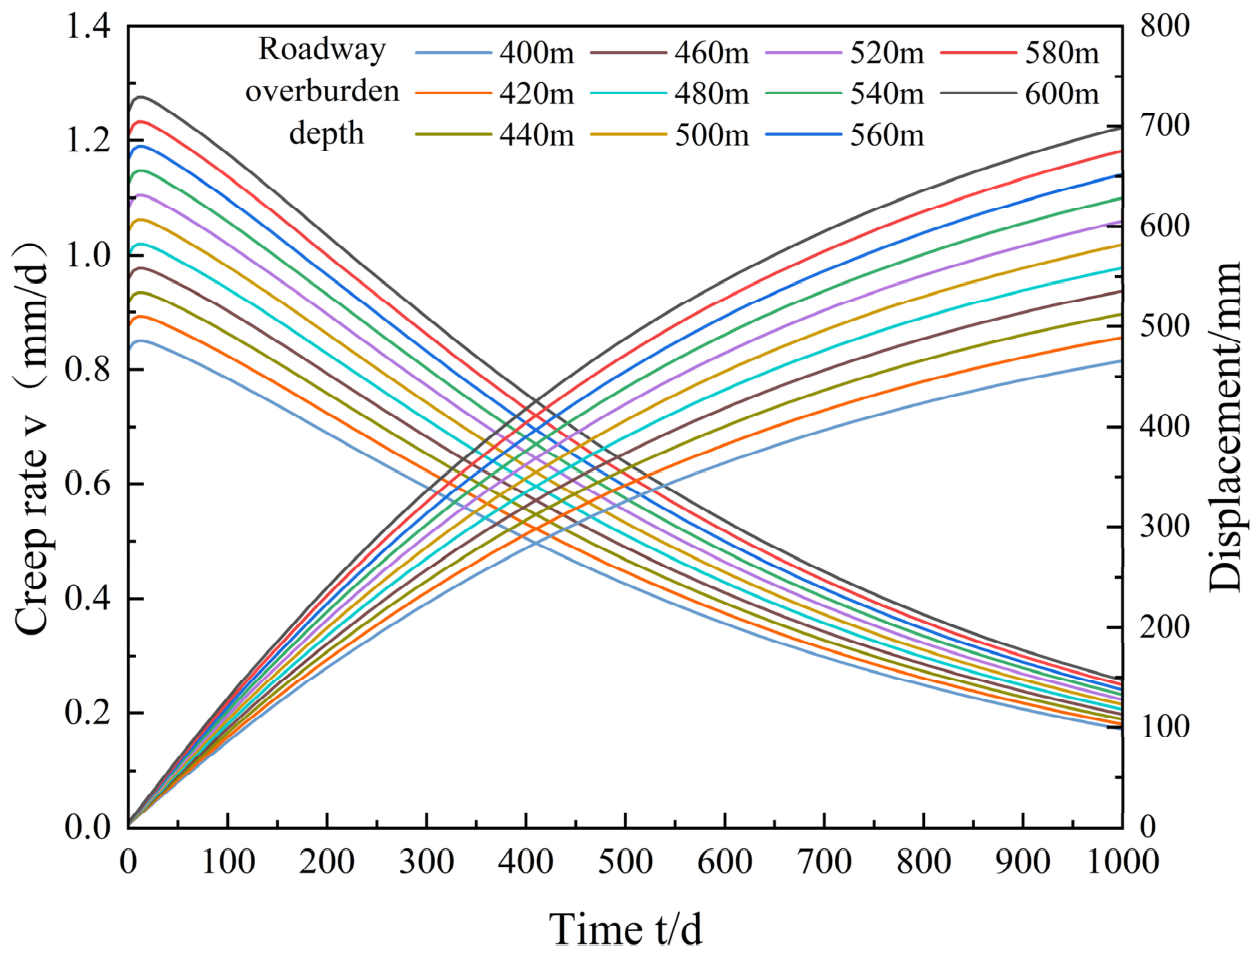
Substituting the quantitative parameters from Table 3, Table 4 and Table 5 and the varying roadway burial depths into Equations (2)–(18) and (2)–(19), respectively, the radial displacement u(a,t) and the rheological rate V(a,t) at the tunnel wall (r = a) are calculated. The displacement and rate curves under different burial depths are plotted, as shown in Figure 5.
The relationship between roadway deformation amount, deformation rate, and burial depth is presented in Table 6.
As the burial depth increases, the deformation of the surrounding rock exhibits a progressively intensifying nonlinear growth trend over time, generally following a pattern of “fast first, slow later”. In the early to middle stages, the differences between the curves are relatively small, mainly controlled by excavation disturbance. In the later stage, the deformation rate gradually decreases and tends to stabilize; however, conditions with greater burial depth still show larger deformation amplitudes and a longer sustained development process, reflecting significant rheological time-dependent characteristics. When the burial depth increases from 400 m to 600 m, the initial rheological rate increases from 0.833 mm/d to 1.250 mm/d, an increase of 50%; the rheological rate at 730 days increases from 0.282 mm/d to 0.423 mm/d, also an increase of 50%; the total displacement at 730 days increases from 405.7 mm to 608.5 mm, and for every 20 m increase in burial depth, the total displacement increases by approximately 20.3 mm.

4. Numerical Simulation Verification Considering Creep Characteristics

To verify the reliability of the theoretical model established in Section 2 and the rheological deformation laws of the surrounding rock presented in Section 3, a numerical simulation study considering creep characteristics is carried out, taking the North Wing Auxiliary Transport Roadway of Zhaoxian Coal Mine as the engineering background. The simulation results are then compared with the theoretical calculations.

4.1. Overview of the North Wing Auxiliary Transport Roadway

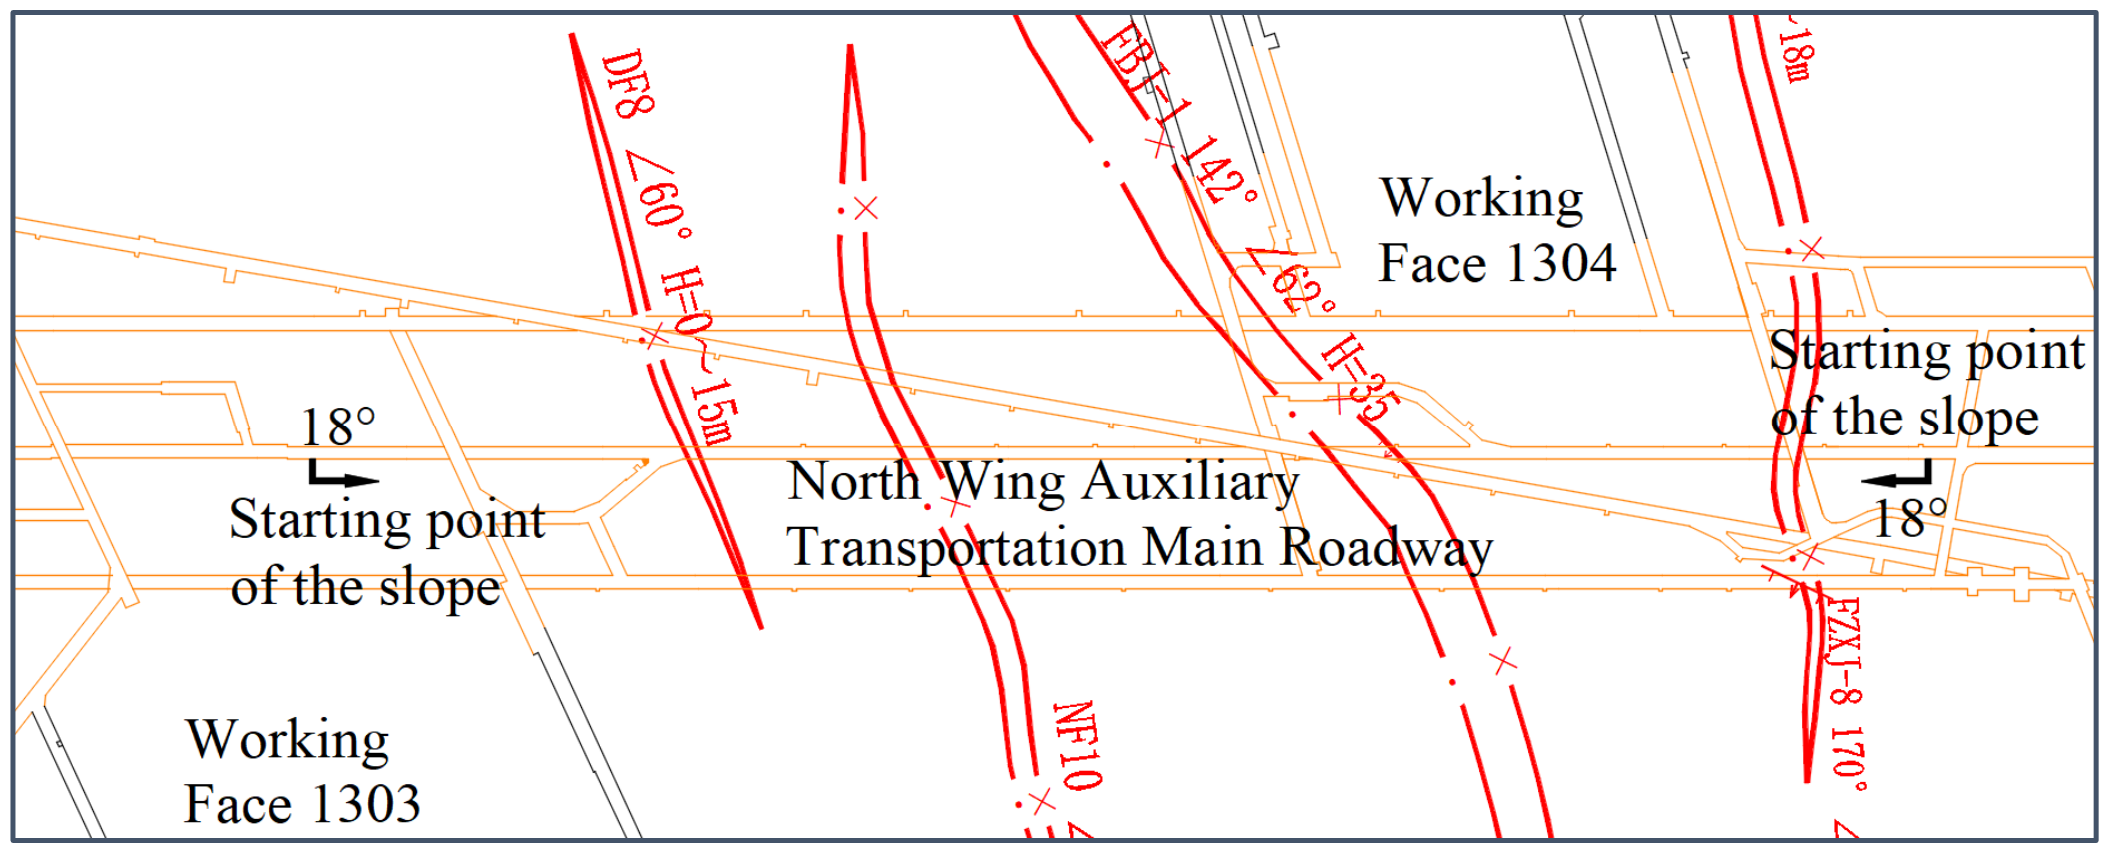
The North Wing Auxiliary Transport Roadway of Zhaoxian Coal Mine is located in the central part of the first mining panel. The roadway has a dip angle of 18°, a burial depth ranging from 434 m to 601 m, and an elevation difference of 200 m between the upper and lower starting points of the slope. The roadway passes through No. 3 coal, mudstone, carbonaceous mudstone, fine sandstone, and siltstone. The layout of the North Wing Auxiliary Transport Roadway is shown in Figure 6.
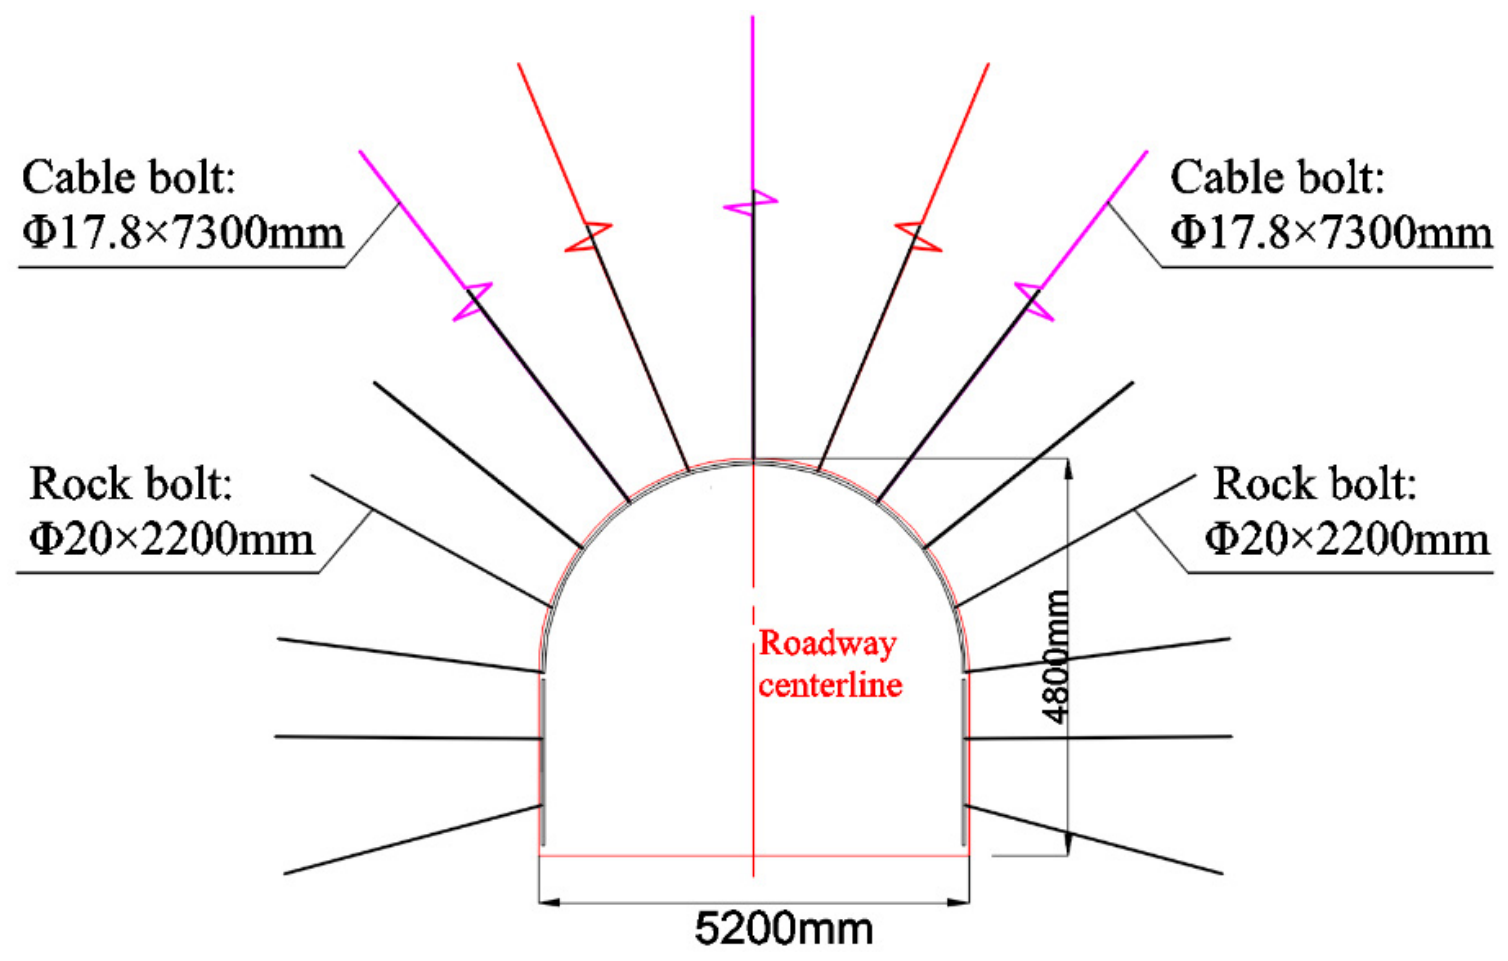
The support for the North Wing Auxiliary Transport Roadway uses Φ20 × 2200 mm left-handed non-longitudinal-rib bolts, with backing plates of 150 × 150 × 10 mm. The bolt spacing and row spacing are 800 mm × 800 mm, with 15 bolts per row, and full-length anchoring. When installing the bolts, one bolt is placed at the top center, and then the remaining bolts are arranged uniformly in a rectangular pattern on both sides; the floor corner bolts are inserted at a downward angle of 15°. The anchor cables are Φ17.8 × 7300 mm, with backing plates of 300 × 300 × 15 mm, and the cable spacing and row spacing are 1600 mm × 1600 mm, arranged in a 2-3-2 pattern, as shown in Figure 7.

4.2. Numerical Simulation Verification Considering Creep Characteristics

4.2.1. Numerical Model Establishment

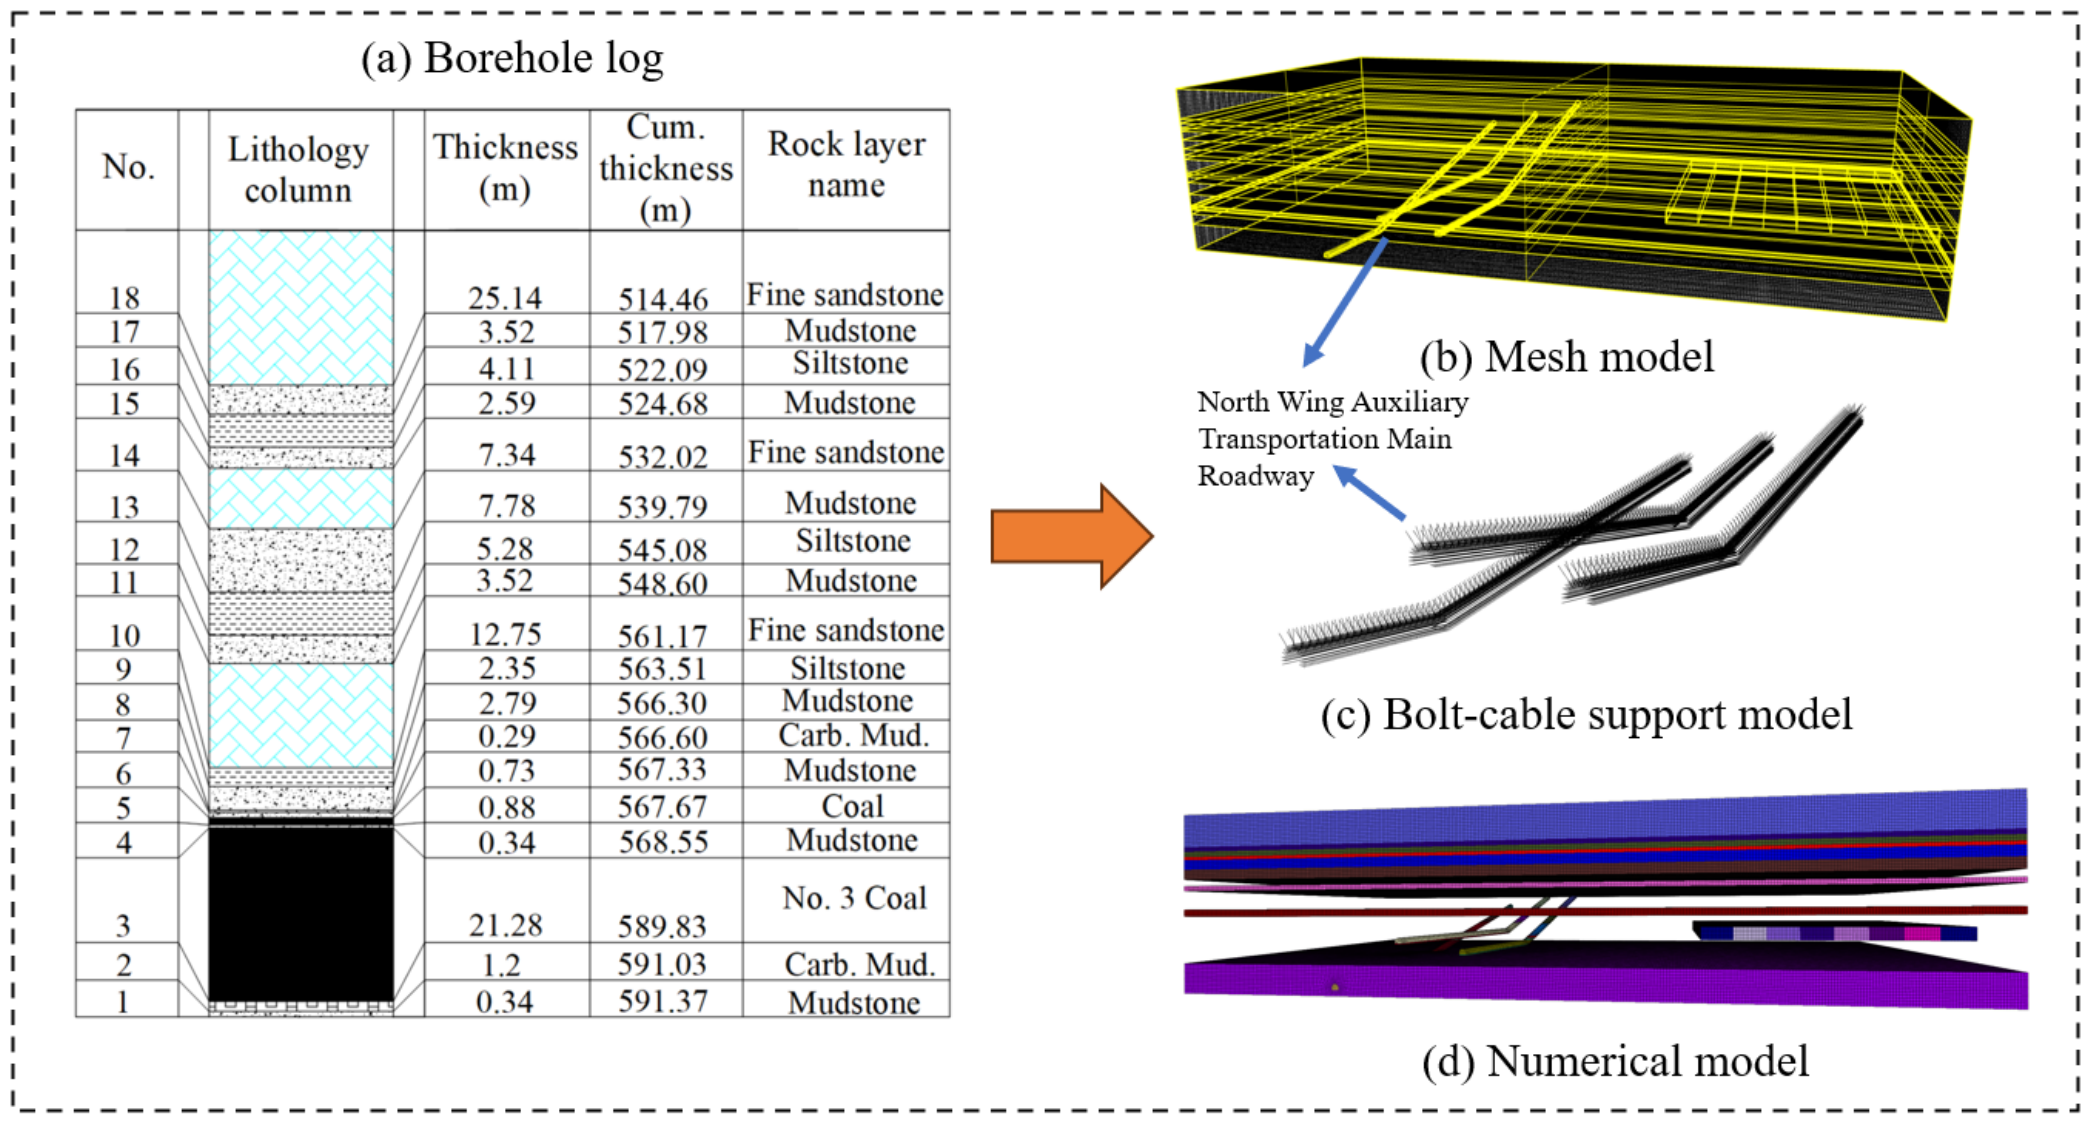
Using the solid modeling tools in Rhino 7 software, a rock mass solid model with dimensions of 600 m (length) × 300 m (width) × 139.57 m (height) was first established. Subsequently, the extrusion of planar curves was employed to generate the solid models of three roadways—the North Wing Auxiliary Transport Roadway, the North Wing Belt Conveyor Roadway, and the North Wing Auxiliary Intake Airway—as well as the 1303 working face with a length of 200 m. The Boolean difference operation was applied to separate the rock mass from the three roadways into distinct modules. Initial meshing was performed using the built-in meshing tool of Rhino, followed by refined meshing with the Gridle plugin to obtain small elements. The node files exported from Rhino were imported into FLAC3D, where the rock strata, roadways, and working face were named and assigned parameters; the physical and mechanical parameters of the rock strata were assigned according to Table 7. Based on the roadway support drawings, line models of the rock bolts and anchor cables were created, exported as DXF files, and the support was applied after roadway excavation, as shown in Figure 8.
The boundary conditions of the numerical model were defined according to the mechanical constraints of the surrounding rock. The bottom boundary (z = 0 plane) was constrained in the vertical direction, while the two side boundaries (x = 300 m and x = −300 m planes) were constrained in the horizontal direction. The front and rear boundaries (y = 0 m and y = 300 m planes) were also constrained in the corresponding horizontal direction. A uniform mesh size of 1 m × 1 m was adopted for the numerical model to ensure sufficient calculation accuracy while maintaining computational efficiency. The calculation was considered converged when the convergence criterion was less than 1 × 10⁻⁵.

4.2.2. Analysis of Simulation Results

The creep analysis mode is set using model configure creep. The settings and solution for the creep stage are implemented with the following FISH code:
model creep timestep starting 1
model creep timestep automatic
model creep timestep minimum 1
model creep timestep maximum 100
model solve time-total 31,104,000
(31,104,000/86,400 = 360 days)
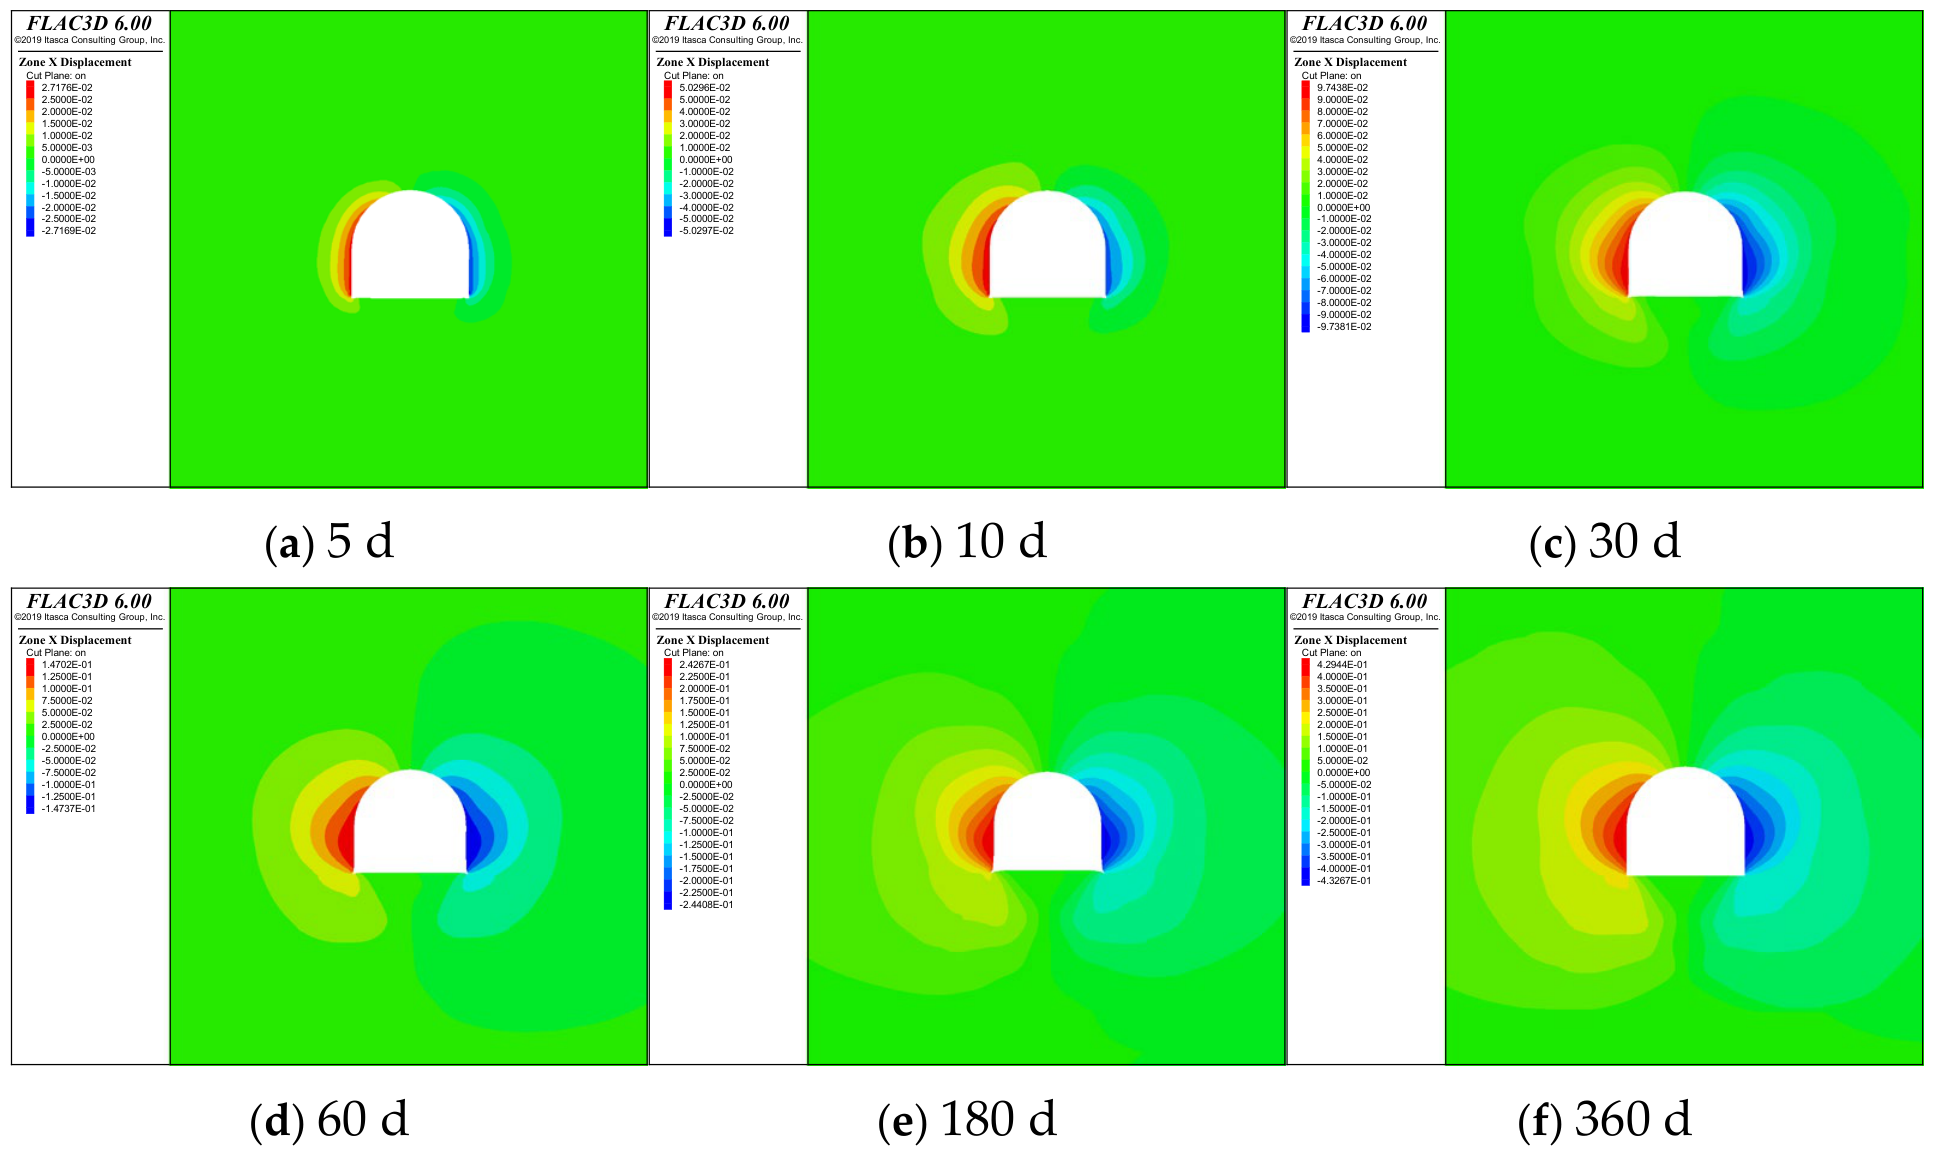
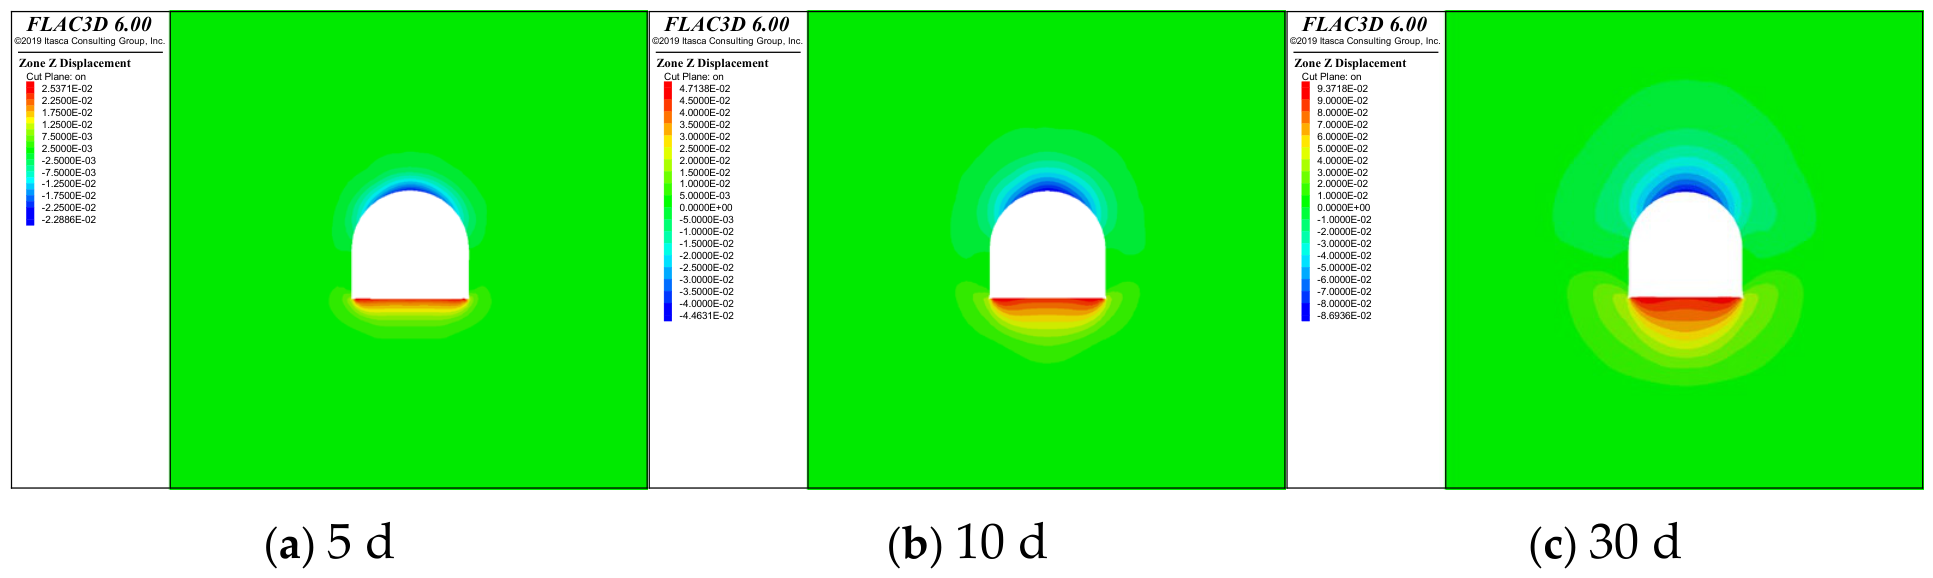
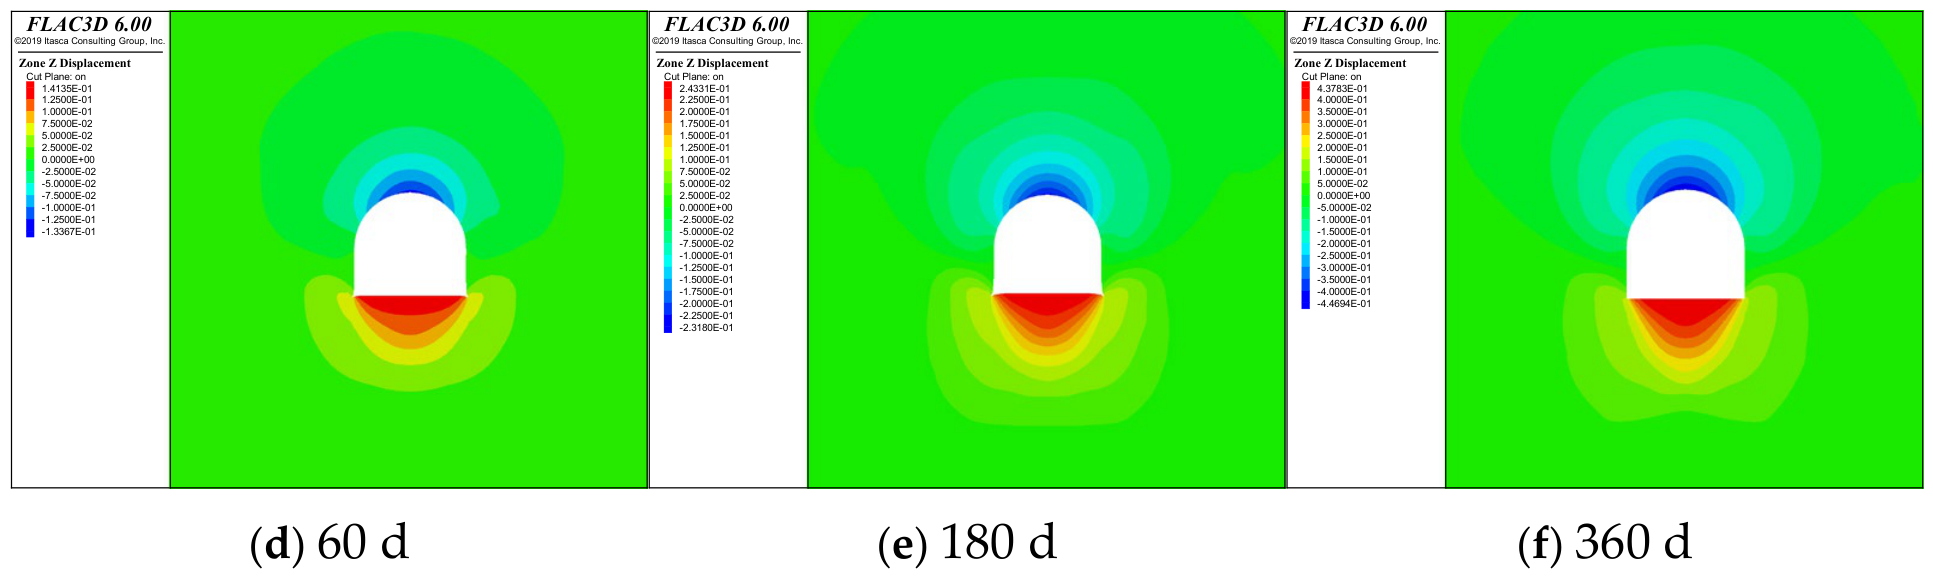
Using the above code, the deformation characteristics of the surrounding rock at 5 d, 10 d, 30 d, 60 d, 180 d, and 360 d after excavation and support of the main roadway are simulated. The simulation results are shown in Figure 9 and Figure 10.
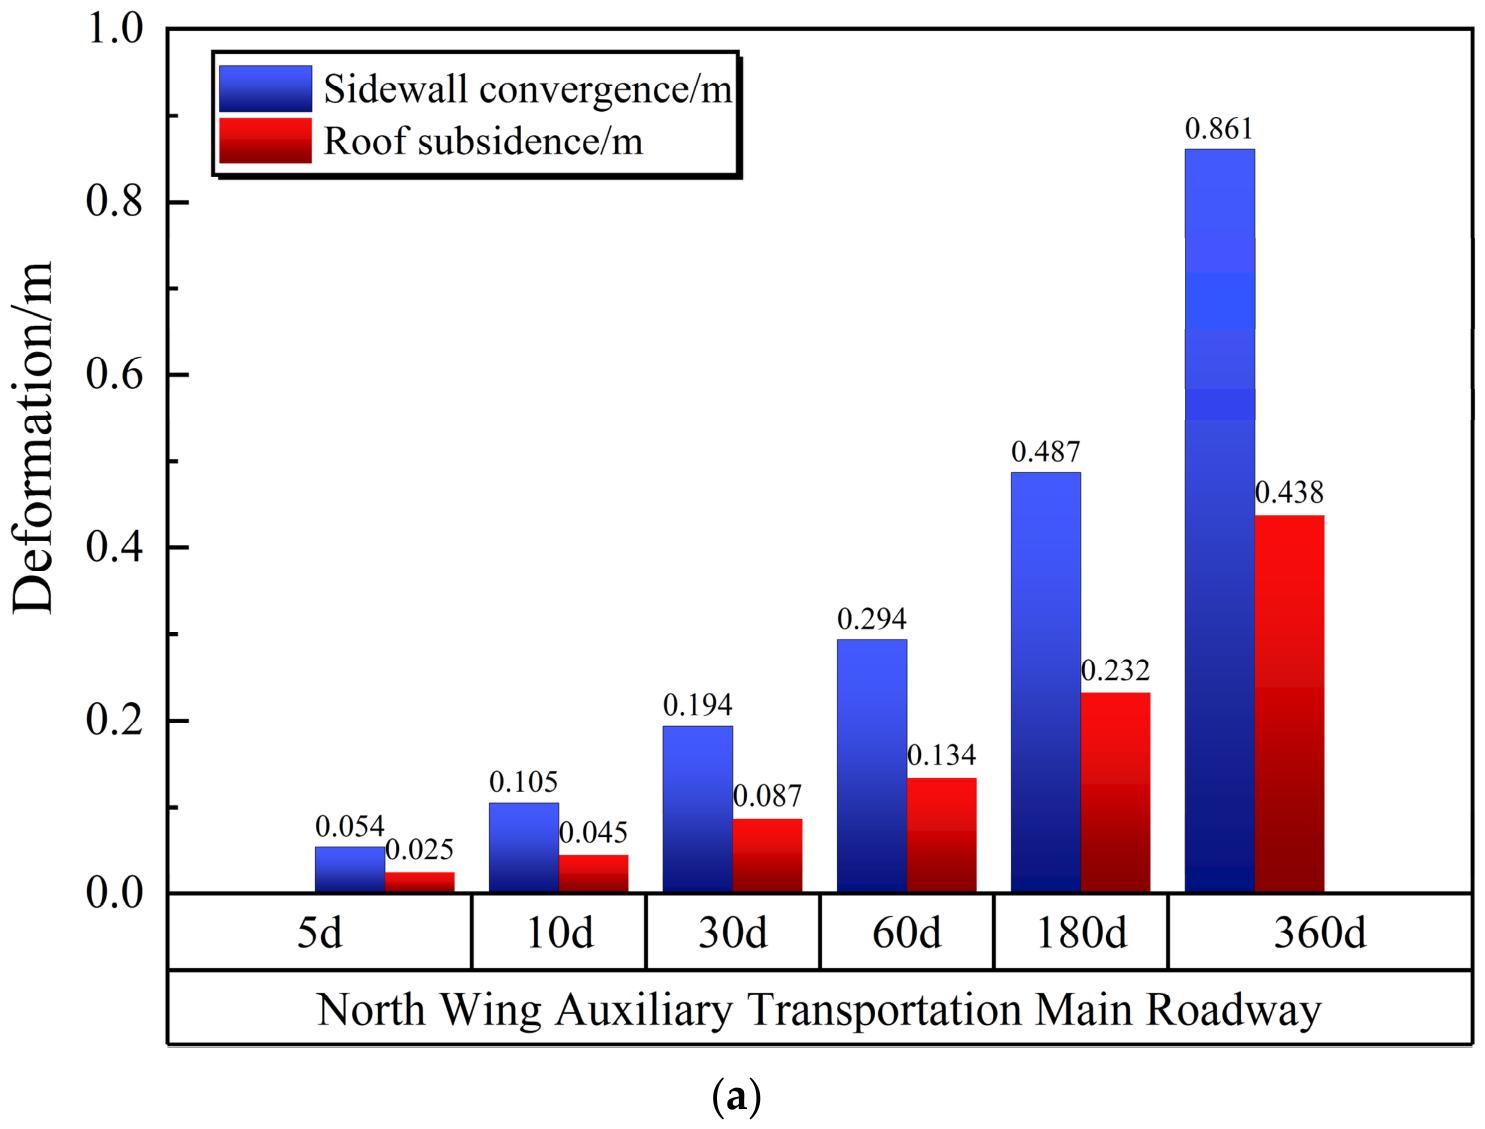
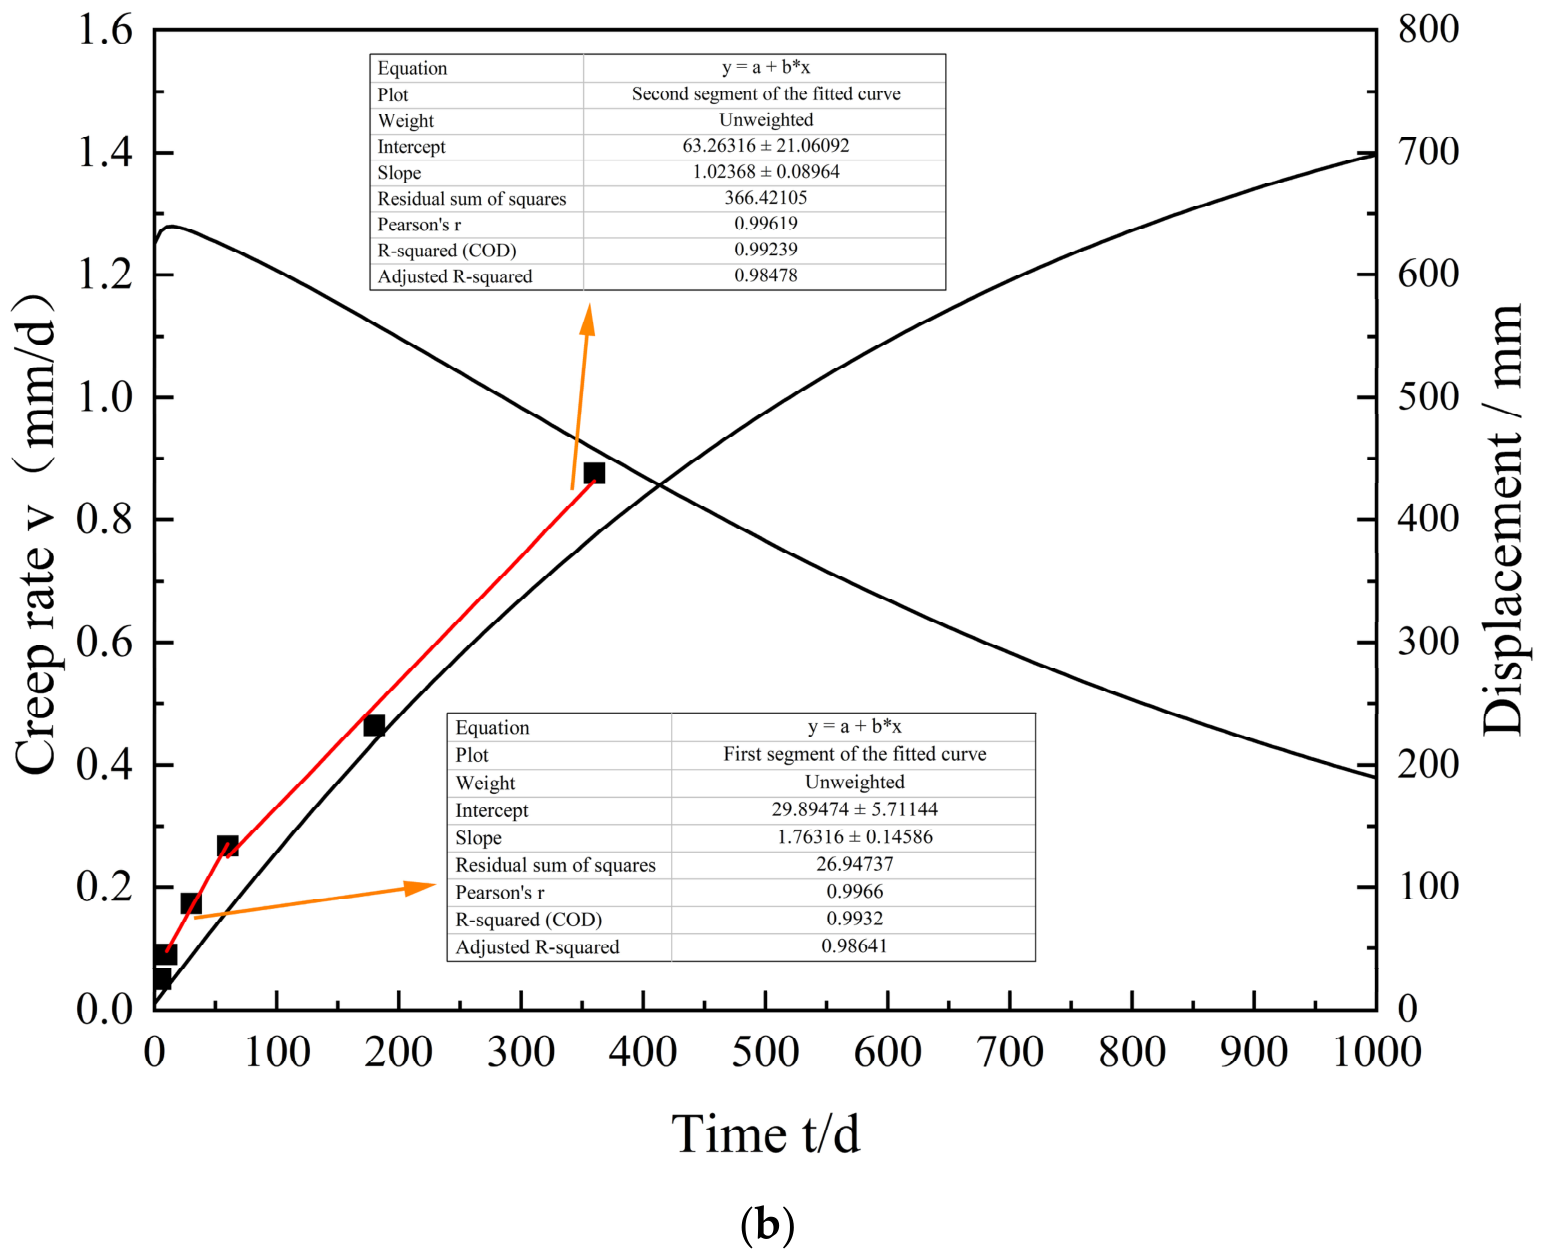
Sections were cut at the slope starting point of the North Wing Auxiliary Transport Roadway, and monitoring points were arranged at the middle of the roadway roof and at symmetric positions on both sides. The roof subsidence and sidewall convergence 360 days after excavation were obtained, as shown in Figure 11, and compared with the theoretical model and analysis results.
It can be seen from Figure 11 that the deformation of the surrounding rock exhibits a significant nonlinear growth characteristic over time, and the numerical simulation results agree well with the theoretical calculation curves overall. During the calculation period (0–360 d), the deformation of the surrounding rock increases to 0.438 m. Fitting analysis of the simulation results and the theoretical curves shows that the variation trends of the two are highly consistent, with a goodness-of-fit correlation coefficient of (R2 ≈ 0.985595), indicating that the established theoretical model can accurately characterize the rheological deformation behavior of the roadway surrounding rock.

5. Engineering Application

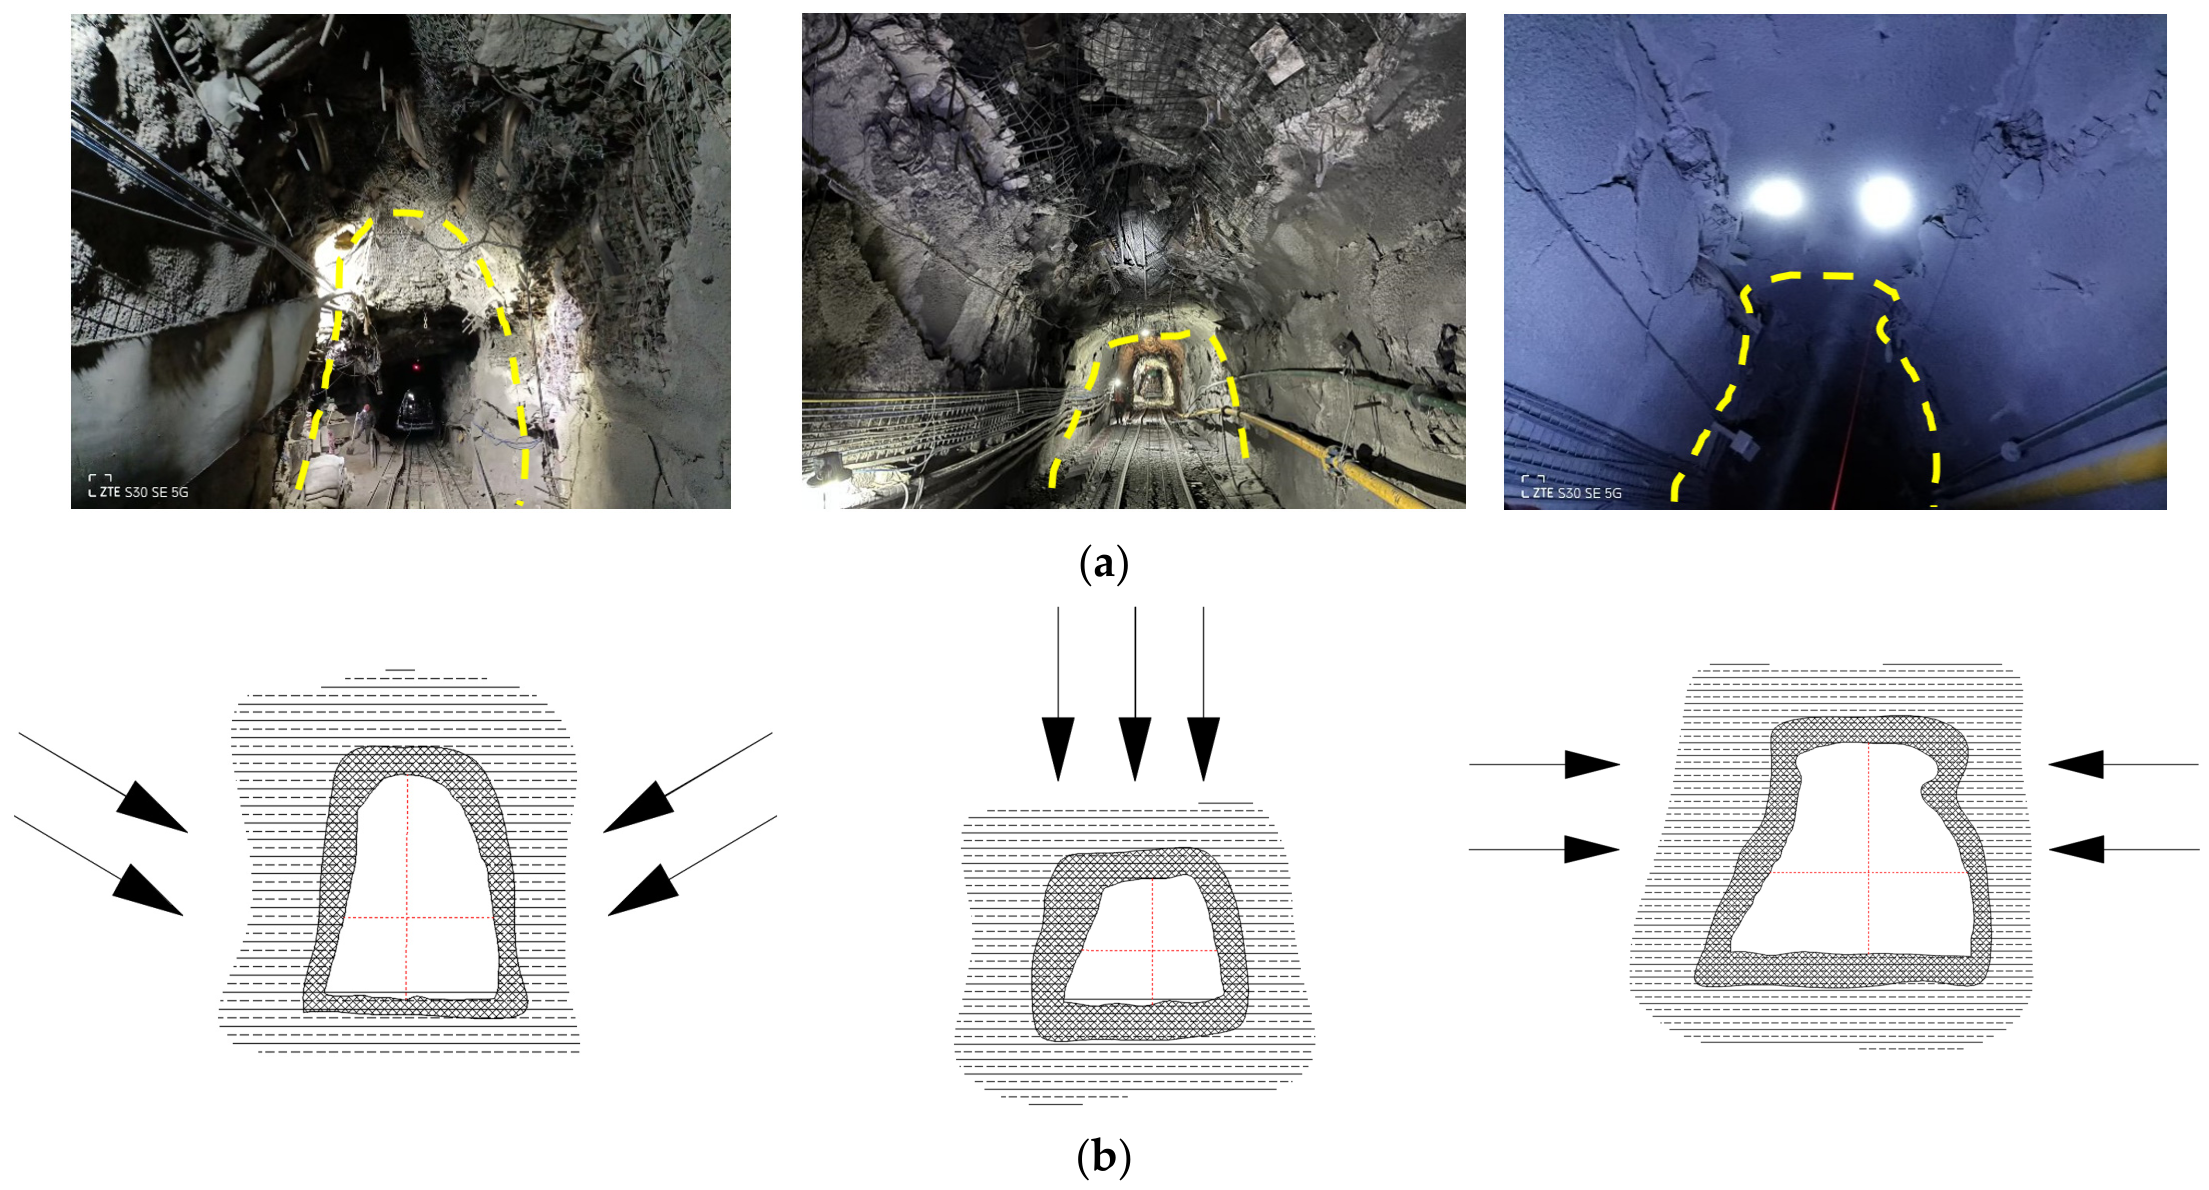
The field deformation characteristics of the North Wing Auxiliary Transport Roadway are shown in Figure 12.
The North Wing Auxiliary Transport Roadway has undergone multiple repair operations, with the most recent repair completed in 2022. After approximately two years (730 days) of operation, the surrounding rock deformation gradually increased, and the roadway section could no longer satisfy the operational requirements. Therefore, roadway enlargement and repair work was initiated in June 2024. Field monitoring of the roadway deformation was conducted before June 2024, and the obtained deformation data were used to validate the proposed theoretical model. Since the roadway cross-section was modified during the enlargement process, the deformation data during the enlargement stage were not directly used for comparison with the original analytical model. After completion of the enlargement project, a new monitoring program will be conducted to further validate the model under the updated roadway conditions.
The roadway was originally designed as a straight-wall semicircular arch, with a designed clear section height of 4.8 m and clear width of 5.2 m. Detailed field cross-section measurements were carried out to evaluate the applicability of the theoretical model.
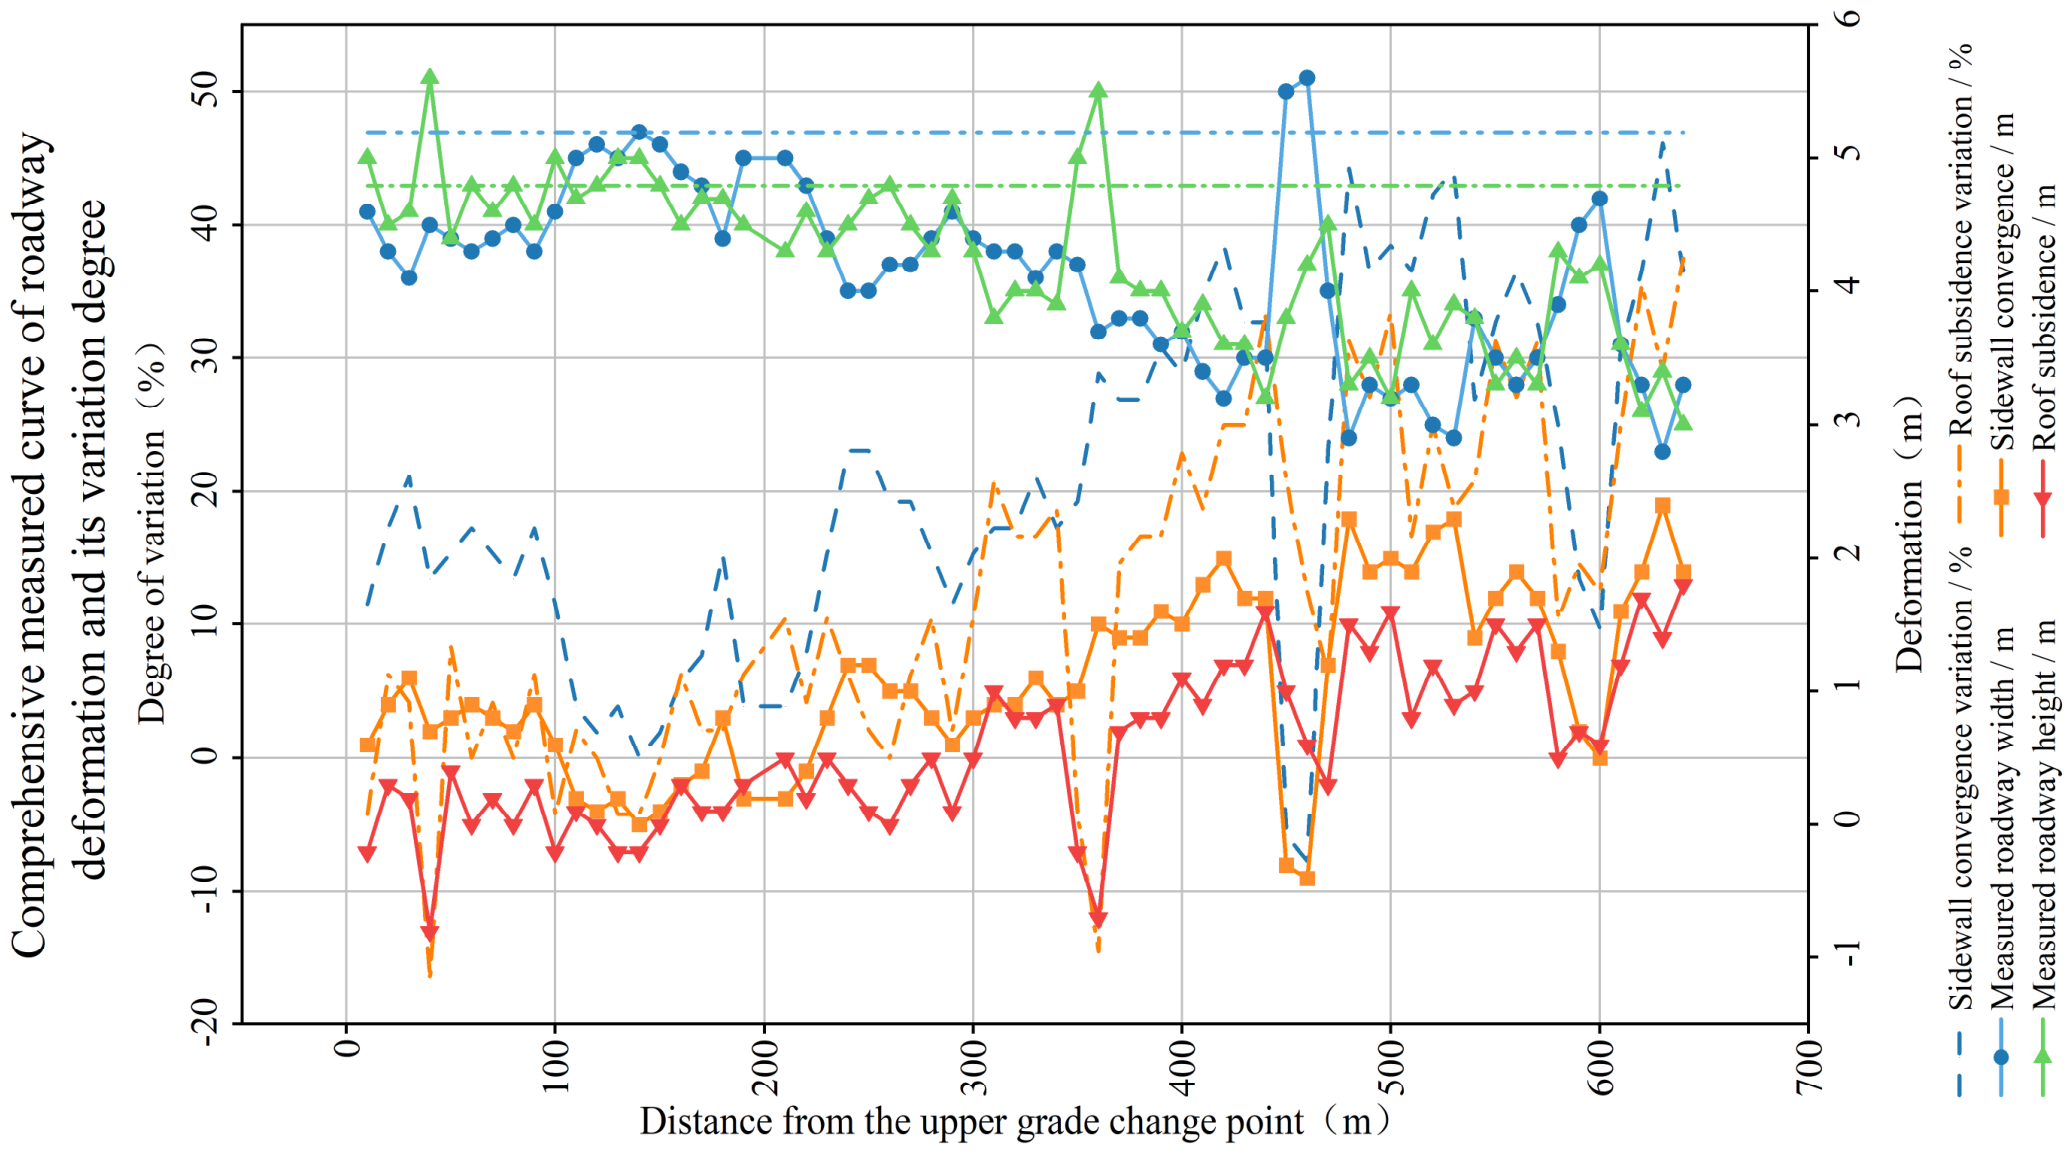
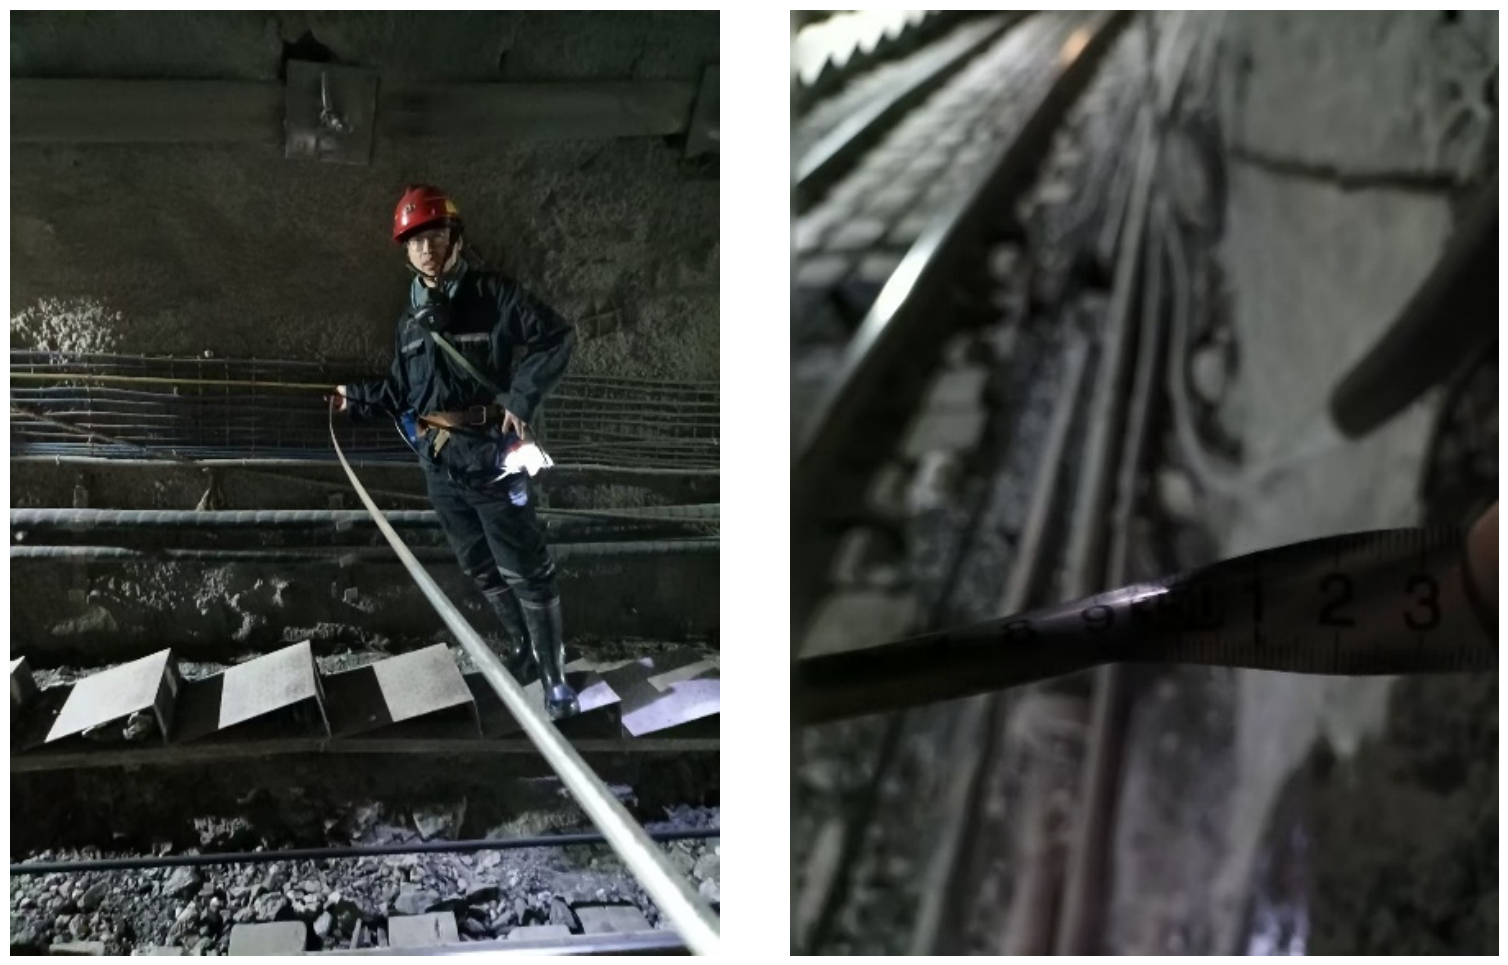
The roadway deformation was measured using a steel tape. The monitoring points were arranged at the center line of the roof and at symmetrical positions on both sidewalls 1.5 m above the roadway floor. A total of 20 monitoring points were established, and the deformation data were collected every 10 days. The monitoring mainly included roof subsidence and sidewall convergence. These measured deformation data were used to evaluate the applicability and accuracy of the proposed rheological model. It should be noted that field measurements may contain certain errors due to the limitations of measurement accuracy, operation conditions, and monitoring point installation. However, the monitoring results provide reliable deformation information for validating the theoretical predictions. The field test photos are shown in Figure 13, and the test results are presented in Figure 14.
(1)
Case study analysis:
Taking the actual geological and support conditions at the lower slope starting point of the North Wing Auxiliary Transport Roadway in Zhaoxian Coal Mine as the calculation case: roadway burial depth h = 600 m, roadway radius a = 2.6 m, average unit weight of overlying strata γ = 25 kN/m3, elastic modulus of the in-situ rock mass E1 = 6000 MPa, viscosity coefficient of the rock mass η = 30,000 MPa·d, Poisson’s ratio ν = 0.27; for support parameters, bolt diameter 20 mm, elastic modulus of bolt rod Eb = 210 GPa, bolt length l = 2.2 m. Substituting the above parameters into Equations (18) and (19), the calculated rheological rate at 730 days for the North Wing Auxiliary Transport Roadway is 0.423 mm/d, and the deformation at 730 days is 608.49 mm. The actual roof subsidence at 730 days at the lower slope starting point is 0.6 m, and the single sidewall convergence is 0.75 m; the average deformation of the surrounding rock is 0.675 m. The absolute deviation between the two is 66.5 mm, and the relative deviation is 9.85%. Considering that the theoretical model is based on simplifying assumptions such as isotropy, linear viscoelasticity, and a hydrostatic stress field, while the actual surrounding rock exhibits heterogeneity, joints and fractures, deviatoric stresses induced by the inclined roadway, and construction disturbances, the theoretical values are slightly smaller than the numerical and measured results. These assumptions mainly influence the predicted deformation by reducing the complexity of the surrounding rock response. In particular, the neglect of rock discontinuities and plastic damage mechanisms tends to underestimate the deformation under high-stress conditions. In addition, excavation-induced deviatoric stresses and construction disturbances may further accelerate surrounding rock deformation, resulting in larger numerical and field-measured values.
Overall, the theoretical calculations agree well with the measured data, indicating that the rheological model established in this paper can reliably predict the long-term deformation trends of high-stress soft rock roadways and has practical engineering value.
(2)
Time-dependent curve fitting analysis:
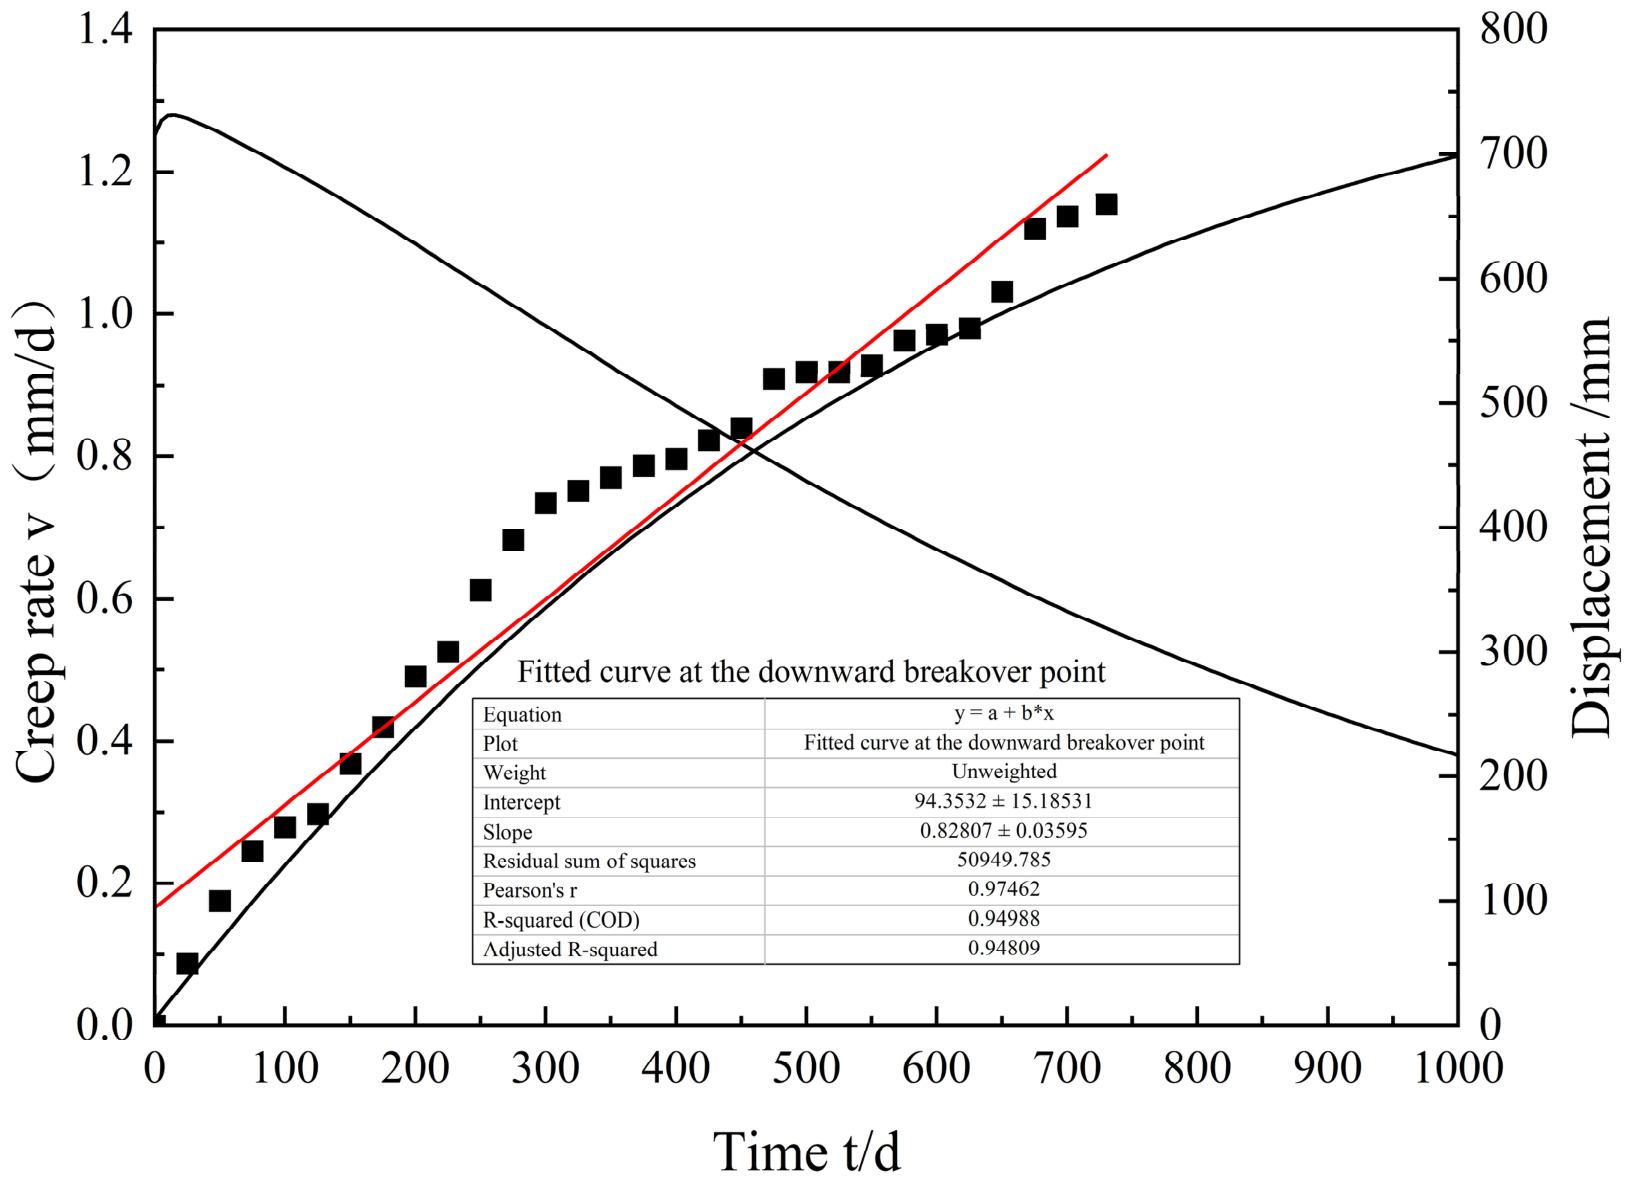
The time-dependent fitting curve at the slope starting point is shown in Figure 15.
According to the comparative analysis between the rheological theoretical curve at the slope starting point and the field measured data, both show an overall decay creep characteristic, in which the displacement increases continuously over time while the growth rate gradually decreases. In the initial stage, the measured values almost completely coincide with the theoretical values, indicating that the selected rheological constitutive model can accurately reflect the instantaneous elastic strain and early creep behavior of the surrounding rock. In the middle stage, the measured displacement is slightly higher than the theoretical value, with the maximum deviation controlled within 5%, which may be attributed to the progressive closure of local micro-cracks at the slope starting point or fluctuations in the field environment. In the later stage, the deviation between the two converges to less than 3%, and the rheological rate steadily decreases from the relatively high initial value to approximately 0.6 mm/d, with no sign of accelerated instability. Quantitative evaluation over the entire period shows a low root mean square error (RMSE) and a coefficient of determination (R2) above 0.98, confirming that the theoretical model is in good agreement with the measured data and can effectively describe the long-term deformation trend of the surrounding rock at the slope starting point, providing a reference for support design under similar engineering conditions.
(3)
Fitting analysis of burial depth:
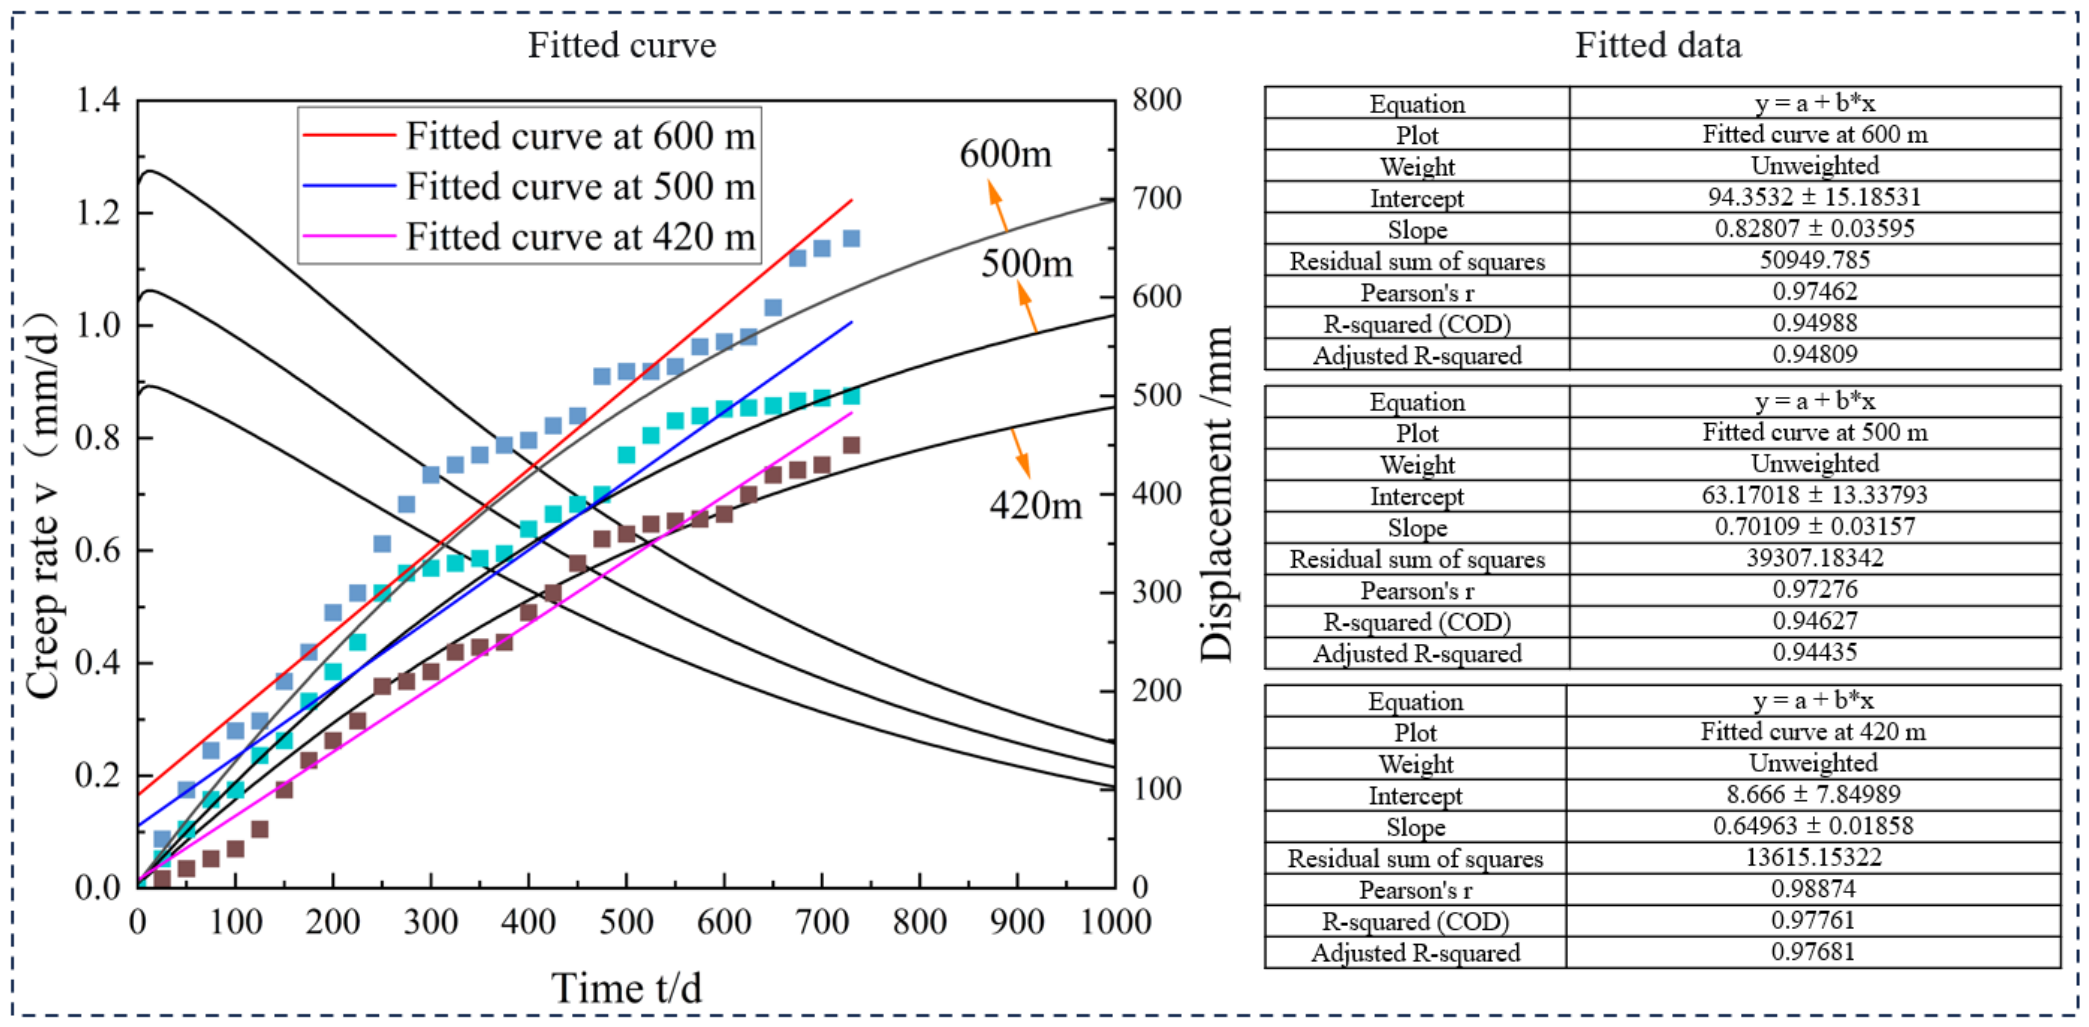
The time-dependent fitting curves for different burial depths are shown in Figure 16.
Based on the linear regression analysis results of the rheological theoretical curves and field measured data at burial depths of 420 m, 500 m, and 600 m, the goodness of fit at each depth is relatively high (R2 > 0.94), indicating that the selected rheological model can adequately describe the time-dependent deformation characteristics of the surrounding rock at different burial depths. Specifically, as the burial depth increases, the slope of the fitted line gradually increases—0.6496 at 420 m, 0.7011 at 500 m, and 0.8281 at 600 m—indicating that the sensitivity of the rheological rate to time increases with depth, and the deep surrounding rock exhibits a more pronounced accelerating creep trend. Meanwhile, the intercept also increases significantly with burial depth (8.67 at 420 m, 63.17 at 500 m, and 94.35 at 600 m), reflecting a larger initial instantaneous strain in the deep surrounding rock. In terms of fitting accuracy, the R2 at 420 m is the highest (0.9776) with the smallest residual sum of squares, meaning the measured points best match the theoretical line; the R2 values at 600 m and 500 m are 0.9499 and 0.9463, respectively, still indicating high correlation, though the measured points are slightly more scattered. Overall, the model exhibits good adaptability to different burial depths, and the greater the depth, the stronger the rheological response. It is recommended to enhance support in deep sections and consider adopting a higher-order rheological constitutive model for long-term prediction.

6. Conclusions

(1) A coupled rheological analytical framework considering both anchored and unanchored rock zones was established based on the Maxwell rheological framework. By introducing the equivalent stiffness contribution of bolt reinforcement into the anchored zone, the proposed model describes the interaction between bolt support and surrounding rock and effectively characterizes the time-dependent deformation behavior of high-stress soft rock roadways.
(2) The analytical solution of surrounding rock displacement indicates that support parameters significantly influence long-term deformation behavior. Increasing bolt density and reducing bolt spacing can effectively suppress deformation accumulation, while bolt length exhibits a threshold effect with diminishing marginal benefits beyond a critical anchorage length.
(3) Burial depth has a significant influence on the rheological response of surrounding rock. With increasing depth, both the initial deformation rate and long-term displacement increase significantly, indicating enhanced time-dependent creep characteristics under high-stress conditions.
(4) Numerical simulation results using FLAC3D show good agreement with theoretical predictions, with a high correlation coefficient (R2 ≈ 0.985), demonstrating the applicability of the proposed model for describing the deformation behavior of high-stress soft rock roadways.
(5) Field engineering validation shows that the theoretical results are consistent with measured deformation data, with a relative error within 10%. The proposed model can effectively describe the long-term deformation trend of the investigated deep soft rock roadway and provide a theoretical reference for support design under similar engineering conditions.
However, the current validation is based on one engineering case, and further studies involving different geological conditions are required to improve the universality of the model.


Author Contributions

Conceptualization, H.Y. and L.S.; Methodology, H.Y., L.S., M.J. and K.G.; Validation, H.Y., L.S., M.J. and K.G.; Data curation, H.Y., L.S. and K.G.; Writing—original draft, M.J.; Writing—review & editing, H.Y., L.S. and M.J.; Supervision, M.J. and K.G. All authors have read and agreed to the published version of the manuscript.

Funding

This research was funded by the National Natural Science Foundation of China (Grant No. 52374102).

Data Availability Statement

The original contributions presented in this study are included in the article. Further inquiries can be directed to the corresponding authors.

Conflicts of Interest

Author Lu Shulin was employed by the company Guizhou Panjiang Clean Coal Co., Ltd. The remaining authors declare that the research was conducted in the absence of any commercial or financial relationships that could be construed as potential conflicts of interest.

References

  1. Wang, X.; Zhang, Y.; Zhang, Q.; Wei, Y.; Liu, W.; Jiang, T. Space-time evolution characteristics of deformation and failure of surrounding rock in deep soft rock roadway. Sustainability 2022, 14, 12587. [Google Scholar] [CrossRef] [Scilit]
  2. Chen, L.; Xi, B.; Zhao, N.; He, S.; Dong, Y.; Liu, K.; Gao, P.; Liu, G. Large deformation mechanism and support countermeasures of deep-buried soft rock tunnels under high geostress state. Buildings 2025, 15, 704. [Google Scholar] [CrossRef] [Scilit]
  3. Sun, D.; Zhang, C.; Zhang, S.; Xu, J.; Tao, Z.; Wu, M.; Li, D.; Zhang, G.; Liu, Y.; Wang, F. Hydraulic fracturing in-situ stress measurements and large deformation evaluation of 1000 m-deep soft rock roadway in Jinchuan No. 2 Mine, Northwestern China. Rock Mech. Rock Eng. 2025, 58, 2781–2801. [Google Scholar]
  4. Wu, B.; Chang, J.; Li, C.; Wang, T.; Shi, W.; Wang, X. Mechanism of Time-Dependent Instability of Deep Soft-Rock Roadway and Crack-Filling Reinforcement Technology. Appl. Sci. 2023, 13, 4641. [Google Scholar] [CrossRef] [Scilit]
  5. Jia, S.; Yang, J.; Gao, M.; Jia, L.; Wen, C.; Wu, G. Experimental and numerical analysis of deformation and failure behaviour for deep roadways in soft rocks. Bull. Eng. Geol. Environ. 2022, 81, 466. [Google Scholar] [CrossRef] [Scilit]
  6. Yang, J.; Wang, X.; Xie, W.; Chen, H. Creep Behaviors of Extremely Soft and Fractured Coal Rock with Different Moisture Contents and Rare Secondary Creep Performance: Yang, Wang, Xie, and Chen. Nat. Resour. Res. 2023, 32, 357–371. [Google Scholar]
  7. Zhao, C.; Zhou, H.; Sun, X.; Zhang, Y.; Miao, C.; Wang, J. Failure mechanism and safety control technology of a composite strata roadway in deep and soft rock masses: A case study. J. Mt. Sci. 2024, 21, 2427–2444. [Google Scholar] [CrossRef] [Scilit]
  8. Yang, J. Numerical simulation study on deformation, failure and control mechanism of high stress soft rock roadway. Coal Sci. Technol. 2019. Available online: https://www.mtkxjs.com.cn/en/article/id/481a7b66-b8cd-40e0-b1d5-ebb5d108a8fb?viewType=citedby-info (accessed on 10 July 2026).
  9. Kang, H.; Yi, K. Simulation study on dilatant and rheologic properties of soft rocks surrounding deep roadway and its application. J. China Coal Soc. 2023, 48, 15–33. [Google Scholar]
  10. Sun, J. Rock rheological mechanics and its advance in engineering applications. Yanshilixue Yu Gongcheng Xuebao/Chin. J. Rock Mech. Eng. 2007, 26, 1081–1106. [Google Scholar]
  11. Shuling, H.; Xiuli, D.; Jun, H. Research on unified analytical solution and corresponding time-effect deformation characteristics of rock mass viscoelastic deformation under rigid and flexible bearing plate tests. In Proceedings of the ISRM International Symposium-Asian Rock Mechanics Symposium, Beijing, China, 21–25 October 2021; p. ISRM-ARMS11-2021-2365. [Google Scholar]
  12. Maheshwari, P. Analysis of deformation of linear viscoelastic two layered laminated rocks. Int. J. Rock Mech. Min. Sci. 2021, 141, 104681. [Google Scholar] [CrossRef] [Scilit]
  13. Zhou, Z.; Zhao, Y.; Zhang, H.; Chen, S.; Chen, L.; Wang, L. Analysis of Rheological Factors of Soft Rock Tunnel Based on Constitutive Model of Rock Parameters Attenuation with Equivalent Effect. Symmetry 2022, 14, 2432. [Google Scholar] [CrossRef] [Scilit]
  14. Wang, G.; Han, W.; Liu, C.; Wang, K.; Luan, H. Rheological Behavior of Rockmass Supported with Rockbolts Based on Viscoelastic Analysis Method. Mathematics 2018, 6, 199. [Google Scholar] [CrossRef] [Scilit]
  15. Zhang, H.; Li, Y.; Wang, X.; Yu, S.; Wang, Y. Study on stability control mechanism of deep soft rock roadway and active support technology of bolt-grouting flexible bolt. Minerals 2023, 13, 409. [Google Scholar] [CrossRef] [Scilit]
  16. Cao, F.; Fang, T. Application and analysis of bolt support in mine driving roadway. Math. Probl. Eng. 2022, 2022, 2521555. [Google Scholar] [CrossRef] [Scilit]
  17. Wang, J.; Zheng, X.; Guo, X.; Xin, W.; Wang, Y.; Li, T.; Liu, L. Study on the anchorage mechanism and roof stability control technology of bolts in fractured or weak surrounding rock. Sci. Rep. 2024, 14, 22906. [Google Scholar] [CrossRef] [Scilit] [PubMed]
  18. Chen, Y.; Meng, Q.; Xu, G.; Wu, H.; Zhang, G. Bolt-grouting combined support technology in deep soft rock roadway. Int. J. Min. Sci. Technol. 2016, 26, 777–785. [Google Scholar] [CrossRef] [Scilit]
  19. Yu, W.; Wang, B.; Zi, X.; Dong, J. Elastoplastic coupling analysis of surrounding rock-prestressed yielding anchor bolts/cables based on unified strength theory. Tunn. Undergr. Space Technol. 2024, 143, 105491. [Google Scholar] [CrossRef] [Scilit]
  20. Yang, W.; Liu, C.; Li, Y.; Wang, B.; Zhang, X. Investigation into the time-dependent mechanical behavior of pre-stressed anchor bolts and fractured rock specimens under synchronized tensile loads. Int. J. Damage Mech. 2025, 34, 1412–1434. [Google Scholar]
  21. Yang, W.; Wang, X.; Ivanović, A.; Zhang, X. Coupled analytical solutions for circular tunnels considering rock creep effects and time-dependent anchoring forces in prestressed bolts. Tunn. Undergr. Space Technol. 2023, 134, 104954. [Google Scholar] [CrossRef] [Scilit]
  22. Suo, X.; Gao, F.; Hu, B.; Zhang, X.; Qu, R. Prevention of Large Deformation of Soft Surrounding Rock in Tunnel Construction. J. Meas. Eng. 2023, 11, 239–252. [Google Scholar] [CrossRef] [Scilit]
  23. Wang, G.; Han, W.; Jiang, Y.; Luan, H.; Wang, K. Coupling analysis for rock mass supported with CMC or CFC rockbolts based on viscoelastic method. Rock Mech. Rock Eng. 2019, 52, 4565–4588. [Google Scholar] [CrossRef] [Scilit]
  24. Wang, J.; Zhang, D.; Sun, Z.; Lu, S.; Zhu, J. Viscos-elastic-plastic analysis of the interaction between the rockbolt-cable combined support and rock mass considering tunnel face effect. Tunn. Undergr. Space Technol. 2025, 163, 106679. [Google Scholar] [CrossRef] [Scilit]
  25. Li, K. Simulation analysis of excavation and support of large cross-section soft surrounding rock tunnel based on FLAC3D. In Proceedings of the 2021 3rd International Conference on Artificial Intelligence and Advanced Manufacture, Manchester, UK, 23–25 October 2021; pp. 2006–2010. [Google Scholar]
  26. Wang, J.; Liu, P.; He, M.; Tian, H.; Gong, W. Mechanical behaviour of a deep soft rock large deformation roadway supported by NPR bolts: A case study. Rock Mech. Rock Eng. 2023, 56, 8851–8867. [Google Scholar] [CrossRef] [Scilit]
  27. Tian, M.; Gao, X.; Zhang, A.; Han, L.; Xiao, H. Study on the deformation failure mechanism and coupling support technology of soft rock roadways in strong wind oxidation zones. Eng. Fail. Anal. 2024, 156, 107840. [Google Scholar] [CrossRef] [Scilit]
  28. Sun, J.; Wang, S. Rock mechanics and rock engineering in China: Developments and current state-of-the-art. Int. J. Rock Mech. Min. Sci. 2000, 37, 447–465. [Google Scholar] [CrossRef] [Scilit]
  29. Chang, L.; Ding-li, Z.; Zhen-yu, S.; Su-lei, Z.; Huang-cheng, F.; Ran, L. Interaction mechanism between primary support and rheological surrounding rock considering hardening performance of shotcrete. Eng. Mech. 2022, 40, 63–75, 86. [Google Scholar]
  30. Wang, G.; Fang, W.; Han, W.; Jiang, Y.; Zhang, X.; Xu, F.; Zhang, S. Coupled rheological behavior of tunnel rock masses reinforced by rock bolts based on the non-hydrostatic stress field. Tunn. Undergr. Space Technol. 2023, 137, 105123. [Google Scholar] [CrossRef] [Scilit]
  31. Song, F.; Wang, H.; Shang, C.; Rodriguez-Dono, A.; Wang, E.; Gui, J.; Alejano, L. Considering creep in rock tunnelling with a combined support system: Theoretical solutions and machine-learning solver. Tunn. Undergr. Space Technol. 2024, 153, 106019. [Google Scholar] [CrossRef] [Scilit]
  32. Fahimifar, A.; Karami, M.; Fahimifar, A. Modifications to an elasto-visco-plastic constitutive model for prediction of creep deformation of rock samples. Soils Found. 2015, 55, 1364–1371. [Google Scholar] [CrossRef] [Scilit]
  33. Nomikos, P.; Rahmannejad, R.; Sofianos, A. Supported axisymmetric tunnels within linear viscoelastic Burgers rocks. Rock Mech. Rock Eng. 2011, 44, 553–564. [Google Scholar] [CrossRef] [Scilit]
  34. Bobet, A.; Einstein, H. Tunnel reinforcement with rockbolts. Tunn. Undergr. Space Technol. 2011, 26, 100–123. [Google Scholar] [CrossRef] [Scilit]
  35. Brady, B.H.; Brown, E.T. Rock Mechanics: For Underground Mining; Springer Science & Business Media: Luxembourg, 2006. [Google Scholar]
  36. Sterpi, D.; Gioda, G. Visco-plastic behaviour around advancing tunnels in squeezing rock. Rock Mech. Rock Eng. 2009, 42, 319–339. [Google Scholar] [CrossRef] [Scilit]
  37. Huang, M.; Zhan, J.; Xu, C.; Jiang, S. New creep constitutive model for soft rocks and its application in the prediction of time-dependent deformation in tunnels. Int. J. Geomech. 2020, 20, 04020096. [Google Scholar] [CrossRef] [Scilit]
  38. Jianping, Z.; Yunjiang, S.; Jinhao, W.; Genshui, W.; Meilu, Y. Full-space collaborative control technology and its application for deeply buried roadways. J. Tsinghua Univ. (Sci. Technol.) 2021, 61, 853–862. [Google Scholar]
  39. Jia, J.; Yu, F.; Tan, Y.; Gao, X. Experimental Investigations on Rheological Properties of Mudstone in Kilometer-Deep Mine. Adv. Civ. Eng. 2021, 2021, 6615379. [Google Scholar] [CrossRef] [Scilit]
  40. Yang, F.; Zhang, C.; Zhou, H.; Liu, N.; Zhang, Y.; Azhar, M.U.; Dai, F. The long-term safety of a deeply buried soft rock tunnel lining under inside-to-outside seepage conditions. Tunn. Undergr. Space Technol. 2017, 67, 132–146. [Google Scholar] [CrossRef] [Scilit]
  41. Pan, R.; Cheng, H.; Wang, L.; Huang, H.; Cai, Y.; Xu, S.; Zhang, H.; Zhang, P. Analysis of the bolt-grouting support in deep roadway and combined high-strength bolt-grouting control technology. J. Min. Saf. Eng. 2020, 37, 461–472. [Google Scholar]
  42. Vasiliev, V.V.; Morozov, E.V. Advanced Mechanics of Composite Materials and Structural Elements; Newnes: London, UK, 2013. [Google Scholar]
Figure 1. Mechanical calculation model of roadway surrounding rock.
Applsci 16 07668 g001
Figure 2. Viscoelastic model of the surrounding rock.
Applsci 16 07668 g002
Figure 3. Relationship between V(a,t), u, and bolt spacing/row spacing.
Applsci 16 07668 g003
Figure 4. Relationship between V(a,t), u, and bolt length.
Applsci 16 07668 g004
Figure 5. Relationship between V(a,t), u, and burial depth.
Applsci 16 07668 g005
Figure 6. Layout plan of the North Wing Auxiliary Transport Roadway.
Applsci 16 07668 g006
Figure 7. Roadway support design drawing.
Applsci 16 07668 g007
Figure 8. Numerical model diagram.
Applsci 16 07668 g008
Figure 9. Horizontal displacement cloud map.
Applsci 16 07668 g009
Figure 10. Vertical displacement cloud map.
Applsci 16 07668 g010aApplsci 16 07668 g010b
Figure 11. Roadway deformation amount during the rheological process and its fitting curve. (a). Deformation of the roadway at the lower breakover point during the creep process. (b). Fitting plot.
Applsci 16 07668 g011aApplsci 16 07668 g011b
Figure 12. Deformation characteristics diagram of roadway surrounding rock. (a). Field deformation diagram of the roadway. (b). Schematic diagram of field deformation characteristics of roadway surrounding rock.
Applsci 16 07668 g012
Figure 13. Field test diagram.
Applsci 16 07668 g013
Figure 14. Comprehensive measured curve graph of roadway deformation magnitude and degree.
Applsci 16 07668 g014
Figure 15. Time-dependent fitting plot at the slope starting point.
Applsci 16 07668 g015
Figure 16. Time-dependent fitting plots for different burial depths.
Applsci 16 07668 g016
Table 1. Table of Quantitative Parameters.
Rock Mass ParametersInitial ValueSupport ParametersInitial Value
Roadway burial depth/h600 mBolt diameter20 mm
Roadway radius/a2.6 mElastic modulus of bolt rod/Eb210 GPa
Average unit weight/γ25 kN/m3Bolt length/l2.2
Elastic modulus of in-situ rock/E16000 MPa
Viscosity coefficient of rock mass/η30,000 MPa·d
Poisson’s ratio/v0.27
Table 2. Relationship between roadway deformation amount and deformation rate and bolt spacing/row spacing.
Bolt Spacing (mm)500*500600*600700*700800*800900*9001000*1000
Initial rheological rate (mm/d)1.2411.2451.2481.2501.2511.251
Rheological rate at 730 days (mm/d)0.0520.1480.2800.4230.5590.678
Deformation at 730 days (mm)315.69425.55524.99608.49675.67728.59
Table 3. Table of Quantitative Parameters.
Rock Mass ParametersInitial ValueSupport ParametersInitial Value
Roadway burial depth/h600 mBolt diameter20 mm
Roadway radius/a2.6 mBolt spacing/a10.8 m
Average unit weight/γ25 kN/m3Bolt row spacing/b10.8 m
Elastic modulus of in-situ rock/E16000 MPaElastic modulus of bolt rod/Eb210 GPa
Viscosity coefficient of rock mass/η30,000 MPa·d
Poisson’s ratio/v0.27
Table 4. Relationship between roadway deformation amount and deformation rate and bolt length.
Bolt Length l (m)11.41.82.22.633.2
Initial rheological rate (mm/d)1.2521.2511.2501.2501.2491.2491.249
Rheological rate at 730 days (mm/d)0.6250.5300.4670.4230.3910.3670.357
Deformation at 730 days (mm)700.21658.39629.43608.48592.78580.69575.65
Table 5. Table of Quantitative Parameters.
Rock Mass ParametersInitial ValueSupport ParametersInitial Value
Roadway radius/a2.6 mBolt diameter20 mm
Average unit weight/γ25 kN/m3Elastic modulus of bolt rod/Eb210 GPa
Elastic modulus of in-situ rock/E16000 MPaBolt length/l2.2
Viscosity coefficient of rock mass/η30,000 MPa·dBolt spacing/a10.8 m
Poisson’s ratio/v0.27Bolt row spacing/b10.8 m
Table 6. Relationship between roadway deformation amount and deformation rate and burial depth.
Roadway Burial Depth *h*/m400440480520560600
Initial rheological rate (mm/d)0.8330.9161.0001.0831.1661.25
Rheological rate at 730 days (mm/d)0.2820.3110.3380.3670.3950.423
Deformation at 730 days (mm)405.65446.22486.78527.35567.91608.48
Table 7. Physical and mechanical parameters of the rock layers.
LithologyThickness/mTensile Strength/MPaBulk Modulus/GPaShear Modulus/GPaCohesion/MPaFriction Angle/°
Fine sandstone25.143.3512.08.01.7633°40′
Mudstone3.521.536.03.54.2533°27′
Siltstone4.112.9210.06.03.237°57′
No. 3 coal21.280.742.01.03.2034.48
Carbonaceous mudstone1.760.84.02.02.028.0
Fine-grained sandstone23.183.512.08.02.035.0
Disclaimer/Publisher’s Note: The statements, opinions and data contained in all publications are solely those of the individual author(s) and contributor(s) and not of MDPI and/or the editor(s). MDPI and/or the editor(s) disclaim responsibility for any injury to people or property resulting from any ideas, methods, instructions or products referred to in the content.