Article

RRHR: Embedded Algorithm for Heart Rate and Heart Rate Variability Detection in Wearable Devices, Using Raw ECG Data Between R-R Peaks


by
Ravichandar Ramachandran
* and
Kanchana Rajaram
Department of Computer Science and Engineering, Sri Sivasubramaniya Nadar College of Engineering, Chennai 603110, Tamil Nadu, India
*
Author to whom correspondence should be addressed.
Appl. Sci. 2026, 16(15), 7576; https://doi.org/10.3390/app16157576
Submission received: 8 June 2026 / Revised: 10 July 2026 / Accepted: 24 July 2026 / Published: 30 July 2026
(This article belongs to the Section Biomedical Engineering)

Abstract

Accurate estimation of heart rate (HR) and heart rate variability (HRV) is essential for continuous cardiac monitoring in wearable devices. Most wearable devices use heartbeat sensors that capture Photoplethysmography (PPG) signals to measure HR which can neither identify irregular heartbeats nor arrhythmia-based heart diseases. Cardiac diseases, autonomic nervous system activities, stress levels, and emotional states can be detected using HR calculated from beat to beat or between successive R-R peaks. Few existing studies have calculated HR from RR intervals using timestamps, which vary across systems and are therefore inaccurate. To address this concern, a novel embedded algorithm named “RRHR” is proposed that measures HR and HRV based on raw ECG data between R-R peaks. Compared with an existing method using the MIT-BIH arrhythmia benchmark dataset, the RRHR approach yielded HR values with significantly reduced errors. RRHR was also validated against the existing clinical approach and achieved 100% agreement with the reference heart rate measurements within a tolerance of ± 1 ECG sample.

1. Introduction

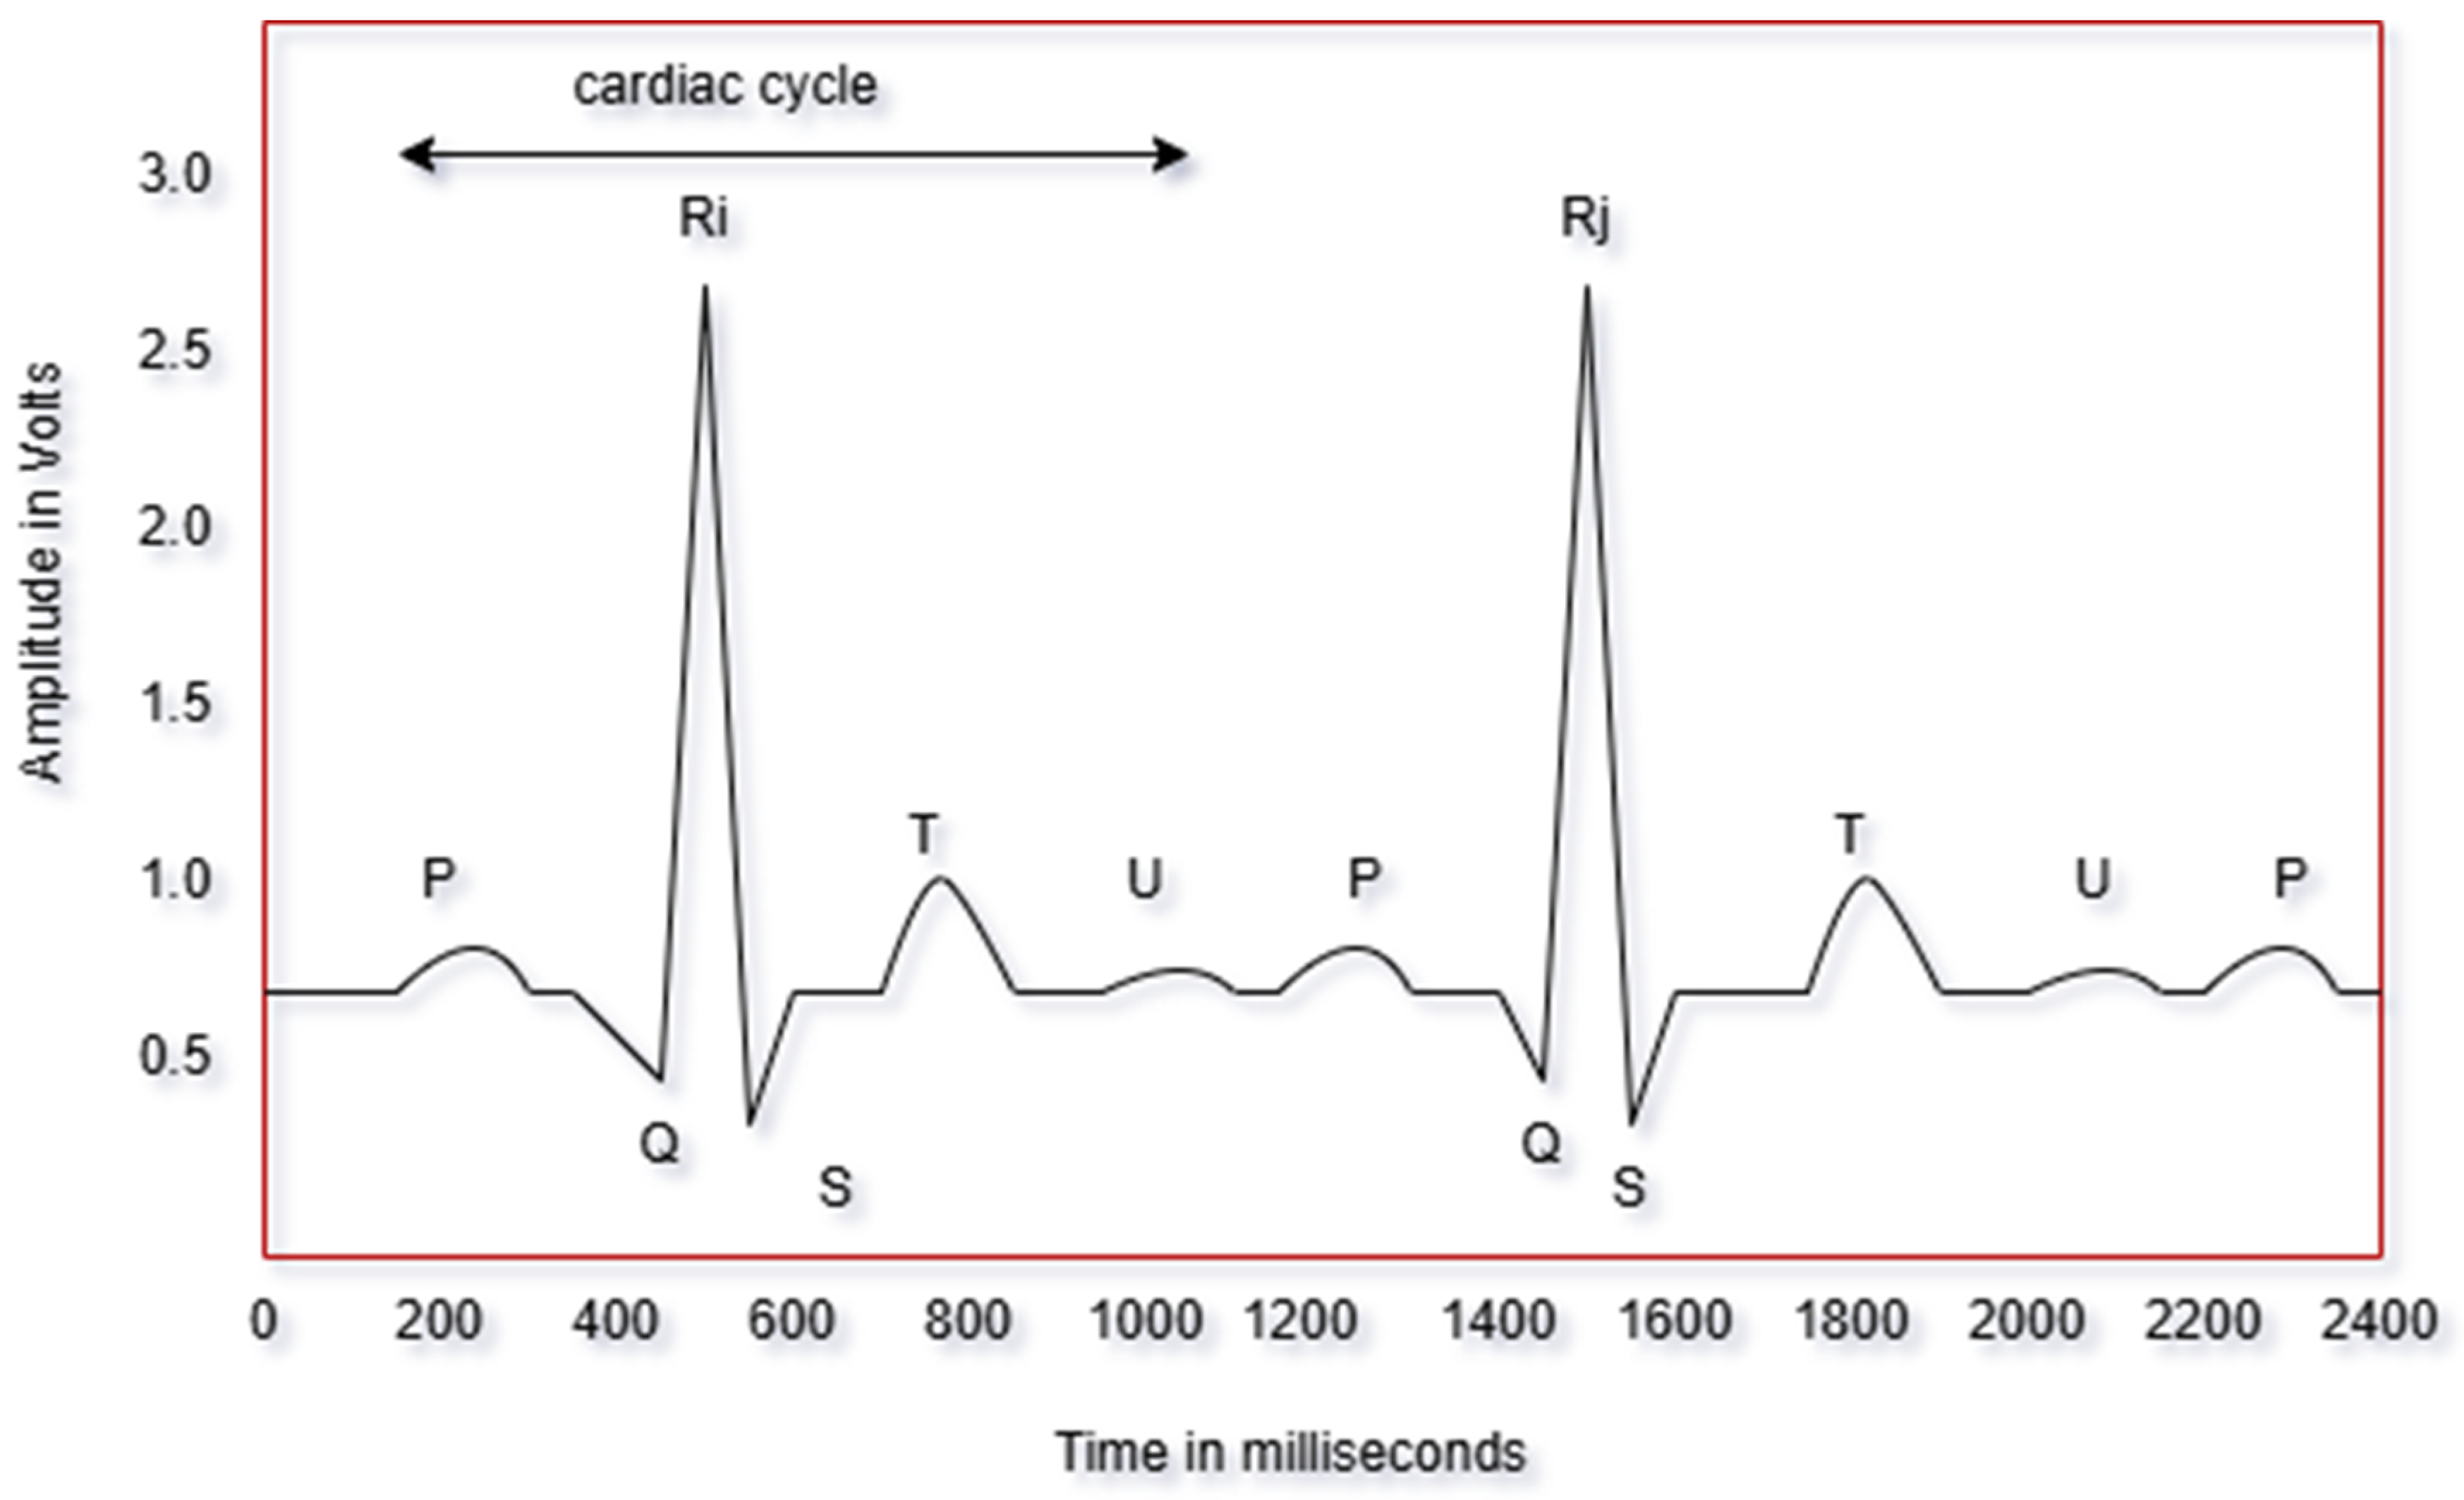
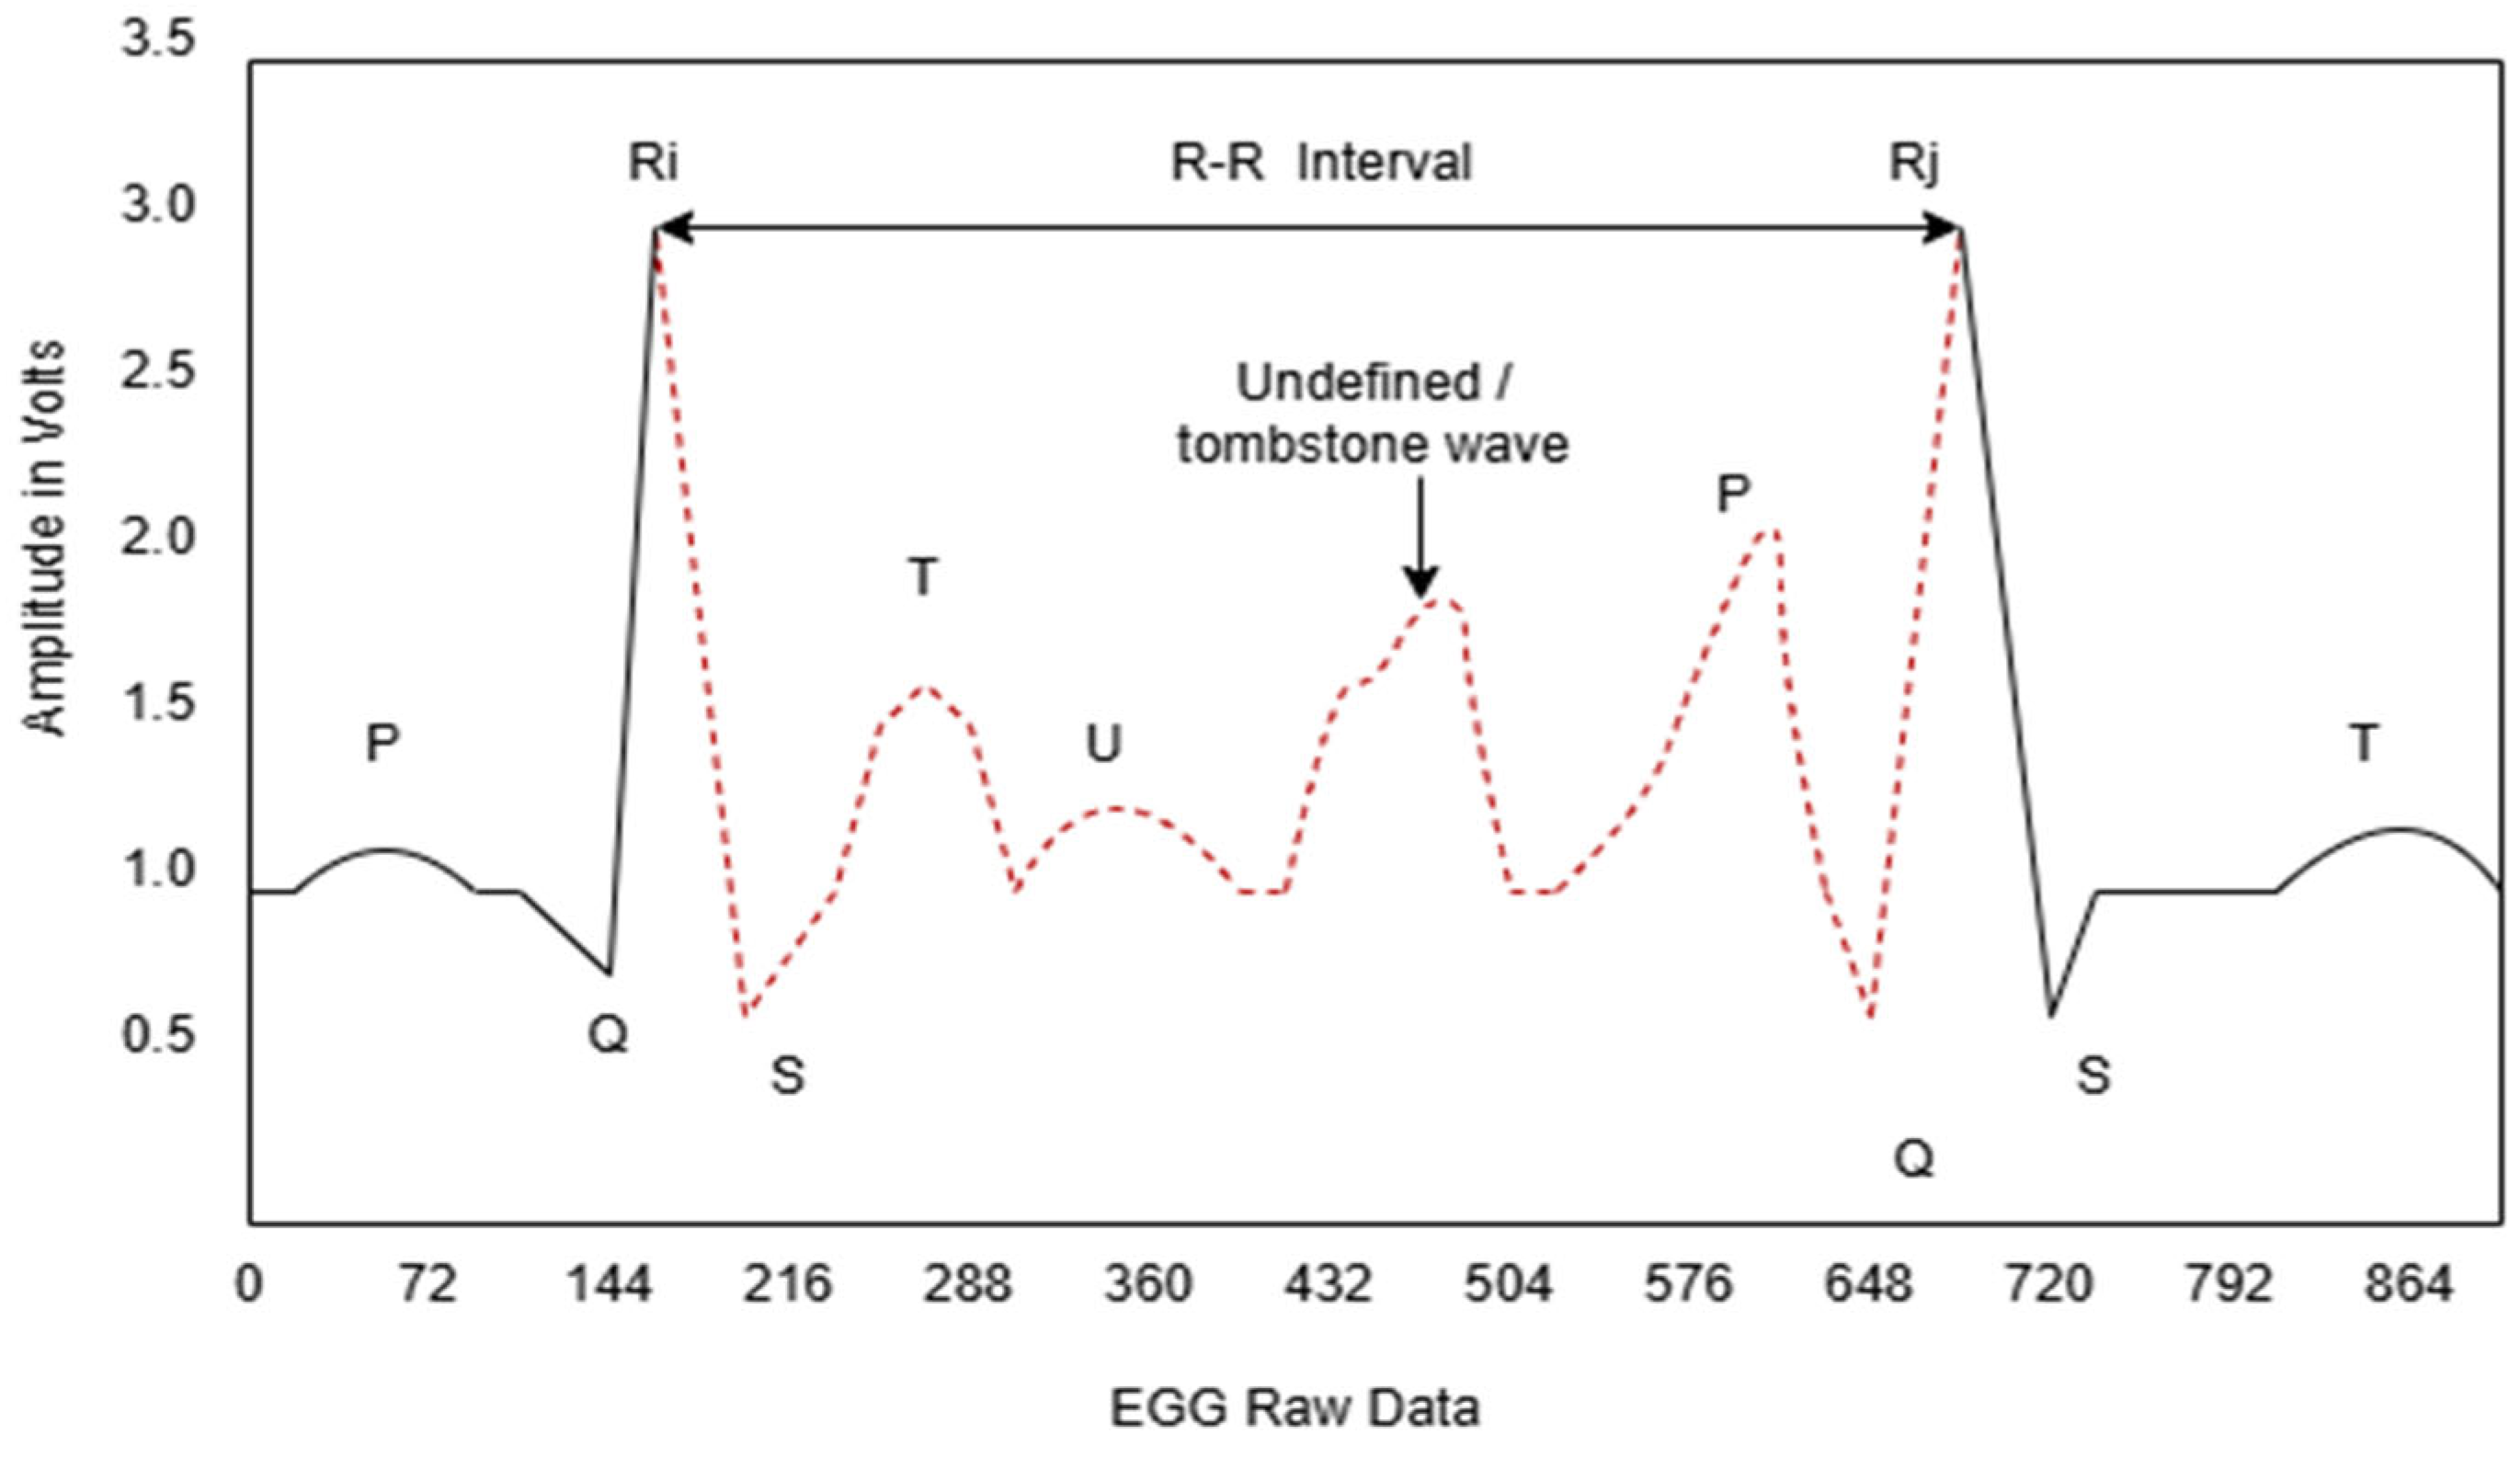
Electrocardiography is an important method for noninvasively measuring the electrical activity of the heart. Electrocardiogram (ECG) devices detect potential changes in heart activity through electrodes attached to fixed positions on the skin surface of the human body using bioelectricity. Conventionally, 12 electrodes are used to acquire diagnostic information about the cardiovascular system and detect any heart disease [1]; however, fewer than 12 leads are also used in portable ECG devices [2]. A typical ECG waveform corresponding to sinus rhythm, shown in Figure 1, represents a cardiac cycle and an R-R interval. The R-R interval exhibits various components, such as the P wave, QRS complex, T wave, and occasionally a U wave. The P wave represents atrial depolarization and appears as a small positive deflection before the QRS complex. The QRS complex, comprising the Q, R, and S points, corresponds to ventricular depolarization, and the R-peak shows the highest amplitude. Following this, the T wave represents ventricular repolarization, appearing broader and smoother compared to the QRS complex. The U wave, if present, indicates late repolarization.
The ECG waveforms are usually different from those shown in Figure 1 because of abnormal rhythms. It is essential to accurately detect R-peaks for the correct diagnosis of heart diseases. The time interval between adjacent R-peaks indicates the heart rate period, which can assist in detecting abnormalities in the heart. Physicians use commercial 12-lead ECG machines and calculate HR by counting the number of small grid boxes presented between R-R peaks on the printed ECG graph sheet. However, these devices are both bulky and expensive. Portable and stand-alone wearable ECG devices are growing in popularity, allowing patients to easily monitor their heart health.
Several studies have been conducted on detecting R-peaks in ECG signals using machine learning or deep learning models. A 1D-CNN model was implemented on the microcontroller STM32F407 to classify arrhythmia diseases based on the QRS pattern [3]. The QRS was detected from a single-lead ECG using a lightweight real-time sliding window-based Max-Min difference [4]. The R-peak detection algorithm developed using evolutionary learning [5] did not test the performance using a benchmark dataset. The deep-match framework for R-peak detection in an ECG acquired through the ear [6] exhibited less than 95% recall. Ten different algorithms for QRS detection were compared in [7]; however, the authors reported that none of them worked for noisy ECG signals. Heart rate variability monitored on an embedded system based on an ARM Microcontroller to analyze heart rate variability in real time using wavelets [8] was used to find the QRS complex by fixing the coefficient automatically. Arrhythmia disease detection from ECG signals was experimentally conducted using machine learning techniques such as SVM, KKN, PNN, and RBFNN, and learning classifiers were optimized using ABC and PSO techniques and validated with the benchmark MIT-BIH database in [9]. However, this study did not calculate HR and was not clinically validated. Portable ECGs provide insufficient ECG information owing to limitations in the number of leads and measurement positions. Hence, V-lead signals were synthesized from limb-lead measurements using R-peak-aligned GANs (Generative Adversarial Networks). Noisy ECG Signal Analysis for Automatic Peak Detection was performed using relative-energy-based wearable R-peak detection [10]. The possibility of finding R-peaks in compressed ECG signals was explored in [11]. ECG features were extracted using the Hilbert transform and Burg method [12] instead of examination with the naked eye; independent component analysis (ICA) and chaos analysis [13], and then ML techniques, have also been applied to find R-peaks. R-peak detection was approached as a segmentation task using the U-Net architecture, which was fed with normalized 3D VCG segments in [14]. Particle Swarm Optimization (PSO) was applied using LSTM, a meta-heuristic approach to a convolution neural network (CNN) and optimized machine learning model, to detect R- and T-peaks [15,16]. This work cannot be used for diagnostic purposes because R-peaks may be missed due to the flattening of R-peaks in the ECG signal. All the above studies detected R-peaks, but none of them measured HR from R-peaks. Because the voltage amplitude of the ECG signal is very low, ranging from 0.5 mV to 5 mV, any small deviation in measuring R-peaks in terms of time would impact the HR measurement and hence the arrhythmia diseases may be subject to incorrect diagnosis. Recently, a few studies have measured HR and heart rate variability (HRV) using machine learning and deep learning models. HRV was measured by extracting respiratory features from a single-lead ECG signal using deep learning models [17].
The R-peak has been detected based on hierarchical clustering and discrete wavelet transform (DWT) [18] and continuous wavelet transform [19]. The Pan–Tompkins algorithm [20] is widely used for HR detection. It detects HR from the R-R interval based on time and by averaging the eight most recent R-R intervals. Pan–Tompkins resulted in 99.3% accuracy when used on ambulatory systems and stand-alone ECG systems. The Modified Pan–Tompkins algorithm [21] was used for QRS detection by normalizing ECG signals in short windows at 1200 ms [22]. The R-peak was detected by applying the Hilbert transform with a real-time ECG signal after the Pan–Tompkins algorithm [23]. The Pan–Tompkins algorithm was validated for QRS detection in healthy individuals and patients with myocarditis in real time [24]. However, timestamp-based methods are not the most suitable for embedded systems. Moreover, they do not consider individual R-R intervals and ignore certain irregularities in the heart rate.
In the literature, several embedded algorithms for QRS and R-peak detection in wearable devices have been proposed for real-time ECG monitoring. Many QRS detection algorithms and ECG denoising algorithms are based on self-convolution windows [25,26,27]. Heart rate variability (HRV) is a widely accepted physiological marker that reflects autonomic nervous system regulation of cardiac activity and has found applications in cardiovascular assessment, stress monitoring, and emotion recognition. Since HRV parameters are derived from consecutive RR intervals, their accuracy depends on precise R-peak detection and reliable heart rate estimation using discrete wavelet transform (DWT) [28]. High-speed microcontrollers with efficient memory processing, such as ARM Cortex, have also been utilized, but this is expensive. An approach that detects QRS using ECG signal strength and trends does not provide accurate results in the case of an aberrated atrial premature beat [29]. An R-peak detection algorithm with adaptive thresholding has also been proposed [30]. Recent systematic reviews have highlighted the rapid growth of consumer wearable ECG devices for continuous monitoring of cardiac activities and long-term healthcare applications. ECGs continue to serve as the primary physiological signal for cardiovascular assessment, while publicly available benchmark databases provide standardized datasets for algorithm development and validation. Although recent research has increasingly adopted machine learning and deep learning techniques for automated ECG analysis, these approaches generally require higher computational resources and memory, limiting their suitability for low-cost embedded platforms [31]. They also do not yield accurate results for noisy wearable ECG devices. The cardiac arrhythmia watchdog (CAW) for wearable ECG devices works by detecting P-QRS-T [32] but consumes more resources and time than the proposed method. There is also R-peak detection using the thresholding method [33]. Recent advances have strongly established heart rate variability as a widely accepted noninvasive indicator of autonomic nervous system activity for both clinical and consumer healthcare applications. ECG-derived HRV remains the gold standard because it provides accurate beat-to-beat R-R interval measurements, whereas wearable PPG-based systems are more susceptible to motion artifacts during daily activities. Consequently, accurate R-peak detection and precise R-R interval measurement are fundamental prerequisites for reliable heart rate and HRV estimation. Furthermore, recent reviews have highlighted the need for standardized validation methodologies and computationally efficient algorithms suitable for wearable and embedded healthcare devices [34], as these observations motivate the development of the proposed RRHR algorithm and its benchmark-based validation on a low-cost embedded platform. A lightweight CNN was developed to detect heart rate anomalies in wearables [35]. Based on HRV, fatigue was detected from an ECG by applying the Sampling-efficient Multi-head Attention (SMA) mechanism [36]. This work evaluates HRV’s diagnostic, prognostic, and therapeutic roles in cardiovascular diseases. HRV can reveal automatic dysfunction of pacemaker earlier, predict outcomes such as sudden cardiac death and recurrent myocardial infarction(MI) using heart rate evaluation with timestamps method which did not have accuracy like the method used counting samples in between R-R as proposed approach RRHR algorithm [37]. Heart rate variability, which is derived from the variation between successive R-R intervals, has become an important physiological indicator for evaluating autonomic nervous system activities and cardiovascular diseases, including arrhythmia, heart failure, and ischemic heart diseases. As wearable healthcare technologies continue to evolve, continuous ECG-based monitoring has gained increasing importance for real-time cardiovascular assessment. Since both HR and HRV analysis depend on accurate R-R interval measurement, reliable R-peak detection remains a fundamental requirement for dependable cardiac monitoring. Nevertheless, recent works have identified challenges related to measurement variability, standardization and validation of the ECG processing algorithms, particularly for resource-constrained embedded systems [38]. The HR estimation in all these studies is based on calculating the time between successive R-R peaks. Implementing time-based algorithms in an embedded wearable system requires standards such as IEEE 754 for floating-point representation, adding a floating-point unit (FPU) and higher memory capacity, which would make it bulky and expensive. Moreover, the use of machine or deep learning models requires a multi-core high-speed processor or application-specific integrated circuit (ASIC) with a large on-chip memory space, making the device more expensive. Even with expensive advanced hardware, wearable devices suffer from inaccurate and inconsistent estimations. This is because the system clock time is considered, and there could be a time variation across different devices. Such inaccurate HR estimation would lead to inaccurate or incorrect diagnosis of arrhythmia.
The quality of a single-lead portable ECG device suffers from baseline drift and more noise due to its changing environment. This may lead to misjudged R-peaks in the ECG. The computing power of a portable wearable device is limited; hence, existing algorithms cannot be directly used. Although several R-peak detection methods have been proposed, none of them are robust and accurate in noise-dominant wearables. In summary, existing studies on HR detection in wearables are based on timestamps, machine learning, or deep learning techniques, which are not accurate, robust, or expensive. To address these concerns, we propose an approach, namely R-R peaks for HR estimation (RRHR), that uses raw data between successive R-peaks to estimate HR through an embedded algorithm in wearable devices.

2. Materials and Methods

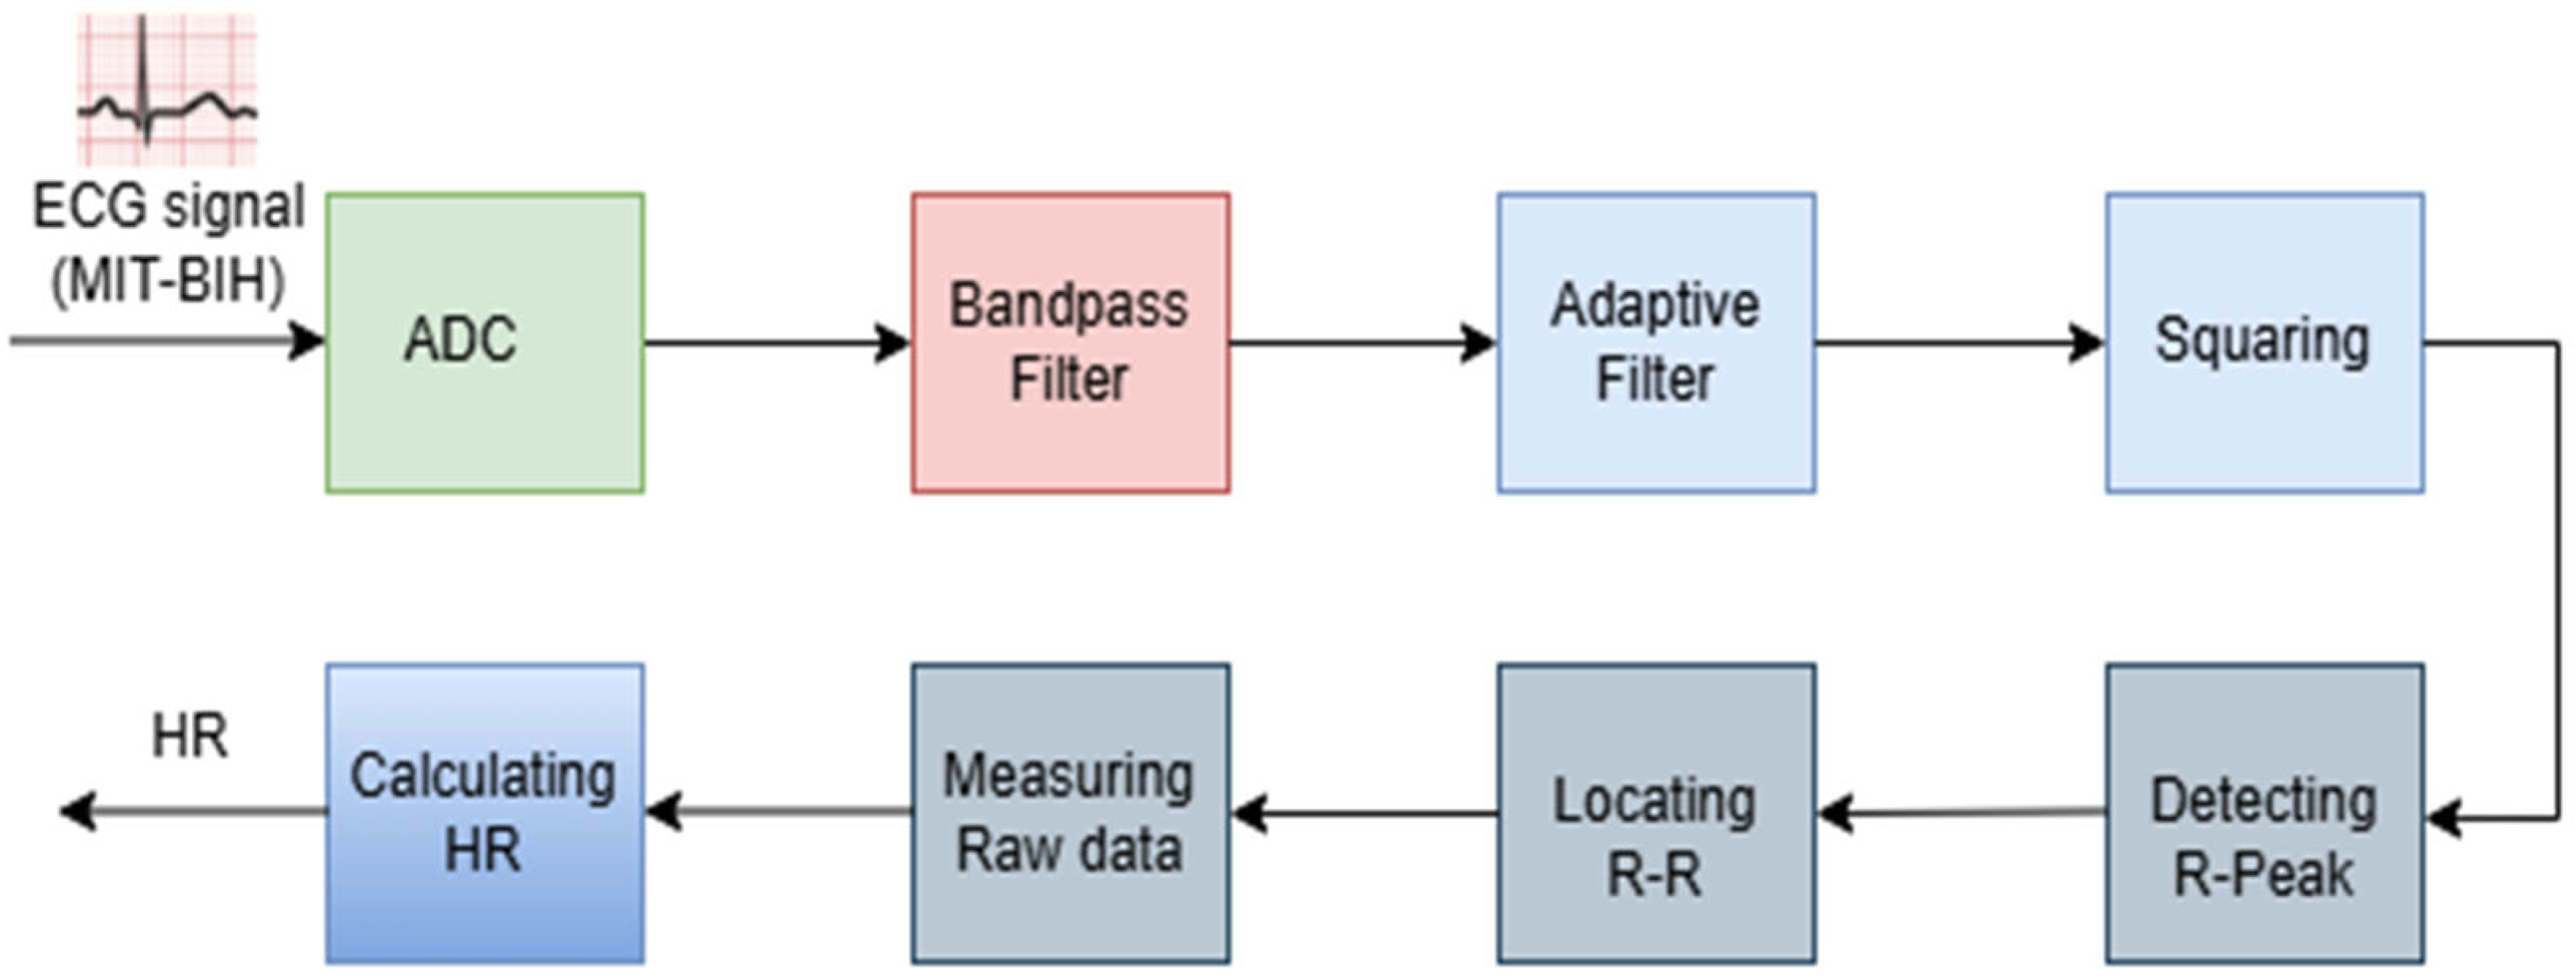
Figure 2 illustrates the flow of the proposed RRHR algorithm implemented for real-time heart rate estimation. The acquired ECG signal, obtained from the database, is first digitized by the analog-to-digital converter (ADC). A digitized signal is then passed through a bandpass filter to suppress baseline wander, power line interference, and high-frequency noise while preserving the frequency components associated with the QRS complex. Following preprocessing, an adaptive filtering stage further enhances the signal by dynamically adjusting to variations in ECG amplitude and residual noise, thereby improving reliability of R-peak detection under different recording conditions. The filtered signal is subsequently squared to amplify the QRS complex and suppress low-amplitude waveform components such as P and T waves, increasing the prominence of the R-peaks. The enhanced signal is analyzed to detect the R-peaks using an adoptive thresholding approach. Once consecutive R-peaks are identified, the corresponding R-R intervals are determined by measuring the sample difference between adjacent R-peaks using the RRHR embedded algorithm. These intervals are stored as raw RRI data and averaged over a predefined sequence to reduce beat-to-beat variability and improve the stability of heart rate estimation. Finally, heart rate is computed using Equation (1).
The proposed approach, RRHR, computes the HR in multiple steps. A benchmark dataset from the MIT-BIH (Massachusetts Institute of Technology Beth Israel Hospital) arrhythmia database was used [39]. The process started with sampling the ECG using an analog-to-digital (ADC) converter at a rate of 360 samples per second. The influence of muscular noise on the resulting digital signal was removed using a bandpass filter comprising a cascade of low-pass and high-pass filters. The signal is then passed through an adaptive filter that modifies the coefficients over time to further enhance the noise reduction process. The signal amplitude was then squared to perform nonlinear amplification, emphasizing the higher frequencies. Figure 2 depicts these stages in the proposed RRHR methodology. The R-peak is identified, and two adjacent R-peaks are located. The raw data are measured between adjacent R-peaks, and the HR is calculated from that.
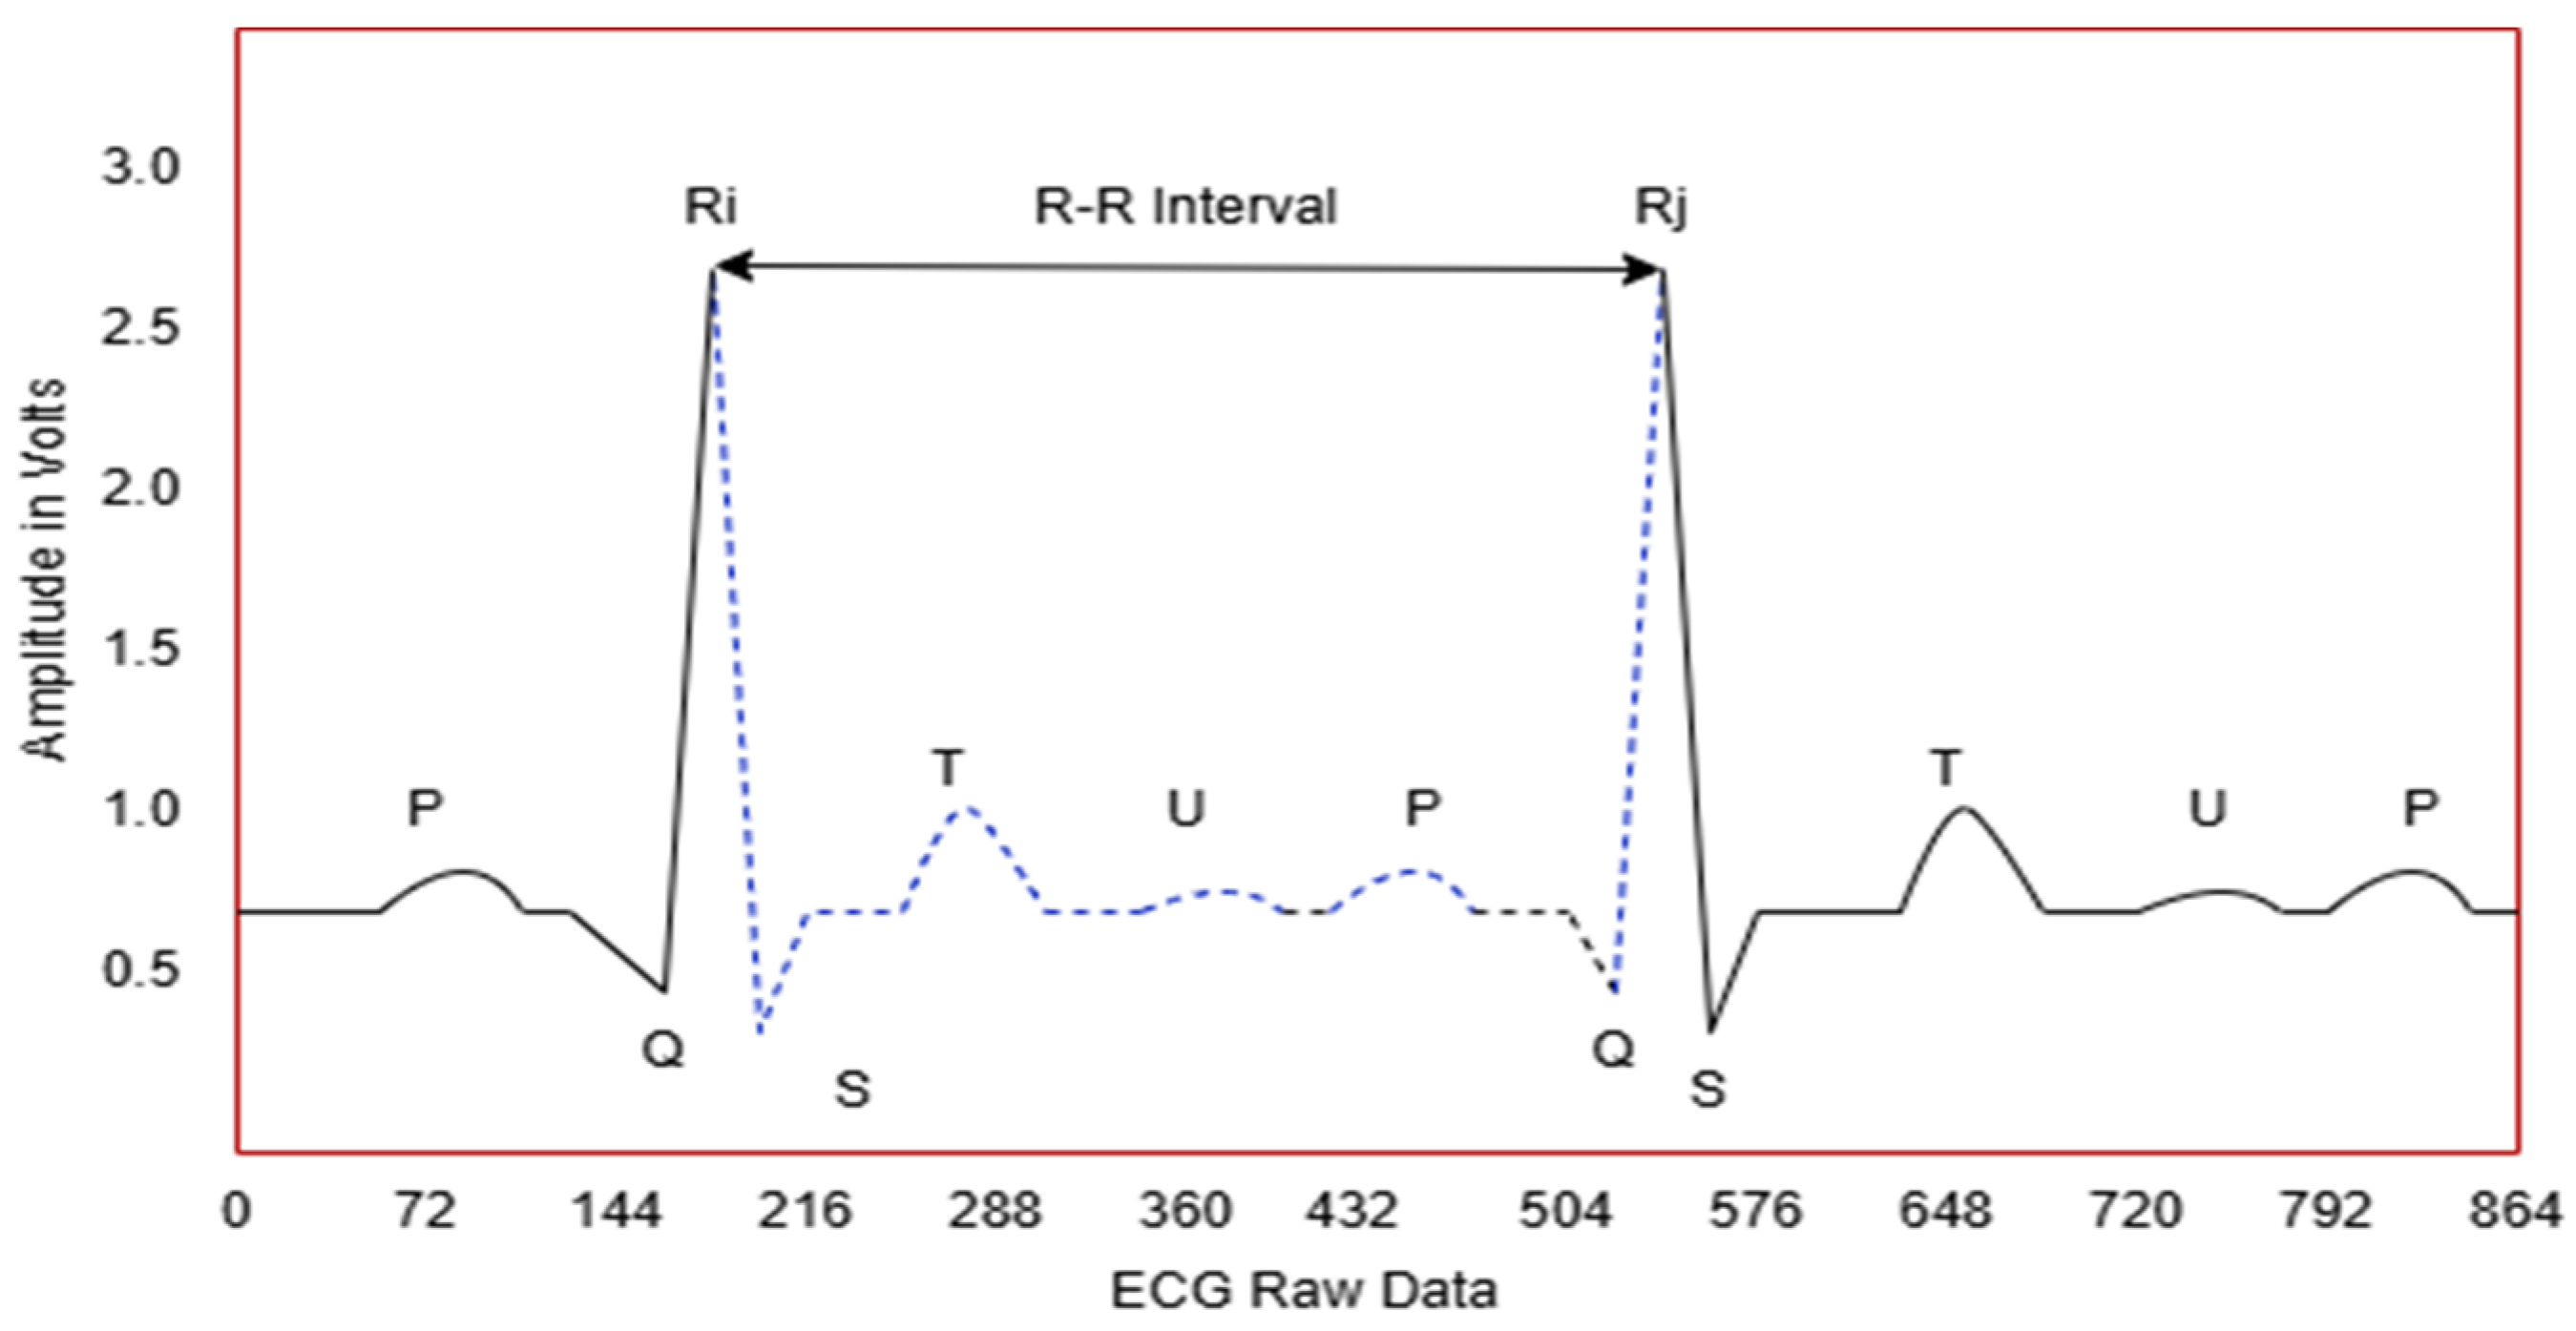
The ECG signals were sampled at a frequency of 360 Hz. The proposed RRHR approach calculates the HR using the count of raw data between two successive R-peaks, as per Formula (1). The ECG graph shown in Figure 3 covers 0–864 data points for a period of 2400 ms at a sampling rate of 360 Hz. The raw data are indicated by dotted lines. The heart rate is calculated by finding the count of raw data between two R-peaks, regardless of the height of the amplitude and width.
H R   B P M = 60 × S F R − R D a t a
If the count of raw data is assumed to be 299 (Ri = 211, Rj = 510 on x-axis), HR is calculated as 60 × 360/299 = 72.24 BPM.
The time-based approach results in inaccurate HR estimates, and averaging heart rates over a fixed period can introduce errors, whereas inter-beat R-R interval-based HR estimation helps identify abnormal patterns and fluctuations. In addition, the RRHR approach of counting raw data in the beat-to-beat R-R interval also helps to accurately detect any undefined wave patterns or tombstones, which indicate noise or abnormal morphological changes, as shown in Figure 4.
To demonstrate the procedure of the proposed method, we performed the following steps.

2.1. ADC (Analog -to -Digital Conversion)

Continuous biological signals (analog signals) representing the electrical activities of the heart are converted into a digital format that is more suitable for processing, storing, and analysis in embedded wearable healthcare devices. ECG signals, which are low in amplitude voltage, ranging from 0.5 mV to 5.0 mV, are amplified, level shifted (converted to positive voltage because microcontrollers do not accept negative voltage), and conditioned using a front-end circuit arrangement. The conditioned signals are then fed as inputs into the ADC. The ADC samples the analog signal at discrete time intervals and quantizes it into digital values based on its resolution. The resolution of the ADC is typically 11-bit (MIT-BIH) at a sampling rate of 360, in accordance with the Nyquist criteria. The output from the ADC ranged from 0 to 2048 in decimal. The ADC has a reference voltage of 5 V and stores the output value in an n-bit register. ADC Resolution is calculated using Formula (2) as 5/211 = 0.0024 V = 2.4 mV.
ADC Resolution or Step size = Reference Voltage/Total number of levels.

2.2. Bandpass Filter

Generally, ECG signals are very low in amplitude, dominated by noise, and corrupted by various interferences, such as baseline wander caused by respiratory and electrode movements, high-frequency noise from muscle activity (EMG), and external electrical interference disturbances. The raw ECG signal comprises the actual heart signal and noise, as per Equation (3).
ECGraw= ECGtrue + Noise
where ECGraw is the measured signal, ECGtrue is the actual cardiac signal, and Noise is the interference.
A bandpass filter (BPF) is used to extract the frequency range that contains meaningful cardiac activity information while suppressing unwanted noise and artifacts. The bandpass filter allows a specific range of frequencies to pass through while attenuating frequencies outside this range. In most ECG applications, a passband range of 0.5 Hz and 40 Hz is commonly selected, which effectively preserves essential waveform features such as the P wave, QRS complex, and T wave. The use of a bandpass filter significantly enhanced the signal-to-noise ratio (SNR) and improved the accuracy of R-peak detection and heart rate estimation. By removing low-frequency drift and high-frequency noise, the filter stabilizes the ECG baseline and reduces the chances of false detection.

2.3. Adaptive Filter

ECG signals are often affected by disturbances such as power line interference motion artifacts, electrode contact noise, and muscle (EMG) activities, which may alter the amplitude and frequency over time. When the ECG signal and noise are stationary and their characteristics are known, a bandpass filter might be adequate. However, in a portable wearable device, an adaptive filter addresses these challenges by adjusting its parameters based on the incoming signal and noise characteristics. An adaptive filter continuously updates its filter coefficients, such as the least mean square (LMS), thereby eliminating the error between the actual signal and noise. A reference sinusoidal noise at 50 Hz was added to eliminate the power line noise. In addition, the adaptive filter eliminates baseline drift and power line interference.

2.4. Squaring

The squaring of the ECG signal amplitude is a nonlinear processing step for R-peak detection. In this step, each sample of the ECG signal was multiplied by itself, effectively converting all values to positive and emphasizing larger amplitudes. This operation enhances the prominence of the QRS complex, which typically has the highest amplitude and steepest slope in the ECG waveform, while suppressing smaller components, such as the P and T waves, as well as residual noise. Consequently, the signal-to-noise ratio (SNR) improved, making it easier to accurately identify the location of the R-peaks.
The squaring operation also accentuates the rapid changes in the signal, thereby highlighting the high-frequency components associated with the QRS complex. This is particularly useful after differentiation, where the slope information is captured, and squaring amplifies these features. Additionally, by making all signal values positive, the process simplifies subsequent steps, such as moving window integration, which relies on consistent signal polarity. Squaring is computationally simple and well-suited for real-time implementation in embedded systems, such as STM32 or ESP32 microcontrollers. Overall, this step plays a crucial role in enhancing key ECG features and improving the robustness and accuracy of the automated heart rate detection algorithms.

2.5. Identifying R-Peak, R-R Interval and ECG Raw Data

In most ECG devices, the monitoring heart rate ranges from 30 to 240 Beats Per Minute (BPM) [39]. That is, there was at least one cardiac cycle within a two-second interval. It is necessary to find a minimum of two R-peaks to compute the HR with 2 s sampling data, which requires more than 720 samples. Our study considers 3 s data with 1080 samples, because the output from the ADC ranges from 0 to 2048 in decimal. A threshold of +/−1 data was applied to detect the R-peak so that none of the R-peaks were missing. A minimum of two R-peaks were detected in the 3 s sample data and stored in a register. Starting from the 0th sample data, all the data in the 1080 samples were checked to identify the highest R-peak value (RPhigh). Again, starting from the 0th sample data, the first R-peak (RP1) within a threshold value +/−1 of RPhigh is found. To identify the second peak, checking starts from the 0th sample, and after locating the first peak RP1, the data are counted until another peak RP2 is found. The data count between RP1 and RP2 is the number of samples between the two R-peaks. This process is illustrated in Algorithm 1.
Algorithm 1: Identifying R-peak, RR interval and ECG raw data
Input: ECG samples after noise removal
Output: R-Peak, R-R interval, data between R-R intervals
// Initialize:
01     C ← 1080//Number of samples
02      DPTR ← 0000H//16-bit register for Data Pointer—ranges from 0 to 65,536—initialized with starting memory address of ECG data
03      P ← 0//Highest peak Y-axis value
04      N ← 0//Number of R-Peaks
05      R ← 0//Number of ECG raw data in R-R interval
06      Threshold ← 1 // Threshold to avoid missing R-Peaks
// Finding Highest R-peak Value
07      WHILE (C > 0) DO
          Current Data ← Fetch ECG sample pointed by DPTR
          IF (Current Data >= P) THEN
            P ← Current Data//Store highest R-peak
          ENDIF
          C ← C – 1
          DPTR ← DPTR + 1
       END WHILE
// Find R-R interval
08   DPTR ← 0000H
09   C ← 1080
10   WHILE (C > 0) AND (N < = 2)
     Current Data ← Fetch ECG sample pointed by DPTR
     IF P is in the range [Current Data − Threshold, Current Data + Threshold] THEN
       N ← N + 1
     ENDIF
     R ← R + 1
     C ← C − 1
     DPTR ← DPTR + 1
     END WHILE
// Calculate HR = (Sampling Frequency × 60)/R-R interval; Sampling rate = 360
11   HR ← (360 × 60)/R
12   END
The above algorithm computes the HR from a single pair of R-peaks. However, it is required to calculate HR using the average of a minimum of R-R intervals in the case of arrhythmic rhythms. Hence, the heart rate based on the average is computed using Equation (4).
H R = 60 × S F × N R 0 − R 1 + R 1 − R 2 + … R n − 1 − R n ) B P M
where N = the number of R-R intervals; SF = sampling frequency; and Ri − Rj = interval samples, Ri = 0, 2, 4, 6 …n − 1, Rj = 1, 3, 5, 7 …n.

3. Results

To demonstrate the effectiveness of the proposed work, we conducted three experiments and compared the results with the ground truth value of the MIT-BIH dataset, traditional method results, and the ECG raw data with the corresponding heart rate.

3.1. Experimental Overview

The benchmark MIT-BIH arrhythmia dataset contains annotated ECG recordings of approximately 30 min per patient. Owing to computational constraints and long processing times, smaller subsets of records were evaluated instead of the full dataset. In the first experiment, the proposed RRHR was compared with the existing TEDA [40]. The second experiment examined the heart rate calculation using different sampling frequencies. The third experiment performed a statistical analysis of the heart rates.

3.2. Hardware Platform for Implementation

This work implemented the TEDA using MATLAB with a PC configuration of an Intel Core i7 processor, as well as 4GB RAM with 1 GB used for the MATLAB and MITBIH dataset. The operating system was Windows 11, and MATLAB R2020a was used. To program NXP 89V51RD2, a standard PC running Windows 10 (64-bit) with a 1.5 GHz processor and 2 GB RAM was used.

3.3. Experiment 1

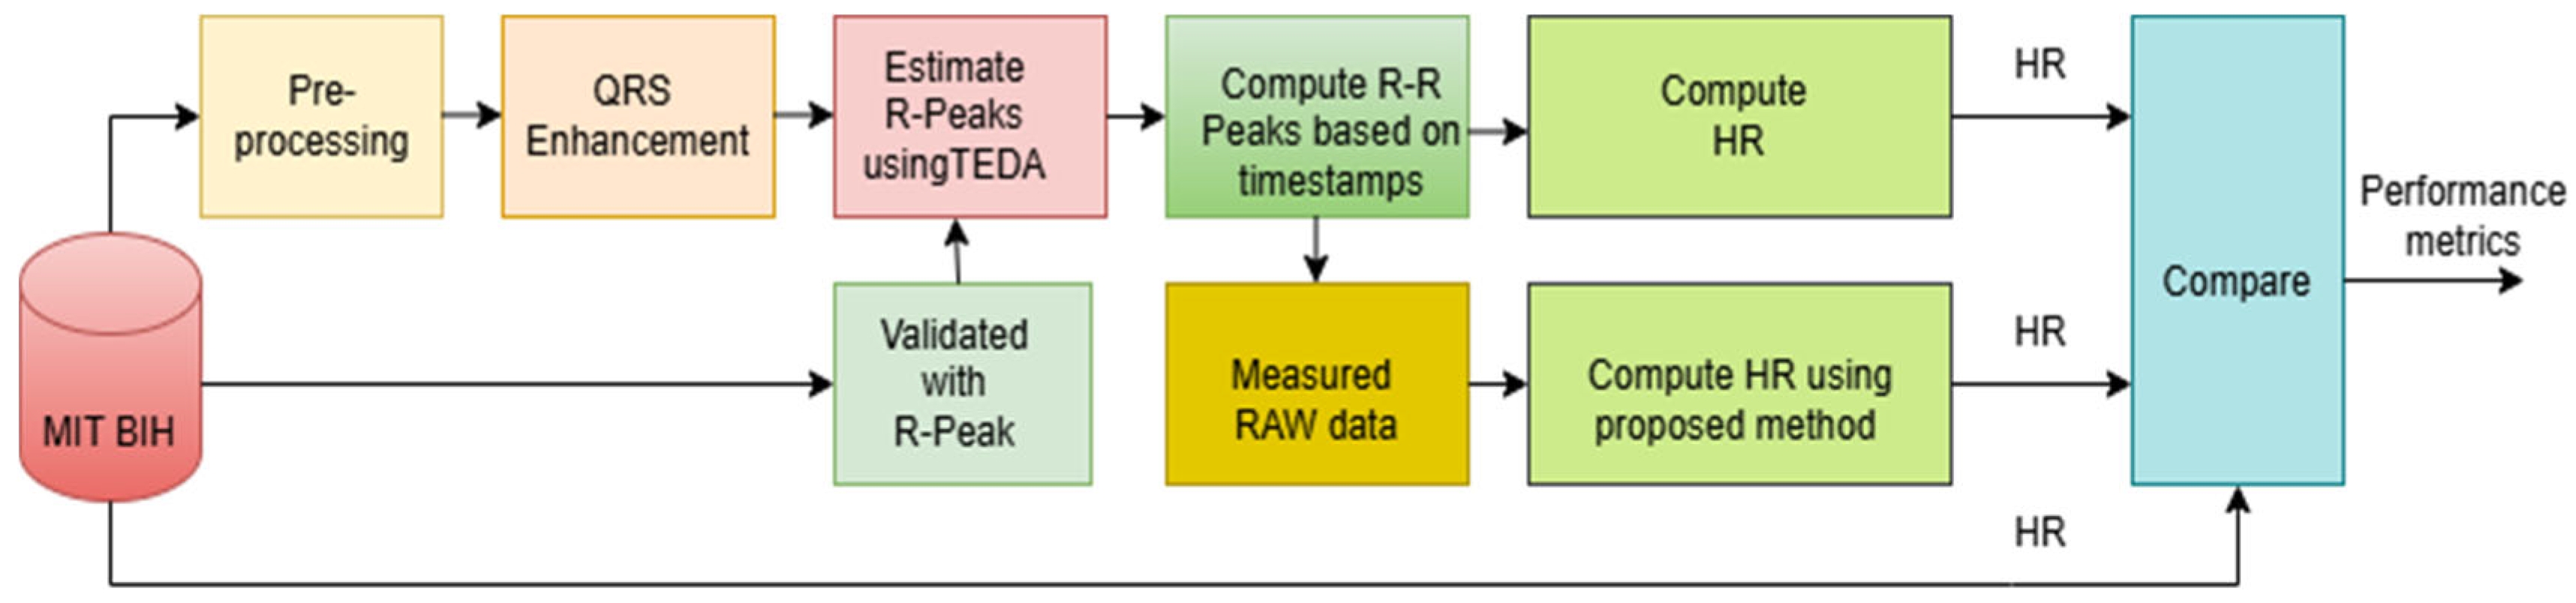
The proposed RRHR approach comprises an embedded algorithm that can be used in a wearable device for HR estimation. It can be tested using an ECG simulator and with patients in real time; however, the results cannot be validated because of missing ground truth values. A benchmark dataset, such as MIT-BIH, is required to validate the proposed approach. However, this dataset cannot be directly used to test embedded algorithms. Therefore, an existing approach, the Typical Eccentricity Detection Anomaly (TEDA) [40], was implemented and tested using MIT-BIH to estimate R-peaks. The pipeline of the experimental process is illustrated in Figure 5.
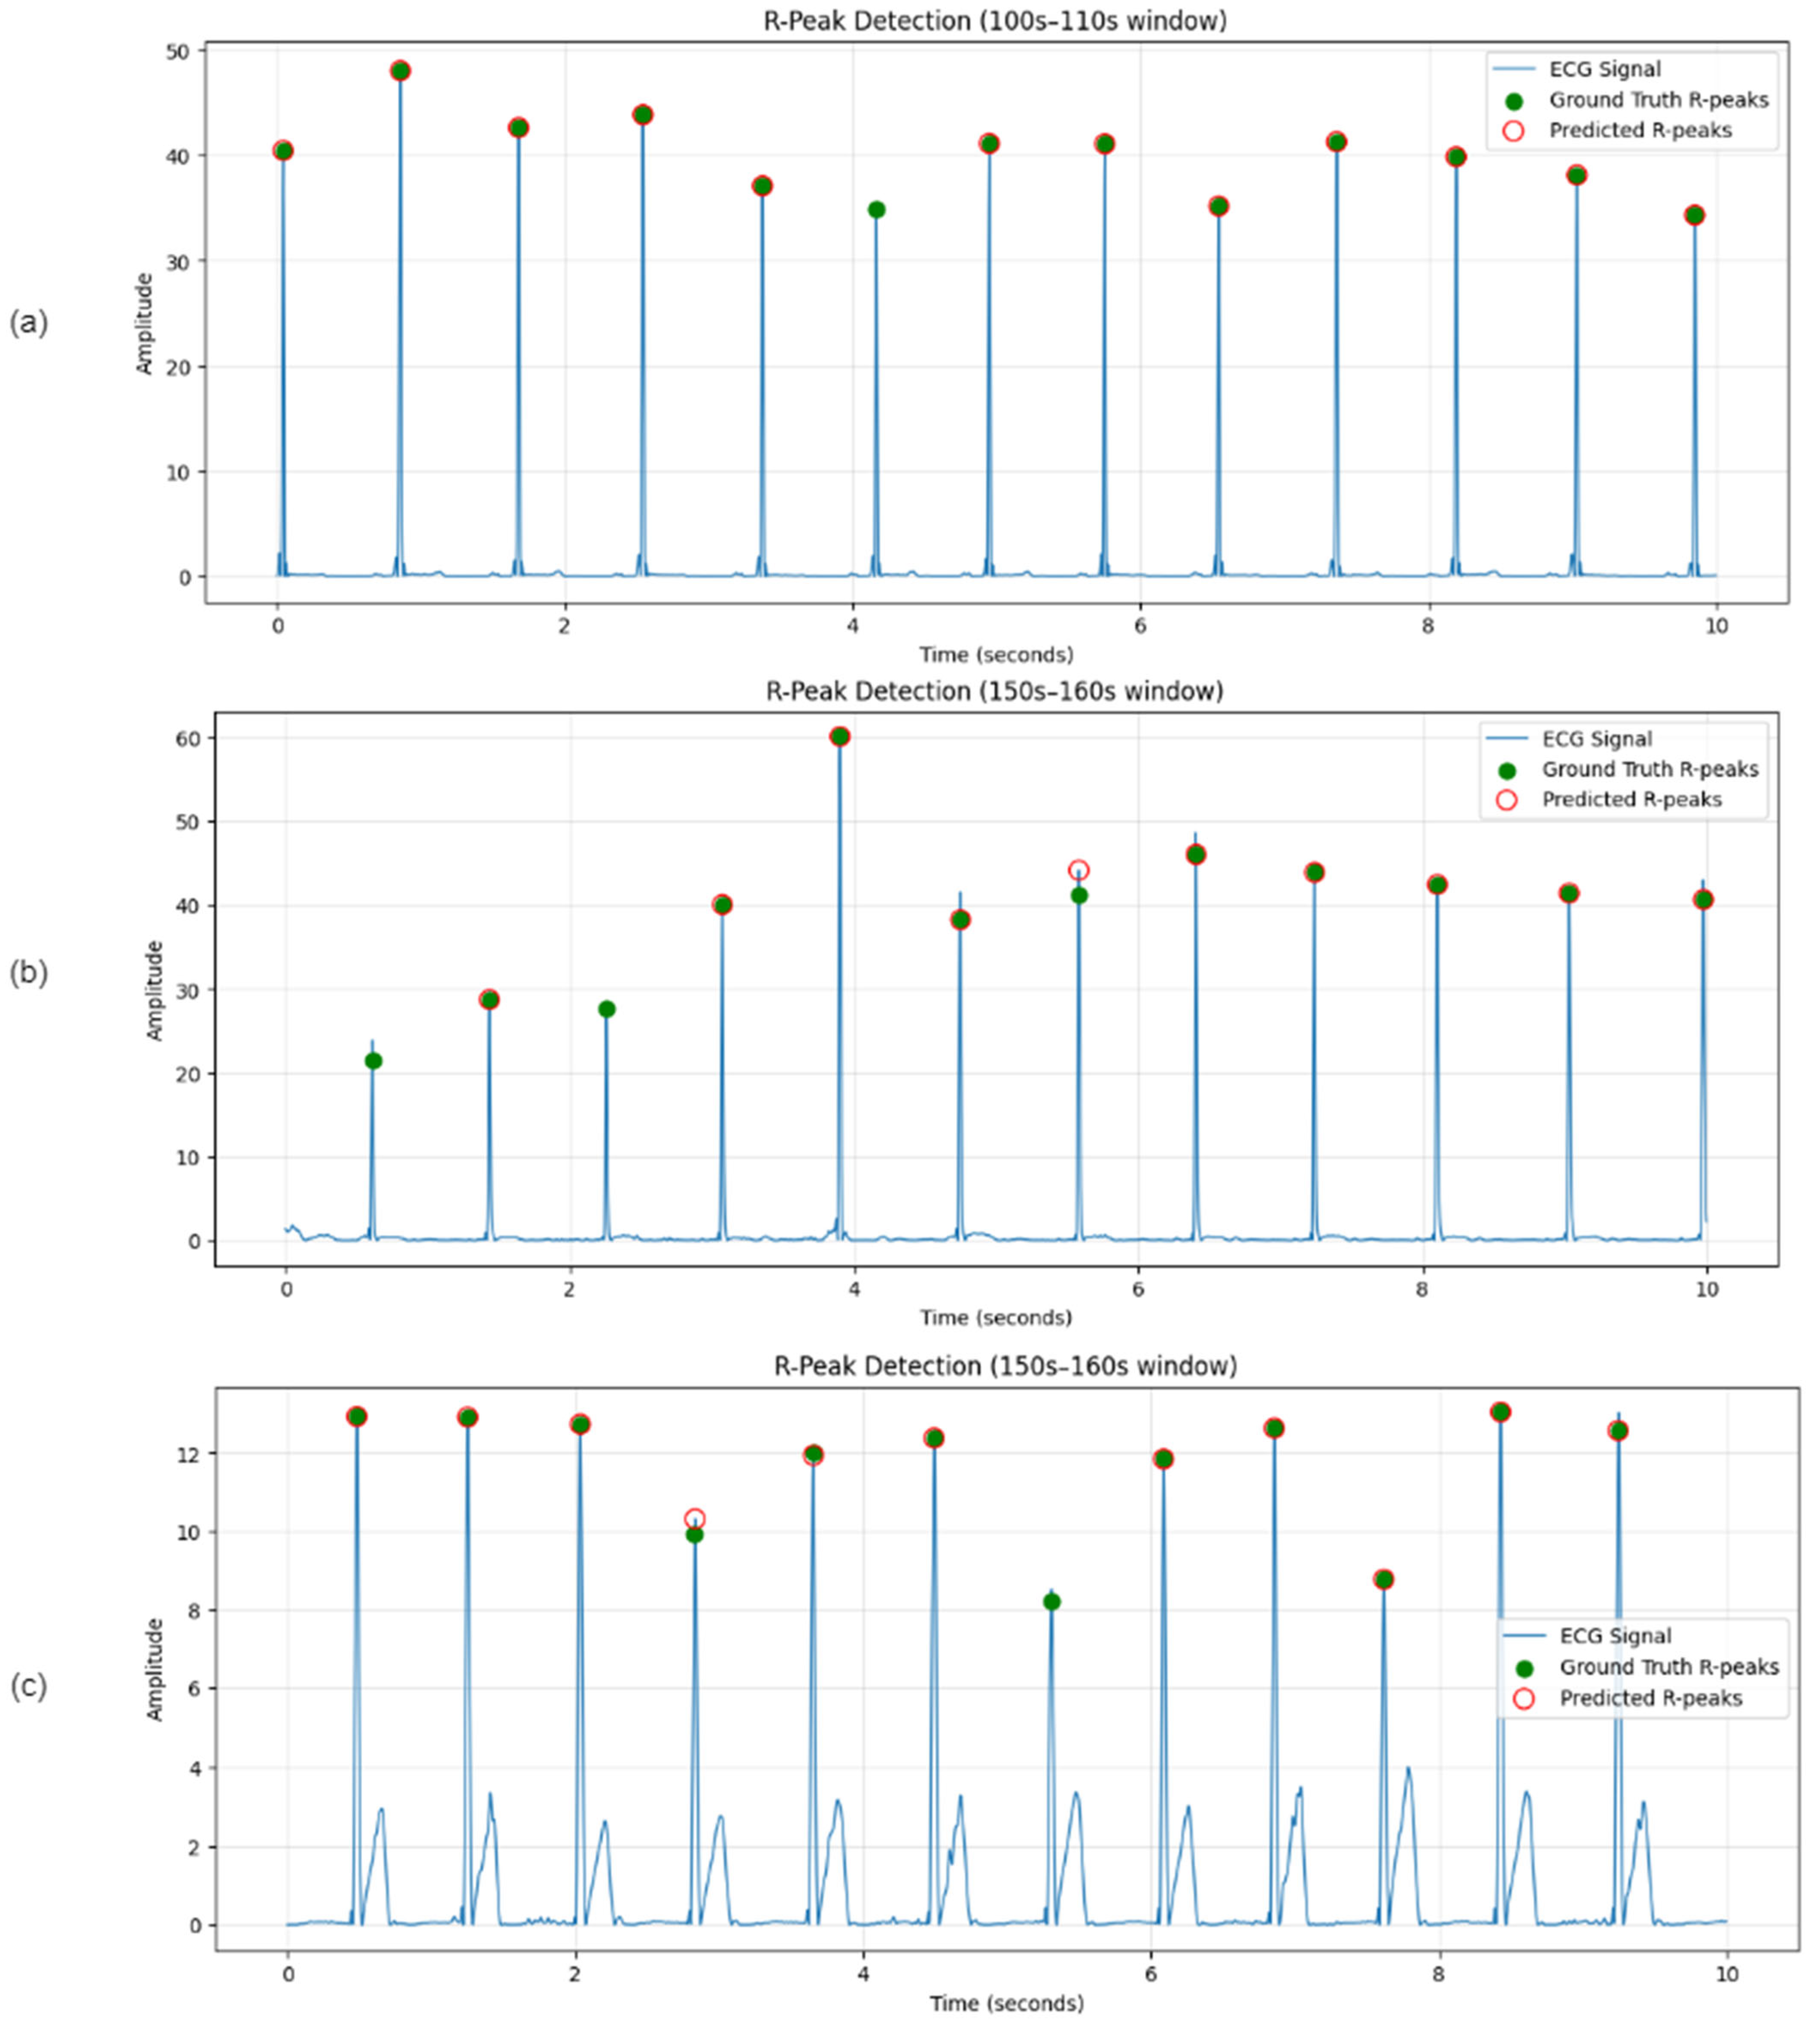
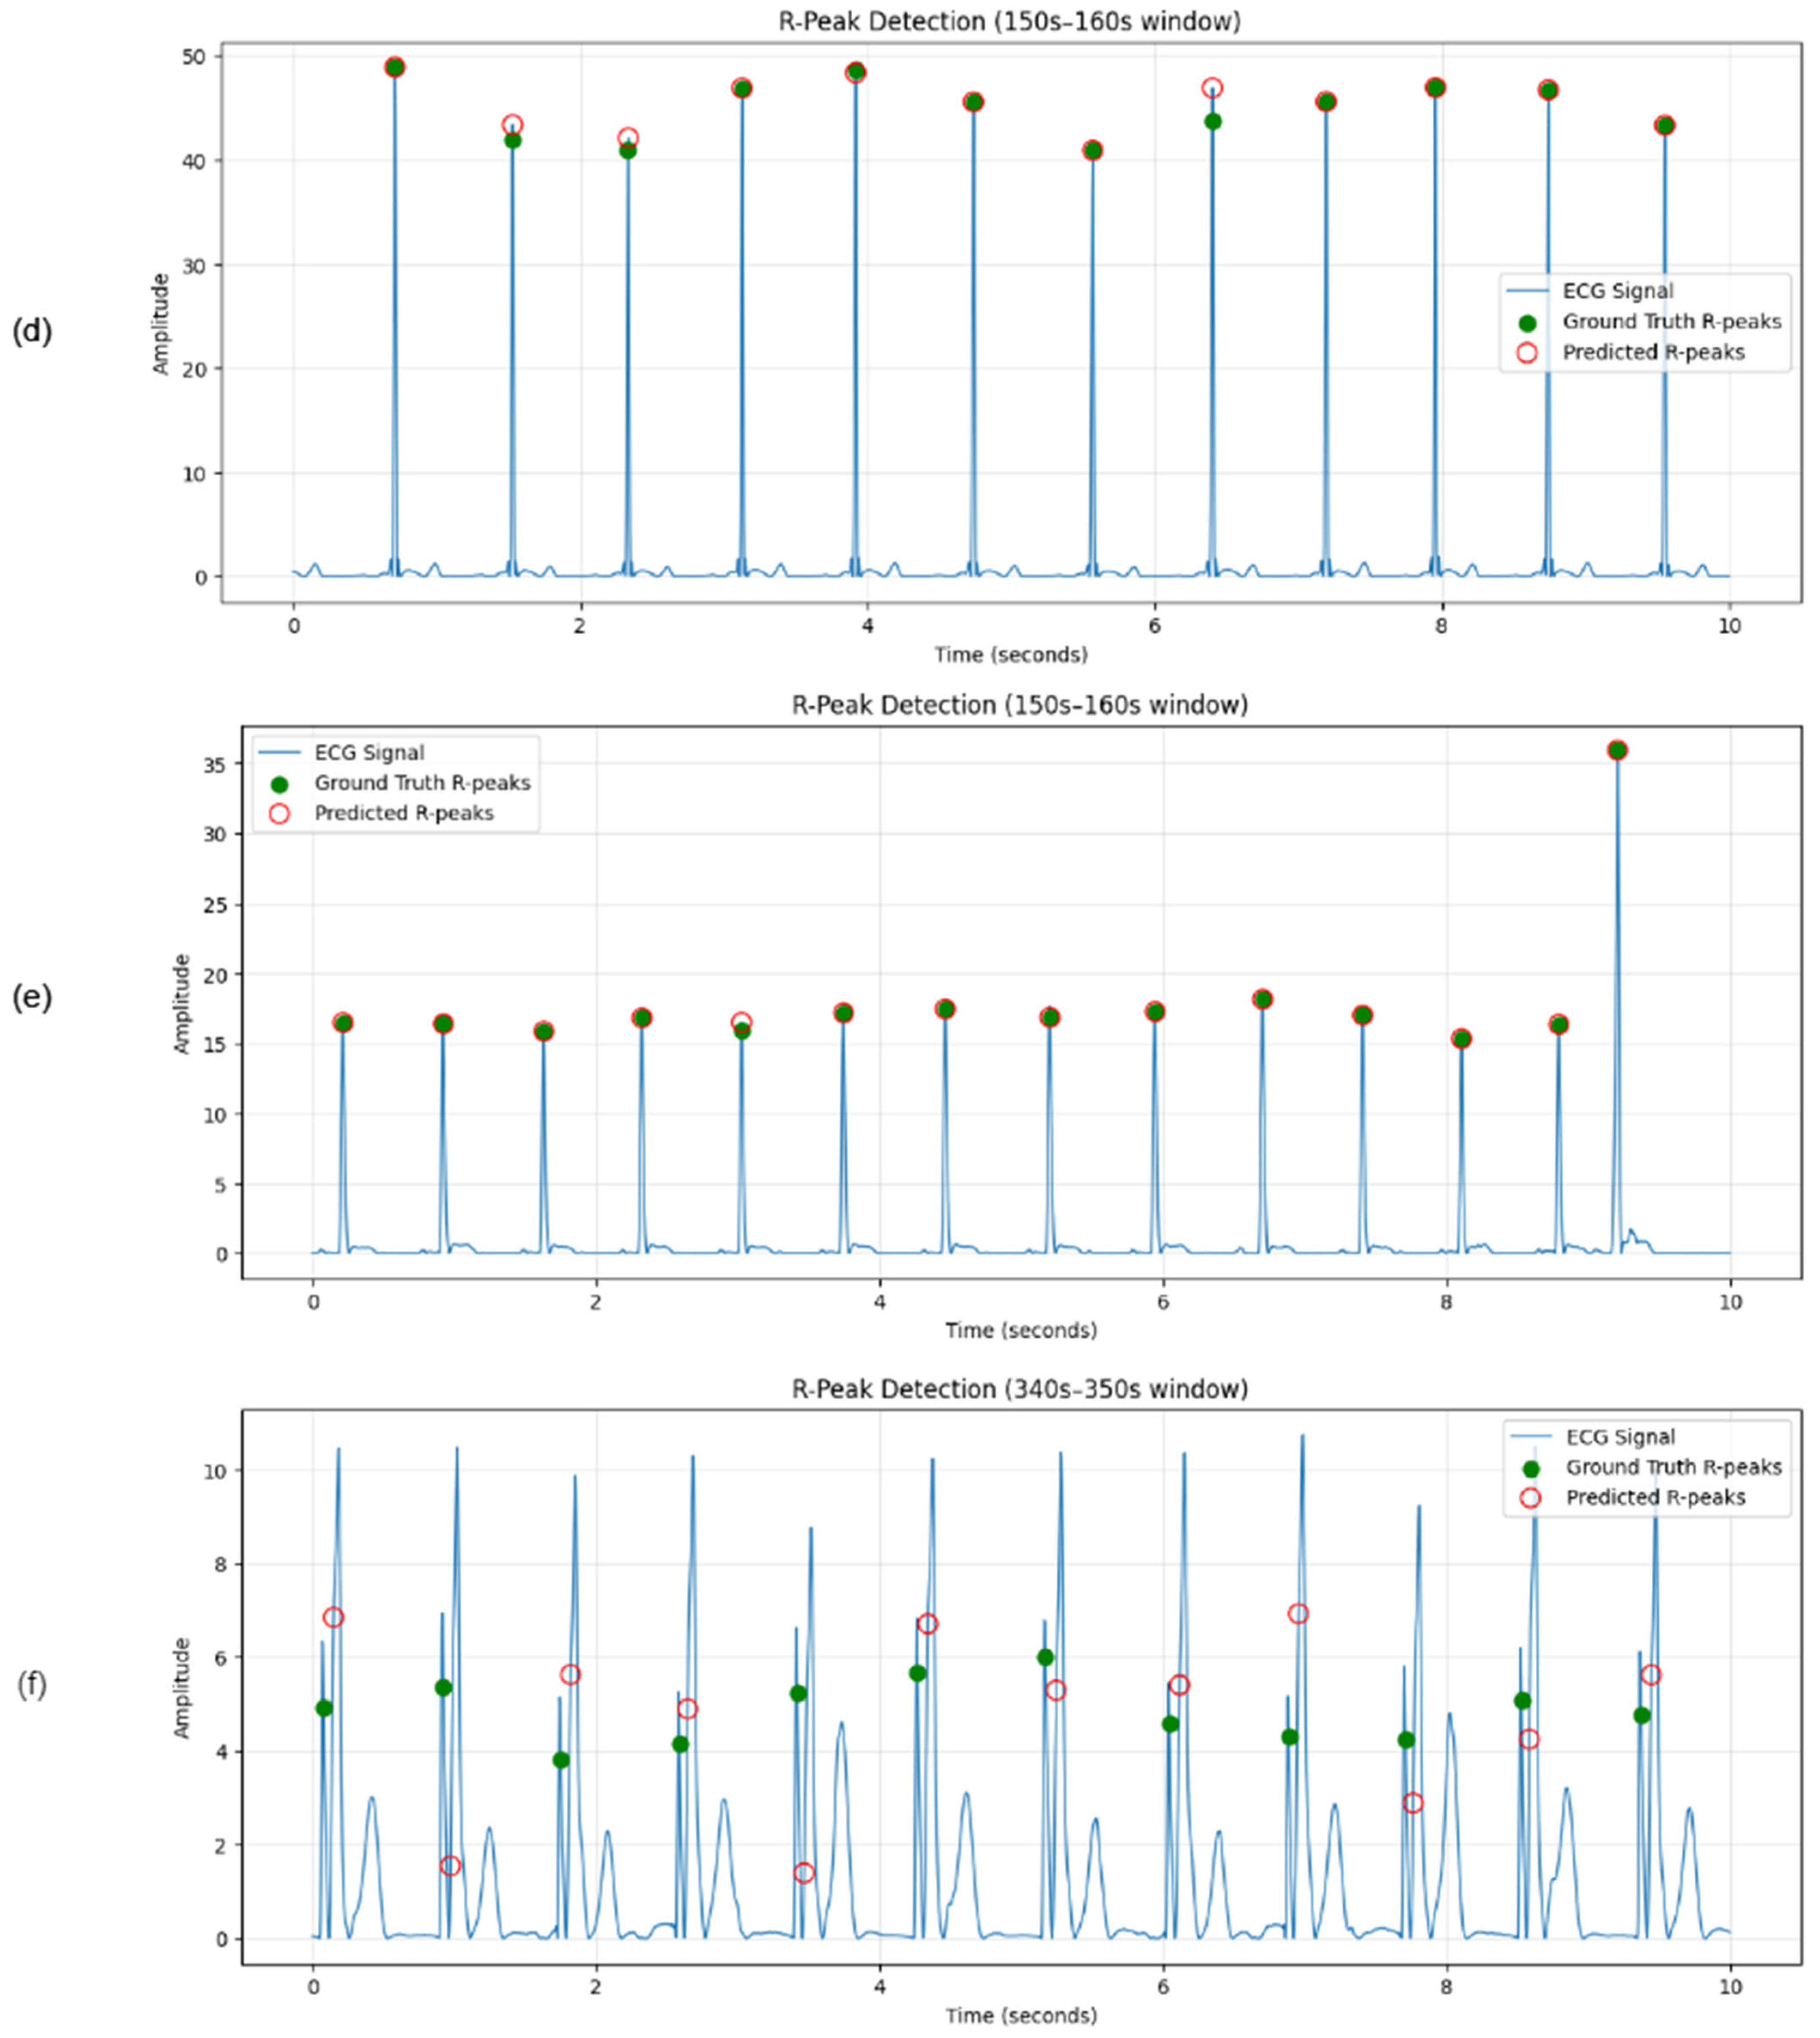
The experiment began by preprocessing the ECG signals to remove noise and baseline drift. This step improves the visibility of the heartbeats and avoids false detections. Next, the ECG waveforms were enhanced to highlight the QRS complexes where the R-peaks occurred. QRS enhancement was performed using bandpass filtering, followed by slope/energy-based amplification. This makes the peak detection step more stable and reliable than the previous method. The TEDA-based detection approach was then applied to identify the potential R-peaks across the signal. The R-peaks are shown in Figure 6 for six sample records during random time intervals. The detected R-peaks were then matched with ground truth annotations from the dataset using a tolerance window. Peaks within tolerance were counted as True Positives (TPs), unmatched detections were counted as False Positives (FPs), and unmatched annotations were counted as Missed Beats. Performance metrics, such as sensitivity in Equation (5), precision in Equation (6), F1 score in Equation (7), and accuracy in Equation (8), were measured for the R-peak detection process and are tabulated in Table 1. This evaluation was performed across full ECG recordings rather than isolated segments, which reflects real-world performance.
S e n s i t i v i t y = T P T P + F N × 100
P r e c i s i o n = T P T P + F P
F 1   S c o r e = 2 × T P 2 × T P + F P + F N
A c c u r a c y = T P + T N T P + F P + T N + F N
The R-R intervals, which are the time between R-R peaks, were estimated using a traditional approach based on time. Then, from the R-R intervals, HR is predicted using the following formula:
H R = 1500 R − R ( m m )
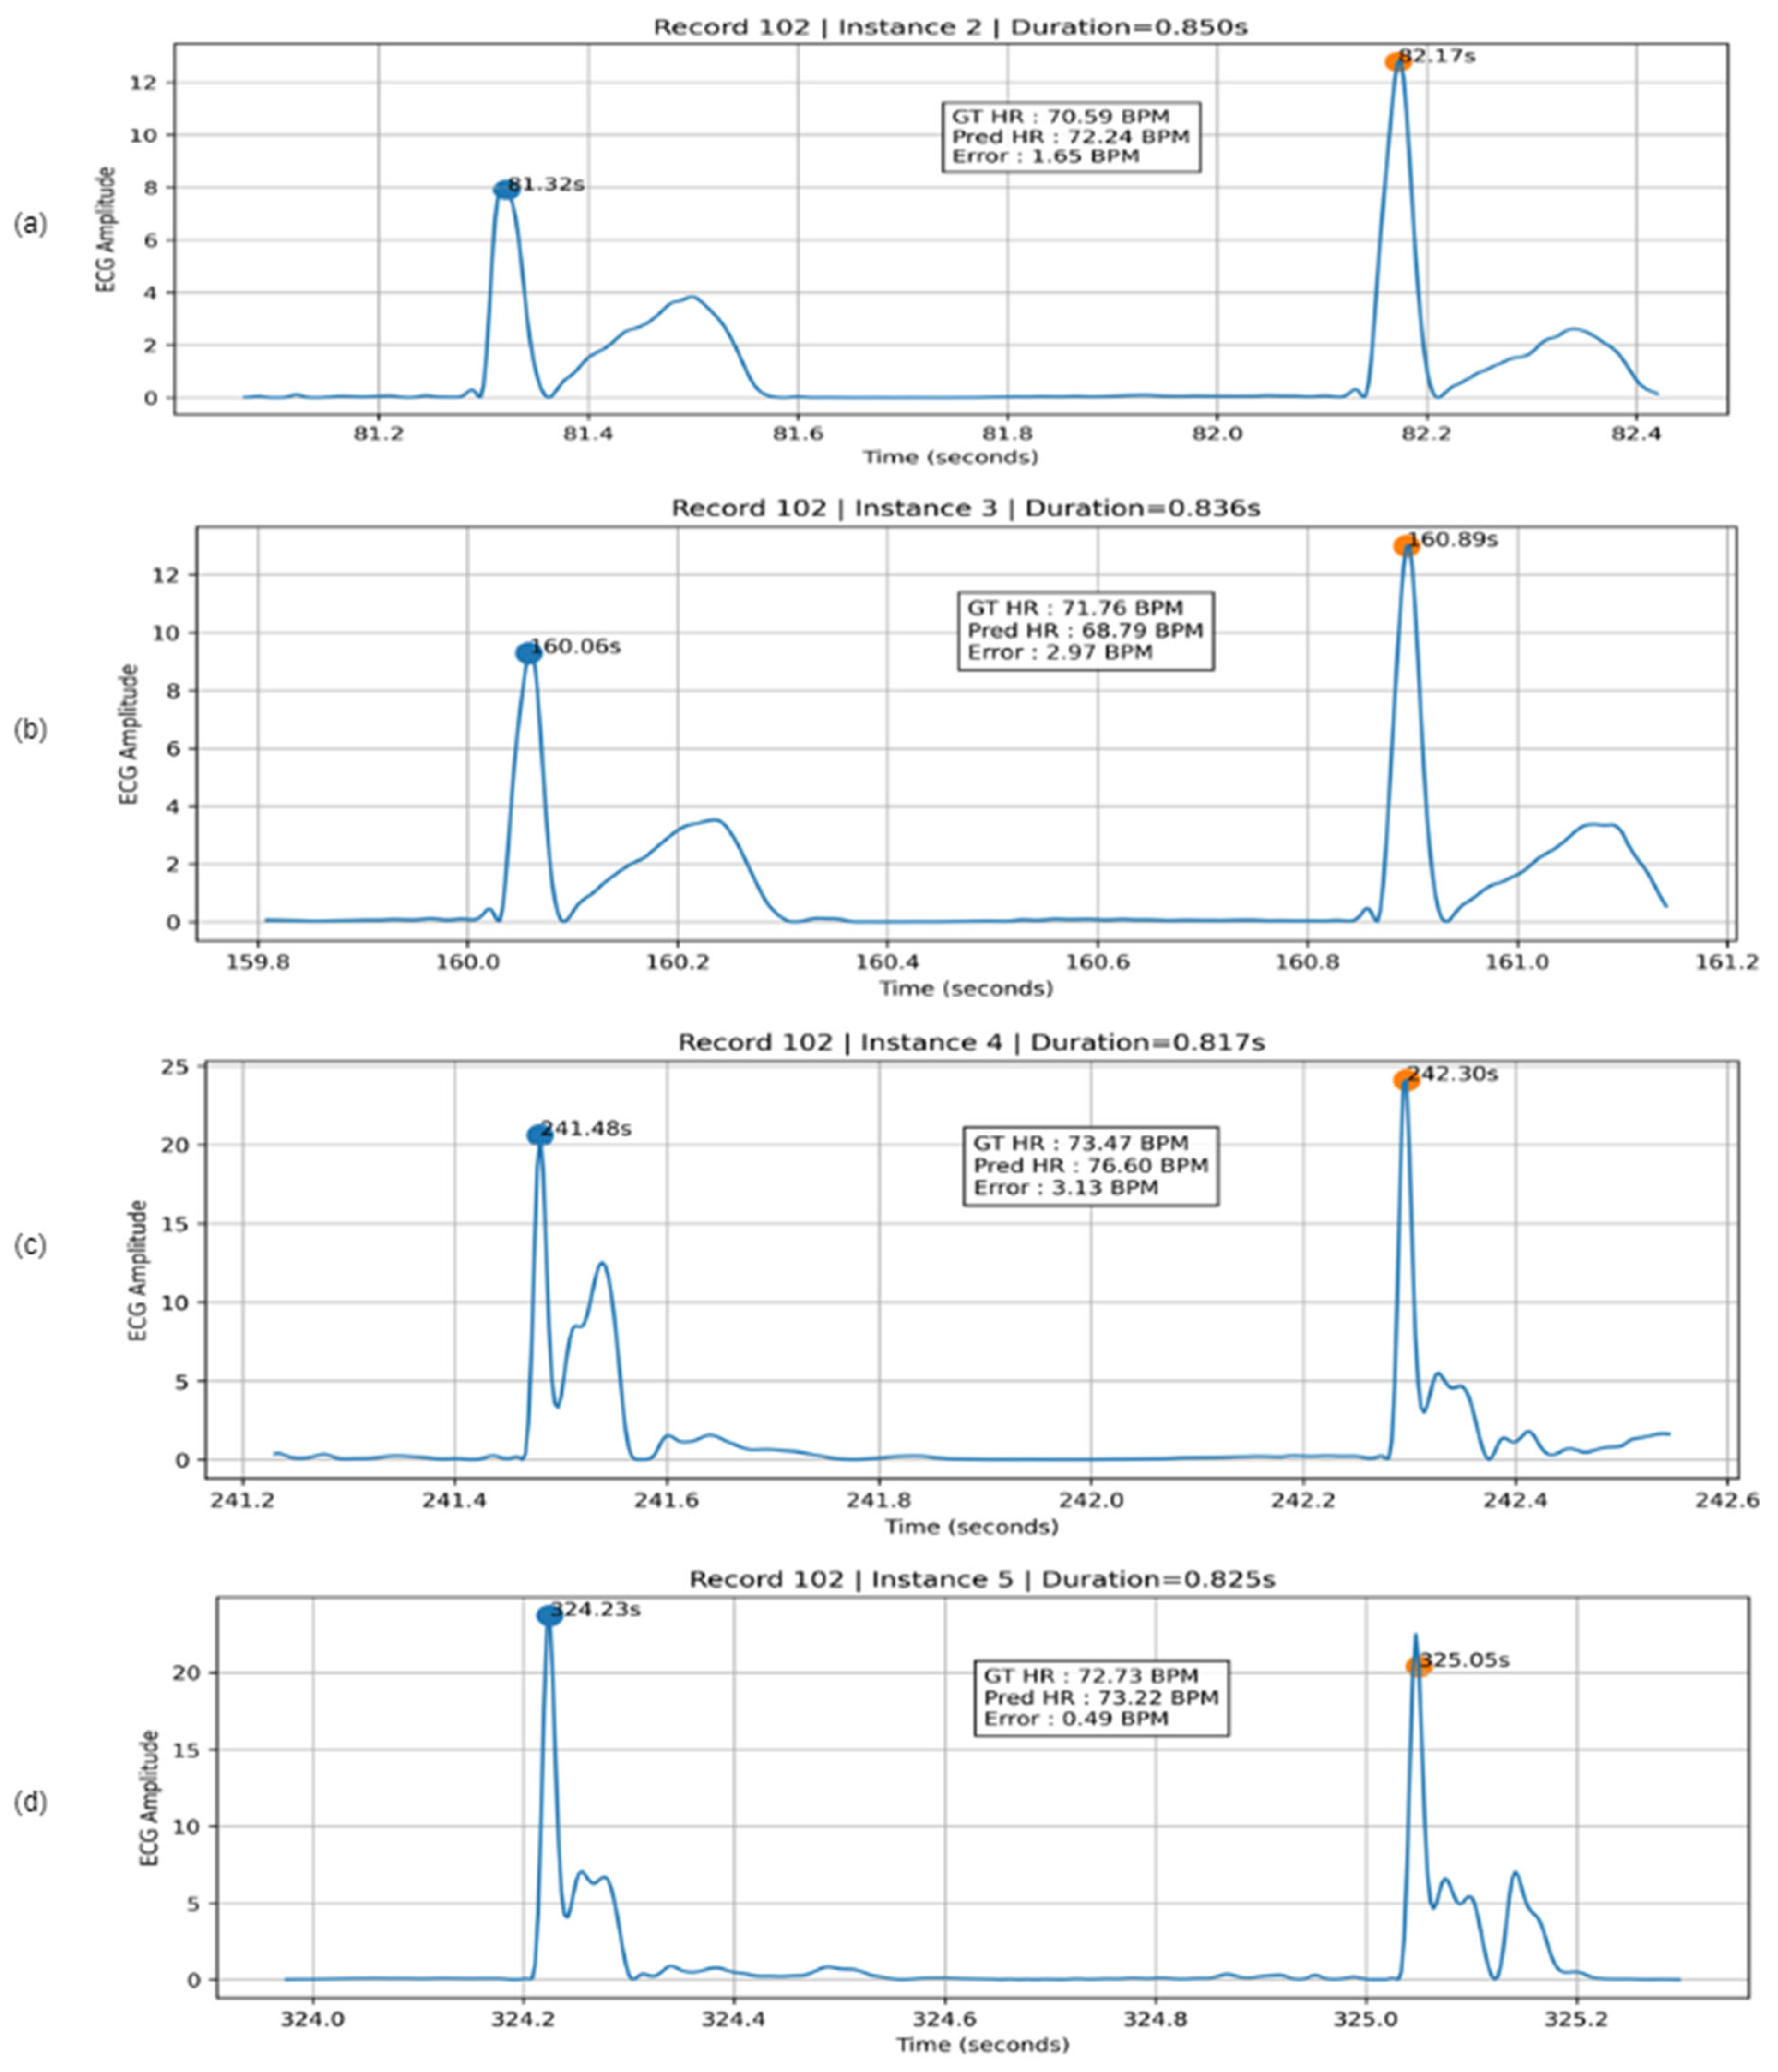
where R-R (mm) is the distance between two consecutive R-peaks on the ECG paper, measured in millimeters. In standard ECG machines, the printing paper speed is 25 mm/s. It moves 1500 mm in one minute. Hence, 1500 mm of ECG paper represents 1 min of time. The R-R instances and HR estimations for a sample record 102 at different time instances are shown in Figure 7, and the performance of the HR calculation for record 102 is shown in Table 2.
Raw data (RRx) were obtained from Equation (1) proposed by the RRHR approach by substituting the GT (ground truth) value of HR from MIT-BIH (HRx). Similarly, the HR value measured through the TEDA (HRy) is substituted in Equation (1) to find the number of samples in R-R (RRy).
The average of RRx and RRy is substituted in Equation (1) to estimate the HR. This approach was followed for all samples, and the HR estimations for a few samples are listed in Table 3. Consider a sample record of 100 and an interval of R2:R3. From MIT–BIH, the GT value for the HR was 77.14 BPM. The HR measured for the same sample using the TEDA was 72.97 BPM. The differential error between these two values was 4.17 BPM. By substituting the GT value of HR in Equation (1), the RRx data value (number of samples in the RR interval) = 60 × 360/77.14 = 280.01. By substituting the measured HR value with the TEDA approach in Equation (1), RRy data value = 60 × 360/72.97 = 296.01. Based on the average of RRx and RRy data, HR = 60 × 360/(280.01 + 296.01)/2) = 74.997.
The HR value calculated using the proposed RRHR approach was within the range of GT and measured values, both of which were computed using the MIT-BIH dataset. Hence, it is proven that the proposed RRHR approach estimates HR values with no error, and it implies that it is possible to prove the accuracy of this embedded algorithm using the benchmark MIT-BIH dataset, indirectly using the TEDA approach.

3.4. Experiment 2

Experiment 2 involved proposed heart rate computation using different sampling rates. The accuracy of the proposed approach under different sampling rates must be proven compared to that of the traditional time-based approach. The HR is calculated using the traditional approach, as given by Equation (9), as well as using the proposed RRHR approach based on Equation (1). The HR is estimated for different sampling rates of 400, 10,000, and 16,000 and tabulated in Table 4. Based on the RRHR approach, 1 mm of ECG graph paper had eight samples at a sampling rate of 200. Alternatively, in the traditional approach, the distance between R-R peaks is considered in mm scale only, which is not precise. It was observed that the HR values were more accurate from a design point of view, and the physicians could observe precise values in decimals, whereas the traditional time-based method provided an approximate value in a range.

3.5. Experiment 3

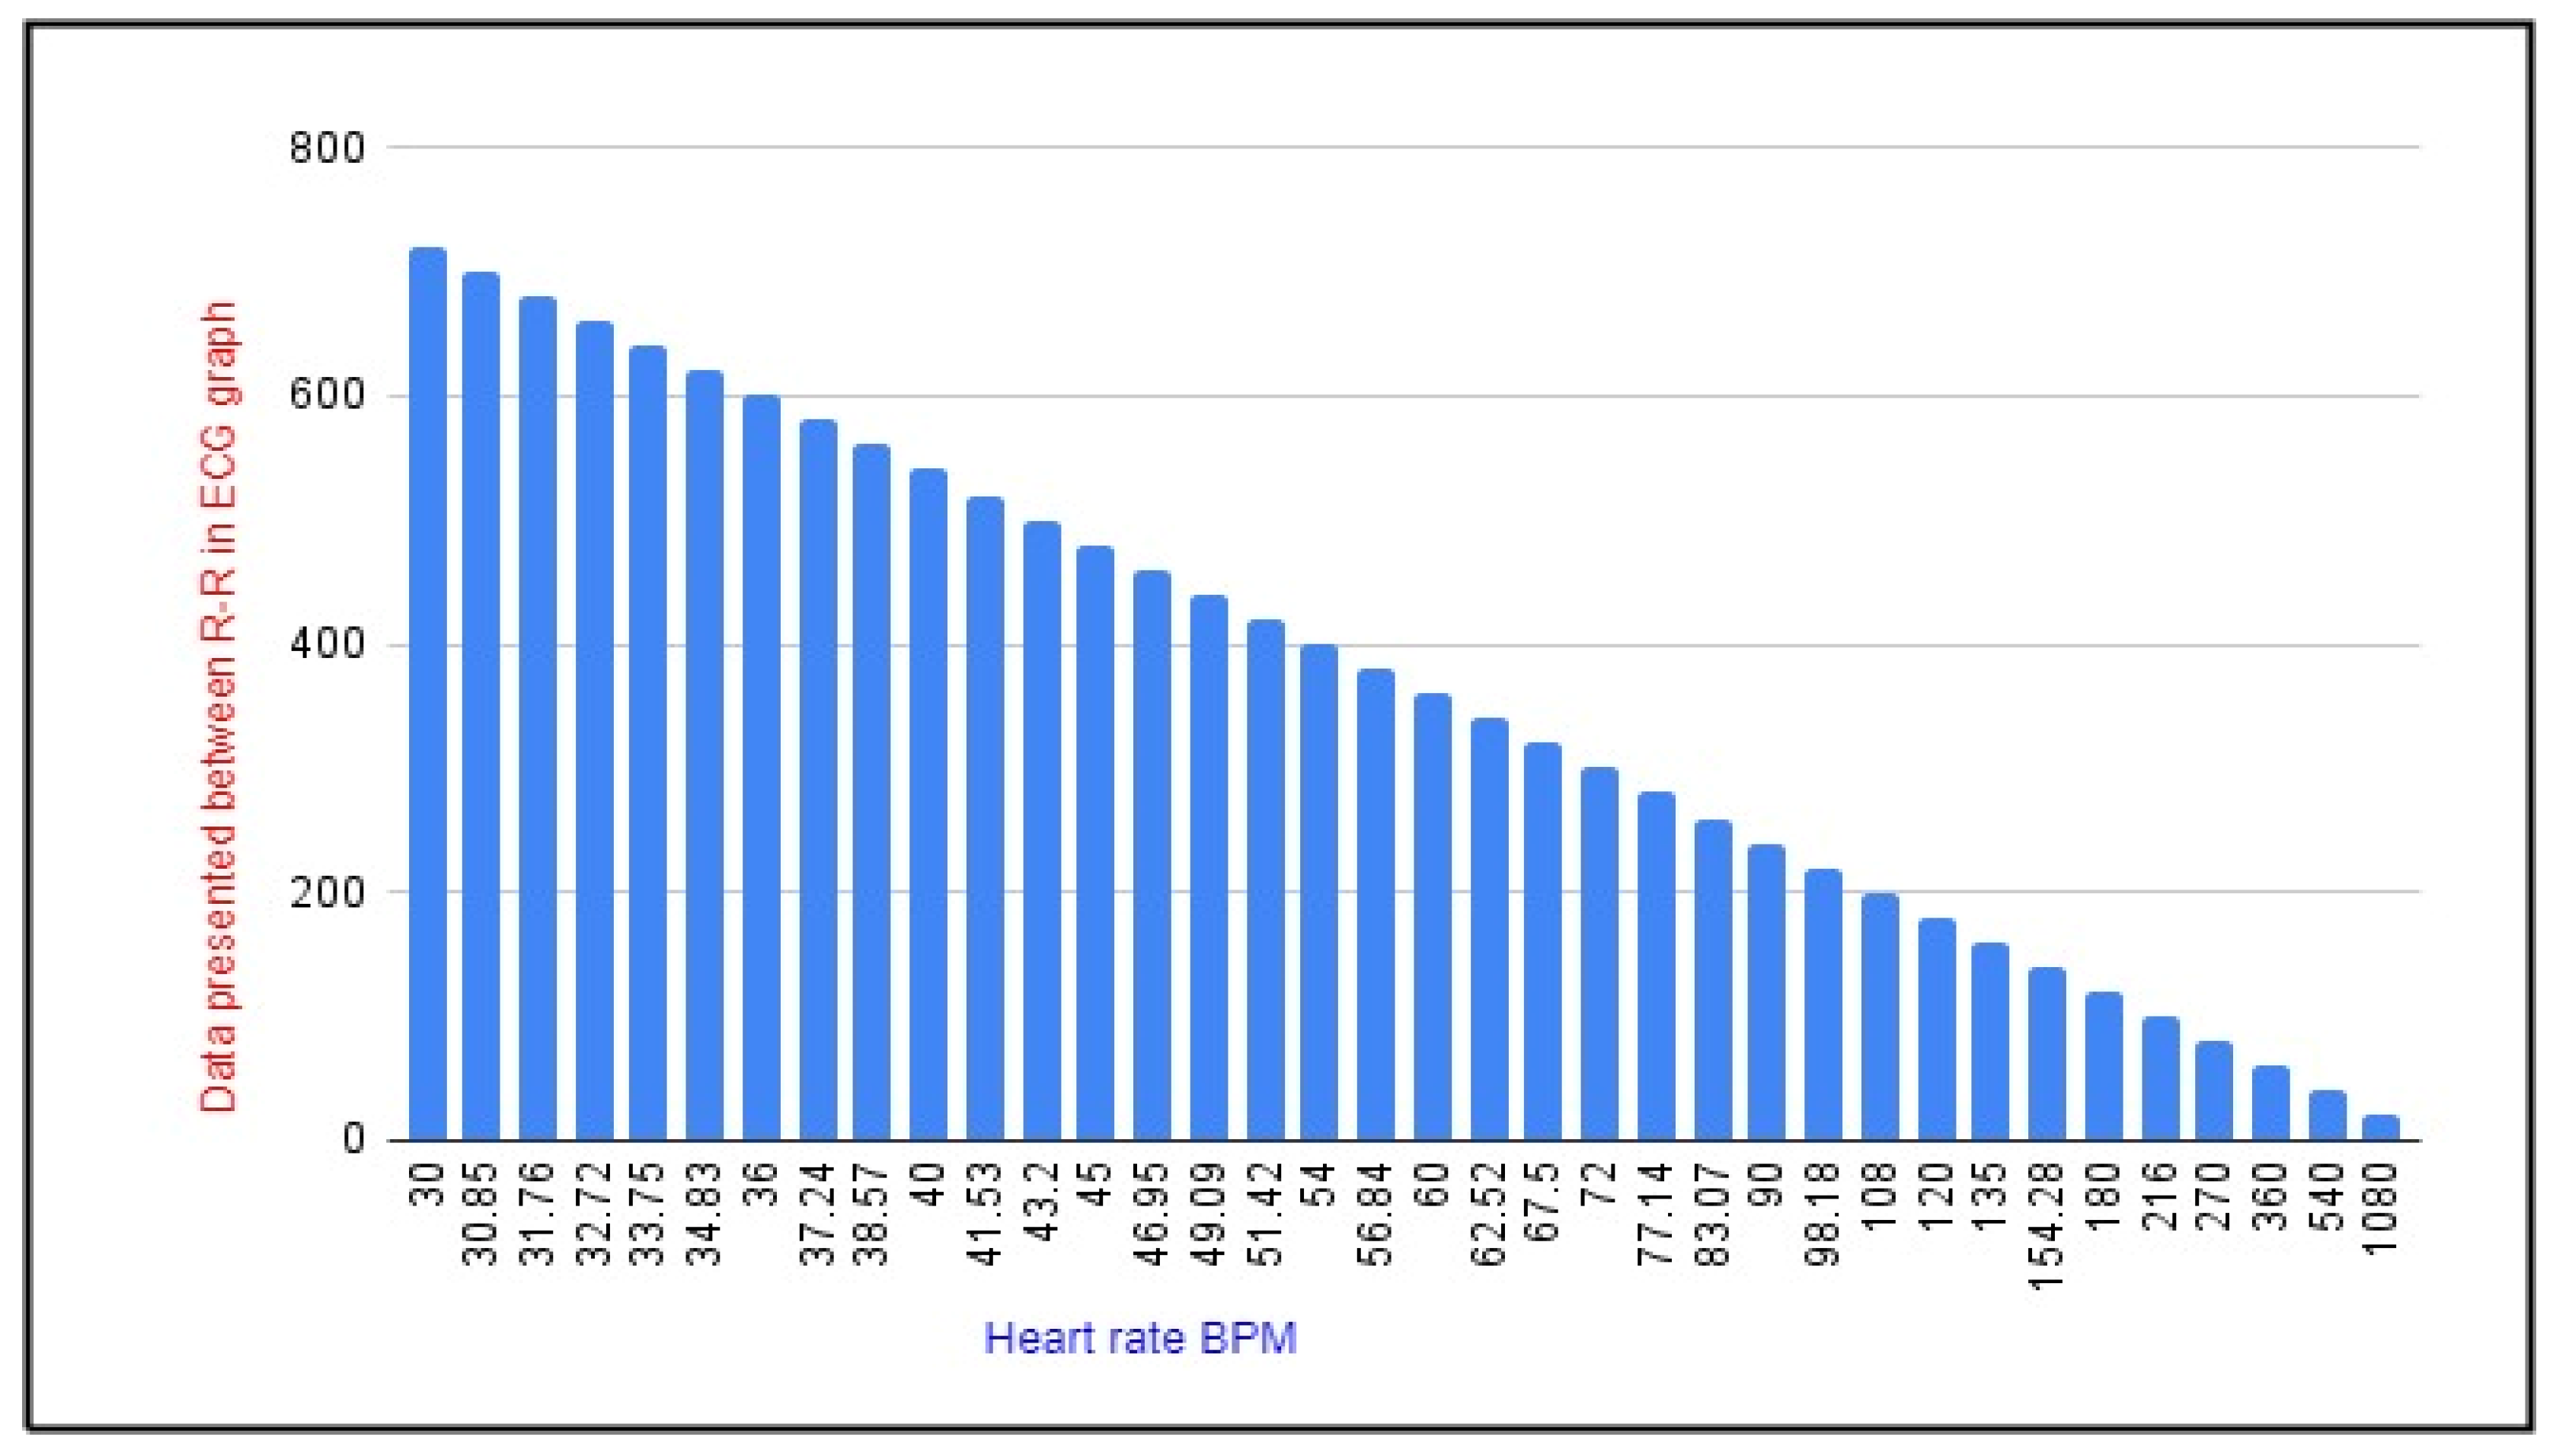
The heart rate was calculated at different R-R peaks with different sampling rates using an ECG simulator that was calibrated for a sampling rate of 360. The results were statistically analyzed and are shown in Figure 8. HR measures 60 when the data is exactly 360 between R-R intervals. Similarly, HRs of 30 and 120 were observed when the raw data were counted as 720 and 180, respectively. The HR was calculated up to 1080 for the theoretical analysis.

4. Discussion

The proposed RRHR is intended for real-time heart rate measurement in resource-constrained embedded systems. Due to low computational complexity and memory requirements, it is well suited to wearable cardiac devices and portable ECG devices, home-based health monitoring and point-of-care diagnostic systems where efficient real-time processing is essential.

5. Conclusions

This proposed work presented RRHR with an embedded heart rate-finding algorithm. The noise was removed from the signal using bandpass and notch filters. In addition, an adaptive filter was used to enhance the signal-to-noise ratio. A squaring process was performed to amplify the R-peak after differentiation. R-peaks and R-R intervals were located, and the raw data was measured between adjacent R-R peaks using the embedded algorithm. The proposed algorithm is well suited for both heart rate and heart rate variability estimation using raw ECG data between consecutive R-R peaks. Unlike conventional approaches that rely on timestamp-based R-R interval measurements, the proposed method directly measures the number of ECG data points between detected R-peaks, thereby eliminating timing inconsistencies arising from system-dependent clocks and timestamp resolutions. Validation was performed with the ground truth and predicted heart rate of the MIT-BIH arrhythmia dataset by implementing the TEDA algorithm. Because the RRHR approach focuses on the sinus rhythm signal, the amplitude of all R-peaks in the continuous ECG data might be similar. Even a slight variation in the peak amplitude can be recognized using an appropriate threshold. The proposed work demonstrates that RRHR achieves a significantly lower heart rate estimation error compared to existing methods. Furthermore, a comparison with the standard clinical calculation method confirmed the accuracy and reliability of the proposed algorithm, achieving 100% agreement with the reference heart rate measurements within a tolerance of ± 1 ECG sample. Owing to its low computational complexity, reduced static memory requirements, and high accuracy, RRHR is suitable for real-time implementation in wearable and resource-constrained embedded ECG monitoring systems for continuous cardiac health assessment. The proposed approach is applicable only for sinus rhythm. It can be extended to abnormal ECG signals. Further co-design of real-time hardware and embedded software is encouraged.
The algorithm has been designed and validated for ECG signals exhibiting normal sinus rhythm. Its performance on other cardiac rhythms, such as atrial fibrillation or ventricular arrhythmias, has not been evaluated and remains a limitation of the present study.

Author Contributions

Conceptualization, R.R. and K.R.; Methodology, R.R. and K.R.; Software, R.R.; Validation, R.R. and K.R.; Formal analysis, R.R. and K.R.; Investigation, R.R. and K.R.; Resources, R.R.; Writing—original draft, R.R.; Writing—review & editing, R.R.; Supervision, K.R. All authors have read and agreed to the published version of the manuscript.

Funding

This research received no external funding.

Institutional Review Board Statement

Not applicable.

Informed Consent Statement

Not applicable.

Data Availability Statement

The original contributions presented in this study are included in the article. Further inquiries can be directed to the corresponding author.

Acknowledgments

The authors would like to express their gratitude to R. Venkatesh DNB(GM), Reg. No. 100952, Department of General Medicine, Govt Medical College and Hospital, Namakkal, Tamil Nadu, India, who had conducted a brief discussion and validation of the proposed approach by comparing it with existing methods.

Conflicts of Interest

The authors declare no conflicts of interest.

References

  1. Khayatzadeh, M.; Zhang, X.; Tan, J.; Liew, W.S.; Lian, Y. A 0.7-v 17.4-/spl mu/w 3-lead wireless ecg soc. IEEE Trans. Biomed. Circuits Syst. 2013, 7, 583–592. [Google Scholar] [CrossRef] [Scilit] [PubMed]
  2. Nemati, E.; Deen, M.J.; Mondal, T. A wireless wearable ECG sensor for long-term applications. IEEE Commun. Mag. 2012, 50, 36–43. [Google Scholar] [CrossRef] [Scilit]
  3. Zahid, M.U.; Kiranyaz, S.; Ince, T.; Devecioglu, O.C.; Chowdhury, M.E.H.; Khandakar, A.; Tahir, A.; Gabbouj, M. Robust R-peak detection in low-quality holter ECGs using 1D convolutional neural network. IEEET Trans. Biomed. Eng. 2022, 69, 119–128. [Google Scholar] [CrossRef] [Scilit]
  4. Pandit, D.; Zhang, L.; Liu, C.; Chattopadhyay, S.; Aslam, N.; Lim, C. A lightweight QRS detector for single lead ECG signals using a max-min difference algorithm. Comput. Methods Programs Biomed. 2017, 144, 61–75. [Google Scholar] [CrossRef] [Scilit] [PubMed]
  5. Hao, Z.; Zhang, X.; Gao, L.; Li, J.; Liu, J.; Lai, Z. A Filter Design Method Based on Evolutionary Learning for R-Peak Detection in Portable ECG Testing Devices. Biomed. Signal Process. Control 2024, 88, 105649. [Google Scholar] [CrossRef] [Scilit]
  6. Davies, H.J.; Hammour, G.; Zylinski, M.; Nassibi, A.; Stanković, L.; Mandy, D.P. The Deep-Match Framework: R-Peak Detection in Ear-ECG. IEEE Trans. Biomed. Eng. 2024, 71, 2014–2021. [Google Scholar] [CrossRef] [Scilit] [PubMed]
  7. Liu, F.; Liu, C.; Jiang, X.; Zhang, Z.; Zhang, Y.; Li, J.; Wei, S. Performance Analysis of Ten Common QRS Detectors on Different ECG Application Cases. J. Healthc. Eng. 2018, 2018, 9050812. [Google Scholar] [CrossRef] [Scilit] [PubMed]
  8. Rodriguez, V.H.; Medrano, C.; Plaza, I. Embedded System Based on an ARM Microcontroller to Analyze Heart Rate Variability in Real Time Using Wavelets. Wirel. Commun. Mob. Comput. 2018, 2018, 9138578. [Google Scholar] [CrossRef] [Scilit]
  9. Raj, S.; Ray, K.C. Sparse Representation of ECG Signals for Automated Recognition of Cardiac Arrhythmias. Expert Syst. Appl. 2018, 105, 49–64. [Google Scholar] [CrossRef] [Scilit]
  10. D’Aloia, M.; Longo, A.; Rizzi, M. Noisy ECG Signal Analysis for Automatic Peak Detection. Information 2019, 10, 35. [Google Scholar] [CrossRef] [Scilit]
  11. Laudato, G.; Oliveto, R.; Scalabrino, S.; Colavita, A.; De Vito, L.; Picariello, F.; Tudosa, I. Identification of R-peak occurrences in compressed ECG signals. In Proceedings of the 2020 IEEE International Symposium on Medical Measurements and Applications (MeMeA), Bari, Italy, 1 June–1 July 2020; IEEE: New York, NY, USA, 2020; pp. 1–6. [Google Scholar]
  12. Gupta, V.; Mittal, M. Efficient R-peak detection in electrocardiogram signal based on features extracted using Hilbert transform and Burg method. J. Inst. Eng. (India) Ser. B 2020, 101, 23–34. [Google Scholar] [CrossRef] [Scilit]
  13. Gupta, V.; Mittal, M.; Mittal, V. R-peak detection-based chaos analysis of ECG signal. Analog Integr. Circuits Signal Process. 2020, 102, 479–490. [Google Scholar]
  14. Mehri, M.; Calmon, G.; Odille, F.; Oster, J. A deep learning architecture using 3D vectorcardiogram to detect R-peaks in ECG with enhanced precision. Sensors 2023, 23, 2288. [Google Scholar] [CrossRef] [Scilit] [PubMed]
  15. Karri, M.; Annavarapu, C.S.R. A real-time embedded system to detect QRS-complex and arrhythmia classification using LSTM through hybridized features. Expert Syst. Appl. 2023, 214, 119221. [Google Scholar] [CrossRef] [Scilit]
  16. Maurya, J.P.; Kumar, V.; Trivedi, V.K.; Shrivastava, A. An Optimized Machine Learning Model for R and T Peak Detection in ECG Signal. In Proceedings of the 2024 International Conference on Artificial Intelligence and Quantum Computation-Based Sensor Application (ICAIQSA), Nagpur, India, 20–21 December 2024; IEEE: New York, NY, USA, 2024; pp. 1–6. [Google Scholar] [CrossRef] [Scilit]
  17. Jiménez-Ocaña, A.A.; Pantoja, A.; Armañac, P.; Bailón, R.; Laguna, P.; Giraldo, L.F. Stress detection using heart rate variability and respiratory signals derived from a single lead ECG. IEEE Trans. Biomed. Eng. 2026, 1–12. [Google Scholar] [CrossRef] [Scilit]
  18. Chen, H.; Maharatna, K. An automatic R and T peak detection method based on the combination of hierarchical clustering and discrete wavelet transform. IEEE J. Biomed. Health Inform. 2020, 24, 2825–2832. [Google Scholar] [CrossRef] [Scilit] [PubMed]
  19. Razavi, S.R.; Doost Mohammadi, M.H. R-peak Detection in Electrocardiogram Signals Using Continuous Wavelet Transform. Int. J. Bioautomation 2017, 21, 165. [Google Scholar]
  20. Pan, J.; Tompkins, W.J. A Real-Time QRS Detection Algorithm. IEEE Trans. Biomed. Eng. 1985, BME-32, 230–236. [Google Scholar] [CrossRef] [Scilit]
  21. Siswanti, Y.W.; Yazid, M.; Setiawan, R. Comparison of 10 QRS Detection Methods for Heartbeat Detection on Portable ECG Systems. In Proceedings of the 2020 International Conference on Computer Engineering, Network, and Intelligent Multimedia (CENIM), Surabaya, Indonesia, 17–18 November 2020; IEEE: New York, NY, USA, 2020; pp. 58–63. [Google Scholar] [CrossRef] [Scilit]
  22. Rahman, M.; Augustyniak, P.; Olejarczyk, E. The QRS Detection Using the Modified Pan-Tompkins Algorithm. In Proceedings of the 2024 IEEE International Workshop on Metrology for Industry 4.0 & IoT (MetroInd4.0 & IoT), Florence, Italy, 29–31 May 2024; IEEE: New York, NY, USA, 2024; pp. 328–332. [Google Scholar] [CrossRef] [Scilit]
  23. Balta, D.; Akyemiş, E.M. Arrhythmia detection using Pan Tompkins algorithm and Hilbert transform with real-time ECG signals. Acad. Perspect. Procedia 2021, 4, 307–315. [Google Scholar] [CrossRef] [Scilit]
  24. Al-Jabbar, A.; Entisar, Y.; Mohamedsheet Al-Hatab, M.M.; Qasim, M.A.; Fathel, W.R.; Fadhil, M.A. Clinical Fusion for Real-Time Complex QRS Pattern Detection in Wearable ECG Using the Pan-Tompkins Algorithm. Fusion Pract. Appl. 2023, 12, 172–184. [Google Scholar] [CrossRef] [Scilit]
  25. Tueche, F.; Mohamadou, Y.; Djeukam, A.; Kouekeu, L.C.N.; Seujip, R.; Tonka, M. Embedded Algorithm for QRS Detection Based on Signal Shape. IEEE Trans. Instrum. Meas. 2021, 70, 1–12. [Google Scholar] [CrossRef] [Scilit]
  26. Orlandic, L.; De Giovanni, E.; Arza, A.; Yazdani, S.; Vesin, J.; Atienza, D. REWARD: Design, Optimization, and Evaluation of a Real-Time Relative-Energy Wearable R-Peak Detection Algorithm. In Proceedings of the 2019 41st Annual International Conference of the IEEE Engineering in Medicine and Biology Society (EMBC), Berlin, Germany, 23–27 July 2019; IEEE: New York, NY, USA, 2019; pp. 3341–3347. [Google Scholar] [CrossRef] [Scilit] [PubMed]
  27. Kaur, A.; Agarwal, A.; Agarwal, R.; Kumar, S. A novel approach to ECG R-peak detection. Arab. J. Sci. Eng. 2019, 44, 6679–6691. [Google Scholar]
  28. Wang, L.; Hao, J.; Zhou, T.H. ECG multi-emotion recognition based on heart rate variability signal features mining. Sensors 2023, 23, 8636. [Google Scholar] [CrossRef] [Scilit] [PubMed]
  29. Kouekeu, L.C.N.; Mohamadou, Y.; Djeukam, A.; Tueche, F.; Tonka, M. Embedded QRS 630 Complex Detection Based on ECG Signal Strength and Trend. Biomed. Eng. Adv. 2022, 3, 100030. [Google Scholar] [CrossRef] [Scilit]
  30. Rodrigues, T.; Samoutphonh, S.; Silva, H.; Fred, A. A Low Complexity R-Peak Detection Algorithm with Adaptive Thresholding for Wearable Devices. In Proceedings of the 2020 25th International Conference on Pattern Recognition (ICPR), Milan, Italy, 10–15 January 2021; IEEE: New York, NY, USA, 2020; pp. 1–8. [Google Scholar] [CrossRef] [Scilit]
  31. Wang, R.; Veera, S.C.M.; Asan, O.; Liao, T. A Systematic Review on the Use of Consumer-Based ECG Wearables on Cardiac Health Monitoring. IEEE J. Biomed. Health Inform. 2024, 28, 6525–6537. [Google Scholar] [CrossRef] [Scilit] [PubMed]
  32. Xu, X.; Cai, Q.; Zhao, Y.; Wang, G.; Zhao, L.; Lian, Y. A 2.66 μW clinician-like cardiac arrhythmia watchdog based on P-QRS-T for wearable applications. IEEE Trans. Biomed. Circuits Syst. 2022, 16, 793–806. [Google Scholar] [CrossRef] [Scilit] [PubMed]
  33. Bittharia, K.; Tiwari, P.; Saxena, S.; Design, V.; Vidyapith, B. R-Peak Detection of ECG Signal Using Thresholding Method. Int. Res. J. Eng. Technol. (IRJET) 2019, 6, 2223–2234. [Google Scholar]
  34. Zhou, Z.; Wang, Y.; Cheng, X.; Wang, J. Evolution of Heart Rate Variability (HRV) Analysis Methodologies (2000–2025): From Task Force Standards to Wearables, AI, and Clinical Translation. Biomed. Signal Process. Control 2026, 123, 110575. [Google Scholar] [CrossRef] [Scilit]
  35. Gu, M.; Zhang, Y.; Wen, Y.; Ai, G.; Zhang, H.; Wang, P.; Wang, G. A lightweight convolutional neural network hardware implementation for wearable heart rate anomaly detection. Comput. Biol. Med. 2023, 155, 106623. [Google Scholar] [CrossRef] [Scilit] [PubMed]
  36. Mu, S.; Liao, S.; Tao, K.; Shen, Y. Intelligent fatigue detection based on hierarchical multiscale ECG representations and HRV measures. Biomed. Signal Process. Control 2024, 92, 106127. [Google Scholar] [CrossRef] [Scilit]
  37. Wang, B.X.; Brennand, E.; Le Page, P.; Mitchell, A.R. Heart rate variability in cardiovascular disease diagnosis, prognosis and management. Front. Cardiovasc. Med. 2026, 12, 1680783. [Google Scholar] [CrossRef] [Scilit] [PubMed]
  38. Alimbayeva, Z.; Alimbayev, C.; Ozhikenov, K.; Bayanbay, N.; Ozhikenova, A. Wearable ECG Device and Machine Learning for Heart Monitoring. Sensors 2024, 24, 4201. [Google Scholar] [CrossRef] [Scilit] [PubMed]
  39. Chen, C.; Chuang, C. A QRS Detection and R Point Recognition Method for Wearable 654 Single-Lead ECG Devices. Sensors 2017, 17, 1969. [Google Scholar] [CrossRef] [Scilit] [PubMed]
  40. Silva, L.; Silva, S.; Souza, L.; Azevedo, K.; Guedes, L.; Fernandes, M. A New and Light-657 weight R-Peak Detector Using the TEDA Evolving Algorithm. Mach. Learn. Knowl. Extr. 2024, 6, 736–750. [Google Scholar] [CrossRef] [Scilit]
Figure 1. ECG waveform with R-R peaks (normal sinus rhythm).
Applsci 16 07576 g001
Figure 2. RRHR—proposed methodology to compute heart rate.
Applsci 16 07576 g002
Figure 3. A segment of ECG showing inter-beat R-R interval and raw data.
Applsci 16 07576 g003
Figure 4. A segment of ECG showing a tombstone in an R-R interval.
Applsci 16 07576 g004
Figure 5. Workflow of the experiment validating RRHR approach using TEDA algorithm.
Applsci 16 07576 g005
Figure 6. R-peaks detected using TEDA algorithm for different sample records: (a) record 100, (b) record 101, (c) record 102, (d) record 104, (e) record 105, (f) record 107.
Applsci 16 07576 g006aApplsci 16 07576 g006b
Figure 7. R–R peaks and HR estimated using record 102: (a) instance R2–R3, (b) instance R3–R4, (c) instance R4–R5, (d) instance R5–R6.
Applsci 16 07576 g007
Figure 8. Statistical analysis of ECG raw data and HR at SF 360.
Applsci 16 07576 g008
Table 1. Performance of R-peak detection.
Sensitivity~87–98% (ability to detect true heartbeats)
Precision~97–99% (correctness of detected peaks)
F1 Score~90–99%
Accuracy~82–97%
Table 2. HR calculation for record 102-performance metrics.
GT beats2274
Calculated beats2015
MAE8.85 BPM
RMSE11.36 BPM
Mean GT HR⩰75.38 BPM
Mean calculated HR⩰66.79 BPM
GT beats2274
Table 3. Comparison of HR estimation using RRHR and traditional approaches.
Record
(MIT-
BIH)
R-R IntervalR-R
(s)
HR
GT
(BPM)
(HRx)
Measured HR
(BPM)
(HRy)
Error
(|HRx − HRy|
R-R Data Using HRx
(RRx)
R-R Data Using HRy
(RRy)
Average (RRx, RRy)
RRavg
HR Based on RRavg
(HRz)
Error
100R2:R30.77877.1472.974.17280.01296.01288.0075.00±2.085
R3:R40.88173.7970.823.15292.01304.99298.572.36±1.575
R4:R50.79275.7975.000.79284.99288.00286.4975.39±0.395
R5:R60.79275.7983.087.29284.99259.99272.4979.26±3.645
102R2:R30.85070.5972.261.65305.99298.92302.45571.41±0.825
R3:R40.83671.7668.792.97301.00313.99307.49570.24±1.475
R4:R50.81773.4776.603.13293.99281.98287.9975.00±1.565
R5:R60.82572.7373.220.49296.98295.00295.9972.97±0.245
105R2:R30.71484.0584.710.66256.98254.98255.98884.370.33
R3:R40.73681.5178.263.25264.99276.00270.50079.851.625
R4:R50.72582.7684.711.95260.99254.98257.99183.700.975
R5:R60.98660.8579.1218.28354.97273.00313.98768.7909.14
107R2:R30.83971.5270.131.39302.01307.99305.00670.180.695
R3:R40.85070.5969.900.69305.99309.01307.50270.240.345
R4:R50.87868.3566.671.69316.02323.98320.00167.490.845
R5:R60.86969.0136.3632.65312.99594.05453.52847.6216.325
Table 4. Comparison of RRHR and traditional/clinical approach under different sampling rates.
SF 400SF 1000SF 10000
ClinicalProposed RRHRClinicalProposed RRHRClinicalProposed RRHR
RR mmHRRR
Data
HRRR
mm
HRRR
Data
HRRR
mm
HRRR
Data
HR
1150016150011500401500115004001500
2–3150–50042571.422–3150–500105571.422–3150–5001050571.42
5–6300–25092260.865–6300–250230260.865–6300–2502300260.86
8–9185.5–166.66134179.108–9185.5–166.66335179.108–9185.5–166.663350179.10
13–14115.38–107.14218110.0913–14115.38–107.14545110.0913–14115.38–107.145450110.09
1510024010015100600100151006000100
2075320752075800752075800075
2560400602560100060256010,00060
44–4534.09–33.3370633.9944–4534.09–33.33176533.9944–4534.09–33.3317,65033.99
12512200012125125000121251250,00012
1500124,00011500160,000115001600,0001
Disclaimer/Publisher’s Note: The statements, opinions and data contained in all publications are solely those of the individual author(s) and contributor(s) and not of MDPI and/or the editor(s). MDPI and/or the editor(s) disclaim responsibility for any injury to people or property resulting from any ideas, methods, instructions or products referred to in the content.