1. Introduction
Water polo is a high-intensity, intermittent aquatic team sport characterised by repeated bouts of maximal effort interspersed with lower-intensity recovery periods, demanding simultaneous proficiency in swimming mechanics, throwing accuracy, tactical positioning, and physical contact management [
1,
2]. The sport imposes substantial aerobic and anaerobic demands: elite players sustain mean heart rates of approximately 80–87% of the maximum during match play, with peak oxygen uptake (VO
2max) values reported in the range of 50–60 mL·kg
−1·min
−1 in senior male athletes and repeated sprint efforts lasting 5–15 s, drawing heavily on phosphocreatine and glycolytic pathways [
3,
4]. Smith [
3] provided an early comprehensive synthesis of the applied physiology of water polo, documenting the cardiovascular, metabolic, and neuromuscular demands placed on competitive athletes across playing positions and situating the sport within a broader framework of high-intensity intermittent effort. The repeated high-intensity collisions and upper-body exertion inherent in match play contribute to a well-documented injury burden in elite players, with systematic reviews and prospective surveillance identifying the shoulder, knee, and head as primary sites of acute and overuse injury [
5,
6]; functional screening of the shoulder complex has more recently been extended to youth club-level cohorts to establish position-specific musculoskeletal profiles [
7]. Early research primarily employed time-motion analysis to describe the metabolic demands and movement profiles of elite players [
2,
8], establishing that water polo imposes substantial aerobic and anaerobic stress across multiple positional roles [
4]. Activity-profile analyses have since quantified the physical and physiological demands of international match play across sexes and competition levels [
9], and sport-specific aerobic fitness assessment protocols have been developed to standardise player readiness monitoring in competitive squads [
10]. As performance analysis has developed, more studies have focused on key performance indicators (KPIs) associated with winning and losing—a paradigm consolidated by Hughes and Bartlett [
1] and underpinned by the systematic observation frameworks formalised by Hughes and Franks [
11]—applied extensively across team and individual aquatic sports [
12].
The use of notational analysis and KPI-based approaches in water polo has increased substantially over the past two decades. Landmark studies demonstrated that shooting efficiency, power-play (6-on-5) conversion rate, and offensive-play confrontation outcomes are consistently associated with team success across senior international and European club contexts [
13,
14,
15,
16]. Escalante et al. [
14] found that teams winning at the 2008 Olympic Games demonstrated superior goal efficiency and six-on-five advantage conversion relative to losing opponents. Lupo et al. [
13,
16] further established that won offensive-play confrontations constitute an independent match discriminant beyond shooting statistics, a finding extended across sex and competition level. The discriminatory value of counterattack and defensive adjustment efficacy was also demonstrated in earlier mixed-gender analyses, where positional attacking sequences proved to be reliable differentiators of match outcome [
17]. Analysis of offensive action success rates across match phases has provided granular insight into the specific types of attacking play that most reliably predict positive outcomes in international competition [
18], while research on the strategic use of time-outs has revealed that targeted deployment of stoppages can modulate power-play conversion efficiency [
19]. Parallel studies have examined how FINA rule modifications affect game dynamics and scoring patterns [
20,
21,
22]; the distance and execution conditions of the penalty shot have also been identified as structural parameters with meaningful effects on performance statistics [
23]; Paixão et al. [
21], showing that contemporary rules amplify power-play efficiency differentials between teams of differing quality. Performance indicator frameworks developed in analogous contact-based aquatic and field team sports have also informed methodological approaches in water polo research. Rink hockey, for instance, shares structural similarities with water polo in terms of confined playing area, high-frequency physical contact between opponents, and the pivotal role of numerical advantage situations (power plays) in determining match outcomes [
24,
25]; KPI frameworks validated in that context have therefore provided useful benchmarks for contextualising performance indicator research in water polo.
Despite this growing body of research, two important gaps remain. First is the majority of published research is concentrated on European professional leagues and senior international events; the Asian competitive context remains under-studied [
12]. Water polo in Asia encompasses diverse competitive traditions spanning East Asia (China, Korea), Southeast Asia (Singapore, Malaysia), and Central Asia (Kazakhstan), yet the performance structure of Asian competition has not been documented in the peer-reviewed literature. Second, youth competition data at the continental championship level are particularly scarce. Positional studies in youth water polo [
26,
27,
28] have documented the importance of cognitive and physical specialisation at the U18 level, and training load monitoring validated specifically for water polo settings has identified RPE-based methods as a reliable tool for tracking physiological demands across developmental cohorts [
29]. Relative age effects have been recognised globally as a structurally important factor shaping youth sport talent pathways, with meta-analytical evidence confirming their pervasive influence across multiple sports and age-grouping contexts [
30]. Understanding the KPI correlates of success at this competitive tier is therefore relevant to coaching, talent identification, and athlete development [
27,
28]. The present study addresses both gaps simultaneously by providing the first peer-reviewed KPI analysis of an Asian youth water polo championship.
The 2026 Asian U18 Men’s Water Polo Championship (Kuala Lumpur, Malaysia; 7–16 March 2026) involved seven national programmes: Singapore (SGP), China (CHN), Kazakhstan (KAZ), Hong Kong–China (HKG), Malaysia (MAS), Korea (KOR), and Chinese Taipei (TPE). The multi-phase format—group stage, second-round robin among the top four qualifiers, consolation sub-tournament, and medal matches—generated 21 decisive matches with no draws, providing a complete match-level dataset from an Asian youth water polo championship. Singapore claimed the gold medal, defeating China 18–17 in the Final; Kazakhstan secured bronze.
Therefore, the present study aimed to identify match-level KPIs associated with winning and losing outcomes in the 2026 Asian U18 Men’s Water Polo Championship and to examine whether significant non-circular indicators retained independent associations with match outcome in an exploratory binary logistic regression model. Based on prior water polo literature [
13,
14,
15,
16], it was hypothesised that (i) indicators related to offensive-play success (WOP) and numerical-advantage scoring (PPG) would significantly discriminate winning from losing teams and that (ii) WOP swould retain an independent positive association with winning after controlling for other significant indicators.
2. Materials and Methods
2.1. Study Design
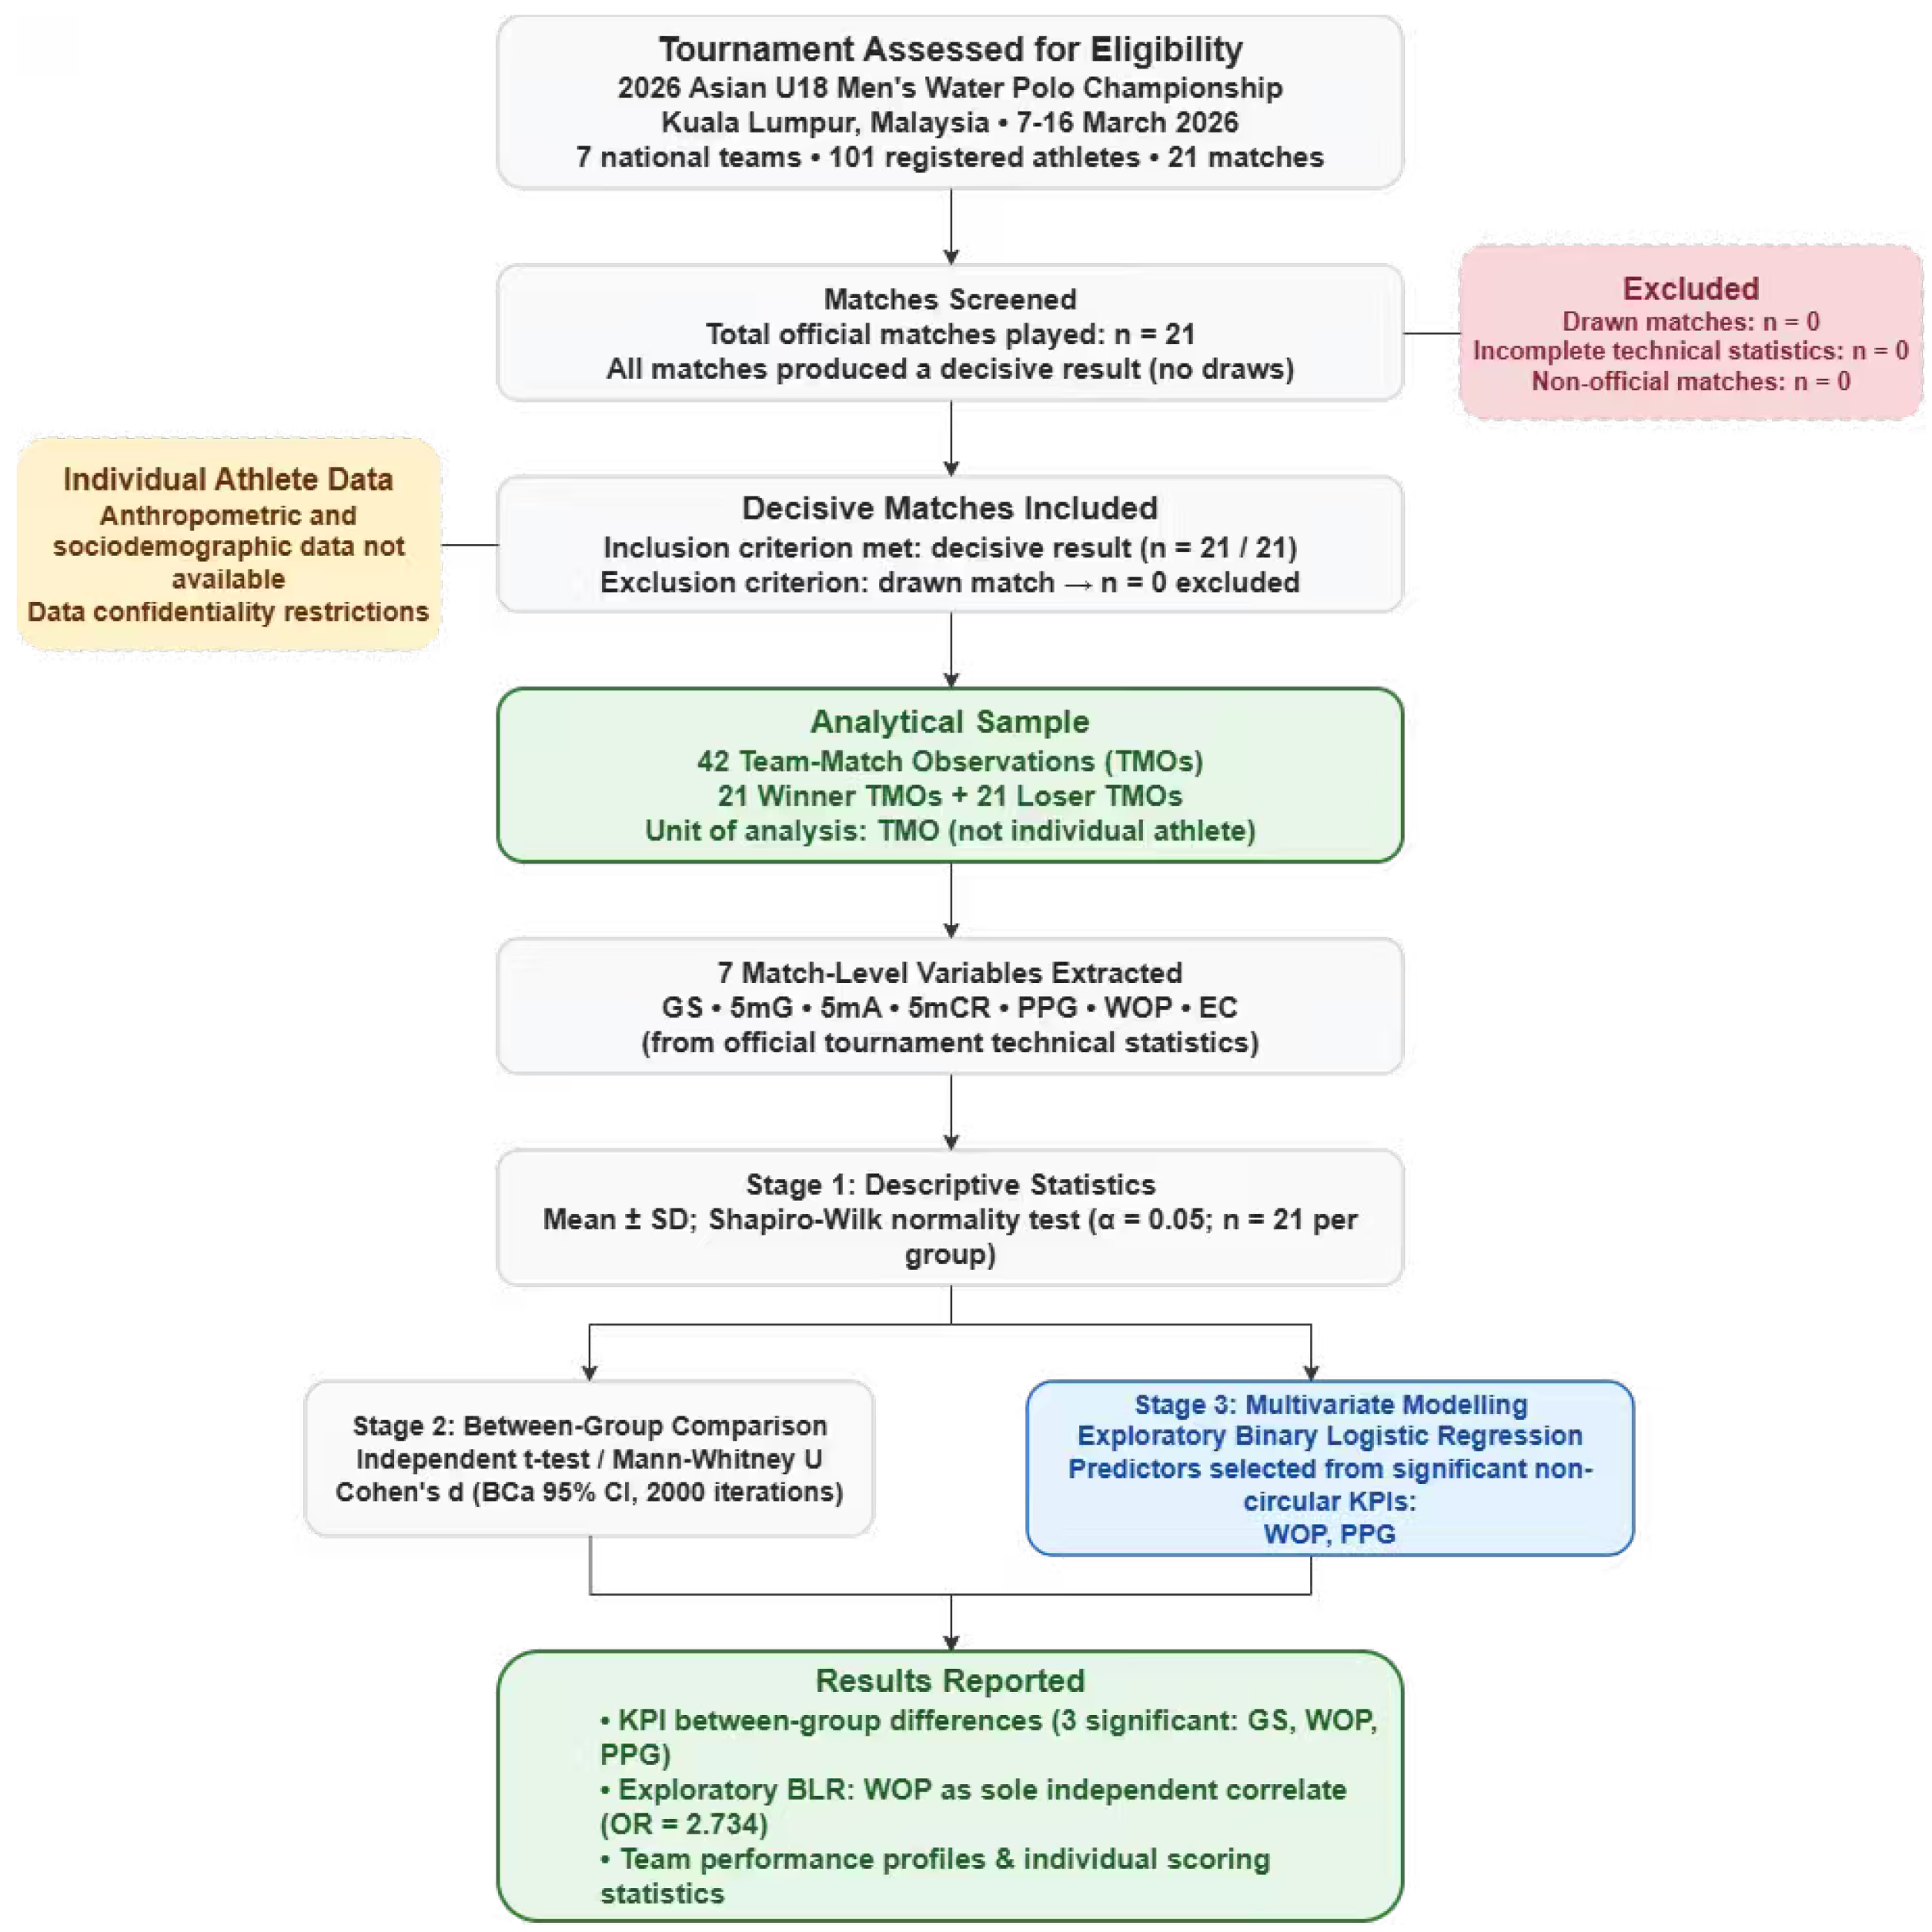
This study adopted a retrospective observational design to examine match-level performance indicators associated with match outcome in the 2026 Asian U18 Men’s Water Polo Championship, held in Kuala Lumpur, Malaysia (7–16 March 2026). Official technical statistics from all tournament matches were analysed following performance analysis frameworks established in water polo and team-sport notational analysis research, whereby competition-derived indicators are compared between winning and losing team units. Because the study relied exclusively on official statistical records rather than author-led video re-coding, the present design constitutes a tournament-level notational analysis. The reporting of this study was guided by the STROBE recommendations for observational research, which are appropriate for retrospective observational designs. Because the study did not involve a randomised controlled trial, the CONSORT framework was not applicable; the STROBE checklist was therefore adopted as the relevant reporting standard. A study flow diagram outlining match inclusion, sample construction, variable extraction, and analytical stages is presented in
Figure 1.
2.2. Tournament Participants and Eligibility Criteria
The study population comprised all seven national teams and 101 registered athletes who participated in the 2026 Asian U18 Men’s Water Polo Championship: China (CHN, n = 15), Hong Kong–China (HKG, n = 14), Kazakhstan (KAZ, n = 15), Korea (KOR, n = 15), Malaysia (MAS, n = 14), Singapore (SGP, n = 15), and Chinese Taipei (TPE, n = 13). The unit of analysis was the team-match observation (TMO) rather than the individual athlete.
Inclusion criteria: Official tournament matches were included if they produced a decisive result and had complete official technical statistics for the seven selected match-level variables. All 21 matches of the tournament satisfied these criteria, yielding 42 TMOs (21 winner TMOs and 21 loser TMOs) as the complete analytical sample.
Exclusion criteria: Matches would have been excluded if they ended in a draw, were not official tournament matches, or had missing or incomplete official technical statistics for the selected variables. No matches met these exclusion criteria.
Although 101 athletes were registered across the seven participating teams, individual anthropometric and sociodemographic data (age, height, body mass) were not made available for research purposes. Following a formal request submitted to both the tournament organising committee and all participating national teams, access to these data was declined on grounds of data confidentiality. Consequently, team-level match performance indicators served as the unit of analysis. This constraint is explicitly acknowledged as a limitation of the study (see the Limitations section).
Because the analytical sample comprised all 21 decisive matches of the tournament, an a priori sample size calculation was not performed. The sample size was determined by the fixed structure of the championship rather than by participant recruitment. Accordingly, all inferential analyses should be interpreted as exploratory and tournament-specific. The limited number of matches may have reduced the ability to detect small-to-moderate effects, particularly for non-significant variables.
2.3. Data Acquisition and Variable Operationalisation
Official performance data were obtained from the technical statistics records of the 2026 Asian U18 Men’s Water Polo Championship, provided by the tournament organising committee in structured spreadsheet format upon conclusion of the event. Data were compiled by trained tournament technical staff using the official technical recording procedures designated for the championship. No personal athlete data were collected or processed by the authors. The complete match results are presented in
Table 1. Seven match-level variables were extracted and operationally defined following previously established conventions in water polo performance analysis [
13,
14,
15,
16,
31]:
Goals Scored (GS): total goals scored per match per team;
Five-metre Goals (5 mG): goals converted from the 5-metre penalty position;
Five-metre Attempts (5 mA): total 5-metre penalty shots attempted;
Five-metre Conversion Rate (5 mCR): ratio of 5 mG to 5 mA, representing shooting efficiency from the penalty spot;
Power-Play Goals (PPGs): goals scored during 6-on-5 numerical superiority situations resulting from opponent exclusion;
Won Offensive Plays (WOPs): the number of offensive contested-play confrontations successfully won by the centre-forward player per match, recorded as outcomes resulting in maintained advantageous ball possession, an exclusion foul against the defender, or an immediate scoring opportunity; and
Ejections Committed (ECs): total temporary exclusion fouls received per match per team.
Table 1.
Complete match results of the 2026 Asian U18 Men’s Water Polo Championship (n = 21 matches).
Table 1.
Complete match results of the 2026 Asian U18 Men’s Water Polo Championship (n = 21 matches).
| No. | Stage | Team A | Score | Team B | Winner | Result |
|---|
| 1 | Group B | HKG | 8–28 | KAZ | KAZ | L–W |
| 2 | Group A | CHN | 12–15 | SGP | SGP | L–W |
| 3 | Group B | MAS | 17–9 | TPE | MAS | W–L |
| 4 | Group A | KOR | 5–26 | SGP | SGP | L–W |
| 5 | Group B | HKG | 21–12 | TPE | HKG | W–L |
| 6 | Group B | MAS | 6–18 | KAZ | KAZ | L–W |
| 7 | Group B | HKG | 16–14 | MAS | HKG | W–L |
| 8 | Group A | CHN | 24–8 | KOR | CHN | W–L |
| 9 | Group B | KAZ | 36–2 | TPE | KAZ | W–L |
| 10 | Consolation | KOR | 23–9 | TPE | KOR | W–L |
| 11 | Round 2 | SGP | 26–8 | HKG | SGP | W–L |
| 12 | Round 2 | KAZ | 14–16 | CHN | CHN | L–W |
| 13 | Consolation | MAS | 17–16 | KOR | MAS | W–L |
| 14 | Round 2 | HKG | 2–27 | CHN | CHN | L–W |
| 15 | Round 2 | KAZ | 14–15 | SGP | SGP | L–W |
| 16 | Consolation | MAS | 14–9 | TPE | MAS | W–L |
| 17 | Round 2 | SGP | 9–7 | CHN | SGP | W–L |
| 18 | Consolation | HKG | 1–28 | KAZ | KAZ | L–W |
| 19 | Consolation | MAS | 14–16 | KOR | KOR | L–W |
| 20 | 3rd Place | KAZ | 31–6 | HKG | KAZ | W–L |
| 21 | Final | SGP | 18–17 | CHN | SGP | W–L |
The authors did not independently re-code video footage. All data were screened for completeness and internal consistency prior to analysis. Regarding WOPs, the tournament technical staff applied the official technical recording procedures designated for the championship; the precise operational thresholds employed were not independently verified by the research team. Although this precludes full external reproducibility of the WOP variable, the official records represented the primary source of tournament performance data available for analysis. This constraint is acknowledged as a limitation (
Section 4). Comparisons with studies employing author-defined or alternative coding protocols should therefore be made with caution.
2.4. Statistical Analysis
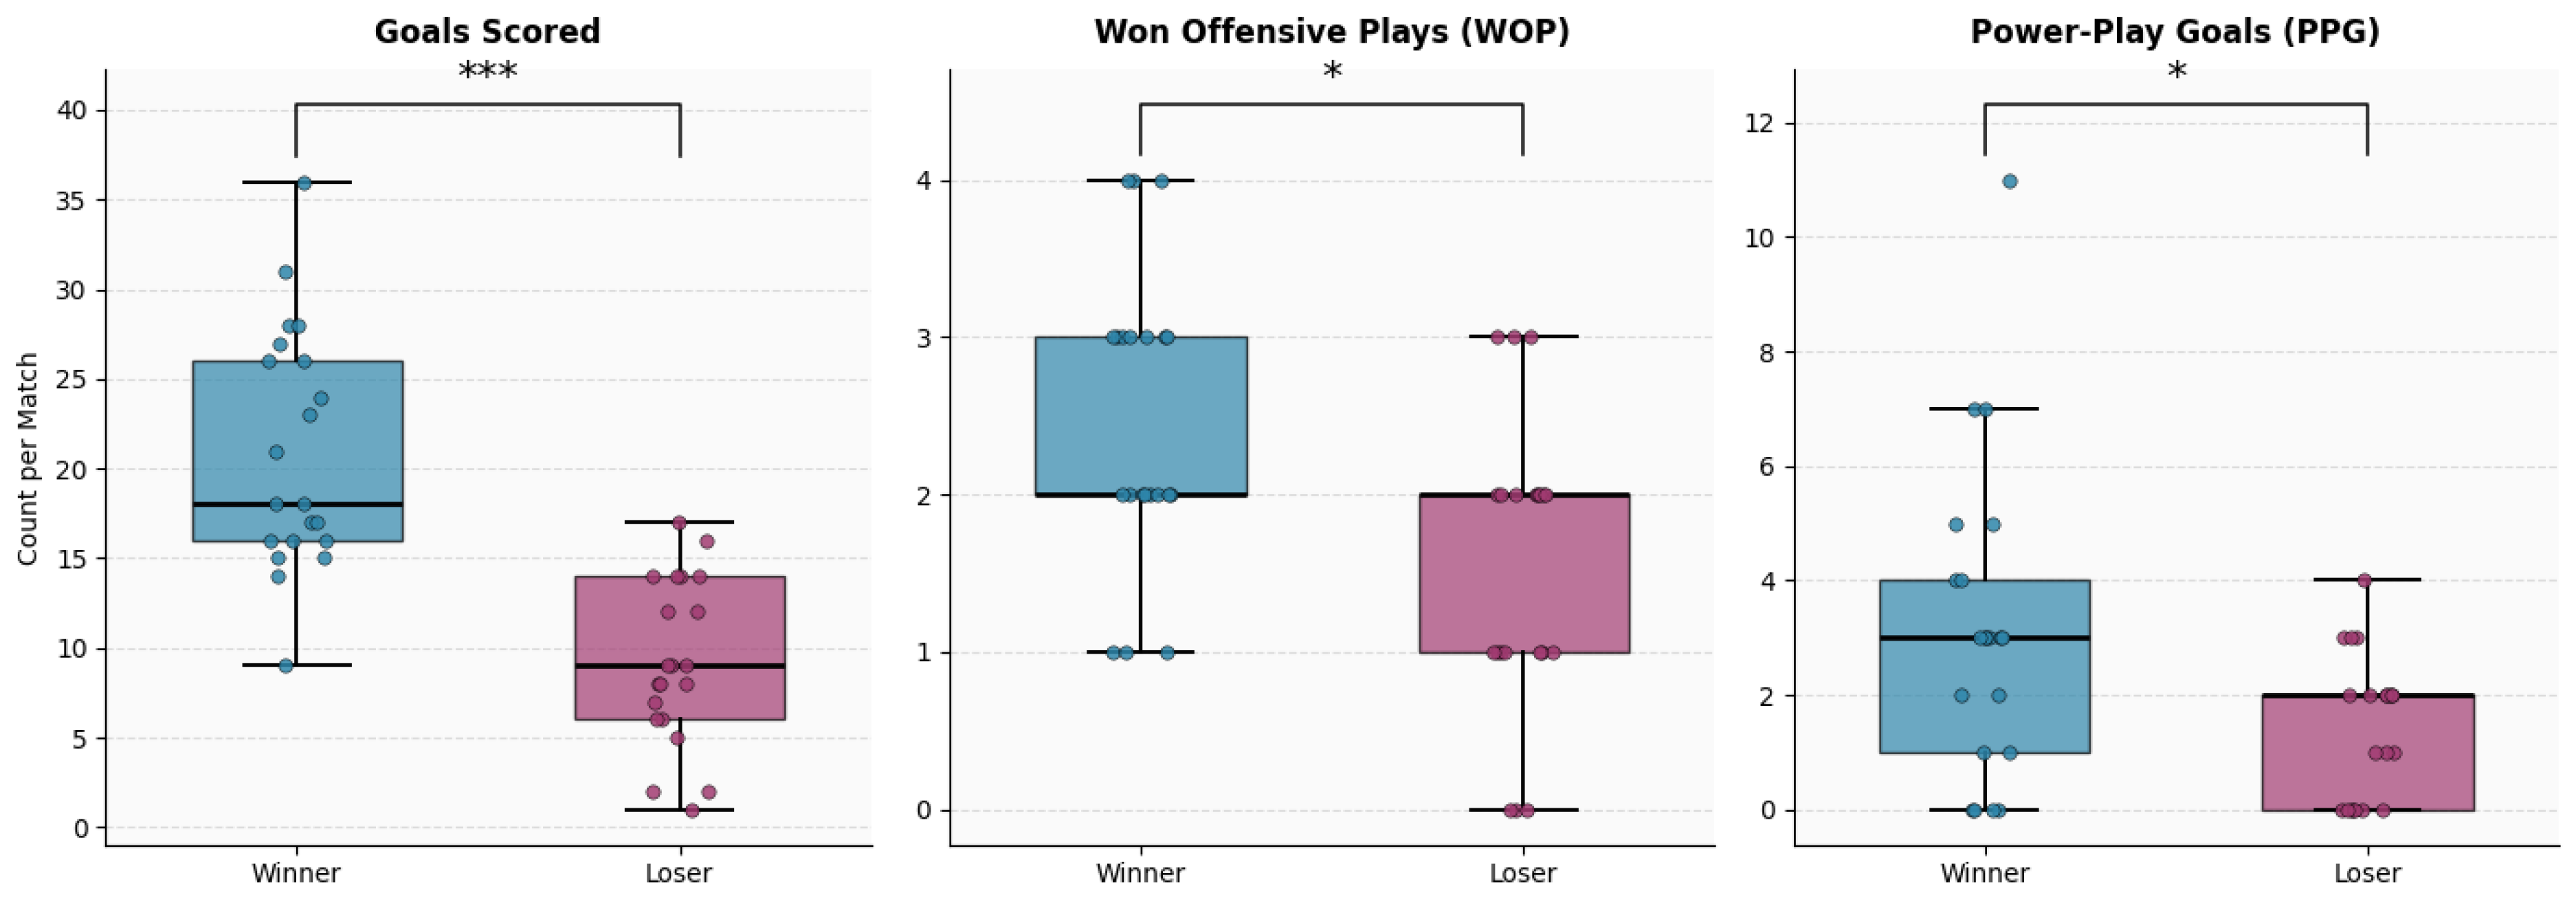
All statistical computations were performed in Python 3.11 using SciPy (v1.11.4), NumPy (v1.24.3), and pandas (v2.0). Figures 2–4 were generated using Matplotlib (v3.8.2) and Seaborn (v0.13.2).
- (i)
Descriptive Statistics. Continuous variables are reported as mean ± standard deviation (SD). Prior to inferential testing, distributional normality was assessed for each variable using the Shapiro–Wilk test (; n = 21 per group).
- (ii)
Between-Group Comparisons. Variables not deviating significantly from normality in either group (both
) were compared using independent-sample
t-tests; variables violating normality in either group were compared using Mann–Whitney U tests. Practical significance was quantified using Cohen’s d (benchmarked as small: 0.20–0.49; medium: 0.50–0.79; large: ≥0.80 [
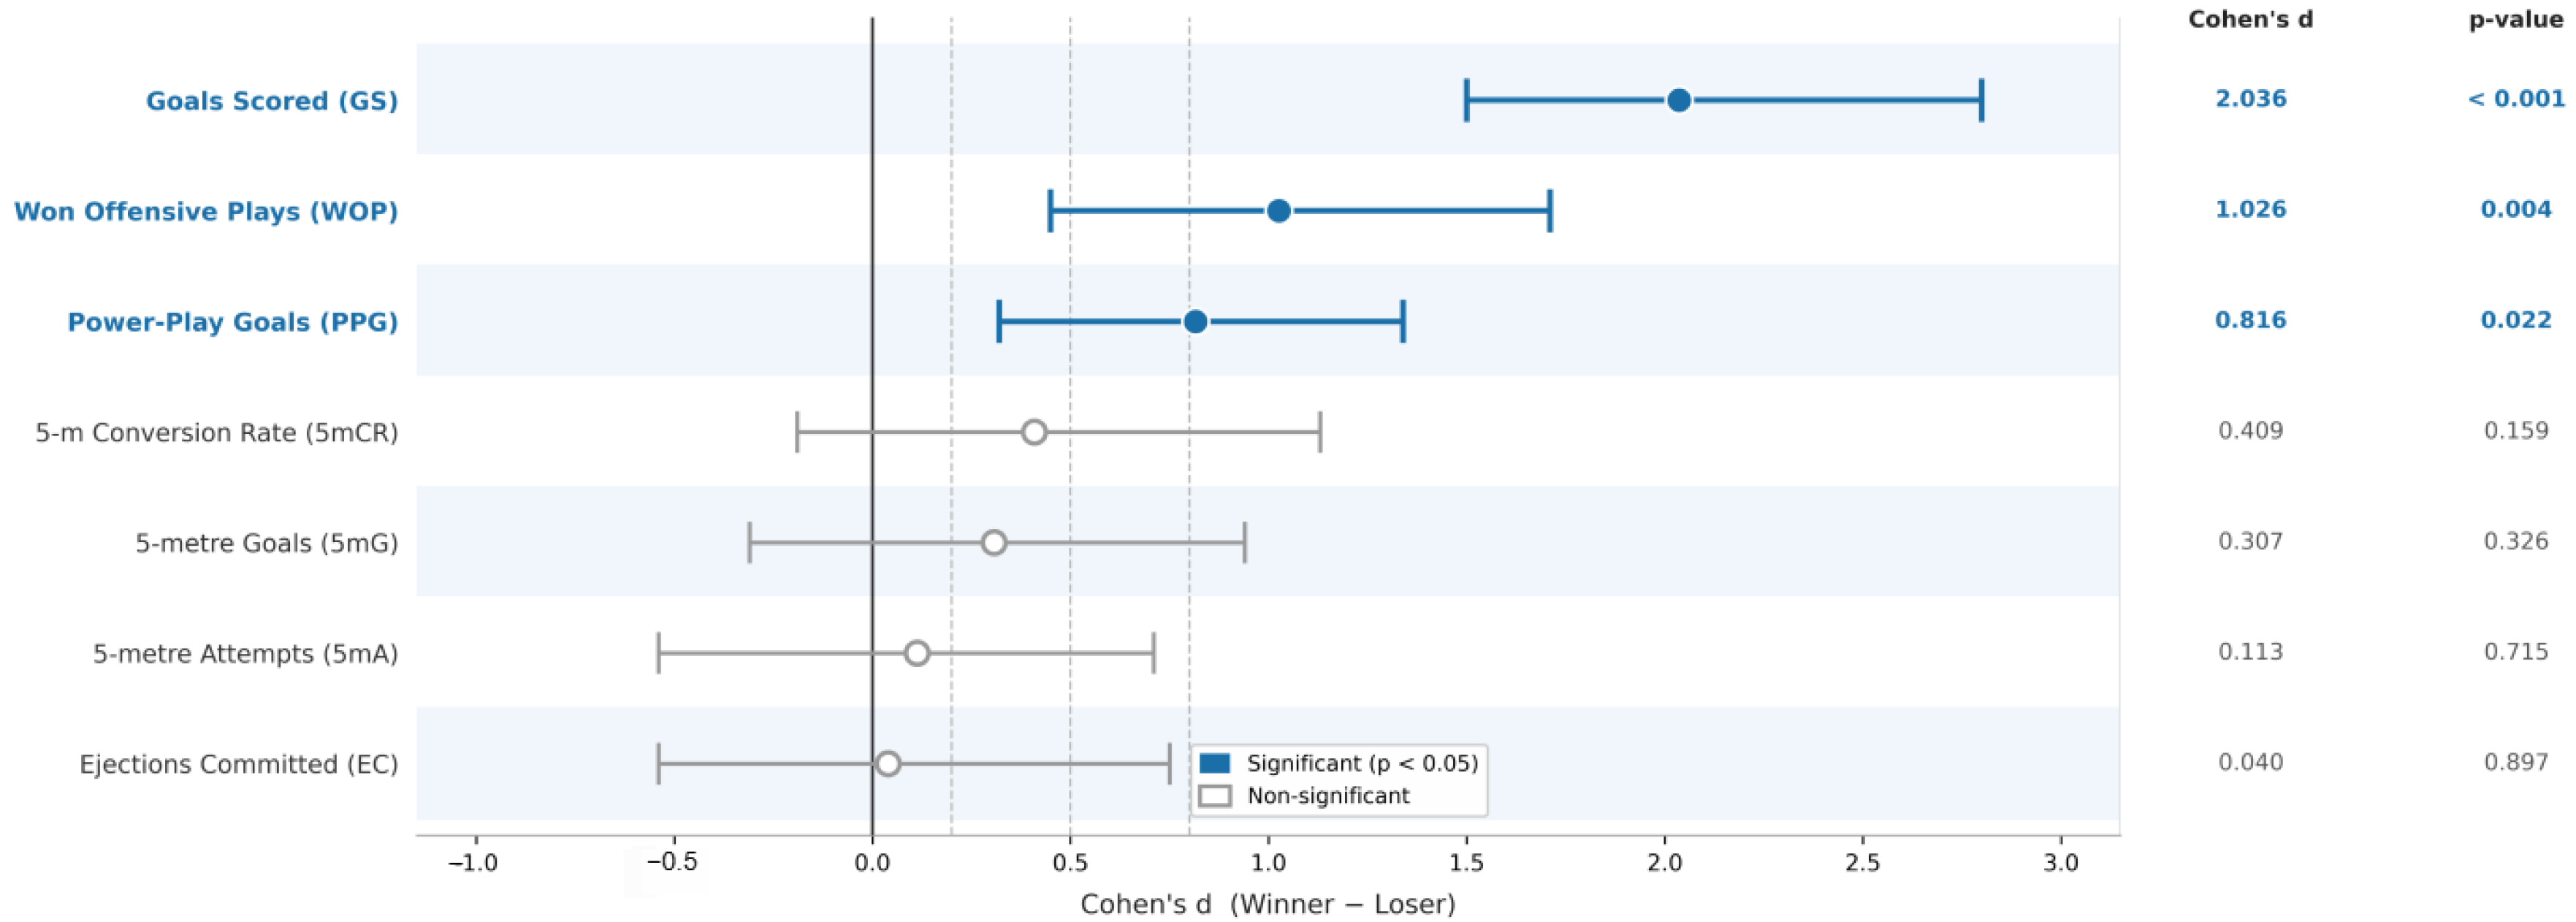
32]), calculated as a standardised mean difference for all variables for consistency, including those examined via Mann–Whitney U tests. These effect sizes were reported to facilitate comparison across variables rather than as assumptions of parametric testing. Bootstrapped 95% confidence intervals (bias-corrected and accelerated [BCa] method, 2000 iterations) were computed for each Cohen’s d estimate. The statistical significance threshold was set at
.
- (iii)
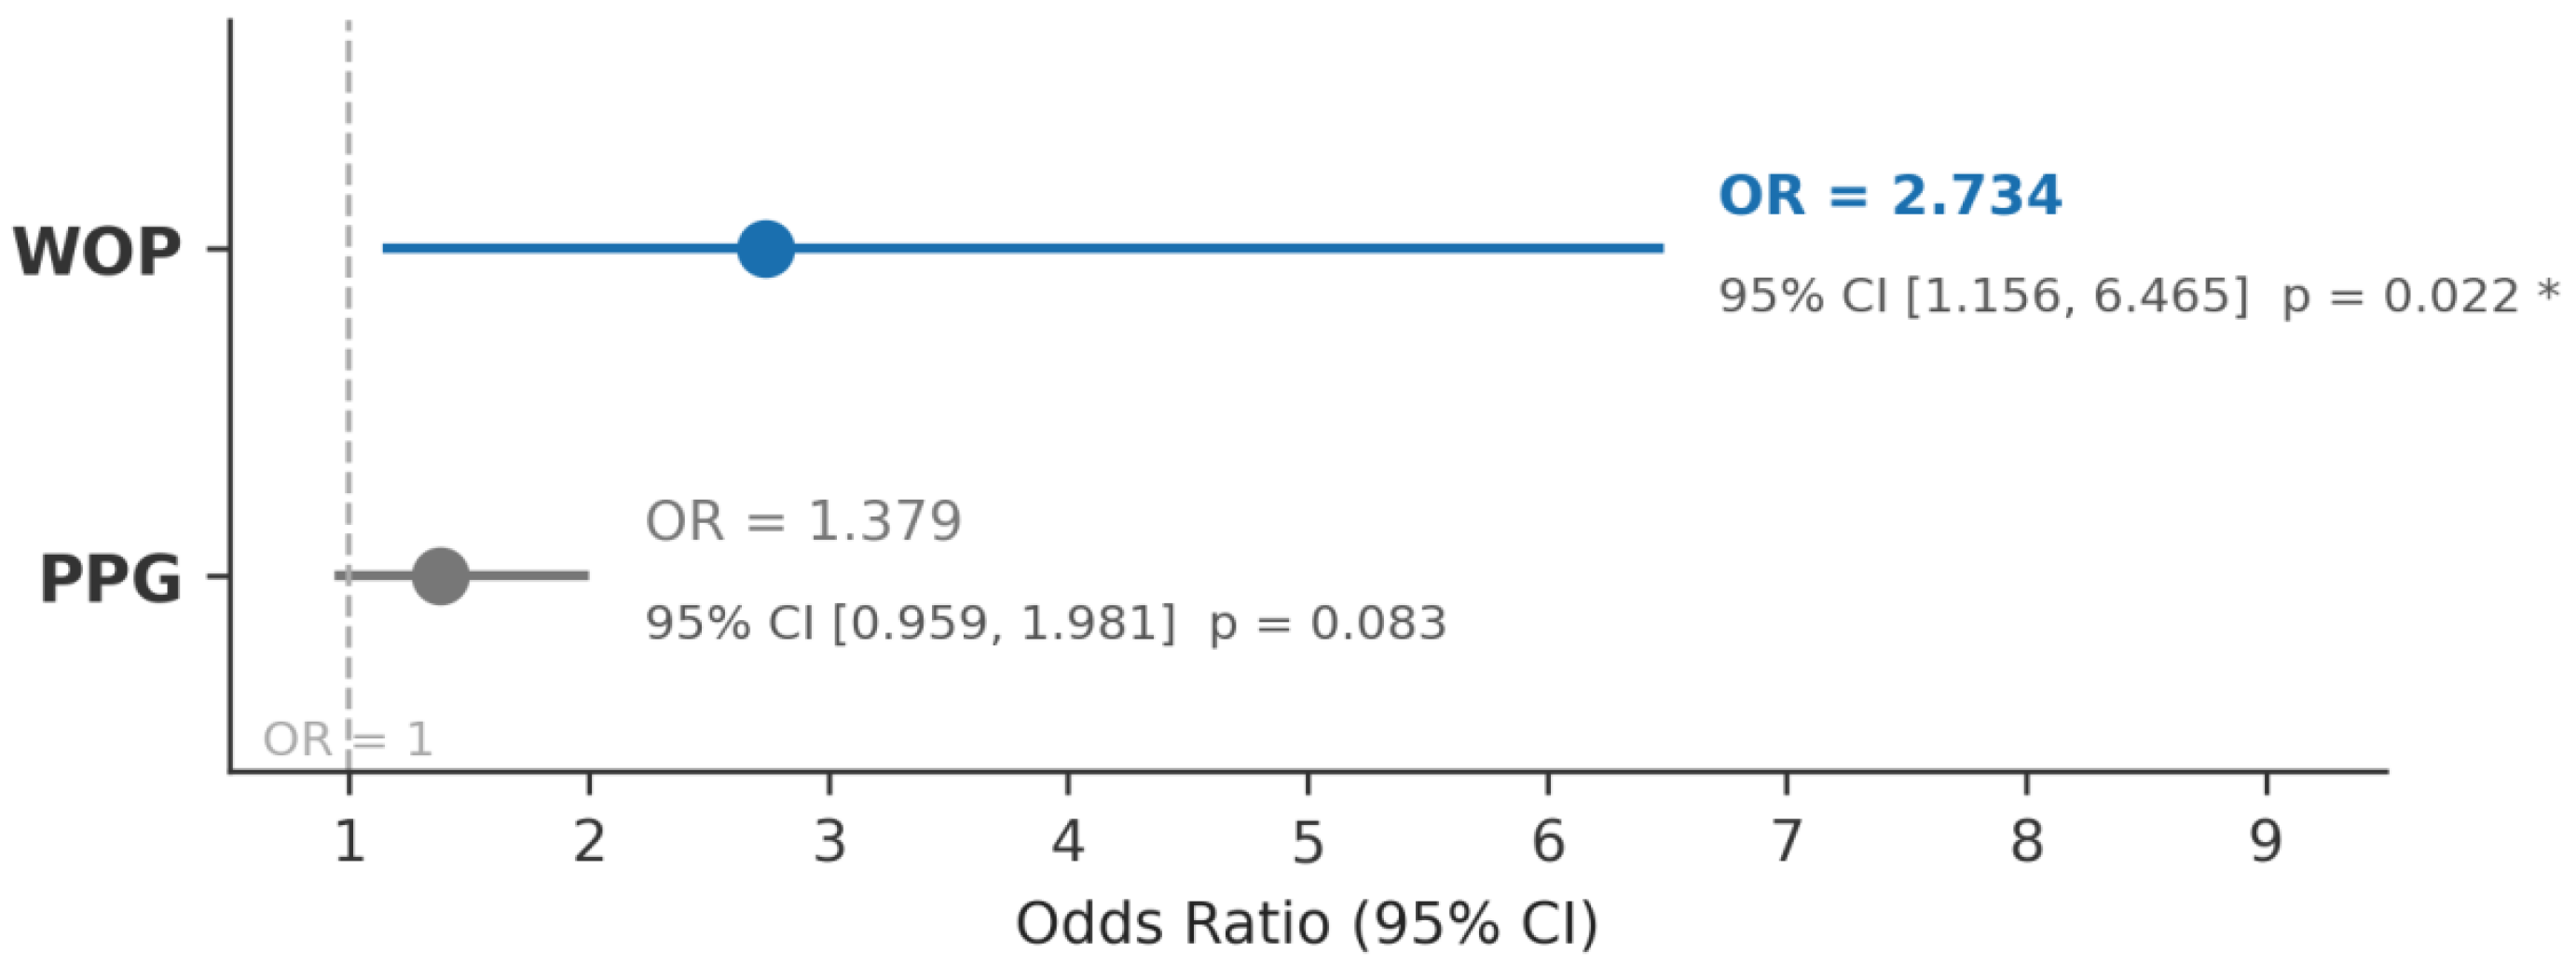
Binary Logistic Regression. An exploratory binary logistic regression (BLR) model (outcome: win = 1, loss = 0) was constructed to examine whether selected match-performance indicators were independently associated with match outcome. Candidate predictors were the significant non-circular discriminants identified in Stage ii: WOPs and PPGs. Goals Scored was excluded to avoid circular reasoning, as it is the direct determinant of match outcome. Prior to model fitting, multicollinearity between WOPs and PPGs was assessed via Spearman correlation and variance inflation factors (VIFs), with VIF
indicating acceptable collinearity. Model parameters (regression coefficient B, standard error SE, Wald
, odds ratio OR, and 95% CI for OR) were estimated by maximum likelihood optimisation (BFGS algorithm). Model fit was evaluated using the likelihood-ratio chi-square statistic, Nagelkerke pseudo-R
2, and the Hosmer–Lemeshow goodness-of-fit test [
33]; overall classification accuracy was also reported.
The model included two predictors and 21 win events, corresponding to an EPV of approximately 10.5, which approximates the commonly cited heuristic threshold of 10 events per predictor [
34]. Nonetheless, given the limited sample size, repeated appearances by the same teams across tournament rounds, and the paired match structure of the dataset, all regression estimates should be interpreted as exploratory indicators of independent association within this specific tournament sample rather than as evidence of predictive generalisability to other contexts.
4. Discussion
The present study examined match-level performance indicators in an understudied Asian youth water polo context and identified three variables—Goals Scored, Won Offensive Plays (WOPs), and Power-Play Goals (PPGs)—that significantly differentiated winning from losing teams. When entered into an exploratory binary logistic regression model, WOPs emerged as the only independent correlate of match outcome. These findings provide preliminary tournament-specific evidence from an Asian U18 competition context and are interpreted within the broader tactical, physiological, and developmental framework of competitive youth water polo.
4.1. Won Offensive Plays: Physiological and Tactical Significance
WOPs showed the strongest independent association with winning in the present tournament. This result aligns with the tactical literature emphasising the strategic centrality of centre-forward play in elite water polo [
13,
16]. In tactical terms, successful centre-forward offensive-play confrontations may create direct or indirect advantages by maintaining advantageous possession, drawing exclusion fouls, or generating immediate scoring opportunities. Therefore, WOPs may capture a competition-relevant component of attacking effectiveness that is not fully represented by scoring statistics alone.
Beyond its tactical dimension, the importance of WOPs can also be interpreted in relation to the physiological and bioenergetic demands of centre-forward play. Water polo is commonly classified as a high-intensity intermittent sport requiring both aerobic and anaerobic energy pathways [
4,
35]. Match-level analyses have shown that water polo players sustain substantial cardiovascular and metabolic loads during competition, with exercise intensity varying according to playing duration and positional role [
4,
35]. Centre-forward players, in particular, are frequently exposed to sustained upper-body contact, repeated resistance against defenders, and explosive leg-drive actions that differ from the movement profile of perimeter players [
28,
36]. These demands suggest that WOP performance may reflect, in part, the interaction between technical skill, tactical positioning, strength, anaerobic power, and contact tolerance.
Previous research on the anthropometric and physiological profiles of water polo players has reported that centre-forward specialists often display greater body mass, upper-body strength characteristics, and short-duration power capacities than perimeter players [
28,
36,
37]. These characteristics are consistent with the explosive and contact-based demands of offensive-play confrontations. In the present tournament, the individual WOP data for CHN3 illustrate how position-specific offensive effectiveness may contribute to team-level attacking performance. However, because the present study did not include anthropometric, maturation, or physiological measurements, it cannot determine whether WOPs directly reflect physical development or position-specific maturation.
From a developmental perspective, youth water polo performance is influenced by anthropometric characteristics, motor abilities, aerobic fitness, anaerobic capacity, and maturation-related neuromuscular development [
37,
38]. The present findings suggest that WOP effectiveness may represent a useful competition-derived marker of centre-forward offensive effectiveness in youth water polo. Nevertheless, whether WOPs also reflect position-specific maturation or physical development should be examined in future studies integrating match statistics with anthropometric, maturity-status, and physiological assessments.
The available match statistics do not permit a causal interpretation of WOPs’ association with winning. The data indicate that victorious teams recorded more successful offensive-play outcomes, but the possession sequences and physical interactions through which these actions were converted into goals, exclusions, or tactical advantages remain undocumented. WOPs should therefore be interpreted as an associated tournament-level competition indicator rather than a demonstrated causal mechanism.
4.2. Power-Play Goals: Bioenergetic and Rule-Context Considerations
The significant bivariate association between PPGs and match outcome, with a large effect size consistent with prior international benchmarks, aligns with evidence from Olympic, World Championship, and international women’s competition contexts [
14,
15,
16,
39]. Six-on-five numerical advantage situations are tactically important because they require rapid ball circulation, positional coordination, technical accuracy, and decision-making under defensive pressure. These short high-intensity phases may place substantial demands on anaerobic energy pathways, particularly the phosphocreatine and glycolytic systems, while also requiring players to maintain technical precision under time pressure [
4,
35]. Recent work on time-out use before power-play situations has further examined whether coaches gain a tactical advantage by interrupting play before man-up execution, highlighting the practical importance of power-play management in water polo [
40].
Contemporary rule modifications have increased the tactical and temporal demands of six-on-five execution, potentially magnifying differences in technical and decision-making efficiency between teams [
20,
21,
22]. The PPG advantage recorded by winning teams in the present study is consistent with the view that power-play execution remains a meaningful discriminating factor in youth water polo. At the U18 level, where position-specific conditioning, tactical experience, and technical consistency are still developing, differences in power-play execution may have substantial match-level relevance.
Once WOPs were included in the exploratory regression model, PPGs no longer retained independent significance (). A plausible interpretation is that WOPs and PPGs partially share attacking variance, as successful centre-forward confrontations may lead to exclusion fouls and subsequent power-play opportunities. However, this sequential relationship was not directly measured in the present dataset and should be regarded as a hypothesis for future investigation rather than a demonstrated mechanism. The overlap between WOPs and PPGs may reflect the integrated tactical structure of centre-forward-driven offences, in which effective offensive-play confrontations contribute to downstream scoring opportunities across multiple statistical categories.
4.3. Non-Discriminating Variables: Five-Metre Penalties and Ejections
The absence of significant differences in 5-metre Goals, 5-metre Attempts, 5-metre Conversion Rate, and Ejections Committed is notable and warrants tactical interpretation. Although 5-metre penalties represent high-probability scoring opportunities, their discriminating value may be limited in a small tournament sample by variability in goalkeeper performance, shooter technique under pressure, and the relatively low frequency of penalty situations. More generally, research on youth team-sport decision-making indicates that decision-making processes vary by age, expertise, and training exposure, which may partly explain technical inconsistency in high-pressure match situations [
41].
Similarly, the absence of a significant difference in Ejections Committed suggests that the overall number of temporary exclusions received was broadly comparable between winning and losing teams. This finding may reflect similar foul exposure across teams, the officiating characteristics of the tournament, or the developmental stage of tactical fouling as a deliberate defensive strategy. However, because the present study relied on official aggregate statistics, a more refined interpretation of penalty generation, goalkeeper effectiveness, defensive pressure, and foul-management tactics was not possible. Future studies incorporating event-sequence data and video-based coding would enable a more precise disaggregation of these variables.
4.4. Developmental and Physiological Context of Youth Water Polo
The present findings should be contextualised within the developmental and physiological characteristics of youth competitive water polo. Compared with senior athletes, U18 water polo players may still be undergoing substantial development in aerobic capacity, anaerobic power, strength, body composition, and tactical decision-making [
37,
38]. Training loads and competition demands at this age group should therefore be understood against a background of ongoing physical maturation rather than stable adult physiological profiles.
The bioenergetic profile of water polo involves a complex interaction between aerobic energy supply during continuous play and rapid anaerobic recruitment during explosive contact situations, shooting actions, transitions, and defensive efforts [
4,
35]. Centre-forward play, where WOP events occur, represents one of the most physically demanding tactical roles within a match, combining repeated contact actions, upper-body resistance, leg-drive force production, and short bursts of high-intensity effort [
28,
36]. At the U18 level, the ability to tolerate and recover from these repeated contact-loading events may plausibly influence WOP effectiveness, although this interpretation cannot be directly tested using the present aggregate dataset.
Maturational and neuromuscular development during adolescence may further influence the capacity for repeated explosive contact performance [
38]. Future longitudinal research combining match-derived WOP statistics with maturity-status assessment, anthropometry, strength and anaerobic power testing, and movement analysis would substantially advance understanding of how youth centre-forward development relates to competitive match performance.
4.5. Methodological Considerations
The model fit statistics and classification results indicate that a two-predictor framework captured a meaningful portion of match-outcome variance within this specific tournament sample. Nevertheless, these values should not be over-interpreted. The regression model was estimated on a competition-specific dataset characterised by a small sample size, non-independence of observations, paired winner–loser data derived from the same matches, and repeated team appearances across tournament rounds. In addition, the model was developed and evaluated on the same dataset, and the reported classification accuracy should therefore be treated as descriptive of the present sample rather than as evidence of robust predictive generalisability.
Future tournament-spanning analyses should consider mixed-effects models, multilevel modelling frameworks, or generalised estimating equations to more appropriately handle non-independence arising from repeated team appearances and paired match structures. Such approaches would allow researchers to distinguish more clearly between team-level tendencies, match-specific effects, and broader performance indicators associated with winning across multiple competitions.
4.6. Implications for Coaching, Performance Analysis, and Talent Development
From an applied and performance-science perspective, the association between WOPs and match outcome has several practical implications for youth water polo programmes. First, monitoring centre-forward offensive-play effectiveness may provide coaches with a competition-derived indicator that reflects both tactical execution and physical contest success. Specifically, WOP count and WOP win rate may serve as match-by-match feedback metrics for evaluating centre-forward performance across a training season or competition cycle, complementing conventional scoring statistics.
Second, the present findings support a more position-specific approach to performance analysis in Asian youth water polo. Youth development programmes may benefit from formalising WOP tracking within player evaluation protocols, particularly when this indicator is interpreted alongside scoring efficiency, power-play execution, defensive context, and match-stage information. Integrating competition-derived WOP data with laboratory or field-based assessments of anthropometry, upper-body strength, anaerobic capacity, and maturity status could provide a more comprehensive understanding of centre-forward developmental trajectories.
Third, the significant bivariate association between PPGs and winning reinforces the applied value of power-play training as a dedicated tactical component at the U18 level. Because power-play execution may partly co-vary with centre-forward effectiveness, coaches may achieve greater training transfer by integrating centre-forward offensive-play drills with six-on-five tactical sequences. Such combined sessions could emphasise drawing exclusions, rapid spacing adjustment, ball circulation, and finishing under time pressure.
However, the values reported in this study should be regarded as tournament-specific descriptive references for the 2026 Asian U18 Championship rather than normative benchmarks for broader talent identification or training prescription. Before such indicators are formally incorporated into development frameworks, they should be replicated across multiple tournament editions, age cohorts, and regional contexts, and evaluated under standardised coding protocols that enable cross-study comparability.
4.7. Limitations
Several limitations should be considered when interpreting the present findings. First, the study was restricted to a single tournament edition, which limits generalisability across seasons, age groups, competition levels, and regional contexts. Second, the analytical dataset was small and did not consist of fully independent observations: the same teams appeared repeatedly across tournament rounds, and winner–loser observations were paired within the same matches. As a result, standard inferential tests may not fully account for the clustered and paired structure of the data. Future studies with larger multi-tournament samples should consider mixed-effects models, multilevel models, or generalised estimating equations to more rigorously handle the non-independence of observations arising from repeated team appearances and paired match design.
Third, all variables were derived from official tournament statistics rather than independent video-based coding, and WOPs in particular followed competition-specific technical recording criteria that may differ from definitions used in other research contexts. This constraint limits cross-study comparability. Fourth, potentially informative performance indicators—including total shot attempts, possession sequences, goalkeeper performance, defensive pressure, and event-level tactical data—were unavailable, which necessarily restricted the explanatory scope of the model. Fifth, matches from different tournament stages were analysed within a single analytical framework, despite possible differences in competitive balance, tactical sophistication, and physical intensity across group, consolation, and medal rounds. Finally, individual athlete anthropometric, maturation, and physiological data were unavailable due to data confidentiality restrictions, precluding the integration of physical profiling with match-performance indicators. Such integration would substantially enrich the interpretation of WOPs and PPGs in future youth water polo research.
5. Conclusions
This study identified match-related key performance indicators associated with match outcomes in the 2026 Asian U18 Men’s Water Polo Championship, addressing a notable gap in the literature on Asian youth water polo. Won Offensive Plays (WOPs) emerged as the most robust independent correlate of winning, highlighting the tactical importance of centre-forward offensive-play effectiveness in this competitive context. These findings suggest that, beyond raw goal output, the ability to win contested offensive situations may provide meaningful added value for team performance at the U18 level.
The results offer tournament-specific and practically relevant insights for coaches and performance analysts working with Asian youth teams. Monitoring WOP-related indicators, including WOP count and WOP win rate, may help coaches evaluate centre-forward offensive effectiveness and design more targeted technical-tactical training. Such monitoring may be especially useful when integrated with power-play training, position-specific conditioning, and contextual match analysis.
Future research should replicate these observations across multiple tournament editions, age groups, and regional contexts. Studies using standardised video-coding protocols, event-sequence analysis, and individual physiological, anthropometric, and maturation-related data would provide a stronger basis for understanding how centre-forward offensive-play effectiveness relates to match performance and youth player development.
Overall, this work provides preliminary tournament-specific evidence for performance analysis in an understudied Asian youth water polo context. The findings may inform future coaching practice, competition analysis, and the gradual development of more evidence-based player evaluation frameworks in the region.