
Identification of Key Performance Indicators for T20—A Novel Hybrid Analytical Approach
 ,
,
Abstract
1. Introduction
2. Materials and Methods
2.1. Research Design
2.2. Data Description
2.3. Data Processing
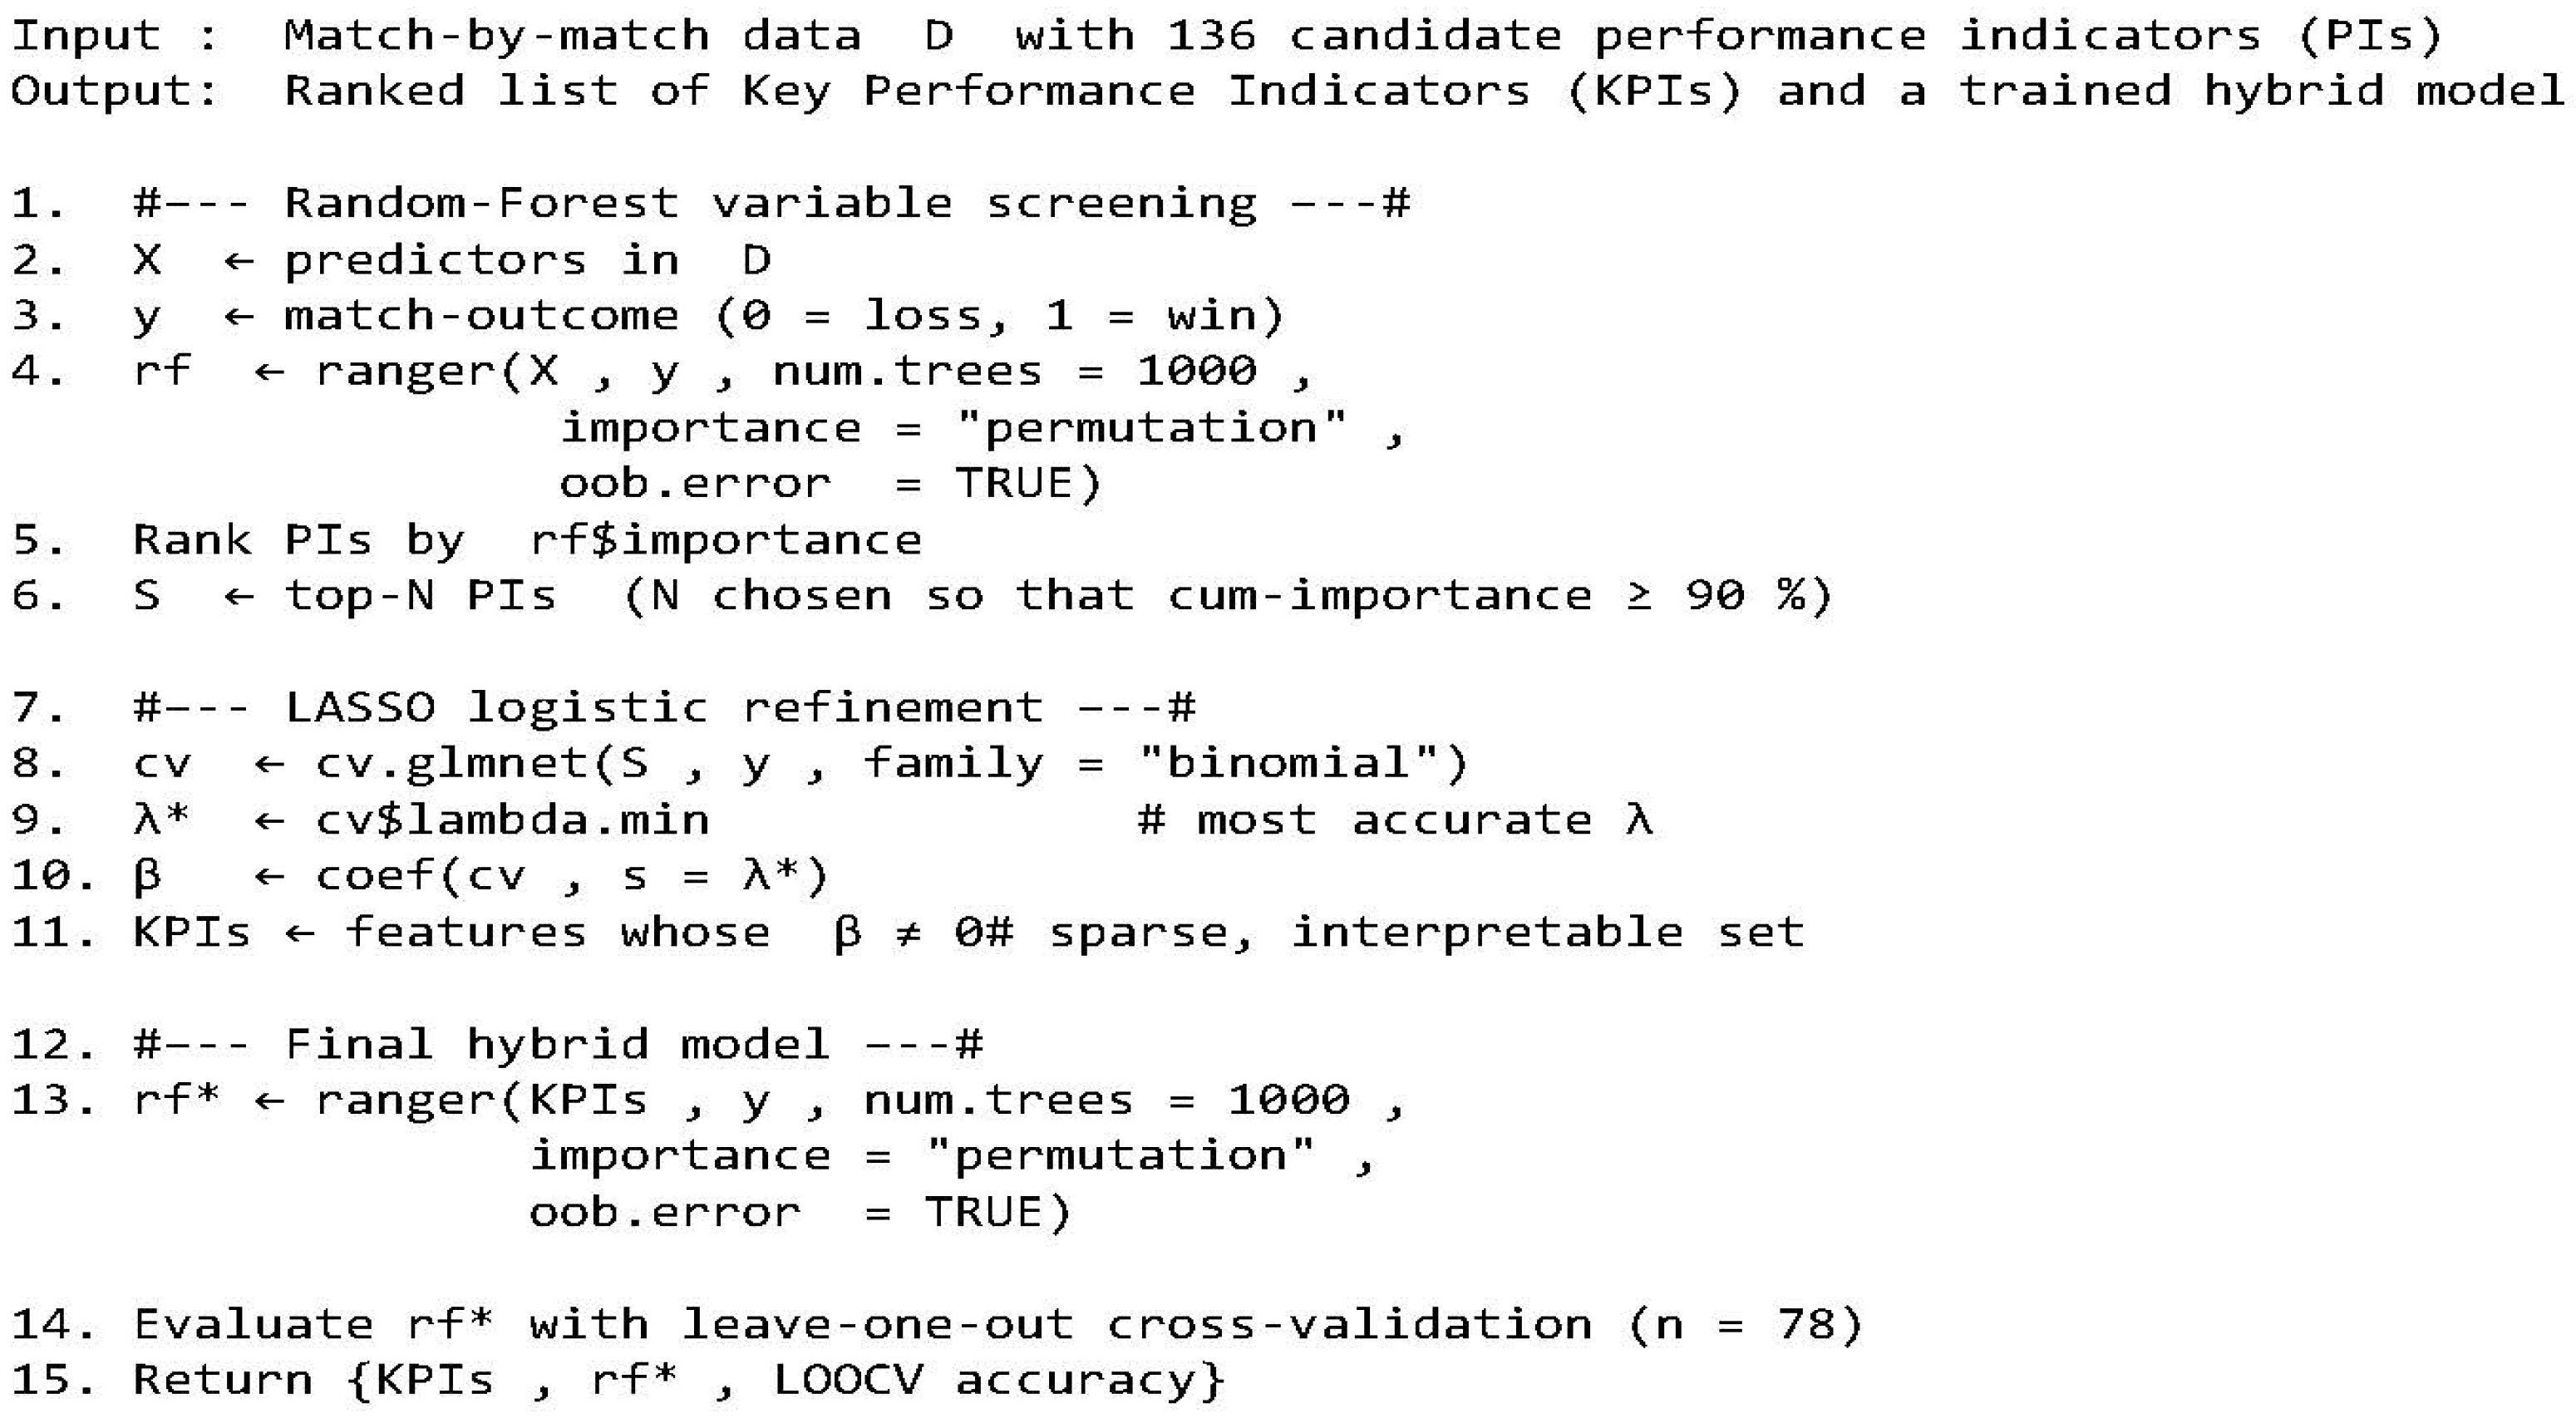
2.4. Data Analysis
3. Results
4. Discussion
4.1. Batting
4.2. Bowling
4.3. Fielding
4.4. Strengths of the Study
4.5. Limitations of the Study
5. Conclusions
Author Contributions
Funding
Institutional Review Board Statement
Informed Consent Statement
Data Availability Statement
Conflicts of Interest
Appendix A

| Performance Indicators | Variable Importance |
|---|---|
| Wicket lost in last six overs (15th–20th) Second Innings | 1.3125 |
| Bowlers taking 2+ wickets Second Innings | 0.9712 |
| Run rate 15th–20th overs Second Innings | 0.8193 |
| Wickets from Seam Second Innings | 0.8120 |
| Strike Rate last six overs 15th–20th overs Second Innings | 0.6538 |
| Inning Single % in ones Second Innings | 0.4848 |
| Wickets from Spin Second Innings | 0.4796 |
| Inning Boundary % in sixes First Innings | 0.4130 |
| Number of sixes First Innings | 0.4100 |
| Overs of seam bowled in last six overs (15th–20th) Second Innings | 0.3167 |
| Run rate 15th–20th overs First Innings | 0.2991 |
| Runs in the last six overs 15th–20th overs First Innings | 0.2911 |
| Sixes in 11th–14th overs First Innings | 0.2821 |
| Strike Rate last six overs 15th–20th overs First Innings | 0.2748 |
| Inning Single % in ones First Innings | 0.2742 |
| Strike Rate 11th–14th overs Second Innings | 0.2685 |
| Runs in the 11th–14th overs Second Innings | 0.2654 |
| Number of fours First Innings | 0.2535 |
| Dot balls in the 11th–14th overs Second Innings | 0.2492 |
| Runs in the 11th–14th overs First Innings | 0.2467 |
| Strike Rate 11th–14th overs First Innings | 0.2291 |
| Partnerships of 50+ runs Second Innings | 0.2186 |
| Inning Boundary % in sixes Second Innings | 0.2170 |
| Total number of catches Second Innings | 0.2157 |
| Dot ball First Innings | 0.2147 |
| Innings Dot ball % First Innings | 0.2098 |
| Dot ball Second Innings | 0.2086 |
| Runs scored by opening partnership First Innings | 0.2048 |
| Power play runs 0th–6th overs First Innings | 0.2047 |
| Total overs of seam bowled Second Innings | 0.1901 |
| Ones in the last six overs 15th–20th overs Second Innings | 0.1858 |
| Wicket lost in overs 7–10 Second Innings | 0.1559 |
| Strike Rate 0th–6th overs First Innings | 0.1550 |
| Dot balls 0th–6th overs First Innings | 0.1502 |
| Number of fours Second Innings | 0.1390 |
| Runs scored by opening partnership Second Innings | 0.1373 |
| Fours in 0th–6th overs First Innings | 0.1323 |
| Number of sixes Second Innings | 0.1298 |
| Number of twos First Innings | 0.1245 |
| Dot balls in the last six overs 15th–20th overs Second Innings | 0.1230 |
| Wickets lost in powerplay First Innings | 0.1228 |
| Dot balls 0th–6th overs Second Innings | 0.1223 |
| Sixes in the last six overs 15th–20th overs First Innings | 0.1202 |
| Ones in 0th–6th overs Second Innings | 0.1196 |
| Runs in the 7th–10th overs Second Innings | 0.1184 |
| Total number of catches First Innings | 0.1146 |
| Strike Rate 7th–10th overs Second Innings | 0.1113 |
| Power play runs 0th–6th overs Second Innings | 0.1087 |
| Number of ones Second Innings | 0.1085 |
| Total number of run outs Second Innings | 0.1036 |
| No Balls First Innings | 0.1013 |
| Sixes in 11th–14th overs Second Innings | 0.0925 |
| Fours in the last six overs 15th–20th overs First Innings | 0.0913 |
| Batsmen scoring 75 + runs Second Innings | 0.0892 |
| Strike Rate 0th–6th overs Second Innings | 0.0881 |
| Fours in 0th–6th overs Second Innings | 0.0857 |
| Wickets lost in powerplay Second Innings | 0.0837 |
| Ones in 7th–10th overs Second Innings | 0.0823 |
| 59 Wickets from Seam First Innings | 0.0816 |
| Total overs of spin bowled Second Innings | 0.0809 |
| Ones in 7th–10th overs First Innings | 0.0765 |
| Partnerships of 25–49 runs Second Innings | 0.0749 |
| Wickets from Spin First Innings | 0.0717 |
| Sixes in the last six overs 15th–20th overs Second Innings | 0.0716 |
| Number of threes Second Innings | 0.0707 |
| Runs in the last six overs 15th–20th overs Second Innings | 0.0696 |
| Batsmen scoring 50–74 runs First Innings | 0.0695 |
| Wicket lost in overs 7–10 First Innings | 0.0676 |
| Ones in 0th–6th overs First Innings | 0.0675 |
| Batsmen scoring 50–74 runs Second Innings | 0.0673 |
| Wicket lost in overs 11–14 Second Innings | 0.0670 |
| Bowlers taking 2+ wickets First Innings | 0.0651 |
| Partnerships of 50+ runs First Innings | 0.0639 |
| Number of fives First Innings | 0.0615 |
| Number of fives Second Innings | 0.0608 |
| LegByes Second Innings | 0.0599 |
| Partnerships of 25–49 runs First Innings | 0.0595 |
| Total number of run outs First Innings | 0.0595 |
| Overs of spin bowled in last six overs (15th–20th) Second Innings | 0.0581 |
| Fours in 7th–10th overs Second Innings | 0.0579 |
| Fours in the last six overs 15th–20th overs Second Innings | 0.0564 |
| Batsmen scoring 75+ runs First Innings | 0.0563 |
| Wicket lost in last six overs (15th–20th) First Innings | 0.0549 |
| Byes Second Innings | 0.0541 |
| Overs of seam bowled in overs 7–10 Second Innings | 0.0519 |
| Dot balls in the 7th–10th overs Second Innings | 0.0515 |
| Innings Dot ball % Second Innings | 0.0508 |
| LegByes First Innings | 0.0482 |
| Batsmen scoring 25–49 runs Second Innings | 0.0468 |
| Number of threes First Innings | 0.0465 |
| Sixes in 7th–10th overs First Innings | 0.0453 |
| Ones in the last six overs 15th–20th overs First Innings | 0.0451 |
| Wicket lost in overs 11–14 First Innings | 0.0442 |
| Overs of seam bowled in powerplay Second Innings | 0.0427 |
| Fours in 11th–14th overs Second Innings | 0.0423 |
| Dot balls in the 7th–10th overs First Innings | 0.0416 |
| Sixes in 0th–6th overs Second Innings | 0.0405 |
| Number of ones First Innings | 0.0387 |
| Overs of spin bowled in powerplay First Innings | 0.0380 |
| Byes First Innings | 0.0377 |
| No Balls Second Innings | 0.0360 |
| Batsmen scoring 25–49 runs First Innings | 0.0356 |
| Sixes in 7th–10th overs Second Innings | 0.0343 |
| Overs of spin bowled in overs 7–10 Second Innings | 0.0342 |
| Sixes in 0th–6th overs First Innings | 0.0339 |
| Overs of seam bowled in last six overs (15th–20th) First Innings | 0.0332 |
| Overs of seam bowled in powerplay First Innings | 0.0328 |
| Overs of seam bowled in overs 7–10 First Innings | 0.0318 |
| Overs of spin bowled in overs 7–10 First Innings | 0.0312 |
| Fours in 11th–14th overs First Innings | 0.0306 |
| Overs of seam bowled in overs 11–14 Second Innings | 0.0290 |
| Overs of spin bowled in last six overs (15th–20th) First Innings | 0.0287 |
| Overs of spin bowled in overs 11–14 First Innings | 0.0283 |
| Total overs of seam bowled First Innings | 0.0279 |
| Innings boundary % in fours Second Innings | 0.0266 |
| Overs of seam bowled in overs 11–14 First Innings | 0.0265 |
| Overs of spin bowled in powerplay Second Innings | 0.0263 |
| Extras Second Innings | 0.0258 |
| Strike Rate 7th–10th overs First Innings | 0.0245 |
| Dot balls in the last six overs 15th–20th overs First Innings | 0.0237 |
| Fours in 7th–10th overs First Innings | 0.0233 |
| Overs of spin bowled in overs 11–14 Second Innings | 0.0233 |
| Dot balls in the 11th–14th overs First Innings | 0.0231 |
| Extras First Innings | 0.0227 |
| Total overs of spin bowled First Innings | 0.0226 |
| Wides Second Innings | 0.0183 |
| Ones in 11th–14th overs Second Innings | 0.0178 |
| Innings boundary % in fours First Innings | 0.0159 |
| Ones in 11th–14th overs First Innings | 0.0109 |
| Runs in the 7th–10th overs First Innings | 0.0053 |
| Number of twos Second Innings | 0.0020 |
| Wides First Innings | 0.0020 |
| Performance Indicators | Feature Coefficient |
|---|---|
| Wicket lost in last six overs (15th–20th) Second Innings | 0.50114 |
| Bowlers taking 2+ wickets Second Innings | 0.25384 |
| Run rate 15th–20th overs Second Innings | 0.15770 |
| Wickets from Seam Second Innings | 0.12563 |
| Inning Single % in ones Second Innings | 0.11829 |
| Sixes in 11th–14th overs First Innings | 0.11057 |
| Wickets from Spin Second Innings | 0.07084 |
| Batting Strike Rate last six overs 15th–20th overs Second Innings | 0.01158 |
| Inning Boundary % in sixes First Innings | –0.01141 |
| Overs of seam bowled in last six overs (15th–20th) Second Innings | –0.01299 |
| Strike Rate last six overs 15th–20th overs First Innings | –0.02058 |
| Runs in the last six overs 15th–20th overs First Innings | –0.05339 |
| Total number of catches in Second Innings | –0.06194 |
| Number of sixes First Innings | –0.08274 |
| Run rate 15th–20th overs First Innings | –0.09664 |
| Partnerships of 50+ runs in the Second Innings | –0.13322 |
| Strike Rate 0th–6th overs First Innings | –0.14433 |
| Power play runs 0th–6th overs First Innings | –0.19465 |
| Performance Indicators | Importance |
|---|---|
| Wicket lost in last six overs (15th–20th) Second Innings | 0.02613 |
| Bowlers taking 2+ wickets Second Innings | 0.01957 |
| Run rate 15th–20th Overs Second Innings | 0.01302 |
| Wickets from Seam Second Innings | 0.01216 |
| Strike Rate last six overs 15th–20th overs Second Innings | 0.00916 |
| Inning Single % in ones Second Innings | 0.00729 |
| Wickets from Spin Second Innings | 0.00542 |
| Inning Boundary % in sixes First Innings | 0.00469 |
| Number of sixes First Innings | 0.00392 |
| Overs of seam bowled in last six overs (15th–20th) Second Innings | 0.00355 |
| Runs in the last six overs 15th–20th overs First Innings | 0.00344 |
| Strike Rate last six overs 15th–20th overs First Innings | 0.00341 |
| Sixes in 11th–14th overs First Innings | 0.00262 |
| Inning Single % in ones First Innings | 0.00260 |
| Number of fours First Innings | 0.00244 |
| Run rate 15th–20th overs First Innings | 0.00230 |
| Total number of catches Second Innings | 0.00221 |
| Strike Rate 11th–14th overs First Innings | 0.00205 |
| Dot balls in the 11th–14th overs Second Innings | 0.00191 |
| Strike Rate 11th–14th overs Second Innings | 0.00179 |
| Runs in the 11th–14th overs First Innings | 0.00178 |
| Runs in the 11th–14th overs Second Innings | 0.00170 |
| Dot ball Second Innings | 0.00143 |
| Partnerships of 50+ runs Second Innings | 0.00141 |
| Strike Rate 0th–6th overs First Innings | 0.00140 |
| Innings Dot ball % First Innings | 0.00139 |
| Runs scored by opening partnership First Innings | 0.00137 |
| Dot balls 0th–6th overs First Innings | 0.00128 |
| Dot ball First Innings | 0.00117 |
| Ones in the last six overs 15th–20th overs Second Innings | 0.00109 |
| Inning Boundary % in sixes Second Innings | 0.00101 |
| Power play runs 0th–6th overs First Innings | 0.00096 |
| Wicket lost in overs 7–10 Second Innings | 0.00088 |
| Number of twos First Innings | 0.00085 |
| Number of fours Second Innings | 0.00082 |
| Dot balls 0th–6th overs Second Innings | 0.00075 |
| Total overs of seam bowled Second Innings | 0.00072 |
| Ones in 0th–6th overs Second Innings | 0.00067 |
| Fours in 0th–6th overs First Innings | 0.00065 |
| wickets lost in powerplay First Innings | 0.00058 |
| Number of sixes Second Innings | 0.00048 |
| Dot balls in the last six overs 15th–20th overs Second Innings | 0.00042 |
| Runs scored by opening partnership Second Innings | 0.00042 |
| Sixes in the last six overs 15th–20th overs First Innings | 0.00036 |
| Ones in 7th–10th overs Second Innings | 0.00036 |
| Strike Rate 7th–10th overs Second Innings | 0.00030 |
| Fours in 0th–6th overs Second Innings | 0.00029 |
| Total number of run outs Second Innings | 0.00027 |
| Ones in 0th–6th overs First Innings | 0.00027 |
| No Balls First Innings | 0.00027 |
| Total overs of spin bowled Second Innings | 0.00021 |
| Number of threes Second Innings | 0.00020 |
| wickets lost in powerplay Second Innings | 0.00020 |
| Runs in the 7th–10th overs Second Innings | 0.00020 |
| Sixes in 11th–14th overs Second Innings | 0.00019 |
| Innings Dot ball % Second Innings | 0.00019 |
| Number of ones Second Innings | 0.00018 |
| Partnerships of 25–49 runs Second Innings | 0.00017 |
| Strike Rate 0th–6th overs Second Innings | 0.00017 |
| Batsmen scoring 50–74 runs First Innings | 0.00014 |
| Power play runs 0th–6th overs Second Innings | 0.00013 |
| Batsmen scoring 75+ runs Second Innings | 0.00012 |
| Sixes in the last six overs 15th–20th overs Second Innings | 0.00009 |
| Batsmen scoring 25–49 runs Second Innings | 0.00009 |
| Total number of catches First Innings | 0.00007 |
| Ones in 7th–10th overs First Innings | 0.00004 |
| Batsmen scoring 50–74 runs Second Innings | 0.00004 |
| Bowlers taking 2+ wickets First Innings | 0.00004 |
| Wickets from Spin First Innings | 0.00003 |
| Fours in the last six overs 15th–20th overs First Innings | 0.00002 |
| LegByes Second Innings | 0.00002 |
| Wickets from Seam First Innings | 0.00002 |
| Overs of seam bowled in powerplay Second Innings | 0.00001 |
| Partnerships of 50+ runs First Innings | 0.00000 |
| Number of fives First Innings | 0.00000 |
| Number of fives Second Innings | 0.00000 |
| Wicket lost in overs 7–10 First Innings | −0.00001 |
| Overs of spin bowled in overs 7–10 Second Innings | −0.00001 |
| Ones in the last six overs 15th–20th overs First Innings | −0.00001 |
| Partnerships of 25–49 runs First Innings | −0.00001 |
| Fours in 7th–10th overs First Innings | −0.00001 |
| Batsmen scoring 75+ runs First Innings | −0.00002 |
| Wicket lost in overs 11–14 Second Innings | −0.00004 |
| Number of ones First Innings | −0.00005 |
| Fours in 7th–10th overs Second Innings | −0.00005 |
| Overs of seam bowled in last six overs (15th–20th) First Innings | −0.00005 |
| Overs of spin bowled in overs 11–14 First Innings | −0.00005 |
| Dot balls in the last six overs 15th–20th overs First Innings | −0.00005 |
| Sixes in 7th–10th overs First Innings | −0.00007 |
| Wicket lost in last six overs (15tht–20h) First Innings | −0.00007 |
| Wicket lost in overs 11–14 First Innings | −0.00007 |
| Dot balls in the 7th–10th overs Second Innings | −0.00008 |
| Overs of spin bowled in last six overs (15th–20th) Second Innings | −0.00008 |
| Sixes in 0th–6th overs Second Innings | −0.00009 |
| Total number of run outs First Innings | −0.00009 |
| Number of twos Second Innings | −0.00009 |
| Fours in 11th–14th overs Second Innings | −0.00009 |
| Number of threes First Innings | −0.00010 |
| LegByes First Innings | −0.00010 |
| Byes Second Innings | −0.00010 |
| Overs of spin bowled in overs 11–14 Second Innings | −0.00011 |
| Overs of seam bowled in powerplay First Innings | −0.00011 |
| Overs of seam bowled in overs 7–10 Second Innings | −0.00013 |
| Overs of seam bowled in overs 11–14 Second Innings | −0.00013 |
| Overs of spin bowled in overs 7–10 First Innings | −0.00014 |
| Sixes in 7th–10th overs Second Innings | −0.00014 |
| Ones in 11th–14th overs First Innings | −0.00014 |
| Fours in the last six overs 15th–20th overs Second Innings | −0.00014 |
| Dot balls in the 7th–10th overs First Innings | −0.00015 |
| Overs of seam bowled in overs 7–10 First Innings | −0.00015 |
| Overs of spin bowled in powerplay Second Innings | −0.00015 |
| Wides Second Innings | −0.00016 |
| Runs in the 7th–10th overs First Innings | −0.00016 |
| Overs of spin bowled in powerplay First Innings | −0.00017 |
| Innings boundary % in fours Second Innings | −0.00017 |
| Sixes in 0th–6th overs First Innings | −0.00019 |
| Byes First Innings | −0.00019 |
| Overs of seam bowled in overs 11–14 First Innings | −0.00019 |
| No Balls Second Innings | −0.00020 |
| Total overs of spin bowled First Innings | −0.00020 |
| Overs of spin bowled in last six overs (15th–20th) First Innings | −0.00021 |
| Batsmen scoring 25–49 runs First Innings | −0.00023 |
| Wides First Innings | −0.00024 |
| Runs in the last six overs 15th–20th overs Second Innings | −0.00024 |
| Total overs of seam bowled First Innings | −0.00024 |
| Extras First Innings | −0.00024 |
| Strike Rate 7th–10th overs First Innings | −0.00026 |
| Dot balls in the 11th–14th overs First Innings | −0.00028 |
| Extras Second Innings | −0.00028 |
| Ones in 11th–14th overs Second Innings | −0.00029 |
| Fours in 11th–14th overs First Innings | −0.00033 |
| Innings boundary % in fours First Innings | −0.00035 |
References
- Anuraj, A.; Boparai, G.S.; Leung, C.K.; Madill, E.W.; Pandhi, D.A.; Patel, A.D.; Vyas, R.K. Sports data mining for cricket match prediction. In Advanced Information Networking and Applications; Barolli, L., Ed.; Springer: Cham, Switzerland, 2023; pp. 668–680. [Google Scholar] [CrossRef]
- Noorbhai, H. Cricket coaching and batting in the 21st century through a 4IR lens: A narrative review. BMJ Open Sport Exerc. Med. 2022, 8, e001435. [Google Scholar] [CrossRef] [PubMed]
- Colomer, C.M.; Pyne, D.B.; Mooney, M.; McKune, A.; Serpell, B.G. Performance analysis in rugby union: A critical systematic review. Sports Med.-Open 2020, 6, 1–5. [Google Scholar] [CrossRef] [PubMed]
- Lord, F.; Pyne, D.B.; Welvaert, M.; Mara, J.K. Field hockey from the performance analyst’s perspective: A systematic review. Int. J. Sports Sci. Coach. 2022, 17, 220–232. [Google Scholar] [CrossRef]
- Vella, A.; Clarke, A.C.; Kempton, T.; Ryan, S.; Coutts, A.J. Assessment of physical, technical, and tactical analysis in the Australian football league: A systematic review. Sports Med.-Open 2022, 8, 124. [Google Scholar] [CrossRef]
- Hughes, M.; Franks, I.; Franks, I.M.; Dancs, H. (Eds.) Essentials of Performance Analysis in Sport; Routledge: London, UK, 2019. [Google Scholar] [CrossRef]
- Lees, A. Science and the major racket sports: A review. J. Sports Sci. 2003, 21, 707–732. [Google Scholar] [CrossRef]
- Hughes, M.D.; Bartlett, R.M. The use of performance indicators in performance analysis. J. Sports Sci. 2002, 20, 739–754. [Google Scholar] [CrossRef]
- Wright, C.; Atkins, S.; Jones, B. An analysis of elite coaches’ engagement with performance analysis services. Int. J. Perform. Anal. Sport 2012, 12, 436–451. [Google Scholar] [CrossRef]
- Mittal, H.; Rikhari, D.; Kumar, J.; Singh, A.K. A study on machine learning approaches for player performance and match results prediction. arXiv 2021, arXiv:2108.10125.2021. [Google Scholar]
- Bhardwaj, D.; Dwyer, D.B. Team technical performance in elite men’s and women’s T20 cricket–determinants of performance within a match and across a season. Int. J. Perform. Anal. Sport 2022, 22, 277–290. [Google Scholar] [CrossRef]
- Douglas, M.J.; Tam, N. Analysis of team performances at the ICC World Twenty20 Cup 2009. Int. J. Perform. Anal. Sport 2010, 10, 47–53. [Google Scholar] [CrossRef]
- Irvine, S.; Kennedy, R. Analysis of performance indicators that most significantly affect International Twenty20 cricket. Int. J. Perform. Anal. Sport 2017, 17, 350–359. [Google Scholar] [CrossRef]
- Moore, A.; Turner, J.D.; Johnstone, A.J. A preliminary analysis of team performance in English first-class Twenty-Twenty (T20) cricket. Int. J. Perform. Anal. Sport 2012, 12, 188–207. [Google Scholar] [CrossRef]
- Najdan, J.M.; Robins, T.M.; Glazier, S.P. Determinants of success in English domestic Twenty20 cricket. Int. J. Perform. Anal. Sport 2014, 14, 276–295. [Google Scholar] [CrossRef]
- Petersen, C.; Pyne, D.B.; Portus, M.J.; Dawson, B. Analysis of Twenty/20 Cricket performance during the 2008 Indian Premier League. Int. J. Perform. Anal. Sport 2008, 8, 63–69. [Google Scholar] [CrossRef]
- Scholes, R.; Shafizadeh, M. Prediction of successful performance from fielding indicators in cricket: Champions League T20 tournament. Sports Technol. 2014, 7, 62–68. [Google Scholar] [CrossRef]
- Parmar, N.; James, N.; Hughes, M.; Jones, H.; Hearne, G. Team performance indicators that predict match outcome and points difference in professional rugby league. Int. J. Perform. Anal. Sport 2017, 17, 1044–1056. [Google Scholar] [CrossRef]
- Rouam, S. False Discovery Rate (FDR). In Encyclopedia of Systems Biology; Dubitzky, W., Wolkenhauer, O., Cho, K.H., Yokota, H., Eds.; Springer: Berlin/Heidelberg, Germany, 2013; pp. 731–736. [Google Scholar] [CrossRef]
- Tabachnick, B.G.; Fidell, L.S. Using Multivariate Statistics, 6th ed.; Pearson: Boston, MA, USA, 2013; pp. 481–498. [Google Scholar]
- Saikia, H.; Bhattacharjee, D.; Radhakrishnan, U.K. A new model for player selection in cricket. Int. J. Perform. Anal. Sport 2016, 16, 373–388. [Google Scholar] [CrossRef]
- Zhou, F.; Fan, H.; Liu, Y.; Zhang, H.; Ji, R. Hybrid model of machine learning method and empirical method for rate of penetration prediction based on data similarity. Appl. Sci. 2023, 13, 5870. [Google Scholar] [CrossRef]
- Lewis, A.J. Towards fairer measures of player performance in one-day cricket. J. Oper. Res. Soc. 2005, 56, 804–815. [Google Scholar] [CrossRef]
- Shah, P.; Shah, M. Pressure Index in Cricket. IOSR J. Sports Phys. Educ. 2014, 1, 9–11. [Google Scholar] [CrossRef]
- Lohse, K.R.; Sainani, K.L.; Taylor, J.A.; Butson, M.L.; Knight, E.J.; Vickers, A.J. Systematic review of the use of “magnitude-based inference” in sports science and medicine. PLoS ONE 2020, 15, e0235318. [Google Scholar] [CrossRef] [PubMed]
- McLean, S.; Kerhervé, H.A.; Stevens, N.; Salmon, P.M. A systems analysis critique of sport-science research. Int. J. Sports Physiol. Perform. 2021, 16, 1385–1392. [Google Scholar] [CrossRef] [PubMed]
- Saikia, H.; Bhattacharjee, D.; Mukherjee, D. Cricket Performance Management: Mathematical Formulation and Analytics; Springer: Berlin/Heidelberg, Germany, 2019; pp. 37–94. [Google Scholar] [CrossRef]
- Starbuck, C. Research Design. In The Fundamentals of People Analytics: With Applications in R; Springer International Publishing: Cham, Switzerland, 2023; pp. 51–57. [Google Scholar] [CrossRef]
- ESPNcricinfo 2021. Available online: https://www.espncricinfo.com/ (accessed on 28 April 2024).
- Cricsheet. T20 Cricket. Available online: https://cricsheet.org/ (accessed on 1 July 2021).
- Kordzadeh, N.; Ghasemaghaei, M. Algorithmic bias: Review, synthesis, and future research directions. Eur. J. Inf. Syst. 2022, 31, 388–409. [Google Scholar] [CrossRef]
- RStudio Open Source & Professional Software for Data Science Teams. Available online: https://www.rstudio.com/ (accessed on 1 September 2022).
- García, S.; Luengo, J.; Herrera, F. Data Preprocessing in Data Mining (Intelligent Systems Reference Library); Springer: Berlin/Heidelberg, Germany, 2015; pp. 36–55. [Google Scholar] [CrossRef]
- James, G.; Witten, D.; Hastie, T.; Tibshirani, R. An Introduction to Statistical Learning: With Applications in R; Springer: Berlin/Heidelberg, Germany, 2013. [Google Scholar] [CrossRef]
- Rokach, L. Decision forest: Twenty years of research. Inf. Fusion 2016, 27, 111–125. [Google Scholar] [CrossRef]
- Van Witteloostuijn, A.; Kolkman, D. Is firm growth random? A machine learning perspective. J. Bus. Ventur. Insights 2019, 11, e00107. [Google Scholar] [CrossRef]
- Hastie, T.; Tibshirani, R.; Friedman, J. The Elements of Statistical Learning, 2nd ed.; Springer: Berlin/Heidelberg, Germany, 2009; pp. 337–387. Available online: https://www.sas.upenn.edu/~fdiebold/NoHesitations/BookAdvanced.pdf (accessed on 29 April 2024).
- Breiman, L. Random forests. Mach. Learn. 2001, 45, 5–32. [Google Scholar] [CrossRef]
- Raju, V.S.; Sethi, N.; Rajender, R. A Review of Data Analytic Schemes for Prediction of Vivid Aspects in International Cricket Matches. In Proceedings of the 2019 5th International Conference on Computing, Communication, Control and Automation (ICCUBEA), Pune, India, 19–21 September 2019; IEEE: Piscataway, NJ, USA, 2019; pp. 1–4. [Google Scholar]
- Wickramasinghe, I. Applications of Machine Learning in cricket: A systematic review. Mach. Learn. Appl. 2022, 10, 100435. [Google Scholar] [CrossRef]
- Ahmed, W. A Multivariate Data Mining Approach to Predict Match Outcome in One-Day International Cricket. Master’s Dissertation, Karachi Institute of Economics and Technology, Karachi, Pakistan, 2015. [Google Scholar]
- Tripathi, A.; Islam, R.; Khandor, V.; Murugan, V. Prediction of IPL matches using Machine Learning while tackling ambiguity in results. Indian J. Sci. Technol. 2020, 13, 4013–4035. [Google Scholar] [CrossRef]
- Kapadia, K.; Abdel-Jaber, H.; Thabtah, F.; Hadi, W. Sport analytics for cricket game results using machine learning: An experimental study. Appl. Comput. Inform. 2022, 18, 256–266. [Google Scholar] [CrossRef]
- Rahman, M.M.; Shamim, M.O.; Ismail, S. An analysis of Bangladesh one day international cricket data: A machine learning approach. In Proceedings of the 2018 International Conference on Innovations in Science, Engineering and Technology (ICISET), Kuala Lumpur, Malaysia, 27–28 October 2018; IEEE: Piscataway, NJ, USA, 2018; pp. 190–194. [Google Scholar]
- Petersen, C.J. Comparison of performance at the 2007 and 2015 Cricket World Cups. Int. J. Sports Sci. Coach. 2017, 12, 404–410. [Google Scholar] [CrossRef]
- Jamil, M.; Kerruish, S.; Mehta, S.; Phatak, A.; Memmert, D.; McRobert, A. Identifying which factors impact bowling and batting performances during the “death” phase of an innings in international men’s 50-over cricket. Int. J. Perform. Anal. Sport 2023, 23, 111–124. [Google Scholar] [CrossRef]
- Modekurti, D.P. Setting final target score in T-20 cricket match by the team batting first. J. Sports Anal. 2020, 17, 205–213. [Google Scholar] [CrossRef]
- Ahmed, S. Game Theory in Cricket [Honours Thesis]. Colby University, USA. 2019. Available online: https://digitalcommons.colby.edu/honorstheses/918 (accessed on 28 April 2024).
- Talukdar, P. Investigating the Role of Opening Partners While Chasing on the Outcome of Twenty 20 Cricket Matches. Manag. Labour Stud. 2020, 45, 222–232. [Google Scholar] [CrossRef]
- Brown, P. Optimising Batting Partnership Strategy in the First Innings of a Limited Overs Cricket Match. Doctoral Dissertation, Victoria University of Wellington, Wellington, New Zealand, 2017. [Google Scholar]
- MacDonald, D.C.; Cronin, J.; Mills, J.; McGuigan, M.; Stretch, R. A review of cricket fielding requirements. S. Afr. J. Sports Med. 2013, 25, 87. [Google Scholar] [CrossRef]
- Norman, J.M.; Clarke, S.R. Dynamic programming in cricket: Optimizing batting order for a sticky wicket. J. Oper. Res Soc. 2007, 58, 1678–1682. [Google Scholar] [CrossRef]
- Davis, J.; Perera, H.; Swartz, T.B. A simulator for Twenty20 cricket. Aust. N. Z. J. Stat. 2015, 57, 55–71. [Google Scholar] [CrossRef]
- Perera, H.; Gill, P.S.; Swartz, T.B. Declaration guidelines in test cricket. J. Quant. Anal. Sports. 2014, 10, 15–26. [Google Scholar] [CrossRef]


| No. | Performance Indicators Features | Definition |
|---|---|---|
| General Match Indicators | ||
| 1 | Total run score | The total number of runs scored in an innings |
| 2 | Wickets | The total number of wickets taken in an innings |
| 3 | Extras | The total number of runs scored as extras in an innings |
| 4 | Leg byes | The total number of runs scored as leg byes in an innings |
| 5 | Wides | The total number of runs scored as wides in an innings |
| 6 | No Balls | The total number of runs scored as no balls in an innings |
| Team Performance Indicators | ||
| 7 | Match outcome | Whether a team won or lost a match ¶ |
| Batting Indicators | ||
| 8 | Runs scored by an opening partnership | The total number of runs scored by the opening batting partnership |
| 9 | Partnerships of 25–49 runs | The total number of 25–49 runs scored by a partnership in an innings |
| 10 | Partnerships of 50+ runs | The total number of 50 runs or more scored by a partnership in an innings |
| 11 | Batter scoring 25–49 runs | The total number of 25–49 runs scored by a batter in an innings |
| 12 | Batter scoring 50–74 runs | The total number of 50–74 runs scored by a batter in an innings |
| 13 | Batter scoring 75+ runs | The total number of 75 or more runs scored by a batter in an innings |
| 14 | Runs scored in powerplay (1st–6th overs) | The total runs scored in the powerplay phase of the 1st–6th overs |
| 15 | Batting strike rate in powerplay (1st–6th overs) ¶ | The average number of runs scored by a batter per 36 balls |
| 16 | Runs scored in the 7th–10th overs | The total runs scored in the powerplay phase in the 7th–10th overs |
| 17 | Batting strike rate in the 7th–10th overs ¶ | The average number of runs scored by a batter per 24 balls |
| 18 | Runs scored in the 11th–14th overs | The total runs scored in the powerplay phase 11th–14th overs |
| 19 | Batting strike rate in the 11th–14th overs ¶ | The average number of runs scored by a batter per 24 balls |
| 20 | Runs scored in the last six overs (15th–20th overs) | The total runs scored in the last six overs (15th–20th overs) |
| 21 | Batting strike rate in the last six overs (15th–20th overs) ¶ | The average number of runs scored by a batter per 36 balls |
| 22 | Number of sixes scored overall | The total number of runs scored as sixes in an innings |
| 23 | Number of fives scored | The total number of runs scored as fives in an innings |
| 24 | Number of fours scored | The total number of runs scored as fours in an innings |
| 25 | Number of threes scored | The total number of runs scored as threes in an innings |
| 26 | Number of twos scored | The total number of runs scored as twos in an innings |
| 27 | Number of singles scored | The total number of runs scored as singles in an innings |
| 28 | Number of sixes in the 1st–6th overs | The total number of sixes in the 1st–6th overs |
| 29 | Number of sixes in the 7th–10th overs | The total number of sixes in the 7th–10th overs |
| 30 | Number of sixes in the 11th–14th overs | The total number of sixes in the 11th–14th overs |
| 31 | Number of sixes in the last six overs (15th–20th overs) | The total number of sixes in the 15th–20th overs |
| 32 | Number of fours in the 1st–6th overs | The total number of fours in the 1st–6th overs |
| 33 | Number of fours in the 7th–10th overs | The total number of fours in the 7th–10th overs |
| 34 | Number of fours in the 11th–14th overs | The total number of fours in the 11th–14th overs |
| 35 | Number of fours in the last six overs (15th–20th overs) | The total number of fours in the 15th–20th overs |
| 36 | Number of singles in the 1st–6th overs | The total number of singles in the 1st–6th overs |
| 37 | Number of singles in the 7th–10th overs | The total number of singles in the 7th–10th overs |
| 38 | Number of singles in the 11th–14th overs | The total number of singles in the 11th–14th overs |
| 39 | Number of singles in the last six overs (15th–20th overs) | The total number of singles in the 15th–20th overs |
| 40 | Innings sixes % | The total number of sixes scored over the boundary in an innings expressed as a percentage |
| 41 | Innings fours % | The total number of fours scored in an innings expressed as a percentage |
| 42 | Innings single % | The total number of singles scored in an innings expressed as a percentage |
| 43 | Run rate in the last six overs (15th–20th overs) | The average number of runs scored per over in the 15th–20th over of an innings ¶ |
| Bowling Indicators | ||
| 44 | Total overs of spin bowling | The total number of overs using spin bowling |
| 45 | Overs of spin bowled in powerplay in the 1st–6th overs | The total number of overs using spin bowling in powerplay for the 1st–6th overs |
| 46 | Overs of spin bowled in the 7th–10th overs | The total number of overs using spin bowling in the 7th–10th overs |
| 47 | Overs of spin bowled in the 11th–14th overs | The total number of overs using spin bowling in the 11th–14th overs |
| 48 | Overs of spin bowled in last six overs (15th–20th) | The total number of overs using spin bowling in the last six overs (15th–20th overs) |
| 49 | Bowlers taking 2+ wickets | Bowlers taking two or more wickets in an innings |
| 50 | Wickets taken by spin bowlers | The total number of wickets taking by spin bowlers in an innings |
| 51 | Wickets taken by seam bowlers | The total number of wickets taking by seam bowlers in an innings |
| 52 | Total overs of seam bowling | The total number of overs using seam bowling |
| 53 | Overs of seam bowled in powerplay in the 1st–6th overs ¶ | The total number of overs using seam bowling in powerplay (1st–6th overs) |
| 54 | Overs of seam bowled in the 7th−10th overs ¶ | The total number of overs using seam bowling in the 7th–10th overs |
| 55 | Overs of seam bowled in the 11th−14th overs ¶ | The total number of overs using seam bowling in the 11th–14th overs |
| 56 | Overs of seam bowled in last six overs (15th−20th) ¶ | The total number of overs using seam bowling in the last six overs (15th–20th overs) |
| 57 | Wickets taken in powerplay in the 1st–6th overs | The total number of wickets taken in the powerplay phase (1st–6th overs) |
| 58 | Wicket taken in the 7th−10th overs | The total number of wickets taken in the 7th–10th overs |
| 59 | Wicket taken in the 11th−14th overs | The total number of wickets taken in the 11th–14th overs |
| 60 | Wicket taken in last six overs (15th−20th) | The total number of wickets lost in the last six overs (15th–20th overs) |
| 61 | Total dot balls | The total number of dot balls in an innings |
| 62 | Total dot balls in the 1st−6th overs | The total number of dot balls in the powerplay phase (1st–6th overs) |
| 63 | Total dot balls in the 7th−10th overs | The total number of dot balls in the 7th–10th overs |
| 64 | Total dot balls in the 11th−14th overs | The total number of dot balls in the 11th–14th overs |
| 65 | Total dot balls in the last six overs (15th−20th overs) | The total number of dot balls in the last six overs (15th–20th overs) |
| 66 | Innings dot ball % | The total number of dot balls in an innings expressed as a percentage |
| Fielding Indicators | ||
| 67 | Total number of catches taken | The total number of catches taken in an innings |
| 68 | Total number of run outs | The total number of run outs in an innings |
| Rank | KPIs | Variable Importance |
|---|---|---|
| 1 | Number of wickets taken in the last six overs (15th–20th) in the second innings | 0.02613 |
| 2 | Number of bowlers taking two or more wickets in the second innings | 0.01957 |
| 3 | Run rate in the last six overs (15th–20th) in the second innings | 0.01302 |
| 4 | Number of wickets taken by seam bowlers in the second innings | 0.01216 |
| 5 | Batting strike rate in the last six overs (15th–20th) in the second innings | 0.00916 |
| 6 | Inning single % in the second innings | 0.00729 |
| 7 | Number of wickets taken by spin bowlers in the second innings | 0.00542 |
| 8 | Number of sixes scored in the first innings | 0.00392 |
| 9 | Number of overs of seam bowling in last six overs (15th–20th) in the second innings | 0.00355 |
| 10 | Number of runs in the last six overs 15th–20th overs in the first innings | 0.00344 |
| 11 | Number of sixes in the 11th–14th overs in the first innings | 0.00262 |
| 12 | Number of catches in the second innings | 0.00221 |
| 13 | Dot ball percentage in the first innings | 0.00139 |
| 14 | Number of runs scored by the opening partnership in the first innings | 0.00137 |
| 15 | Number of dot balls in the 1st–6th overs in the first innings | 0.00128 |
| 16 | Number of ones in the last six overs (15th–20th) overs in the second innings | 0.00109 |
Disclaimer/Publisher’s Note: The statements, opinions and data contained in all publications are solely those of the individual author(s) and contributor(s) and not of MDPI and/or the editor(s). MDPI and/or the editor(s) disclaim responsibility for any injury to people or property resulting from any ideas, methods, instructions or products referred to in the content. |
© 2025 by the authors. Licensee MDPI, Basel, Switzerland. This article is an open access article distributed under the terms and conditions of the Creative Commons Attribution (CC BY) license (https://creativecommons.org/licenses/by/4.0/).
Share and Cite
November, R.V.; Cai, H.; Taliep, M.S.; Nyirenda, C.; Leach, L.L. Identification of Key Performance Indicators for T20—A Novel Hybrid Analytical Approach. Appl. Sci. 2025, 15, 6483. https://doi.org/10.3390/app15126483
November RV, Cai H, Taliep MS, Nyirenda C, Leach LL. Identification of Key Performance Indicators for T20—A Novel Hybrid Analytical Approach. Applied Sciences. 2025; 15(12):6483. https://doi.org/10.3390/app15126483
Chicago/Turabian StyleNovember, Rucia V., Haiyan Cai, Mogammad Sharhidd Taliep, Clement Nyirenda, and Lloyd L. Leach. 2025. "Identification of Key Performance Indicators for T20—A Novel Hybrid Analytical Approach" Applied Sciences 15, no. 12: 6483. https://doi.org/10.3390/app15126483
APA StyleNovember, R. V., Cai, H., Taliep, M. S., Nyirenda, C., & Leach, L. L. (2025). Identification of Key Performance Indicators for T20—A Novel Hybrid Analytical Approach. Applied Sciences, 15(12), 6483. https://doi.org/10.3390/app15126483