Article

U-SAMNet: Uncertainty-Aware Self-Attention Multi-Task Network for Pore Detection in Additive Manufacturing


1
Department of Computer Science, Prairie View A&M University, Prairie View, TX 77446, USA
2
Department of Mechanical System Engineering, Kumoh National Institute of Technology, Gumi-si 39177, Gyeongbuk, Republic of Korea
3
Department of Mechanical Engineering, Texas A&M University, College Station, TX 77843, USA
*
Author to whom correspondence should be addressed.
Appl. Sci. 2026, 16(15), 7506; https://doi.org/10.3390/app16157506
Submission received: 19 May 2026 / Revised: 17 July 2026 / Accepted: 22 July 2026 / Published: 28 July 2026
(This article belongs to the Section Materials Science and Engineering)

Abstract

Reliable pore detection in in situ monitoring is essential for quality control in additive manufacturing, particularly in safety-critical applications. However, existing automated approaches often struggle with low-quality images, computational inefficiency, and the lack of reliable uncertainty estimates to identify the pores accurately. To address these limitations, this paper proposes U-SAMNet, an Uncertainty-Aware Self-Attention Multi-Task Network. The model jointly performs pore segmentation, image-level classification, and denoising on in situ monitoring images, while deriving epistemic uncertainty via Monte Carlo dropout variance to dynamically suppress unreliable attention features. This study uses electron-optical (ELO) images from the E-PBF process. A novel Uncertainty Guidance Attention (UGA) block is introduced. It suppresses channel attention weights using inverted uncertainty estimates. Unlike prior methods that modulate classification weights, U-SAMNet operates on pixel-wise feature maps. The model has only 1.69 M parameters. A single forward pass takes 17.46 ms per image, while uncertainty estimation is performed through multiple Monte Carlo dropout passes. The model was evaluated on real E-PBF images and achieved 99.42% pixel accuracy, 85.31% F1-score, and 74.38% IoU on a held-out test set of 43 real images. It also generalizes to other industrial defect detection benchmarks, reaching 85.09% F1-score on DAGM 2007 and 82.32% on DeepCrack. GAN-synthesized training data improves the F1-score by 21.34 percentage points over rotation augmentation alone. Ablation studies confirm that each component contributes meaningfully to the final performance.

1. Introduction

Additive manufacturing (AM) has gained a lot of attention in recent years. It has real benefits such as part consolidation, design flexibility, and shorter lead times [1]. However, industrial AM is very different from the small 3D printers that people use at home. It uses advanced machines that work with high-performance materials like metals and superalloys. AM requires precise conditions to produce strong, reliable parts. Despite all of this, wide adoption is still held back by challenges in quality assurance [2]. Repeatability issues may also occur across different machines and builds, even with the same process parameters [2]. Most commonly, ex situ characterization techniques are used in the industry today. Mechanical testing and X-ray computed tomography (XCT) are among them. These approaches are costly and time-consuming. This limits their use in large-scale industrial production [3]. Moreover, X-ray computed tomography (XCT) is well known for its reduced accuracy with regard to large, rough, or geometrically complex parts [3]. In contrast, in situ monitoring offers a more scalable and cost-effective alternative, as it enables real-time detection of both dense and porous surfaces during the build process [1,2].
Among various AM methods, electron-beam powder bed fusion (E-PBF) has recently attracted particular interest due to its ability to process advanced materials. Superalloys, refractory metals, and intermetallic compounds are typically difficult to fabricate [4]. Traditional manufacturing methods and laser powder bed fusion (L-PBF) face significant challenges with these materials [5]. E-PBF is especially suitable for aerospace, biomedical, and nuclear energy applications. These fields require high material integrity and thermal resistance [6].
E-PBF systems can generate electron-optical (ELO) images using backscattered electrons (BSEs). They can capture layer-by-layer data during the build. These images provide varying brightness or contrast based on surface morphology. Dense areas scatter more BSEs and look brighter, while porous areas trap electrons and appear darker [4]. Previous works have shown that ELO monitoring can be used to identify pores during fabrication [4,5,6]. Nonetheless, most current works are limited to post-process analysis, mainly investigating the correlations between ELO signals and surface morphology while not allowing for real-time defect identification [6]. Recent work using deep learning with total electron emission signals has demonstrated the potential for real-time anomaly detection [6] but does not provide a detailed characterization of pore features.
Accurately detecting anomalies in ELO images remains challenging due to several factors. Anomalies vary widely in size and shape [7]. Image quality can fluctuate across layers or builds [6]. ELO images often contain noise and imaging artifacts, which can further degrade detection performance [5]. Furthermore, the current automated segmentation methods face three main limitations: Firstly, these techniques struggle to extract features across varying anomaly/pore morphologies due to multi-scale variability [7]. Secondly, they typically lack mechanisms to quantify uncertainty, limiting confidence in automated predictions [8]. Thirdly, they are often computationally inefficient, making them unsuitable for real-time industrial applications [9].
Deep learning has proven effective for image-based defect detection [10]. U-Net is one of the most popular architectures for pixel-level segmentation tasks [11]. However, standard U-Net models cannot measure prediction uncertainty and often fail on noisy or low-quality images [12]. This makes them unreliable for safety-critical applications like additive manufacturing [8]. To address these limitations, this work proposes U-SAMNet, an Uncertainty-Aware Self-Attention Multi-Task Network, which introduces a novel suppression-based Uncertainty Guidance Attention (UGA) block. This block dynamically scales channel attention weights using inverted epistemic uncertainty estimates, suppressing unreliable features at the pixel level. U-SAMNet integrates Monte Carlo dropout-based uncertainty estimation [12] directly into its channel attention mechanism. This allows the model to suppress unreliable predictions and emphasize features with high confidence. The neural network is designed as a unified multi-task learning framework that simultaneously performs pore segmentation, uncertainty estimation, image classification, and image denoising.
This work focuses on E-PBF. However, the proposed framework can also be applied to other additive manufacturing processes such as fused deposition modeling. In situ quality control and defect detection are important challenges across all AM processes [13]. The aim of this study is to establish a multi-task learning model with high performance in terms of three listed evaluation indicators: (1) It should be light, capable of working in real time and accurately detecting anomalies at both the pixel level and the object level. (2) It should enhance feature robustness with uncertainty-based attention. (3) It must be robust at generalization and display well across different anomaly morphologies and imaging conditions.

2. Related Work

This section covers a brief review of the related works that are relevant to this work from four perspectives: industrial quality inspection, uncertainty quantification of computer vision, attention mechanism, and multi-task learning.

2.1. Industrial Defect Detection and Uncertainty Quantification

Industrial-based defect inspection has come a long way, from traditional machine-vision methods [13] to state-of-the-art deep learning methodologies such as segmentation [10], mixed supervision [14], end-to-end solutions [9], multi-scale fusion strategy [15], lightweight network design [9], domain adaptation algorithms for defect detection [16], and uncertainty-aware systems applied to defect inspections [8].
However, most methods do not estimate uncertainty, which is crucial for safety-critical applications. This estimation separates epistemic uncertainty from aleatoric uncertainty. Monte Carlo dropout [12] made it possible to quantify uncertainty without architectural adjustments, and later this idea found use in computer vision [17]. Heo et al. [18] first introduced uncertainty-aware attention in healthcare. They added input-dependent uncertainty to the attention mechanism using variational inference. They showed that treating attention weights as distributions improves accuracy and calibration. Other research includes evidential reasoning [19], deep evidential regression [20], ensemble-based uncertainty [21], latent uncertainty [22], medical imaging practice [23], surveys [24], calibration [25], and uncertainty quality [26].
Current research in additive manufacturing mainly studies in situ monitoring [7]. This work focuses on finding defects after the printing process. However, the use of uncertainty-aware attention in a systematic way with respect to additive manufacturing has yet to be investigated. Table 1 summarizes existing industrial defect detection methods. The table shows that no existing method provides both uncertainty estimation and real-time performance for E-PBF additive manufacturing data. Although most of the methods mentioned above attain high accuracy on their designated datasets, they usually do not deliver uncertainty estimates or allow real-time application, which are fundamental to ensuring safety in safety-critical settings.

2.2. Attention Mechanisms in the Context of Computer Vision Research

Machine learning is a field of artificial intelligence where computers learn patterns from data without being explicitly programmed. Deep learning is a subset of machine learning that uses multi-layered neural networks to automatically extract features from raw data. Modern deep learning architectures use attention mechanisms. These allow the model to focus on important features and ignore others. The Squeeze-and-Excitation (SE) block gives CNNs channel attention by modeling relationships between channels. It performs better than non-local modules, which only capture spatial interactions [18]. Convolutional Block Attention Module (CBAM) improves on previous methods by combining channel attention and spatial attention in a single module [30]. Foundations of self-attention mechanisms [31] that worked wonders for natural language processing via Transformers have been extended to computer vision. Non-local networks capture long-range image dependencies in a filter-wise manner [32], while Vision Transformers (ViTs) show that purely attention-based architectures can achieve competitive performance across vision tasks [33].
Recent developments are all about efficiency and specialized use cases. The computational complexity is addressed by more efficient attention mechanisms like Linformer [34], and Performer [35]. Hybrid CNN–Transformer architectures combine both paradigms [36], and multi-scale attention is designed for the specific task of industrial inspection [37]. Uncertainty-modulated attention is used in medical imaging [38], manufacturing quality control [39], and adaptive systems [40]. It helps the model focus correctly by giving more attention to uncertain areas and less to certain ones, instead of making mistakes. Today, attention mechanisms are integrated into medical and industrial areas of imaging to highlight the salient regions using different functionalities, like in Attention U-Net for segmentation [28] and attention gating. For safety-critical applications, these prediction uncertainties are essential because decisions would fundamentally rely on their confidence.

2.3. Defect Detection in Additive Manufacturing

There is also an increasing demand for AM defect detection due to the importance of quality assurance during the production process. It is particularly important for safety-relevant applications. Researchers [41] investigated details of porosity analysis in AM parts using X-ray CT. Maskery et al. [42] also studied the mechanical response of AM porous materials, where they found correlations between the type of defects and the macroscopic properties.
Recent algorithms from deep learning for AM defect discovery have demonstrated encouraging performance results. Zhang et al. [43] used CNNs to predict porosity in selective laser melting. Scime et al. [7] used deep learning for anomalous detection in powder bed images. Nevertheless, these methods are mainly concerned with process monitoring rather than post-processing defect inspection. Ferguson et al. [44] used machine learning to detect porosity in CT scans of AM parts. This work is the most closely related to the approach in this paper, but their approach uses classic feature extraction, and there is no involvement of deep learning networks, uncertainty estimation, etc.
This study makes three main contributions, which are are listed below: First, we propose a novel UGA block. It suppresses channel attention weights by A U G A = A c ( 1 U ) , in contrast to previous works [18] that modulated classification weights rather than per-pixel feature maps. Second, we present a unified framework that performs segmentation, classification, and denoising within a single lightweight network. Epistemic uncertainty is estimated using MC-dropout variance and used to suppress unreliable feature channels. Third, a pix2pix GAN synthesis pipeline is customized to increase the training data from 1147 up to 7147 samples, with strict separation between synthetic and real evaluation data.

3. Materials and Methods

Three challenges are present in designing a pore detection framework for AM: (1) Unreliable Predictions—Current methods do not provide any confidence estimates signifying reliability for safety-critical decisions; (2) Poor Attention Allocation—Conventional attention cannot completely focus on regions of interest, and it may highlight areas of uncertainty that exacerbate unreliable features; (3) Scarce Training Data—AM data is not generally large-scale, which mandates an effective training strategy.
The Proposed Solution: This study tackles these challenges using uncertainty-guided attention, capable of suppressing unreliable features yet amplifying confident predictions, as well as multi-task learning for data-efficient training.

3.1. Problem Statement

Let X R H × W × 1 be an input additive manufacturing image with candidate pore defects where a multi-task learning problem is defined that simultaneously optimizes three supervised tasks alongside uncertainty estimation:
Segmentation : S = f seg ( X ; θ shared , θ seg ) { 0 , 1 } H × W
Classification : C = f cls ( X ; θ shared , θ cls ) { 0 , 1 }
Denoising : D = f denoise ( X ; θ shared , θ denoise ) [ 0 , 1 ] H × W
Epistemic uncertainty is not a supervised task. It is estimated from the predictive variance over T Monte Carlo dropout forward passes through the bottleneck features:
U = 1 T t = 1 T S ^ t S ¯ 2 , S ¯ = 1 T t = 1 T S ^ t
where S ^ t = σ ( Conv ( Dropout ( f bottleneck ) ) ) denotes the t-th stochastic prediction under a randomly sampled dropout mask. This formulation ensures that U [ 0 , 1 ] H × W reflects the model’s predictive dispersion rather than any proxy supervision signal. The three supervised tasks and uncertainty estimate (Equations (1)–(4)) are combined together synergistically: (1) the pixel-wise pore segmentation gives the specific location of the defect in details; (2) epistemic uncertainty estimated via MC-dropout variance (Equation (4)) quantifies prediction confidence for each pixel, making decisions reliable; (3) the image-level classification provides a global context, which helps the local segmentation accuracy; and (4) the image denoising serves as implicit regularization while enabling simultaneous noise reduction in manufacturing images.
Here, θ shared denotes the shared encoder parameters, and the task-specific parameter set { θ seg , θ cls , θ denoise } represents the parameters depicted in the proposed network architecture. Since uncertainty is derived from predictive variance rather than a learned head, no task-specific parameters θ unc are required.
Uncertainty-Guided Attention: In contrast to conventional attention mechanism learning, which is static and heavily based on feature-level statistics, the proposed attention weight is moderated by uncertainty estimation. This relationship is described mathematically in Equation (5):
A UGA = A c ( 1 U )
where high uncertainty ( U 1 ) reduces attention to unreliable features and low uncertainty ( U 0 ) maintains attention to confident predictions. In this formulation, A c represents the standard channel attention weights computed using global statistics from both average and max pooling operations. U is the epistemic uncertainty map obtained from MC-dropout variance over T = 10 stochastic forward passes (Equation (4)). It is not a supervised prediction target. The element-wise multiplication (⊙) creates a dynamic modulation mechanism where confident features ( U 0 ) preserve original attention weights through ( 1 U ) 1 , uncertain features ( U 1 ) are suppressed via ( 1 U ) 0 , and intermediate uncertainty values create proportional modulation. This uncertainty-guided approach is particularly valuable for additive manufacturing applications where imaging conditions vary due to surface artifacts and electron-beam effects. It enables robust pore detection while maintaining sensitivity to confident predictions.

3.1.1. Real-World Image Datasets

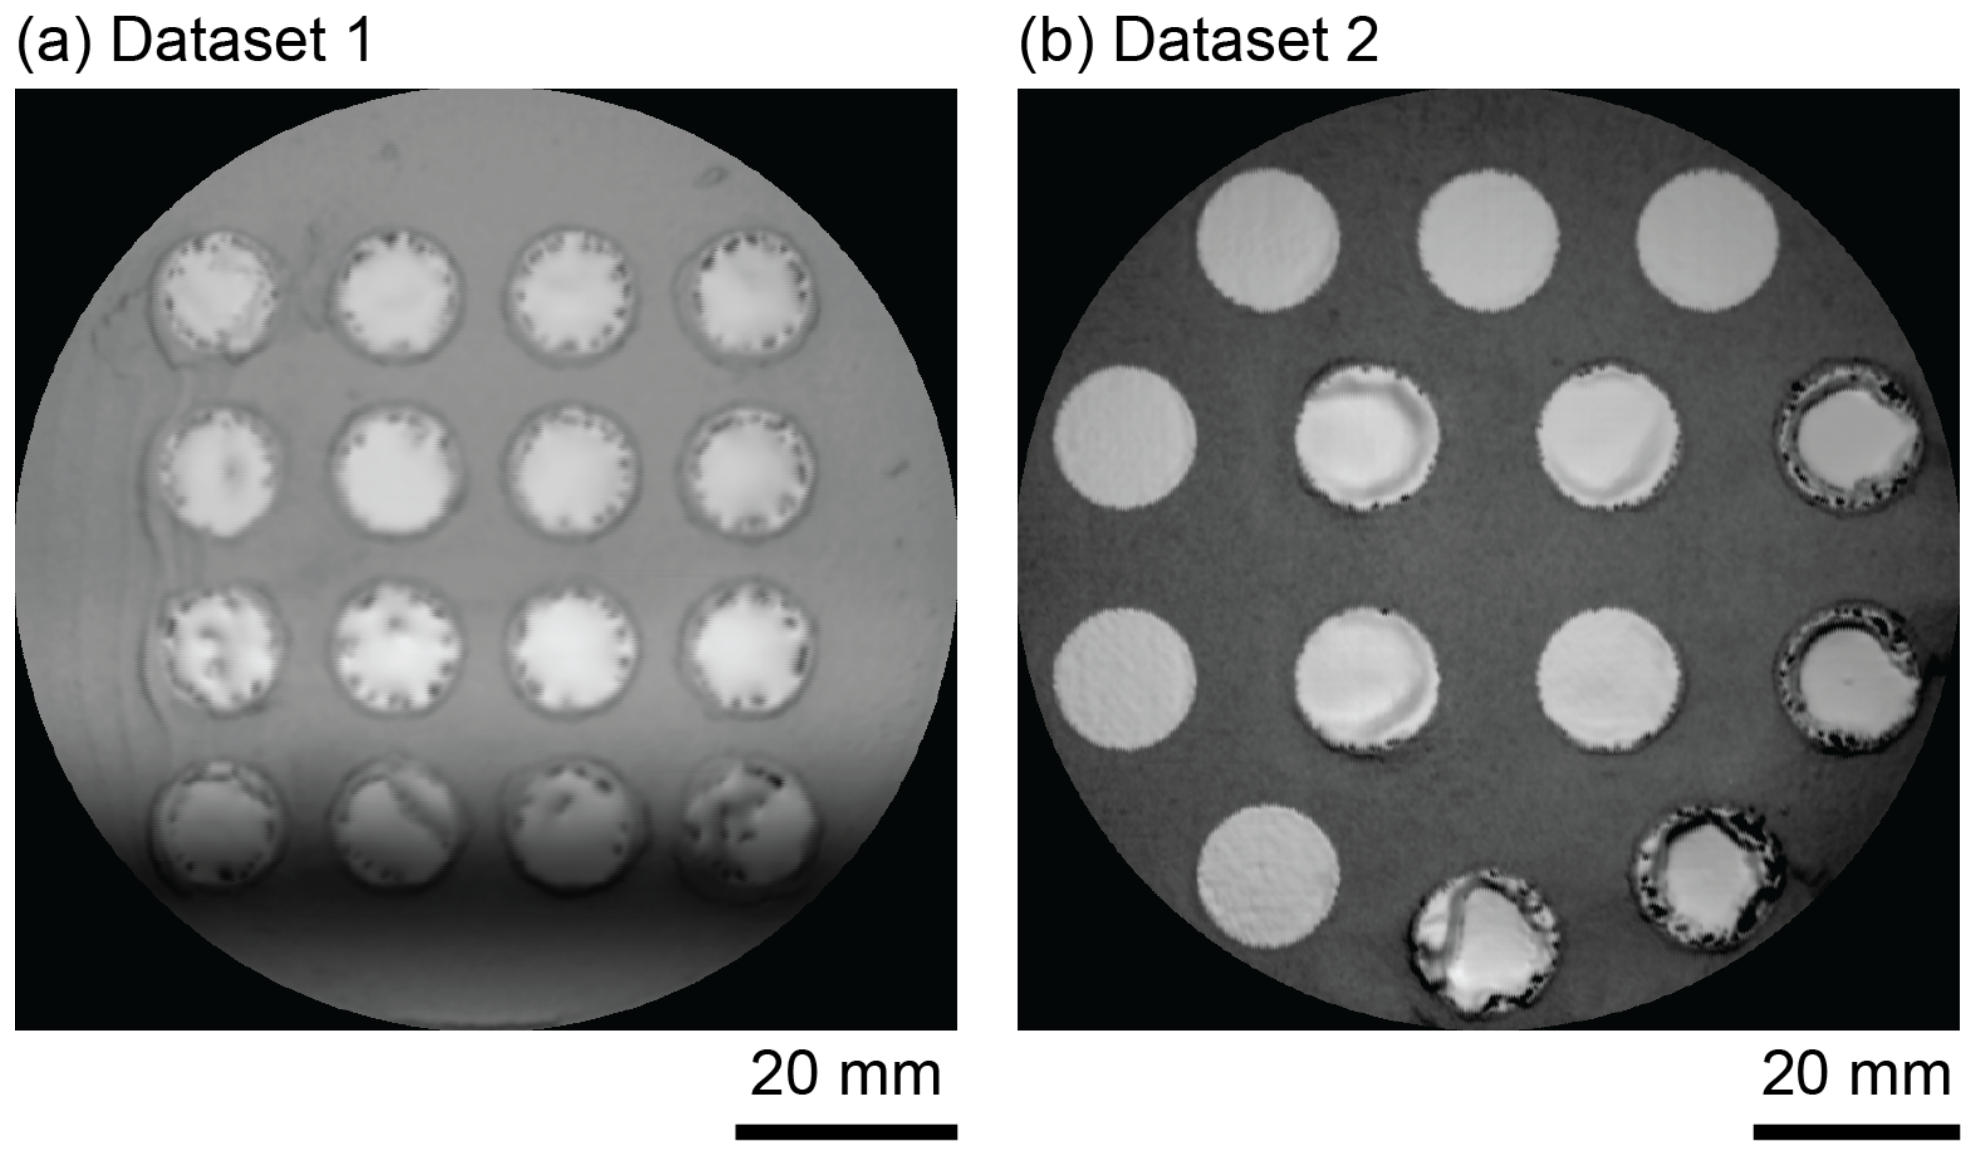
The dataset contains 426 electron-optical (ELO) backscattered electron (BSE) images initially collected during the electron-beam powder bed fusion (E-PBF) process using a Freemelt E-PBF system (Freemelt AB, Mölndal, Sweden).The images were captured layer by layer during the build as part of in situ monitoring. The dataset has two subsets (Figure 1): Dataset-1 contains 157 low-resolution images of 795 × 795 pixels in size. The pixel size is about 25 μm/pixel based on a 20 mm field of view shown in the scale bar. Dataset-2 contains 269 high-resolution images of 2857 × 2857 pixels in size, with a pixel size of about 7 μm/pixel. Each image includes multiple circular build coupons under different shading conditions and layouts. This provides a range of imaging conditions similar to real E-PBF monitoring. All images are grayscale. Dense regions appear brighter due to higher BSE yield, while porous regions appear darker.

3.1.2. Data Augmentation Plan and Data Annotation

To expand the training set, we apply a simple geometric augmentation strategy to our dataset. Since additive manufacturing experiments are costly, augmentation is an appropriate alternative to reuse and regenerate more data, which is based on the real-world generated images. Each of the 340 training images is rotated at 0°, 90°, 180°, and 270° to increase the diversity of the dataset and improve model generalization, producing 1360 rotated training images (340 × 4). Rotation alone has limited diversity. To address this, we also use a pix2pix GAN pipeline, described in Section 3.1.3. The GAN generates new pore patterns and textures that do not exist in the original dataset. Ground-truth binary masks were generated using a classical computer vision pipeline applied to the original grayscale BSE images. The pipeline consisted of the following steps: First, Gaussian blurring was applied with a kernel size of 5 × 5 and σ = 0 to reduce noise. Second, Laplacian sharpening was applied to enhance pore boundaries. The kernel used a center weight of 5 and neighbor weights of 1 . Third, CLAHE was applied with a clip limit of 2.0 and a tile grid size of 8 × 8. Fourth, median blurring with a kernel size of 5 was applied for edge-preserving smoothing. Fifth, Sobel edge detection was applied with a kernel size of 3 and a binary threshold of 20. Morphological closing with a 3 × 3 kernel and dilation with 1 iteration were used to localize the circular build coupons. Coupon regions were detected using the Hough Circle Transform with parameters dp = 1.2, minDist = 40, param1 = 60, param2 = 30, minRadius = 25, and maxRadius = 55. Within each detected coupon, pores were identified using Gaussian adaptive thresholding with blockSize = 25 and C = 3. Morphological erosion (3 × 3 kernel, 1 iteration), dilation (3 × 3 kernel, 2 iterations), and closing (3 × 3 kernel) were then applied. Contours with an area between 5 and 300 pixels were kept as pore annotations. Contours outside this range were removed as noise or coupon boundaries. The validation strategy differs between the two datasets. For Dataset-1 (low-resolution images), the generated masks were validated using corresponding X-ray computed tomography (XCT) images of the same samples. This confirmed that the detected pore locations matched the subsurface porosity measurements. For Dataset-2 (high-resolution images), the image quality and pore contrast allowed direct manual verification without XCT reference. The annotation pipeline was applied to 1360 rotated training images. Among them, 213 images were excluded due to unclear pore boundaries or poor detection quality. This resulted in 1147 verified image–mask pairs for training. All 43 validation images and 43 test images passed the quality check and were retained. The remaining image–mask pairs were reviewed to ensure that the masks accurately represented pore locations and did not contain imaging artifacts. All generated masks were reviewed by three researchers. Each mask was either accepted or rejected based on visual inspection. Masks with minor errors were corrected by rerunning the pipeline with adjusted parameters. Specifically, the C value with block size in the adaptive thresholding step was tuned until the pore boundaries were accurately captured. Masks that could not be reliably corrected were excluded. Acceptance decisions were made by consensus among the three reviewers. No formal inter-observer agreement metric was computed.

3.1.3. Synthetic Data

Real images and their augmented version provided a large sample pool to test the model; however, adding synthetic data is also valuable in further evaluating the model. Synthetic data generation is a well-known approach in image processing and the deep learning domain for the purpose of image processing or classification. To further address data scarcity, a conditional generative adversarial network (pix2pix) [45] was trained only on the 1147 real training pairs to synthesize additional paired samples. The validation and test images were excluded from GAN training, preserving the strict separation between training and evaluation data. The generator learns the mapping from binary pore masks to realistic ELO plate images, producing 6000 additional synthetic pairs. This GAN-based synthesis constitutes true data augmentation, with new pore spatial distributions and imaging textures not present in the original dataset, as distinct from geometric augmentation of existing images.
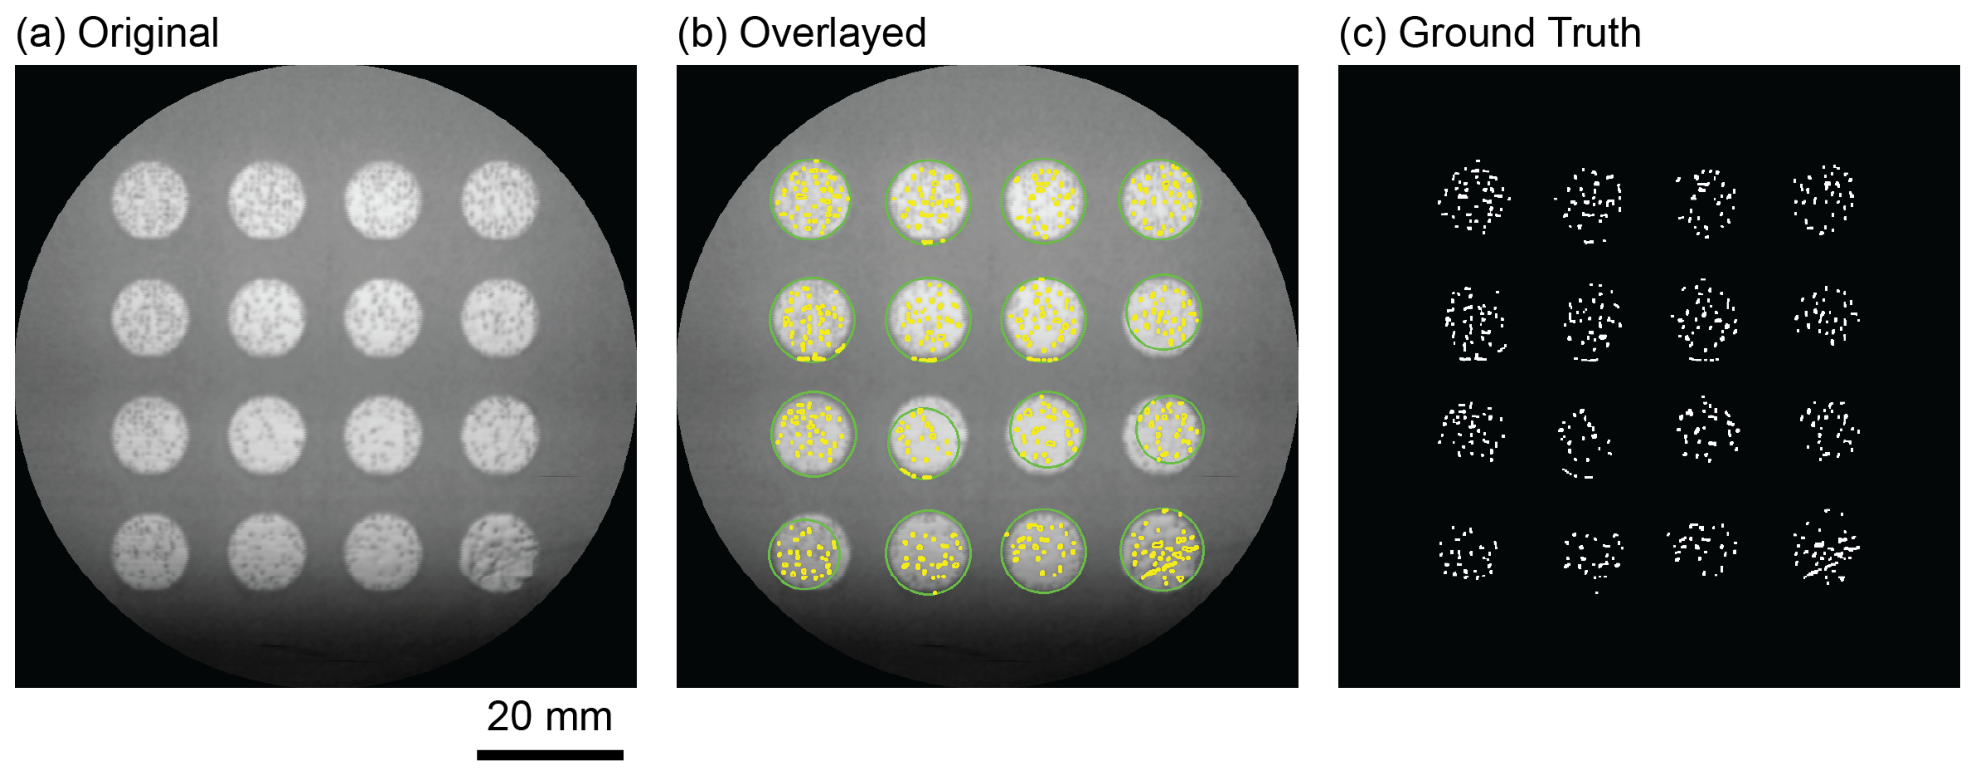
Additionally, both datasets were annotated (see Figure 2) using a classical computer vision workflow. The process started with the original grayscale images, which were blurred and sharpened to enhance image quality. Sobel edge detection was applied to identify edges in each image. Contour detection was then used to outline the pore boundaries. Pores were highlighted with yellow outlines to visualize defects. A ground-truth binary mask was generated for each image as reference annotations.

3.1.4. Splitting and Normalization of Data

For a fair and unbiased evaluation, the 426 original images were divided into three non-overlapping subsets using stratified random sampling (random_state = 42). The training set contained 340 images (80%), while the validation and test sets each contained 43 images (10%). The original image was used for data splitting. Each image is a single ELO capture of a build plate. Its coupons and all rotated versions remained in the same subset. Rotation augmentation (0°, 90°, 180°, and 270°) was applied only to the training set, increasing it to 1360 images. After quality verification, 1147 training images were retained. The GAN-synthesized image–mask pairs were subsequently incorporated into the training set only, bringing the total training data to 7147 images (1147 real + 6000 synthetic). It is important to note that the validation and test sets consisted exclusively of real images that the model never encountered during training. This strict data separation ensures that all reported performance metrics genuinely reflect the model’s ability to generalize to unseen real-world manufacturing images, rather than benefiting from any overlap between training and evaluation data. Rotation augmentation was applied after splitting the dataset. This split ensured that all rotated versions of an image stayed in the same subset. Therefore, no data leakage occurred between the training, validation, and test sets.
For multi-task learning, three supervised task targets are defined per image:
  • Segmentation: Binary masks of pore locations.
  • Classification: Pores are present or not at the image level, calculated as ( Y mask . sum ( ) > 0 ) .
  • Denoising Targets: Original clean images for noise reduction learning.
  • Uncertainty: Derived at inference time from predictive variance across T = 10 MC-dropout forward passes (Equation (4)). No ground-truth label is assigned.

3.2. Network Architecture: U-SAMNet

U-SAMNet is built on the U-Net encoder–decoder backbone [11], which works well for pixel-level segmentation with limited training data. The encoder uses three levels with 64, 128, and 256 filters. This keeps the model compact, with 1.69 M parameters, and suitable for real-time use. Input images are resized to 256 × 256 pixels to preserve spatial detail for pore detection. The UGA block is placed at the bottleneck. This layer has the most semantic information, making it suitable for uncertainty-guided feature suppression before decoding. The decoder features are shared across the multi-task heads. This supports joint learning. The classification head provides global context for segmentation, while the denoising head acts as a regularizer [17].
U-SAMNet extends the U-Net encoder–decoder architecture with novel uncertainty-aware attention and multi-task learning modules. The network comprises three main components: (1) a shared encoder for feature representation learning, (2) Uncertainty Guidance Attention (UGA) blocks, and (3) multi-task output heads with skip connections.

3.2.1. Shared Encoder

The encoder follows a standard convolutional architecture with progressive downsampling. Each encoder block consists of two 3 × 3 convolutions, batch normalization, and ReLU activation. Spatial downsampling is performed via MaxPooling with stride 2. The encoder outputs feature maps at different resolutions to perform multi-scale feature extraction crucial for detecting pores at various scales. The feature map dimensions at each encoding level are as follows: Level 1 (skip1) has 128 × 128 × 64 , Level 2 (skip2) has 64 × 64 × 128 , and the bottleneck has 32 × 32 × 256 . These multi-resolution features captured in 32 × 32 × 256 enable the network to detect pores at various scales, from small surface defects to larger internal voids.

3.2.2. Uncertainty Guidance Attention (UGA) Blocks

The proposed UGA block integrates dropout-based uncertainty estimation with channel attention mechanisms. The UGA block operation consists of three sequential steps:
Step 1: Uncertainty Map Generation: Generates an uncertainty map from the bottleneck features using dropout, as formulated in Equation (6):
U map = σ ( Conv 2 D ( Dropout ( f bottleneck ) ) )
The uncertainty map is computed by applying dropout to the bottleneck feature tensor f bottleneck R 32 × 32 × 256 , followed by a 1 × 1 convolution and sigmoid activation σ , producing U map R 32 × 32 × 1 —a spatial scalar uncertainty map where each value reflects predictive dispersion at that spatial location. This single-channel map is subsequently broadcast across all 256 feature channels during modulation.
Step 2: Channel Attention Computation: Channel attention weights are generated using global statistics from both average and max pooling operations, as shown in Equation (7):
A c = σ ( Add ( [ Dense ( ReLU ( Dense ( GAP ( F ) ) ) ) , Dense ( ReLU ( Dense ( GMP ( F ) ) ) ) ] ) )
The channel attention mechanism described in Equation (7) operates on the bottleneck feature tensor F R 32 × 32 × 256 . Global average pooling (GAP) and global max pooling (GMP) each reduce F to a channel descriptor vector R 1 × 1 × 256 . These are passed through shared dense layers with a reduction ratio r = 8 (bottleneck dimension 256 / 8 = 32 ) and summed to produce the channel attention vector A c R 1 × 1 × 256 , where each scalar encodes the importance weight of one feature channel.
Step 3: Uncertainty-Guided Modulation: The core innovation combines channel attention with uncertainty estimates through multiplicative fusion, as expressed in Equation (8):
A UGA = A c ( 1 U map )
The element-wise multiplication in Equation (8) operates as follows: A c R 1 × 1 × 256 is a channel-wise vector and U map R 32 × 32 × 1 is a spatial scalar map. The term ( 1 U map ) R 32 × 32 × 1 is broadcast across all 256 channels, while A c is broadcast across all 32 × 32 spatial locations, producing A UGA R 32 × 32 × 256 , a full spatial-channel attention mask requiring no explicit resizing or normalization beyond standard broadcasting. When uncertainty is high ( U map 1 ), ( 1 U map ) 0 suppresses attention across all channels at that spatial location. When uncertainty is low ( U map 0 ), the original channel attention weights A c are preserved. The modulated feature tensor is then obtained as F ˜ = F A UGA R 32 × 32 × 256 , which is passed to the decoder.

3.2.3. Multi-Task Output Heads

The architecture incorporates three supervised output heads plus an uncertainty estimator to leverage shared decoder features defined in Equations (9)–(12):
Segmentation Head: A 1 × 1 convolution followed by sigmoid activation generates pixel-wise pore segmentation masks:
S = σ ( Conv 2 D 1 × 1 ( decoder _ features ) )
Uncertainty Estimation: Epistemic uncertainty is not a supervised head but is estimated from predictive variance across T = 10 MC-dropout forward passes applied to the decoder features:
U = Var σ Conv 2 D 1 × 1 Dropout ( decoder _ features , p ) t = 1 T
This ensures that U [ 0 , 1 ] H × W reflects model dispersion rather than any supervised target.
Classification Head: Performs image-level pore presence classification using global average pooling followed by dense layers:
C = σ ( Dense ( Dropout ( Dense ( GAP ( decoder _ features ) ) ) ) )
Denoising Head: Reconstructs clean images from noisy inputs using decoder features for implicit regularization:
D = σ ( Conv 2 D 1 × 1 ( decoder _ features ) )
The three supervised heads in Equations (9)–(12) serve different roles. The segmentation head predicts pore locations at the pixel level. The classification head captures global image context through a single label. The denoising head reduces image noise and helps regularize the model. Uncertainty U is computed after training using MC-dropout variance (Equation (10)). It is used in the UGA block to reduce the influence of unreliable channel features. It is not learned through any loss function.

3.2.4. U-SAMNet Algorithm

The U-SAMNet algorithm steps with the uncertainty-guided attention are provided in Algorithm 1. The main innovation (line 8) is to adaptively normalize channel attention weights by ( 1 U map ) , which dynamically suppresses features with high epistemic uncertainty while accentuating confident predictions. This approach differs from conventional attention mechanisms, which highlight all candidate features equally, by selectively emphasizing relevant features. Monte Carlo dropout (line 4) captures uncertainty by using T = 10 stochastic passes to calculate variance as a systematic confidence measure. Multi-task formulation (lines 10–11) uses three related tasks. The classification head gives a global context for segmentation. The denoising head helps the model learn cleaner features by reconstructing the input. Uncertainty U is not supervised. It is computed at inference using MC-dropout variance (Equation (4)). It is reported together with the three outputs. The computational complexity of the model is O ( T · H W C + H W i C i ) . Empirically, this yields 0.68 GFLOPs, with 1.69 M parameters and an inference time of 17.46 ms, making it suitable for real-time quality control.
Algorithm 1 U-SAMNet Forward Pass with Uncertainty-Guided Attention
Require: Image x R H × W × 1 ; Params:  p = 0.5 , T = 10 , r = 8
Ensure: Segmentation S, Classification C, Denoising D; Uncertainty U derived from MC-dropout variance
1:// Multi-scale encoder
2: e 1 , e 2 , e 3 Encoder ( x ) R H / 2 × W / 2 × 64 , R H / 4 × W / 4 × 128 , R H / 8 × W / 8 × 256
3:// Epistemic uncertainty via MC dropout
4: U map Var ( { σ ( Conv 1 × 1 ( Dropout ( e 3 , p ) ) ) } t = 1 T )
5:// Channel attention
6: A c σ ( MLP r ( GAP ( e 3 ) ) + MLP r ( GMP ( e 3 ) ) )
7:// Uncertainty-guided modulation
8: e ˜ 3 e 3 [ A c ( 1 U map ) ] ▹ Suppress uncertain features
9:// Decoder and multi-task heads
10: f Decoder ( e ˜ 3 , e 2 , e 1 ) R H × W × 64
11: S σ ( Conv ( f ) ) ▹ Segmentation head
12: C , D σ ( MLP ( GAP ( f ) ) ) , σ ( Conv ( f ) )
13: U Var ( { σ ( Conv ( Dropout ( f , p ) ) ) } t = 1 T ) ▹ MC-dropout variance, not supervised
14:return S, U, C, D

3.2.5. Loss Function

The three-task loss function combines supervised objectives with equal weights, as formulated in Equation (13):
L total = L seg + L cls + L denoise
The segmentation and classification heads use binary cross-entropy loss. The denoising head uses mean squared error. Uncertainty U is not included in the loss. It is computed from MC-dropout variance, as defined in Equations (14)–(16):
L seg = 1 N i = 1 N y i log ( s i ) + ( 1 y i ) log ( 1 s i )
L cls = y cls log ( c ) + ( 1 y cls ) log ( 1 c )
L denoise = 1 N i = 1 N x i d i 2
The three-task loss in Equation (13) optimizes three supervised objectives. The loss terms in Equations (14)–(16) correspond to the output heads defined in Equations (9)–(12). Here, N denotes the number of pixels, { s i , c , d i } are the predicted outputs, y i is the segmentation ground truth, y cls is the image-level label, and x i is the clean target image for denoising. Uncertainty U is not used during training. It is computed after training using MC-dropout variance (Equation (4)) and used only to modulate attention in the UGA block. The equal weighting is based on three points: First, all outputs are in the range [ 0 , 1 ] . This reduces the scale difference between BCE and MSE. It also avoids the need for extra weighting [17]. Second, the classification label comes from the segmentation mask ( Y mask . sum ( ) > 0 ) , so the two tasks are closely related. Third, the ablation results support this pipeline. Also, removing any task reduces performance (w/o multi-task: 5.19 % F1; w/o denoising: 3.21 % F1). GradNorm [46] and homoscedastic uncertainty weighting [17] are not explored here and can be considered for future work.

3.3. Baseline Models Implementation

To evaluate U-SAMNet, we compare it with nine baseline models under the same training and test settings. The baselines include standard segmentation models, uncertainty-aware models, and attention-based models. We use these models to check how they affect performance. We also compare them to show the benefit of uncertainty-guided attention in U-SAMNet.
U-Net [11]: Selected as the standard baseline for pixel-level segmentation. Four encoder–decoder blocks with filters 64→128→256→512. Each block has two 3 × 3 convolutions with batch normalization and ReLU, followed by 2 × 2 max pooling. Decoder uses transposed convolutions with skip connections. Parameters: 7.69 M.
VGG16-UNet [47]: Selected to evaluate the benefit of pre-trained deep features. Pre-trained VGG16 (ImageNet) encoder with U-Net decoder. Skip connections from blocks 1 to 5. Grayscale images converted to RGB for compatibility. Parameters: 38.78 M.
ResNet50-UNet [48]: Selected to evaluate residual learning with deep pre-trained features. ResNet50 encoder with U-Net decoder. Features extracted from conv1_relu, conv2_block3_out, conv3_block4_out, conv4_block6_out, and conv5_block3_out. Pre-trained ImageNet encoder. Parameters: 45.76 M.
HRNet [49]: Selected to evaluate multi-scale feature representation, which is relevant for detecting pores of varying sizes. Multi-resolution network with three parallel streams at 1×, 1/2×, and 1/4× resolutions (48, 96, 192 channels). Cross-resolution fusion via upsampling and downsampling. Parameters: 54.00 M.
DeepLabV3+ [50]: Selected to evaluate dilated convolution-based semantic segmentation. ASPP module with dilated convolutions (rates 6, 12, and 18), global average pooling, and 1 × 1 convolutions. ResNet50 backbone with output stride 16. Parameters: 13.31 M.
MC-Dropout U-Net [12]: Standard U-Net with dropout ( p = 0.5 ) after each encoder block. Used to test uncertainty from MC-dropout only.
Attention U-Net [28]: U-Net with attention gates at skip connections. Used to test spatial attention without uncertainty.
SE-U-Net [29]: U-Net with Squeeze-and-Excitation blocks after each encoder stage. Used to test channel attention without uncertainty.
CBAM-U-Net [30]: U-Net with CBAM blocks. Used to test both spatial and channel attention without uncertainty.
The first five baselines are standard segmentation models with different architectures. They are used for general comparison. The other four are based on U-Net. Each one changes a single part of the model. MC-dropout U-Net adds uncertainty estimation, Attention U-Net adds spatial attention, SE-U-Net adds channel attention, and CBAM-U-Net adds both. All of them do not use uncertainty-guided attention. This allows a fair comparison with U-SAMNet.

3.4. Training Configuration

All models were trained with identical settings to ensure fair comparison. We used the Adam optimizer with a learning rate scheduler (factor = 0.5, patience = 5, min_lr = 1 × 10 6 ). Input images were resized to 256 × 256 pixels with a batch size of 16 and trained for 50 epochs. This applies to U-SAMNet and all nine baselines, including the four uncertainty-aware and attention-based models. All models were trained on the same 7147-image training set and evaluated on the same 43 held-out real test images, ensuring a direct and fair comparison.

Hardware and Software Environment

All experiments were conducted on the Bridges-2 supercomputing system at the Pittsburgh Supercomputing Center [51]. The GPU partition was used with NVIDIA Tesla V100 32 GB GPUs. The software environment consisted of Python 3.9, TensorFlow 2.10, CUDA 11.2, and cuDNN 8.1. Model inference time of 17.46 ms per image was measured on the same hardware. This time is for a single forward pass per image at batch size 4. It was averaged over 5 repeated measurements. GPU warm-up was done before recording using dummy forward passes. The time covers the model forward pass only. It does not include image loading, resizing, or data transfer. It also does not include the T = 10 MC-dropout passes for uncertainty estimation. When uncertainty estimation is included, the inference time is approximately 174.6 ms per image. All reported computational efficiency metrics, including FLOPs, parameter count, memory usage, and inference time, were evaluated under identical hardware and software conditions to ensure reproducibility.

4. Results and Analysis

4.1. Quantitative Performance on AM Dataset

This study compares U-SAMNet with several baseline methods on the AM pore dataset. Table 2 shows the overall performance comparison. U-SAMNet outperforms all other baseline methods and obtains the highest performances comparing to all the benchmarks with 99.42% accuracy, 87.10% precision, 83.60% recall and 85.31% F1-score.
The results illustrate that classical CNN models cannot handle the complex morphologies and the variant scales of pores in AM images. However, HRNet achieves a competitive performance (74.70% F1-score) by keeping high-resolution representations. DeepLabV3+ achieves the lowest performance (36.04% F1-score), since its architecture is designed for semantic segmentation instead of fine-grained defect detection.
Additionally, this study provides comparisons with recent Monte Carlo dropout methods that obtain baseline accuracies of 75–80% [52] and medical imaging accuracy of 83.5–92.6% but calibration errors above 0.15 [24] and F1-scores between 78 and 84% in process monitoring [53] for uncertainty quantification performance. This uncertainty-guided attention approach outperforms baseline models, showing 99.42% accuracy and 85.31% F1-score. The validation F1-score of 86.32% closely matches the test F1-score of 85.31% (difference of 1.01%), which suggests limited overfitting to the training distribution. With real-time efficiency (17.46 ms), it proves the effectiveness of incorporating target distribution insights into base attention mechanisms for manufacturing use-case applications.
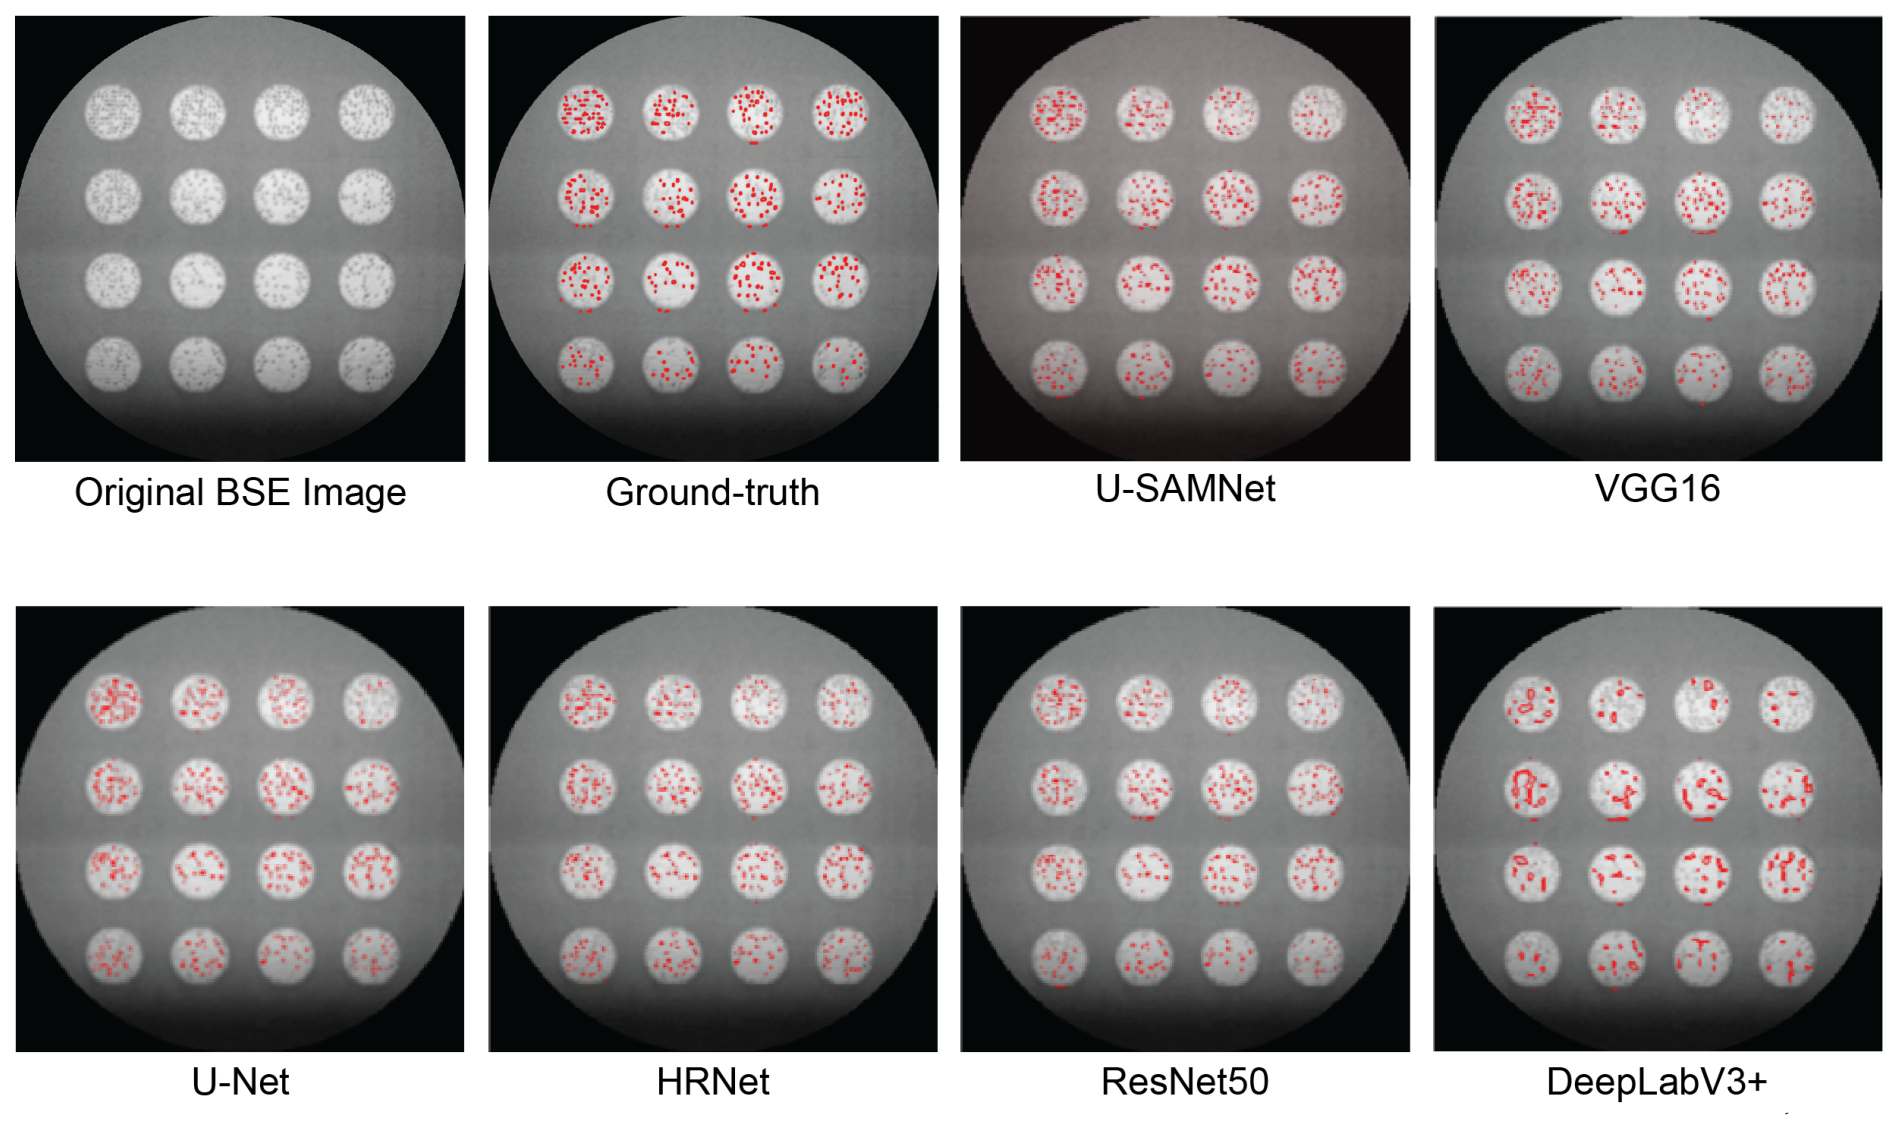
Figure 3 presents a visual comparison of pore detection results across deep learning models using a BSE image. The original image, ground-truth pore annotations, and U-SAMNet and VGG16 predictions are shown in the top row, while results for U-Net, HRNet, ResNet50, and DeepLabV3+ are presented on the bottom row. Red dots indicate detected pores. In this experiment, U-SAMNet achieved the best performance, with an F1-score of 85.31%, near to the ground truth. ResNet50 had lower pore detection performance, with more false positives and missed detections than VGG16, U-Net, or HRNet. Similarly, DeepLabV3+ performs poorly without the discriminator, obtaining a very low pore localization score of 36.0% (F1-score).
Table 3 extends the comparison to uncertainty-aware and attention-based baselines, all trained and evaluated under identical conditions.
U-SAMNet performs better than all four baselines on every metric. MC-dropout U-Net achieves an F1-score of 75.40%, which is 9.91 percentage points lower than that of U-SAMNet. This shows that MC-dropout alone is not enough. The results improve from Attention U-Net (78.69%) to SE-U-Net (80.62%), then CBAM-U-Net (82.09%), and finally U-SAMNet (85.31%). This shows that adding uncertainty-guided attention gives the best performance for pore detection in E-PBF images.
Three analyses were conducted to confirm that the GAN-synthesized images contribute genuine diversity to the training process. First, synthetic images were added exclusively to the training set. The validation and test sets contained only real images. Therefore, all reported metrics reflect performance on unseen real manufacturing images only. Second, 50 randomly sampled synthetic image–mask pairs were visually inspected. The generated images show realistic ELO imaging characteristics. These include natural background texture, brightness gradients, and pore morphology consistent with real E-PBF samples. The synthesized images also display novel pore spatial distributions not found in the original dataset. This confirms that the GAN introduces genuine visual diversity beyond simple geometric augmentations. Third, the validation F1-score is 86.32% and the test F1-score is 85.31%. Both scores are computed on real images only. The difference between them is only 1.01%. This small gap suggests that the model generalizes to the available real manufacturing images. No domain shift from the synthetic training data was observed.
Table 4 shows the effect of GAN data. One setting uses only real images with rotation (1147 samples). The other includes GAN-generated pairs (7147 samples).
The GAN synthesis pipeline improves performance across all metrics. Without synthetic data, the model gets an F1-score of 63.97% and an IoU of 48.13%. This shows weak performance when the training data is limited. When 6000 GAN-synthesized pairs are added, the F1-score increases to 85.31% and IoU to 74.38%. The biggest improvement is in recall, which rises from 56.80% to 83.60%. This means that the model misses fewer pores. Precision also improves from 73.20% to 87.10%, so there are fewer false detections. Overall, the results show that GAN-generated data helps the model learn more varied examples and improves pore detection beyond rotation augmentation.
To check the reliability of the results, we used bootstrap confidence intervals. The test set had only 43 real images, so we resampled it 1000 times with replacement. Table 5 reports the mean, standard deviation, and 95% confidence intervals for all metrics.
The confidence intervals are very narrow across all metrics. The F1-score of 85.31% falls within a 95% CI of [85.02%, 85.60%], a range of just 0.58 percentage points. The IoU of 74.38% falls within [73.95%, 74.81%], a range of 0.86 percentage points. These tight intervals confirm that the reported results are statistically stable and not an artifact of the small test set size. The low standard deviations (0.15–0.22%) further indicate that performance estimates are highly consistent across bootstrap resamples. Multi-seed experiments are left for future work when additional computational resources become available.

4.2. Multi-Task Performance Analysis

Contrary to traditional approaches that are only based on the segmentation, this study proposes a new model called U-SAMNet, which tackles simultaneously multiple tasks. Since the current baseline models are not multi-task-learned, this paper analyzes each task of the U-SAMNet model separately to show the versatility of this method.

4.2.1. Performance in Image-Level Classification

The capability of U-SAMNet in classifying images to find the presence of pores is well shown in the AM dataset. Its multi-task architecture simultaneously performs global feature mapping on image-level and pixel-level segmentation with high accuracy. This indicates that the model is capable of performing both classification and localization tasks effectively. Such a dual capability is especially critical when it comes to industrial defect detection, where identifying the presence of a defect is important, but identifying where that defect occurs is equally noteworthy and valuable.

4.2.2. Denoising Task Performance

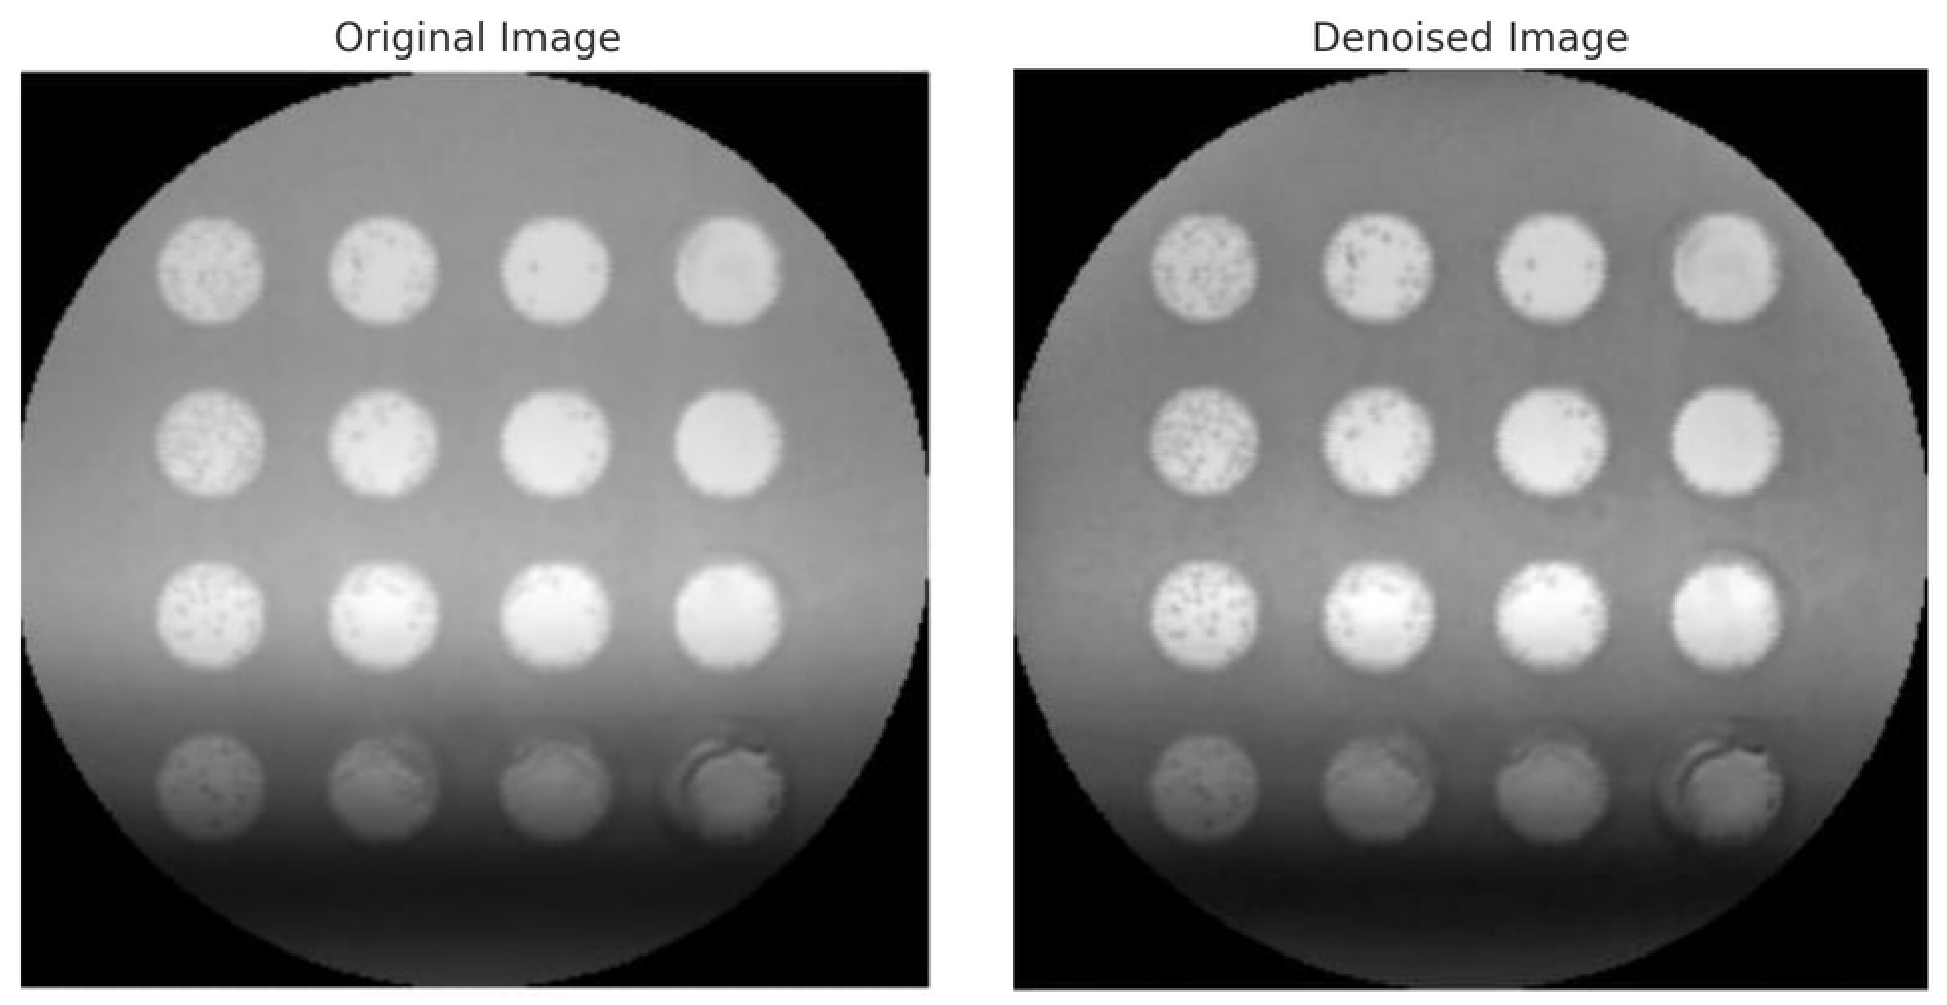
The denoising module serves two purposes: it reduces noise and acts as an implicit regularizer. The visual results in Figure 4 illustrate the denoising performance of the model, capable of removing noise while maintaining structural details sufficient for pore detection. In terms of quality, it achieves a mean PSNR of 28.2 dB and SSIM of 0.88 on the AM dataset, demonstrating excellent reconstruction to enable more careful pore evaluation. The denoising task helps the model learn better features without separate preprocessing.

4.2.3. Uncertainty Calibration Analysis

Calibration metrics were computed using the U-SAMNet model trained on real images with rotation augmentation. The MC-dropout mechanism, dropout rate ( p = 0.5 ), and output architecture were the same across all training configurations [12], so these metrics reflect the uncertainty capability of the architecture itself. Table 6 shows the results. The Brier score of 0.0046 and ECE of 0.0017 confirm that the model is well calibrated. Its confidence closely matches its actual accuracy. The low ECE matters in safety-critical AM inspection, where overconfident predictions can cause missed defects. The AUROC of 0.6748 indicates that regions with higher uncertainty scores correspond to a greater frequency of prediction errors. A value above 0.5 confirms that the uncertainty scores are useful for detecting errors. This validates the UGA suppression mechanism [8]. These results confirm that U-SAMNet produces reliable uncertainty estimates for safety-critical quality control.

4.3. Computational Efficiency Analysis

Table 7 compares the computational requirements of U-SAMNet and the baseline models. U-SAMNet has 1.69 M parameters and a model size of 13.12 MB. This is much smaller than ResNet50 (45.76 M), VGG16 (38.78 M), and DeepLabV3+ (13.31 M). This compact size suggests potential suitability for edge deployment. Validation on industrial edge hardware remains for future work.
U-SAMNet takes 17.46 ms per image for a single forward pass at batch size 4. When T = 10 MC-dropout passes are included, the time increases to about 174.6 ms per image. This is higher than the baselines. However, none of the baselines perform uncertainty estimation. The extra time comes from that additional step. U-SAMNet still has the fewest parameters (1.69 M), smallest model size (13.12 MB), lowest FLOPs (0.68 GFLOPs), and lowest memory usage (6.47 MB). It is also the most lightweight model among all compared methods.

4.4. Cross-Dataset Generalization

To evaluate generalization, U-SAMNet was tested on two publicly available benchmark datasets using the same training and evaluation protocol as the AM dataset. DAGM 2007 Dataset [54]: This benchmark contains ten classes of artificially generated surface defects [54]. U-SAMNet achieves 98.83% accuracy, 88.24% precision, 82.16% recall, and 85.09% F1-score. For reference, Tabernik et al. [10] reported 96.5% accuracy on this dataset using a supervised segmentation approach, and Božič et al. [14] reported approximately 99% AP using mixed supervision. Our result is competitive, noting that these methods were trained and optimized specifically on DAGM while U-SAMNet was trained on E-PBF AM data and evaluated without fine-tuning. DeepCrack Dataset [55]: This benchmark contains 537 manually annotated crack images from multiple scenes [55]. U-SAMNet achieves 98.57% accuracy, 91.05% precision, 75.12% recall, and 82.32% F1-score. The original DeepCrack method [55] reported an F1-score of about 85.3% on this dataset using a model designed and trained for crack segmentation. Our result is slightly lower, at 82.32%. This was expected, since U-SAMNet is not fine-tuned on crack data and is designed for pore detection rather than crack structures. These cross-dataset results show that the method works on different types of defects and different imaging setups without fine-tuning. However, models trained directly on each dataset still perform better for that specific task.

4.5. Ablation Study Results

Detailed ablation study results on how much each component contributes to the performance on three datasets are reported in Table 8:
The UGA block is an important component for AM, DAGM, and DeepCrack, where the observed F1-score drops by 5.87% (AM), 4.40% (DAGM), and 3.83% (DeepCrack) when removing the UGA block. This confirms the usefulness of uncertainty-guided feature modulation. The removal of uncertainty estimation contributes to a decrease in the F1-score by 6.50% (AM), 5.03% (DAGM), and 4.64% (DeepCrack), which shows that it plays an important role in guiding the attention mechanism and improving the reliability of prediction. Here, removing multi-task learning shows a drop of 5.19% on AM, 3.68% on DAGM, and 3.28% on DeepCrack in F1-score for all datasets, indicating the benefits of performing joint optimization over complementary tasks with respect to enhanced feature representation learning as well as training regularization.

4.6. Confusion Matrix Analysis

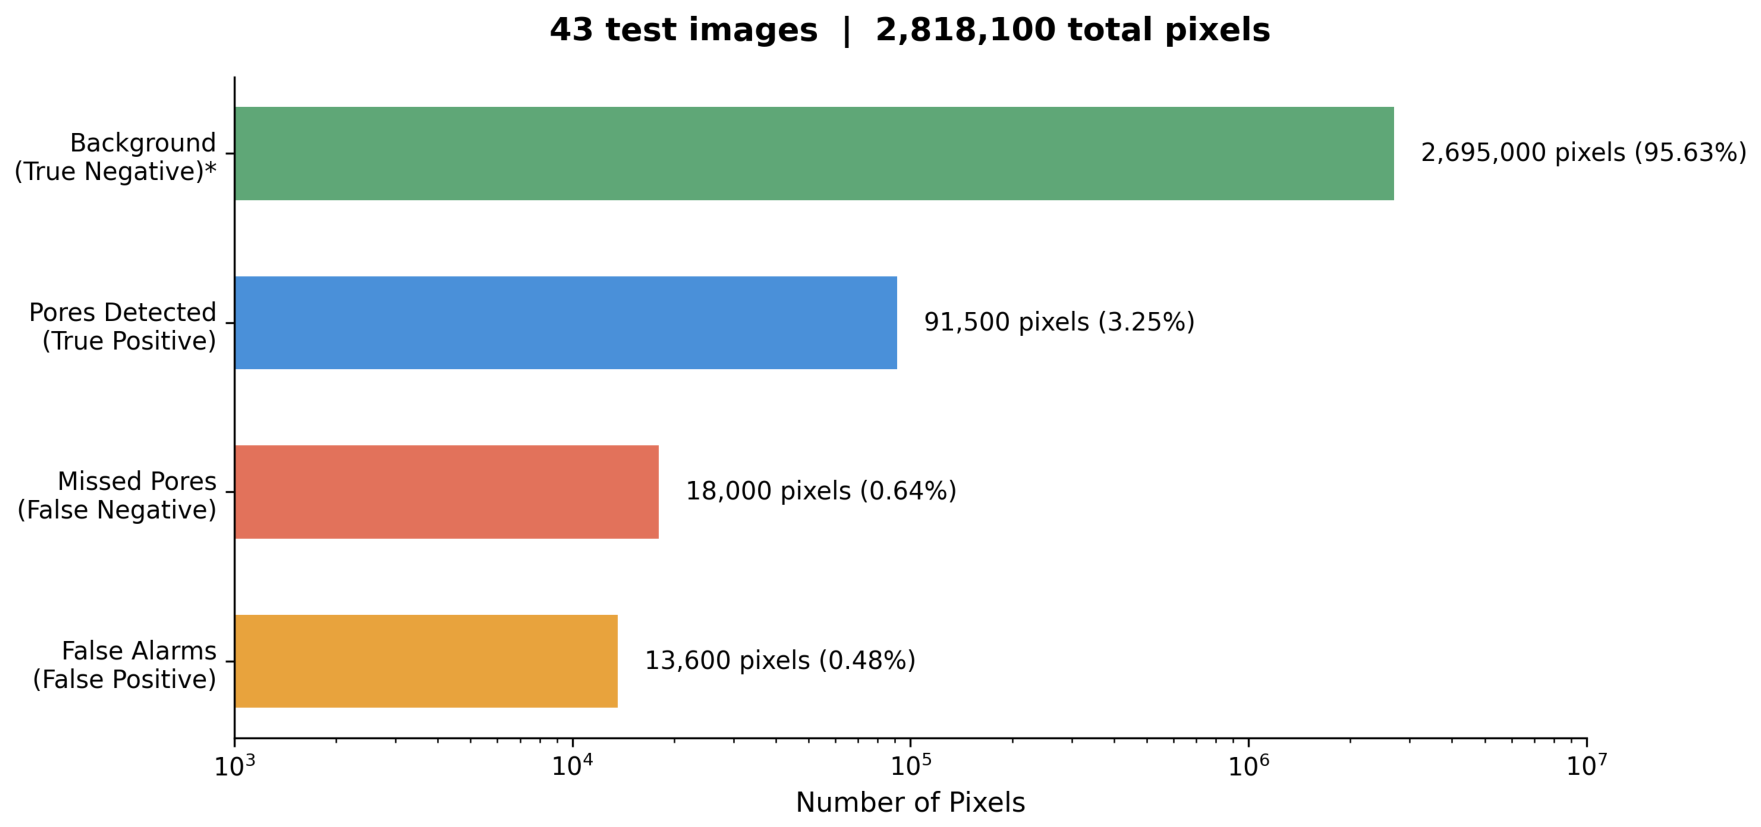
Figure 5 shows the pixel-level detection results of U-SAMNet. The model exhibits moderate precision (87.10%) and recall (83.60%) scores, which can be attributed to the severe class imbalance inherent in the dataset. The background class dominates the additive manufacturing images, comprising 95.63% of all pixels (2,695,000 true negatives), while pores represent only a small minority, at 3.25% (91,500 true positives). This imbalance allows the model to achieve high accuracy primarily by correctly predicting the abundant background pixels, without necessarily excelling at pore detection. While the model successfully identifies a substantial number of pore pixels (91,500 true positives), it simultaneously fails to detect a significant portion (18,000 false negatives), resulting in suboptimal recall performance. Additionally, the model erroneously classifies 13,600 background pixels as pores (false positives), which directly impacts precision. This class imbalance phenomenon demonstrates why relying solely on accuracy metrics is misleading for fine-grained defect detection tasks. Note that accuracy (99.42%) is computed over coupon regions only, excluding outer background pixels. To comprehensively evaluate model performance in such scenarios, complementary metrics including F1-score (85.31%) and IoU (74.38%) provide more meaningful insights into the model’s true capability for identifying minority-class features in highly imbalanced datasets.

5. Discussion

5.1. Technical Advantages of U-SAMNet

The UGA block proposes a fundamentally different attention formulation. Standard methods such as SE [18] and CBAM [30] compute attention solely from feature statistics. Uncertainty-aware attention, described by Heo et al. [18], modulates classification weights using variational inference. Neither approach suppresses pixel-wise feature maps using epistemic uncertainty. The proposed formulation A UGA = A c ( 1 U ) addresses this gap directly. When uncertainty is high ( U 1 ), attention is fully suppressed. When uncertainty is low ( U 0 ), the original attention weight is preserved. This is confirmed by ablation: removing the UGA block reduces F1 by 5.87%, while removing uncertainty estimation alone leads to an even larger reduction of 6.50%. U-SAMNet improves the F1-score by 5.06 percentage points over the best standard baseline (VGG16-UNet, 80.25%). It also improves by 3.22 points over the best attention baseline (CBAM-U-Net, 82.09%). This shows the benefit of uncertainty-guided attention in the multi-task setting. The model has 1.69 M parameters and a single-pass inference time of 17.46 ms. It is lightweight and compact. Validation on industrial edge hardware remains an avenue for future work. The well-calibrated uncertainty estimates enable the confidence scores to better reflect the trustworthiness of predictions. Finally, conventional CNN architectures (U-Net, ResNet50) cannot model the complicated, multi-scale AM defect relationship well, achieving no more than 74.80% F1-score. This proposed approach significantly outperforms all SOTA baselines, validating the effectiveness of uncertainty-guided attention and multi-task learning with denoising. The close agreement between validation F1 (86.32%) and test F1 (85.31%) further suggests that the model does not overfit to the training distribution.
Interpretability in deep learning for image-based inspection remains an open problem. Some studies combine attention mechanisms with uncertainty estimation [56]. These methods can improve detection performance and interpretability in safety-critical tasks. This motivates the use of uncertainty-guided attention in U-SAMNet.

5.2. Limitations and Future Works

Data collection in additive manufacturing is both expensive and time-consuming. In this study, this limitation is partially addressed through Pix2pPix GAN synthesis. The GAN expands the training set to 7147 paired samples. Synthetic images are kept strictly separate from the validation and test sets. This ensures that evaluation metrics reflect performance on real images only. Our proposed model performs very well on the available data, and it is expected to perform well when additional real-world data becomes available. Our confidence in the model is based on its continued high accuracy in pore identification using augmented and synthetic data.
In this study, the data were split before rotation augmentation. All rotated versions of an image remained in the same subset. This prevented data leakage between the training, validation, and test sets. The validation F1-score was 86.32%, while the test F1-score was 85.31%. The small difference of 1.01% is consistent with limited overfitting. However, the held-out test set contained only 43 real images. This limits the strength of any generalization claim, and the results should be interpreted with caution.
Future work will also validate the proposed approach on larger, independently collected datasets. Testing across different machines and materials would further confirm generalization. While the model shows good cross-dataset generalization on AM datasets, it is designed for 2D image analysis only. Detailed pore characterization would require 3D computation of BSE images, which is not addressed in this work. In the future, the model could be extended to handle 3D data and larger datasets, improving real-time defect detection and generalization across different materials and imaging conditions.
Comparisons with other uncertainty-aware models such as Deep Ensemble U-Net, Bayesian U-Net, and Evidential U-Net are not included in this work and will be explored in future work. The masks were verified by three researchers. They checked each mask visually and accepted or rejected it by consensus. We did not compute a formal inter-observer agreement metric such as Cohen’s kappa. We plan to add this in future annotation work. The results are reported using bootstrap confidence intervals with 1000 resamples. Using multiple random seeds to report means ± standard deviations will also be explored in future work.
The pix2pix synthesis pipeline does not fully capture all real-world variations, such as beam deflection artifacts and layer-to-layer surface changes. Still, the results show a clear benefit from synthetic data. The F1-score improves by 21.34 percentage points over rotation-only training. The validation and test results are also close, with a gap of 1.01%. More advanced synthesis methods will be explored in future work.

6. Conclusions

This study proposes U-SAMNet, an Uncertainty-Aware Self-Attention Multi-Task Network for pore detection in ELO images of the E-PBF process. The main contributions of this work include the introduction of the Uncertainty Guidance Attention (UGA) block for Monte Carlo dropout-based uncertainty estimation, and the development of a three-task framework for segmentation, classification, and denoising. MC-dropout variance was used to estimate uncertainty and guide channel attention in the UGA block. U-SAMNet substantially outperformed the state of the art on the held-out real test set, with 99.42% pixel accuracy, and 85.31% F1-score, with a validation F1 of 86.32% indicating consistent performance on the available held-out data. Despite containing only 1.69 million parameters and a 17.46 ms inference time, U-SAMNet improved the F1-score by 3.22 percentage points over the strongest baseline (CBAM-U-Net) and by 5.06 percentage points over the best standard segmentation baseline. This paper also demonstrates good cross-dataset generalization, achieving F1-scores of 85.09% on DAGM 2007 and 82.32% on DeepCrack. Ablation studies further validated the contribution of each component. In summary, this work proposes a suppression-based uncertainty-guided attention mechanism. It modulates pixel-wise feature maps for in situ quality control in E-PBF additive manufacturing. It also improves accuracy while keeping the inference cost low. The presented method not only focuses on manufacturing but also lays down a platform for uncertainty-aware computer vision research, and if further studies prove it right, it could change the dynamics of many other areas, such as medical imaging or autonomous systems in safety-critical application domains where reliable confidence prediction is required.

Supplementary Materials

The following supporting information can be downloaded at https://www.mdpi.com/article/10.3390/app16157506/s1.

Author Contributions

Conceptualization, N.G. and M.T.A.; methodology, P.R.; software, P.R.; formal analysis, P.R.; investigation, K.L., D.T.T. and H.Y.; resources, K.L., D.T.T. and H.Y.; data curation, K.L., D.T.T. and H.Y.; writing—original draft preparation, P.R.; writing—review and editing, P.R., K.L., D.T.T., H.Y., M.T.A. and N.G.; visualization, P.R.; supervision, N.G. (machine learning) and M.T.A. (3D printing and data collection); All authors have read and agreed to the published version of the manuscript.

Funding

This research was funded by the Air Force Office of Scientific Research (AFOSR).

Institutional Review Board Statement

Not applicable.

Informed Consent Statement

Not applicable.

Data Availability Statement

The E-PBF image dataset used in this study was acquired using proprietary hardware and cannot be made publicly available due to confidentiality restrictions associated with the experimental equipment and ongoing research. Data may be made available upon reasonable request, subject to approval by all collaborating institutions. Requests should be directed to the corresponding author at noghaffari@pvamu.edu. The training code and model implementation are provided as Supplementary Materials with this submission. The full U-SAMNet code is publicly available at https://github.com/noushing/USAM-Net (accessed on 20 July 2026). This includes data preprocessing and annotation generation. It also includes synthetic data generation and model training. The baseline comparisons and evaluation scripts are provided as well.

Acknowledgments

During the preparation of this manuscript, the authors used Grammarly (web version, accessed 2026) for the purposes of grammar checking and language editing. The authors have reviewed and edited the output and take full responsibility for the content of this publication.

Conflicts of Interest

The authors declare no conflicts of interest. The funders had no role in the design of the study; in the collection, analyses, or interpretation of data; in the writing of the manuscript; or in the decision to publish the results.

Abbreviations

The following abbreviations are used in this manuscript:
AMAdditive Manufacturing
E-PBFElectron-Beam Powder Bed Fusion
L-PBFLaser Powder Bed Fusion
ELOElectron-Optical
BSEBackscattered Electron
XCTX-Ray Computed Tomography
U-SAMNetUncertainty-Aware Self-Attention Multi-Task Network
UGAUncertainty Guidance Attention
CNNConvolutional Neural Network
GANGenerative Adversarial Network
MCMonte Carlo
SESqueeze and Excitation
CBAMConvolutional Block Attention Module
ViTVision Transformer
PSNRPeak Signal-to-Noise Ratio
SSIMStructural Similarity Index Measure
AUROCArea Under the Receiver Operating Characteristic Curve
IoUIntersection over Union
AFOSRAir Force Office of Scientific Research
FLOPFloating-Point Operation

References

  1. DebRoy, T.; Wei, H.; Zuback, J.; Mukherjee, T.; Elmer, J.; Milewski, J.; Beese, A.; Wilson-Heid, A.; De, A.; Zhang, W. Additive manufacturing of metallic components—Process, structure and properties. Prog. Mater. Sci. 2018, 92, 112–224. [Google Scholar] [CrossRef]
  2. Seifi, M.; Gorelik, M.; Waller, J.; Hrabe, N.; Shamsaei, N.; Daniewicz, S.; Lewandowski, J.J. Progress towards metal additive manufacturing standardization to support qualification and certification. JOM 2017, 69, 439–455. [Google Scholar] [CrossRef]
  3. Snow, Z.; Scime, L.; Ziabari, A.; Fisher, B.; Paquit, V. Scalable in situ non-destructive evaluation of additively manufactured components using process monitoring, sensor fusion, and machine learning. Addit. Manuf. 2023, 78, 103817. [Google Scholar] [CrossRef]
  4. Arnold, C.; Pobel, C.; Osmanlic, F.; Körner, C. Layerwise monitoring of electron beam melting via backscatter electron detection. Rapid Prototyp. J. 2018, 24, 1401–1406. [Google Scholar] [CrossRef]
  5. Pobel, C.R.; Arnold, C.; Osmanlic, F.; Fu, Z.; Körner, C. Immediate development of processing windows for selective electron beam melting using layerwise monitoring via backscattered electron detection. Mater. Lett. 2019, 249, 70–72. [Google Scholar] [CrossRef]
  6. Arnold, C.; Breuning, C.; Körner, C. Electron-optical in situ imaging for the assessment of accuracy in electron beam powder bed fusion. Materials 2021, 14, 7240. [Google Scholar] [CrossRef] [PubMed]
  7. Scime, L.; Beuth, J. Anomaly detection and classification in a laser powder bed additive manufacturing process using a trained computer vision algorithm. Addit. Manuf. 2018, 19, 114–126. [Google Scholar] [CrossRef]
  8. Zhao, Z.; Liu, W.; Ren, J.; Wang, C.; He, Y.; Zhang, X.; Chen, X. Uncertainty-driven trustworthy defect detection for high-resolution powder bed images in selective laser melting. J. Manuf. Syst. 2024, 72, 59–73. [Google Scholar] [CrossRef]
  9. Yang, L.; Xu, S.; Fan, J.; Li, E.; Liu, Y. A pixel-level deep segmentation network for automatic defect detection. Expert Syst. Appl. 2023, 215, 119388. [Google Scholar] [CrossRef]
  10. Tabernik, D.; Šela, S.; Skvarič, J.; Skočaj, D. Segmentation-based deep-learning approach for surface-defect detection. J. Intell. Manuf. 2020, 31, 759–776. [Google Scholar]
  11. Ronneberger, O.; Fischer, P.; Brox, T. U-Net: Convolutional networks for biomedical image segmentation. In Proceedings of the International Conference on Medical Image Computing and Computer-Assisted Intervention (MICCAI), Munich, Germany, 5–9 October 2015; pp. 234–241. [Google Scholar]
  12. Gal, Y.; Ghahramani, Z. Dropout as a Bayesian approximation: Representing model uncertainty in deep learning. In Proceedings of the International Conference on Machine Learning (ICML), New York, NY, USA, 19–24 June 2016; pp. 1050–1059. [Google Scholar]
  13. Lu, J.; Lee, S.-H. Real-time defect detection model in industrial environment based on lightweight deep learning network. Electronics 2023, 12, 4388. [Google Scholar] [CrossRef]
  14. Božič, J.; Tabernik, D.; Skočaj, D. Mixed supervision for surface-defect detection: From weakly to fully supervised learning. Comput. Ind. 2021, 129, 103459. [Google Scholar] [CrossRef]
  15. Wen, G.; Cheng, L.; Yuan, H.; Li, X. Surface defect detection based on adaptive multi-scale feature fusion. Sensors 2025, 25, 1720. [Google Scholar] [CrossRef] [PubMed]
  16. Li, C.; Yan, H.; Qian, X.; Zhu, S.; Zhu, P.; Liao, C.; Tian, H.; Li, X.; Wang, X.; Li, X. A domain adaptation YOLOv5 model for industrial defect inspection. Measurement 2023, 213, 112725. [Google Scholar] [CrossRef]
  17. Kendall, A.; Gal, Y. What uncertainties do we need in Bayesian deep learning for computer vision? Adv. Neural Inf. Process. Syst. 2017, 30. [Google Scholar]
  18. Heo, J.; Lee, H.B.; Kim, S.; Lee, J.; Kim, K.J.; Yang, E.; Hwang, S.J. Uncertainty-aware attention for reliable interpretation and prediction. In Proceedings of the Advances in Neural Information Processing Systems 31 (NeurIPS 2018), Montreal, QC, Canada, 2–8 December 2018; pp. 909–918. [Google Scholar]
  19. Sensoy, M.; Kaplan, L.; Kandemir, M. Evidential deep learning to quantify classification uncertainty. In Proceedings of the Advances in Neural Information Processing Systems 31 (NeurIPS 2018), Montreal, QC, Canada, 2–8 December 2018; pp. 3179–3189. [Google Scholar]
  20. Amini, A.; Schwarting, W.; Soleimany, A.; Rus, D. Deep evidential regression. In Proceedings of the Advances in Neural Information Processing Systems 33 (NeurIPS 2020), Virtual, 6–12 December 2020; pp. 14927–14937. [Google Scholar]
  21. Malinin, A.; Gales, M. Predictive uncertainty estimation via prior networks. In Proceedings of the Advances in Neural Information Processing Systems 31 (NeurIPS 2018), Montreal, QC, Canada, 2–8 December 2018. [Google Scholar]
  22. Postels, J.; Blum, H.; Strümpler, Y.; Cadena, C.; Siegwart, R.; Van Gool, L.; Tombari, F. The hidden uncertainty in a neural network’s activations. arXiv 2020, arXiv:2012.03082. [Google Scholar]
  23. Litjens, G.; Kooi, T.; Bejnordi, B.E.; Setio, A.A.A.; Ciompi, F.; Ghafoorian, M.; van der Laak, J.A.W.M.; van Ginneken, B.; Sánchez, C.I. A survey on deep learning in medical image analysis. Med. Image Anal. 2017, 42, 60–88. [Google Scholar] [CrossRef] [PubMed]
  24. Abdar, M.; Pourpanah, F.; Hussain, S.; Rezazadegan, D.; Liu, L.; Ghavamzadeh, M.; Fieguth, P.; Cao, X.; Khosravi, A.; Acharya, U.R.; et al. A review of uncertainty quantification in deep learning: Techniques, applications and challenges. Inf. Fusion 2021, 76, 243–297. [Google Scholar] [CrossRef]
  25. Wilson, A.G.; Izmailov, P. Bayesian deep learning and a probabilistic perspective of generalization. Adv. Neural Inf. Process. Syst. 2020, 33, 4697–4708. [Google Scholar]
  26. Ding, Y.; Liu, J.; Xiong, J.; Shi, Y. Revisiting the evaluation of uncertainty estimation and its application to explore model complexity-uncertainty trade-off. arXiv 2019, arXiv:1903.02050. [Google Scholar]
  27. Bergmann, P.; Fauser, M.; Sattlegger, D.; Steger, C. MVTec anomaly detection: A comprehensive real-world dataset for unsupervised anomaly detection. In Proceedings of the IEEE/CVF Conference on Computer Vision and Pattern Recognition (CVPR), Long Beach, CA, USA, 15–20 June 2019; pp. 9584–9592. [Google Scholar]
  28. Oktay, O.; Schlemper, J.; Folgoc, L.L.; Lee, M.; Heinrich, M.; Misawa, K.; Mori, K.; McDonagh, S.; Hammerla, N.Y.; Kainz, B.; et al. Attention U-Net: Learning where to look for the pancreas. In Proceedings of the Medical Image Computing and Computer Assisted Intervention (MICCAI), Granada, Spain, 16–20 September 2018; pp. 235–243. [Google Scholar]
  29. Hu, J.; Shen, L.; Sun, G. Squeeze-and-excitation networks. In Proceedings of the IEEE Conference on Computer Vision and Pattern Recognition (CVPR), Salt Lake City, UT, USA, 18–22 June 2018; pp. 7132–7141. [Google Scholar]
  30. Woo, S.; Park, J.; Lee, J.-Y.; Kweon, I.S. CBAM: Convolutional block attention module. In Proceedings of the European Conference on Computer Vision (ECCV), Munich, Germany, 8–14 September 2018; pp. 3–19. [Google Scholar]
  31. Vaswani, A.; Shazeer, N.; Parmar, N.; Uszkoreit, J.; Jones, L.; Gomez, A.N.; Kaiser, Ł.; Polosukhin, I. Attention is all you need. In Proceedings of the Advances in Neural Information Processing Systems (NeurIPS), Long Beach, CA, USA, 4–9 December 2017; pp. 5998–6008. [Google Scholar]
  32. Wang, X.; Girshick, R.; Gupta, A.; He, K. Non-local neural networks. In Proceedings of the IEEE Conference on Computer Vision and Pattern Recognition (CVPR), Salt Lake City, UT, USA, 18–22 June 2018; pp. 7794–7803. [Google Scholar]
  33. Dosovitskiy, A.; Beyer, L.; Kolesnikov, A.; Weissenborn, D.; Zhai, X.; Unterthiner, T.; Dehghani, M.; Minderer, M.; Heigold, G.; Gelly, S.; et al. An image is worth 16x16 words: Transformers for image recognition at scale. In Proceedings of the International Conference on Learning Representations (ICLR), Virtual, 3–7 May 2021. [Google Scholar]
  34. Wang, S.; Li, B.Z.; Khabsa, M.; Fang, H.; Ma, H. Linformer: Self-attention with linear complexity. arXiv 2020, arXiv:2006.04768. [Google Scholar]
  35. Choromanski, K.; Likhosherstov, V.; Dohan, D.; Song, X.; Gane, A.; Sarlos, T.; Hawkins, P.; Davis, J.; Mohiuddin, A.; Kaiser, L.; et al. Rethinking attention with performers. In Proceedings of the International Conference on Learning Representations (ICLR), Virtual, 3–7 May 2021. [Google Scholar]
  36. Khan, S.; Naseer, M.; Hayat, M.; Zamir, S.W.; Khan, F.S.; Shah, M. Transformers in vision: A survey. ACM Comput. Surv. 2022, 54, 200. [Google Scholar] [CrossRef]
  37. Peng, J.; Shao, H.; Xiao, Y.; Cai, B.; Liu, B. Industrial surface defect detection and localization using multi-scale information focusing and enhancement GANomaly. Expert Syst. Appl. 2024, 238, 122361. [Google Scholar] [CrossRef]
  38. Kohl, S.A.A.; Romera-Paredes, B.; Meyer, C.; De Fauw, J.; Ledsam, J.R.; Maier-Hein, K.; Eslami, S.M.A.; Rezende, D.J.; Ronneberger, O. A probabilistic U-Net for segmentation of ambiguous images. In Proceedings of the 32nd Conference on Neural Information Processing Systems (NeurIPS 2018), Montreal, QC, Canada, 2–8 December 2018; Volume 31. [Google Scholar]
  39. Vieira e Silva, A.L.B.; Simões, F.; Kowerko, D.; Schlosser, T.; Battisti, F.; Teichrieb, V. Attention modules improve image-level anomaly detection for industrial inspection: A DifferNet case study. arXiv 2023, arXiv:2311.02747. [Google Scholar]
  40. Ma, Y.; Yin, J.; Huang, F.; Li, Q. Surface defect inspection of industrial products with object detection deep networks: A systematic review. Artif. Intell. Rev. 2024, 57, 333. [Google Scholar] [CrossRef]
  41. Du Plessis, A.; Yadroitsev, I.; Yadroitsava, I.; Le Roux, S.G. X-ray microcomputed tomography in additive manufacturing: A review of the current technology and applications. 3D Print. Addit. Manuf. 2018, 5, 227–247. [Google Scholar] [CrossRef]
  42. Nguyen, H.D.; Pramanik, A.; Basak, A.; Dixit, A.R.; Chattopadhyaya, S.; Debnath, S.; Prakash, C. A critical review on additive manufacturing of Ti-6Al-4V alloy: Microstructure and mechanical properties. J. Mater. Res. Technol. 2022, 18, 4641–4661. [Google Scholar] [CrossRef]
  43. Scime, L.; Beuth, J. A multi-scale convolutional neural network for autonomous anomaly detection and classification in a laser powder bed fusion additive manufacturing process. Addit. Manuf. 2019, 24, 273–286. [Google Scholar]
  44. Ferguson, M.; Ak, R.; Lee, Y.-T.T.; Law, K.H. Detection and segmentation of manufacturing defects with convolutional neural networks and transfer learning. Smart Sustain. Manuf. Syst. 2018, 2, 20180021. [Google Scholar] [CrossRef]
  45. Isola, P.; Zhu, J.-Y.; Zhou, T.; Efros, A.A. Image-to-image translation with conditional adversarial networks. In Proceedings of the IEEE Conference on Computer Vision and Pattern Recognition (CVPR), Honolulu, HI, USA, 21–26 July 2017; pp. 1125–1134. [Google Scholar]
  46. Chen, Z.; Badrinarayanan, V.; Lee, C.-Y.; Rabinovich, A. GradNorm: Gradient normalization for adaptive loss balancing in deep multitask networks. In Proceedings of the International Conference on Machine Learning (ICML), Stockholm, Sweden, 10–15 July 2018; pp. 794–803. [Google Scholar]
  47. Simonyan, K.; Zisserman, A. Very deep convolutional networks for large-scale image recognition. arXiv 2014, arXiv:1409.1556. [Google Scholar]
  48. He, K.; Zhang, X.; Ren, S.; Sun, J. Deep residual learning for image recognition. In Proceedings of the IEEE Conference on Computer Vision and Pattern Recognition (CVPR), Las Vegas, NV, USA, 27–30 June 2016; pp. 770–778. [Google Scholar]
  49. Sun, K.; Xiao, B.; Liu, D.; Wang, J. Deep high-resolution representation learning for visual recognition. In Proceedings of the IEEE/CVF Conference on Computer Vision and Pattern Recognition (CVPR), Long Beach, CA, USA, 15–20 June 2019; pp. 5693–5703. [Google Scholar]
  50. Chen, L.-C.; Zhu, Y.; Papandreou, G.; Schroff, F.; Adam, H. Encoder-decoder with atrous separable convolution for semantic image segmentation. In Proceedings of the European Conference on Computer Vision (ECCV), Munich, Germany, 8–14 September 2018; pp. 801–818. [Google Scholar]
  51. Brown, S.T.; Buitrago, P.; Hanna, E.; Sanielevici, S.; Scibek, R.; Nystrom, N.A. Bridges-2: A Platform for Rapidly-Evolving and Data Intensive Research. In Proceedings of the Practice and Experience in Advanced Research Computing (PEARC), Virtual, 19–22 July 2021; pp. 1–4. [Google Scholar]
  52. Asgharnezhad, H.; Shamsi, A.; Alizadehsani, R.; Mohammadi, A.; Alinejad-Rokny, H. Enhancing Monte Carlo Dropout performance for uncertainty quantification. Neural Comput. Appl. 2026, 38, 464. [Google Scholar] [CrossRef]
  53. Ledda, E.; Fumera, G.; Roli, F. Dropout injection at test time for post hoc uncertainty quantification in neural networks. Inf. Sci. 2023, 648, 119573. [Google Scholar]
  54. Wieler, M.; Hahn, T.; Hamprecht, F.A. Weakly supervised learning for industrial optical inspection. In Proceedings of the DAGM Symposium on Pattern Recognition, Heidelberg, Germany, 12–14 September 2007. [Google Scholar]
  55. Liu, Y.; Yao, J.; Lu, X.; Xie, R.; Li, L. DeepCrack: A deep hierarchical feature learning architecture for crack segmentation. Neurocomputing 2019, 338, 139–153. [Google Scholar] [CrossRef]
  56. Fallahy, S.; Rezazadeh, N. MARBLE-DA: Masonry analysis with robust, batch-normalised, label-free, explainable domain adaptation for crack detection. J. Build. Eng. 2025, 116, 114673. [Google Scholar] [CrossRef]
Figure 1. Representative ELO BSE images from Dataset-1 (a), 795 × 795 pixels, 25 μm/pixel) and Dataset-2 (b), 2857 × 2857 pixels, 7 μm/pixel). Scale bars indicate a 20 mm field of view. Bright regions correspond to dense material and dark regions indicate surface pores.
Applsci 16 07506 g001
Figure 2. Data annotation process: (a) an original AM sample image with various pore structures; (b) pore detection results from classical detection system used for annotation; and (c) the binary ground-truth mask generated from classical detection.
Applsci 16 07506 g002
Figure 3. Visual pore detection model comparison.
Applsci 16 07506 g003
Figure 4. Original image after denoising.
Applsci 16 07506 g004
Figure 5. Pixel-level detection results of U-SAMNet on 43 held-out real test images (2,818,100 total pixels). Background pixels (95.63%) dominate due to class imbalance, which is why F1-score (85.31%) and IoU (74.38%) are used as primary evaluation metrics. * Background includes pixels outside coupon regions; accuracy (99.42%) is computed over coupon regions only.
Applsci 16 07506 g005
Table 1. Comparison of industrial defect detection methods on standard benchmarks and E-PBF AM dataset, including uncertainty-aware and attention-based baselines.
MethodYearDatasetPerformanceUncertaintyReal-Time
Existing Methods on Public Benchmarks
Tabernik et al. [10]2020KolektorSDD96.5% Acc (seg)NoNo
Bergmann et al. [27]2019MVTec AD88.8% AUROCNoNo
Božič et al. [14]2021DAGM & KolektorSDD99% APNoYes
Yang et al. [9]2023MVTec AD96.4% AUROCNoYes
Zhao et al. [8]2024MVTec AD98.2% AUROCNoYes
Uncertainty-Aware and Attention Baselines on E-PBF AM Dataset
MC-Dropout U-Net [12]2026E-PBF AM75.40% F1YesYes
Attention U-Net [28]2026E-PBF AM78.69% F1NoYes
SE-U-Net [29]2026E-PBF AM80.62% F1NoYes
CBAM-U-Net [30]2026E-PBF AM82.09% F1NoYes
Proposed Method
U-SAMNet2026E-PBF AM85.31% F1YesYes
All E-PBF AM baselines were trained on 7147 images and evaluated on 43 held-out real test images under identical protocols.
Table 2. Performance comparison of U-SAMNet against standard segmentation baseline models on the E-PBF AM dataset. All models trained on 7147 images and evaluated on 43 held-out real test images.
MethodAccuracyPrecisionRecallF1-Score
U-Net99.4772.9076.8074.80
ResNet50-UNet99.4271.2072.5071.84
VGG16-UNet99.5880.1080.4080.25
DeepLabV3+99.0249.0028.5036.04
HRNet99.4571.5078.2074.70
U-SAMNet (Ours)99.4287.1083.6085.31
Bold indicates the proposed method and its results.
Table 3. Comparison of U-SAMNet against uncertainty-aware and attention-based baselines on the E-PBF AM dataset. All models trained on 7147 images and evaluated on 43 held-out real test images.
MethodAccuracyPrecisionRecallF1-ScoreIoU
MC-Dropout U-Net98.9875.2075.6075.4060.51
Attention U-Net99.1479.3078.1078.6964.87
SE-U-Net99.2581.4079.8580.6267.53
CBAM-U-Net99.3182.9081.3082.0969.62
U-SAMNet (Ours)99.4287.1083.6085.3174.38
Bold indicates the proposed method and its results.
Table 4. Effect of GAN synthetic data augmentation on U-SAMNet performance. All metrics evaluated on the same 43 held-out real test images.
Training DataSamplesAccuracyPrecisionRecallF1-ScoreIoU
Real + rotation only114799.3573.2056.8063.9748.13
Real + rotation + GAN714799.4287.1083.6085.3174.38
Bold indicates the best result in each column. All models were trained with identical hyperparameters and evaluated on the same held-out real test set.
Table 5. Bootstrap confidence intervals (95%, n = 1000 resamples) for U-SAMNet on the 43 held-out real test images.
MetricMeanStd95% CI Lower95% CI Upper
Accuracy99.42%0.02%99.38%99.46%
Precision87.10%0.18%86.75%87.45%
Recall83.60%0.20%83.21%83.99%
F1-Score85.31%0.15%85.02%85.60%
IoU74.38%0.22%73.95%74.81%
Table 6. Uncertainty calibration metrics computed on the held-out real test set using T = 10 MC-dropout forward passes.
MetricValueInterpretation
Brier Score0.0046Lower is better (0 = perfect)
ECE0.0017Lower is better (0 = perfect)
AUROC (uncertainty vs error)0.6748Higher is better (1 = perfect)
Table 7. Comparison of computational requirements across models. Inference time is measured per image at batch size 4 on Bridges-2 GPU hardware.
MethodParams (M)Size (MB)Inference Time (ms)FLOPs (G)Memory (MB)
U-Net7.6988.2018.4815.3929.35
ResNet5045.76349.8328.5418.31174.58
VGG1638.78296.0527.6815.51147.94
DeepLabV3+13.31101.8319.405.3350.80
HRNet54.0067.08 26.781.5133.40
U-SAMNet1.6913.1217.460.686.47
Bold indicates the proposed method and its results. HRNet model size reflects values measured during the original experiment and may differ from theoretical estimates due to implementation and checkpoint format differences.
Table 8. Ablation study on various datasets.
DatasetVariantAccuracyPrecisionF1-Score
AMFull U-SAMNet99.4287.1085.31
w/o UGA Block99.1680.2579.44
w/o Uncertainty99.1379.6278.81
w/o Multi-task99.2081.0580.12
w/o Denoising99.2783.3582.10
DAGM 2007Full U-SAMNet98.8388.2485.09
w/o UGA Block98.5583.1080.69
w/o Uncertainty98.4982.4580.06
w/o Multi-task98.6184.0281.41
w/o Denoising98.6885.7782.70
DeepCrackFull U-SAMNet98.5791.0582.32
w/o UGA Block98.2286.8078.49
w/o Uncertainty98.1785.9277.68
w/o Multi-task98.2987.4579.04
w/o Denoising98.4189.1280.54
Bold indicates the full model in each dataset group.
Disclaimer/Publisher’s Note: The statements, opinions and data contained in all publications are solely those of the individual author(s) and contributor(s) and not of MDPI and/or the editor(s). MDPI and/or the editor(s) disclaim responsibility for any injury to people or property resulting from any ideas, methods, instructions or products referred to in the content.