Article

LiteFracNet: An Efficient Feature Interaction Network for Fracture Detection in Medical Images

School of Optoelectronic Engineering, Xi’an Technological University, Xi’an 710021, China
*
Author to whom correspondence should be addressed.
Appl. Sci. 2026, 16(15), 7484; https://doi.org/10.3390/app16157484
Submission received: 26 June 2026 / Revised: 21 July 2026 / Accepted: 23 July 2026 / Published: 27 July 2026
(This article belongs to the Special Issue AI-Based Biomedical Signal and Image Processing)

Abstract

Automated fracture detection remains challenging because fracture regions often exhibit low contrast, blurred boundaries, large scale variations, and substantial morphological diversity. Although deep learning-based detectors show promising performance, they often suffer from limited category coverage and insufficient multi-scale feature representation. To address these issues, we propose LiteFracNet, a lightweight framework for accurate and efficient fracture detection. C3-CFormer enhances feature representation via residual aggregation, gated dynamic modeling, and long-range dependency extraction. C2Mona improves fine-grained fracture perception using multi-scale convolution and feature separation–reconstruction. The OmniKernel Fusion Pyramid Network (OFPN) promotes cross-level feature interaction and multi-scale information propagation, improving detection of subtle fractures. The Fusion-Enhanced Detection Head (FED-Head) employs channel alignment and shared convolutions to unify multi-scale features, reducing redundancy in conventional multi-branch heads. On the HBFMID, LiteFracNet achieves a mAP50 of 93.53% with 2.41 M parameters, 8.1 GFLOPs, a 4.9 MB model size, and 87.1 FPS inference speed. It also achieves a mAP50 of 61.43% on the pediatric GRAZPEDWRI-DX dataset, demonstrating competitive cross-dataset adaptability. These results indicate that LiteFracNet has the potential to efficiently assist computers in detecting fractures.

1. Introduction

Fractures are among the most common clinical injuries and are typically caused by disruptions in bone integrity under external forces. They are often associated with pain, swelling, functional impairment, and, in severe cases, various complications, substantially affecting patients’ quality of life [1]. In recent decades, fractures have become a major global public health concern. According to the World Health Organization (WHO), there were approximately 178 million new fracture cases worldwide in 2019, representing a 33.4% increase compared with 1990, while the number of people living with fracture-related symptoms reached 455 million, an increase of 70.1% [2]. Fracture prevalence and characteristics vary considerably across regions and populations [3]. For instance, osteoporosis affected 19.2% of the Chinese population aged 50 years and older in 2018 [4], while fracture incidence has continued to rise in aging societies such as Japan and Germany [5,6]. Similar upward trends have also been reported in developing countries, partly due to traffic accidents and occupational injuries [7]. These findings highlight the growing global burden of fractures and the urgent need for early and accurate fracture detection.
Traditional automated fracture detection methods mainly rely on handcrafted texture features combined with conventional machine learning models for fracture localization. However, these approaches depend heavily on expert knowledge and manual feature design, which limits their robustness and generalizability in large-scale medical imaging applications, such as X-ray, CT, and MRI. For example, Sharma et al. [8] extracted bone texture features using Histogram of Oriented Gradients (HOG) and employed a Support Vector Machine (SVM) classifier, achieving an F1-score of 92%. Muzakki et al. [9] compared HOG, Local Binary Patterns (LBP), and Scale-Invariant Feature Transform (SIFT) features for X-ray fracture detection using a K-Nearest Neighbors (KNN) classifier and reported an accuracy of 99.03% with the HOG-KNN model. In subsequent work, Muzakki et al. [10] further improved the accuracy to 99.30% by integrating KNN, decision trees, and random forests into an ensemble framework. Despite promising results, these methods rely on separating feature extraction from classification, limiting feature expressiveness, adaptability, and scalability. Efficient end-to-end fracture detection methods that minimize handcrafted features and expert intervention are essential for real-time clinical decision support.
With the rapid development of artificial intelligence, deep learning-based object detection has become mainstream for automated fracture detection, improving accuracy and efficiency. One-stage and two-stage detectors are the two dominant paradigms. One-stage detectors, such as YOLO and its variants [11,12], perform localization and classification in a single forward pass, providing high detection speed and computational efficiency. In contrast, two-stage detectors, such as PCB-Faster-RCNN [13], first generate candidate regions through a Region Proposal Network (RPN) and then perform classification and bounding-box regression. Although two-stage detectors generally achieve stronger localization performance, they usually involve more complex inference pipelines and slower runtime. For example, Qi et al. [14] applied Faster R-CNN with a multi-resolution Feature Pyramid Network (FPN) and a ResNet-50 backbone to fracture detection, achieving a detection accuracy of 71.5% at the cost of substantial computational resources. Jia et al. [15] proposed a sternum fracture detection method based on Cascade R-CNN with an attention mechanism, achieving a mAP of 71% on 1227 X-ray images, but its inference speed was only 10.9 FPS, limiting its efficiency for clinical deployment. In comparison, YOLO-based detectors provide a more favorable trade-off between detection accuracy and computational efficiency through end-to-end prediction. For instance, Qiu et al. [16] incorporated HGNetV2, DySample, GSConv, and Focaler-CIoU into YOLOv4 for wrist fracture detection, achieving a mAP50 of 65% with an inference time of 2.7 ms. Fu et al. [17] developed a YOLOv4-based model for ultrasound fracture fragment detection that outperformed YOLOv3 in mAP50, although the number of detectable categories remained limited.
Despite these advances, current fracture detection models remain insufficient for routine clinical application because most are evaluated on limited datasets and rarely consider complex multi-lesion cases, making their robustness across different anatomical regions, patient populations, imaging modalities, and acquisition conditions uncertain. Moreover, improvements in benchmark accuracy often come with increased computational cost, while clinically important false-negative errors and external validation remain insufficiently assessed. To address this, we propose a lightweight one-stage fracture detection model that enhances performance while maintaining computational efficiency. The main contributions are:
(1) We design C3-CFormer to enhance contextual feature representation by combining lightweight residual aggregation, gated dynamic modeling, and Transformer-based long-range dependency learning.
(2) We introduce C2Mona to capture fine-grained fracture features through multi-scale convolution and feature separation–reconstruction, thereby improving fracture detection.
(3) We introduce the OmniKernel Fusion Pyramid Network to strengthen cross-level feature fusion and multi-scale information propagation while preserving subtle structural details.
(4) We design FED-Head to reduce structural redundancy and computational cost through channel alignment and shared convolutions while maintaining robust multi-scale detection performance.
The rest of this paper is organized as follows: Section 2 reviews fracture detection research; Section 3 introduces the architecture and key modules of LiteFracNet; Section 4 details the experimental setup and dataset; Section 5 presents results and analysis; and Section 6 discusses limitations and future directions.

2. Related Work

2.1. The Application of Deep Learning in Medical Lesion Detection

Object detection is a key computer vision task that localizes and classifies objects in images. Unlike image classification, it also predicts bounding boxes with confidence scores. Recent deep learning advances have improved medical image analysis, particularly lesion detection, enhancing automation and diagnostic precision. Baldini et al. [18] proposed the SRE-YOLO method, which enables automatic detection of laryngeal cancer lesions at different scales from endoscopic White Light (WL) and Narrow-Band Imaging (NBI) images, with an inference speed of 58.8 frames per second (FPS). Similarly, Chen et al. [19] designed the HD-YOLO model by integrating Dual-Domain Fusion Convolution (DDFConv) and Multi-Scale Channel Fusion (MSCF), improving the detection efficiency of endometrial lesions, achieving a mAP of 79.5% and a 13.9% increase in FPS compared to the baseline. Wang et al. [20] designed the SIH-Det model, incorporating the Multi-Scale Dilated Feature Aggregation (MDFA) module and Dynamic Hybrid Processing Unit (DHPU), resulting in a mAP50 of 98.4%. Based on YOLOv7 and HLSAM, Liu et al. [21] proposed a segmentation method for breast cancer microcalcification clusters; by combining the accuracy of YOLOv7 with the segmentation capability of HLSAM, this method achieved a Dice coefficient of 88.76% ± 0.32% on the VinDr-Mammo dataset. Kang et al. [22] presented the PK-YOLO brain tumor detection model, which significantly improves the detection performance for small brain tumors by integrating pre-trained knowledge with lightweight convolutional neural networks. Sun et al. [23] proposed the GD-RTDETR model, which introduces Cascaded Group Attention (CGA), Gated Sampling, and a Dual-Fusion Enhanced Path Aggregation Network (GDPAN), increasing the mAP50 for lung nodule detection by 4.1% compared with the baseline. Finally, Han et al. [24] constructed the lightweight breast cancer detection network YOLOv9-AGMA, in which an Adaptive Gated Multi-scale Attention (AGMA) module improves detection accuracy by 9.9% over the baseline model.
Deep learning technologies have demonstrated considerable potential in medical imaging diagnostics, not only enhancing diagnostic accuracy but also optimizing clinical workflows. With ongoing advances in algorithms, these technologies are poised to play an increasingly pivotal role in aiding diagnosis and quantifying pathological lesions.

2.2. Detection and Classification of Fracture Lesions

Accurate fracture localization remains challenging due to lesion diversity and blurred boundaries. Various improvements to one-stage detectors have been proposed to address this issue. Zou et al. [25] incorporated an attention mechanism into the YOLOv7 model, achieving a mAP of 86.2% on the FracAtlas dataset. However, this approach increased parameter complexity and did not include cross-modal training to validate the model’s generalization performance. Zhang et al. [26] optimized the YOLO11 model by integrating the Bone-Multi-Scale Convolutional Attention (Bone-MSCA) module and Focal-SIoU loss function, improving mAP50 by 1.24% over the baseline, although the accuracy gain was modest. Nguyen et al. [27] evaluated the YOLOv4 model on wrist fracture X-ray datasets, achieving 90.36% accuracy, but the model’s redundant parameters limited its clinical deployment. Liu et al. [28] achieved 92.1% mAP50 using YOLO11 on fracture datasets; however, complex cases involving multiple coexisting lesions were excluded from the analysis. The Kid-YOLO model, proposed by Liu et al. [29] for pediatric wrist fracture detection, improved accuracy by 3.2%, but its limited training and validation datasets posed risks of overfitting, restricting its broader clinical applicability. Ju et al. [30] introduced the Feature Context Excitation-YOLOv8 model, which achieved significant results on the GRAZPEDWRI-DX dataset. However, the minimal variant of this model contains 43 million parameters and consumes 465.6 GFLOPs. Hsieh et al. [31] proposed the YOLOR model, achieving 93.4% accuracy on spinal CT image datasets by replacing the backbone network with MobileViT and EfficientNet_NS. However, the model’s high parameter complexity and the dataset’s limited category diversity remain notable drawbacks.
Therefore, the key research gap lies not only in limited category coverage and model complexity, but also in the insufficient evidence regarding robustness across datasets, patient populations, anatomical regions, and clinically challenging cases. Accordingly, this study aims to enhance fracture feature representation while reducing computational overhead, thereby establishing a technically viable foundation for subsequent external and clinical validation.

3. Research Methodology

3.1. Proposed Method

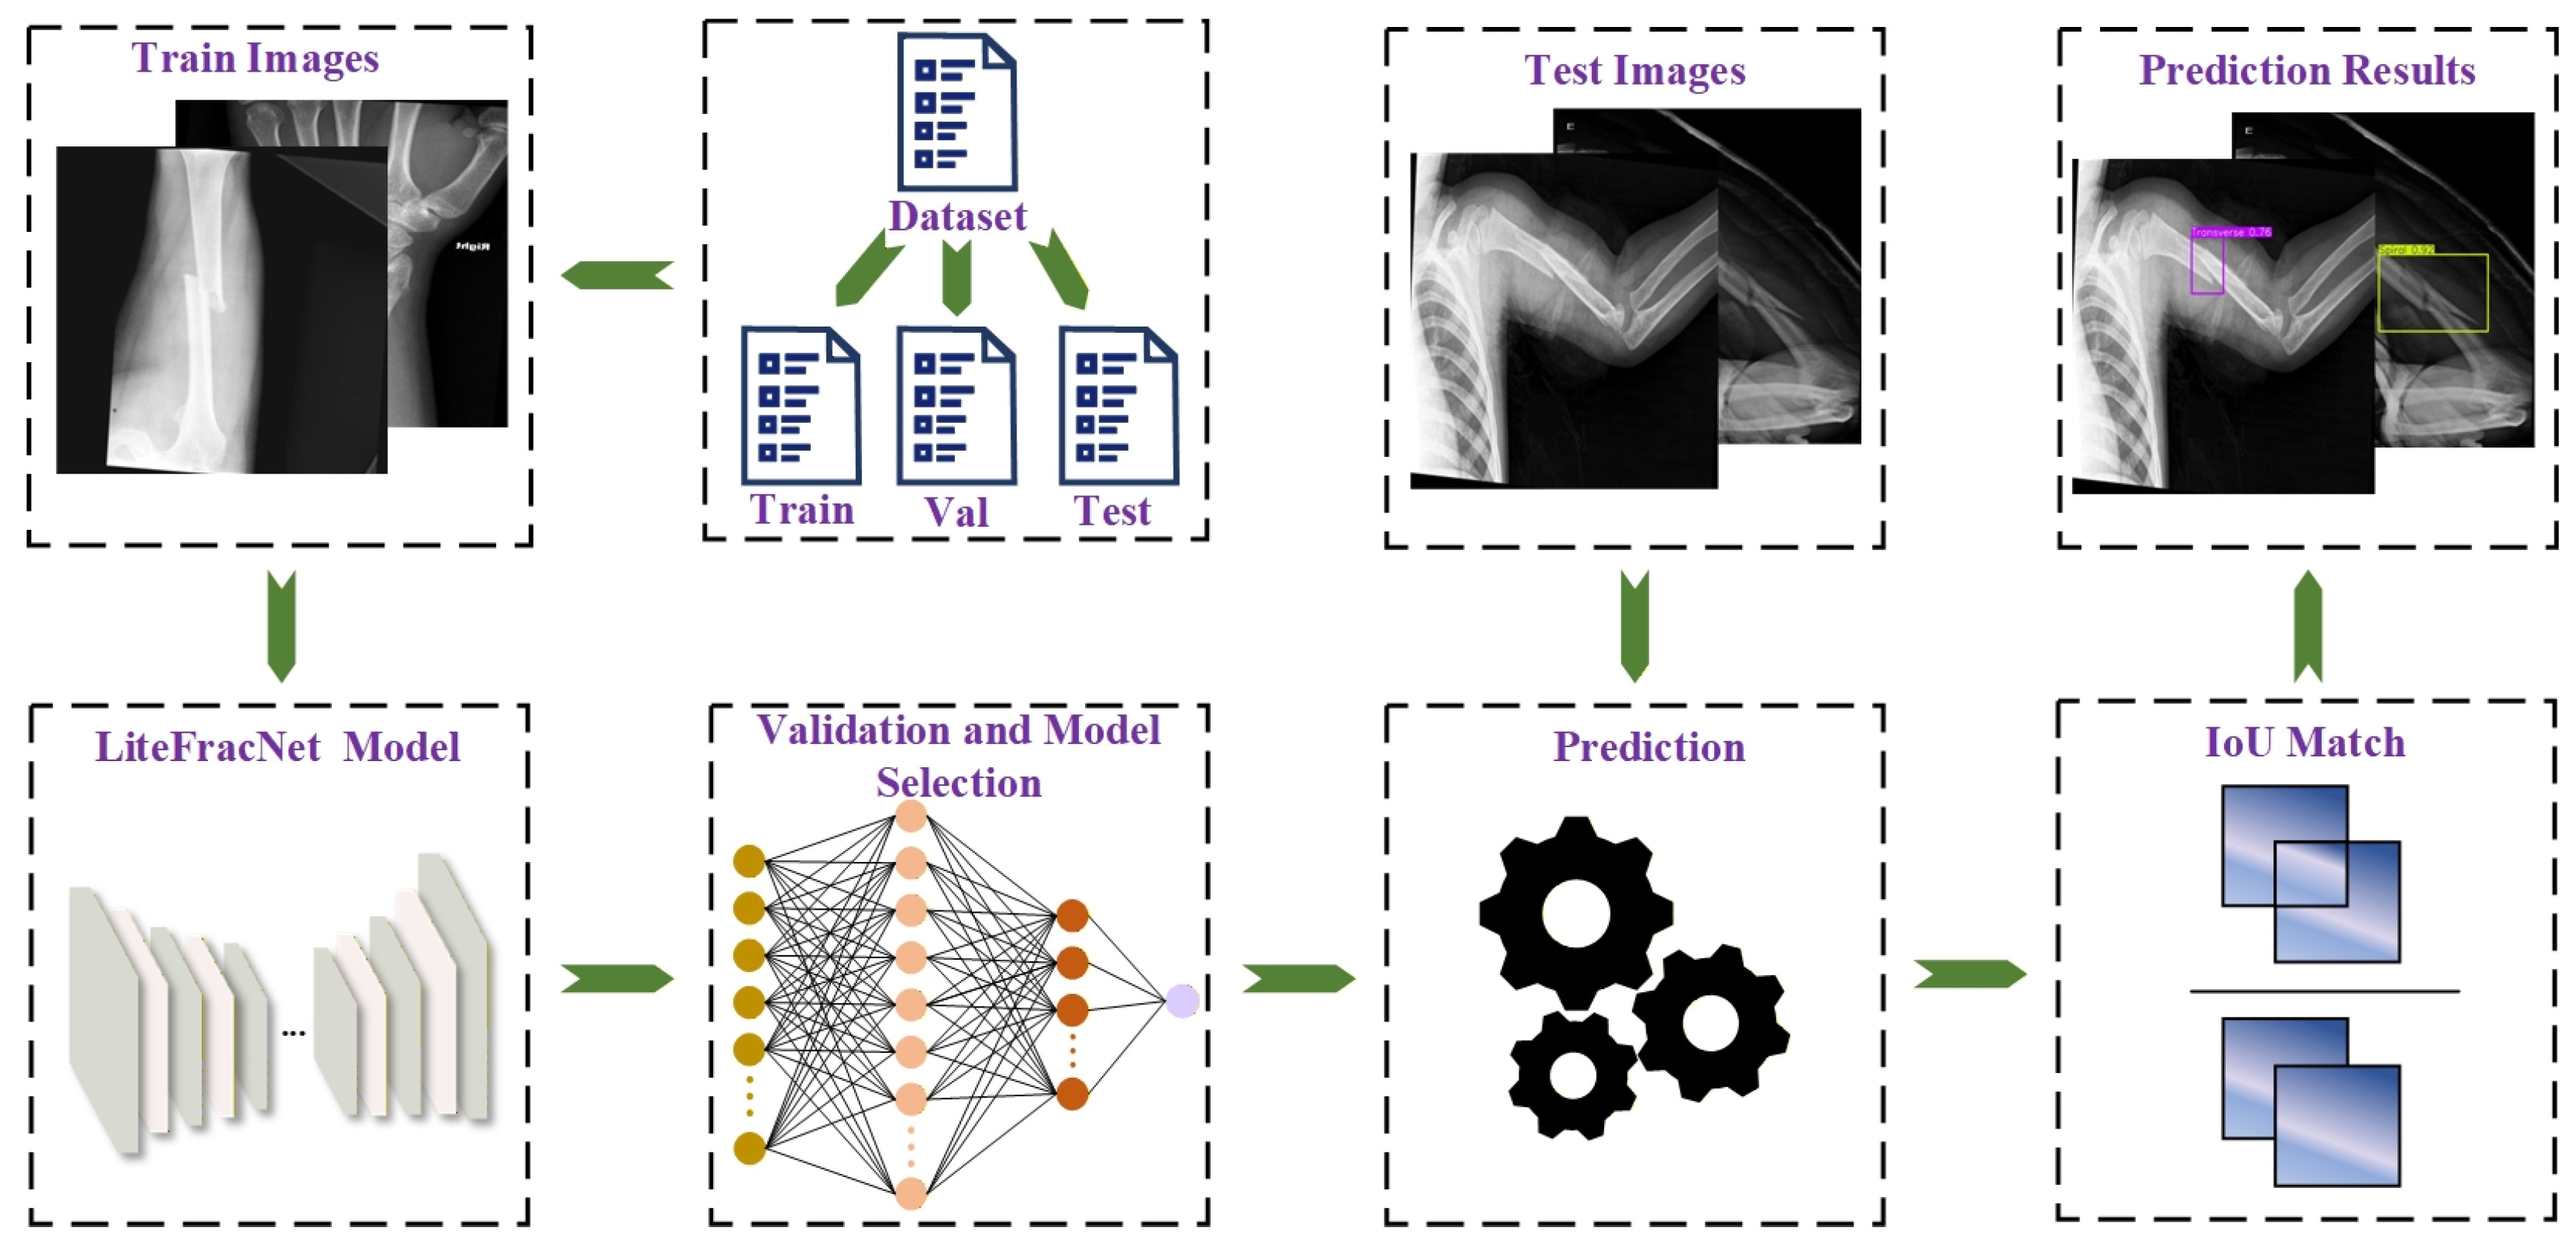
Figure 1 illustrates the overall workflow of the proposed fracture detection framework. All images were resized to 640 × 640 pixels, with the corresponding annotations adjusted accordingly. The dataset was divided into training, validation, and test sets according to the predefined split. The training set was used for model optimization, while the validation set was used to monitor the training process and select the best-performing model. The selected model was subsequently evaluated on the independent test set. During inference, predictions below the predefined confidence threshold were removed, and the remaining results were presented using bounding boxes and class labels.

3.2. LiteFracNet Model

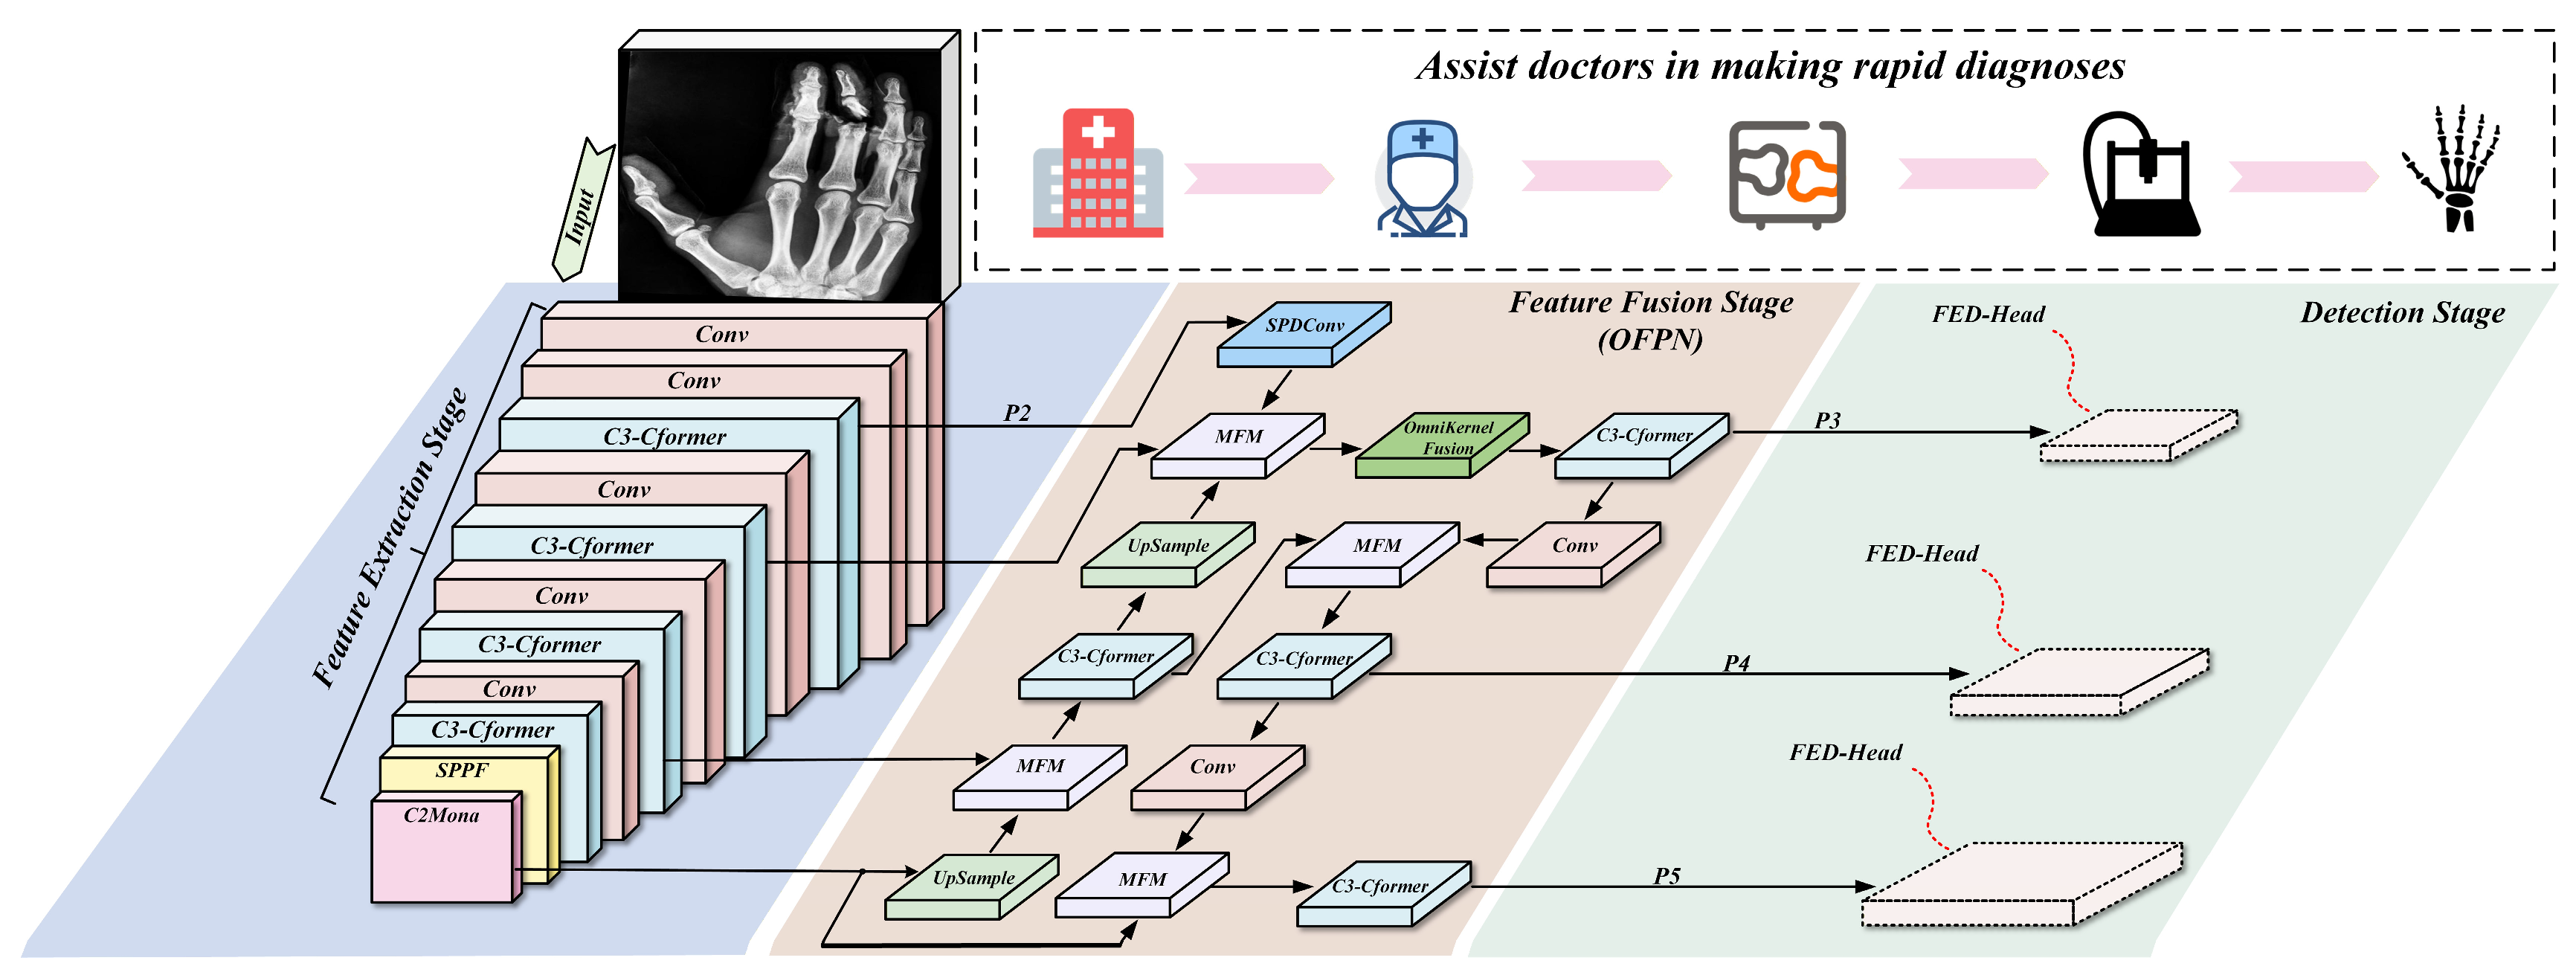
This paper proposes LiteFracNet, an efficient and lightweight model for multi-class fracture detection. LiteFracNet integrates several key modules. C3-CFormer enhances contextual feature representation through residual aggregation, gated dynamic modeling, and long-range dependency learning. C2Mona captures fine-grained fracture cues via multi-scale convolutions and feature separation–reconstruction, improving the detection of blurred fracture boundaries. OFPN promotes cross-level feature interaction and multi-scale information propagation, thereby preserving subtle fracture details. FED-Head aligns channel dimensions and employs shared convolutions to model multi-scale features in a unified feature space, reducing redundancy and improving cross-scale information flow. The overall architecture of LiteFracNet is shown in Figure 2.

3.3. C3-CFormer Module

Current one-stage fracture detectors primarily rely on multi-scale feature modules to enhance feature extraction. However, because these modules are built on local convolutions, they struggle to capture long-range dependencies between distant features. Although some models incorporate self-attention mechanisms to model long-range dependencies and better exploit distant contextual information, their high computational complexity and memory overhead still hinder real-time deployment.
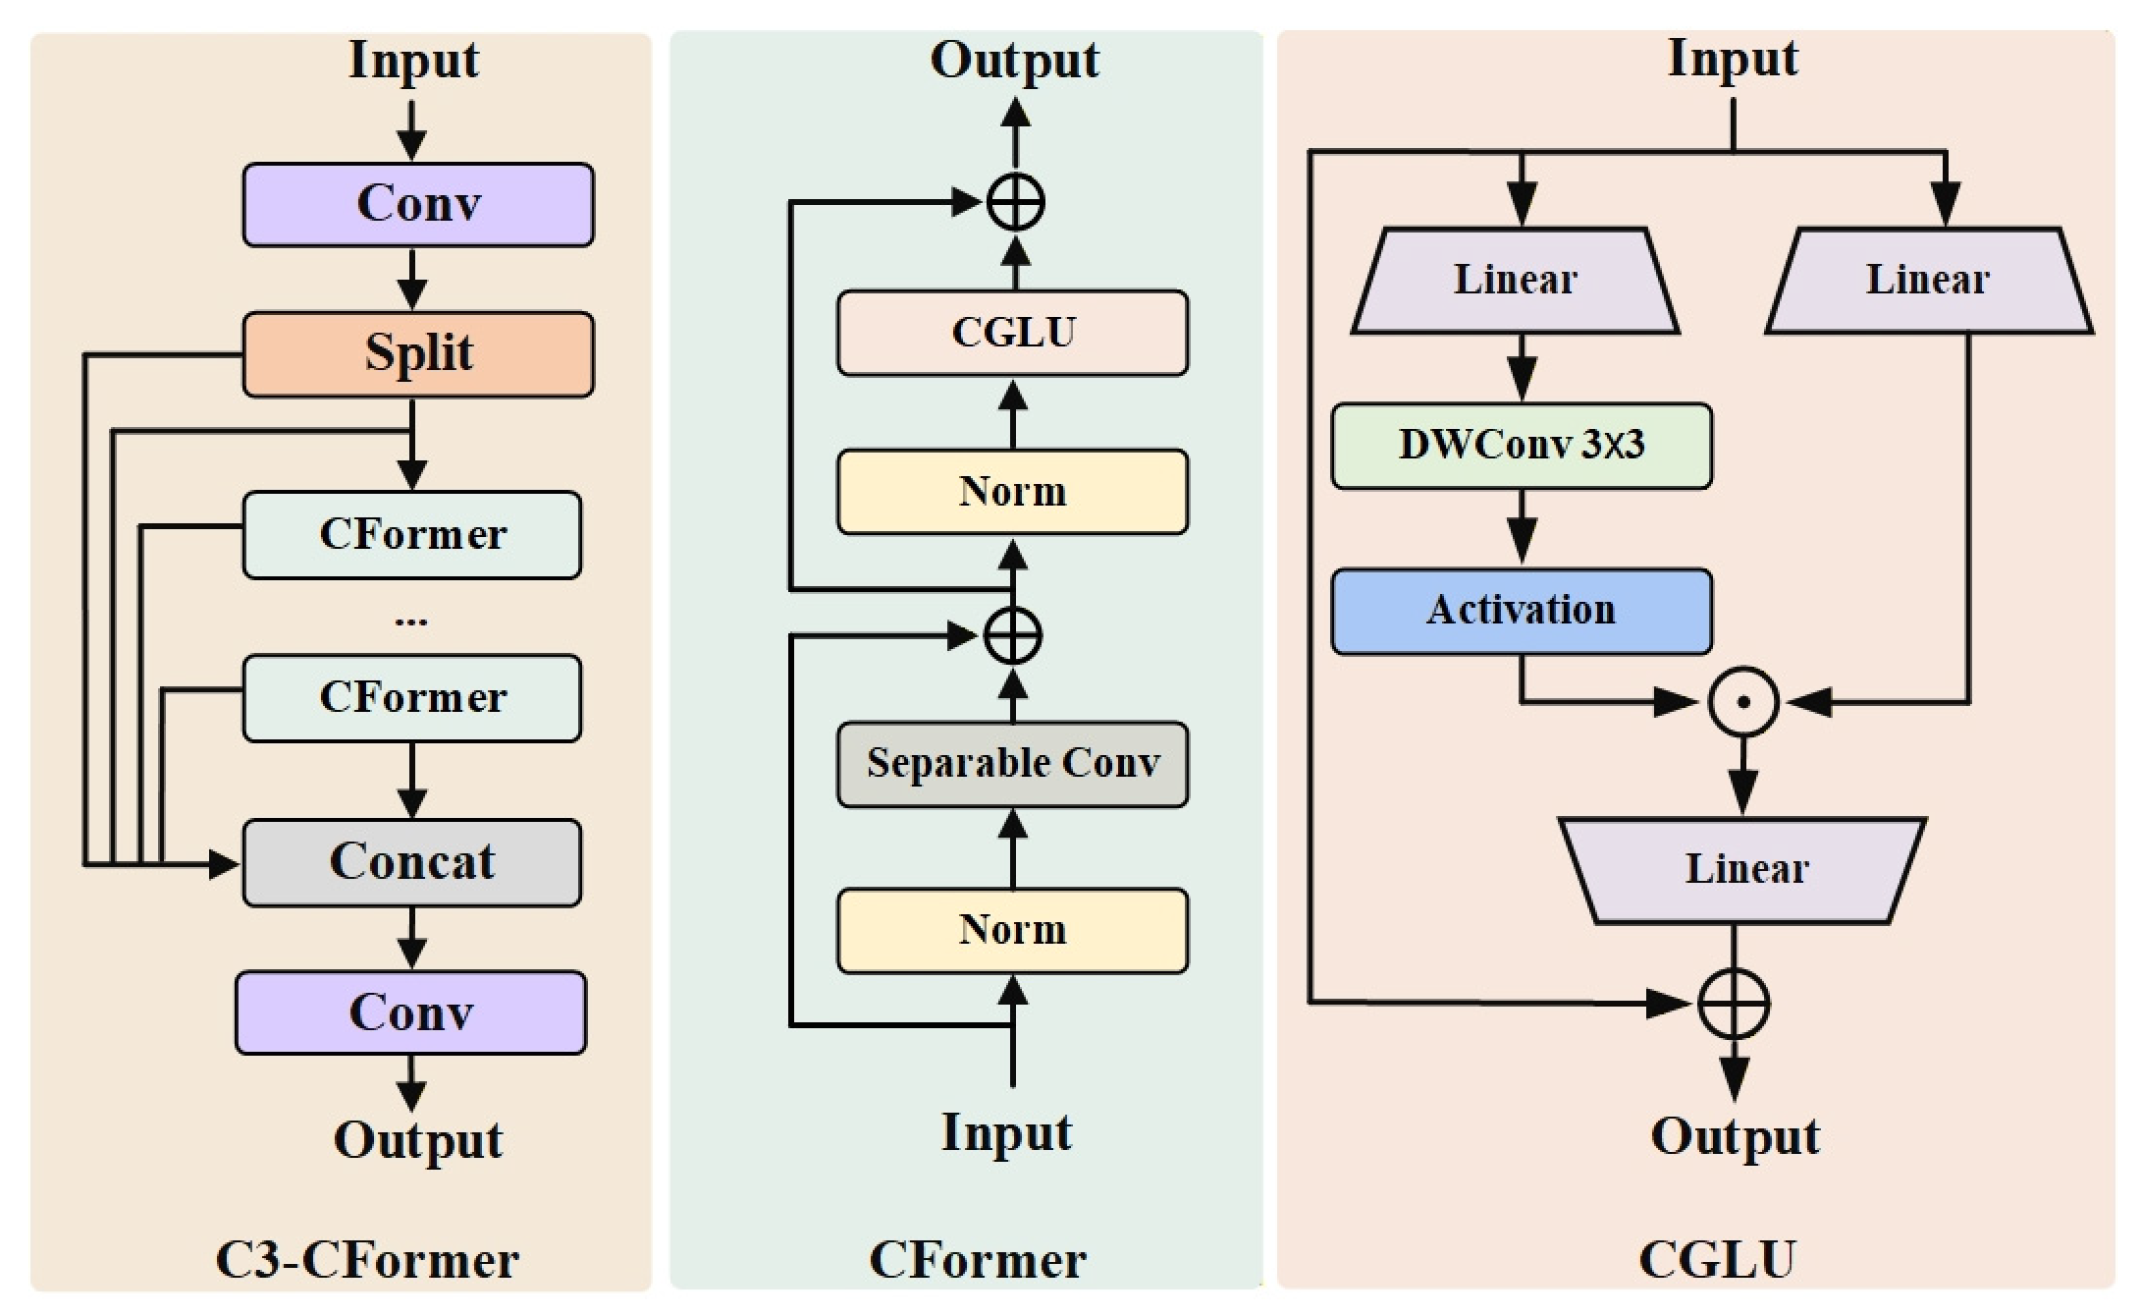
To address these limitations, we construct C3-CFormer by integrating the existing ConvFormer block [32] and CGLU mechanism [33] into the C3 residual aggregation framework. The novelty lies in this fracture-oriented architectural integration, which combines long-range contextual modeling with local gated feature interaction while maintaining a lightweight structure. Embedded within the C3 framework, this architecture preserves the advantages of lightweight residual aggregation while incorporating Transformer-based long-range dependency modeling and gated dynamic mechanisms, thereby substantially improving feature representation. The structure of C3-CFormer is illustrated in Figure 3.
The ConvFormer module in the C3-CFormer architecture uses a Channel Multi-layer Perceptron (MLP) for information transfer and feature transformation along the channel dimension. Dependence between channels is captured through nonlinear transformations in the fully connected network. However, Channel MLP has limitations, particularly its inability to effectively capture local spatial information, and its structure restricts dynamic adaptability.
To address these issues, this study introduces the Convolutional Gated Linear Unit (CGLU) into ConvFormer, replacing the traditional MLP. This modification enhances both the model’s performance and computational efficiency. The computation process is as follows:
X m i d d l e = S e p a r a b l e C o n v ( N o r m ( X ) ) + β 1 ( X )
X o u t p u t = C G L U ( N o r m ( X m i d d l e ) ) + β 2 ( X m i d d l e )
where X C × H × W represents the input features, β 1 and β 2 denote the residual scaling factors. The CGLU enhances local feature modeling by combining convolutional operations with a gating mechanism. Specifically, the Gated Linear Unit (GLU) is a channel-mixing mechanism formed by two linear projections. In the gating branch, the input first undergoes a 3 × 3 depth-wise convolution to capture local features at each spatial position, and a gating signal is then generated from the neighboring features. This signal is activated using GELU, after which the original input and the gating signal are combined via element-wise multiplication to regulate the information flow. In this way, the model can adaptively modulate the input based on local features, producing more representative outputs.
C G L U ( X ) = C o n v ( G E L U ( D W C o n v ( C o n v ( X 1 ) ) ) C o n v ( X 2 ) )
Y o u t p u t = C G L U ( X ) + X
where C o n v ( X 1 ) and C o n v ( X 2 ) denote the two channel-wise splits obtained from a 1 × 1 convolution, ⊙ represents element-wise multiplication, DWConv refers to depth-wise convolution, and GELU is the activation function.

3.4. C2Mona Module

Fracture regions in medical images typically exhibit low contrast, blurred edges, and substantial morphological variability, which poses significant challenges for multi-scale feature extraction. Although the existing Cross-Channel Parallel Spatial Attention (C2PSA) module improves feature representation through multi-layer attention mechanisms, it still has the following limitations: (1) multi-layer attention computations introduce considerable computational overhead and (2) its fixed convolutional kernel structure struggles to capture both local edge details and global texture information.
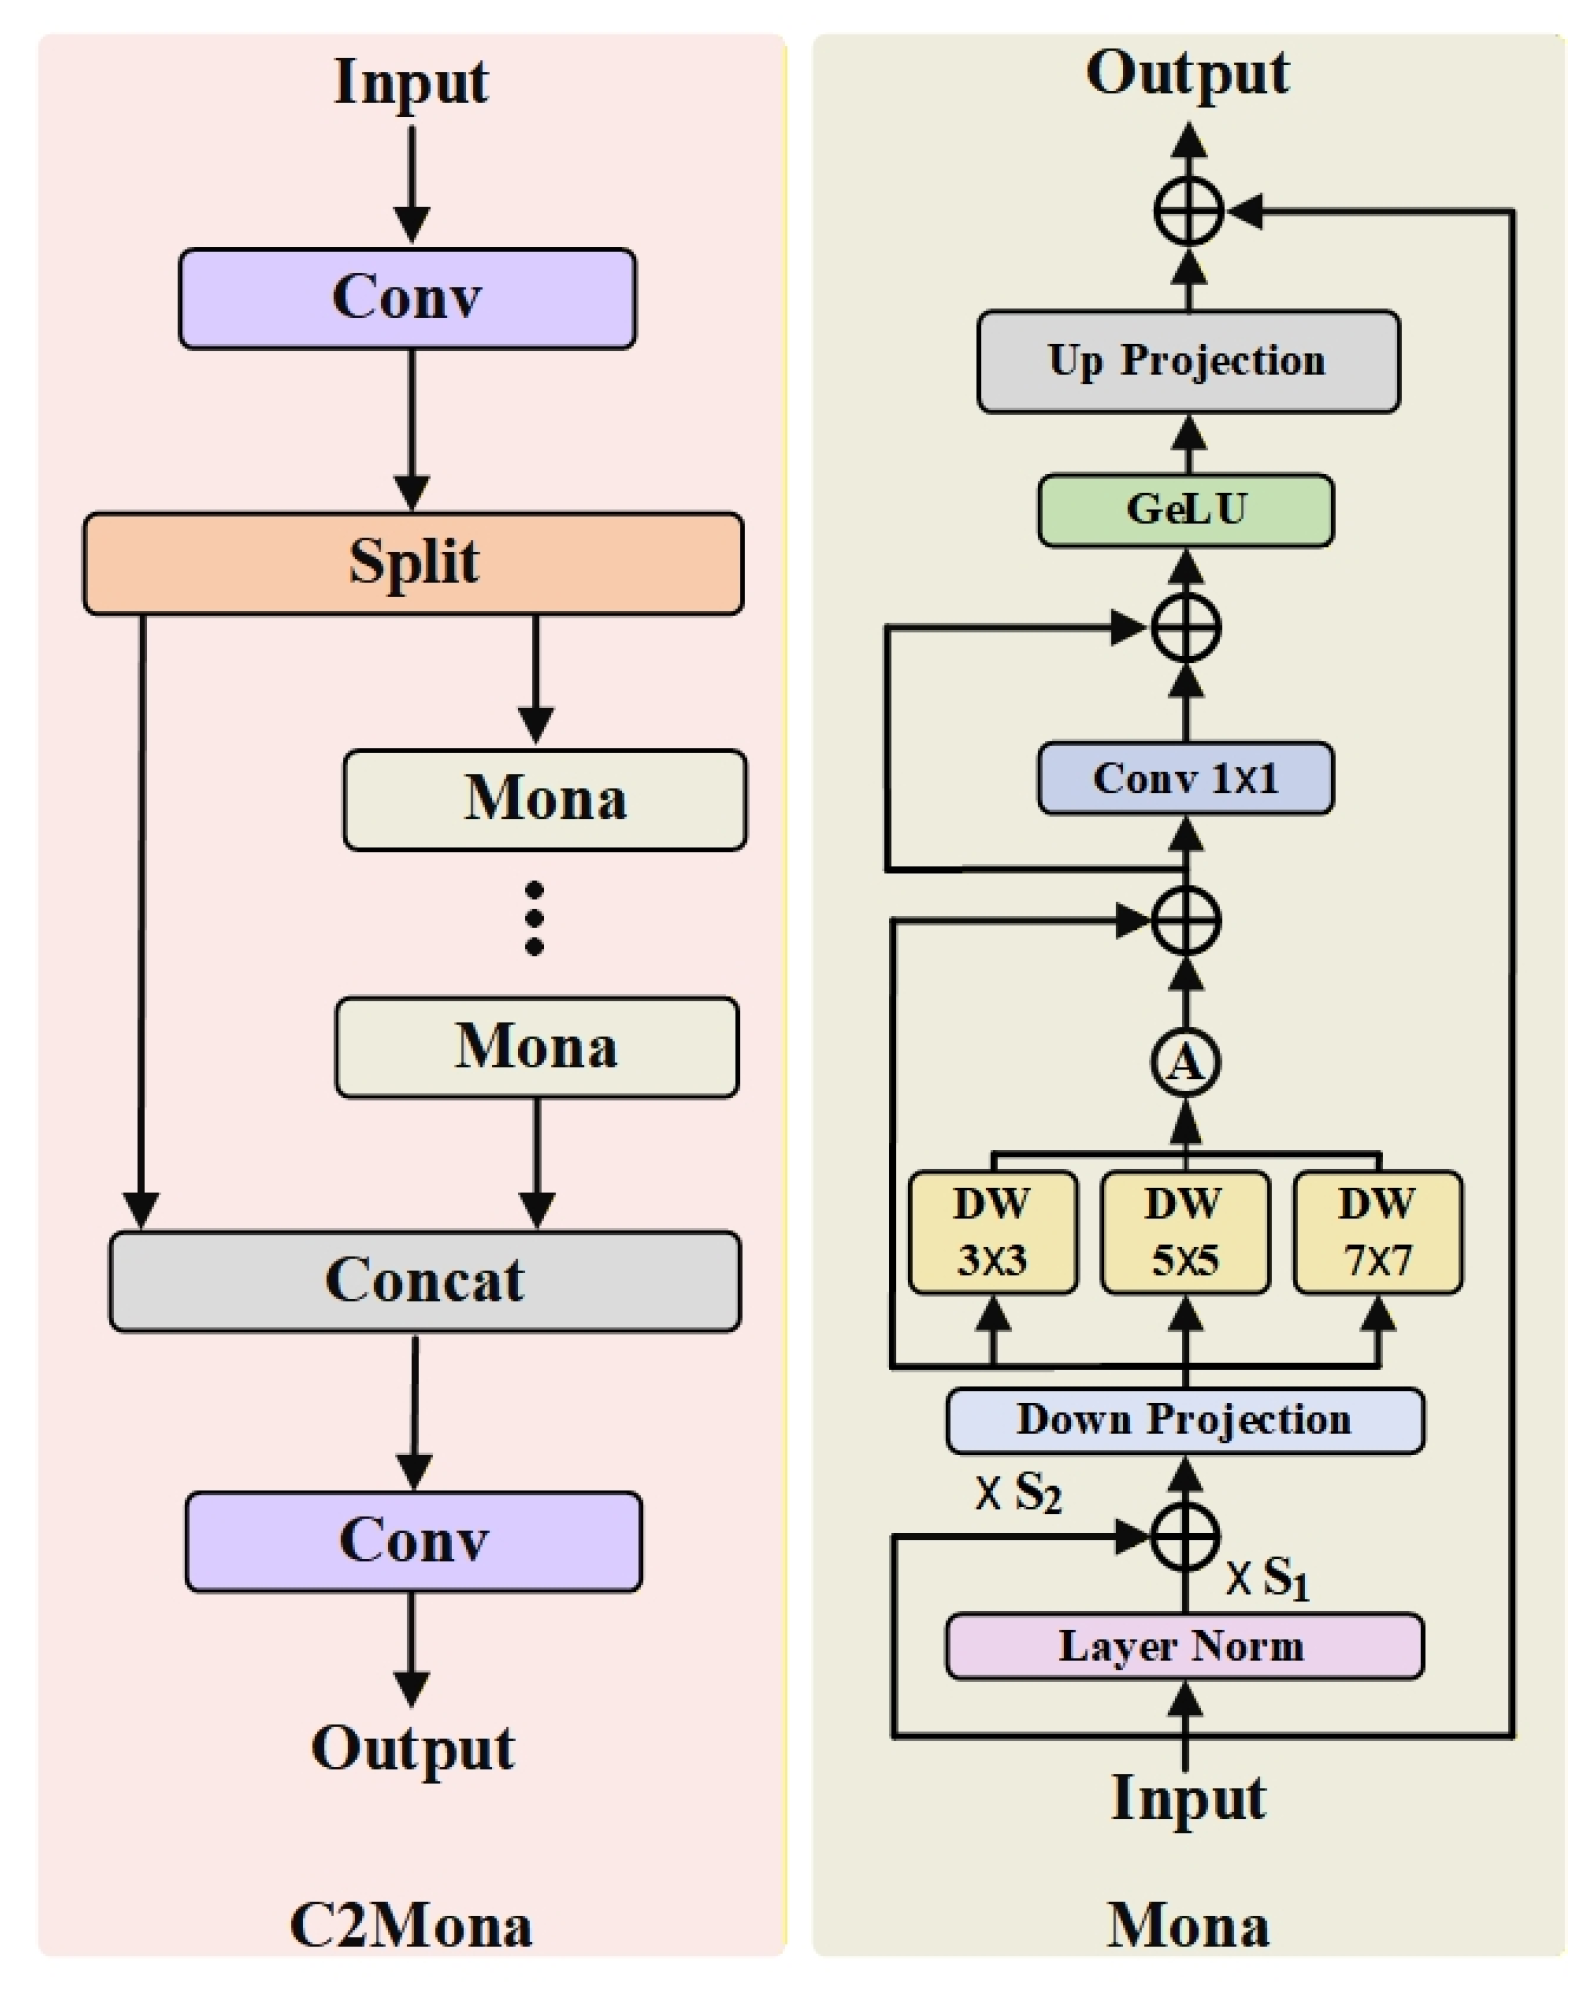
To address these limitations, we develop C2Mona by integrating the existing Mona transformation block [34] into a partial-feature aggregation architecture based on channel splitting, parallel feature transformation, and subsequent feature recombination. Through the coordinated use of multi-scale depth-wise convolution, channel compression–reconstruction, and residual fusion, C2Mona is tailored to capture low-contrast fracture features with blurred boundaries while maintaining low computational overhead. The architecture of C2Mona is illustrated in Figure 4.
The C2Mona module inherits the “grouping-parallel-fusion” strategy from the C2-series modules. The input feature X C × H × W is first processed by a convolutional layer and then divided into sub-feature groups along the channel dimension. Each sub-feature group is passed through a Mona sub-module for feature extraction. The resulting feature groups are concatenated along the channel dimension and subsequently fused by another convolutional layer to produce the final output. The overall functional expression is given as follows:
Y m i d d l e = C o n v ( X )
S p l i t ( Y m i d d l e ) = [ Y 1 , Y 2 ]
U 0 = Y 2
U i = M i ( U i 1 ) , i = 1 , , n
Y = C o n v ( C o n c a t ( Y 1 , U n ) )
where M i ( ) represents the Mona sub-module, Y 1 denotes the identity branch, and Y 2 denotes the Mona branch. The core of the Mona sub-module consists of feature normalization, down-projection, multi-scale depth-wise convolution, nonlinear activation, up-projection, and residual fusion. The module first applies down-projection to reduce the channel dimension from C to C / S 1 , alleviating the computational burden for subsequent multi-scale convolutions. Parallel multi-scale depth-wise convolutions (DWConv 3 × 3, 5 × 5, 7 × 7) then extract feature information at different receptive fields. The resulting convolution outputs are fused through point-wise convolutions to align with the semantic distribution across different scales.
The fused features are passed through the GeLU activation function to introduce nonlinearity and then up-projected to restore the channel dimension to its original size C , enabling semantic compensation and reconstruction. Finally, the output is fused with the input features via a residual connection, facilitating context enhancement while maintaining stable feature distribution, thus supporting effective deep network training. The computation expression is as follows:
(1) The input features are first subjected to 2D layer normalization (LayerNorm2d) and then scaled using learnable parameters:
X = S 1 L N ( X ) + S 2 X
where S 1 and S 2 are learnable parameters, representing element-wise multiplication across channels.
(2) Channel reduction:
P = D o w n P r o j e c t i o n ( X )
(3) Multi-scale depth-wise convolution:
D k = D o w n C o n v k × k ( P ) , k { 3 , 5 , 7 }
(4) The output is fused through averaging and residual connection:
U = P + 1 3 k { 3 , 5 , 7 } D k
Followed by a 1 × 1 convolution and residual operation.
Z = U + C o n v 1 × 1 ( U )
(5) Features are nonlinearly transformed using GELU and subsequently projected back to the original channel dimension while preserving the spatial resolution:
Z = U p P r o j e c t i o n ( G E L U ( Z ) )
(6) The channel dimension is restored through a 1 × 1 convolution, with the input residual added:
Y = X + C o n v 1 × 1 ( Z )

3.5. OFPN Model

For fracture detection tasks, traditional detectors often lose fine-grained structural information during multi-scale feature fusion in the neck stage, particularly when fractures are subtly concealed, which increases the likelihood of missed detections. To address this challenge, we design the OmniKernel Fusion Pyramid Network (OFPN) by reorganizing existing components, including SPDConv [35], OmniKernel [36], and MFM [37], within a unified cross-level feature-pyramid architecture. The novelty of OFPN lies in the redesigned interaction pathway and its coordinated integration with C3-CFormer to enhance multi-scale information propagation and preserve subtle fracture details.
The proposed OFPN employs SPD-Conv in the high-resolution branch in combination with medium-scale semantic enhancement layers. Furthermore, OFPN introduces an OmniKernel-based feature aggregation structure (the OmniKernel fusion module) that performs weighted fusion of features at different scales, thereby enhancing the network’s discriminative power. To further improve feature modeling, the C3-CFormer module from the backbone is integrated into OFPN, enabling the network to better adapt to diverse fracture morphologies. Finally, in the multi-scale feature concatenation stage, the Modulation Fusion Module applies attention-guided adaptive recalibration for efficient feature integration, improving detection accuracy and robustness while maintaining real-time performance.

3.5.1. SPDConv Module

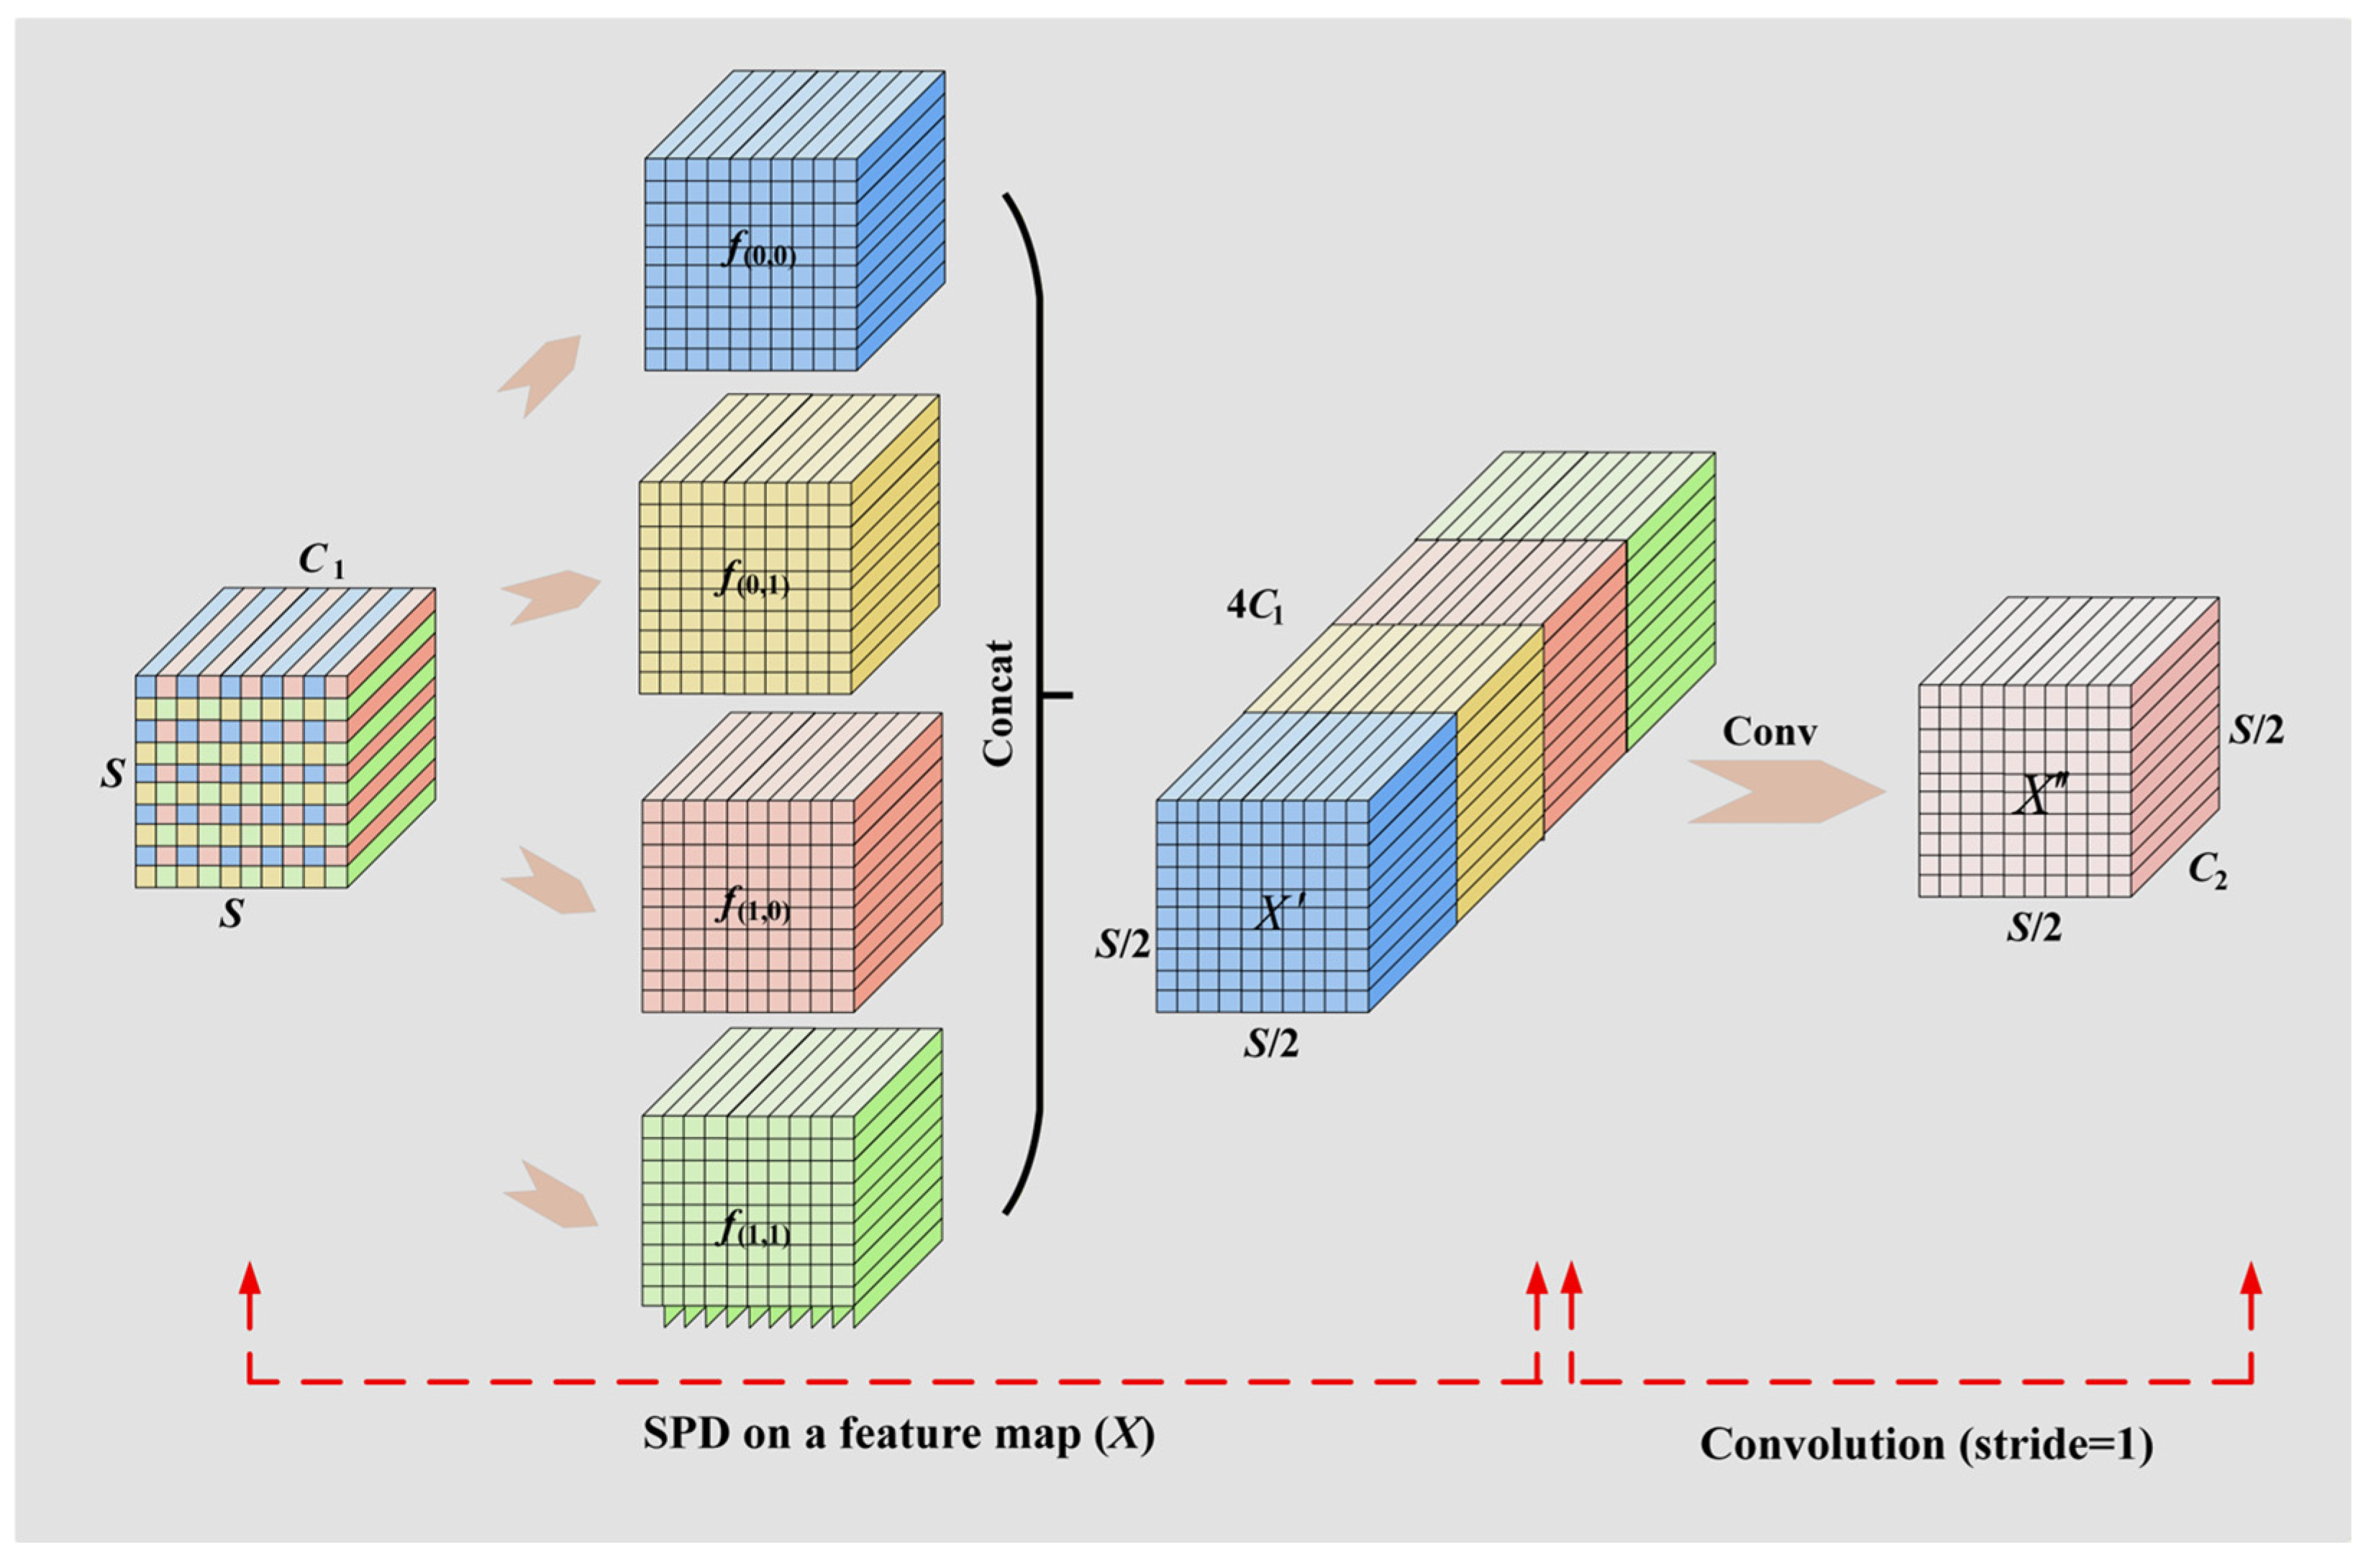
SPDConv is an enhanced convolutional structure designed to improve feature retention in low-resolution images, as illustrated in Figure 5. Unlike conventional downsampling in one-stage detectors, this module replaces strided convolutions and pooling with a Space-to-Depth (SPD) transformation, which mitigates detail loss and preserves fine-grained features. Specifically, SPDConv consists of an SPD transformation layer followed by a stride-1 convolutional layer, enabling efficient feature extraction and thereby improving fine-grained information retention. The SPD layer rearranges the input feature X C × H × W into multiple sub-feature map slices, mapping spatial resolution into the channel dimension. When the scaling factor is set to 2, the down-sampling operation produces four sub-feature maps:
G 0 , 0 = X [ 0 : S : s c a l e , 0 : S : s c a l e ] ; G 1 , 0 = X [ 1 : S : s c a l e , 0 : S : s c a l e ] ; G 0 , 1 = X [ 0 : S : s c a l e , 1 : S : s c a l e ] ; G 1 , 1 = X [ 1 : S : s c a l e , 1 : S : s c a l e ] ,
In this process, the input feature map is partitioned into four equally sized sub-feature maps, which are concatenated along the channel dimension to form an intermediate feature map X ( S / 2 ) × ( S / 2 ) × 4 C 1 . This operation reduces spatial resolution while enriching the channel-wise feature representation. A convolution with a stride of 1 is then applied to X to obtain X , where the channel dimension is compressed in a pixel-wise manner using learnable parameters, thereby preserving spatial information. This design maintains global contextual information encoded in the channel dimension and alleviates the detail loss typically associated with conventional down-sampling methods.

3.5.2. OmniKernel Fusion Module

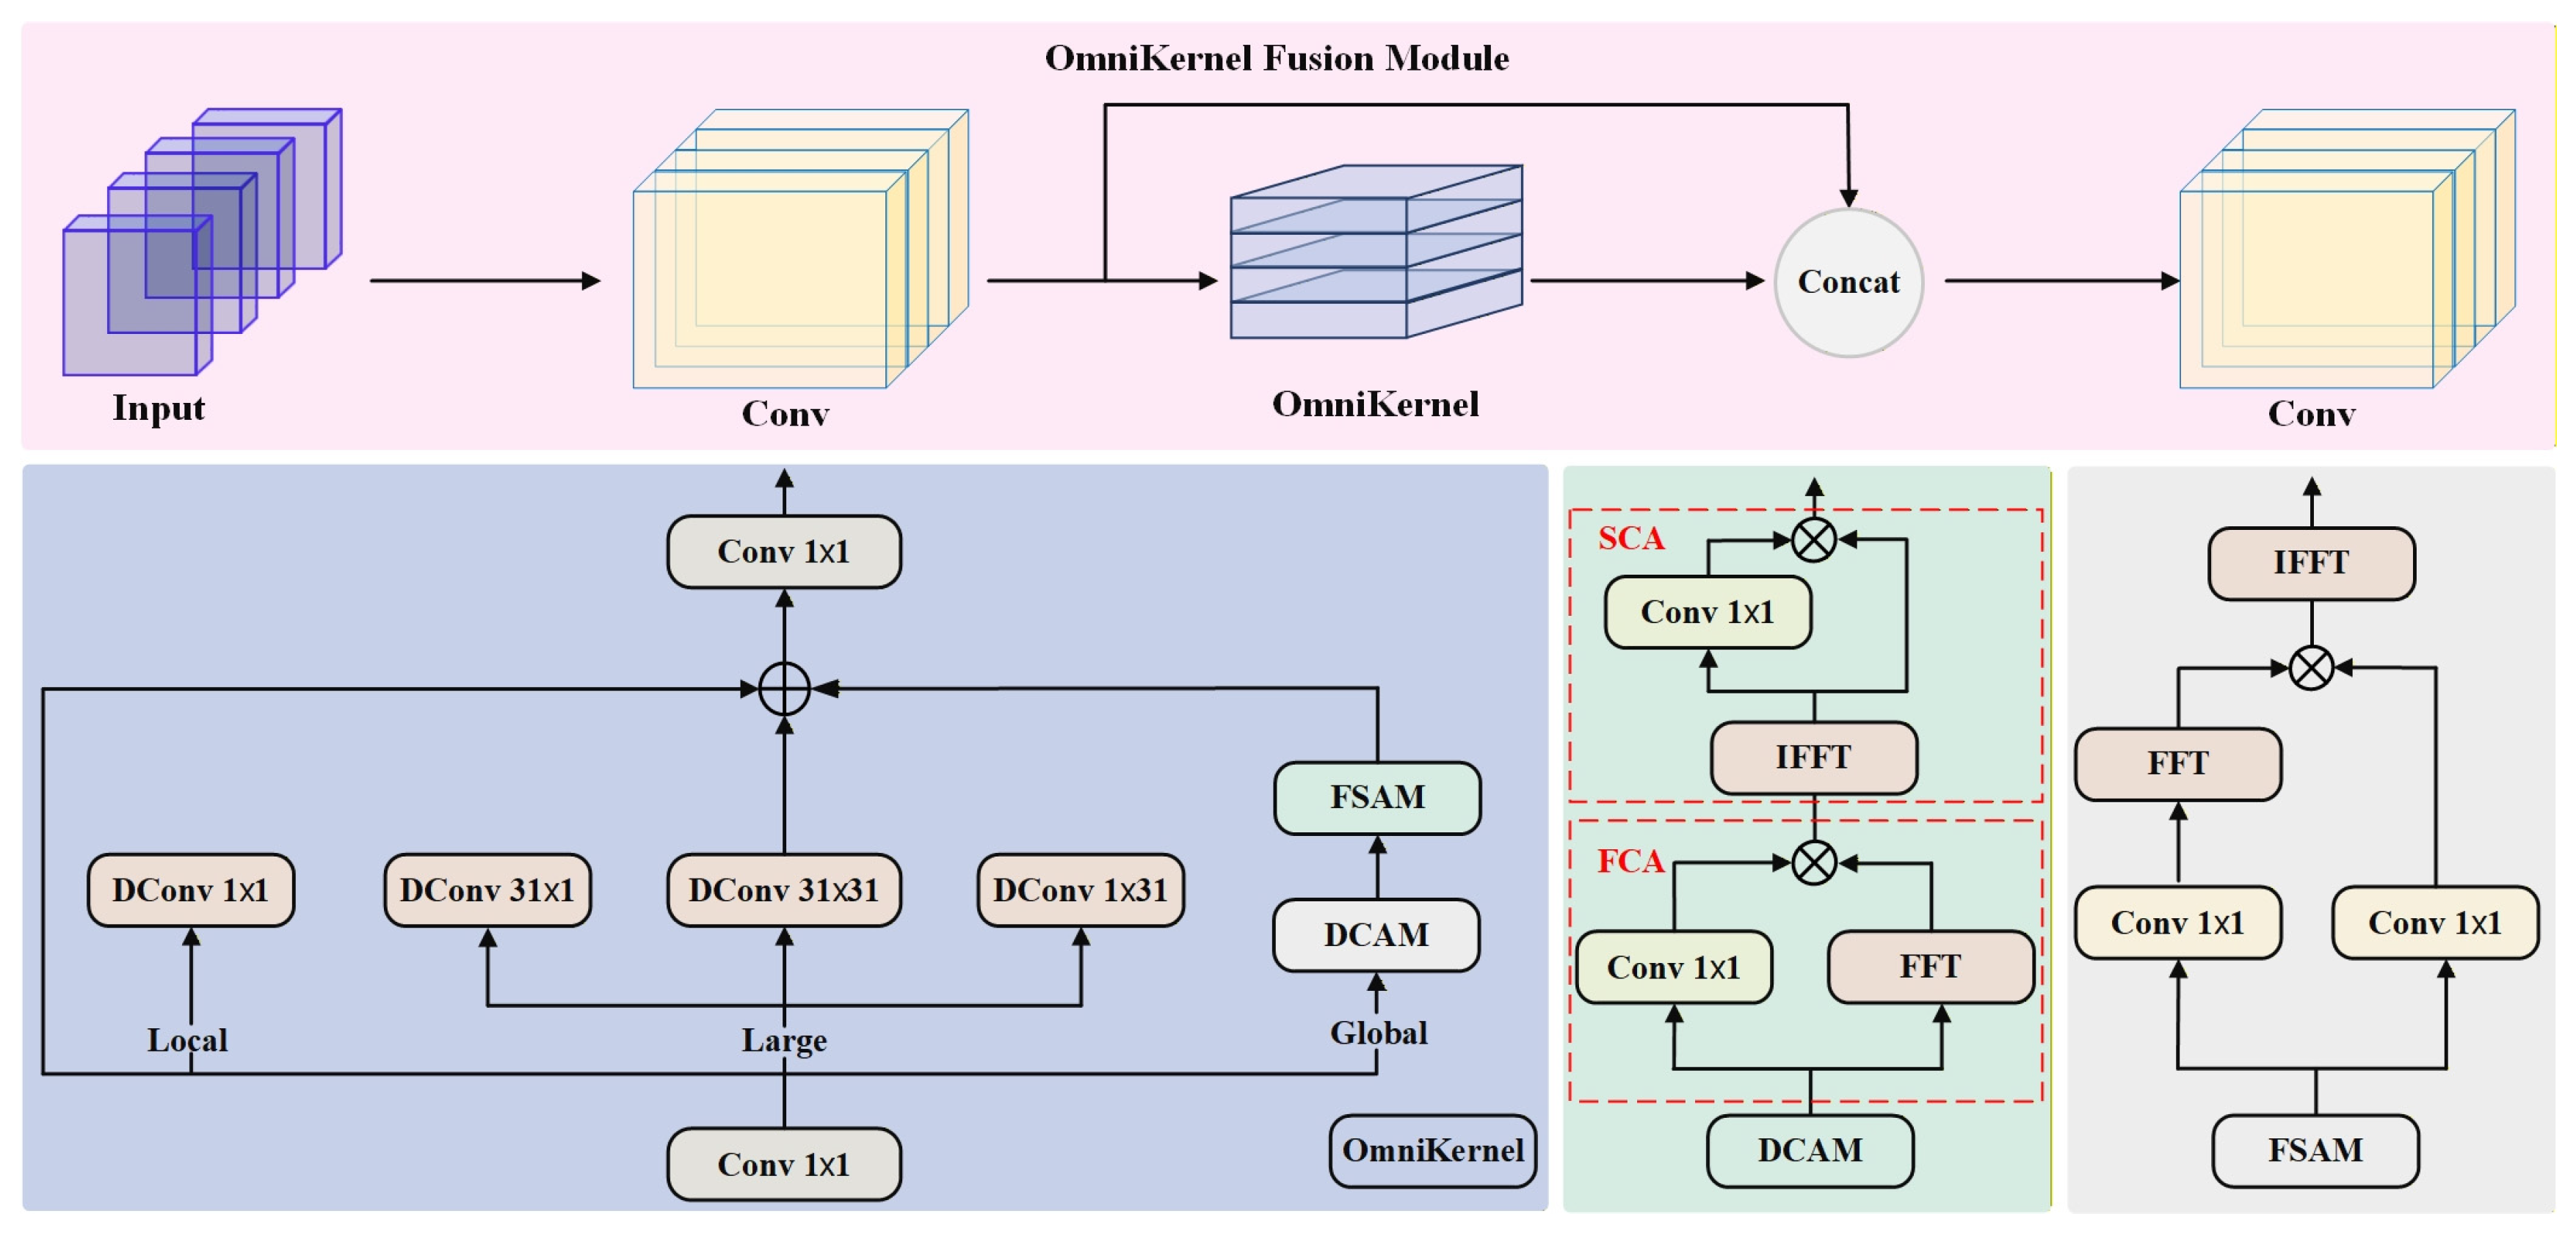
The OmniKernel Fusion module adopts multi-level residual architecture. The input feature map is split into two paths: one path is processed by a lightweight convolutional subnetwork, while the other is propagated directly to subsequent layers via a residual connection. The features from both paths are then concatenated along the channel dimension and used as input for the following processing stages, as illustrated in Figure 6.
The OmniKernel module comprises three main branches: a global branch, a large-kernel branch, and a local branch. The global branch captures broad contextual information using a Dual-domain Channel Attention Mechanism (DCAM) and a Frequency-Selective Attention Mechanism (FSAM), enabling the network to learn more comprehensive feature representations. The large-kernel branch employs deep convolutions with large receptive fields to provide multi-granularity context and enrich feature information. The local branch focuses on fine-grained local features through point-wise convolutions, ensuring effective retention of small-scale information.
In the large kernel branch, the input is processed through three independent convolutional operations. Specifically, a 31 × 31 depth-wise convolution captures broad contextual information, while 1 × 31 and 31 × 1 depth-wise separable convolutions extract fine-grained contextual features.
During the inference phase of the global branch, the traditional 31 × 31 convolution kernels fail to cover the global receptive field effectively due to the high resolution of the input images. To address this limitation, we employ a dual-domain processing strategy to enhance global feature modeling. This branch combines the DCAM and FSAM modules to strengthen the model’s global perception by amplifying informative features in both domains. The overall process can be expressed as follows:
(1) The DCAM module applies a Frequency-Channel Attention (FCA) mechanism to the input features, which can be formulated as:
X F C A = F F T ( X G l o b a l ) W 1 × 1 ( G A P ( X G l o b a l ) )
The FCA output X F C A is processed through a 1 × 1 convolution and combined with Global Average Pooling (GAP) to globally modulate the features.   represents element-wise multiplication.
(2) After Fourier transform, the global features are passed into the Spatial Channel Attention (SCA) module to refine feature representation:
X D C A M = I F F T ( X F C A ) W 1 × 1 ( G A P ( X F C A ) )
The output X D C A M of the DCAM module primarily enhances coarse-grained local domain features. This output is then passed into the FSAM to further refine the features along the spatial dimension.
(3) X F S A M , the output of the FSAM module, is enhanced using a 1 × 1 depth-wise convolution to improve local feature representation.

3.5.3. Modulation Fusion Module

One-stage detectors typically concatenate feature maps at different scales along the channel dimension using a Concat operation. However, this approach introduces several issues: (1) Concat merely stacks multi-level features, leading to information redundancy and making it difficult for the model to effectively select informative features; (2) it lacks explicit modeling of relationships between features at different levels; and (3) concatenation increases the number of channels, causing a sharp rise in the computational complexity of subsequent convolutional layers.
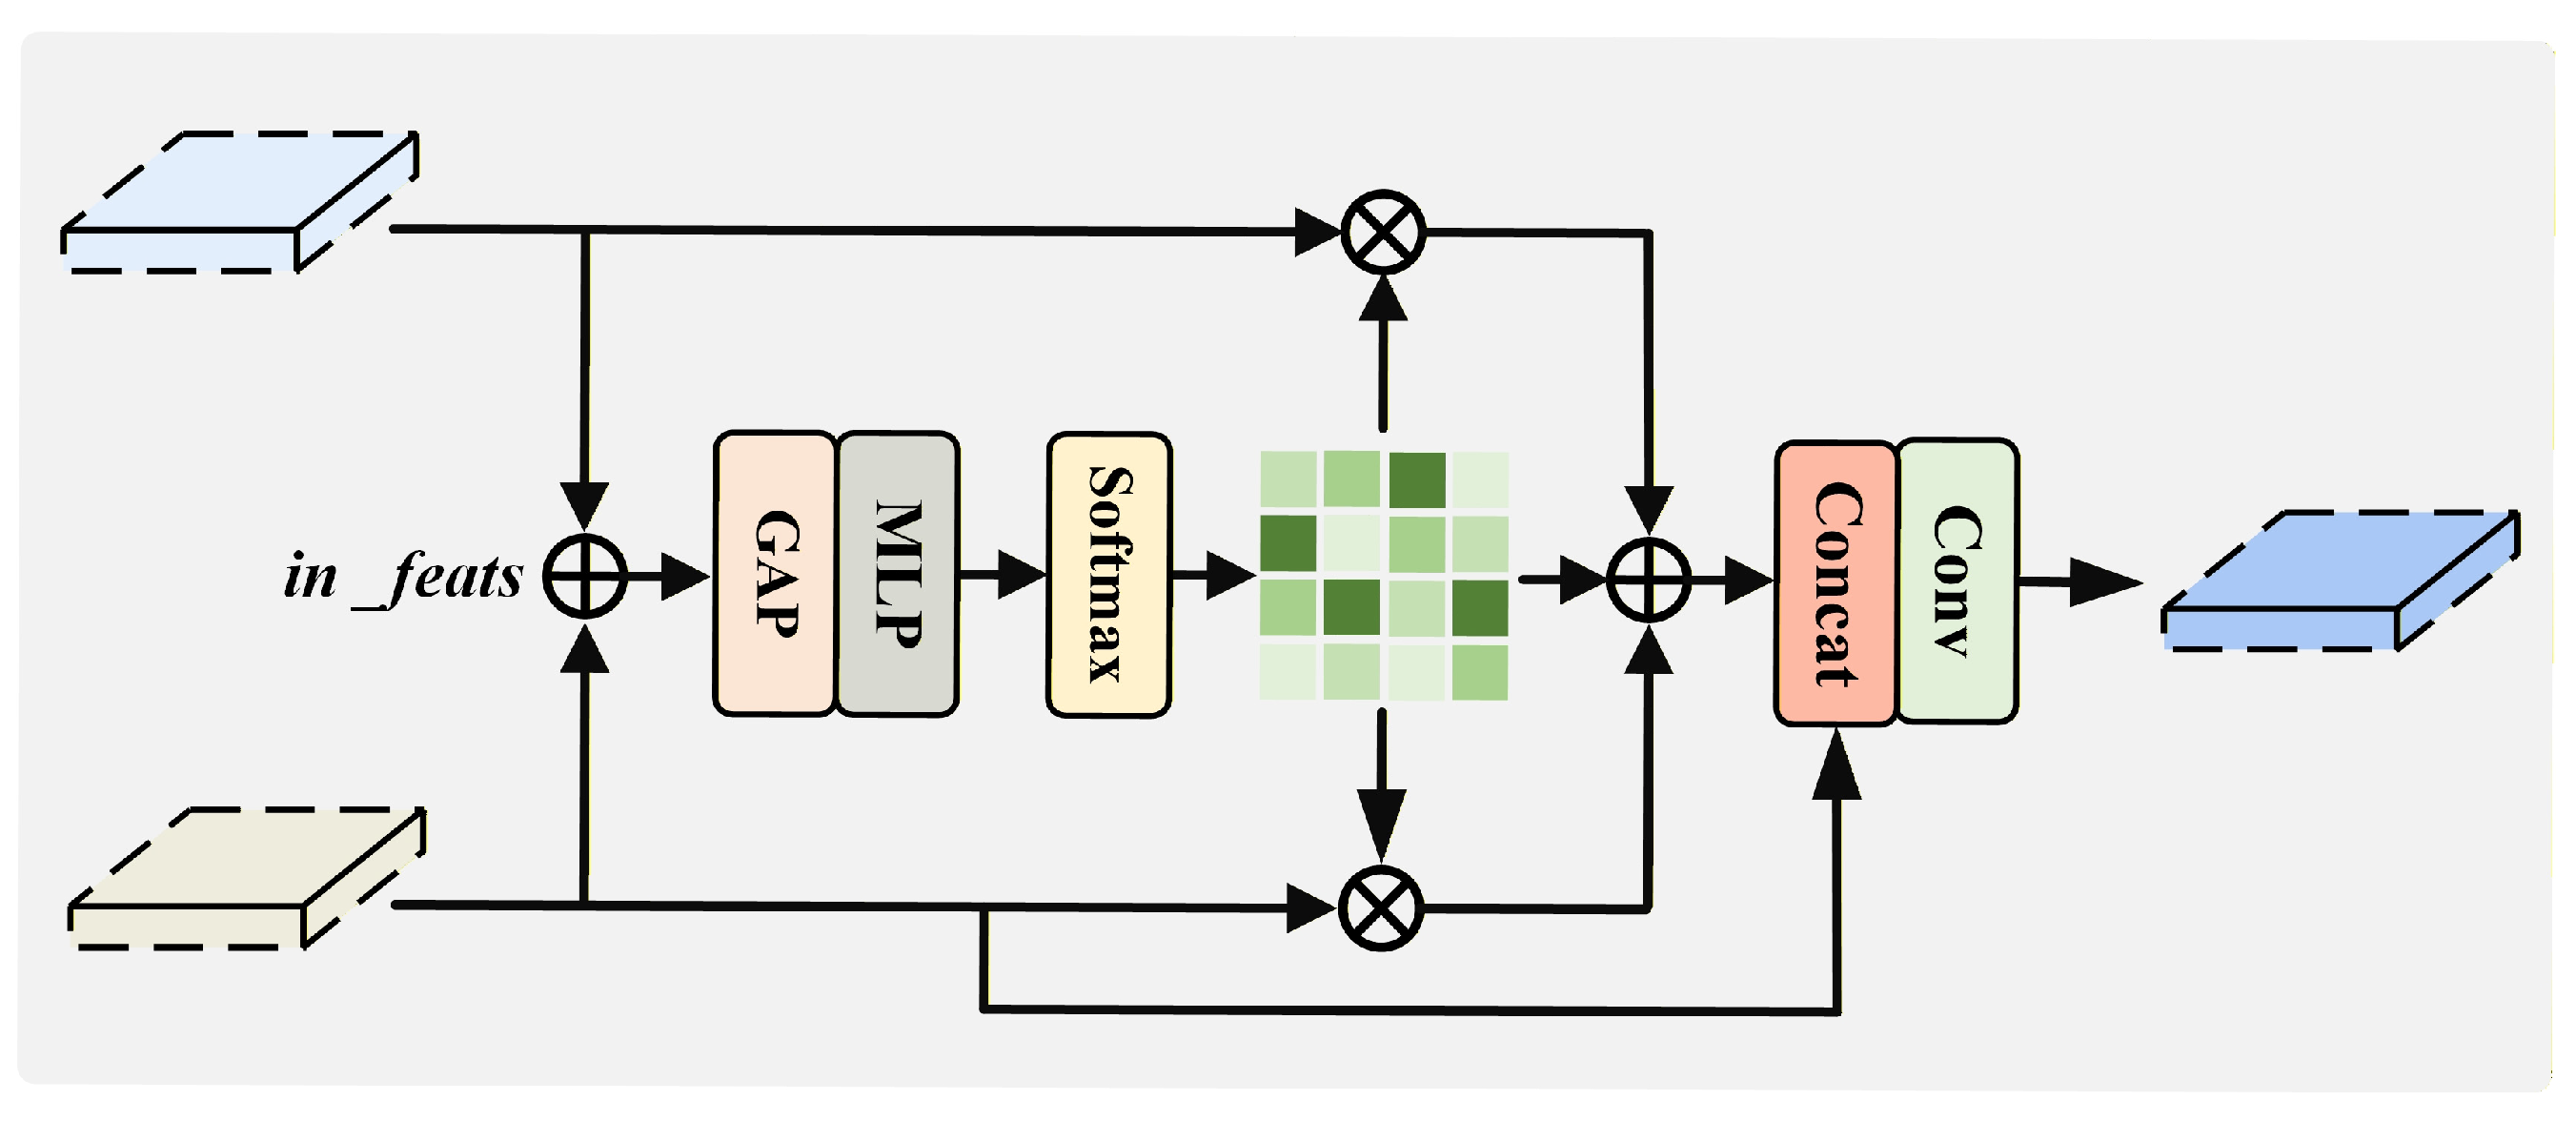
To address these issues, we incorporate the Modulation Fusion Module (MFM) into OFPN, as illustrated in Figure 7. The MFM mechanism reduces redundancy by dynamically weighting feature scales, thereby ensuring efficient and relevant feature selection. It also promotes cross-level feature interaction and enhances multi-scale fusion while maintaining computational efficiency.
The attention mechanism in the MFM, consisting of a Multi-Layer Perceptron (MLP) and a Softmax operation, enables the model to automatically adjust the importance of features across different scales, suppress redundant information, and emphasize key features relevant to fracture detection. This process facilitates the effective selection and fusion of multi-scale features. The computation process of the MFM is formulated as follows:
(1) Feature map processing: For the input i n _ f e a t s i C i × H × W , scale matching is performed using a 1 × 1 convolution:
f i = C o n v i ( i n _ f e a t s i ) , i = 1 , , n
where C o n v i refers to the convolution operation applied to each input feature map.
(2) Concatenation and reshaping: All processed feature maps are concatenated along the channel dimension and reorganized into the shape ( n C , H , W ) :
F = C o n c a t ( f 1 , f 2 , , f n )
(3) Global feature aggregation: The concatenated feature map undergoes global average pooling, and the output is passed through the MLP module to generate weighted coefficients:
a t t n = S o f t m a x ( M L P ( A v g P o o l ( F ) ) )
(4) Weighted fusion: The feature maps are weighted and summed using the generated coefficients, resulting in the fused output feature map:
o u t = i = 1 n a t t n i f i
where represents element-wise multiplication. The final output feature map contains optimized multi-scale fused information.

3.6. FED-Head Model

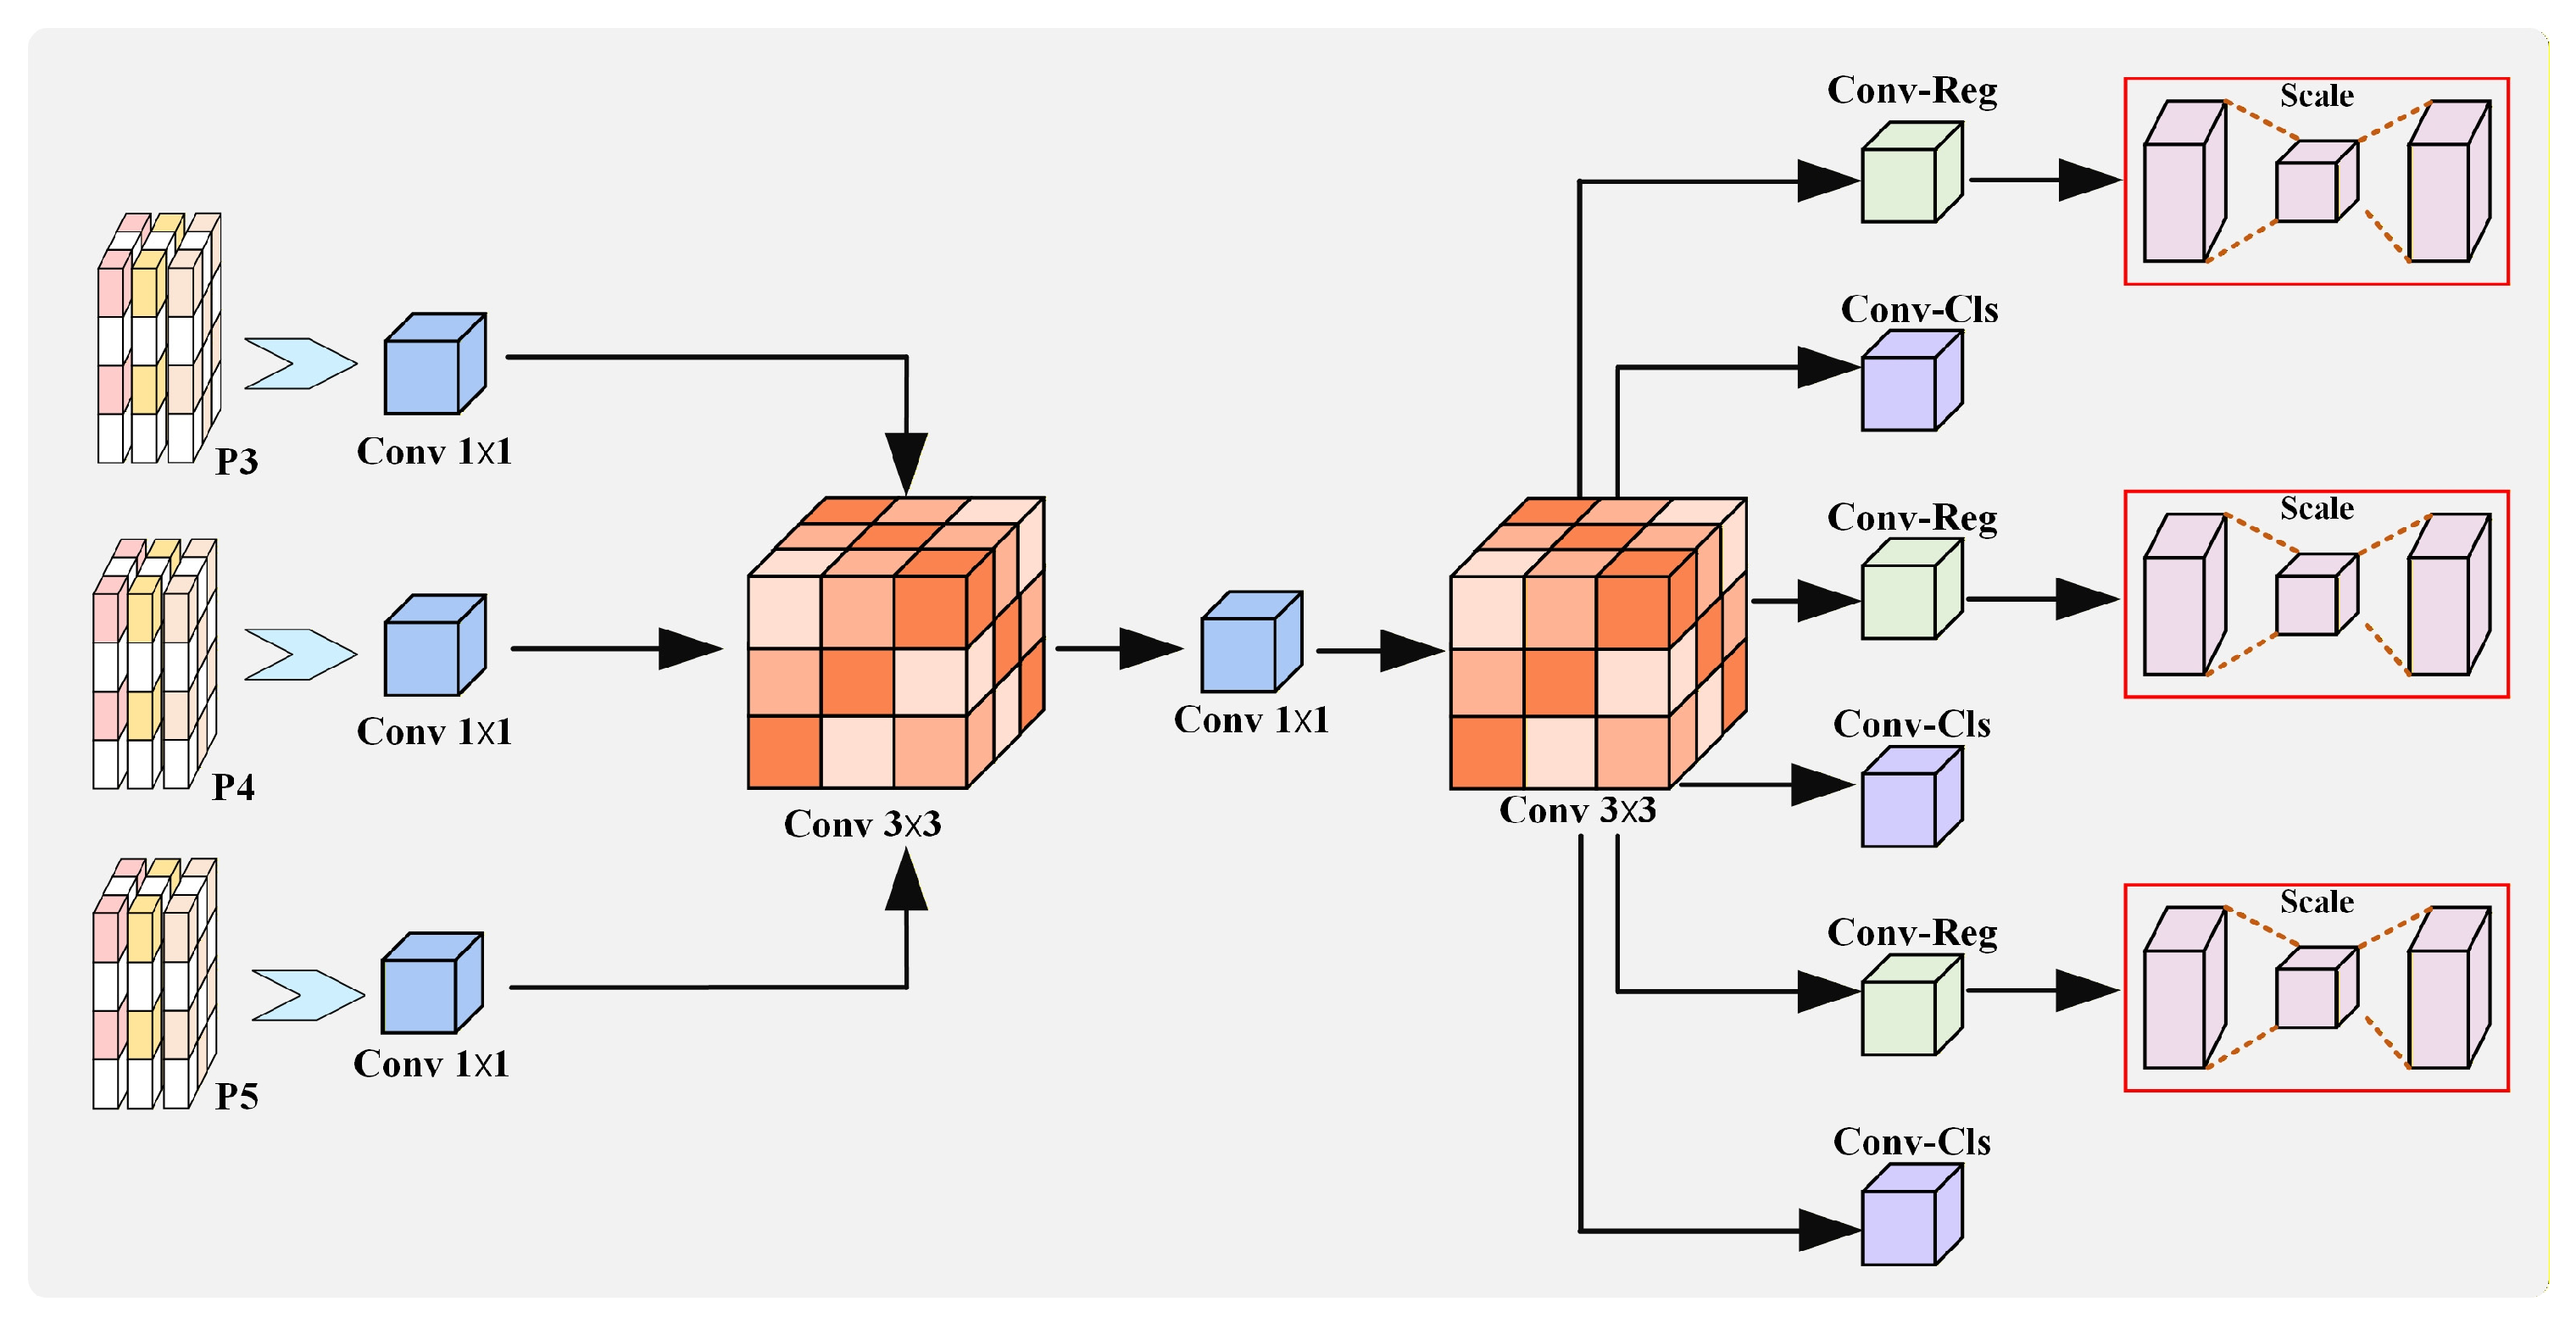
When the fracture region is partially occluded, the detection heads of mainstream one-stage detectors tend to produce large regression and classification errors. In addition, these detectors typically employ independent detection heads for feature maps at different scales (e.g., P3, P4, P5), which provide limited feature interaction and thus insufficient multi-scale information integration, ultimately constraining overall detection accuracy. To overcome these limitations, we design FED-Head using established operations, including channel alignment, group normalization, shared convolution, and scale-aware regression. Its architectural novelty lies in organizing these operations into a unified lightweight detection head that promotes shared semantic modeling across multiple feature scales while reducing the redundancy of conventional independent prediction branches. Its structure is shown in Figure 8.
Specifically, the feature maps from the P3, P4, and P5 layers are first projected to a unified channel dimension and normalized using 1 × 1 convolution followed by group normalization. A 3 × 3 convolution is then applied to extract shared semantic features, thereby integrating information across different scales within a unified feature space and enhancing the model’s ability to detect small targets. During training, FED-Head adopts both an IoU-based localization loss and a cross-entropy classification loss to ensure accurate regression and robust classification performance, while also improving optimization stability in complex backgrounds. The computation of FED-Head can be formulated as follows:
P ˜ i = G N ( C o n v 1 × 1 ( i ) ( P i ) ) , i { 3 , 4 , 5 }
F i = ϕ ( G N ( C o n v 3 × 3 s h a r e d ( P ˜ i ) ) ) , i { 3 , 4 , 5 }
Y ˜ i c l s = C o n v 1 × 1 c l s ( F i ) , i { 3 , 4 , 5 }
Y ˜ i r e g = C o n v S c a l e i [ C o n v 1 × 1 r e g ( F i ) ] , i { 3 , 4 , 5 }
where P i C i × H i × W i represents the input feature of the i-th scale, GN represents Group Normalization, C o n v 3 × 3 s h a r e d represents the 3 × 3 convolution with shared weights among the three scales, ϕ ( ) represents the nonlinear activation function, F i represents the shared semantic features sent to the classification and regression branches, Y ˜ i c l s represents the classification prediction of the i-th scale, and Y ˜ i r e g represents the bounding box regression prediction.
Additionally, a scale transformation layer (Conv-Scale) is introduced after the regression branch to adaptively rescale and refine the regression outputs at different feature levels. This design alleviates the challenges associated with multi-scale feature processing and ensures stable, reliable detection performance, even for fractures with pronounced scale variations.

4. Experimental Environment and Dataset

4.1. Dataset Construction

The dataset used in this study is the Human Bone Fracture Multimodal Image Dataset (HBFMID) [38], a comprehensive medical imaging dataset designed for fracture detection. HBFMID integrates X-ray and MRI modalities and covers a broad range of human skeletal regions. The dataset consists of 1539 images, including 1347 for training, 128 for validation, and 64 for testing. It contains fractures from various skeletal regions, such as the elbow, fingers, forearm, humerus, shoulder, femur, tibia, hip, and wrist. The performance reported in this study represents aggregate evaluation across the mixed-modality dataset rather than separate modality-specific evaluation.
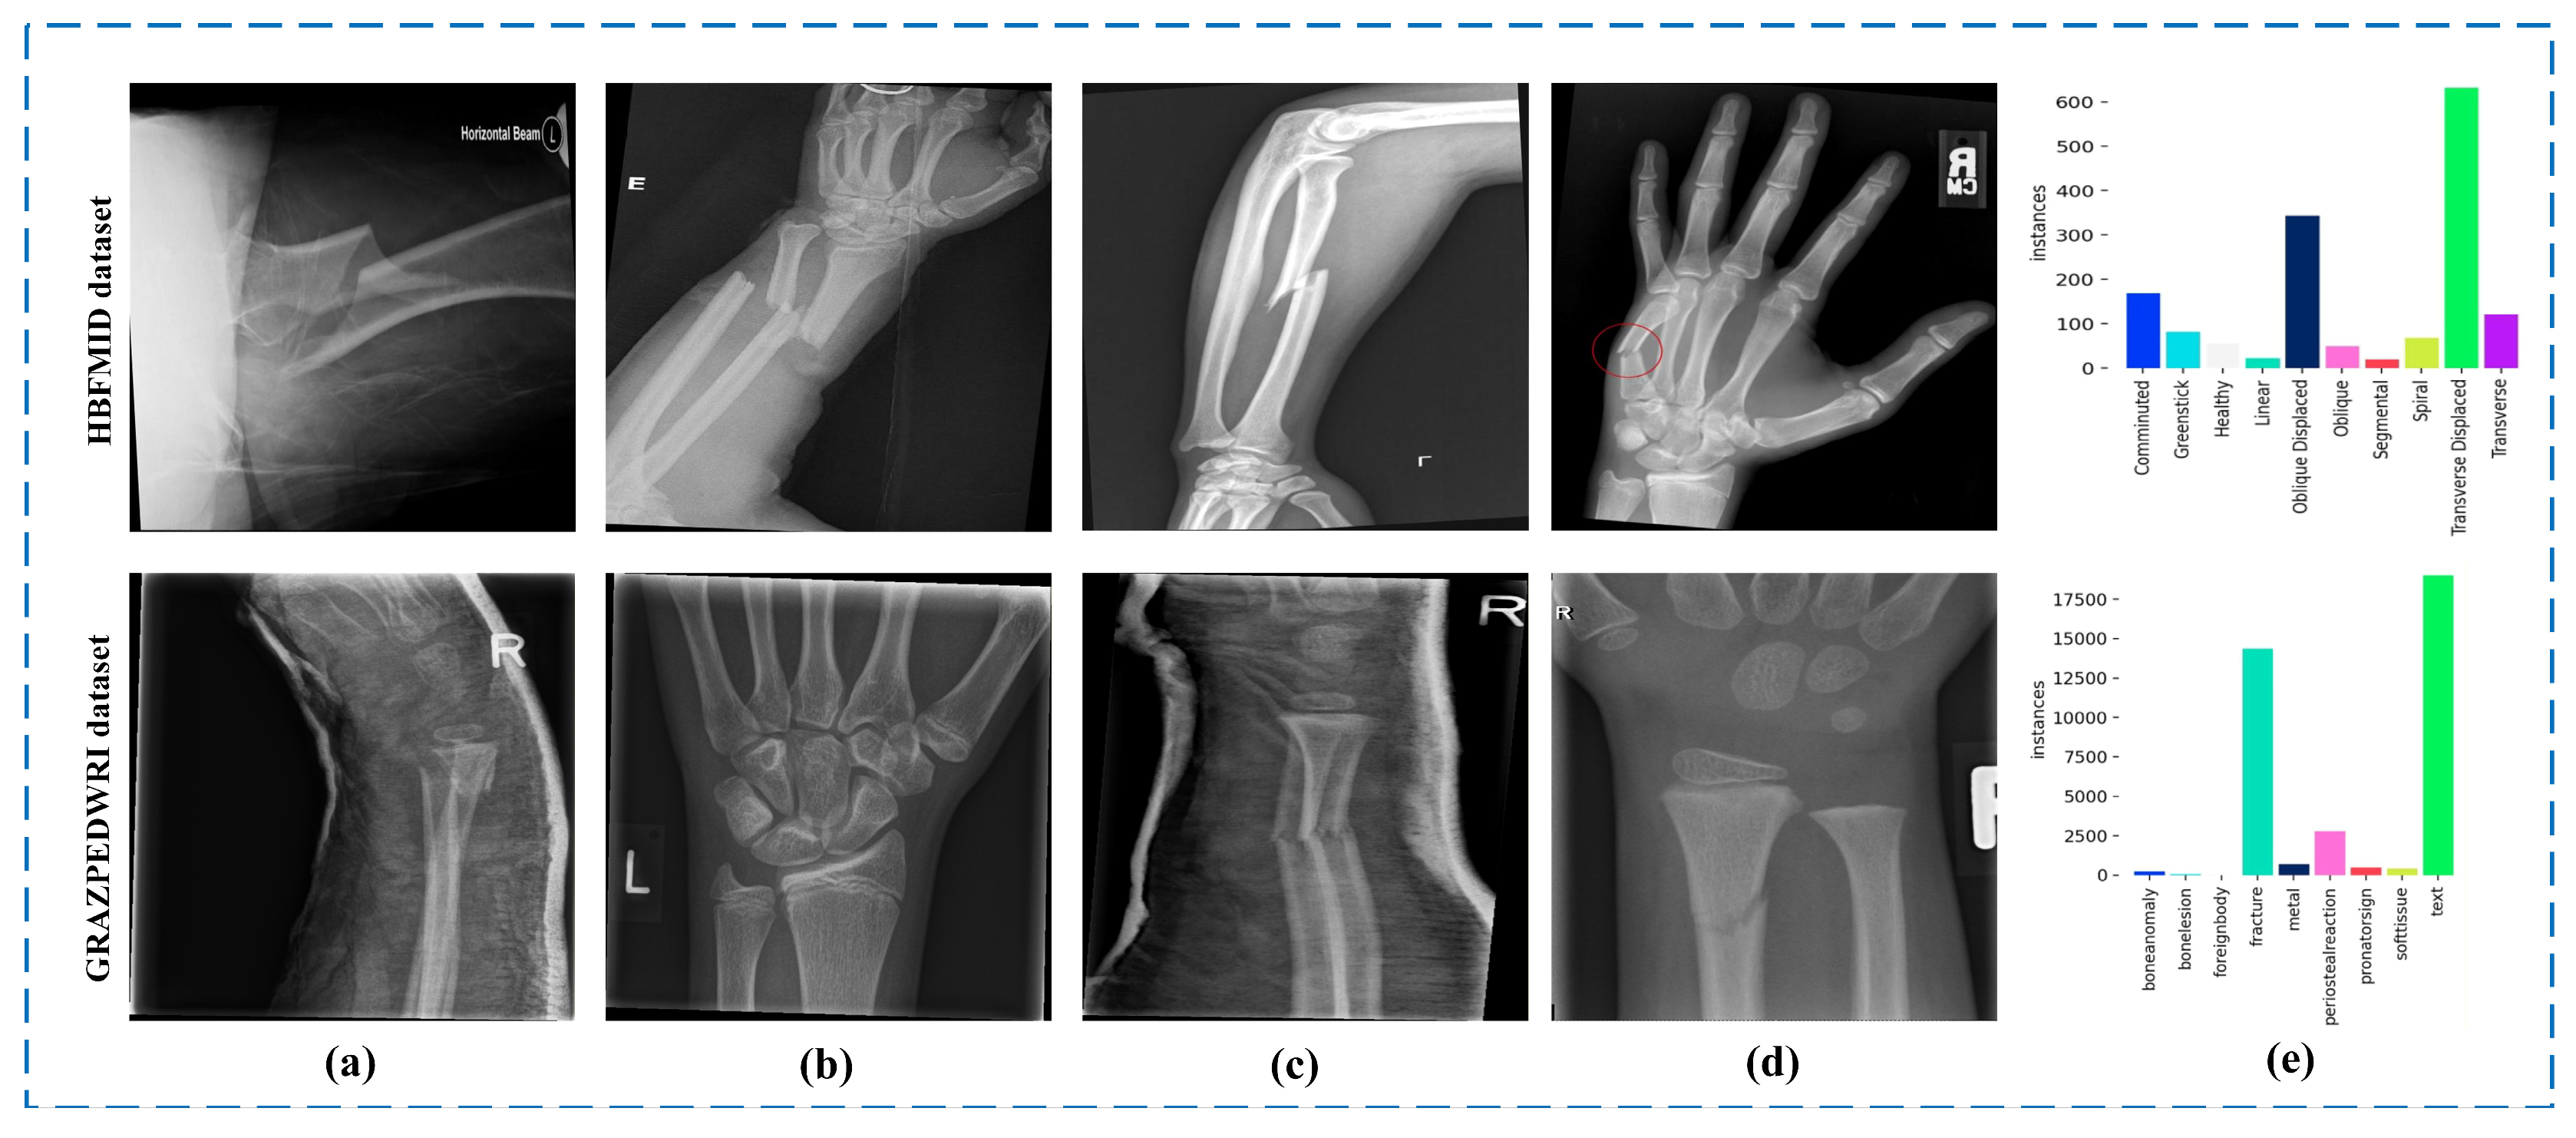
To further evaluate the model’s generalization ability, we used the GRAZPEDWRI-DX dataset [39] as an additional dataset. The GRAZPEDWRI-DX dataset, released by the Medical University of Graz, contains 20,327 pediatric wrist traumas X-ray images, with 16,233 used for training and 4094 for validation. The dataset includes 74,459 labels and 67,771 labeled objects. Representative sample images (a–d) and the class distributions (e) from both datasets are shown in Figure 9.

4.2. Environmental Settings and Evaluation Criteria

The experiments were conducted on a system running Ubuntu 18.04.6, equipped with an Intel Core i9-9900 CPU (Intel Corporation, Santa Clara, CA, USA) and an NVIDIA GeForce RTX 2080 Ti GPU with 11 GB of memory. The computational environment included CUDA 11.8, Python 3.12.9, and PyTorch 2.4.0 deep learning framework. Hyper-parameter configurations used during training are provided in Table 1.
To ensure a fair comparison, the YOLO11 baseline, all ablation variants, and the complete LiteFracNet model were randomly initialized and independently trained from scratch without using any pretrained weights. All models were trained under identical experimental conditions, including the same training, validation, and test splits, input resolution, number of epochs, batch size, optimizer, learning-rate scheduler, weight decay, momentum, data-augmentation strategy, loss configuration, and evaluation criteria. A fixed random seed was used consistently across all comparative and ablation experiments to control the effects of random initialization, data shuffling, and stochastic data augmentation.
Model performance was evaluated using several metrics. Precision (P) measures the proportion of predicted bounding boxes that correctly match the ground truth, while Recall (R) reflects the model’s ability to correctly identify ground-truth bounding boxes. The formulas for Precision and Recall are given as follows:
p = T P T P + F P
R = T P T P + F N
The F1-score, calculated as the harmonic mean of Precision and Recall, provides an overall measure of classification performance, and its formula is defined as:
F 1 = 2 × P × R P + R
Average Precision (AP) evaluates detection performance by computing the mean precision over a range of recall thresholds. The mean Average Precision (mAP) is obtained by averaging the AP values across all categories and serves as a comprehensive metric of the model’s overall detection capability.
A P = 0 1 P ( R ) d ( R )
m A P = i N A P i N
where N denotes the total number of categories in the dataset.
To evaluate the model’s lightweight characteristics, several efficiency metrics, including the number of parameters, GFLOPs, and model size, are considered.

5. Results and Analysis

5.1. Comparative Analysis of Feature Extraction Network Architectures

The feature extraction network of LiteFracNet is composed of the C3-CFormer, SPPF, and C2Mona modules. These modules work synergistically to extract fracture features from different regions and forward them to the neck for multi-scale feature fusion. To validate the effectiveness of this feature extraction network, we conducted comparative experiments in which it was replaced with alternative backbone networks. The results of these comparisons are reported in Table 2.
Table 2 presents a comparison of different feature extraction networks. Our model outperforms others in both accuracy and efficiency, achieving 93.59% precision, 84.74% recall, and an F1-score of 88.95%. It has 2.41 M parameters, 8.1 GFLOPs, and a model size of 4.9 MB, highlighting its high efficiency. In contrast, while StarNet has fewer parameters, its F1-score is 86.69%, and its mAP50 does not exceed that of our model. LSKNet, MobileNetv4, and UnireplkNet offer good computational efficiency but come with higher model complexities. EfficientViT strikes a balance in computational efficiency, but its mAP50 is still lower than ours. Overall, our model strikes an optimal balance between accuracy and efficiency, making it highly suitable for real-time fracture detection tasks.

5.2. Comparative Analysis of C3-CFormer Architectures

LiteFracNet utilizes four C3-CFormer modules for feature extraction and fusion, effectively combining convolution and attention mechanisms to extract and integrate feature information. To assess the performance benefits of C3-CFormer, we replaced it with other modules and conducted comparison experiments. The results are presented in Table 3.
As shown in Table 3, the C3-CFormer module achieves 93.59% precision, 84.74% recall, and an F1-score of 88.95%. LiteFracNet outperforms the other modules in F1-score, where it surpasses most of the compared models. In terms of computational efficiency, our model has 2.41 M parameters, 8.1 GFLOPs, and a size of 4.9 MB, highlighting its lightweight design. In contrast, FMABlock, DeepDBB, and ODConv have 3.16 M, 2.58 M, and 2.72 M parameters, respectively, resulting in higher computational complexity. While FasterBlock and FMABlock offer advantages in efficiency and model size, their overall performance still falls short compared to our model.

5.3. Comparative Analysis of C2Mona Network Architectures

C2Mona integrates multi-scale depth-wise convolutions with a channel down-projection and up-projection mechanism to enhance cross-scale feature interaction while maintaining computational efficiency. To validate the advantages of C2Mona in feature extraction and information fusion, we replaced C2Mona with other architectural modules and conducted comparative experiments. For a fair comparison, we implemented C2-style variants using the core module of each competing architecture. The results are presented in Table 4.
As shown in Table 4, the C2Mona module achieves the highest detection accuracy while maintaining a high recall rate. Although C2PSA and C2DA have fewer parameters, they exhibit a significant performance degradation. C2BRA achieves high precision; however, it does not outperform C2Mona in terms of overall performance. Compared with the other modules, C2Mona demonstrates superior capability in handling complex tasks while maintaining low computational cost, thereby improving robustness and generalization.

5.4. Comparative Analysis of OmniKernel Fusion Modules

To evaluate the performance of the proposed OmniKernel fusion module in feature fusion and fracture detection under high occlusion conditions, we compared it with several mainstream feature fusion modules. The results, presented in Table 5, demonstrate the performance of the module when replaced with alternative approaches. These comparative experiments effectively validate the module’s advantages in multi-scale feature capture, cross-level information fusion, and computational efficiency.
Table 5 presents a comprehensive performance comparison of various competing models. Our proposed OmniKernel fusion module achieves the best performance across precision, recall, and F1-score metrics. In contrast, the competing modules, including the Pyramid Sparse Transformer (PST), Residual Attention Block (RAB), and RepConvBlock, show lower F1-score and mAP50 values, indicating that they are less effective than our module in detecting targets under complex scenarios.

5.5. Comparative Analysis of FED-Head Architectures

To further enhance LiteFracNet’s performance in human fracture detection, we design FED-Head, an efficient detection head. Compared to mainstream one-stage models, FED-Head is lightweight and significantly improves inference speed by optimizing the feature processing workflow. To evaluate the advantages of FED-Head, we compared it with three different detection heads, and the results are presented in Table 6. These experiments provide an in-depth analysis of the performance of each detection head in terms of computational efficiency and robustness.
As shown in Table 6, FED-Head demonstrates excellent overall performance, with a precision of 93.59%, recall of 84.74%, and mAP50 of 93.53%. With 2.41 M parameters, 8.1 GFLOPs, and a model size of 4.9 MB, FED-Head achieves a favorable trade-off between high computational efficiency and precision. The RSCD and LADH architecture also achieved lower mAP50 value than FED-Head, reaching 93.34% and 91.57%, respectively. Their precision, recall, and F1-scores were also lower than those of FED-Head.

5.6. Ablation Studies

To rigorously evaluate the individual and joint contributions of the proposed components, we conducted an ablation study. Specifically, this study systematically investigates four key modules: C3-CFormer (Module A), C2Mona (Module B), OFPN (Module C), and FED-Head (Module D). The results of progressive module integration are summarized in Table 7. The YOLO11 baseline and all ablation variants were randomly initialized and independently trained from scratch without pretrained weights under identical training and evaluation settings.
Table 7 presents the results of an eight-setting ablation study conducted to systematically evaluate the individual and joint contributions of the proposed modules, including C3-CFormer (Module A), C2Mona (Module B), OFPN (Module C), and FED-Head (Module D). Starting from the baseline model, progressively integrating different modules resulted in notable performance variations. When applied individually, Modules A and C yielded more pronounced improvements than Modules B and D. Module C increased mAP50 to 92.37%, indicating its strong capability in enhancing feature representation. The complete model integrating all four modules (LiteFracNet) achieved the best overall performance, reaching a precision of 93.59%, recall of 84.74%, F1-score of 88.95%, and mAP50 of 93.53%, while maintaining moderate computational complexity and a compact model size.
To evaluate the statistical significance of the observed performance difference, YOLO11 and LiteFracNet were independently trained from scratch five times without pretrained weights under identical experimental conditions. The same set of five random seeds was used for both models, yielding five paired mAP50 observations for a two-sided paired t-test. Table 8 presents the t-test results of LiteFracNet on the HBFMID and GRAZPEDWRI-DX datasets.

5.7. Comparison of Different Datasets

5.7.1. Comparison of Different Models on the HBFMID

To comprehensively evaluate the performance of LiteFracNet in human fracture detection, we selected precision, recall, F1-score, and mAP50 as the primary performance metrics. Parameters, GFLOPs, FPS, and model size were used to assess the model’s lightweight characteristics. LiteFracNet was then compared with state-of-the-art (SOTA) models, including YOLOv13, Hyper-YOLO, and RT-DETR, to validate its superior performance. The results are presented in Table 9.
As shown in Table 9, LiteFracNet outperforms several mainstream detectors, achieving the highest precision (93.59%), F1-score (88.95%), and mAP50 (93.53%) among the compared models. Compared to high-performance models such as Hyper-YOLO and RT-DETR-r18, LiteFracNet achieves a slightly higher mAP50 while using fewer parameters and a smaller model size. Compared with YOLOv5n, YOLOv6n, and YOLOv10n, LiteFracNet consistently yields better accuracy, with larger gains observed for the lightweight baselines. LiteFracNet achieves efficient real-time inference at a frame rate of 87.1 FPS while maintaining high detection accuracy. Although models such as YOLOv5n, YOLOv9t, and YOLO11n exhibit higher frame rates, LiteFracNet remains capable of performing real-time fracture localization, demonstrating a well-balanced trade-off between accuracy and computational efficiency. Nevertheless, optimizing inference speed continues to be a key focus for future work.
LiteFracNet maintains high precision while demonstrating lightweight architecture. With only 2.41 M parameters, 8.1 GFLOPs, and a model size of 4.9 MB, it is on par with nano-level detectors but offers significantly better precision. In comparison to larger small-scale models like YOLOv6s, YOLOv10s, and RT-DETR, LiteFracNet reduces its parameter count and model size by more than 60%. Overall, LiteFracNet achieves a favorable balance between detection accuracy and computational efficiency, providing a compact architectural foundation for subsequent deployment and optimization on resource-constrained platforms.
To further characterize the computational requirements and deployment potential of LiteFracNet beyond the desktop-GPU benchmark, we conducted a throughput-based theoretical analysis using its computational complexity and parameter count. The reported inference speed of 87.1 FPS was measured on an NVIDIA GeForce RTX 2080 Ti. LiteFracNet requires 8.1 GFLOPs for each 640 × 640 input image. Assuming effective sustained computational throughputs of 0.1, 0.5, and 1.0 TOPS under consistent numerical precision and operation-count conventions, the estimated network-only latencies are approximately 81.0, 16.2, and 8.1 ms, corresponding to 12.3, 61.7, and 123.5 FPS, respectively. Together with its compact architecture of 2.41 million parameters and a 4.9 MB saved model weight file, these estimates demonstrate the favorable computational and storage characteristics of LiteFracNet and provide quantitative support for its deployment potential on low-power platforms. This analysis provides an architecture-level efficiency reference under controlled throughput assumptions, while its interpretation should account for platform-dependent factors, including activation-memory consumption, image preprocessing and post-processing, data-transfer latency, runtime implementation efficiency, memory-bandwidth constraints, power consumption, and thermal behavior. Furthermore, the reported 4.9 MB represents the on-disk size of the saved model weight file rather than the peak memory consumption during inference. Therefore, this analysis provides a quantitative basis for subsequent platform-specific deployment and optimization, while evaluation on representative low-power hardware will be needed to quantify the actual end-to-end latency, runtime memory consumption, and energy efficiency.

5.7.2. Comparison of Different Models on the GRAZPEDWRI-DX Dataset

To further evaluate the model’s cross-domain generalization ability, LiteFracNet was independently tested on the GRAZPEDWRI-DX dataset. The dataset contains pediatric wrist-trauma radiographs with multiple annotated findings and fracture-related labels. The comparison results are shown in Table 10.
Despite differences in model parameter scale and computational complexity, LiteFracNet outperforms other models across several key metrics. Specifically, LiteFracNet achieves 65.51% precision, 63.45% recall, and 64.46% F1-score, demonstrating balanced performance among lightweight models. Compared to one-stage detectors of similar scale, LiteFracNet shows significant improvements in F1-score and mAP50, underscoring its superior feature extraction and target localization capabilities.
Although LiteFracNet achieved the highest mAP50 of 61.43%, its improvement over the strongest baseline models was relatively limited. Specifically, the mAP50 exceeded those of YOLOv13 and YOLO11n by 1.00 and 1.34 percentage points, respectively. Therefore, this result should be interpreted as evidence of partial cross-domain adaptability rather than complete domain invariance. The performance degradation relative to HBFMID indicates that differences in patient population, anatomical characteristics, imaging protocols, and annotation distributions remain important challenges.

5.8. Visual Analysis

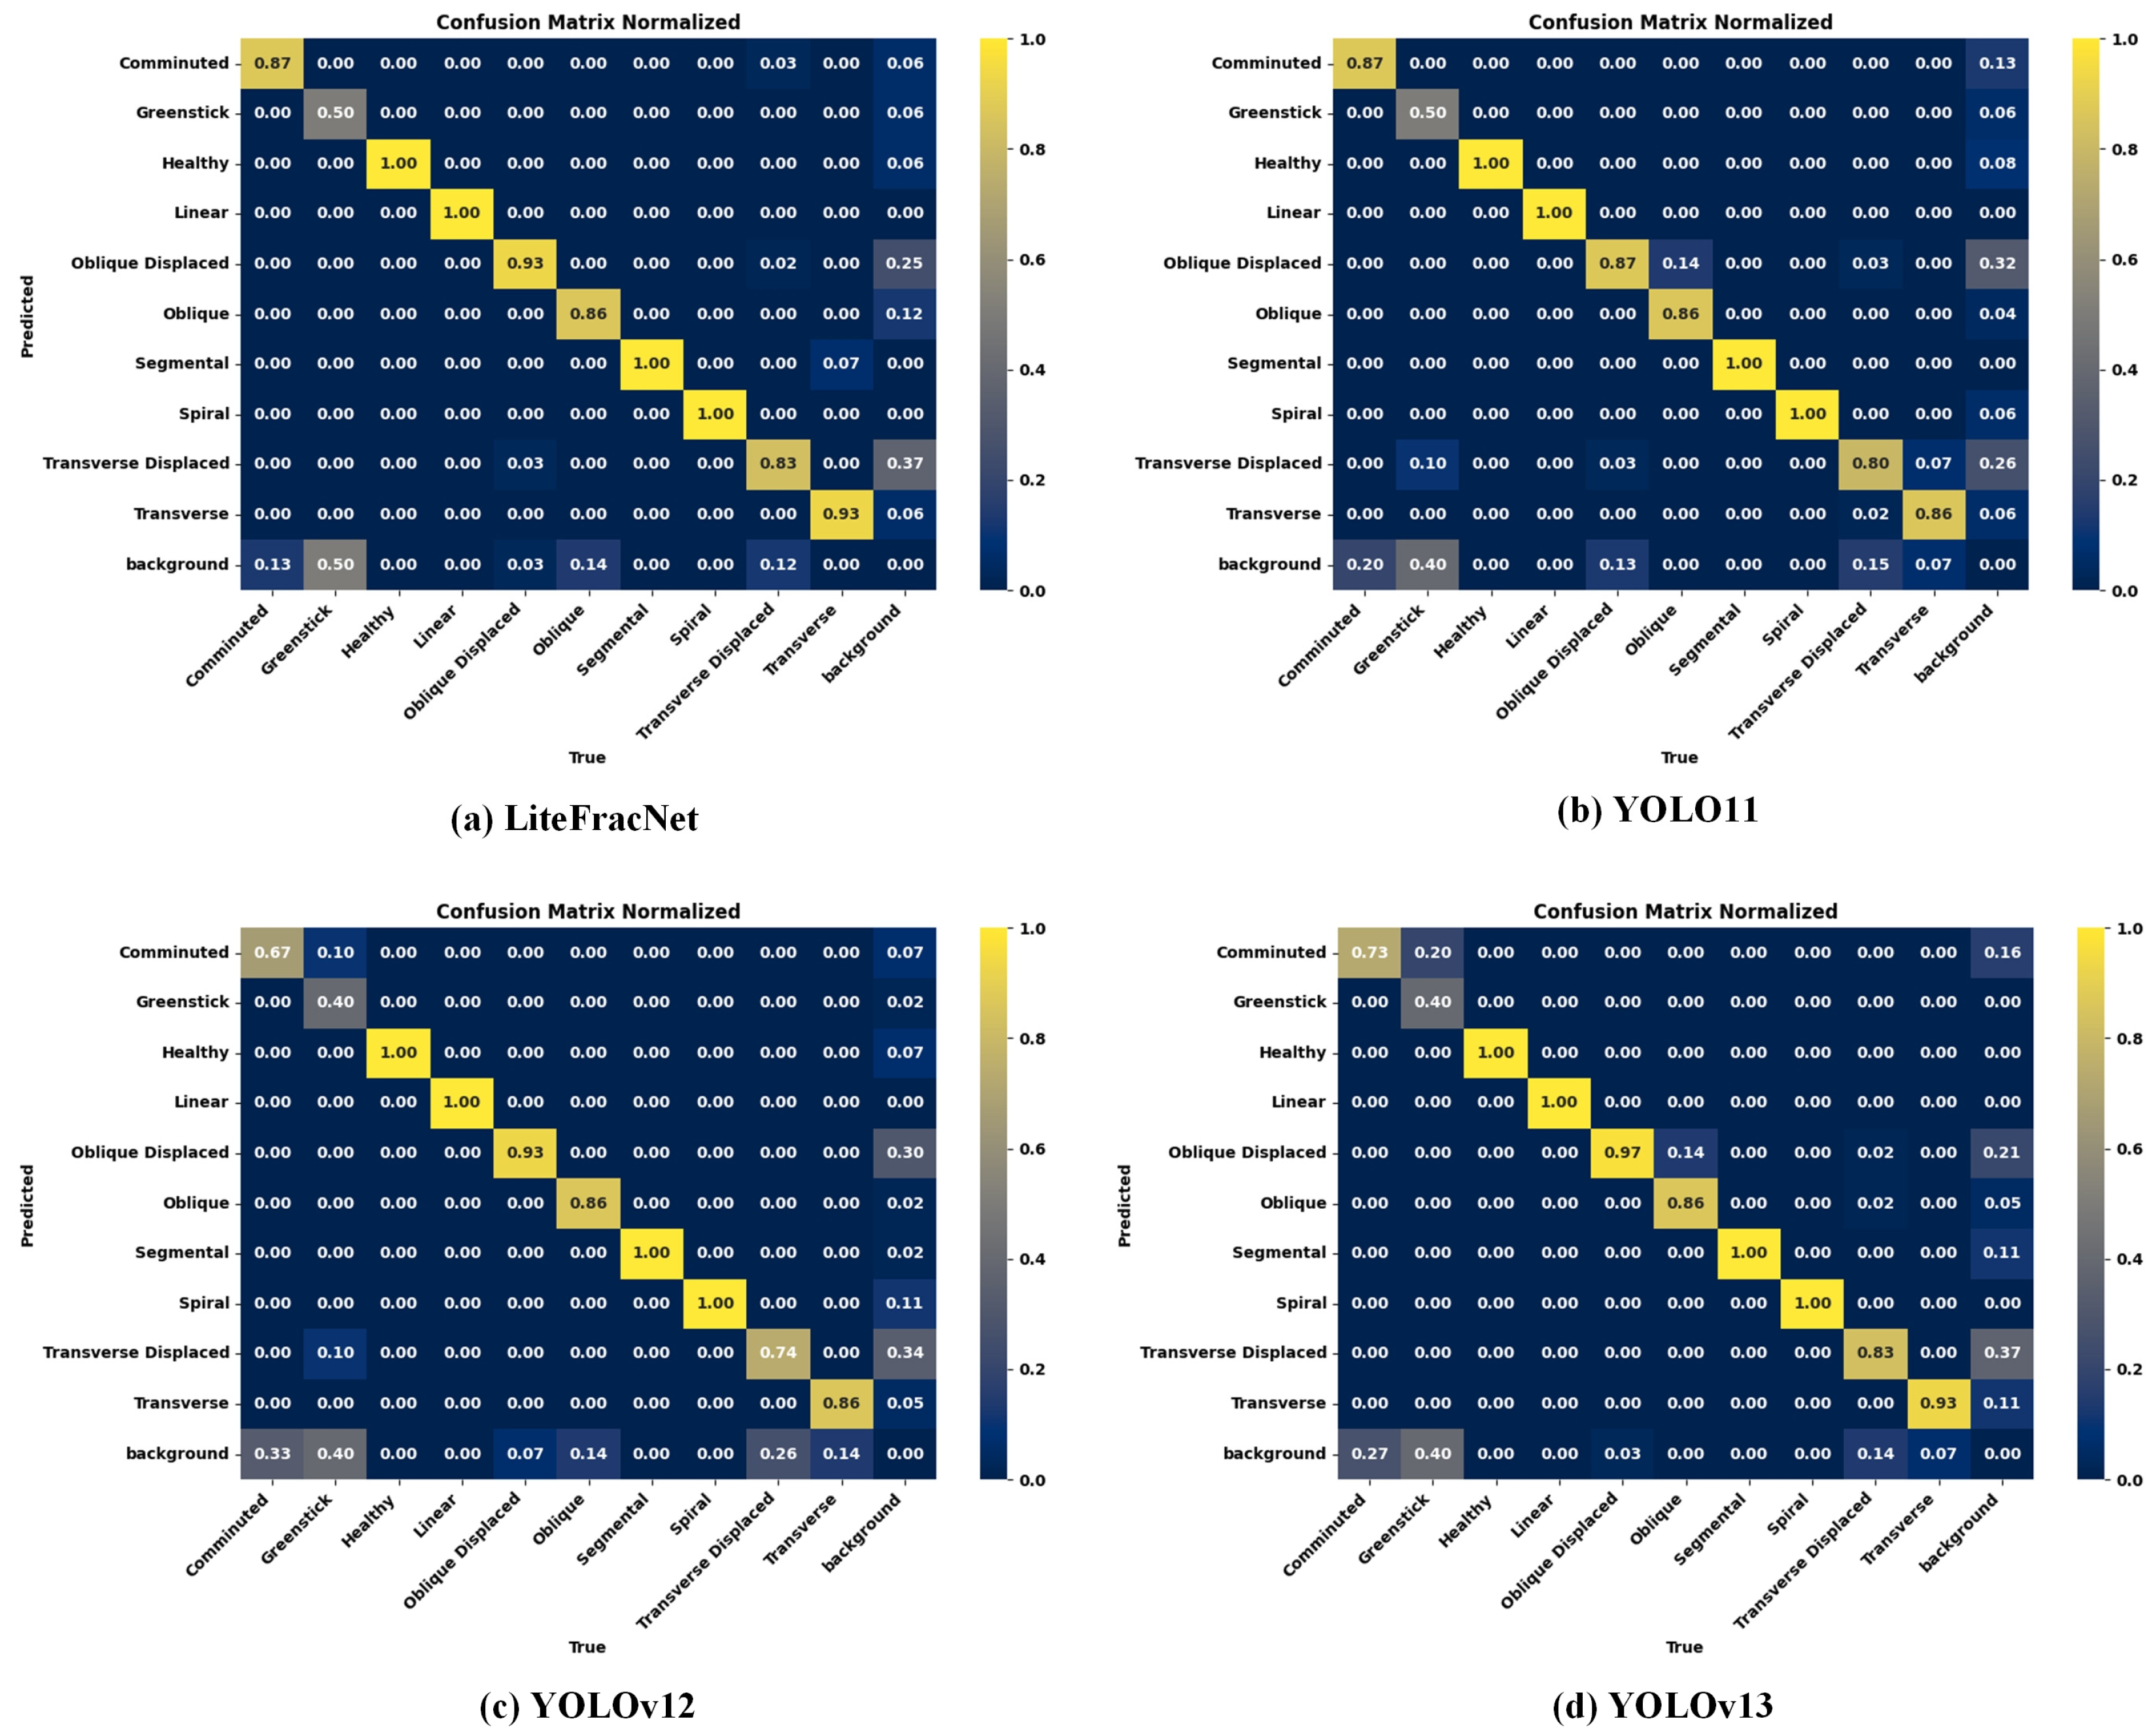
The confusion matrix is a widely used evaluation tool in multi-class tasks, enabling visualization of the model’s classification results and error distribution across categories. By comparing predicted results with ground truth labels, it quantifies both correct and incorrect classifications for each category. Figure 10 shows the normalized confusion matrix of the LiteFracNet model on the HBFMID, compared with several SOTA models. As depicted in the figure, LiteFracNet outperforms YOLO11, YOLOv12, and YOLOv13, demonstrating higher classification accuracy across all fracture categories and highlighting its superior generalization capability.
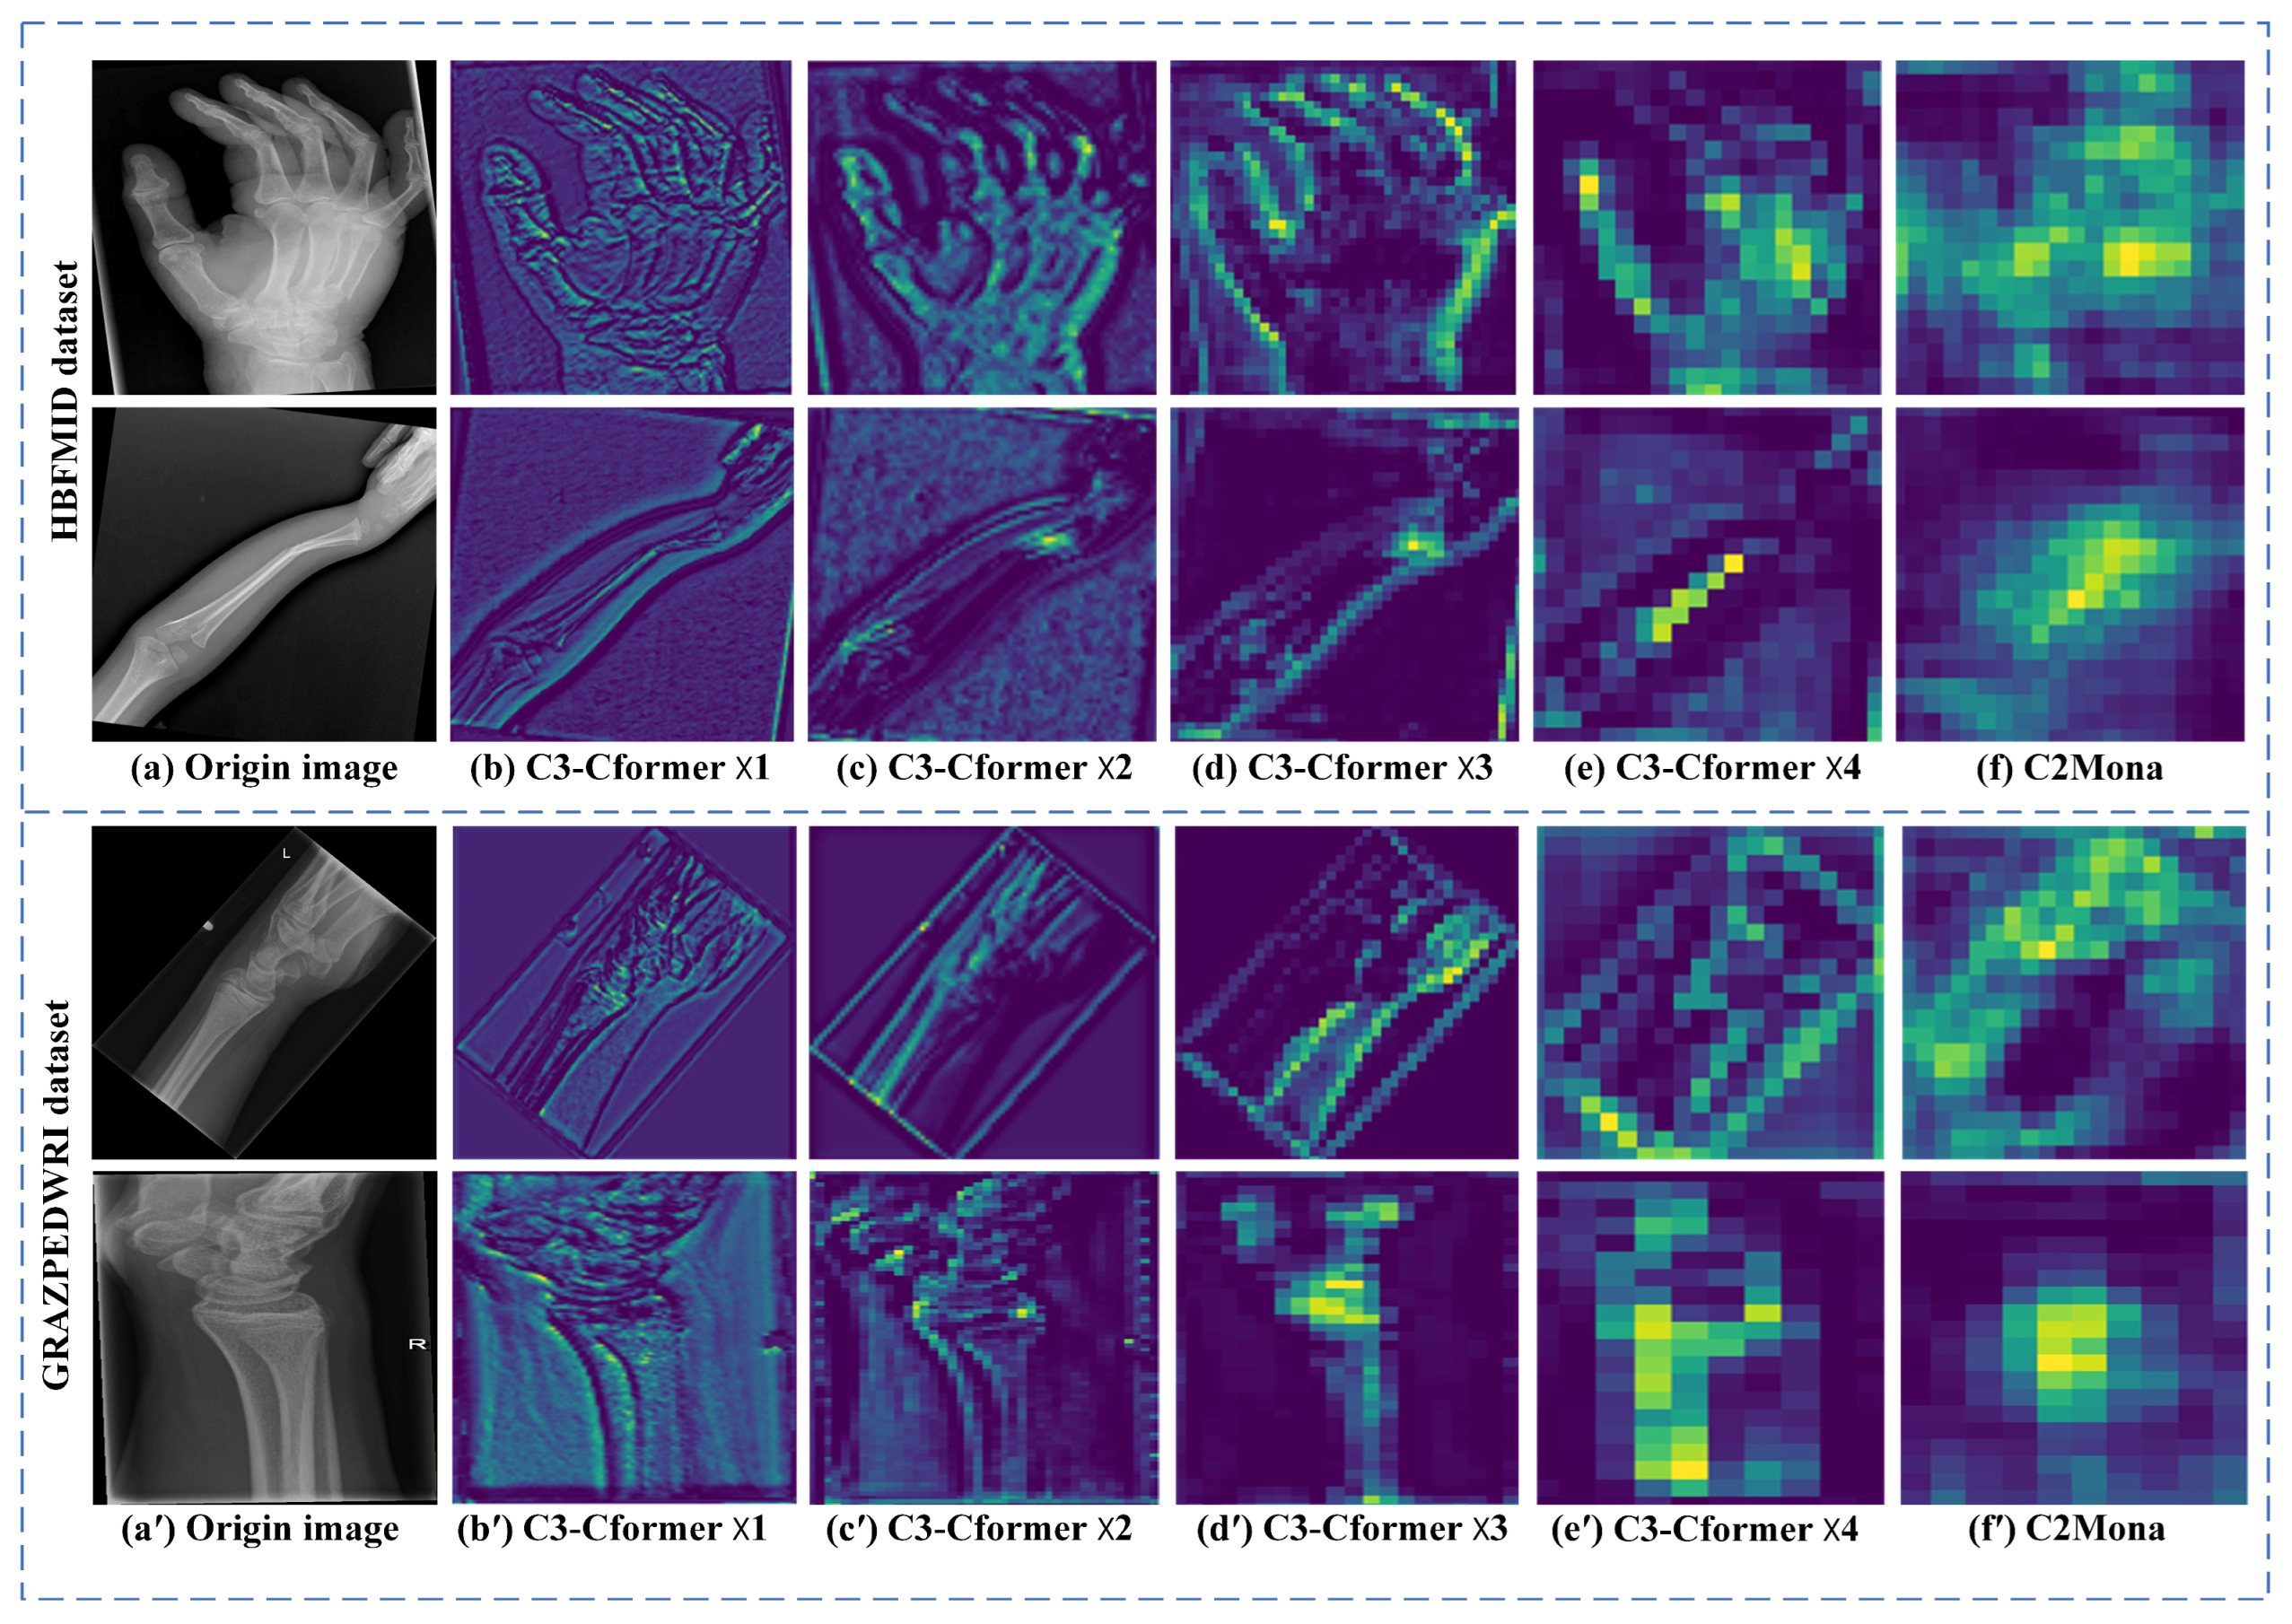
To better understand the mechanisms underlying the internal representation of LiteFracNet, we applied feature map visualization techniques to analyze the four C3-CFormer modules and the C2Mona module in the feature extraction network (see Figure 11). Layered visualizations clearly show the evolution of features: the first two C3-CFormer modules (shallow layers) primarily extract low-level features, such as local edges and intensity gradients, while the latter two (deep layers) capture global features, integrating these basic features into high-level semantic information that encodes fracture characteristics with diagnostic value. The C2Mona module enhances the model’s expressiveness and optimizes feature map computation by passing and reusing information across multiple convolution layers.
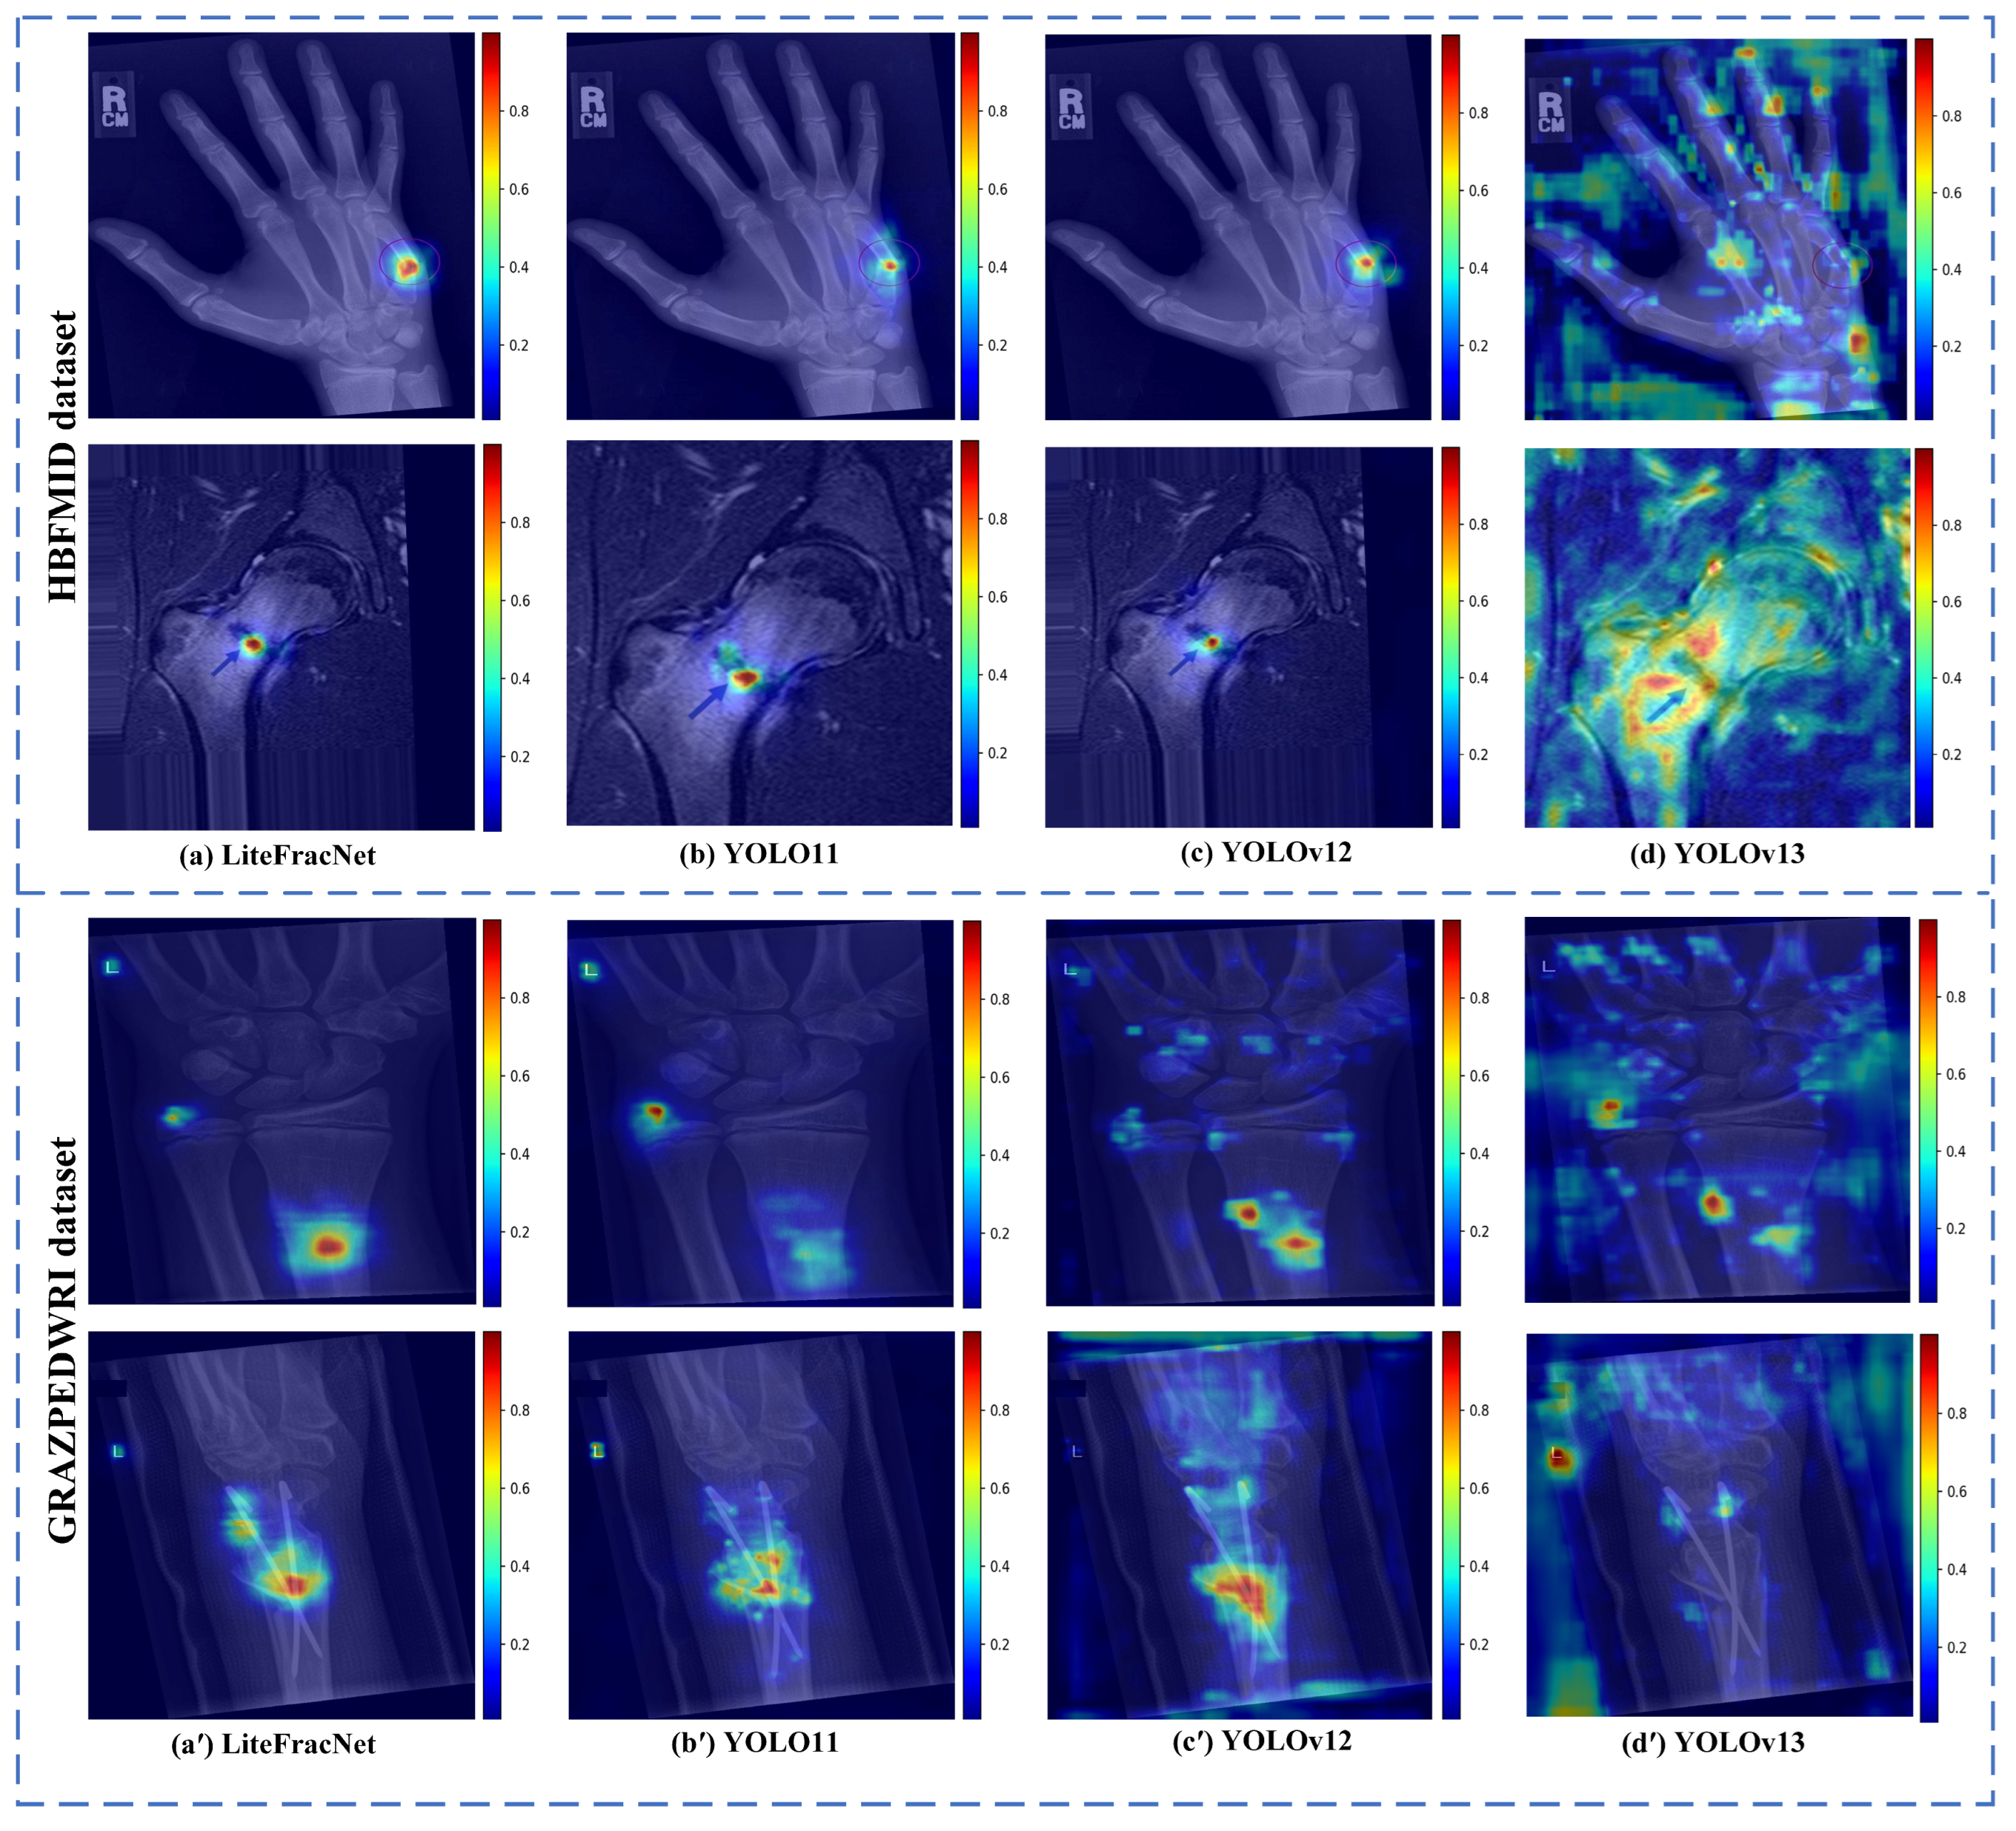
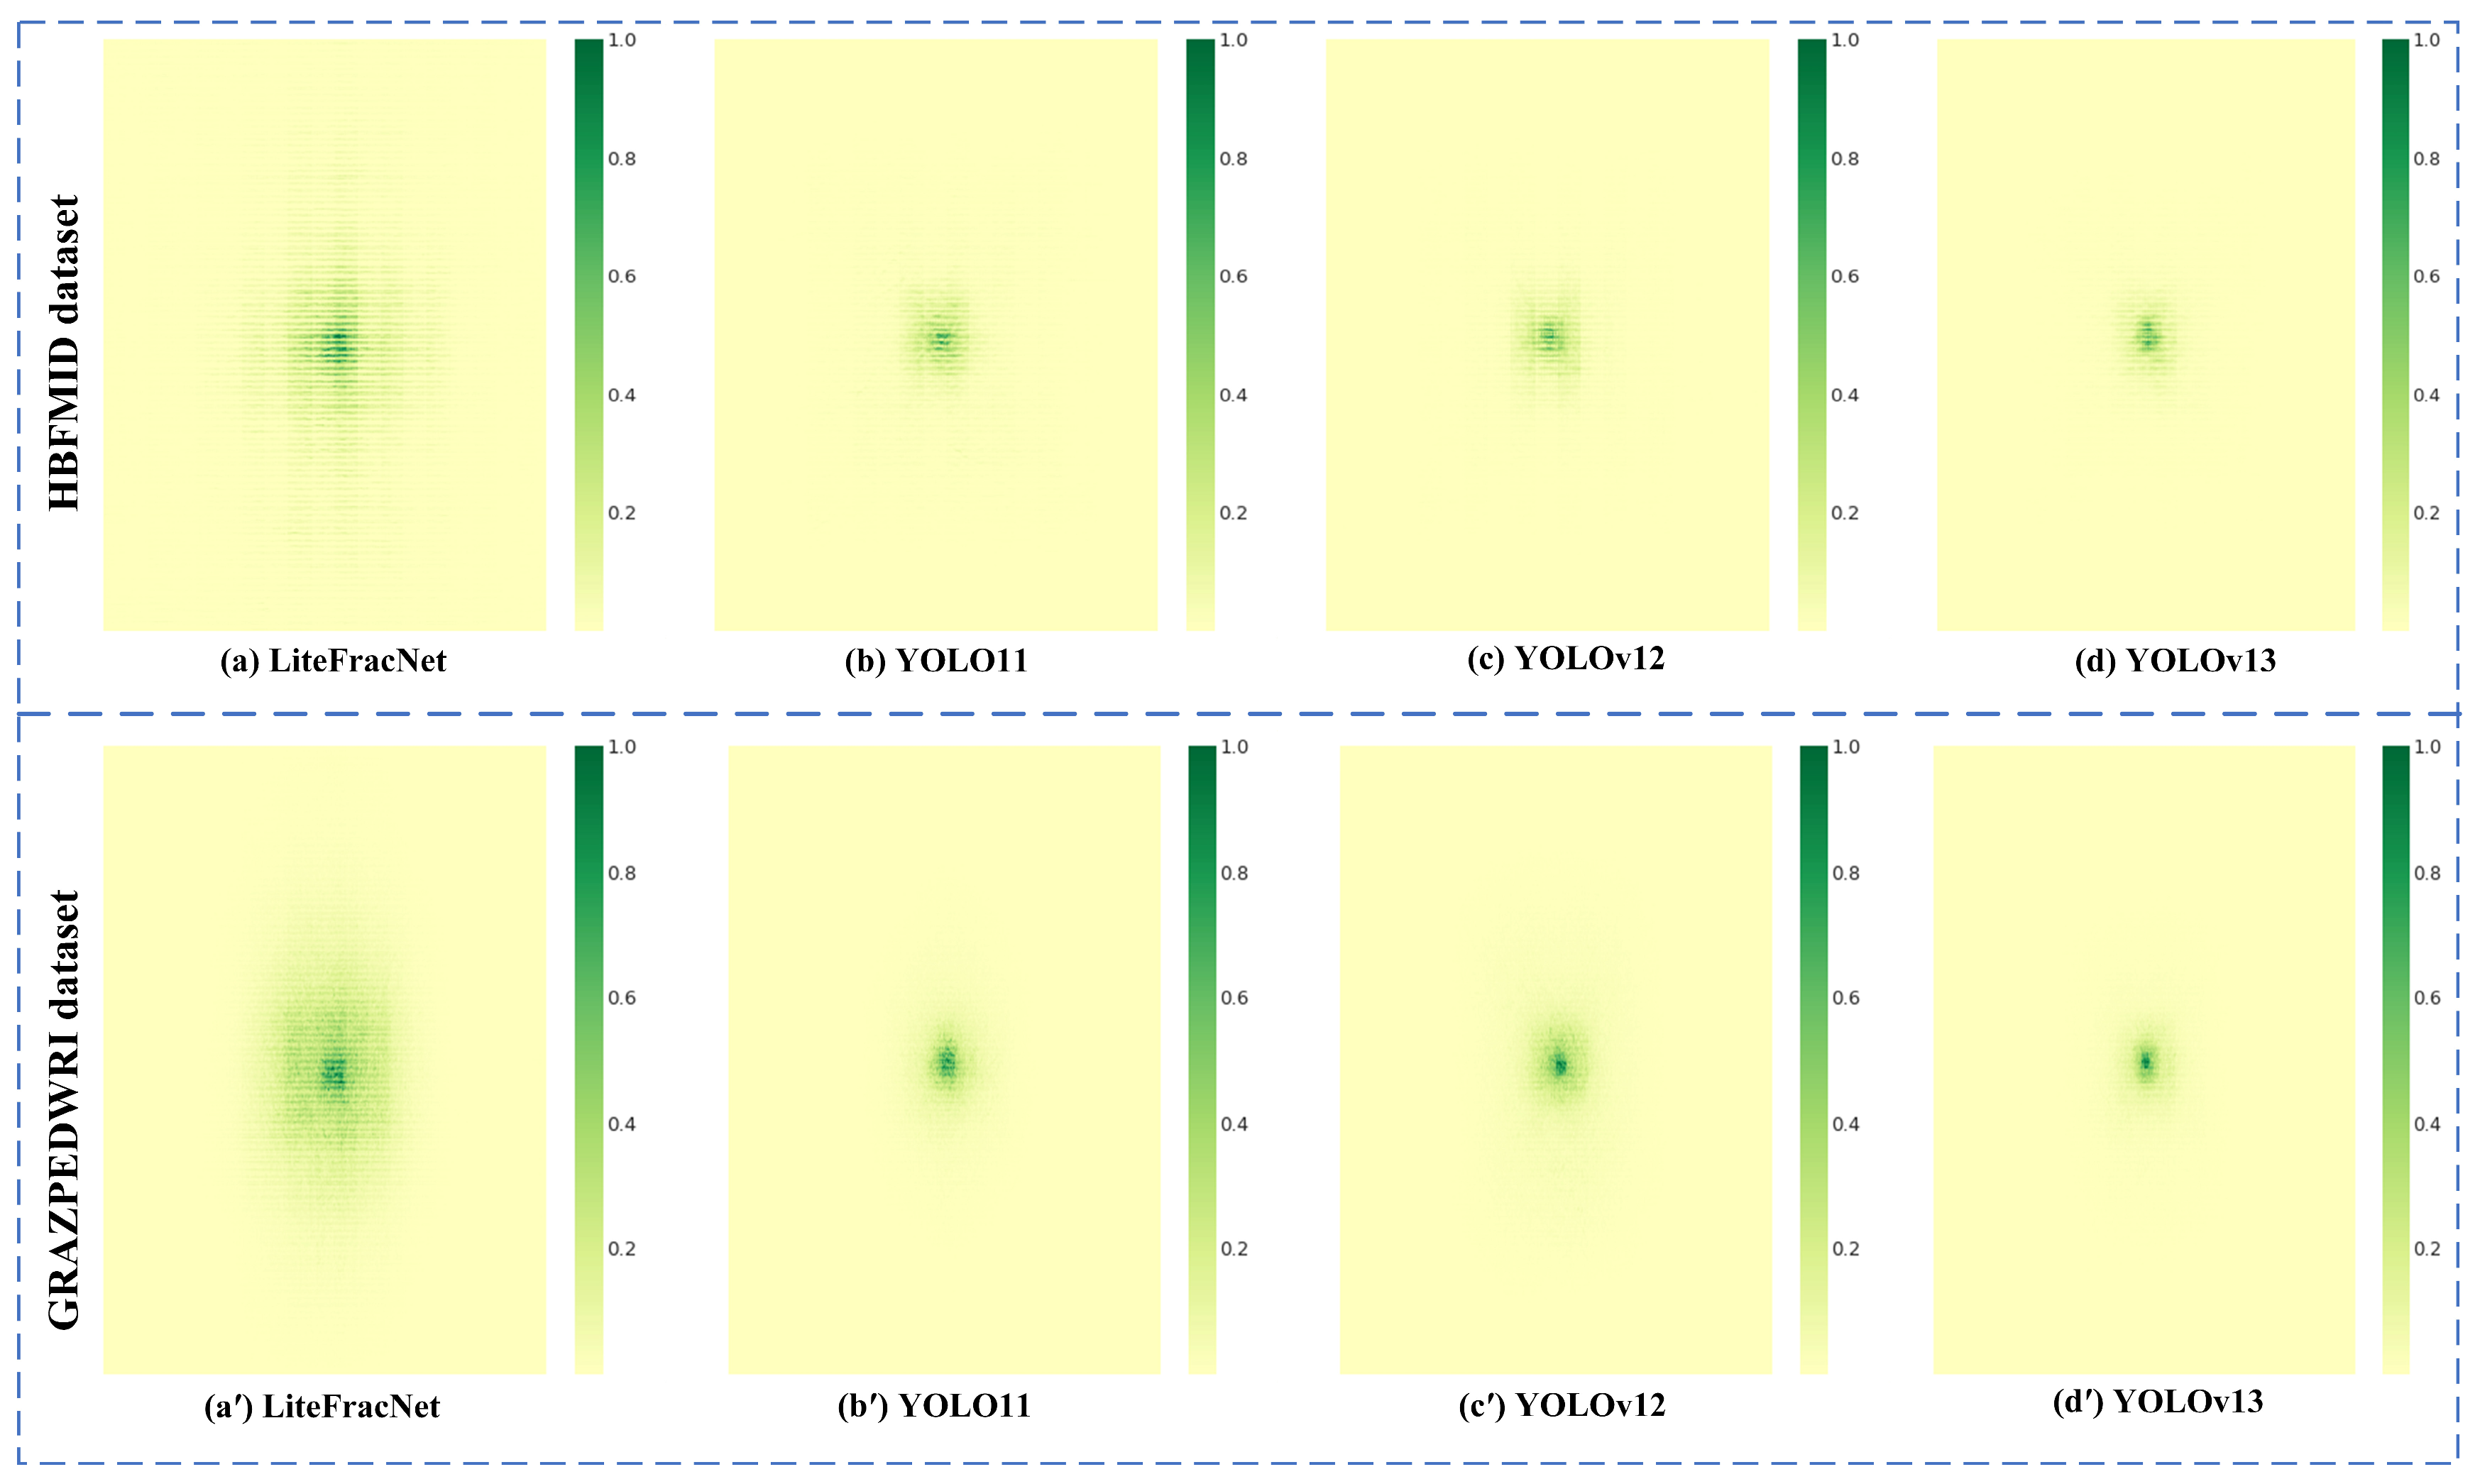
To further explore the model’s spatial attention distribution, we used Gradient-weighted Class Activation Mapping (Grad-CAM) [72] visualization to compare LiteFracNet with three mainstream detectors across two datasets (see Figure 12). The analysis revealed significant qualitative differences: one-stage detectors exhibited diffuse activation patterns, primarily focusing on background and non-pathological areas, indicating insufficient attention to lesion regions. In contrast, LiteFracNet generated highly concentrated activation heat-maps, with peak responses precisely aligned with lesion boundaries, demonstrating the model’s ability to learn spatially specific, discriminative pathological features.
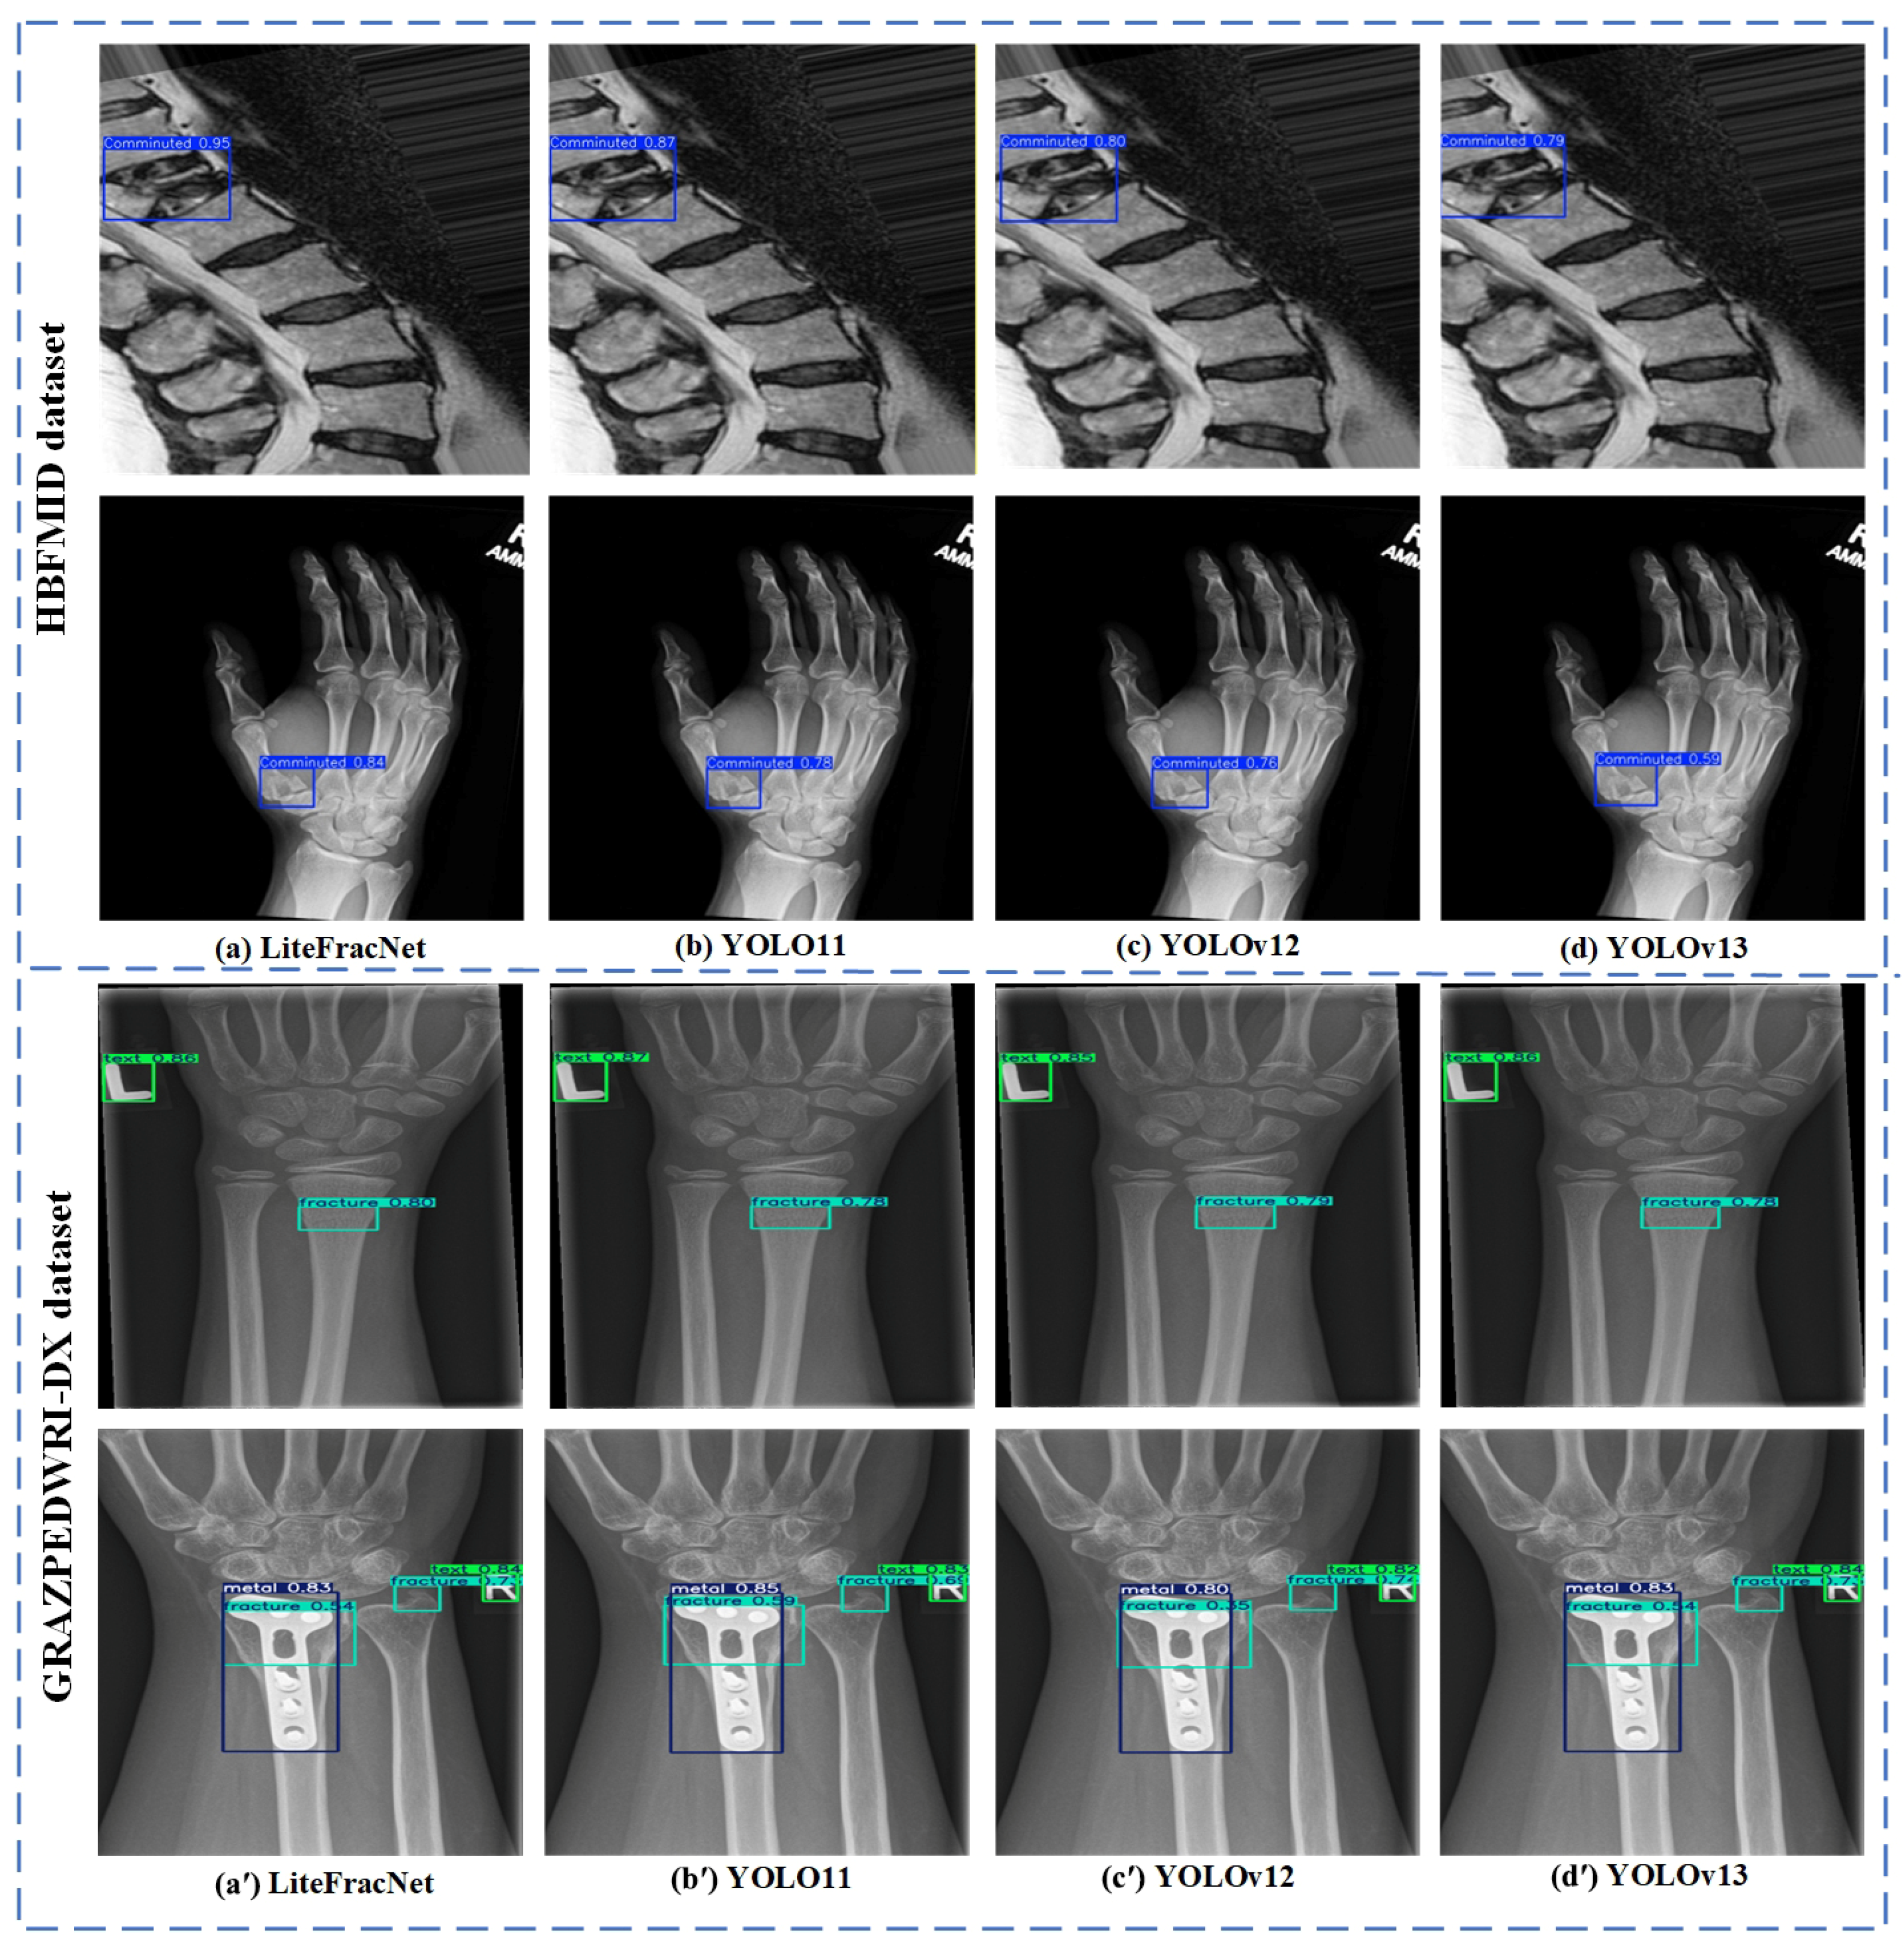
Figure 13 presents a qualitative comparison of LiteFracNet with mainstream detectors across the two datasets. In the representative cases, LiteFracNet achieved more precise fracture localization and consistently higher prediction confidence, whereas several competing detectors exhibited false-positive responses. When considered together with the Grad-CAM visualizations, these observations indicate that LiteFracNet can more effectively focus on fracture-relevant regions and maintain stable detection behavior under heterogeneous imaging conditions. These qualitative findings provide supportive evidence for the robustness and potential clinical reliability of LiteFracNet.
The receptive field size directly affects the model’s ability to extract features across different scales and complex backgrounds. A larger receptive field captures broader contextual information and improves the modeling of long-range dependencies. Figure 14 compares the effective receptive field distribution of LiteFracNet with three mainstream detectors across two datasets. The results show that LiteFracNet outperforms the other models in receptive field coverage, enabling better integration of spatial context and more effective capture of global features at the fracture site. This gives LiteFracNet a significant advantage in fracture recognition and localization accuracy. In contrast, one-stage detectors have smaller receptive fields, limiting their ability to capture global features, especially in complex backgrounds and for small objects.

6. Discussion

Although LiteFracNet achieved competitive performance on GRAZPEDWRI-DX, its mAP50 was 61.43%, compared with 93.53% on HBFMID, and its improvements over several strong baselines were relatively modest. This numerical difference arises because the two datasets have significant variations in terms of the patient population, anatomical coverage, imaging methods, category definitions, and annotation features. HBFMID includes multiple skeletal regions and both X-ray and MRI images, whereas GRAZPEDWRI-DX consists exclusively of pediatric wrist radiographs. These results suggest that LiteFracNet remains effective in a distinct dataset setting, although its performance is dataset dependent.
Pediatric radiographs present distinct diagnostic challenges. Growth plates, ossification centers, and incomplete ossification may resemble fracture lines and increase false-positive predictions, whereas subtle buckle, incomplete, and nondisplaced fractures may lead to false-negative detections because of their low contrast and limited structural discontinuity. The reported Precision, Recall, F1-score, and mAP50 provide quantitative measures of overall performance, while the Grad-CAM visualizations and representative detection examples offer complementary qualitative evidence of model attention and detection behavior. However, dedicated error stratification across fracture subtypes and patient groups, together with confidence-interval estimation, would provide a more comprehensive assessment of robustness and clinical reliability.
From a clinical perspective, domain-dependent false-positive predictions may increase radiologists’ review burden, whereas false-negative predictions may delay the recognition of subtle fractures. Therefore, further multi-center external validation, population-specific error analysis, and confidence-threshold calibration are required before practical clinical application. Future work will investigate domain adaptation strategies, including feature-distribution alignment, population-aware augmentation, and consistency regularization, to improve performance across heterogeneous patient populations and imaging environments.
Future work could also integrate LiteFracNet with text classification models for radiology reports or clinical notes. LiteFracNet could provide image-based fracture evidence, while the text branch could classify diagnostic findings and urgency and identify fracture-related information, potentially supporting clinical decision-making, report verification, and automated triage. Transformer-based and graph neural network-based text classification studies provide relevant cross-domain methodological references [73,74].

7. Conclusions

In this study, we proposed LiteFracNet, a lightweight fracture detection framework that integrates C3-CFormer, C2Mona, OFPN, and FED-Head to enhance contextual representation, multi-scale feature fusion, and prediction efficiency. LiteFracNet achieved a mAP50 of 93.53% on HBFMID, with only 2.41 million parameters, 8.1 GFLOPs, and a model size of 4.9 MB. On the pediatric GRAZPEDWRI-DX dataset, it achieved a mAP50 of 61.43%, demonstrating competitive performance under a substantially different data distribution. Nevertheless, the performance gap between the two datasets highlights the need for further improvements in cross-domain robustness.
Future work will focus on enhancing computational efficiency and domain adaptability through deployment-oriented optimization and domain-adaptation techniques. Validation on larger, multi-center datasets with more diverse demographic, anatomical, and imaging characteristics will further clarify the clinical applicability and deployment potential of LiteFracNet.


Author Contributions

Conceptualization, X.C.; methodology, X.C.; software, X.C.; data curation, Y.L.; resources, Y.L.; writing—original draft preparation, X.C.; supervision, G.W.; project administration, G.W.; funding acquisition, G.W. All authors have read and agreed to the published version of the manuscript.

Funding

The work is partly supported by the Scientific Research Program Funded by Education Department of Shaanxi Provincial Government (Program No. 22JY025). Excellent Doctoral Dissertation Cultivation Program of Xi’an Technological University (No. YB202502).

Institutional Review Board Statement

Not applicable.

Informed Consent Statement

Not applicable. This study used only publicly available de-identified datasets.

Data Availability Statement

No new data were created or analyzed in this study. Data sharing is not applicable to this article.

Conflicts of Interest

The authors declare no conflicts of interest.

References

  1. Markovics, D.; Virág, A.; Gadó, K. Management of Chronic Pain in Elderly Patients: The Central Role of Nurses in Multidisciplinary Care. Geriatrics 2025, 10, 110. [Google Scholar] [CrossRef] [Scilit] [PubMed]
  2. World Health Organization. Fragility Fractures; World Health Organization: Geneva, Switzerland, 2024. [Google Scholar]
  3. Feng, J.-N.; Zhang, C.-G.; Li, B.-H.; Zhan, S.-Y.; Wang, S.-F.; Song, C.-L. Global Burden of Hip Fracture: The Global Burden of Disease Study. Osteoporos. Int. 2024, 35, 41–52. [Google Scholar] [PubMed]
  4. Chang, S. World Osteoporosis Day: Focusing on Bone Health Across the Life Course; Chinese Center for Disease Control and Prevention: Beijing, China, 2022. [Google Scholar]
  5. Orimo, H.; Yaegashi, Y.; Onoda, T.; Fukushima, Y.; Hosoi, T.; Sakata, K. Hip Fracture Incidence in Japan: Estimates of New Patients in 2007 and 20-Year Trends. Arch. Osteoporos. 2009, 4, 71–77. [Google Scholar] [CrossRef] [Scilit] [PubMed]
  6. Rupp, M.; Walter, N.; Pfeifer, C.; Lang, S.; Kerschbaum, M.; Krutsch, W.; Baumann, F.; Alt, V. The Incidence of Fractures Among the Adult Population of Germany: An Analysis from 2009 through 2019. Dtsch. Ärztebl. Int. 2021, 118, 665–669. [Google Scholar] [PubMed]
  7. Job, R.F.S.; Wambulwa, W.M. Features of Low-Income and Middle-Income Countries Making Road Safety More Challenging. J. Road Saf. 2020, 31, 79–84. [Google Scholar] [CrossRef] [Scilit]
  8. Sharma, A.; Yadav, D.P.; Garg, H.; Kumar, M.; Sharma, B.; Koundal, D. Bone Cancer Detection Using Feature Extraction Based Machine Learning Model. Comput. Math. Methods Med. 2021, 2021, 7433186. [Google Scholar] [CrossRef] [Scilit] [PubMed]
  9. Muzakki, A.F.; Prasetyo, S.Y.; Purwanto, E.S. Evaluating K-Nearest Neighbors for X-Ray Bone Fracture Detection Using HOG, LBP, and SIFT Feature Extraction Methods. In Proceedings of the 2025 International Conference on Computer Sciences, Engineering, and Technology Innovation (ICoCSETI), Virtual, 21 January 2025. [Google Scholar]
  10. Muzakki, A.F.; Prasetyo, S.Y.; Purwanto, E.S. Comparative Analysis of Ensemble Techniques for Bone Fracture Detection from X-Ray Images Using HOG Features. In Proceedings of the 2025 International Conference on Advancement in Data Science, E-Learning and Information System (ICADEIS), Bandung, Indonesia, 3–4 February 2025. [Google Scholar]
  11. Al-Ashoor, A.; Lilik, F.; Nagy, S. Addressing the Impact of Resolution Scaling on YOLO Performance for Brain Tumor Detection Through Optimized Network Depth/Width Adjustments. Appl. Sci. 2026, 16, 4320. [Google Scholar] [CrossRef] [Scilit]
  12. Du, S.; Wei, Y. ASC-YOLO: Multi-Scale Feature Fusion and Adaptive Decoupled Head for Fracture Detection in Medical Imaging. Appl. Sci. 2025, 15, 9031. [Google Scholar] [CrossRef] [Scilit]
  13. He, Z.; Wu, Y.; Lv, Y.; He, Y. PCB-Faster-RCNN: An Improved Object Detection Algorithm for PCB Surface Defects. Appl. Sci. 2025, 15, 12881. [Google Scholar] [CrossRef] [Scilit]
  14. Qi, Y.; Zhao, J.; Shi, Y.; Zuo, G.; Zhang, H.; Long, Y.; Wang, F.; Wang, W. Ground Truth Annotated Femoral X-Ray Image Dataset and Object Detection Based Method for Fracture Types Classification. IEEE Access 2020, 8, 189436–189444. [Google Scholar] [CrossRef] [Scilit]
  15. Jia, Y.; Wang, H.; Chen, W.; Wang, Y.; Yang, B. An Attention-Based Cascade R-CNN Model for Sternum Fracture Detection in X-Ray Images. CAAI Trans. Intell. Technol. 2022, 7, 658–670. [Google Scholar] [CrossRef] [Scilit]
  16. Qiu, H.; He, Y. X-YOLO: A Method for Detecting Wrist Fractures in Children Based on Dynamic Feature Enhancement and Lightweight Design. Biomed. Signal Process. Control 2026, 112, 108874. [Google Scholar]
  17. Fu, X.; Yang, Q.; Sun, C.; Dou, M.; Hu, J.; Sun, H.; Lyu, F. Clinical Value of a YOLO11-Based Ultrasound Detection Model for Limb Long Bone Fracture Ends. Chin. J. Med. Ultrasound (Electron. Ed.) 2025, 22, 541–546. [Google Scholar]
  18. Baldini, C.; Migliorelli, L.; Berardini, D.; Azam, M.A.; Sampieri, C.; Ioppi, A.; Srivastava, R.; Peretti, G.; Mattos, L.S. Improving Real-Time Detection of Laryngeal Lesions in Endoscopic Images Using a Decoupled Super-Resolution Enhanced YOLO. Comput. Methods Programs Biomed. 2025, 260, 108539. [Google Scholar] [CrossRef] [Scilit] [PubMed]
  19. Chen, X. HD-YOLO: Real-Time Detection of Benign and Malignant Endometrial Lesions Using YOLO11. Signal Image Video Process. 2025, 19, 535. [Google Scholar] [CrossRef] [Scilit]
  20. Wang, G.; Chen, X.; Wang, H.; Li, Y. SIH-Det: A Lightweight Multi-Scale Dynamic Convolution Network for Efficient Intracranial Hemorrhage Segmentation. Biomed. Signal Process. Control 2026, 112, 108647. [Google Scholar] [CrossRef] [Scilit]
  21. Liu, B.; Chen, H.; Zhu, T.; Ye, Z.; Cui, H.; Wang, K. YOLO-HLSAM: Adapting Foundation Segment Anything Model for Semi-Automatic Detection and Segmentation of Breast Cancer Microcalcification Clusters. Biomed. Signal Process. Control 2026, 111, 108300. [Google Scholar] [CrossRef] [Scilit]
  22. Kang, M.; Ting, F.F.; Phan, R.C.W.; Ting, C.M. PK-YOLO: Pretrained Knowledge Guided YOLO for Brain Tumor Detection in Multiplanar MRI Slices. In Proceedings of the 2025 IEEE/CVF Winter Conference on Applications of Computer Vision (WACV), Tucson, AZ, USA, 28 February–4 March 2025. [Google Scholar]
  23. Sun, K.; Wang, Y.; Zhou, H. Enhanced Pulmonary Nodule Detection Using a Transformer Framework with Dual Fusion and Gated Mechanism. Complex Intell. Syst. 2025, 11, 397. [Google Scholar] [CrossRef] [Scilit]
  24. Han, K.; Li, Z.; Cai, M. YOLOv9-AGMA: An Enhanced Knowledge Distillation Network for Breast Ultrasound Image Classification. Biomed. Signal Process. Control 2026, 113, 108957. [Google Scholar] [CrossRef] [Scilit]
  25. Zou, J.; Arshad, M.R. Detection of Whole Body Bone Fractures Based on Improved YOLOv7. Biomed. Signal Process. Control 2024, 91, 105995. [Google Scholar] [CrossRef] [Scilit]
  26. Zhang, W.; Ji, S. Rehabilitation Driven Optimized YOLOv11 Model for Medical X-Ray Fracture Detection. Sensors 2025, 25, 5793. [Google Scholar] [CrossRef] [Scilit] [PubMed]
  27. Nguyen, H.T.; Tran, T.B.; Tran, T.T. Fracture Detection in Bone: An Approach with Versions of YOLOv4. SN Comput. Sci. 2024, 5, 765. [Google Scholar] [CrossRef] [Scilit]
  28. Liu, J.; Sun, P.; Yuan, Y.; Chen, Z.; Tian, K.; Gao, Q.; Li, X.; Xia, L.; Zhang, J.; Xu, N. YOLOv12 Algorithm-Aided Detection and Classification of Lateral Malleolar Avulsion Fracture and Subfibular Ossicle Based on CT Images: Multicenter Study. JMIR Med. Inform. 2025, 13, e79064. [Google Scholar] [CrossRef] [Scilit] [PubMed]
  29. Liu, D.; Yang, Z.; Bao, C.; Meng, Q. Artificial Intelligence-Based Method for Detecting Wrist Fractures in Children. Sci. Rep. 2025, 15, 38555. [Google Scholar] [CrossRef] [Scilit] [PubMed]
  30. Ju, R.-Y.; Chien, C.-T.; Xieerke, E.; Chiang, J.-S. Pediatric Wrist Fracture Detection Using Feature Context Excitation Modules in X-Ray Images. IET Image Process. 2026, 20, e70269. [Google Scholar]
  31. Hsieh, M.H.; Chang, C.Y.; Hsu, S.M. Accurate Detection of Fresh and Old Vertebral Compression Fractures on CT Images Using Ensemble YOLOR. Multimed. Tools Appl. 2024, 83, 89375–89391. [Google Scholar] [CrossRef] [Scilit]
  32. Yu, W.; Si, C.; Zhou, P.; Luo, M.; Zhou, Y.; Feng, J.; Yan, S.; Wang, X. MetaFormer Baselines for Vision. IEEE Trans. Pattern Anal. Mach. Intell. 2024, 46, 896–912. [Google Scholar] [CrossRef] [Scilit]
  33. Shi, D. TransNeXt: Robust Foveal Visual Perception for Vision Transformers. In Proceedings of the IEEE/CVF Conference on Computer Vision and Pattern Recognition (CVPR), Seattle, WA, USA, 16–22 June 2024. [Google Scholar]
  34. Yin, D.; Hu, L.; Li, B.; Zhang, Y.; Yang, X. 5% > 100%: Breaking Performance Shackles of Full Fine-Tuning on Visual Recognition Tasks. In Proceedings of the IEEE/CVF Conference on Computer Vision and Pattern Recognition (CVPR), Nashville, TN, USA, 11–15 June 2025. [Google Scholar]
  35. Sunkara, R.; Luo, T. No More Strided Convolutions or Pooling: A New CNN Building Block for Low-Resolution Images and Small Objects. In Proceedings of the Joint European Conference on Machine Learning and Knowledge Discovery in Databases (ECML PKDD), Grenoble, France, 19–23 September 2022. [Google Scholar]
  36. Cui, Y.; Ren, W.; Knoll, A. Omni-Kernel Network for Image Restoration. In Proceedings of the AAAI Conference on Artificial Intelligence; Association for the Advancement of Artificial Intelligence: Washington, DC, USA, 2024; Volume 38. [Google Scholar]
  37. Zhang, Y.; Zhou, S.; Li, H. Depth Information Assisted Collaborative Mutual Promotion Network for Single Image Dehazing. In Proceedings of the IEEE/CVF Conference on Computer Vision and Pattern Recognition (CVPR), Seattle, WA, USA, 17–21 June 2024. [Google Scholar]
  38. Parvin, S.; Rahman, A. A Real-Time Human Bone Fracture Detection and Classification from Multi-Modal Images Using Deep Learning Technique. Appl. Intell. 2024, 54, 9269–9285. [Google Scholar] [CrossRef] [Scilit]
  39. Nagy, E.; Janisch, M.; Hržić, F.; Sorantin, E.; Tschauner, S. A Pediatric Wrist Trauma X-Ray Dataset (GRAZPEDWRI-DX) for Machine Learning. Sci. Data 2022, 9, 222. [Google Scholar] [CrossRef] [Scilit] [PubMed]
  40. Li, Y.; Li, X.; Dai, Y.; Hou, Q.; Liu, L.; Liu, Y.; Cheng, M.-M.; Yang, J. LSKNet: A Foundation Lightweight Backbone for Remote Sensing. Int. J. Comput. Vis. 2025, 133, 1410–1431. [Google Scholar]
  41. Ma, X.; Dai, X.; Bai, Y.; Wang, Y.; Fu, Y. Rewrite the Stars. In Proceedings of the IEEE/CVF Conference on Computer Vision and Pattern Recognition (CVPR), Seattle, WA, USA, 17–21 June 2024. [Google Scholar]
  42. Qin, D.; Leichner, C.; Delakis, M.; Fornoni, M.; Luo, S.; Yang, F.; Wang, W.; Banbury, C.; Ye, C.; Akin, B.; et al. MobileNetV4: Universal Models for the Mobile Ecosystem. In Proceedings of the European Conference on Computer Vision (ECCV), Milan, Italy, 29 September–4 October 2024. [Google Scholar]
  43. Ding, X.; Zhang, Y.; Ge, Y.; Zhao, S.; Song, L.; Yue, X.; Shan, Y. UniRepLKNet: A Universal Perception Large-Kernel ConvNet for Audio, Video, Point Cloud, Time-Series and Image Recognition. In Proceedings of the IEEE/CVF Conference on Computer Vision and Pattern Recognition (CVPR), Seattle, WA, USA, 17–21 June 2024. [Google Scholar]
  44. Liu, X.; Peng, H.; Zheng, N.; Yang, Y.; Hu, H.; Yuan, Y. EfficientViT: Memory Efficient Vision Transformer with Cascaded Group Attention. In Proceedings of the IEEE/CVF Conference on Computer Vision and Pattern Recognition (CVPR), Vancouver, BC, Canada, 18–22 June 2023. [Google Scholar]
  45. Zhang, T.; Li, L.; Zhou, Y.; Liu, W.; Qian, C.; Hwang, J.-N.; Ji, X. CAS-ViT: Convolutional Additive Self-Attention Vision Transformers for Efficient Mobile Applications. arXiv 2024, arXiv:2408.03703. [Google Scholar]
  46. Wan, D.; Lu, R.; Hu, B.; Yin, J.; Shen, S.; Xu, T.; Lang, X. YOLO-MIF: Improved YOLOv8 with Multi-Information Fusion for Object Detection in Gray-Scale Images. Adv. Eng. Inform. 2024, 62, 102709. [Google Scholar] [CrossRef] [Scilit]
  47. Chen, J.; Kao, S.-H.; He, H.; Zhuo, W.; Wen, S.; Lee, C.-H.; Chan, S.-H.G. Run, Don’t Walk: Chasing Higher FLOPS for Faster Neural Networks. In Proceedings of the IEEE/CVF Conference on Computer Vision and Pattern Recognition (CVPR), Vancouver, BC, Canada, 18–22 June 2023. [Google Scholar]
  48. Li, F.; Cong, R.; Wu, J.; Bai, H.; Wang, M.; Zhao, Y. SRConvNet: A Transformer-Style ConvNet for Lightweight Image Super-Resolution. Int. J. Comput. Vis. 2025, 133, 173–189. [Google Scholar]
  49. Yang, G.; Wang, Y.; Shi, D.; Wang, Y. Golden Cudgel Network for Real-Time Semantic Segmentation. In Proceedings of the IEEE/CVF Conference on Computer Vision and Pattern Recognition (CVPR), Nashville, TN, USA, 11–15 June 2025. [Google Scholar]
  50. Feijoo, D.; Benito, J.C.; Garcia, A.; Conde, M.V. DarkIR: Robust Low-Light Image Restoration. In Proceedings of the IEEE/CVF Conference on Computer Vision and Pattern Recognition (CVPR), Nashville, TN, USA, 11–15 June 2025. [Google Scholar]
  51. Li, C.; Zhou, A.; Yao, A. Omni-Dimensional Dynamic Convolution. arXiv 2022, arXiv:2209.07947. [Google Scholar]
  52. Wu, W.; Liu, S.; Xia, Y.; Zhang, Y. Dual Residual Attention Network for Image Denoising. Pattern Recognit. 2024, 149, 110291. [Google Scholar] [CrossRef] [Scilit]
  53. Zhang, H.; Zu, K.; Lu, J.; Zou, Y.; Meng, D. EPSANet: An Efficient Pyramid Squeeze Attention Block on Convolutional Neural Network. In Proceedings of the Asian Conference on Computer Vision (ACCV), Macau, China, 4–8 December 2022. [Google Scholar]
  54. Xia, Z.; Pan, X.; Song, S.; Li, E.L.; Huang, G. Vision Transformer with Deformable Attention. In Proceedings of the IEEE/CVF Conference on Computer Vision and Pattern Recognition (CVPR), New Orleans, LA, USA, 18–24 June 2022. [Google Scholar]
  55. Zhu, L.; Wang, X.; Ke, Z.; Zhang, W.; Lau, R.W.H. BiFormer: Vision Transformer with Bi-Level Routing Attention. In Proceedings of the IEEE/CVF Conference on Computer Vision and Pattern Recognition (CVPR), Vancouver, BC, Canada, 18–22 June 2023. [Google Scholar]
  56. Lan, L.; Li, Y.; Liu, X.; Zhou, J.; Zhang, J.; Huang, N.; Zhang, Y. MSLAU-Net: A Hybrid CNN-Transformer Network for Medical Image Segmentation. arXiv 2025, arXiv:2505.18823. [Google Scholar]
  57. Hu, J.; Bai, T.; Wu, F.; Peng, Z.; Zhang, Y. Pyramid Sparse Transformer: Enhancing Multi-Scale Feature Fusion with Dynamic Token Selection. arXiv 2025, arXiv:2505.12772. [Google Scholar]
  58. Lou, M.; Yu, Y. OverLoCK: An Overview-First-Look-Closely-Next ConvNet with Context-Mixing Dynamic Kernels. In Proceedings of the IEEE/CVF Conference on Computer Vision and Pattern Recognition (CVPR), Nashville, TN, USA, 10–17 June 2025. [Google Scholar]
  59. Liu, Q.; Wan, X.; Sheng, Y.; Wei, B. GCEA-YOLO: An Enhanced YOLOv11-Based Network for Smoking Behavior Detection in Oilfield Operation Areas. Sensors 2026, 26, 103. [Google Scholar] [PubMed]
  60. Cao, Q.; Chen, H.; Wang, S.; Wang, Y.; Fu, H.; Chen, Z.; Liang, F. LH-YOLO: A Lightweight and High-Precision SAR Ship Detection Model Based on the Improved YOLOv8n. Remote Sens. 2024, 16, 4340. [Google Scholar] [CrossRef] [Scilit]
  61. Zhang, J.; Chen, Z.; Yan, G.; Wang, Y.; Hu, B. Faster and Lightweight: An Improved YOLOv5 Object Detector for Remote Sensing Images. Remote Sens. 2023, 15, 4974. [Google Scholar] [CrossRef] [Scilit]
  62. Jocher, G.; Chaurasia, A.; Stoken, A.; Borovec, J.; NanoCode012; Kwon, Y.; Xie, T.; Michael, K.; Fang, J.; imyhxy; et al. Ultralytics/YOLOv5: v6.2-YOLOv5 Classification Models, Apple M1, Reproducibility, ClearML and Deci.ai Integrations, version 6.2; Zenodo: Geneva, Switzerland, 2022. [Google Scholar] [CrossRef]
  63. Li, C.; Li, L.; Jiang, H.; Weng, K.; Geng, Y.; Li, L.; Ke, Z.; Li, Q.; Cheng, M.; Nie, W.; et al. YOLOv6: A One-Stage Object Detection Framework for Industrial Applications. arXiv 2022, arXiv:2209.02976. [Google Scholar]
  64. Wang, C.Y.; Yeh, I.H.; Liao, H.Y.M. YOLOv9: Learning What You Want to Learn Using Programmable Gradient Information. In Proceedings of the European Conference on Computer Vision (ECCV), Milan, Italy, 29 September–4 October 2024. [Google Scholar]
  65. Wang, A.; Chen, H.; Liu, L.; Chen, K.; Lin, Z.; Han, J.; Ding, G. YOLOv10: Real-Time End-to-End Object Detection. Adv. Neural Inf. Process. Syst. 2024, 37, 107984–108011. [Google Scholar] [CrossRef] [Scilit]
  66. Jocher, G.; Qiu, J. Ultralytics YOLO11, Version 11.0.0, 2024. Available online: https://github.com/ultralytics/ultralytics (accessed on 22 July 2026).
  67. Tian, Y.; Ye, Q.; Doermann, D. YOLOv12: Attention-Centric Real-Time Object Detectors. arXiv 2025, arXiv:2502.12524. [Google Scholar]
  68. Lei, M.; Li, S.; Wu, Y.; Hu, H.; Zhou, Y.; Zheng, X.; Ding, G.; Du, S.; Wu, Z.; Gao, Y. YOLOv13: Real-Time Object Detection with Hypergraph-Enhanced Adaptive Visual Perception. arXiv 2025, arXiv:2506.17733. [Google Scholar]
  69. Feng, Y.; Huang, J.; Du, S.; Ying, S.; Yong, J.-H.; Li, Y.; Ding, G.; Ji, R.; Gao, Y. Hyper-YOLO: When Visual Object Detection Meets Hypergraph Computation. IEEE Trans. Pattern Anal. Mach. Intell. 2025, 47, 2388–2401. [Google Scholar] [CrossRef] [Scilit] [PubMed]
  70. Zhao, Y.; Lv, W.; Xu, S.; Wei, J.; Wang, G.; Dang, Q.; Liu, Y.; Chen, J. DETRs Beat YOLOs on Real-Time Object Detection. In Proceedings of the IEEE/CVF Conference on Computer Vision and Pattern Recognition (CVPR), Seattle, WA, USA, 17–21 June 2024. [Google Scholar]
  71. Lyu, C.; Zhang, W.; Huang, H.; Zhou, Y.; Wang, Y.; Liu, Y.; Zhang, S.; Chen, K. RTMDet: An Empirical Study of Designing Real-Time Object Detectors. arXiv 2022, arXiv:2212.07784. [Google Scholar]
  72. Selvaraju, R.R.; Cogswell, M.; Das, A.; Vedantam, R.; Parikh, D.; Batra, D. Grad-CAM: Visual Explanations from Deep Networks via Gradient-Based Localization. In Proceedings of the IEEE International Conference on Computer Vision (ICCV), Venice, Italy, 22–29 October 2017. [Google Scholar]
  73. Wang, S. Development of an automated transformer-based text analysis framework for monitoring fire door defects in buildings. Sci. Rep. 2025, 15, 43910. [Google Scholar] [CrossRef] [Scilit] [PubMed]
  74. Wang, S. Graph neural network–driven text classification for fire-door defect inspection in pre-completion construction. Sci. Rep. 2025, 15, 44382. [Google Scholar] [CrossRef] [Scilit] [PubMed]
Figure 1. The overall architecture of the proposed detection framework.
Applsci 16 07484 g001
Figure 2. LiteFracNet model structure.
Applsci 16 07484 g002
Figure 3. C3-CFormer module structure.
Applsci 16 07484 g003
Figure 4. C2Mona module structure.
Applsci 16 07484 g004
Figure 5. SPDConv structure.
Applsci 16 07484 g005
Figure 6. OmniKernel fusion module.
Applsci 16 07484 g006
Figure 7. Modulation fusion module structure.
Applsci 16 07484 g007
Figure 8. FED-Head structure.
Applsci 16 07484 g008
Figure 9. Example of the HBFMID and GRAZPEDWRI-DX dataset images.
Applsci 16 07484 g009
Figure 10. Normalized confusion matrices of different models on the HBFMID.
Applsci 16 07484 g010
Figure 11. Feature map visualization of LiteFracNet on two datasets.
Applsci 16 07484 g011
Figure 12. Heat-map visualization of LiteFracNet on two datasets.
Applsci 16 07484 g012
Figure 13. Detection performance of LiteFracNet on two datasets.
Applsci 16 07484 g013
Figure 14. Visualization of the receptive field of LiteFracNet on two datasets.
Applsci 16 07484 g014
Table 1. Experimental environment configuration.
Hyper-ParametersValue
Epoch300
Image size640 × 640
Weight decay0.0005
Momentum0.937
Batch size16
OptimizerSGD
Seed0
Pretrained weightsNone
NMS IoU threshold0.5
Lr00.01
Lr10.01
Table 2. Comparison results of different feature extraction networks on HBFMID.
MethodsPrecisionRecallF1-ScoreParams (M)GFLOPsmAP50Model Size (MB)
LiteFracNet0.93590.84740.88952.418.10.93534.9
LSKNet [40]0.91740.82950.87125.3917.50.874610.7
StarNet [41]0.91620.82270.86691.875.20.86174.6
MobileNetv4 [42]0.92030.83970.87825.1920.20.924210.3
UnireplkNet [43]0.93190.84680.88735.5714.70.928411.5
EfficientViT [44]0.93250.82740.87683.678.20.93157.9
Table 3. Comparison results of different C3-CFormer modules on HBFMID.
MethodsPrecisionRecallF1-ScoreParams (M)GFLOPsmAP50Model Size (MB)
LiteFracNet0.93590.84740.88952.418.10.93534.9
AdditiveBlock [45]0.92660.84380.88332.437.40.92845.2
DeepDBB [46]0.88750.85550.87122.586.30.92638.7
FasterBlock [47]0.89030.85210.87082.337.10.92475.0
FMABlock [48]0.90800.82530.86413.168.10.89946.5
GCConv [49]0.93030.81420.86842.738.90.91767.3
EBlock [50]0.91380.83440.86232.427.90.91655.0
ODConv [51]0.92700.83500.87862.727.40.93125.6
HDRAB [52]0.92680.81050.86482.768.30.91335.9
Table 4. Comparison results of different C2Mona modules on HBFMID.
MethodsPrecisionRecallF1-ScoreParams (M)GFLOPsmAP50Model Size (MB)
LiteFracNet0.93590.84740.88952.418.10.93534.9
C2PSA [53]0.92410.83590.87782.358.10.92624.8
C2DA [54]0.91520.82650.86862.378.10.91784.9
C2BRA [55]0.93390.83780.88322.998.30.92956.0
C2MSLA [56]0.92340.84690.88352.968.30.93466.0
Table 5. Comparison results of different fusion modules on HBFMID.
MethodsPrecisionRecallF1-ScoreParams (M)GFLOPsmAP50Model Size (MB)
LiteFracNet0.93590.84740.88952.418.10.93534.9
PST [57]0.92240.83760.87802.357.40.92144.8
RAB [52]0.92470.84060.88062.357.60.92794.8
RepConvBlock [58]0.93040.84700.88672.367.50.93414.9
Table 6. Comparison results of different detection heads on HBFMID.
MethodsPrecisionRecallF1-ScoreParams (M)GFLOPsmAP50Model Size (MB)
LiteFracNet0.93590.84740.88952.418.10.93534.9
Efficient Head [59]0.92700.84510.88422.307.60.92154.7
RSCD [60]0.93150.84360.88542.598.10.93346.4
LADH [61]0.91520.83270.87202.277.70.91574.7
Table 7. Results of the ablation study on HBFMID.
MethodsPrecisionRecallF1-ScoreParams (M)GFLOPsmAP50Model Size (MB)
YOLO110.92230.83890.87862.586.30.89885.3
+A0.92930.83920.88202.446.20.91265.0
+B0.92370.84130.88062.646.40.90395.4
+C0.92460.84690.88402.668.90.92375.4
+D0.91870.84780.88182.425.60.90284.9
+A+B0.92540.84230.88192.496.20.92556.2
+A+B+C0.92760.84380.88372.578.80.92865.3
+A+B+C+D0.93590.84740.88952.418.10.93534.9
Table 8. Results of the t-test on HBFMID and GRAZPEDWRI-DX datasets.
DatasetMethodsSample Size (n)Mean ± SD (%)t Valuedfp Value
HBFMIDYOLO11590.03 ± 0.31---
LiteFracNet593.46 ± 0.3416.6694<0.001
GRAZPEDWRI-DXYOLO11559.98 ±0.26---
LiteFracNet561.39 ± 0.229.2574<0.001
Table 9. Comparison results of different models on HBFMID.
MethodsPrecisionRecallF1-ScoreParams (M)GFLOPsmAP50FPSModel Size (MB)
YOLOv5n [62]0.90210.86460.88302.185.80.9148102.34.7
YOLOv5s [62]0.90350.86470.88377.8218.80.924682.416.0
YOLOv6n [63]0.89730.77920.83414.1611.50.864372.48.6
YOLOv6s [63]0.93290.81260.868615.9842.80.867865.232.2
YOLOv9t [64]0.84860.84790.84821.736.40.8552105.74.2
YOLOv9s [64]0.92470.85490.88846.2022.10.921261.213.3
YOLOv10n [65]0.85410.77830.81442.276.50.836888.55.8
YOLOv10s [65]0.86730.84720.85717.2221.40.847658.416.6
YOLO11n [66]0.92230.83890.87862.586.30.8988100.75.3
YOLOv12n [67]0.90190.79410.84462.515.80.858283.55.2
YOLOv13n [68]0.84200.84660.84432.456.10.877885.25.2
Hyper-YOLO [69]0.93530.84530.88803.629.50.934271.37.3
RT-DETR r18 [70]0.92950.84650.886119.8857.00.933642.777.0
RTMDet-tiny [71]0.69260.76840.72854.788.20.815739.29.3
RTMDet-s [71]0.72850.81460.76918.9214.20.886335.518.2
LiteFracNet0.93590.84740.88952.418.10.935387.14.9
Table 10. Comparison results of different models on GRAZPEDWRI-DX dataset.
MethodsPrecisionRecallF1-ScoreParams (M)GFLOPsmAP50Model Size (MB)
YOLOv5n [62]0.67290.56820.61612.185.80.58974.7
YOLOv6n [63]0.64110.55250.59354.1611.50.57518.6
YOLOv9t [64]0.62460.58250.60281.736.40.57424.2
YOLOv10n [65]0.65230.59220.62072.276.50.58945.8
YOLO11n [66]0.69570.59260.64002.586.30.60095.3
YOLOv12n [67]0.64210.58810.61392.515.80.58715.2
YOLOv13n [68]0.69340.57450.62842.456.10.60425.2
Hyper-YOLO [69]0.59410.60060.59733.629.50.59987.3
LiteFracNet0.65510.63450.64462.418.10.61434.9
Disclaimer/Publisher’s Note: The statements, opinions and data contained in all publications are solely those of the individual author(s) and contributor(s) and not of MDPI and/or the editor(s). MDPI and/or the editor(s) disclaim responsibility for any injury to people or property resulting from any ideas, methods, instructions or products referred to in the content.