Joint Prediction of Goaf Temperature and CO Concentration Using Multi-Source Monitoring Feature Fusion and CA-WOA-Optimized Models

Abstract
1. Introduction
2. Models and Methods
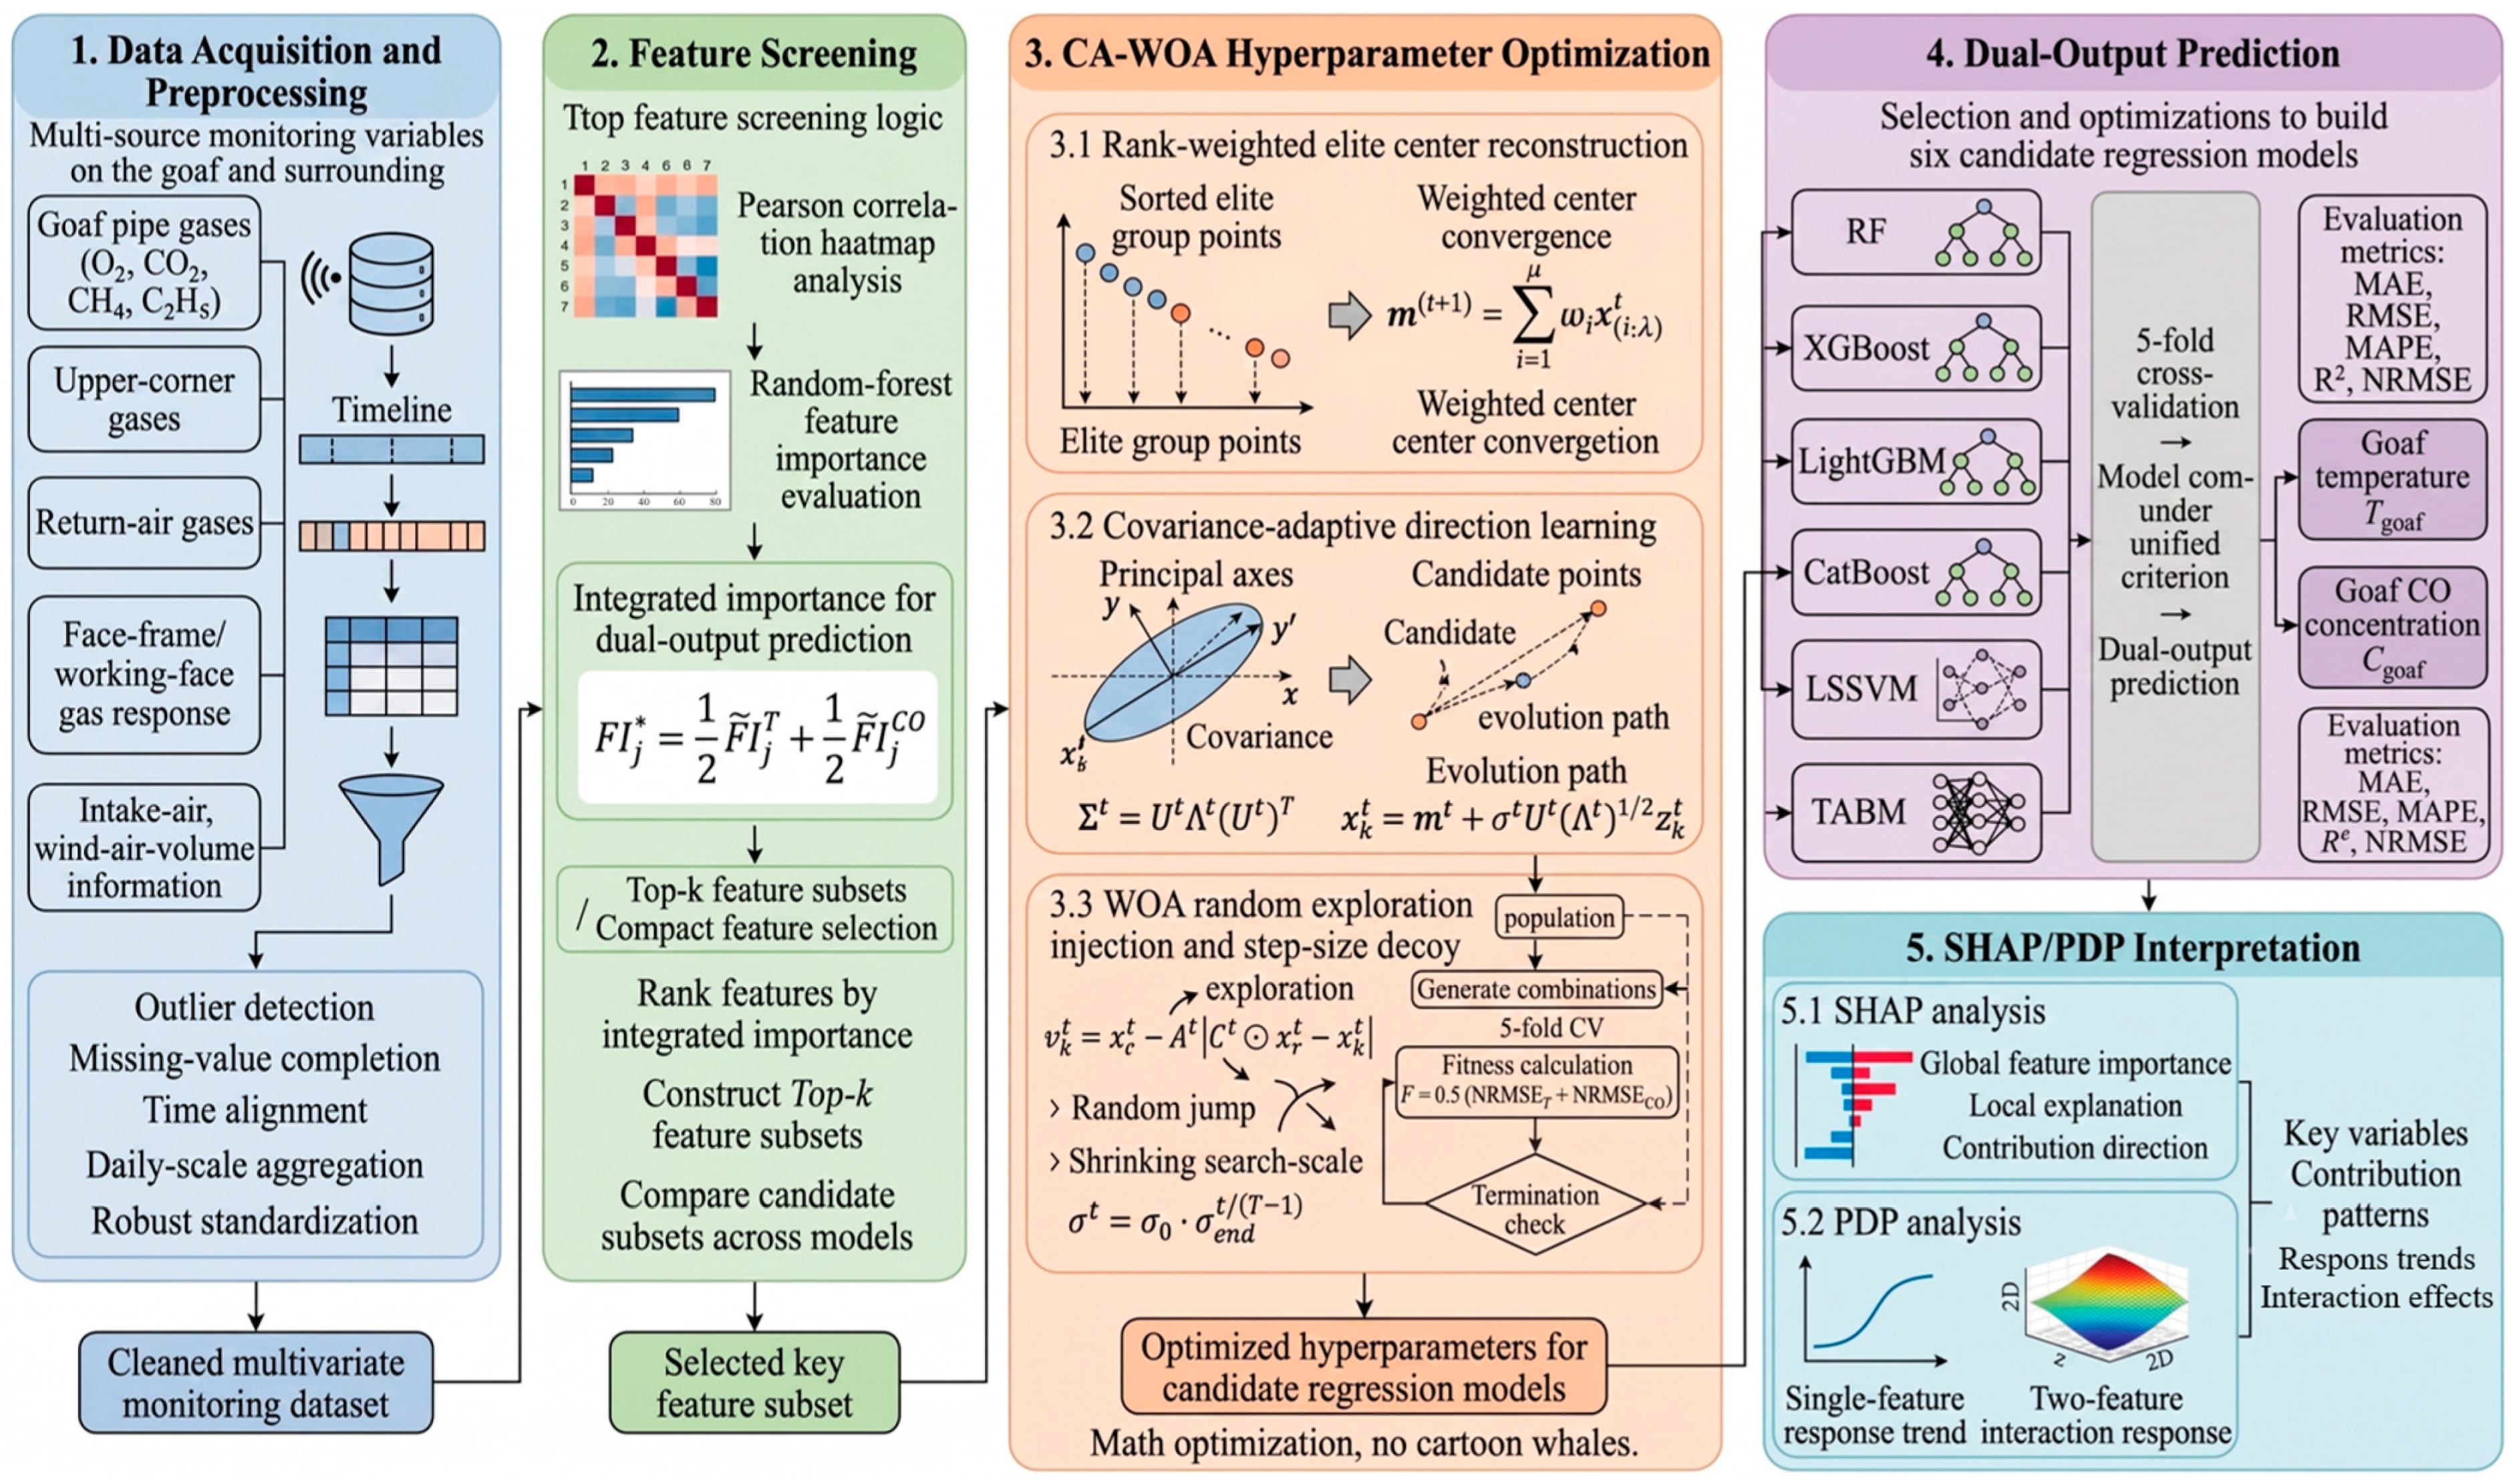
2.1. Overall Framework
2.2. Integrated Feature Ranking and Candidate-Subset Construction
2.3. TABM Regression Model
2.4. CA-WOA Optimization Algorithm
2.4.1. Limitations of WOA and Improvement Strategy
2.4.2. Improvement Strategies of CA-WOA
- (1)
- Rank-weighted elite-center reconstruction
- (2)
- Covariance-adaptive direction learning
- (3)
- Random-search injection and step-size contraction
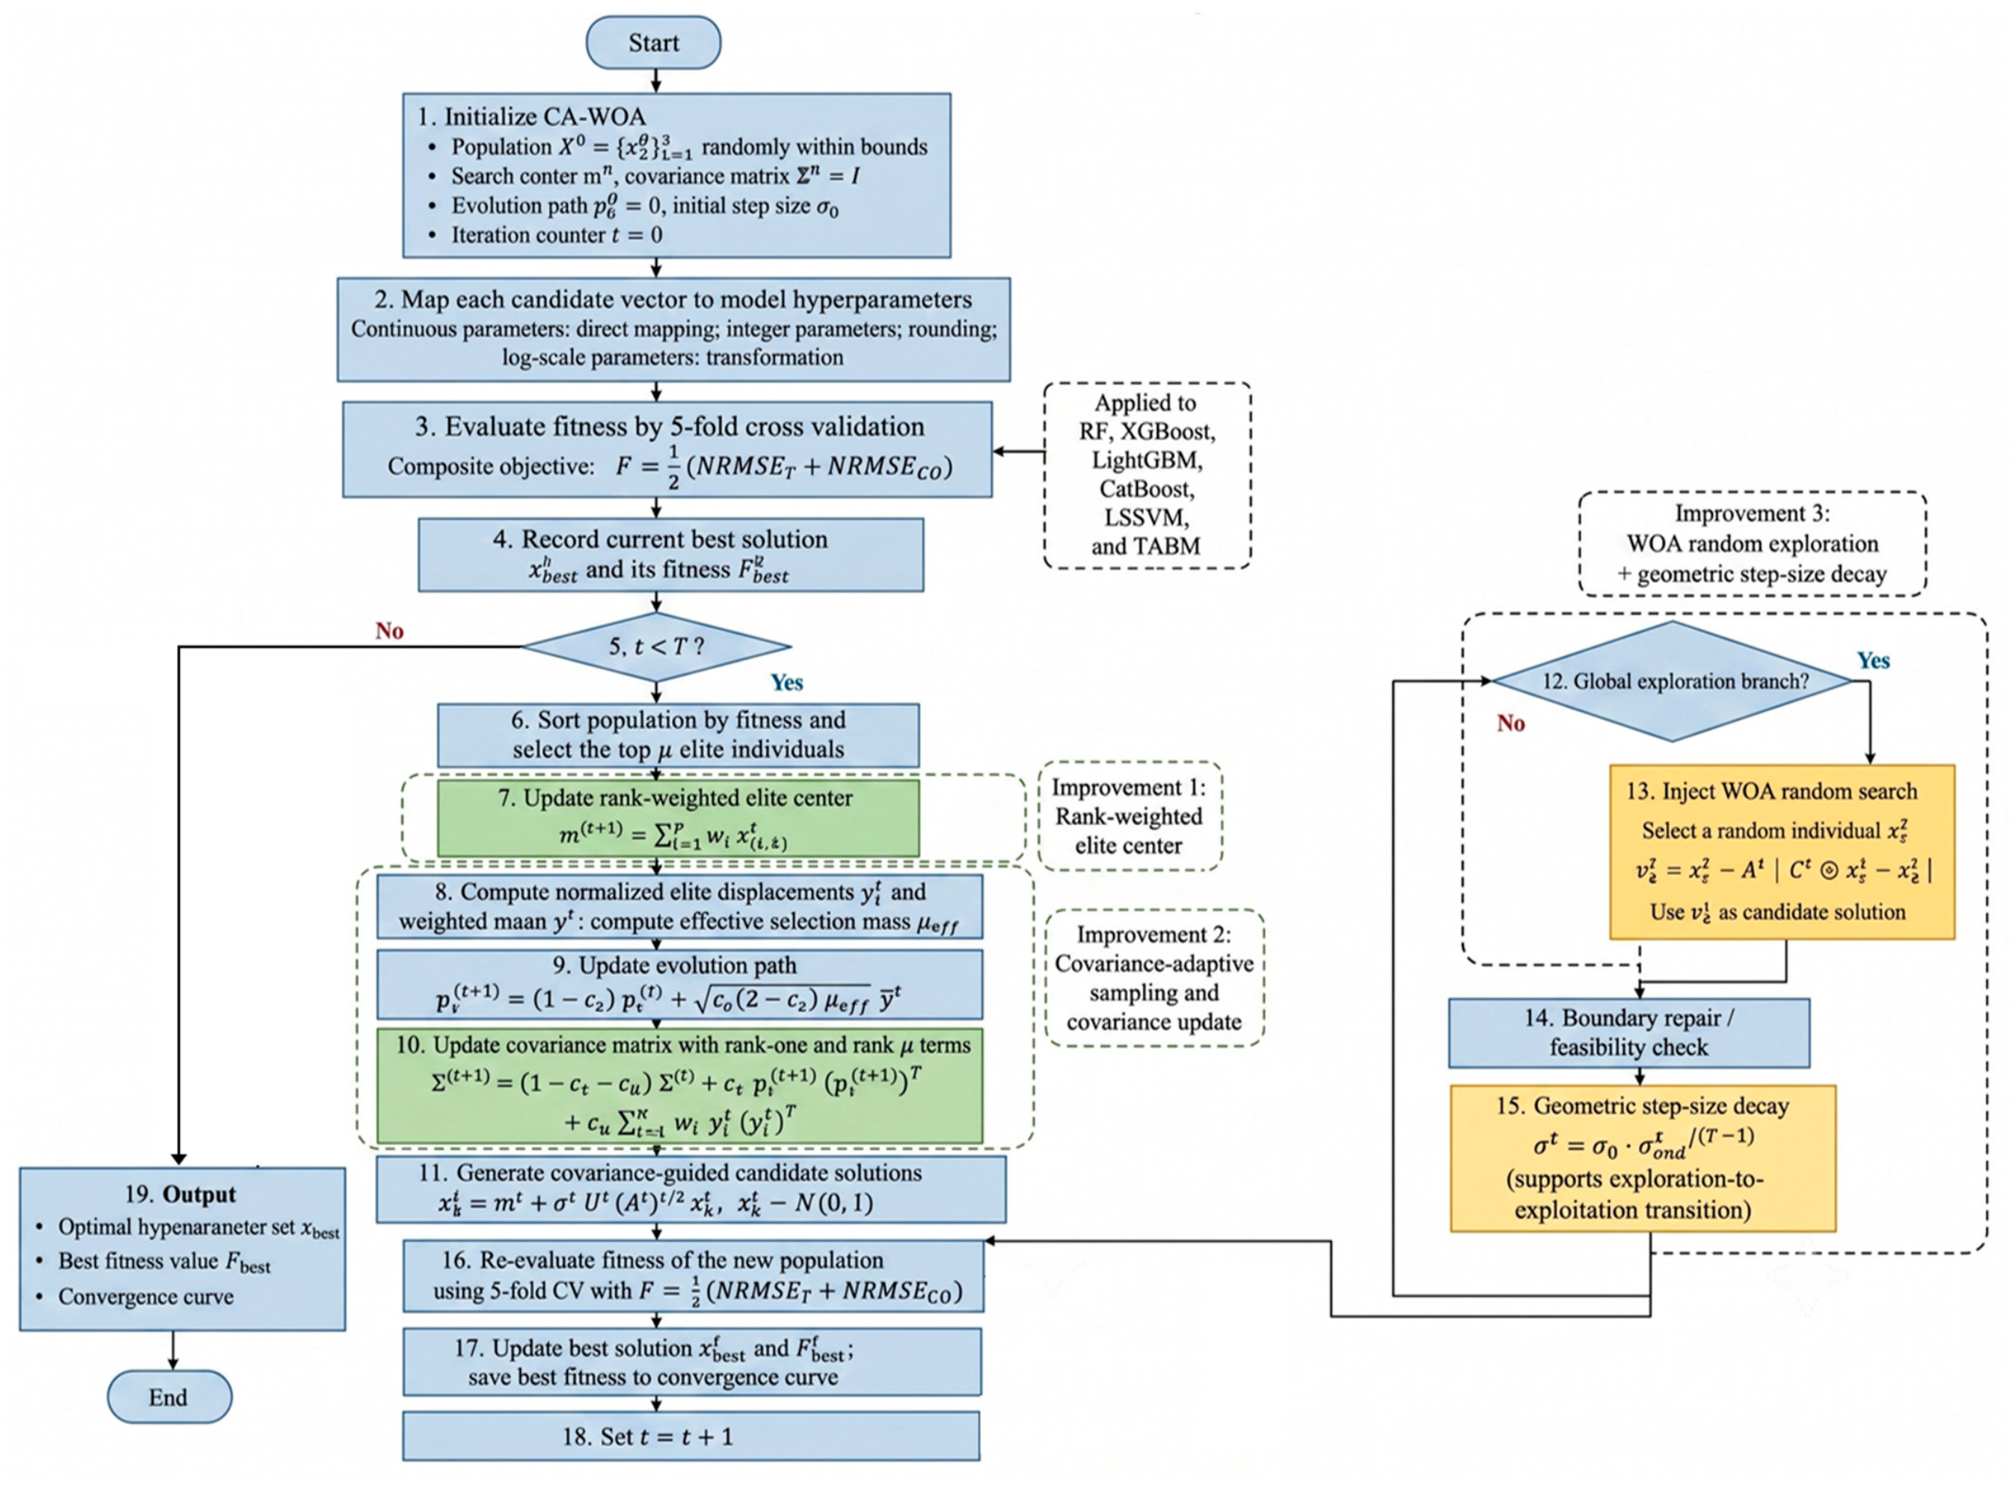
2.4.3. CA-WOA Algorithm Procedure
2.5. SHAP/PDP Interpretation Methods
2.6. Evaluation Metrics and Fitness Function
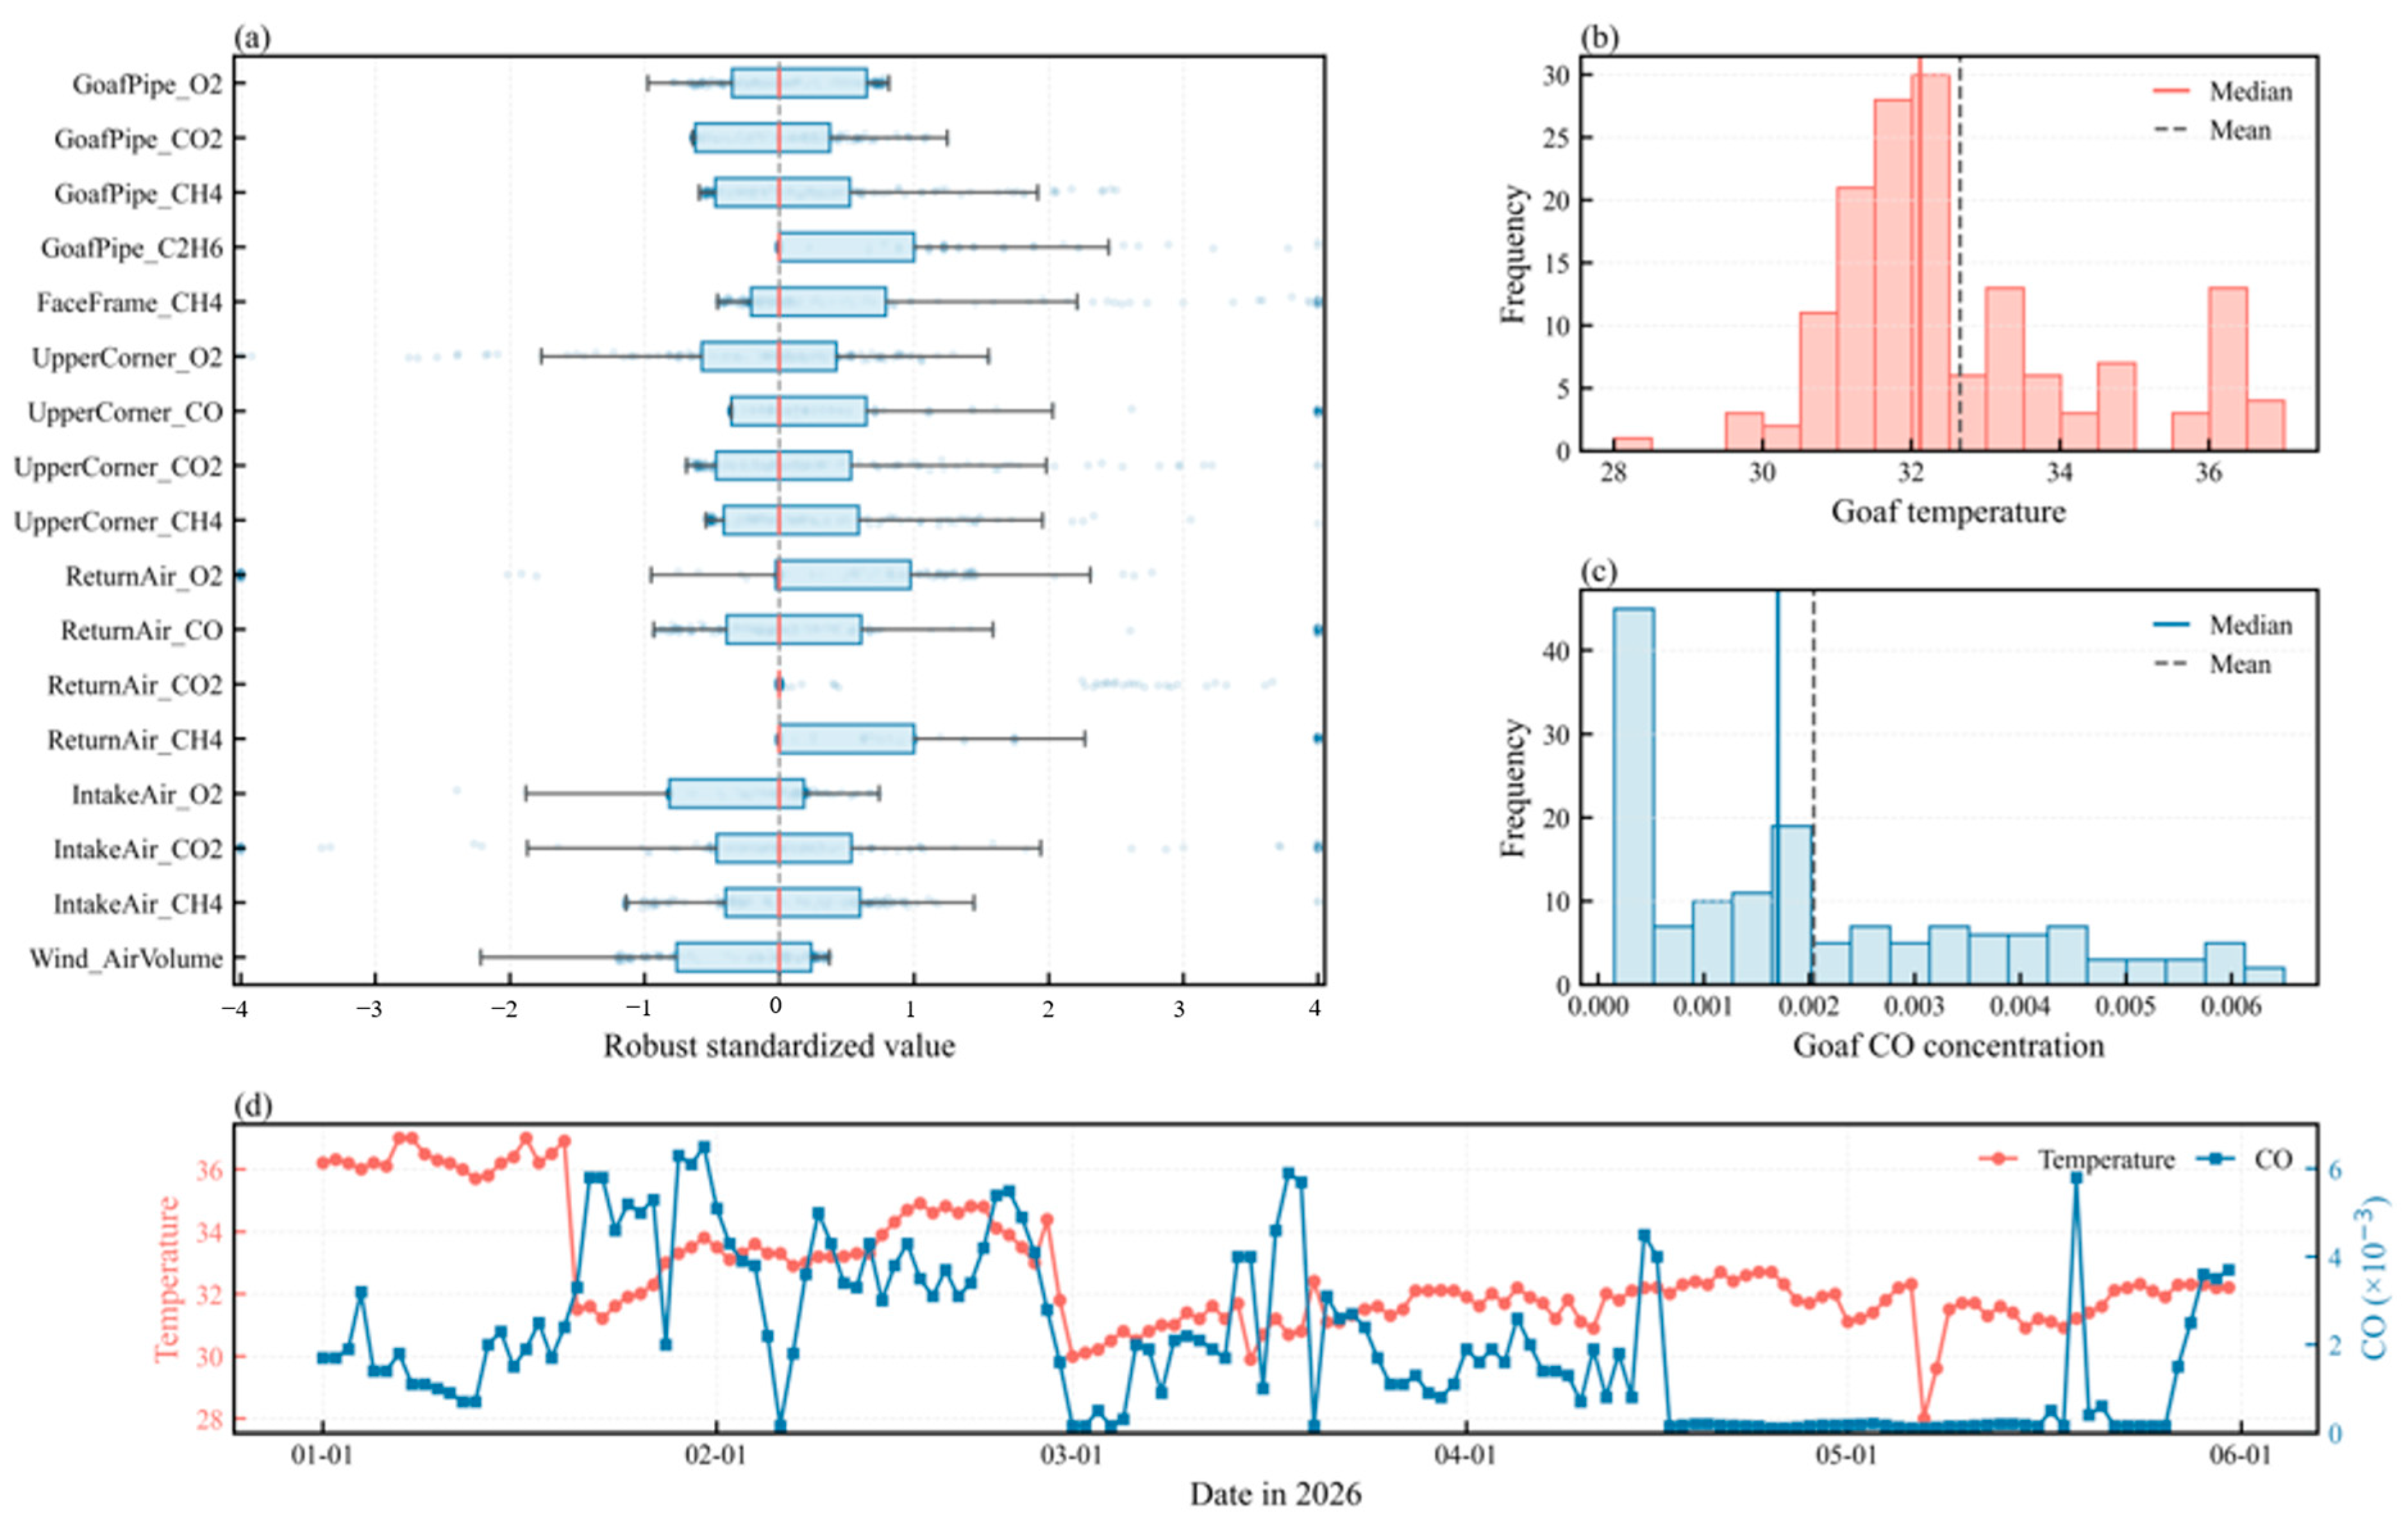
3. Data Sources and Preprocessing
4. Experimental Results and Analysis
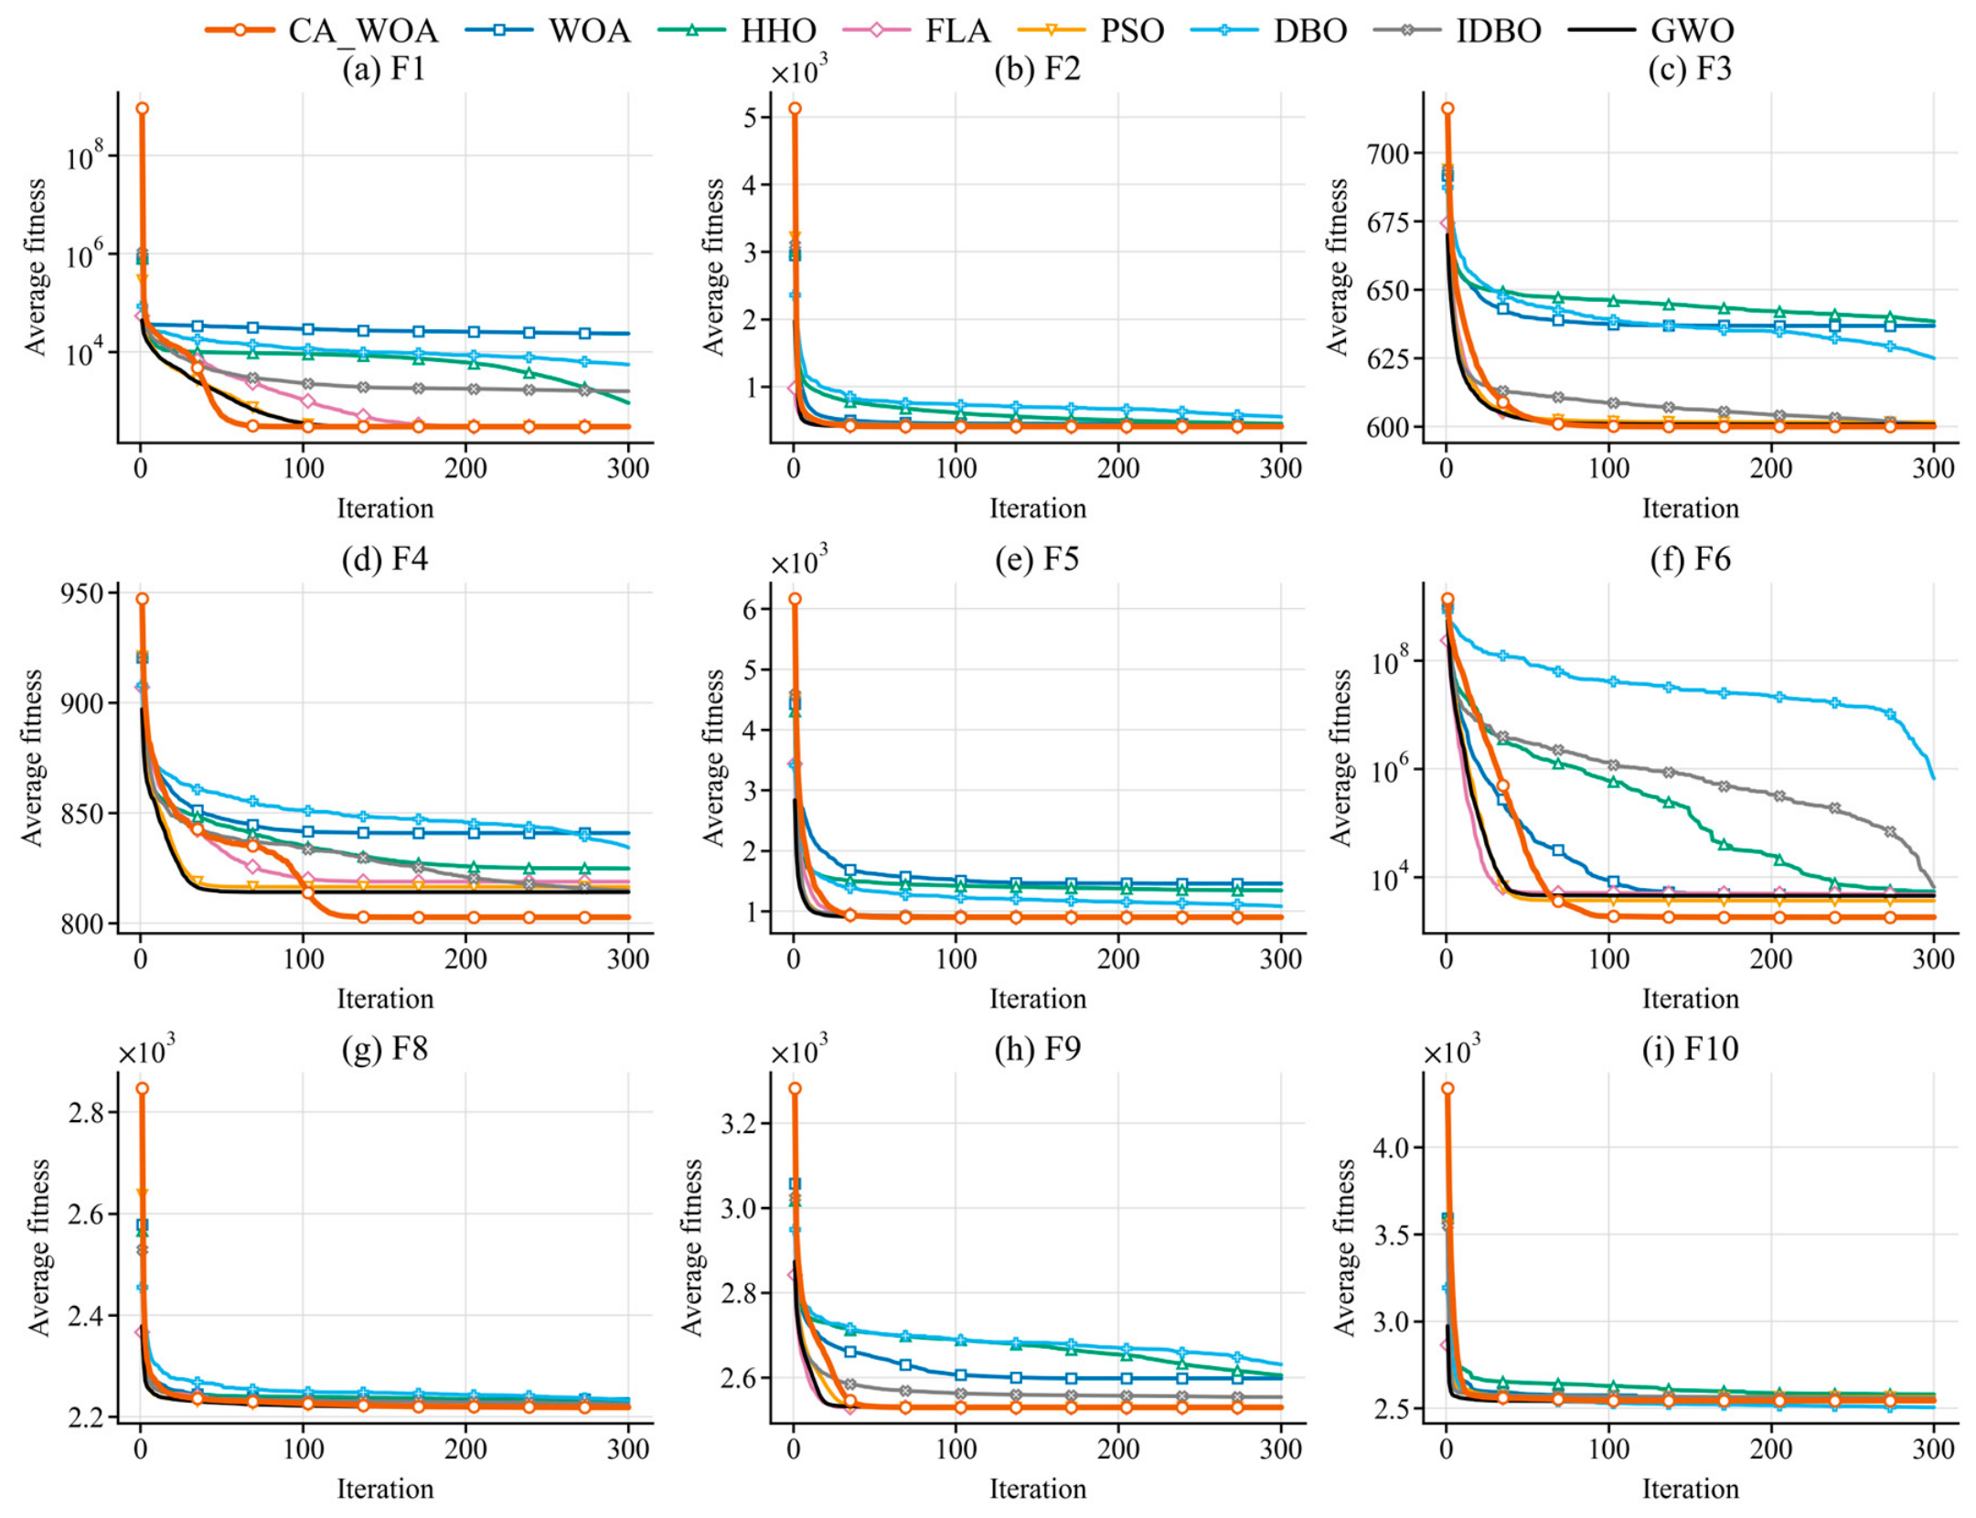
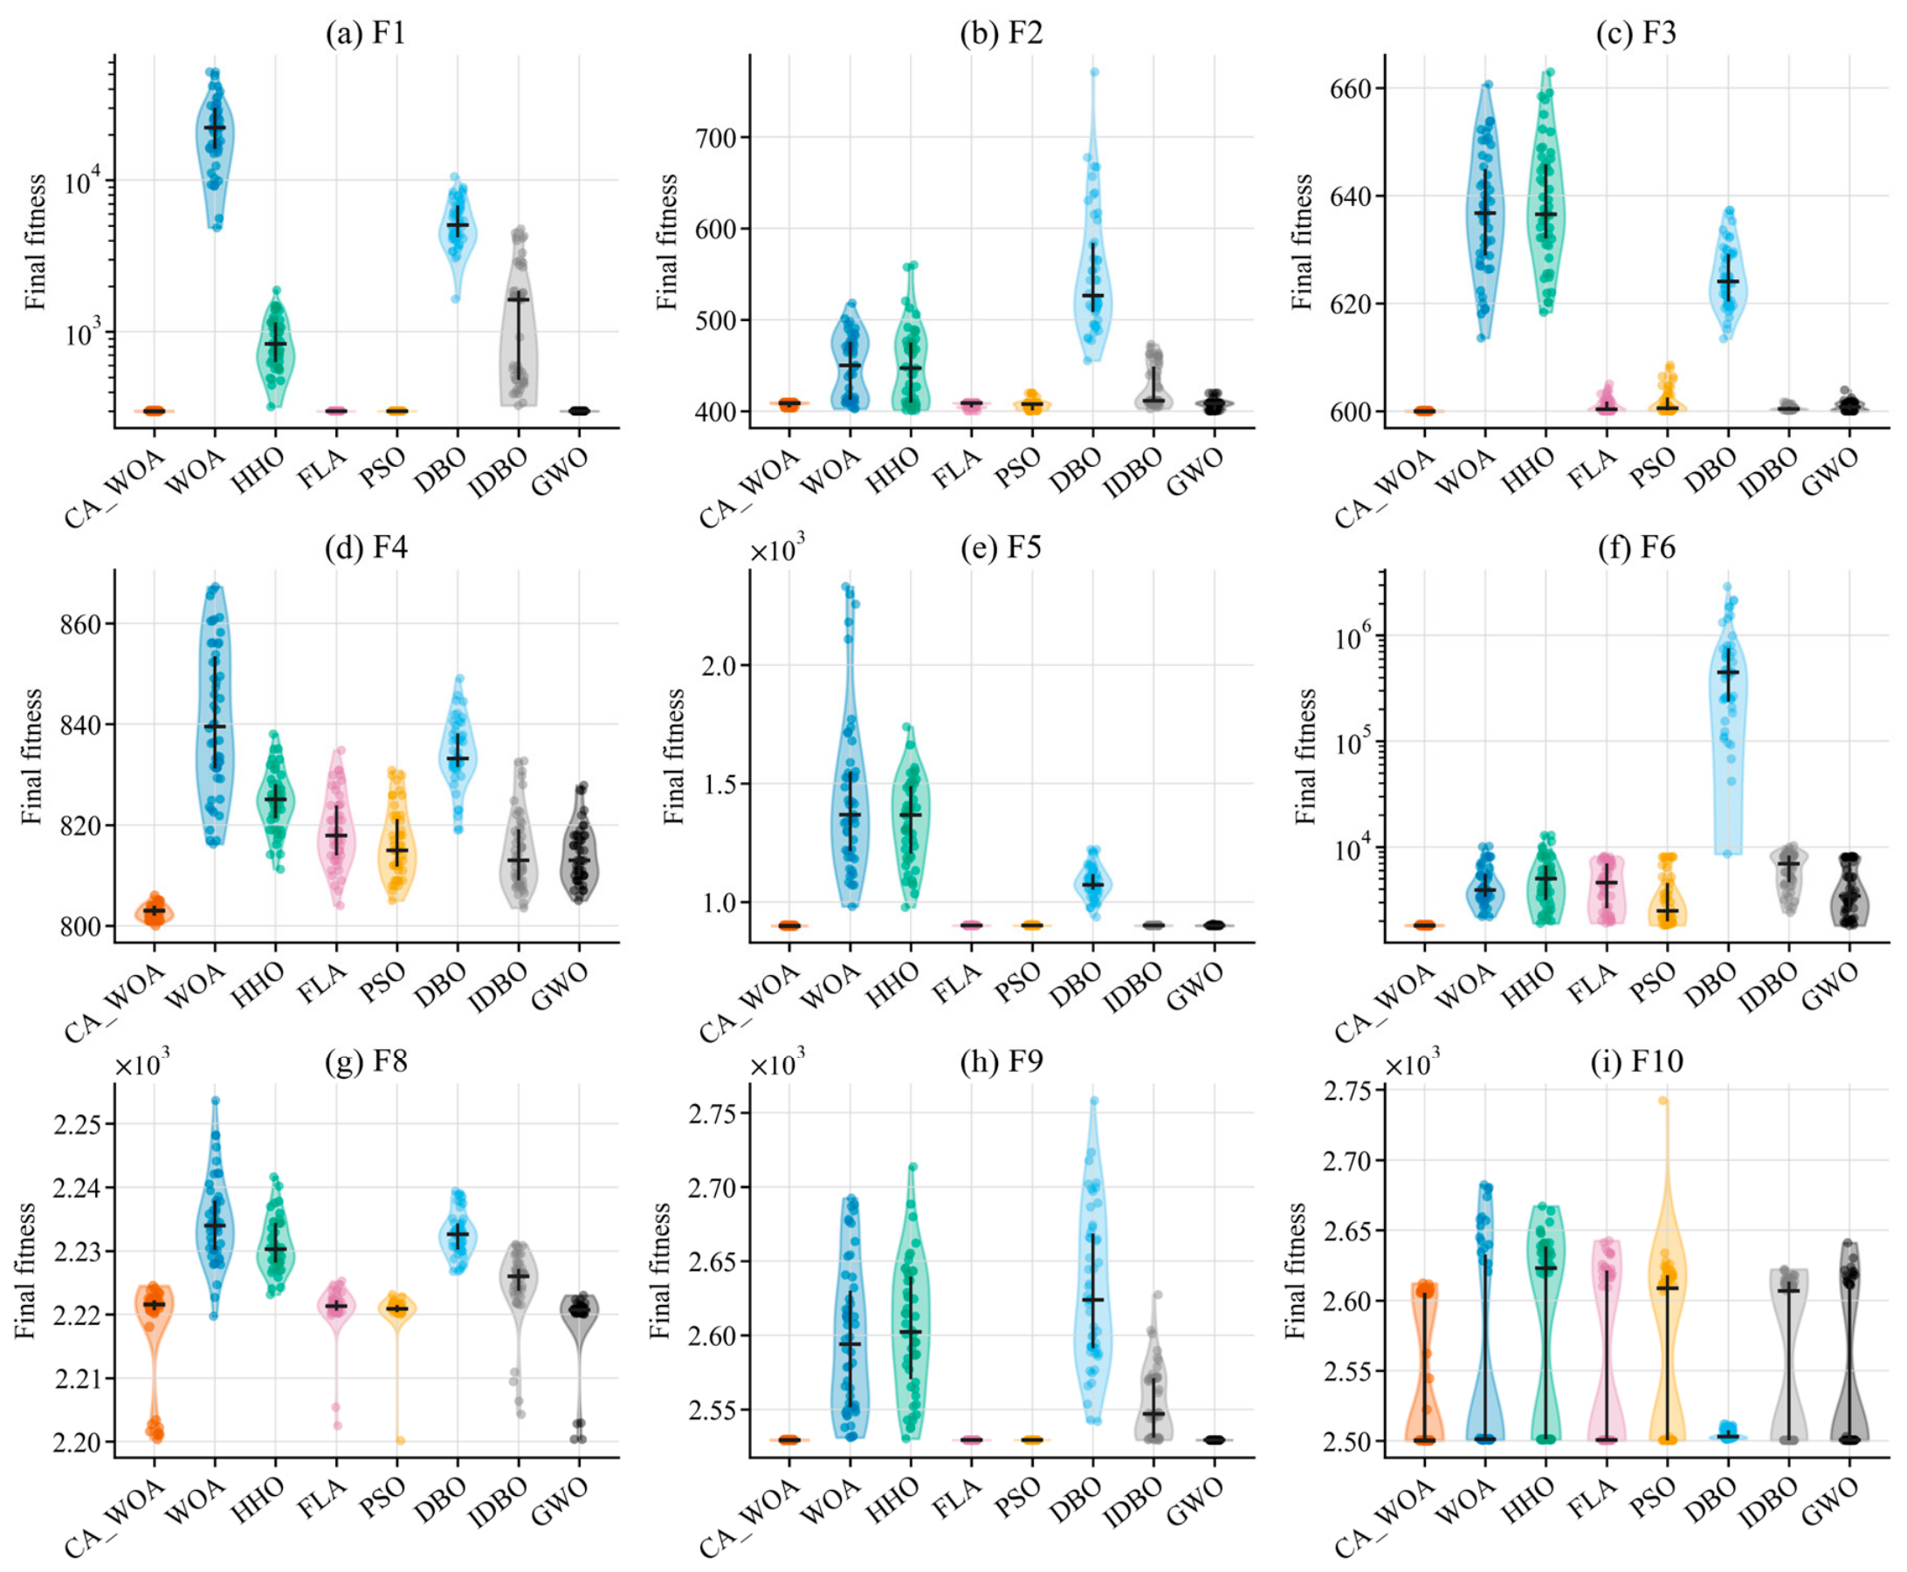
4.1. Benchmark Test of CA-WOA
4.2. Correlation and Feature Selection
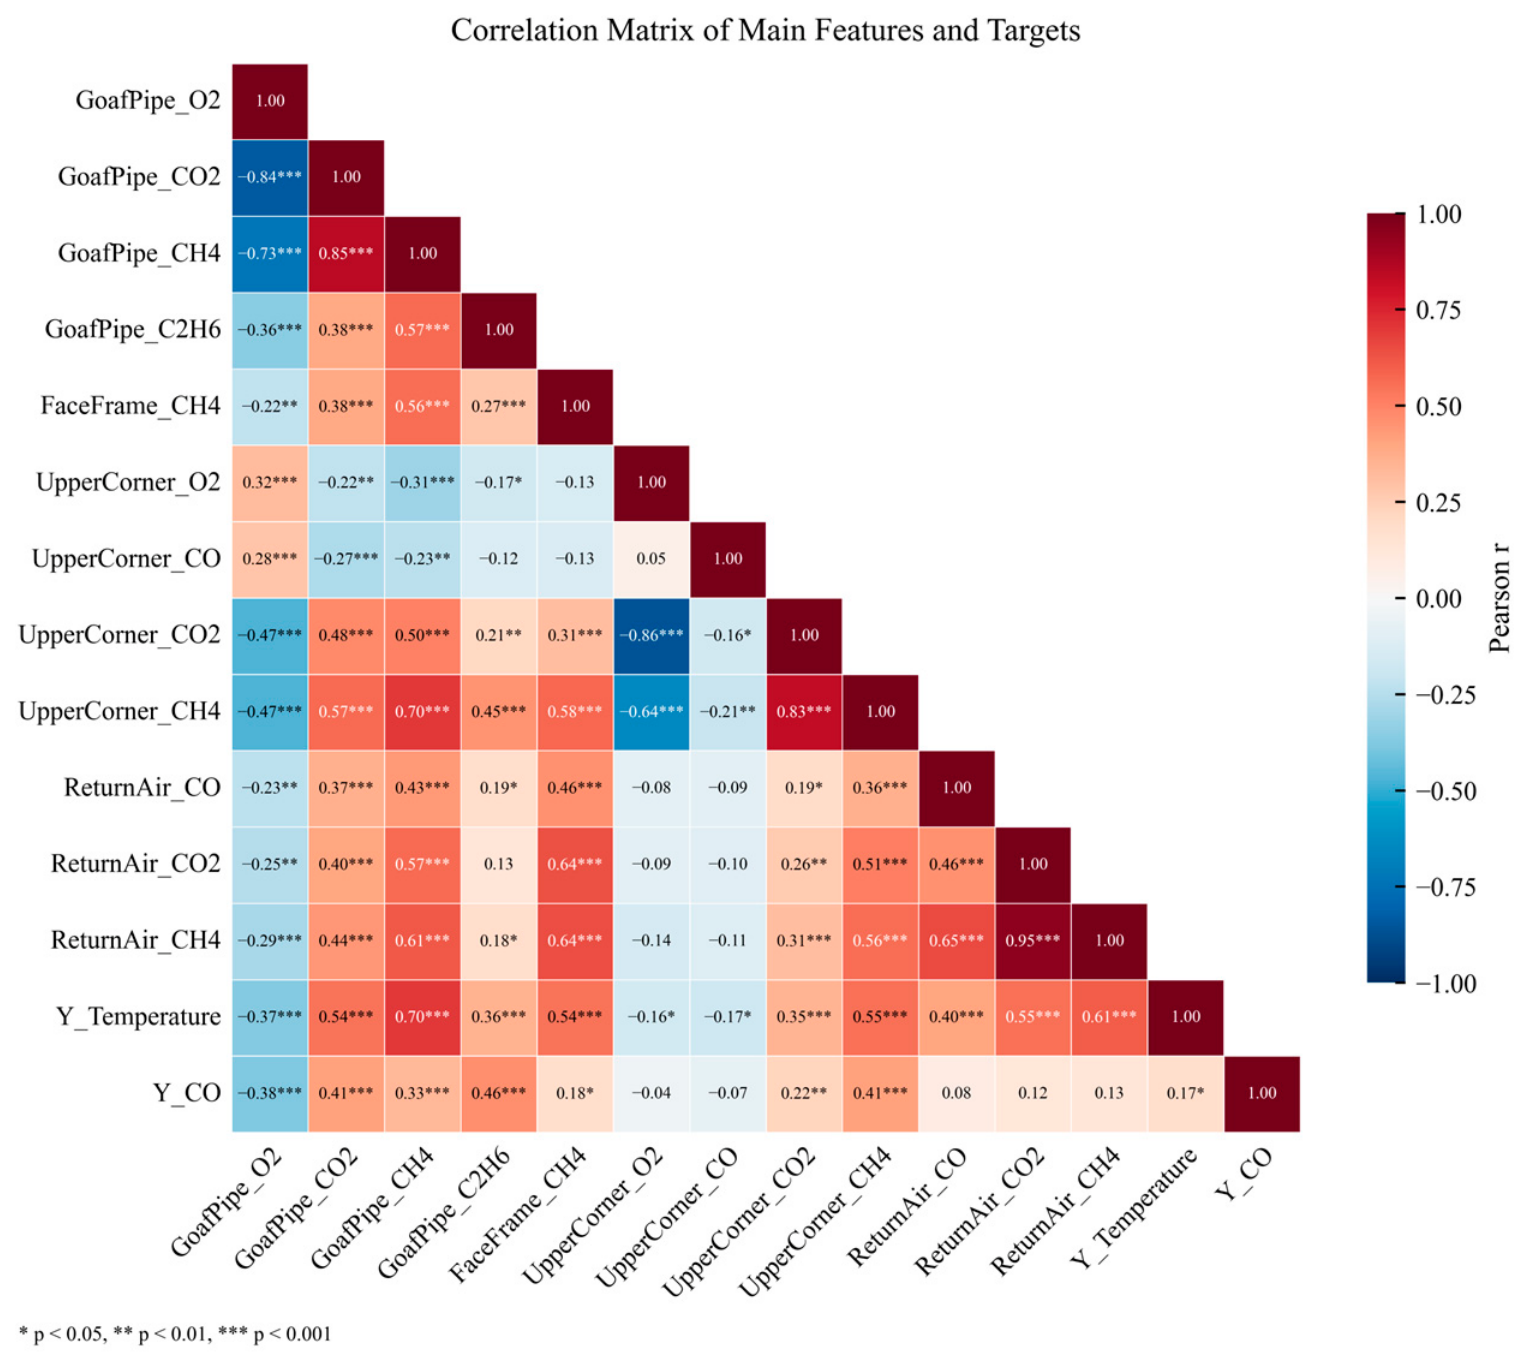
4.2.1. Feature Correlation Analysis
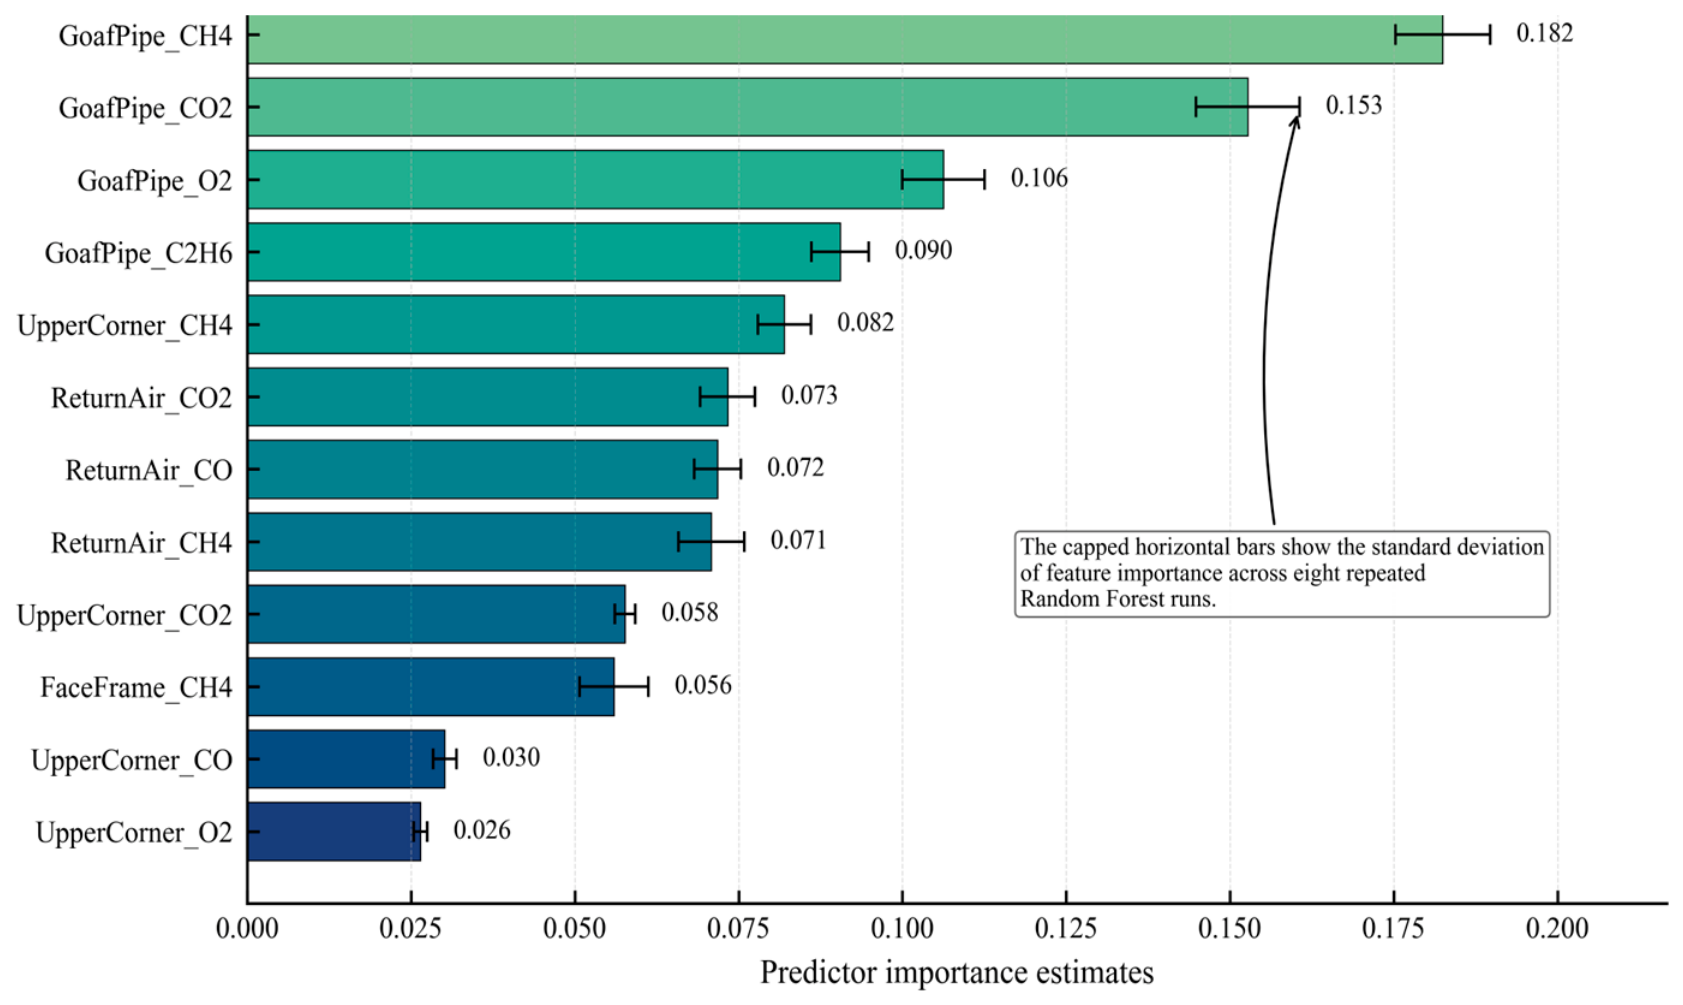
4.2.2. Feature-Importance Ranking
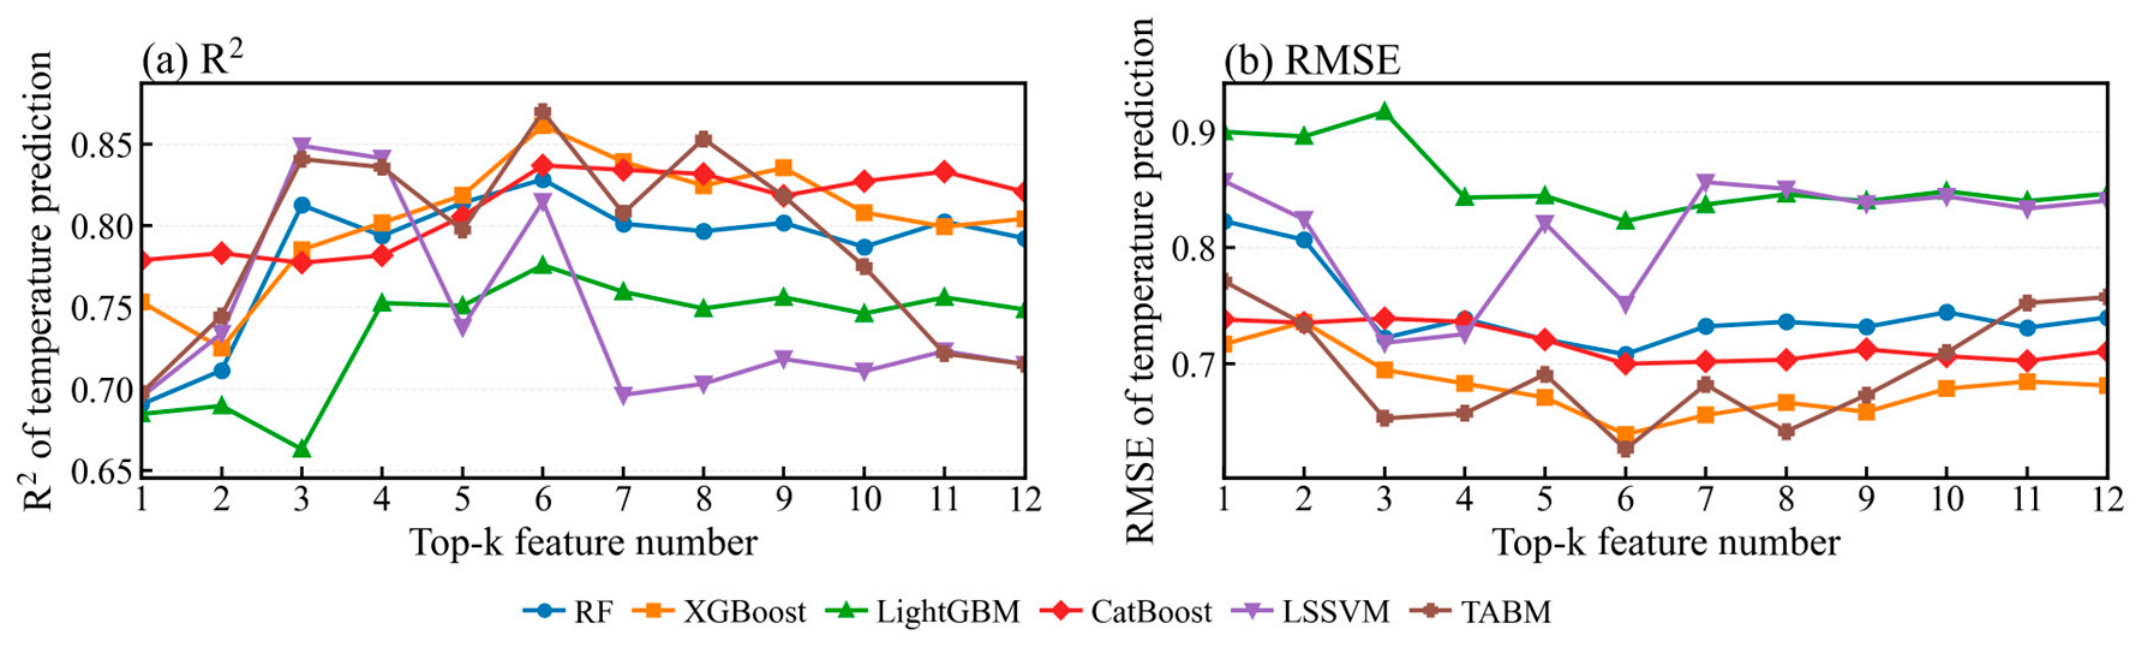
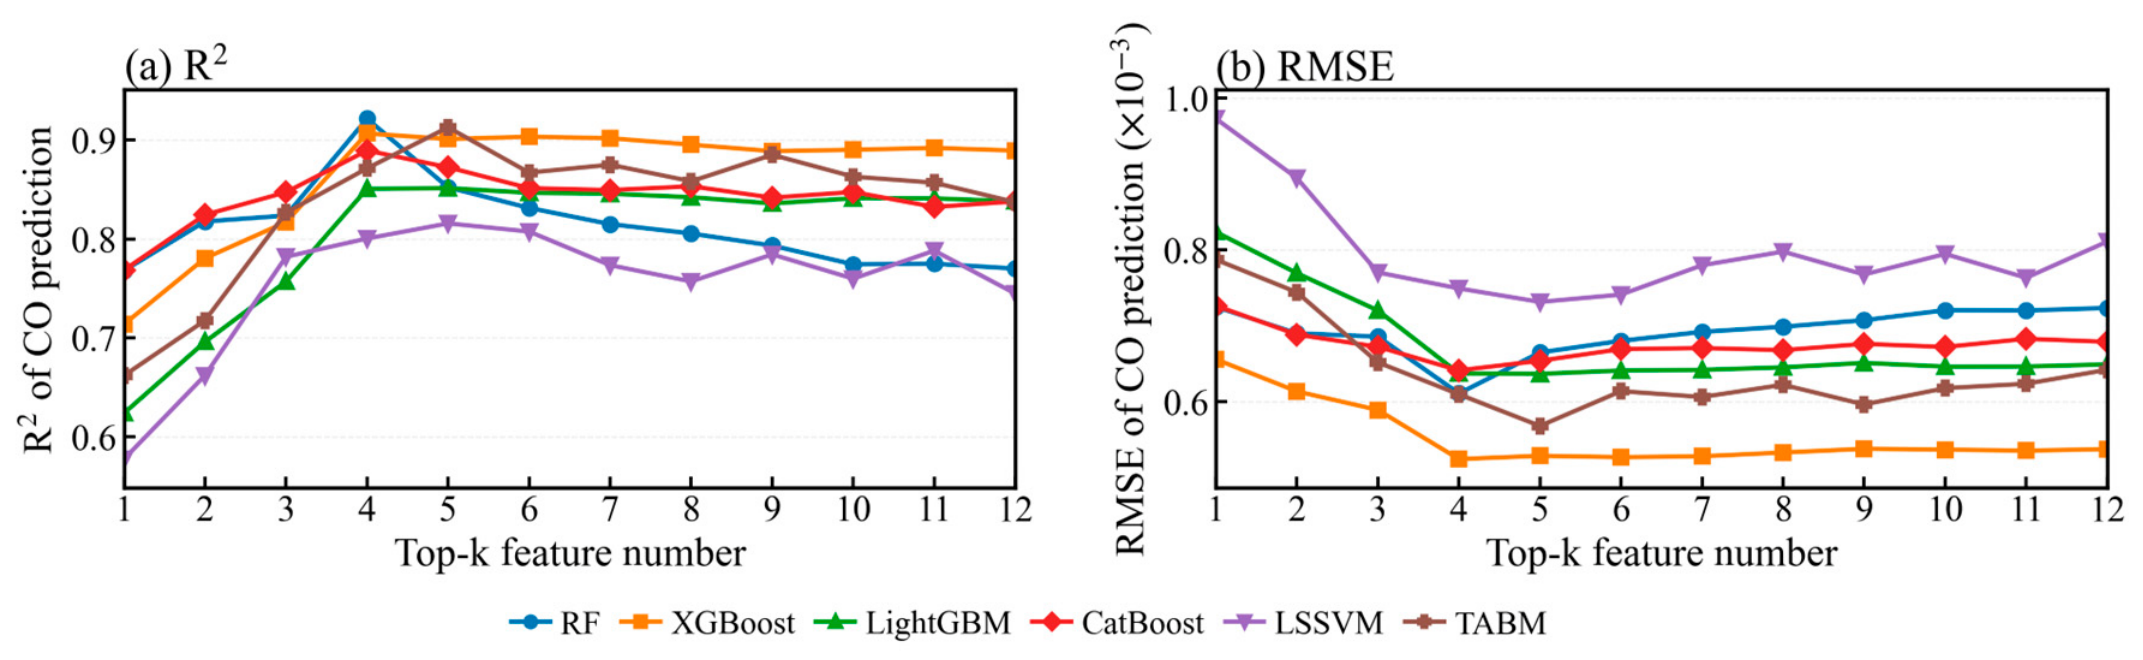
4.2.3. Cross-Model Validation of Top- Feature Subsets
4.3. CA-WOA-Based Model Optimization Analysis
4.3.1. Optimization Settings and Search Space
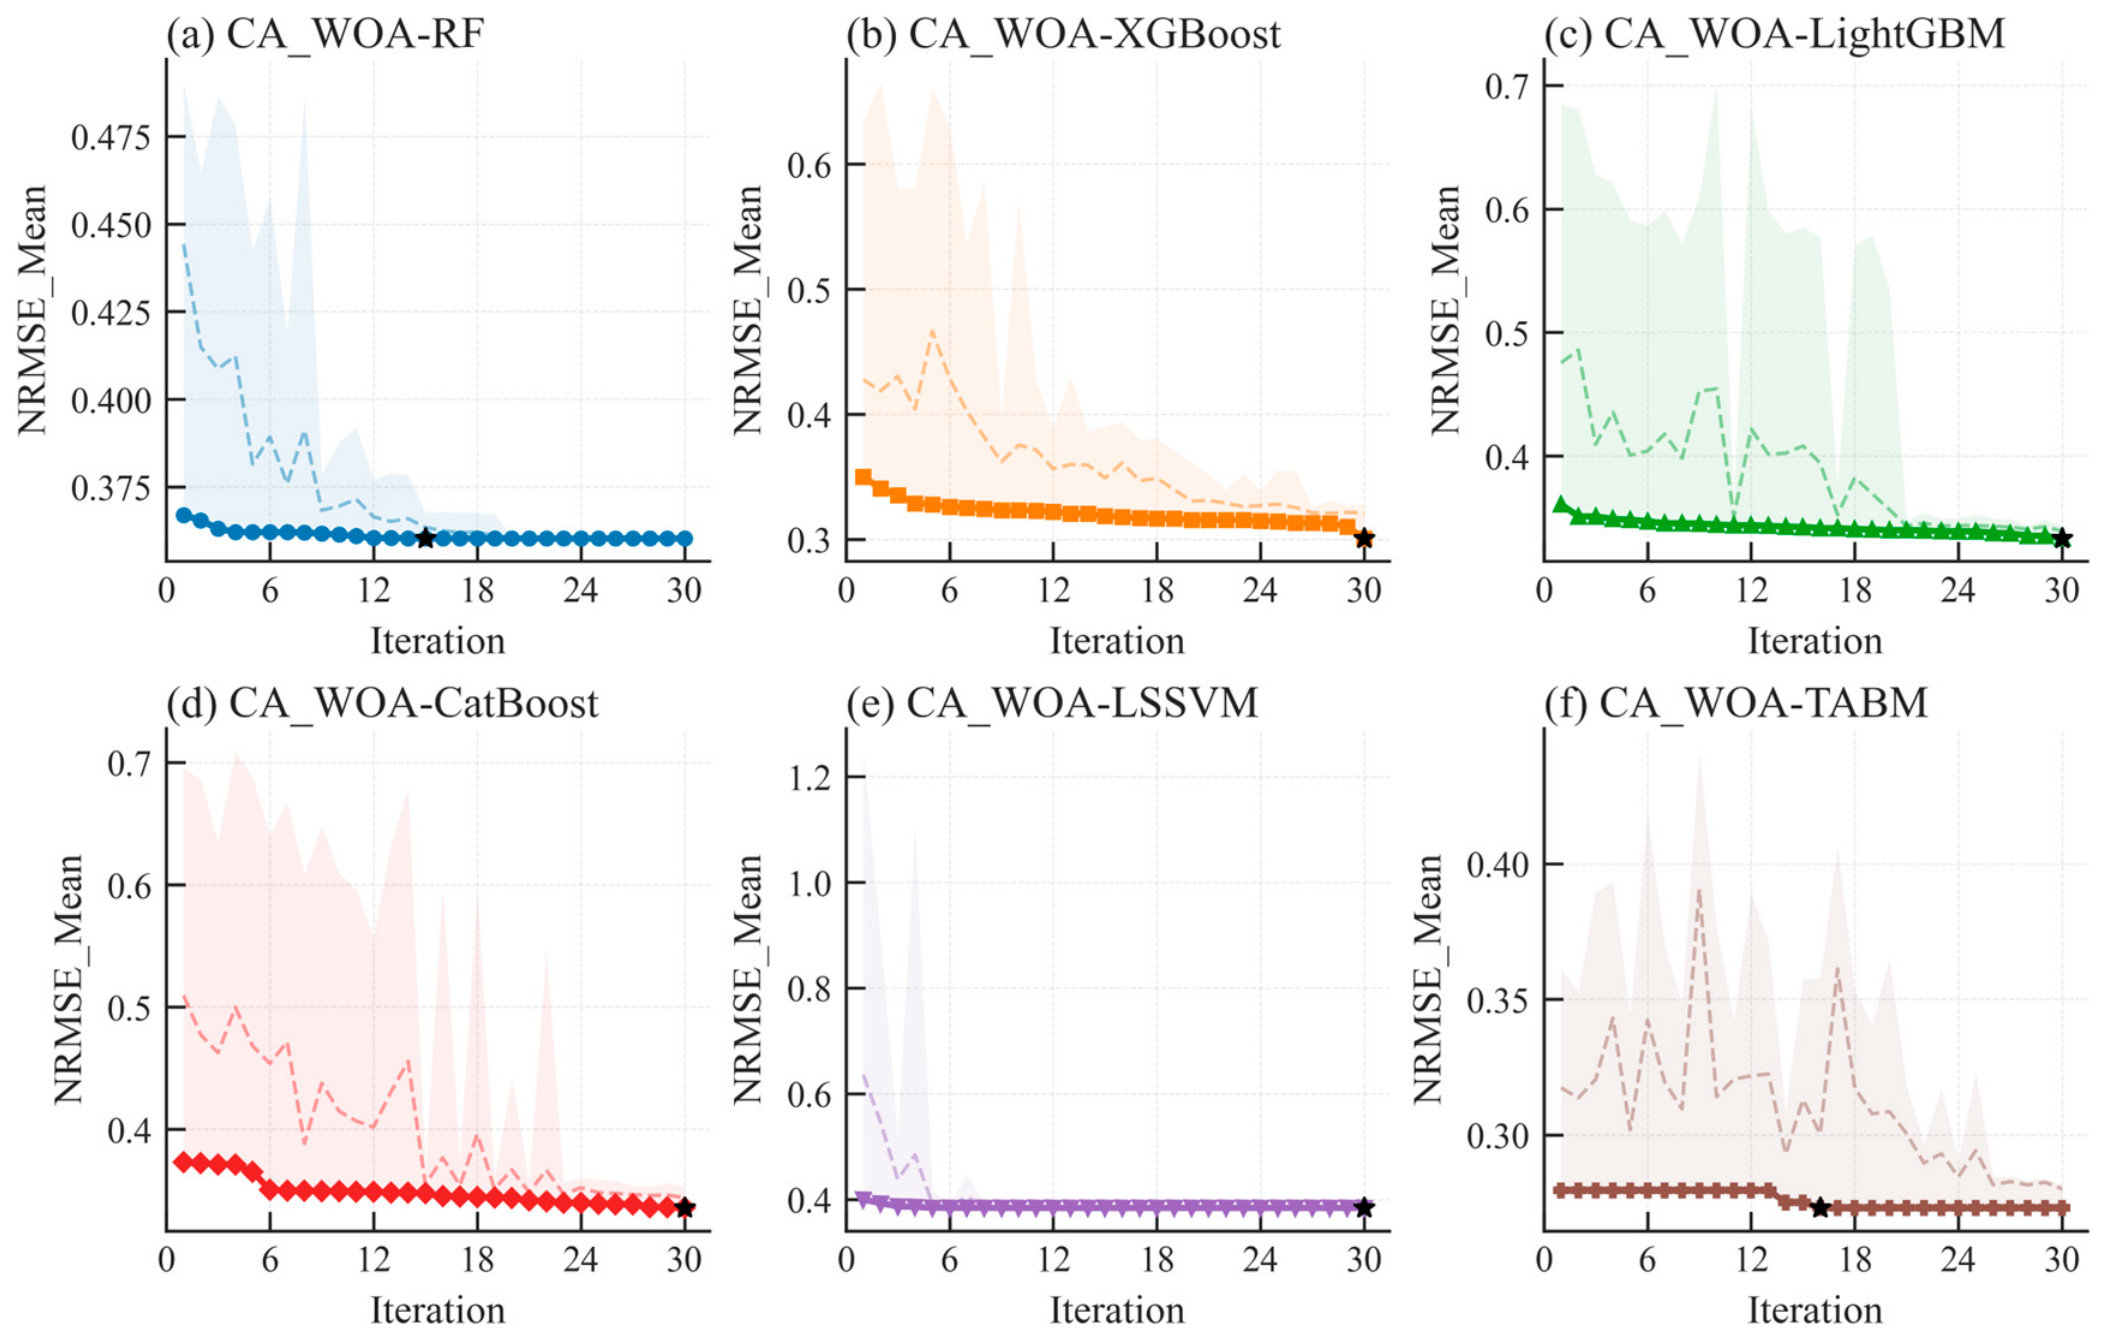
4.3.2. Fitness Convergence Analysis
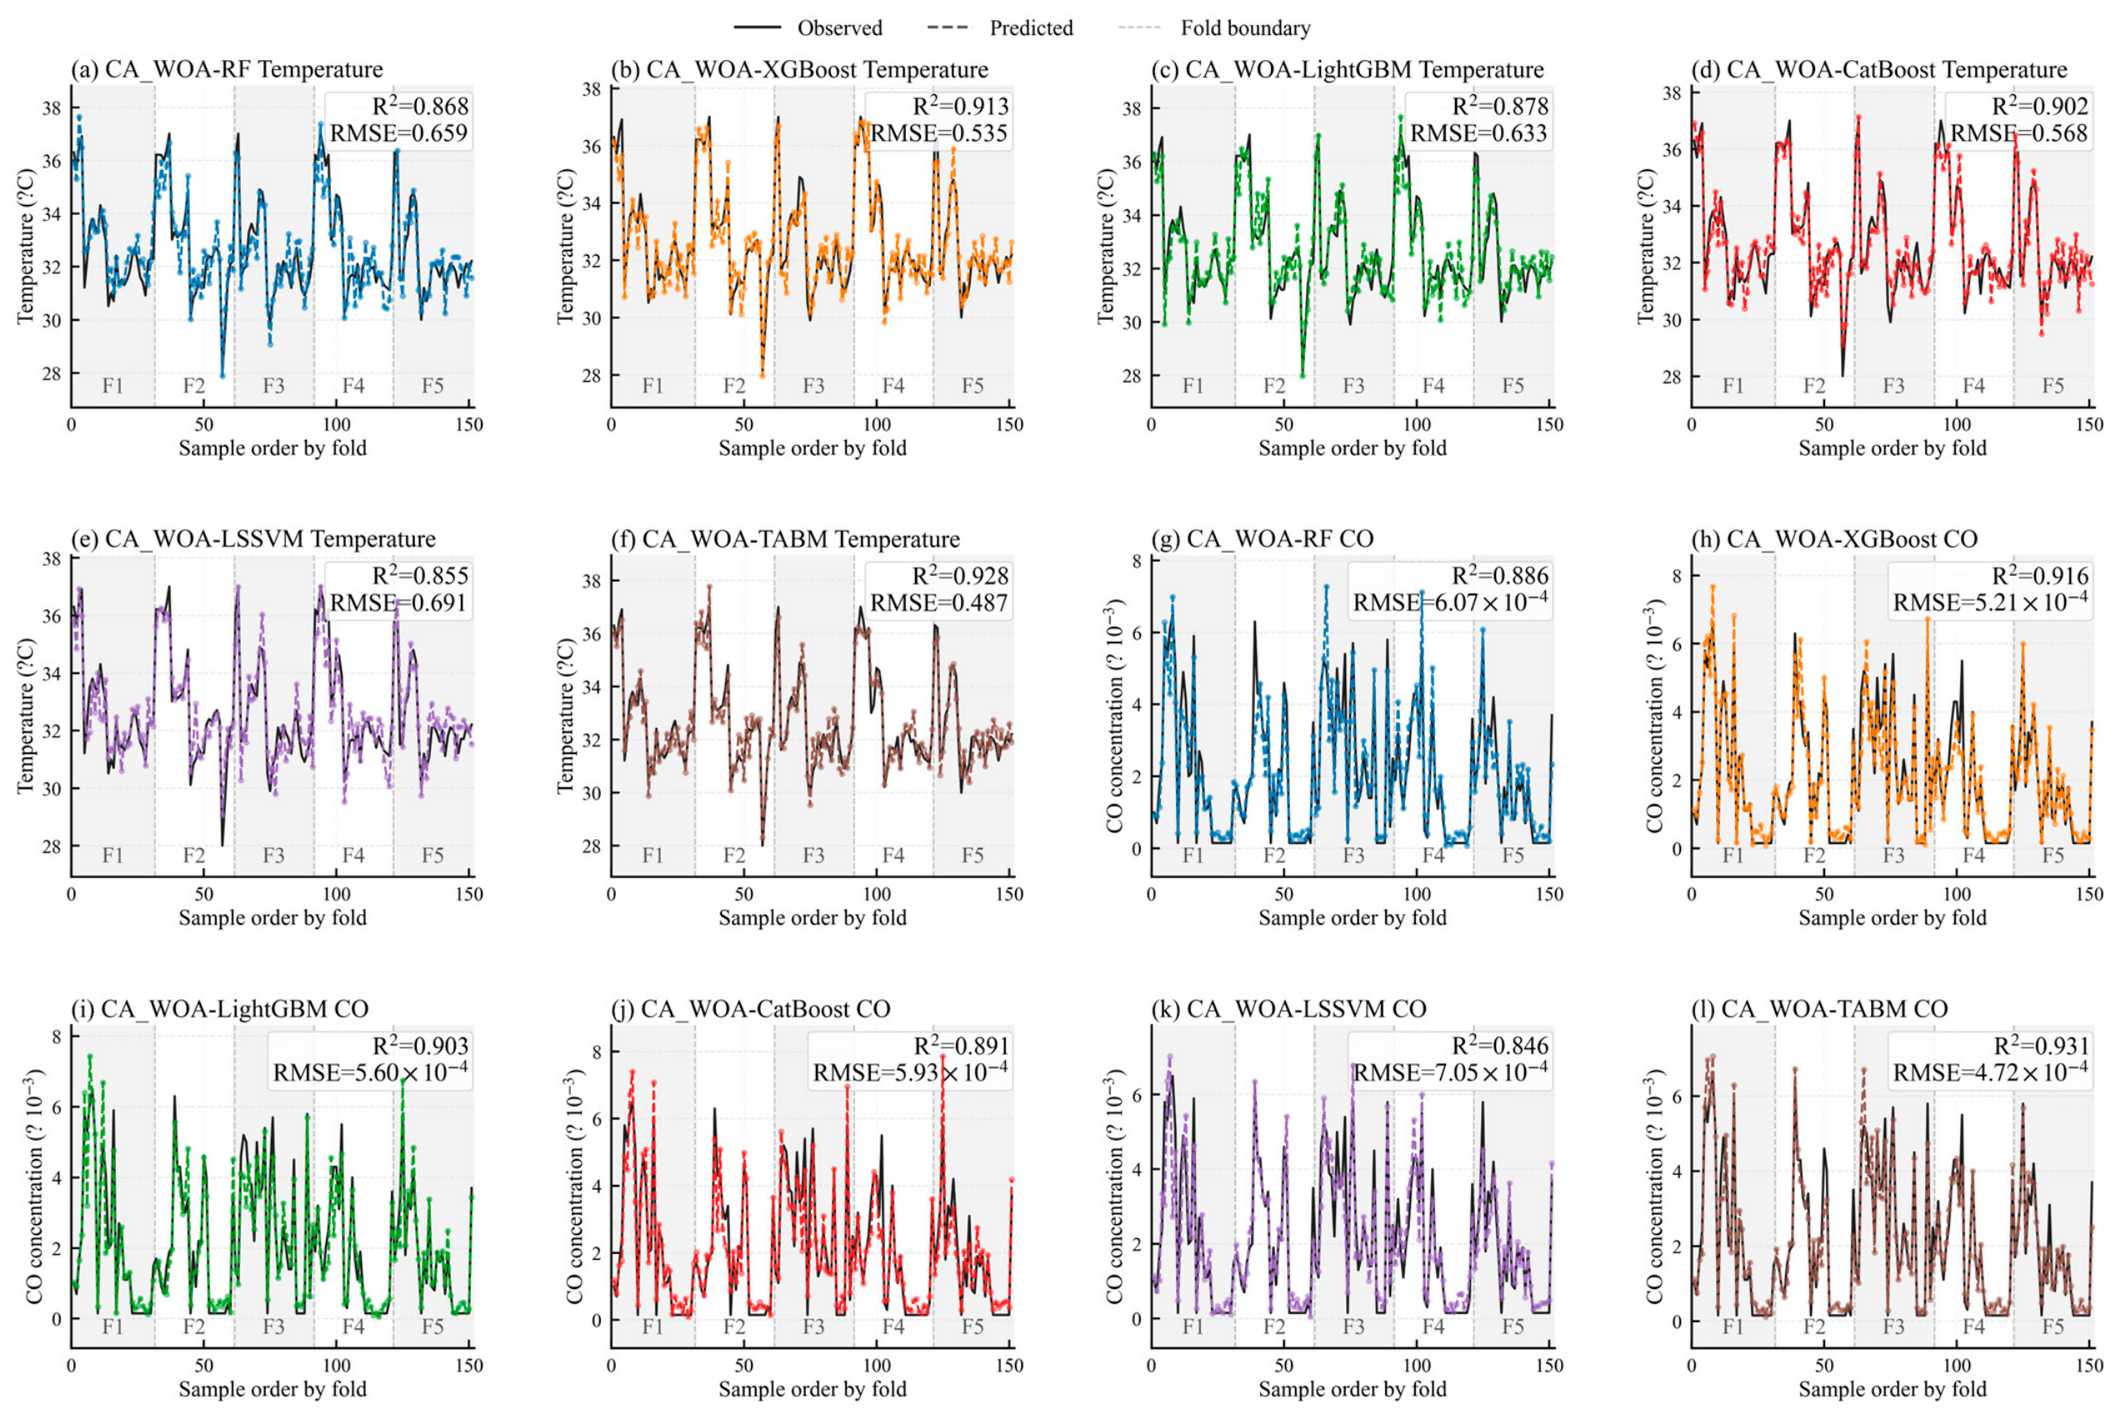
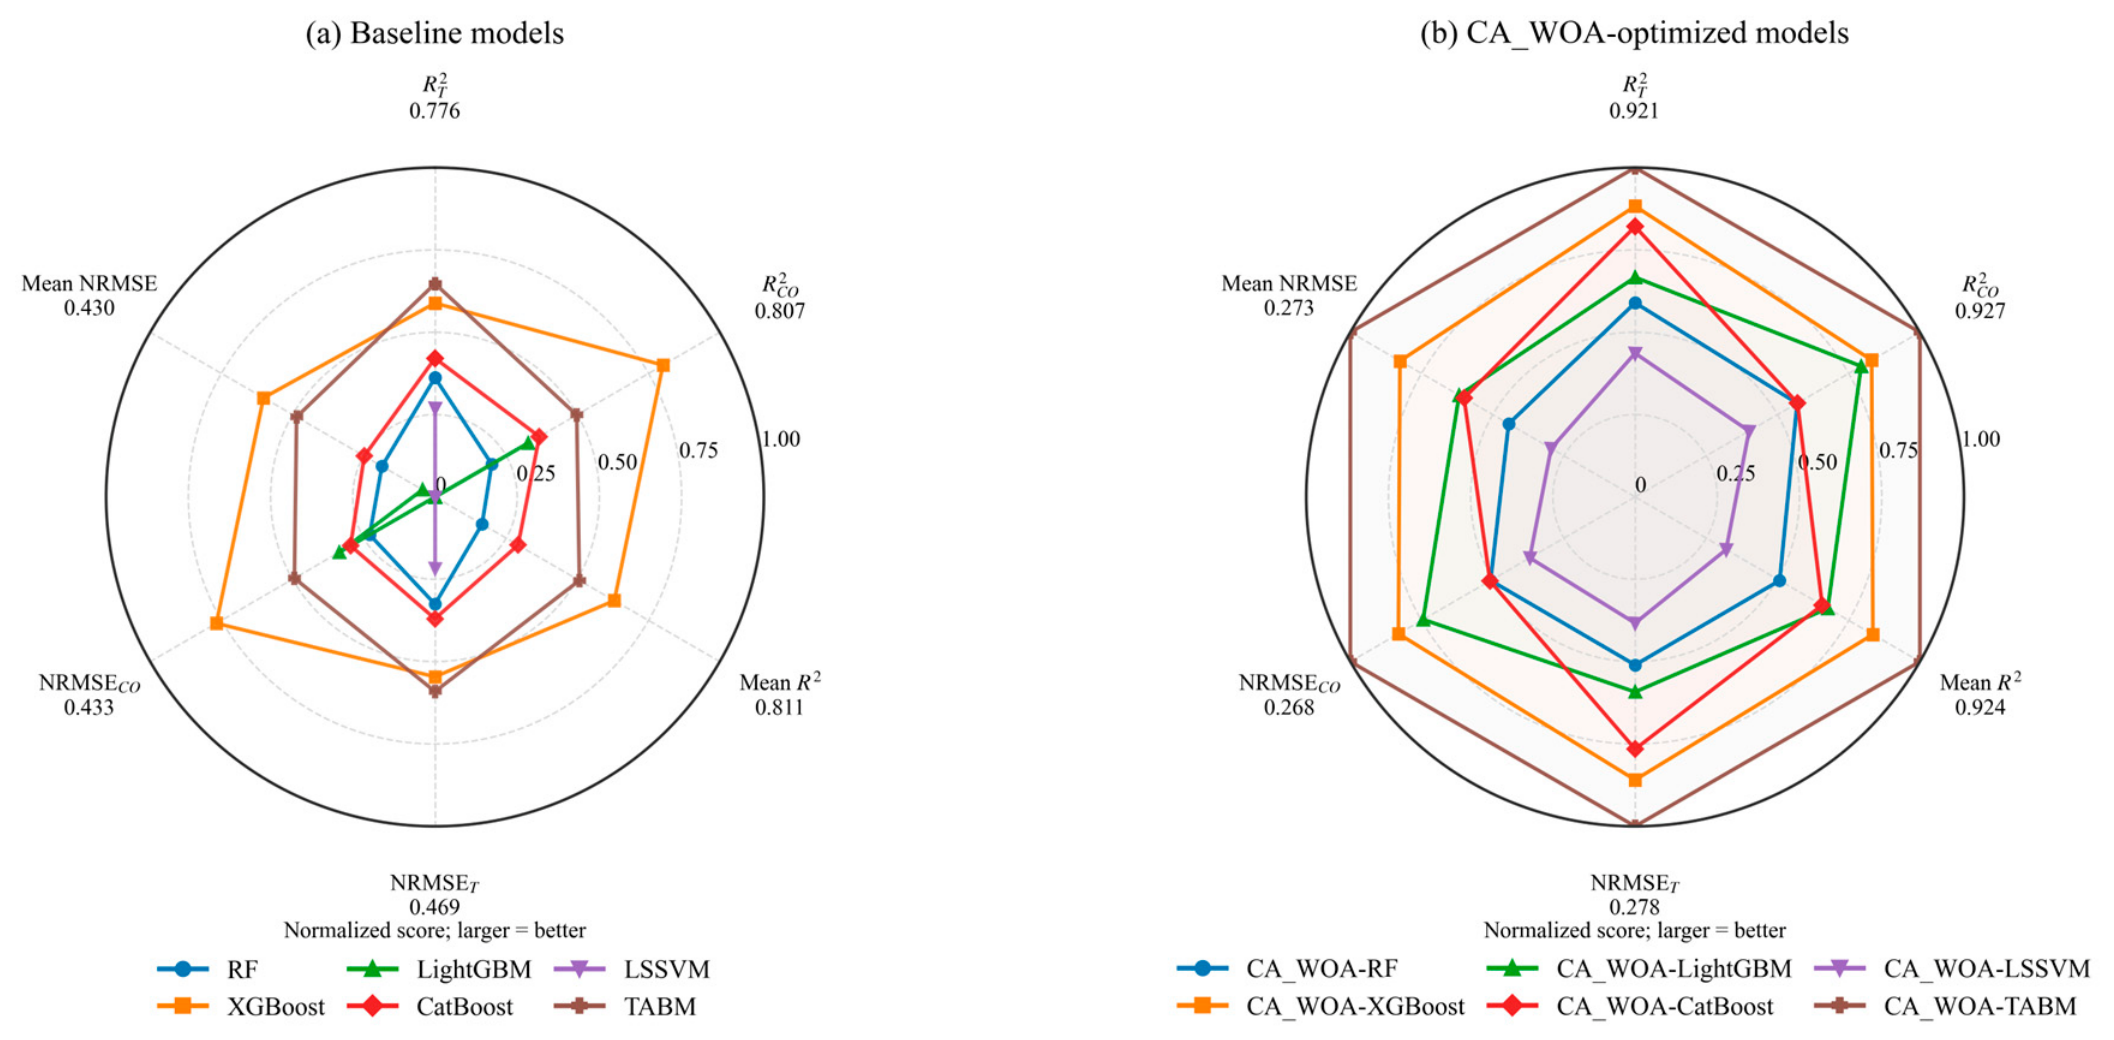
4.3.3. Out-of-Fold Prediction and Model Comparison
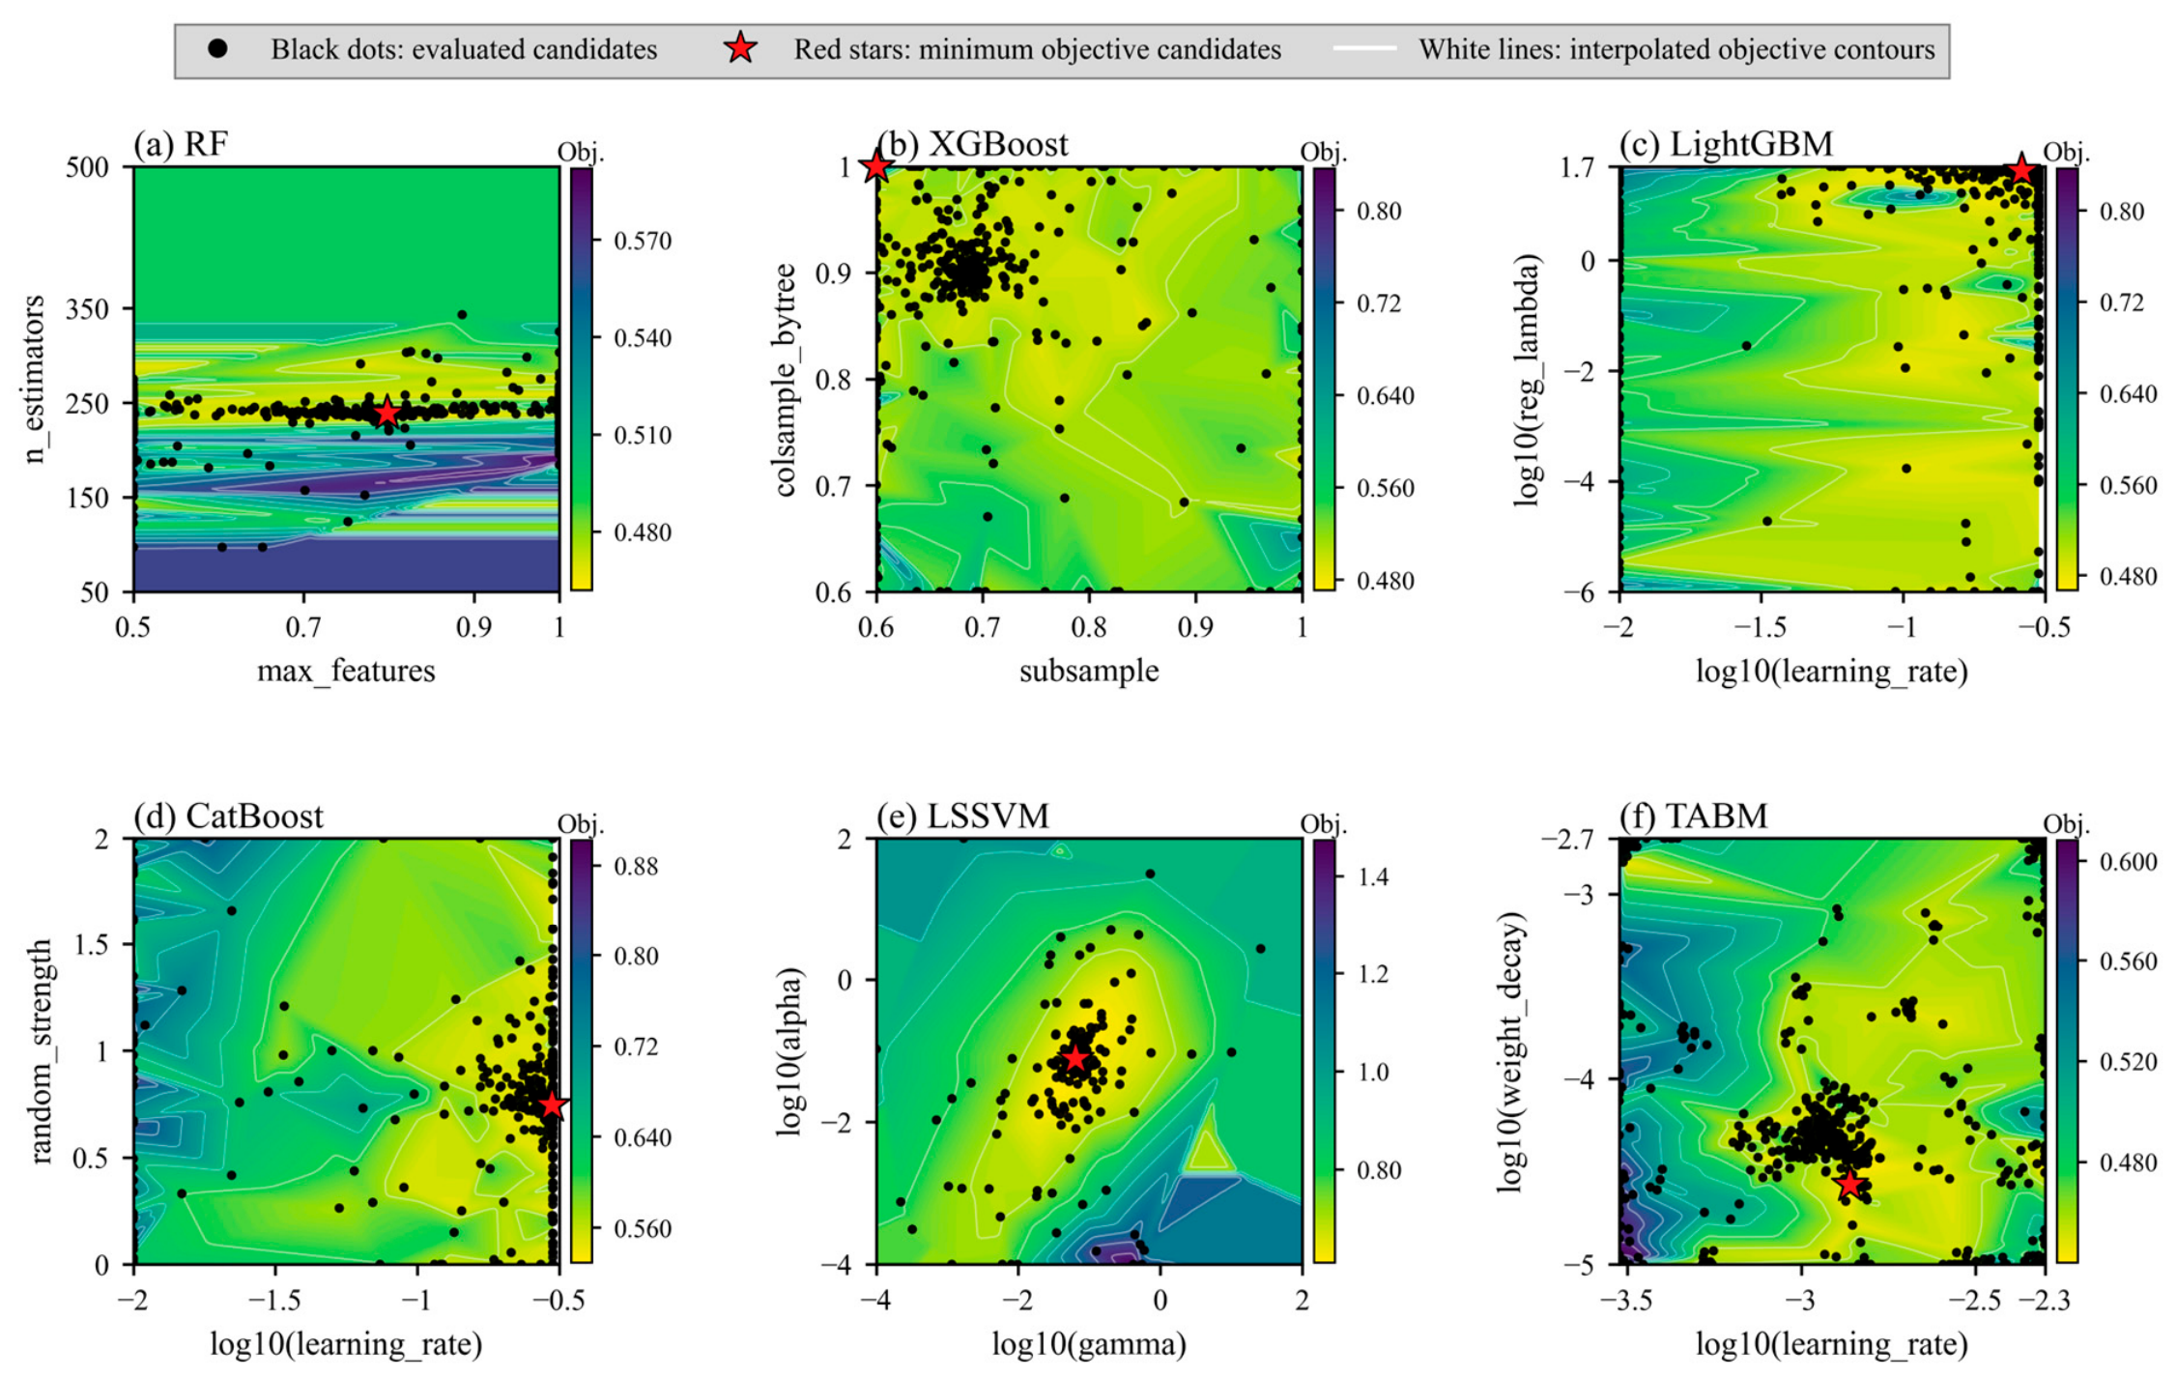
4.3.4. Hyperparameter Response and Sensitivity Analysis
4.4. SHAP/PDP Interpretation Analysis
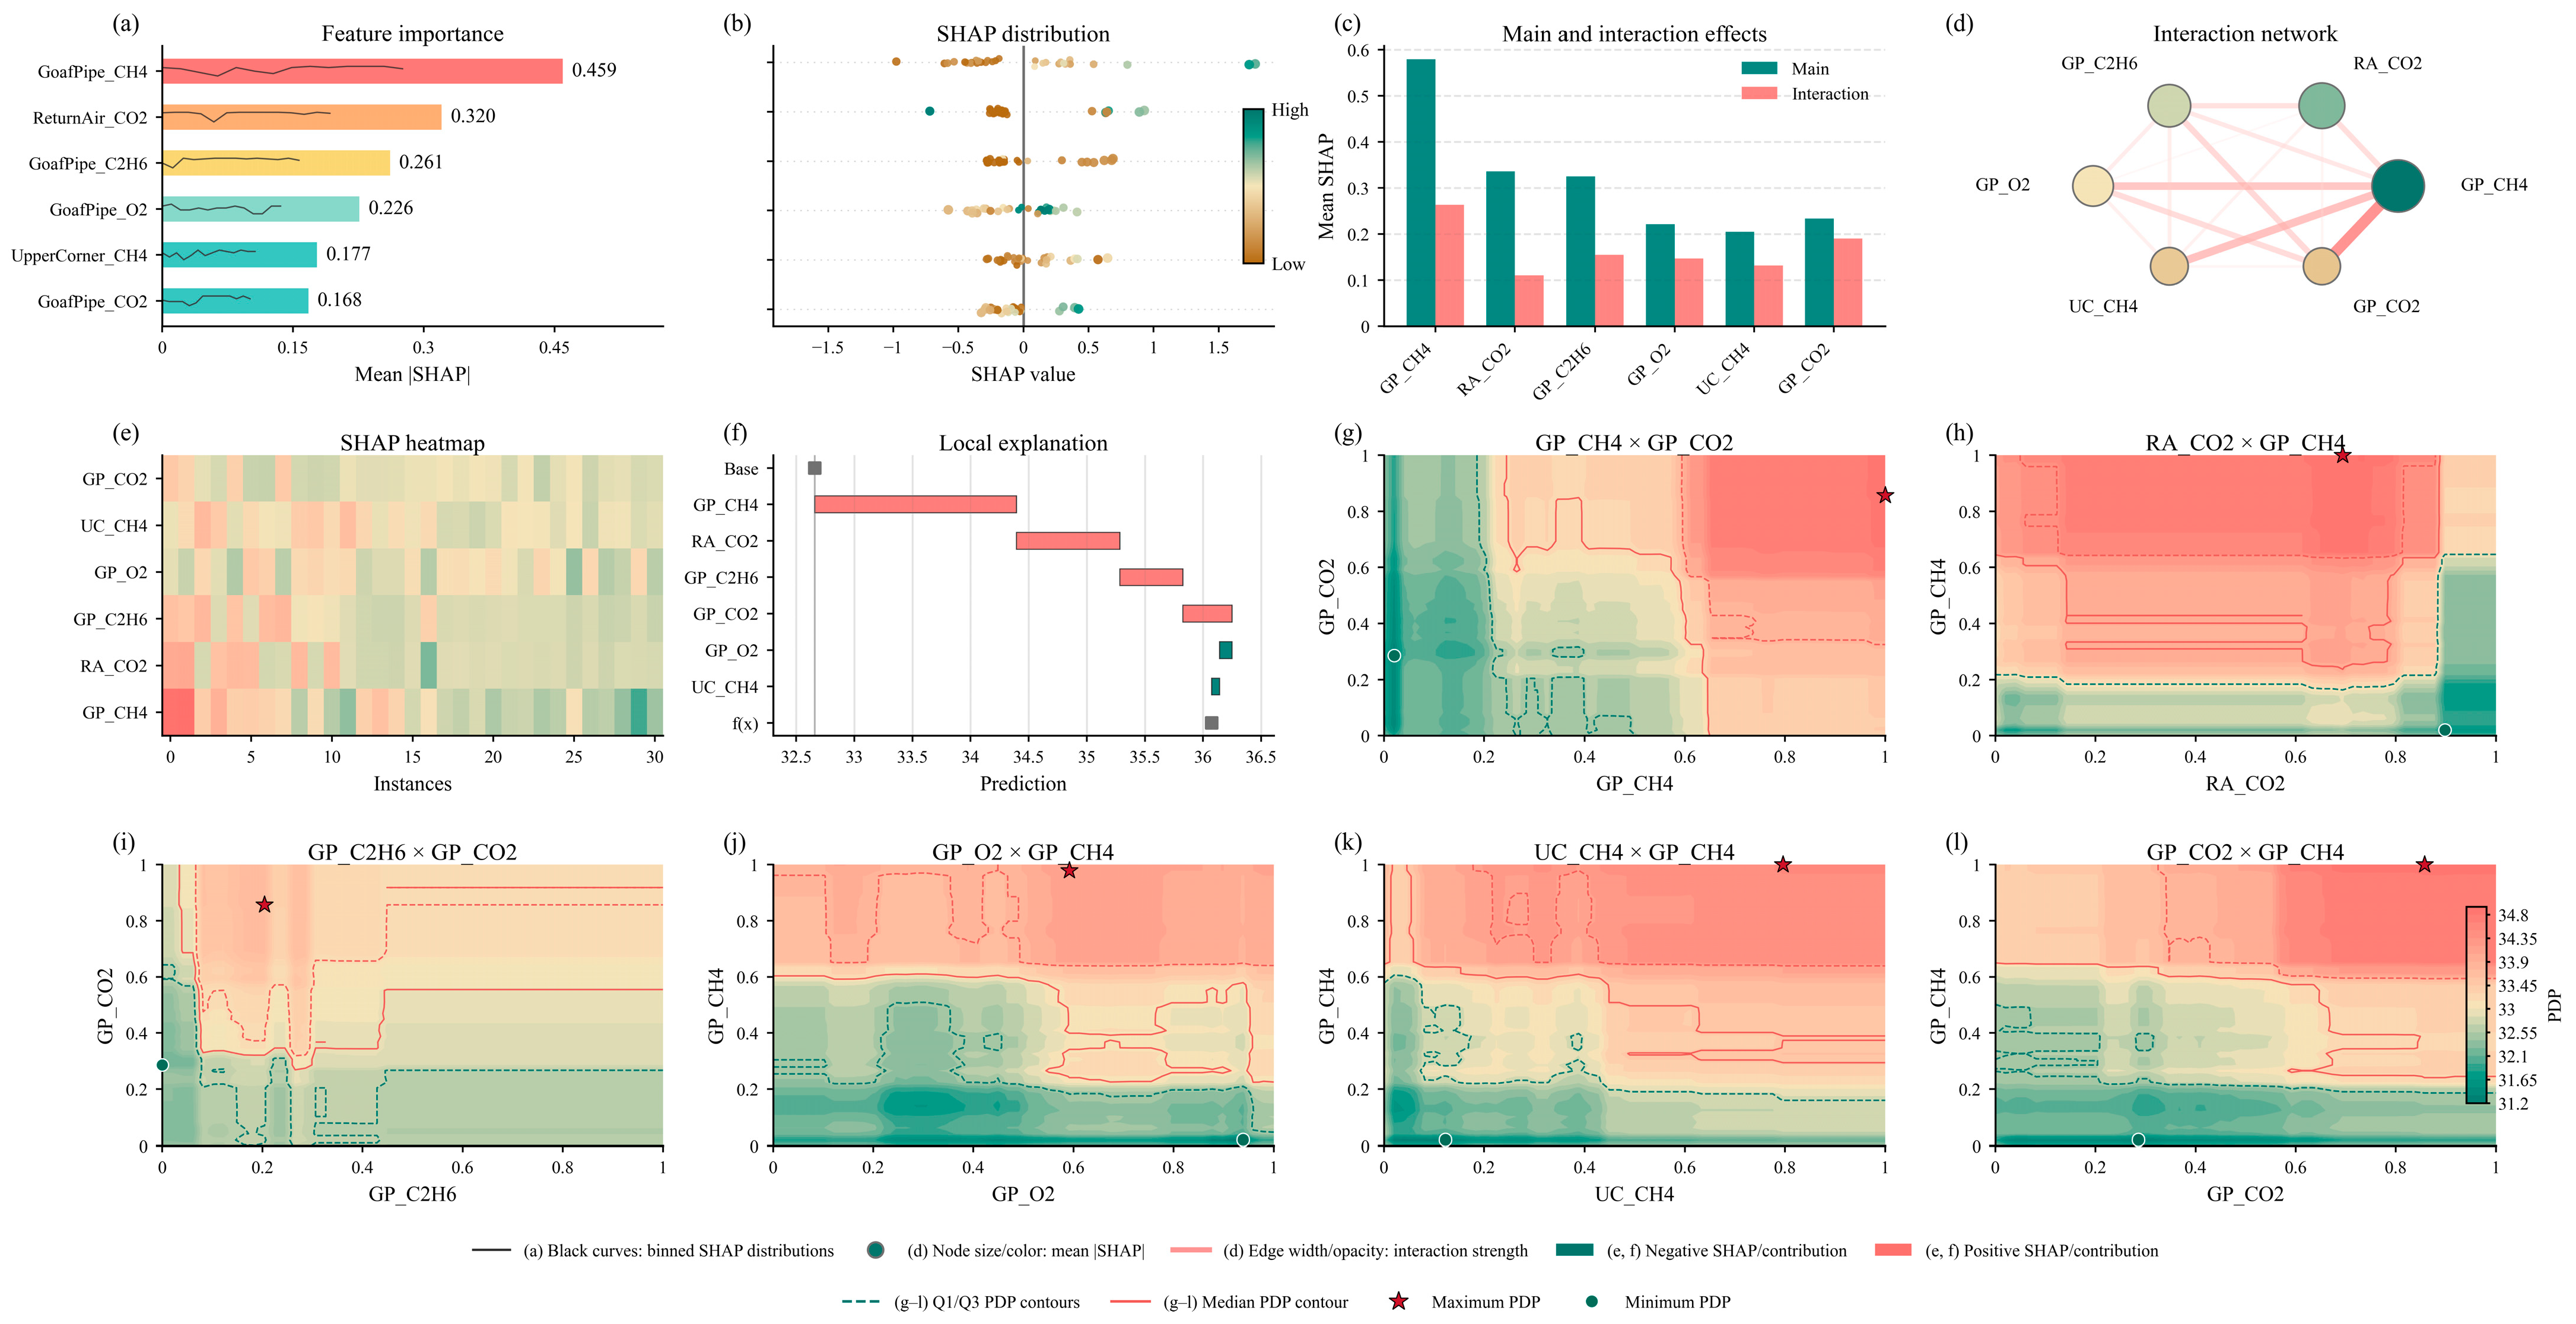
4.4.1. Interpretation of Temperature Prediction
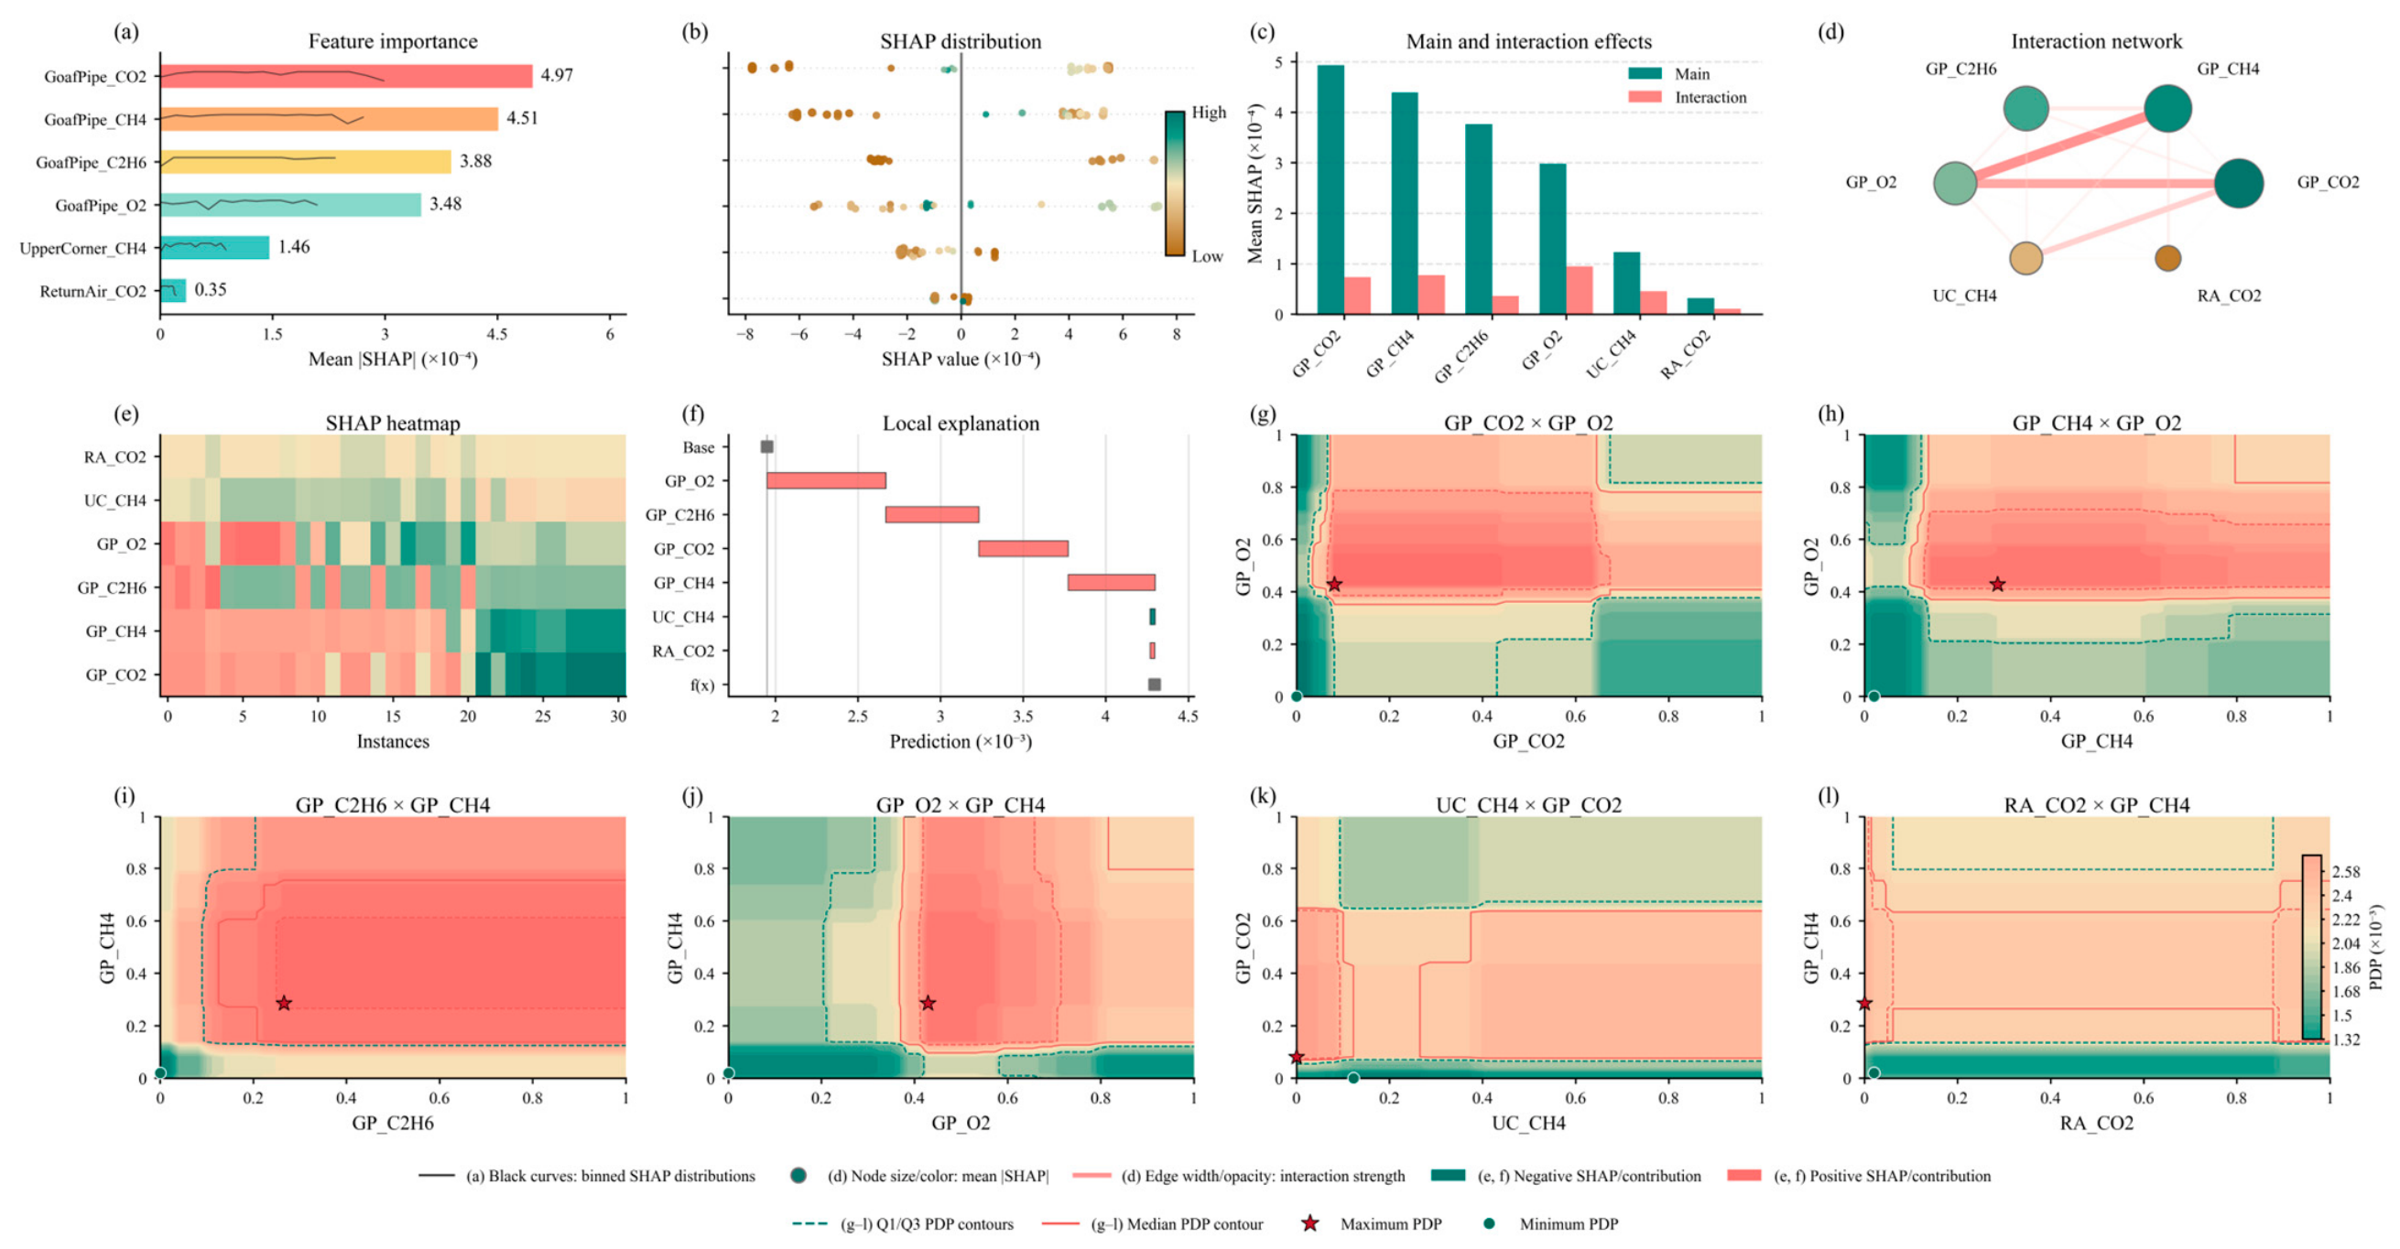
4.4.2. Interpretation of CO Prediction
4.5. Engineering Validation on the 1202 Working Face
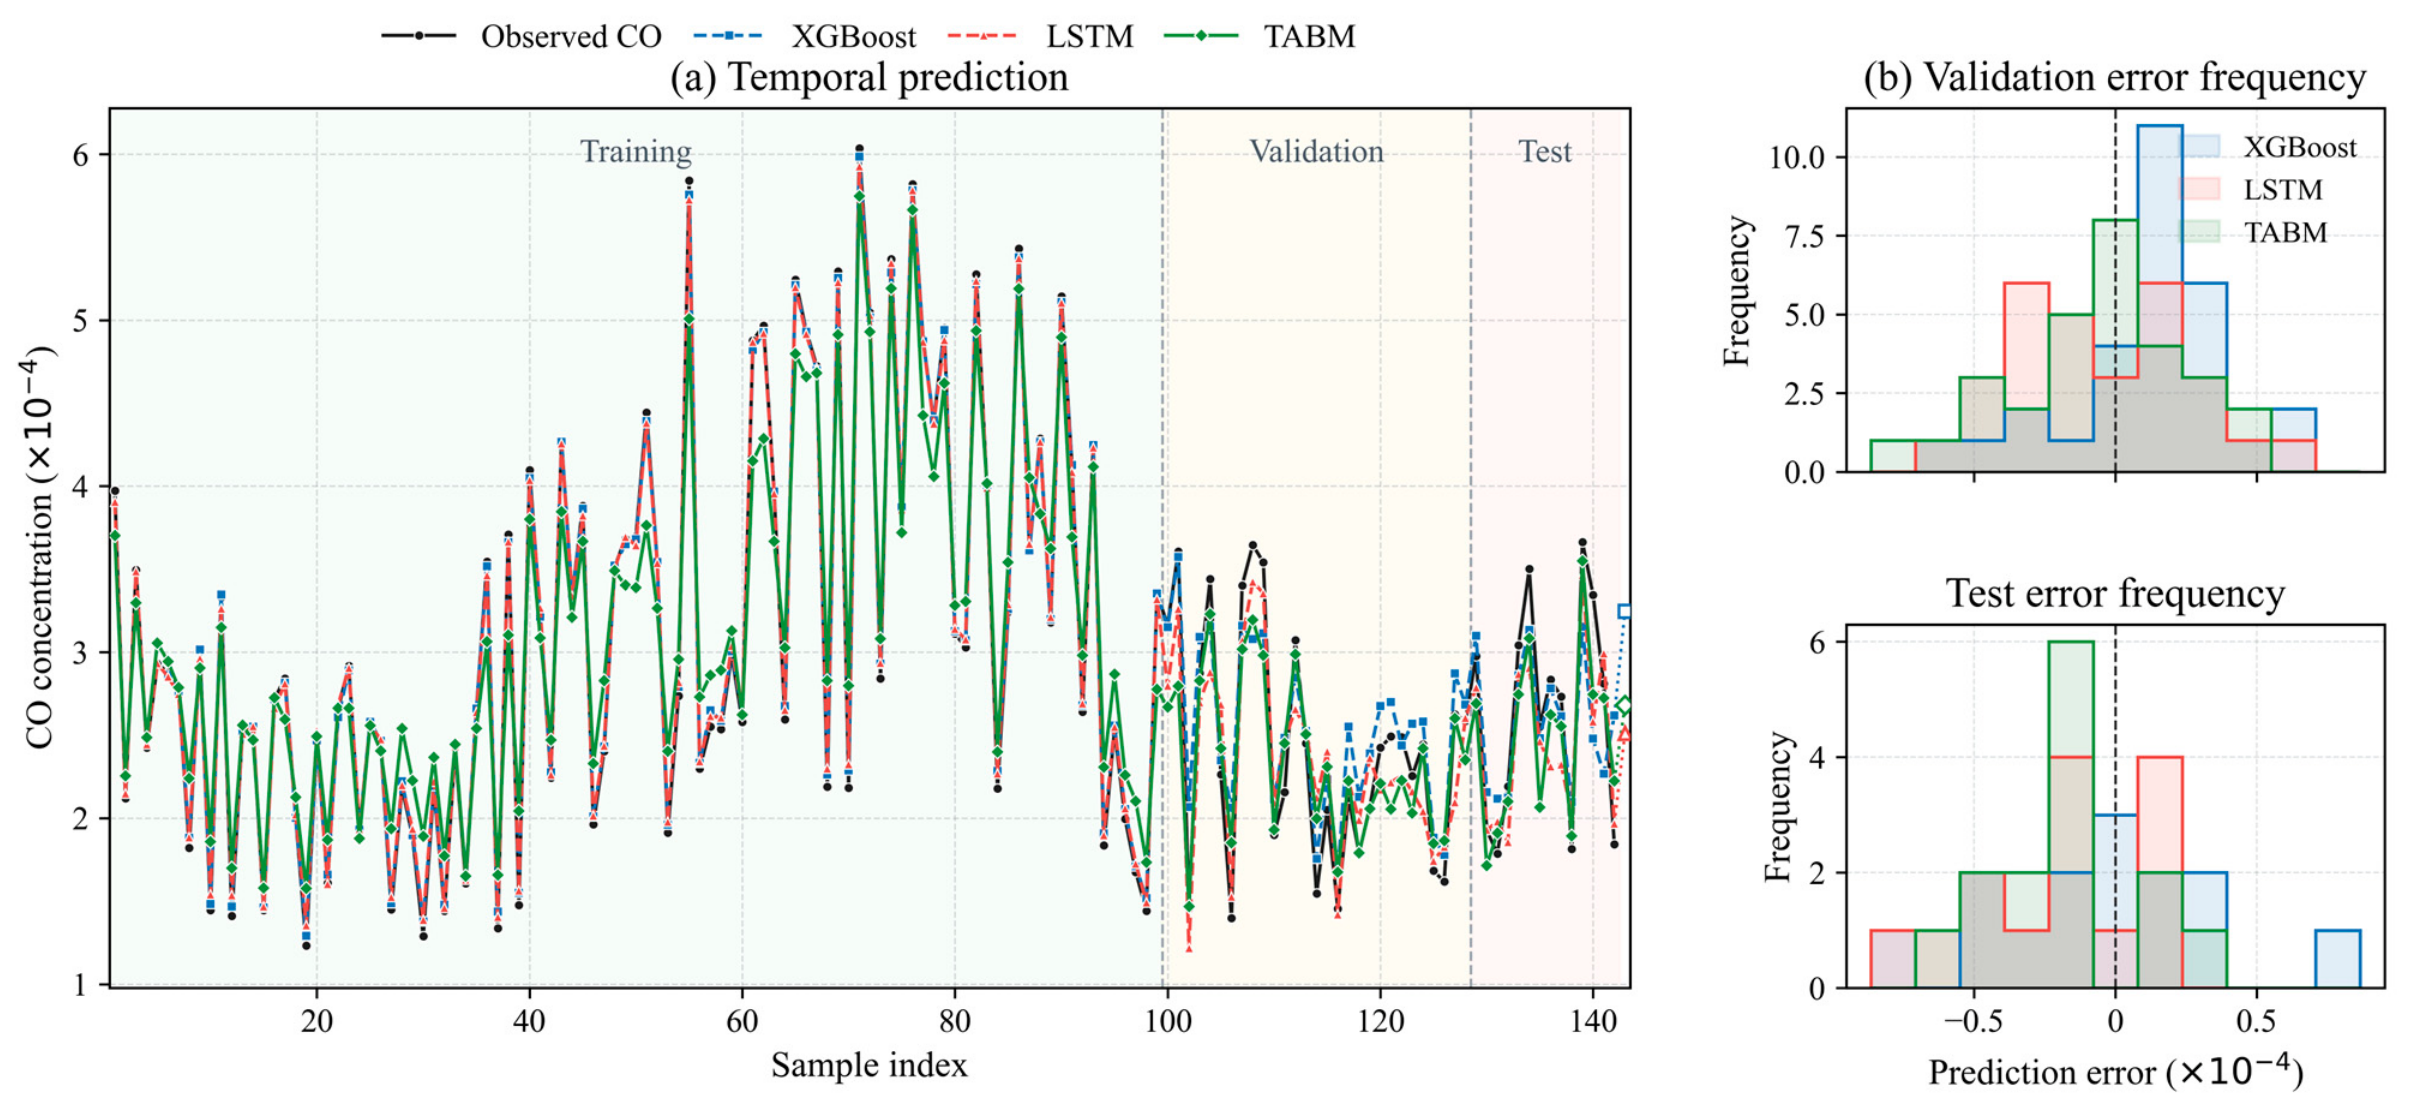
4.5.1. Temporal Generalization Under Chronological Splitting
4.5.2. Model and Optimizer Comparison on the 1202 Working Face
5. Discussion
6. Conclusions
- (1)
- A daily-scale multi-source monitoring sample system was constructed for the low-temperature oxidation stage of a goaf. Correlation analysis and random forest-based importance ranking indicate that GoafPipe_CH4, GoafPipe_CO2, GoafPipe_O2, and GoafPipe_C2H6 are the main features and provide key inputs for the continuous prediction of goaf temperature and CO concentration.
- (2)
- CA-WOA was developed by integrating rank-weighted elite-center reconstruction, covariance-adaptive direction learning, random-search injection, and geometric step-size decay. The Friedman test confirmed significant overall differences among the compared algorithms. The ablation results showed that covariance adaptation and elite-center reconstruction contributed positively on most benchmark functions, while the effects of step-size decay and random-search injection were more problem-dependent.
- (3)
- CA-WOA improved the dual-output prediction performance of all six candidate models. CA-WOA–TABM achieved the best performance, with a fivefold average mean of 0.924 and a composite fitness of 0.273. In out-of-fold prediction, the values for goaf temperature and CO concentration were 0.928 and 0.931, respectively, indicating stable internal validation performance under the current data conditions. Additional evaluation using data from the 1202 working face showed that TABM achieved a later-period test of 0.766 under chronological splitting, while CA-WOA–TABM achieved a fivefold mean of 0.948.
- (4)
- SHAP/PDP analysis indicates that the model captures nonlinear response relationships between key gas variables and the dual-output targets. Temperature prediction is mainly affected by GP_CH4, RA_CO2, GP_C2H6, and GP_O2, whereas CO prediction is mainly affected by GP_CO2, GP_CH4, GP_C2H6, and GP_O2. The proposed method provides data-driven support for continuous prediction of goaf temperature and CO concentration during the low-temperature oxidation stage, but further validation using more field samples and cross-mine data is still required.
Supplementary Materials
Author Contributions
Funding
Institutional Review Board Statement
Informed Consent Statement
Data Availability Statement
Acknowledgments
Conflicts of Interest
References
- Niu, H.; Zhu, H.; Wang, G.; Pan, H.; Sun, S.; Yu, X.; Yang, X.; He, J. A Review of the Mechanisms and Control Technologies of Coal and Gas Outbursts: Recent Advances and Future Perspectives. Energy Fuels 2024, 38, 23230–23245. [Google Scholar] [CrossRef]
- Anghelescu, L.; Diaconu, B.M. Advances in Detection and Monitoring of Coal Spontaneous Combustion: Techniques, Challenges, and Future Directions. Fire 2024, 7, 354. [Google Scholar] [CrossRef]
- Wang, L.; Xu, W.; Huang, W.; Wang, C.; Gao, Z.; Liu, Y. Analyzing Coupled Risk Mechanisms and Key Factors in Coal Mine Fires: An N-K Model and Complex Network Approach. Sustainability 2026, 18, 1730. [Google Scholar] [CrossRef]
- Agarwal, S.; Gautam, P.K.; Zou, Y.; Dwivedi, R.; Panigrahi, D.C.; Dagli, C.; Singh, A. Leveraging Intrinsic Properties for Classification of Coal Seams towards Spontaneous Combustion Proclivity and Predicting Susceptibility Using Machine Learning: Smart and Sustainable Mining Approach. J. Sustain. Min. 2025, 24, 32–52. [Google Scholar] [CrossRef]
- Liu, Y.; Wen, H.; Chen, C.; Guo, J.; Jin, Y.; Zheng, X.; Cheng, X.; Li, D. Research Status and Development Trend of Coal Spontaneous Combustion Fire and Prevention Technology in China: A Review. ACS Omega 2024, 9, 21727–21750. [Google Scholar] [CrossRef] [PubMed]
- Ma, T.; Ma, B.; Zhai, X.; Song, B.; Bai, Y.-E.; Liu, L.; Yang, H.; Wang, W.; He, B.; Chen, X. Nonlinear Evolutionary Characteristics and Early Warning Methods of Coal Spontaneous Combustion: Implications for Coal Mine Disaster Warning. J. Anal. Appl. Pyrolysis 2026, 194, 107492. [Google Scholar] [CrossRef]
- Liu, X.; Wang, H.; Wang, E.; Li, Z.; Liu, X.; Wang, K. Research on Evolution Law of Index Gases Produced by the Coal Spontaneous Combustion Based on Wavelet Analysis. Fuel 2024, 370, 131859. [Google Scholar] [CrossRef]
- Lei, C.; Feng, Q.; Zhu, Y.; Cui, C.; Bao, R.; Deng, C. Multiple Indicator Gases and Temperature Prediction of Coal Spontaneous Combustion Oxidation Process. Fuel 2025, 393, 134991. [Google Scholar] [CrossRef]
- Zhang, J.; Bai, X.; Song, Z.; Zhang, Y.; Dong, X.; Wu, S.; Xing, C.; Li, X.; Xu, W.; Zhang, S. Research Progress and Perspectives on Prevention and Control Technologies for Coal–rock–gas Composite Dynamic Disasters: New Types of Induced Classifications, Discriminant Criteria, and Structural Control Schemes. Rock Mech. Rock Eng. 2025, 58, 10143–10181. [Google Scholar] [CrossRef]
- Jin, Y.; Li, Y.; Liu, W.; Yang, X.; Cheng, X.; Qi, C.; Li, C.; Hui, J.; Zhang, L. Research Status and Prospect of Coal Spontaneous Combustion Source Location Determination Technology. Processes 2025, 13, 2305. [Google Scholar] [CrossRef]
- Zhai, X.; Li, X.; Hou, Q.; Ma, T.; Song, B.; Hao, L. Research and application of classification warning method for coal spontaneous combustion in goaf under air leakage. Coal Sci. Technol. 2025, 53, 161–169. [Google Scholar]
- Zhou, Q.; Mao, X.; Jia, B. Development of a Graded Early Warning Index System and Identification of Critical Temperatures for Coal Spontaneous Combustion Using Composite Gas Characteristics. ACS Omega 2024, 9, 35515–35525. [Google Scholar] [CrossRef] [PubMed]
- Hao, J.; Wang, S.; Wen, H.; Liu, Z.; Zhang, D.; Ren, L. Multi-Stage Indicator Gas Selection and Early-Warning Method for Coal Spontaneous Combustion. Case Stud. Therm. Eng. 2026, 77, 107516. [Google Scholar] [CrossRef]
- Zhang, L.; Luo, Z.; Wang, Y.; Su, B.; Zhang, H. Study on Multi-Monitoring Point Coal Spontaneous Combustion Grading Early Warning System and GRU Model. Fuel 2026, 405, 136452. [Google Scholar] [CrossRef]
- Wang, C.; Hu, P.; Sun, Y.; Yang, C. Study on CO Source Identification and Spontaneous Combustion Warning Concentration in the Return Corner of Working Face in Shallow Buried Coal Seam. Environ. Sci. Pollut. Res. 2024, 31, 15050–15064. [Google Scholar] [CrossRef] [PubMed]
- Wang, K.; Huang, H.; Deng, J.; Zhang, Y.; Wang, Q. A Spatio-Temporal Temperature Prediction Model for Coal Spontaneous Combustion Based on Back Propagation Neural Network. Energy 2024, 294, 130824. [Google Scholar] [CrossRef]
- Zhuo, H.; Li, T.; Lu, W.; Zhang, Q.; Ji, L.; Li, J. Prediction Model for Spontaneous Combustion Temperature of Coal Based on PSO-XGBoost Algorithm. Sci. Rep. 2025, 15, 2752. [Google Scholar] [CrossRef] [PubMed]
- Zou, P.; Ye, Y.; Zhou, W.; Tu, L.; Han, C.; Liang, X. Study on the Prediction of Coal Spontaneous Combustion Tendency Based on the Particle Swarm Optimization Algorithm Optimized the Xgboost Model. Int. J. Coal Prep. Util. 2026, 46, 1950–1971. [Google Scholar] [CrossRef]
- Guo, J.; Chen, C.; Wen, H.; Cai, G.; Liu, Y. Prediction Model of Goaf Coal Temperature Based on PSO-GRU Deep Neural Network. Case Stud. Therm. Eng. 2024, 53, 103813. [Google Scholar] [CrossRef]
- Zhang, P.; Chen, X. An Unsupervised Learning Approach for Coal Spontaneous Combustion Warning Level Classification Using T-SNE and k-Means Clustering. Appl. Sci. 2025, 15, 3756. [Google Scholar] [CrossRef]
- Li, Y.; Song, L. Research on Coal Spontaneous Combustion Hierarchical Prediction Model Based on NSGA-II-RF. Sci. Rep. 2025, 15, 6298. [Google Scholar] [CrossRef] [PubMed]
- Long, L.; Shi, Q.; Zhang, Q.; Hu, J.; Zhang, H. Dual-Warning Model for Coal Spontaneous Combustion Temperature Prediction and Risk Classification Based on BO-LightGBM. Process Saf. Environ. Prot. 2025, 201, 107624. [Google Scholar] [CrossRef]
- Pan, H.; Fan, Y.; Deng, J.; Shi, K.; Wang, C.; Lei, X.; Wei, Z.; Bai, J. GCN-Based Prediction Method for Coal Spontaneous Combustion Temperature. Process Saf. Environ. Prot. 2025, 196, 106855. [Google Scholar] [CrossRef]
- Zhao, H.; Zhou, X.; Han, J.; Liu, Y.; Liu, Z.; Wang, S. Research on Early Warning Model of Coal Spontaneous Combustion Based on Interpretability. Sci. Rep. 2025, 15, 18847. [Google Scholar] [CrossRef] [PubMed]
- Liu, C.; Wang, E.; Li, Z.; Zang, Z.; Li, B.; Yin, S.; Zhang, C.; Liu, Y.; Wang, J. Research on Multi-Factor Adaptive Integrated Early Warning Method for Coal Mine Disaster Risks Based on Multi-Task Learning. Reliab. Eng. Syst. Saf. 2025, 260, 111002. [Google Scholar] [CrossRef]
- Zhongyu, L.; Qing, G.; Wanxing, R. Statistical Study of the Characteristics of Coal Spontaneous Combustion Gases and Temperature. Combust. Sci. Technol. 2024, 196, 4292–4311. [Google Scholar] [CrossRef]
- Zhang, X.; Fan, M.; Wang, D.; Zhou, P.; Tao, D. Top- k Feature Selection Framework Using Robust 0–1 Integer Programming. IEEE Trans. Neural Netw. Learn. Syst. 2021, 32, 3005–3019. [Google Scholar] [CrossRef] [PubMed]
- Li, Z.; Koryanov, V.V. Application of the Ensemble Model TabM to Predict Fuel-Optimal Low-Thrust Transfers. In Advances in Transdisciplinary Engineering; Shi, L., Ed.; IOS Press: Amsterdam, The Netherlands, 2026. [Google Scholar]
- Mirjalili, S.; Lewis, A. The Whale Optimization Algorithm. Adv. Eng. Softw. 2016, 95, 51–67. [Google Scholar] [CrossRef]
- Ahmed, A.M.; Rashid, T.A.; Hassan, B.A.; Majidpour, J.; Noori, K.A.; Rahman, C.M.; Abdalla, M.H.; Qader, S.M.; Tayfor, N.; Mohammed, N.B. Balancing Exploration and Exploitation Phases in Whale Optimization Algorithm: An Insightful and Empirical Analysis. In Handbook of Whale Optimization Algorithm; Elsevier: Amsterdam, The Netherlands, 2024; pp. 149–156. [Google Scholar]
- Brodzicki, A.; Piekarski, M.; Jaworek-Korjakowska, J. The Whale Optimization Algorithm Approach for Deep Neural Networks. Sensors 2021, 21, 8003. [Google Scholar] [CrossRef] [PubMed]
- Aguirre, N.; Cuevas, E.; Luque-Chang, A.; Barba-Toscano, O.; Vasquez-Franco, M. Covariance Matrix Adaptation Evolution Strategy (CMA-ES): A Comprehensive Survey of Variants and Hybridizations. Arch. Comput. Methods Eng. 2026. [Google Scholar] [CrossRef]
- Qin, L.; Zhu, Y.; Liu, S.; Zhang, X.; Zhao, Y. The Shapley Value in Data Science: Advances in Computation, Extensions, and Applications. Mathematics 2025, 13, 1581. [Google Scholar] [CrossRef]
- Ma, Y.; Zhao, Y.; Yu, J.; Zhou, J.; Kuang, H. An Interpretable Gray Box Model for Ship Fuel Consumption Prediction Based on the SHAP Framework. J. Mar. Sci. Eng. 2023, 11, 1059. [Google Scholar] [CrossRef]





| Algorithm | Friedman Mean Rank | Overall Rank | Top-3 Count | W/T/L vs. CA-WOA |
|---|---|---|---|---|
| CA-WOA | 1.39 | 1 | 9 | — |
| FLA | 3.06 | 2 | 5 | 1/1/7 |
| IDBO | 3.5 | 3 | 6 | 0/1/8 |
| PSO | 3.94 | 4 | 3 | 0/1/8 |
| GWO | 4.56 | 5 | 3 | 0/0/9 |
| DBO | 6.22 | 6 | 1 | 1/0/8 |
| WOA | 6.61 | 7 | 1 | 0/0/9 |
| HHO | 6.72 | 8 | 0 | 0/0/9 |
| Function | CA-WOA | WOA | HHO | FLA | PSO | DBO | GWO | IDBO |
|---|---|---|---|---|---|---|---|---|
| F1 | 3.00 × 10² ±1.99 × 10⁻¹⁴ | 2.60 × 10⁴ ±1.50 × 10⁴ | 9.15 × 10² ±3.47 × 10² | 3.00 × 10² ±1.17 × 10⁻² | 3.00 × 10² ±8.02 × 10⁻⁹ | 5.53 × 10³ ±1.85 × 10³ | 1.73 × 10³ ±1.67 × 10³ | 3.00 × 10² ±2.55 × 10⁻⁹ |
| F2 | 4.07 × 10² ±2.32 × 100 | 4.74 × 10² ±8.64 × 101 | 4.52 × 10² ±4.68 × 101 | 4.06 × 10² ±3.00 × 100 | 4.12 × 10² ±1.69 × 101 | 5.75 × 10² ±1.04 × 10² | 4.26 × 10² ±2.30 × 101 | 4.13 × 10² ±1.87 × 101 |
| F3 | 6.00 × 10² ±2.10 × 10⁻⁶ | 6.37 × 10² ±1.12 × 101 | 6.38 × 10² ±1.11 × 101 | 6.02 × 10² ±3.04 × 100 | 6.03 × 10² ±4.12 × 100 | 6.25 × 10² ±5.89 × 100 | 6.01 × 10² ±1.14 × 100 | 6.02 × 10² ±2.59 × 100 |
| F4 | 8.03 × 10² ±1.55 × 100 | 8.41 × 10² ±1.47 × 101 | 8.25 × 10² ±6.35 × 100 | 8.19 × 10² ±7.01 × 100 | 8.18 × 10² ±8.82 × 100 | 8.35 × 10² ±7.46 × 100 | 8.15 × 10² ±8.11 × 100 | 8.16 × 10² ±9.67 × 100 |
| F5 | 9.00 × 10² ±0.00 × 100 | 1.59 × 10³ ±5.10 × 10² | 1.34 × 10³ ±1.75 × 10² | 9.03 × 10² ±7.46 × 100 | 9.09 × 10² ±3.57 × 101 | 1.09 × 10³ ±7.16 × 101 | 9.07 × 10² ±1.54 × 101 | 9.06 × 10² ±2.62 × 101 |
| F6 | 1.81 × 10³ ±9.30 × 100 | 5.58 × 10³ ±5.66 × 10³ | 5.84 × 10³ ±4.20 × 10³ | 4.83 × 10³ ±2.17 × 10³ | 3.66 × 10³ ±2.23 × 10³ | 1.93 × 10⁶ ±4.77 × 10⁶ | 6.53 × 10³ ±2.19 × 10³ | 4.50 × 10³ ±2.37 × 10³ |
| F8 | 2.22 × 10³ ±7.61 × 100 | 2.24 × 10³ ±1.12 × 101 | 2.24 × 10³ ±1.90 × 101 | 2.22 × 10³ ±4.62 × 100 | 2.23 × 10³ ±2.85 × 101 | 2.23 × 10³ ±6.85 × 100 | 2.23 × 10³ ±1.81 × 101 | 2.24 × 10³ ±4.16 × 101 |
| F9 | 2.53 × 10³ ±5.86 × 10⁻¹¹ | 2.60 × 10³ ±5.01 × 101 | 2.60 × 10³ ±4.35 × 101 | 2.53 × 10³ ±2.08 × 101 | 2.54 × 10³ ±2.24 × 101 | 2.63 × 10³ ±5.21 × 101 | 2.56 × 10³ ±2.66 × 101 | 2.53 × 10³ ±2.09 × 101 |
| F10 | 2.54 × 10³ ±5.13 × 101 | 2.55 × 10³ ±7.16 × 101 | 2.58 × 10³ ±6.84 × 101 | 2.57 × 10³ ±1.21 × 10² | 2.57 × 10³ ±7.77 × 101 | 2.51 × 10³ ±2.57 × 101 | 2.57 × 10³ ±1.24 × 10² | 2.55 × 10³ ±8.05 × 101 |
| Model | Hyperparameter | Baseline Value | Model | Hyperparameter | Baseline Value |
|---|---|---|---|---|---|
| RF | n_estimators | 220 | RF | max_depth | 4 |
| RF | min_samples_leaf | 5 | RF | max_features | 0.7 |
| RF | n_jobs | 1 | |||
| XGBoost | n_estimators | 80 | XGBoost | max_depth | 2 |
| XGBoost | learning_rate | 0.04 | XGBoost | subsample | 0.8 |
| XGBoost | colsample_bytree | 0.8 | XGBoost | min_child_weight | 4 |
| XGBoost | reg_lambda | 8 | XGBoost | n_jobs | 1 |
| LightGBM | n_estimators | 90 | LightGBM | max_depth | 2 |
| LightGBM | learning_rate | 0.04 | LightGBM | subsample | 0.8 |
| LightGBM | colsample_bytree | 0.8 | LightGBM | min_child_samples | 12 |
| LightGBM | reg_lambda | 8 | LightGBM | n_jobs | 1 |
| CatBoost | iterations | 90 | CatBoost | depth | 2 |
| CatBoost | learning_rate | 0.04 | CatBoost | l2_leaf_reg | 20 |
| CatBoost | random_strength | 2 | CatBoost | thread_count | 1 |
| LSSVM | alpha | 10−3 | LSSVM | gamma | 0.005 |
| TABM | max_epochs | 300 | TABM | patience | 30 |
| TABM | lr | 1 × 10⁻³ | TABM | weight_decay | 3 × 10⁻⁴ |
| TABM | batch_size | 512 | TABM | d_block | 128 |
| TABM | n_blocks | 3 | TABM | k | 16 |
| TABM | dropout | 0.1 | TABM | val_fraction | 0.15 |
| Model | Hyperparameter | Search Range | Value | Model | Hyperparameter | Search Range | Value |
|---|---|---|---|---|---|---|---|
| RF | n_estimators | 50–500 | 239 | RF | max_depth | 2–20 | 17 |
| RF | min_samples_leaf | 1–8 | 1 | RF | max_features | 0.5–1.0 | 0.797948795 |
| XGBoost | n_estimators | 50–500 | 166 | XGBoost | max_depth | 2–10 | 6 |
| XGBoost | learning_rate | 0.01–0.30 | 0.3 | XGBoost | subsample | 0.6–1.0 | 0.6 |
| XGBoost | colsample_bytree | 0.6–1.0 | 1 | XGBoost | min_child_weight | 1–10 | 1 |
| XGBoost | reg_lambda | 10−6–50 | 50 | ||||
| LightGBM | n_estimators | 50–500 | 113 | LightGBM | max_depth | 2–12 | 6 |
| LightGBM | learning_rate | 0.01–0.30 | 0.26171755 | LightGBM | subsample | 0.6–1.0 | 0.755818689 |
| LightGBM | colsample_bytree | 0.6–1.0 | 0.827405489 | LightGBM | min_child_samples | 5–30 | 5 |
| LightGBM | reg_lambda | 10−6–50 | 42.39844725 | LightGBM | |||
| CatBoost | iterations | 50–500 | 335 | CatBoost | depth | 2–10 | 8 |
| CatBoost | learning_rate | 0.01–0.30 | 0.297133605 | CatBoost | l2_leaf_reg | 0.001–50 | 27.4900443 |
| CatBoost | random_strength | 0–2 | 0.746715595 | CatBoost | |||
| LSSVM | alpha | 10−4–100 | 0.077669431 | LSSVM | gamma | 10−4–100 | 0.06395764 |
| TABM | max_epochs | 180–420 | 315 | TABM | |||
| TABM | lr (learning_rate) | 3 × 10⁻⁴–0.005 | 0.001376567 | TABM | weight_decay | 10−5–0.002 | 2.7 × 10⁻⁵ |
| TABM | batch_size | 64–512 | 489 | TABM | d_block | 64–256 | 96 |
| TABM | n_blocks | 2–4 | 4 | TABM | k | 8–24 | 16 |
| TABM | dropout | 0–0.25 | 0.25 | TABM |
| Model | R2_T | R2_CO | Mean R2 | NRMSE_T | NRMSE_CO | F |
|---|---|---|---|---|---|---|
| CA-WOA-RF | 0.861 ± 0.023 | 0.876 ± 0.038 | 0.868 ± 0.015 | 0.372 ± 0.031 | 0.349 ± 0.056 | 0.360 ± 0.022 |
| CA-WOA–XGBoost | 0.904 ± 0.037 | 0.907 ± 0.052 | 0.905 ± 0.021 | 0.305 ± 0.064 | 0.296 ± 0.083 | 0.300 ± 0.033 |
| CA-WOA-LightGBM | 0.872 ± 0.025 | 0.903 ± 0.024 | 0.887 ± 0.012 | 0.356 ± 0.034 | 0.310 ± 0.039 | 0.333 ± 0.018 |
| CA-WOA-CatBoost | 0.895 ± 0.023 | 0.876 ± 0.039 | 0.885 ± 0.023 | 0.323 ± 0.036 | 0.349 ± 0.057 | 0.336 ± 0.034 |
| CA-WOA-LSSVM | 0.839 ± 0.056 | 0.855 ± 0.069 | 0.847 ± 0.054 | 0.396 ± 0.074 | 0.372 ± 0.090 | 0.384 ± 0.071 |
| CA-WOA–TABM | 0.921 ± 0.028 | 0.927 ± 0.017 | 0.924 ± 0.020 | 0.278 ± 0.050 | 0.268 ± 0.033 | 0.273 ± 0.036 |
| Model | Before Mean R2 | After Mean R2 | Improvement | Before F | After F | Reduction |
|---|---|---|---|---|---|---|
| RF | 0.83 | 0.868 | 0.039 | 0.401 | 0.36 | 10.10% |
| XGBoost | 0.882 | 0.905 | 0.023 | 0.336 | 0.3 | 10.50% |
| LightGBM | 0.811 | 0.887 | 0.076 | 0.423 | 0.333 | 21.30% |
| CatBoost | 0.844 | 0.885 | 0.041 | 0.391 | 0.336 | 14.10% |
| LSSVM | 0.811 | 0.847 | 0.036 | 0.43 | 0.384 | 10.80% |
| TABM | 0.868 | 0.924 | 0.056 | 0.354 | 0.273 | 22.80% |
| Model | R2_T | RMSE_T | R2_CO | RMSE_CO |
|---|---|---|---|---|
| CA-WOA-RF | 0.868 | 0.659 | 0.886 | 6.07 × 10⁻⁴ |
| CA-WOA–XGBoost | 0.913 | 0.535 | 0.916 | 5.21 × 10⁻⁴ |
| CA-WOA-LightGBM | 0.878 | 0.633 | 0.903 | 5.60 × 10⁻⁴ |
| CA-WOA-CatBoost | 0.902 | 0.568 | 0.891 | 5.93 × 10⁻⁴ |
| CA-WOA-LSSVM | 0.855 | 0.691 | 0.846 | 7.05 × 10⁻⁴ |
| CA-WOA–TABM | 0.928 | 0.487 | 0.931 | 4.72 × 10⁻⁴ |
| Dataset | Model | (×10−5) | (×10−5) | (%) | ||
|---|---|---|---|---|---|---|
| Training set | XGBoost | 0.9988 | 0.4400 | 0.3481 | 1.4624 | 0.0351 |
| Training set | LSTM | 0.9981 | 0.5343 | 0.4329 | 1.7733 | 0.0434 |
| Training set | TABM | 0.9242 | 3.3889 | 2.8376 | 10.7704 | 0.2754 |
| Validation set | XGBoost | 0.8054 | 3.0032 | 2.5337 | 12.0452 | 0.4412 |
| Validation set | LSTM | 0.8029 | 3.0221 | 2.6272 | 11.2584 | 0.4439 |
| Validation set | TABM | 0.7937 | 3.0924 | 2.3866 | 10.0391 | 0.4542 |
| Test set | XGBoost | 0.5633 | 4.1041 | 3.2274 | 12.8483 | 0.6608 |
| Test set | LSTM | 0.6778 | 3.5253 | 2.8518 | 10.3755 | 0.5676 |
| Test set | TABM | 0.7661 | 3.0037 | 2.5523 | 9.7089 | 0.4836 |
| Model | (×10−5) | (×10−5) | (%) | ||
|---|---|---|---|---|---|
| XGBoost | 0.7741 ± 0.1196 | 3.253 ± 0.889 | 2.539 ± 0.787 | 9.34 ± 3.45 | 0.4599 ± 0.1340 |
| TABM | 0.9093 ± 0.0304 | 2.121 ± 0.391 | 1.619 ± 0.249 | 6.08 ± 1.12 | 0.2976 ± 0.0511 |
| RS–TABM | 0.9052 ± 0.0873 | 2.092 ± 1.056 | 1.446 ± 0.637 | 5.47 ± 2.65 | 0.2880 ± 0.1220 |
| WOA–TABM | 0.9323 ± 0.0366 | 1.826 ± 0.611 | 1.339 ± 0.413 | 4.93 ± 1.83 | 0.2532 ± 0.0671 |
| GPBO–TABM | 0.9351 ± 0.0431 | 1.768 ± 0.697 | 1.219 ± 0.382 | 4.63 ± 1.78 | 0.2448 ± 0.0791 |
| TPE–TABM | 0.9468 ± 0.0256 | 1.616 ± 0.454 | 1.152 ± 0.252 | 4.36 ± 1.24 | 0.2254 ± 0.0544 |
| CMAES–TABM | 0.9456 ± 0.0202 | 1.654 ± 0.403 | 1.210 ± 0.296 | 4.57 ± 1.25 | 0.2304 ± 0.0398 |
| CA-WOA–XGBoost | 0.9055 ± 0.1146 | 1.936 ± 1.153 | 1.509 ± 0.935 | 5.49 ± 3.72 | 0.2712 ± 0.1619 |
| CA-WOA–TABM | 0.9481 ± 0.0401 | 1.565 ± 0.706 | 1.175 ± 0.546 | 4.27 ± 2.03 | 0.2159 ± 0.0816 |
| Model Comparison | (×10−5) | (×10−5) | (pp) | ||
|---|---|---|---|---|---|
| TABM vs. XGBoost | 0.1262 [0.0847, 0.1716] | 1.196 [0.796, 1.610] | 0.921 [0.594, 1.258] | 3.270 [2.040, 4.506] | 0.1656 [0.1128, 0.2202] |
| CA-WOA–TABM vs. CA-WOA–XGBoost | 0.0382 [0.0076, 0.0717] | 0.511 [0.104, 0.923] | 0.339 [0.083, 0.597] | 1.235 [0.353, 2.152] | 0.0707 [0.0146, 0.1270] |
| Model | Objective Evaluations | Optimization Time (s) | Final Fitting Time (s) | Total Pipeline Time (s) | Inference Latency (ms/Sample) |
|---|---|---|---|---|---|
| XGBoost | — | — | 0.08 | 0.083 | 0.098 |
| TABM | — | — | 0.489 | 0.496 | 0.188 |
| RS–TABM | 60 | 6.996 | 0.219 | 7.213 | 0.166 |
| WOA–TABM | 60 | 5.853 | 0.174 | 6.081 | 0.166 |
| GPBO–TABM | 60 | 7.073 | 0.253 | 7.275 | 0.157 |
| TPE–TABM | 60 | 7.108 | 0.247 | 7.388 | 0.161 |
| CMAES–TABM | 60 | 6.938 | 0.22 | 7.317 | 0.192 |
| CA-WOA–XGBoost | 60 | 4.604 | 0.079 | 4.68 | 0.098 |
| CA-WOA–TABM | 60 | 6.267 | 0.239 | 6.493 | 0.163 |
Disclaimer/Publisher’s Note: The statements, opinions and data contained in all publications are solely those of the individual author(s) and contributor(s) and not of MDPI and/or the editor(s). MDPI and/or the editor(s) disclaim responsibility for any injury to people or property resulting from any ideas, methods, instructions or products referred to in the content. |
© 2026 by the authors. Licensee MDPI, Basel, Switzerland. This article is an open access article distributed under the terms and conditions of the Creative Commons Attribution (CC BY) license.
Share and Cite
Yuan, G.; Ma, L.; Zhang, P.; Zhang, L.; Lu, Z.; Cao, Y. Joint Prediction of Goaf Temperature and CO Concentration Using Multi-Source Monitoring Feature Fusion and CA-WOA-Optimized Models. Appl. Sci. 2026, 16, 7422. https://doi.org/10.3390/app16157422
Yuan G, Ma L, Zhang P, Zhang L, Lu Z, Cao Y. Joint Prediction of Goaf Temperature and CO Concentration Using Multi-Source Monitoring Feature Fusion and CA-WOA-Optimized Models. Applied Sciences. 2026; 16(15):7422. https://doi.org/10.3390/app16157422
Chicago/Turabian StyleYuan, Gang, Li Ma, Pengyu Zhang, Longcheng Zhang, Zhuoyang Lu, and Yue Cao. 2026. "Joint Prediction of Goaf Temperature and CO Concentration Using Multi-Source Monitoring Feature Fusion and CA-WOA-Optimized Models" Applied Sciences 16, no. 15: 7422. https://doi.org/10.3390/app16157422
APA StyleYuan, G., Ma, L., Zhang, P., Zhang, L., Lu, Z., & Cao, Y. (2026). Joint Prediction of Goaf Temperature and CO Concentration Using Multi-Source Monitoring Feature Fusion and CA-WOA-Optimized Models. Applied Sciences, 16(15), 7422. https://doi.org/10.3390/app16157422