1. Introduction
The rapid development of autonomous driving technology is reshaping the global urban transportation landscape with unprecedented depth and breadth [
1,
2]. As an outstanding representative of Level 4 autonomous driving commercialization, robotaxi services are transitioning from the proof-of-concept stage to large-scale commercial operations, having accumulated rich practical experience in multiple core metropolitan areas across the United States [
3]. Among them, Waymo, a subsidiary of Alphabet, has become a benchmark enterprise in this field due to its leading technology and massive operational scale. As its service coverage continues to expand, the spatial distribution rationality and system resilience of pick-up points are increasingly becoming core bottlenecks that determine system operational efficiency, equity of resource allocation, and the ability to respond to emergencies [
4]. The analysis of the spatial pattern and network structure of autonomous vehicle pick-up points is inherently a comprehensive problem combining big data processing, machine learning, and complex system modeling. An in-depth analysis of the network topological characteristics of pick-up points can not only reveal the hidden patterns of user travel demand behind massive trajectory data but also provide crucial data-driven decision support for optimizing vehicle routing algorithms, designing intelligent fleet dispatch systems, and enhancing the resilience of autonomous driving service networks against sudden disruptions [
5]. A series of open-source datasets represented by the Waymo Open Dataset provides unprecedented opportunities for conducting reproducible and verifiable data-driven research, enabling academia to extract universally applicable theoretical insights from real-world complex scenarios [
6].
From the macroscopic perspective of urban transportation systems, the network structure of pick-up points holds profound theoretical significance and practical value. Theoretically, pick-up points serve as critical interfaces connecting the virtual dispatch network with the physical urban space; abstracting them into a complex network can reveal the underlying organizational logic of the autonomous driving service system. Practically, autonomous driving services face various disruptions in real-world urban environments, including road construction, traffic accidents, extreme weather, and even cyberattacks. If a certain hotspot area is paralyzed, to what extent will the entire service network be affected? Which nodes are essential for maintaining network connectivity? Answering these questions directly relates to the reliability of autonomous driving services and the overall resilience of the urban transportation system. Although academia has conducted a certain amount of research on autonomous vehicles and shared mobility services, there remain two main limitations in the identification of pick-up points and network vulnerability analysis:
First, the confusion between trajectory starting points and genuine pick-up points. A common yet often overlooked methodological flaw in existing literature utilizing trajectory data to study pick-up and drop-off (PUDO) locations is the direct equation of trajectory starting points with pick-up points. In real-world urban traffic environments, vehicles initiate movement from a stationary state for various reasons, including waiting at traffic lights, queuing in congested segments, and yielding to pedestrians. If these traffic-related stopping behaviors are not effectively distinguished from genuine passenger pick-up events, spatial analyses based on trajectory starting points will incorporate a substantial amount of noise, leading to biased research conclusions. Traditional rule-based filtering methods often rely on subjective experience, lack objective data-driven evidence, and struggle to adapt to complex and dynamic real-world traffic scenarios.
Second, an overemphasis on descriptive spatial analysis at the expense of normative network diagnosis. In current research on autonomous driving services, there is a plethora of network analyses regarding vehicle route planning and some vulnerability studies on charging station networks. However, studies that construct pick-up points as a network and analyze its vulnerability are uncommon. Most existing PUDO research remains at the level of analyzing hotspot distributions using kernel density estimation, addressing the characteristics of pick-up point distribution but lacking systematic diagnosis at the normative level. Consequently, they cannot answer what problems exist in the distribution, where the vulnerable nodes are, and what would happen if a specific node failed. The absence of this perspective makes it difficult for existing research to address the resilience challenges faced by autonomous driving services in complex urban environments.
To address the aforementioned limitations, this study aims to utilize the Waymo Open Motion Dataset, a large-scale real-world trajectory dataset, to develop a data-driven identification framework for candidate pick-up points based on machine learning. Furthermore, it constructs the identified pick-up points into a complex network to systematically evaluate its topological characteristics and vulnerability.
3. Data Sources and Preprocessing
3.1. Data Source and Description
This study utilizes the Waymo Open Motion Dataset (WOMD) (
https://waymo.com/open/data/motion/, accessed on 15 June 2026), which is one of the most comprehensive and widely applied open-source datasets in the autonomous driving industry [
29]. This dataset contains high-definition maps as well as detailed trajectory data of autonomous vehicles and surrounding traffic participants in complex urban environments. The primary data collection locations include representative cities for the commercial operation of autonomous vehicles in the United States, such as San Francisco and Phoenix. These cities exhibit significant differences in urban morphology and traffic structure, providing ideal samples for spatial analysis. The dataset was collected from the operations of the Waymo autonomous driving fleet on real-world urban roads, comprising 150 validation scene files and a total of 2,316,135 vehicle trajectories. Each trajectory records the vehicle’s position (x, y coordinates), velocity (vx, vy components), and heading angle information within a 9.1 s time window at a sampling frequency of 10 Hz. All coordinates are origin-centered at the scene center and employ a metric projected coordinate system, ensuring the accuracy of spatial distance calculations.
The core data utilized in this study are the starting points of autonomous vehicle trajectories. We selected the trajectory segments of the focal autonomous vehicles with the object type AGENT and extracted the coordinates of the first frame as a proxy for the autonomous vehicle pick-up points. The theoretical foundation for this processing method is that the starting position of an autonomous vehicle in a complete operational scene largely corresponds to the location where it receives a dispatch command and begins executing a passenger pick-up task, representing a high-precision spatial mapping of passenger boarding behavior. To construct a standardized dataset suitable for spatial analysis, we designed a rigorous preprocessing pipeline. First, we used TensorFlow and the official Waymo Open Dataset toolkit to parse the scene files in TFRecord format, filtered out trajectories with the object type VEHICLE, and extracted their complete time-series data. Second, all spatial data were uniformly projected into a metric coordinate system. Through automated Python 3.12 scripts, we batch-processed all scene files in the dataset and extracted the starting coordinates of the AGENT trajectories. After performing data cleaning to remove obvious outliers and duplicate records located outside the service area, we generated an original dataset containing 2,316,135 trajectories.
3.2. Machine Learning-Based Trajectory Classification and Pick-Up Point Identification
Directly equating trajectory starting points with pick-up points introduces substantial noise, as vehicles may have their trajectory starting points captured due to traffic lights, congestion, or simply passing through a sensor coverage area. To overcome this limitation and improve the accuracy of pick-up point identification, this study developed a multi-stage machine learning framework. By organically combining kinematic stratification, feature engineering, and unsupervised clustering, candidate PUDO events are isolated from massive trajectory data.
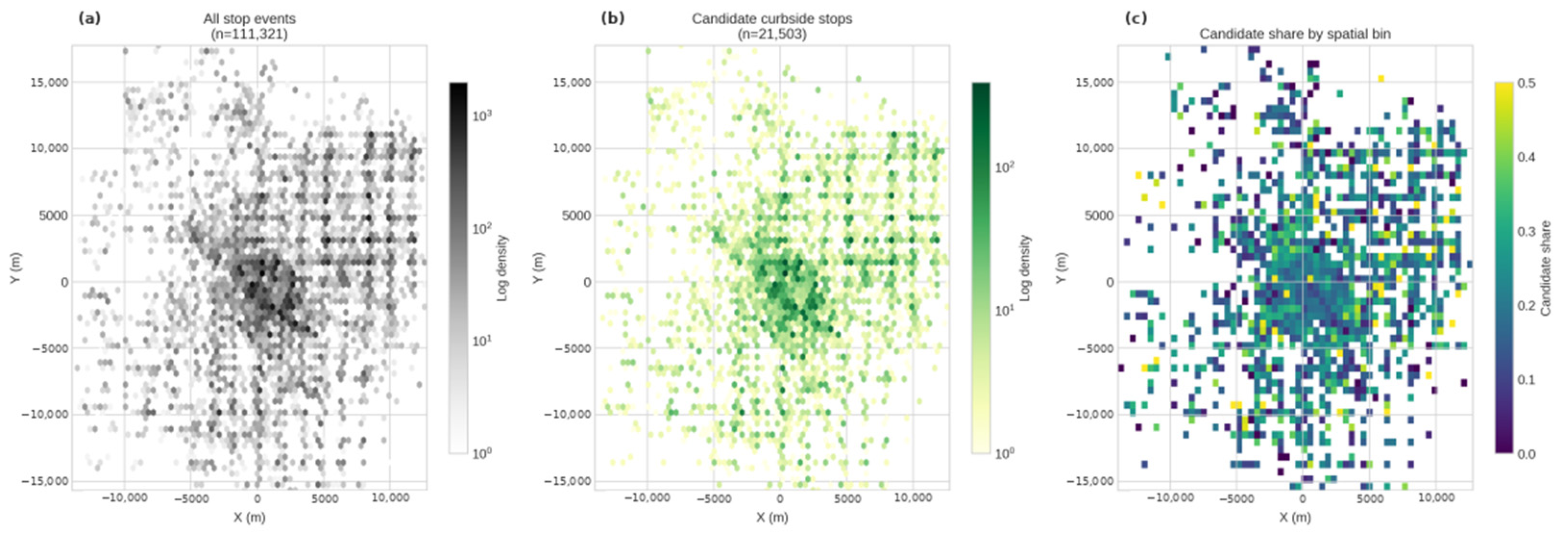
Before applying complex machine learning algorithms, this study first performed kinematic stratification on the 2,316,135 original trajectories based on the macroscopic motion states of the vehicles. According to the total displacement and initial velocity features of the trajectories, all trajectories were classified into three macroscopic motion patterns. The first category is Stationary Vehicles, defined as trajectories with a total displacement of less than 5 m. These typically represent vehicles parked at the curbside or in parking lots and were excluded as no meaningful movement occurred. The second category is Continuously Moving Vehicles, characterized by a total displacement greater than or equal to 5 m and an initial velocity greater than or equal to 2 m/s. These represent vehicles that were already in motion when captured by sensors and lack the physical semantics of a pick-up point; thus, they were also removed. The third category is Stop-to-Go Vehicles, which have a total displacement greater than or equal to 5 m but an initial velocity of less than 2 m/s. These trajectories completely capture the dynamic process of a vehicle starting from a stationary or near-stationary state and merging into the traffic flow. They constitute the core target group most likely to contain genuine pick-up events and traffic light stops. Through this preliminary kinematic stratification step, the analysis sample was drastically reduced from over 2.31 million original trajectories to 111,321 target trajectories. While filtering out 95.2% of irrelevant noise data, this step significantly improved the computational efficiency of the subsequent feature engineering and clustering analysis.
The two kinematic thresholds are grounded in physical considerations. The 5 m displacement threshold exceeds the localization jitter of the dataset and is approximately one vehicle length, thereby distinguishing genuinely stationary or parked vehicles from those that actually initiated a trip; the 2 m/s initial-velocity threshold corresponds to a near-creep speed, separating vehicles departing from a stationary state from those already traveling through the sensing area. These two thresholds serve only as a coarse pre-filter to define the candidate pool of stop-to-go trajectories; the final distinction between candidate pick-up points and traffic-related stops is made by unsupervised clustering, in other words, the study is data-driven rather than dependent on manually specified thresholds.
For the selected 111,321 target trajectories, this study further conducted multi-dimensional feature engineering, extracting 12 kinematic and geometric variables capable of reflecting the microscopic differences in vehicle starting behaviors. The core design logic of these features is that genuine PUDO events generate unique trajectory morphologies: the vehicle must deviate from the main road, execute a turning maneuver to enter a curbside or parking area, and depart after a brief stay. Specifically, the spatial geometric features include maximum lateral offset, curvature ratio, total heading change, and maximum single-step heading change. The motion dynamics features encompass stop duration, average initial acceleration, deceleration before stopping, average velocity, and velocity standard deviation. In addition, path length and total displacement were extracted as macroscopic displacement features. To eliminate the impact of differences in dimensions and orders of magnitude among various features on the distance metric algorithm, all 12-dimensional features were clipped to the 1st to 99th percentile range and subsequently subjected to Z-score Normalization, as shown in
Figure 1.
For reproducibility, the two principal engineered features are de-fined explicitly. Let a trajectory be sampled as points , = 0, …, n − 1, with chord vector of length . The maximum lateral offset is the maximum perpendicular (cross-track) distance from any trajectory point to the straight chord connecting the start and end points, ; a large value indicates a lateral pull-out toward the curb, whereas a near-zero value indicates near-straight motion. The curvature ratio (sinuosity) is the ratio of the traveled path length to the straight-line displacement D between the start and end points; it equals 1 for a perfectly straight path and increases with turning or detouring. Heading changes are computed from per-step heading differences wrapped to , with the total and maximum absolute per-step changes used as features.
After completing feature extraction and standardization, this study employs the K-Means algorithm to conduct unsupervised clustering analysis on the target trajectories. This method aims to discover natural groupings within the trajectory data, thereby avoiding the risk of circular reasoning caused by artificially set thresholds in traditional rule-based annotation methods. To scientifically determine the optimal number of clusters, K, this study comprehensively introduces the Elbow Method and the Silhouette Score for quantitative evaluation within the range of K in {2, 3, 4, 5, 6, 7}. Clustering was performed with k-means++ initialization, ten restarts ( = 10), and a fixed random seed (random_state = 42) to ensure full reproducibility; the resulting mean silhouette coefficients were 0.382, 0.231, 0.224, 0.259, 0.268, and 0.263 for K = 2 to 7, respectively. The analytical results indicate that when K = 2, the Silhouette Score reaches its global maximum, and the Sum of Squared Errors (SSE) curve exhibits a distinct elbow inflection point. This result also possesses clear physical interpretability: trajectories can essentially be bifurcated into two basic behavioral patterns, namely, curbside departure behaviors associated with pick-ups and in-lane traffic-related stop-and-go behaviors.
3.3. Complex Network Construction and Topological Indicator Calculation
3.3.1. Definition of Network Nodes
Given the massive number of identified pick-up points (21,503), directly using each point as a network node would result in topological connections at a microscopic scale that lack macroscopic significance for transportation planning. Therefore, a Spatial Grid Aggregation method is adopted, which is similar to the concept of the Traffic Analysis Zone (TAZ) commonly used in transportation planning. We divided the entire study area into regular grids of 200 m × 200 m. Through this aggregation step, we mapped the 21,503 discrete pick-up points into 3780 grid nodes with clear spatial representativeness, constituting the foundation of the complex network. The 200 m resolution is consistent with the Traffic Analysis Zone (TAZ) concept in transportation planning and with a walkable block scale, ensuring that each node carries meaningful macroscopic spatial representativeness.
3.3.2. Network Construction
This study employs a Distance Threshold-based method to construct an Undirected Unweighted Network [
30]. Considering urban pedestrian accessibility and the dispatch efficiency of autonomous vehicles between adjacent blocks, this study sets the threshold D_threshold = 500 m. The ultimately constructed network is denoted as G = (V, E), where V is the set of 3780 grid nodes, and E is the set of undirected edges established based on the 500 m threshold. The 500 m threshold corresponds to a standard pedestrian catchment radius (approximately a five- to six-minute walk) widely adopted in transit-accessibility research, reflecting the distance within which a traveler can reach an alternative pick-up point on foot. The network is deliberately modeled as undirected and unweighted: this first-order abstraction isolates the intrinsic topological connectivity of the pick-up-point system and provides a structural baseline that is a prerequisite for subsequent weighted, directed, and dynamic analyses, consistent with established practice in complex-network vulnerability research.
3.3.3. Network Topological Indicator Calculation
To quantitatively describe the structural characteristics of the constructed pick-up point network, we calculated the following classical complex network topological indicators:
Degree : The number of edges connected to node i. It reflects the direct connectivity of the node within a local range.
Network Density: The ratio of the number of actually existing edges in the network to the maximum possible number of edges [
30].
where
denotes the total number of edges in the network, and
denotes the total number of nodes. The denominator
represents the maximum number of edges that could theoretically exist in an undirected network with
nodes, i.e., the number of all possible node pairs
Degree Centrality: The normalized form of the node degree value [
31].
where
denotes the degree of node
i, i.e., the number of edges directly connected to node
, and
represents the maximum possible number of connections for any single node in a network of
nodes, serving as the normalization factor to ensure comparability across networks of different sizes.
Betweenness Centrality: The proportion of shortest paths between all pairs of nodes in the network that pass-through node
i [
28].
where
is the total number of shortest paths from node
to
, and
is the number of those paths that pass-through node
.
Closeness Centrality : The reciprocal of the sum of the lengths of the shortest paths from node i to all other nodes in the network. It reflects the global accessibility of the node within the entire network.
Clustering Coefficient : The ratio of the number of actually existing edges between the neighbors of node i to the maximum possible number of edges. It reflects the local clustering degree of the network.
Largest Connected Component (LCC): The connected subgraph with the largest number of nodes in the network. The proportion of nodes contained in the LCC to the total number of nodes is a key indicator for measuring the overall connectivity of the network.
Isolation Index: The proportion of nodes with a degree of 0 to the total number of nodes.
Global Efficiency : The average of the reciprocals of the shortest path lengths between all pairs of nodes in the network. It reflects the overall information or physical transmission efficiency of the network.
4. Results
4.1. Pick-Up Point Identification
Through kinematic stratification of the 2,316,135 original trajectories, 111,321 stop-to-go trajectories were successfully identified. Subsequently, K-Means clustering (K = 2) based on 12 kinematic and geometric features partitioned these trajectories into two distinct clusters.
As shown in
Table 1, Cluster 0 (
n = 21,503) exhibits markedly high lateral offset (mean = 6.17 m, substantially exceeding the typical lane width of 3.5 m), pronounced total heading change (2.24 rad), large maximum single-step heading change (0.28 rad), and an elevated curvature ratio (1.18). These characteristics are entirely consistent with the physical process of a vehicle departing from a curbside bay or a non-motorized lane, executing a significant turning and lateral maneuver to merge into the main traffic flow. Accordingly, Cluster 0 is unambiguously identified as representing genuine Pick-up Points.
In contrast, Cluster 1 (n = 89,818) displays a minimal lateral offset (mean = 0.43 m), a negligible total heading change (0.36 rad), an almost imperceptible maximum single-step heading change (0.02 rad), and a curvature ratio approaching unity (1.02, approximating a perfectly straight trajectory). Furthermore, the stop duration of Cluster 1 is significantly longer than that of Cluster 0 (2.79 s vs. 1.38 s), whereas the mean initial acceleration is considerably lower (0.27 m/s2 vs. 0.56 m/s2). These features are highly consistent with the behavioral pattern of a vehicle waiting at a traffic signal and subsequently accelerating gradually upon the signal turning green. Taken together, Cluster 1 is characteristically representative of traffic-related stop-and-go events following signal clearance or the dissipation of congestion.
Classification validation and uncertainty. Because the Waymo Open Motion Dataset provides no ground-truth passenger pick-up labels, the reliability of the clustering-based identification was assessed through three complementary checks. First, the clusters are physically interpretable: the candidate pick-up cluster shows a mean maximum lateral offset of 6.17 m (exceeding the typical 3.5 m lane width) and a mean total heading change of 2.24 rad, whereas the traffic-stop cluster is near-linear (0.43 m; 0.36 rad). Second, an independent Gaussian-mixture clustering of the same feature space recovers a curbside-type minority group of comparable size with the same qualitative signature, indicating that the identified behavior is not an artifact of the K-Means algorithm, The exact membership of borderline cases is nonetheless method-sensitive, and the identified points are therefore best regarded as candidate pick-up locations subject to a degree of classification uncertainty. Third, a blind manual audit was performed: 50 trajectories were randomly sampled from each cluster, plotted in a canonical frame, the straight start-to-end chord aligned horizontally, with a ±1.75 m one-lane reference band, shuffled, and visually labeled with cluster identity hidden, 84% of candidate-cluster samples exhibited clear curbside-departure geometry, versus 6% of traffic-cluster samples. Together, these checks support the interpretation while making its uncertainty explicit.
4.2. Initial Topological Characteristics of the Pick-Up Point Network
After aggregating the 21,503 pick-up points into 200 m × 200 m grid cells, 3780 network nodes were obtained. Based on a distance threshold of 500 m, an undirected unweighted network comprising 3780 nodes and 13,589 edges was constructed.
Table 2 summarizes the initial topological indicators of this network.
The topological indicators reveal that the autonomous driving pick-up point service network exhibits an organizational logic structurally distinct from that of traditional urban transportation networks. The network density of 0.0019 implies that, out of the approximately 7.14 million edges theoretically possible, only 13,589 are actually realized. The mean clustering coefficient is as high as 0.5732. Examined from an urban spatial perspective, this globally sparse yet locally dense topological structure is not a product of random emergence but rather a direct reflection of the spatial organizational logic of autonomous driving services. Pick-up points are dispersed across multiple discontinuous service zones at the urban scale; however, within each zone, they are highly proximate to one another owing to shared road infrastructure and travel demand, thereby forming topologically meaningful community structures. This finding resonates with the polycentric, cluster-based spatial development patterns observed in urban geography, suggesting that the spatial layout of autonomous driving services is largely constrained by the existing functional zoning of the city rather than uniformly covering the entire operational area.
The LCC encompasses 2497 nodes, accounting for 66.1% of the total node count. This implies that more than two-thirds of the service nodes form a continuous, mutually accessible service network within a 500 m pedestrian catchment area. From the perspective of travelers, this structural characteristic carries important practical implications: passengers located within the LCC can find an alternative pick-up point within walking distance even when service at a specific node is unavailable, thereby ensuring spatial redundancy of service. The remaining 33.9% of nodes are distributed across 377 mutually isolated small connected components, spatially corresponding to urban peripheral areas or transitional zones of service coverage. The coexistence of LCC dominance and fragmented periphery reveals potential issues of spatial equity in the autonomous driving service network: passengers in core areas enjoy a high degree of service assurance, while those in peripheral areas face the risk of service interruption.
The mean degree of the network is 7.19; however, the degree distribution spans from 0 to 22, with a standard deviation of 5.00 and a coefficient of variation of approximately 0.70, indicating significant heterogeneity in the connectivity capacity among nodes. The 185 isolated nodes with a degree of zero represent spatially completely disconnected service points, whereas high-degree nodes serve as connectors linking multiple local communities. Although the degree distribution has not yet reached the strict criteria of a scale-free network, it already demonstrates that the connectivity of the network is largely dependent on a small number of highly connected hub nodes.
4.3. Topological Attack and Network Vulnerability Analysis
To assess the vulnerability of the pick-up point network, sequential network attack simulations were conducted, and the evolution of the largest connected component ratio and global efficiency was monitored as a function of the node removal fraction.
The attack simulations conducted in this study are abstract topological node-removal experiments, comprising random failures and targeted removals based on degree or betweenness centrality. Cybersecurity incidents are regarded only as one of several possible real-world causes of node loss, alongside physical damage, road construction, and extreme weather [
32]. Owing to the excessively large volume of the sample data, this study conducts only topological attack simulations; this constitutes a limitation of the study, which is discussed in detail in the
Section 5.
4.3.1. Decay of the Largest Connected Component
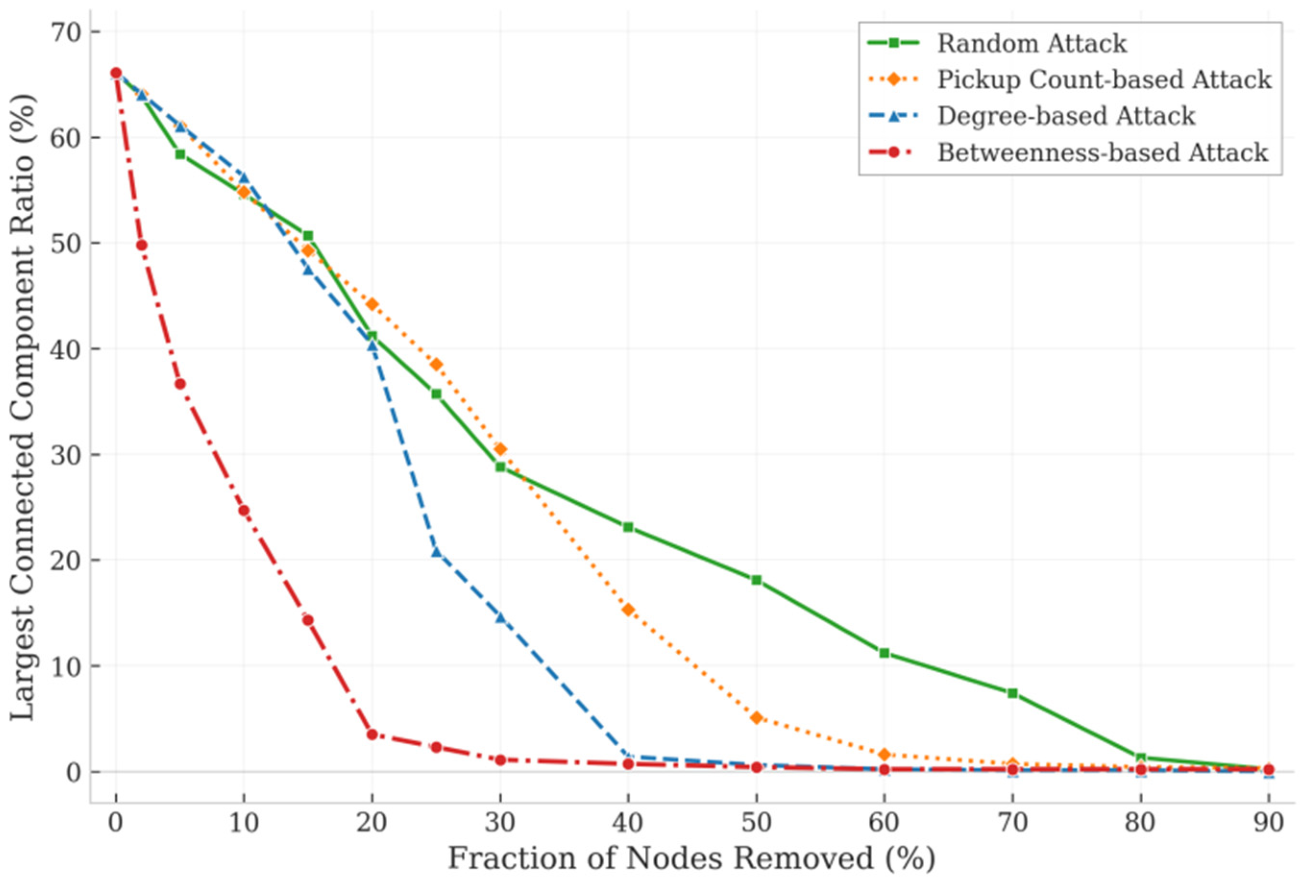
Figure 2 depicts the decay trajectories of the LCC Ratio under four attack strategies with progressively increasing node removal fractions. The four curves display markedly divergent degradation patterns.
Under random removal of 10% of nodes, the LCC Ratio declines only modestly from an initial 66.1% to 54.6%, corresponding to a relative reduction of approximately 17.4%. Even at a removal fraction of 20%, the LCC persists at 41.2%, with the backbone of the connected structure remaining substantially intact. This pronounced tolerance to random perturbation originates from the heterogeneous degree distribution of the network. From a practical operational standpoint, this finding suggests that random node failures triggered by unpredictable localized events—such as isolated road construction, temporary traffic restrictions, or single-point equipment malfunctions—are unlikely to fundamentally compromise the overall connectivity of the autonomous driving service network. A marked escalation in vulnerability is observed when the attack strategy transitions from random to targeted, with appreciable differences among the targeted strategies themselves. Degree centrality-based attacks, which sequentially remove the most highly connected hub nodes, demonstrate greater destructive efficiency than random attacks. Following the removal of the top 10% of high-degree nodes, the LCC Ratio decreases to 56.3%, a margin not yet substantially different from that of random attacks. However, at a removal fraction of 25%, the LCC undergoes a precipitous collapse to 20.9%, signaling the onset of structural disintegration. At 40% removal, the LCC plummets to 1.4% (53 nodes), indicating that the network has been effectively reduced to complete fragmentation. The decay curve of degree-based attacks exhibits a characteristic nonlinear profile—initially gradual, then abrupt—with the inflection point located in the 20–25% removal interval. This threshold effect demonstrates that network connectivity is not uniformly distributed across nodes but is critically dependent on a limited number of highly connected hubs.
The most devastating attack strategy proves to be the targeted attack based on betweenness centrality. Nodes with high betweenness are frequently not the most densely connected local hubs but rather the critical bridges linking distinct community modules. Experimental results indicate that removing merely the top 5% of high-betweenness nodes causes the LCC Ratio to plunge from 66.1% to 36.7%—a reduction of nearly half. At 10% removal, it further declines to 24.7%, and at a removal fraction of only 20%, the LCC collapses to 3.5%, with the network disintegrating into 458 mutually disconnected isolated components. Relative to degree-based attacks, the betweenness-based decay curve exhibits a steeper descent from the outset, and the removal fraction required to achieve an equivalent level of damage is substantially lower: reducing the LCC below 20% requires the removal of approximately 25% of nodes under degree-based attacks but only approximately 10% under betweenness-based attacks. This disparity reveals that, within the pick-up point service network, the preservation of global connectivity hinges not on nodes possessing the greatest number of local connections but on those serving as inter-community connectors. These bridge nodes are limited in quantity, yet their structural role is irreplaceable.
4.3.2. Decay of Global Efficiency
Global efficiency, defined as the mean of the reciprocals of the shortest path lengths across all node pairs, serves as a topological indicator that captures the degree of mutual accessibility between any two pick-up points within the service network. The initial global efficiency of 0.0282 resides at a relatively low level, a baseline physically attributable to the extreme global sparsity of the network coupled with the extended mean path length within the LCC. This implies that, under undisturbed conditions, although the autonomous driving service network forms tightly clustered local communities, the cost of cross-city global connectivity remains considerable.
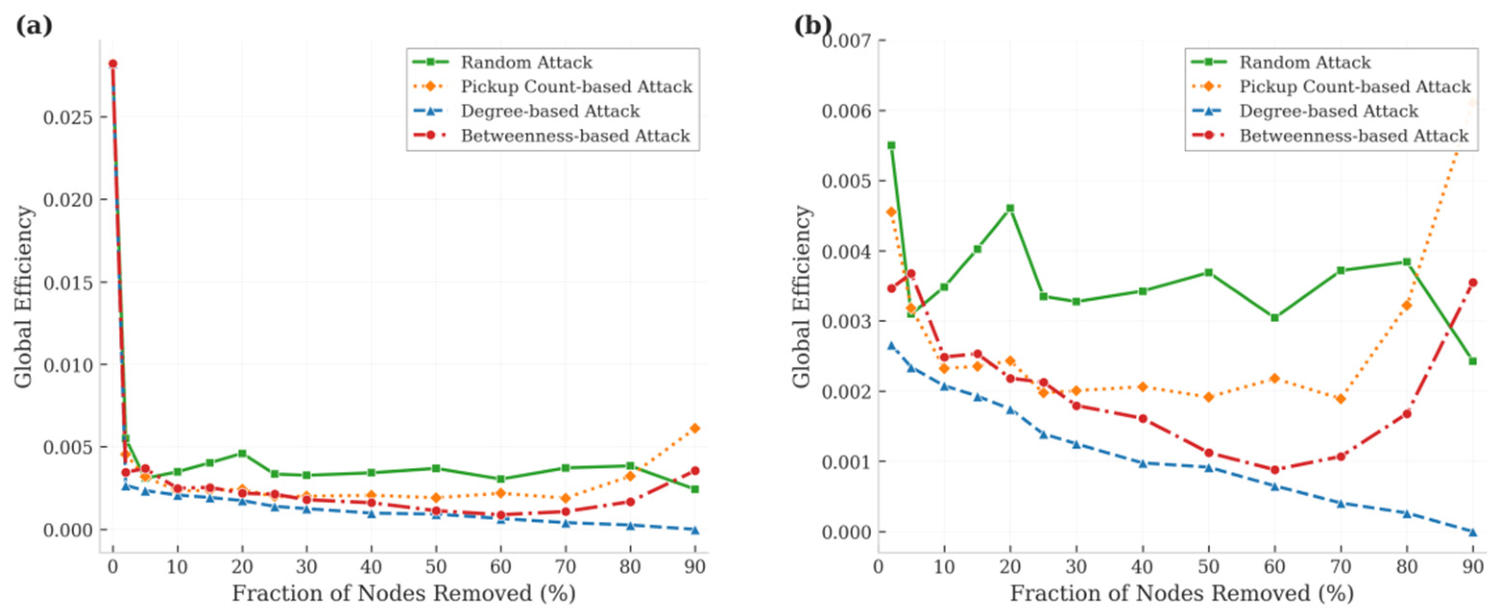
As illustrated in
Figure 3, the decay trend of global efficiency under all four attack scenarios is broadly congruent with the LCC collapse trajectory in macroscopic morphology, yet exhibits more pronounced dynamics at the microscopic scale of evolutionary rate. A salient observation is that all attack strategies induce a precipitous drop in global efficiency during the initial phase. Even under random attacks—the least damaging to the LCC—the removal of a mere 2% of nodes causes global efficiency to fall from 0.0282 to 0.0055, after which it oscillates within an extremely low range. Such a modest level of random disruption, while insufficient to partition the network into disconnected islands, compels extensive rerouting of shortest paths throughout the network, thereby substantially increasing the mean topological distance among surviving nodes and markedly degrading global service accessibility.
Among the targeted strategies, betweenness centrality-based attacks once again exhibit the most potent destructive capacity. Following the removal of 5% of high-betweenness nodes, global efficiency declines to 0.0037; at a removal fraction of 20%, it further deteriorates to 0.0022. By contrast, degree centrality-based attacks display a distinctive monotonically decreasing profile in the later evolutionary stages, indicative of the network degenerating into isolated nodes. During the advanced stages of betweenness-based and pick-up-point-count-based attacks, a slight anomalous rebound in global efficiency is observed, as shown in the zoomed-in panel of
Figure 3. This counterintuitive recovery does not signify a restoration of network connectivity; rather, it is an artifact of severe fragmentation—the few remaining small connected components contain very few, tightly clustered nodes, yielding shorter local mean path lengths that mathematically inflate the averaged global efficiency. This nuance further substantiates the state of complete network disintegration following severe targeted attacks.
4.3.3. Multi-Dimensional Topological Responses to Network Collapse and Mechanism Analysis
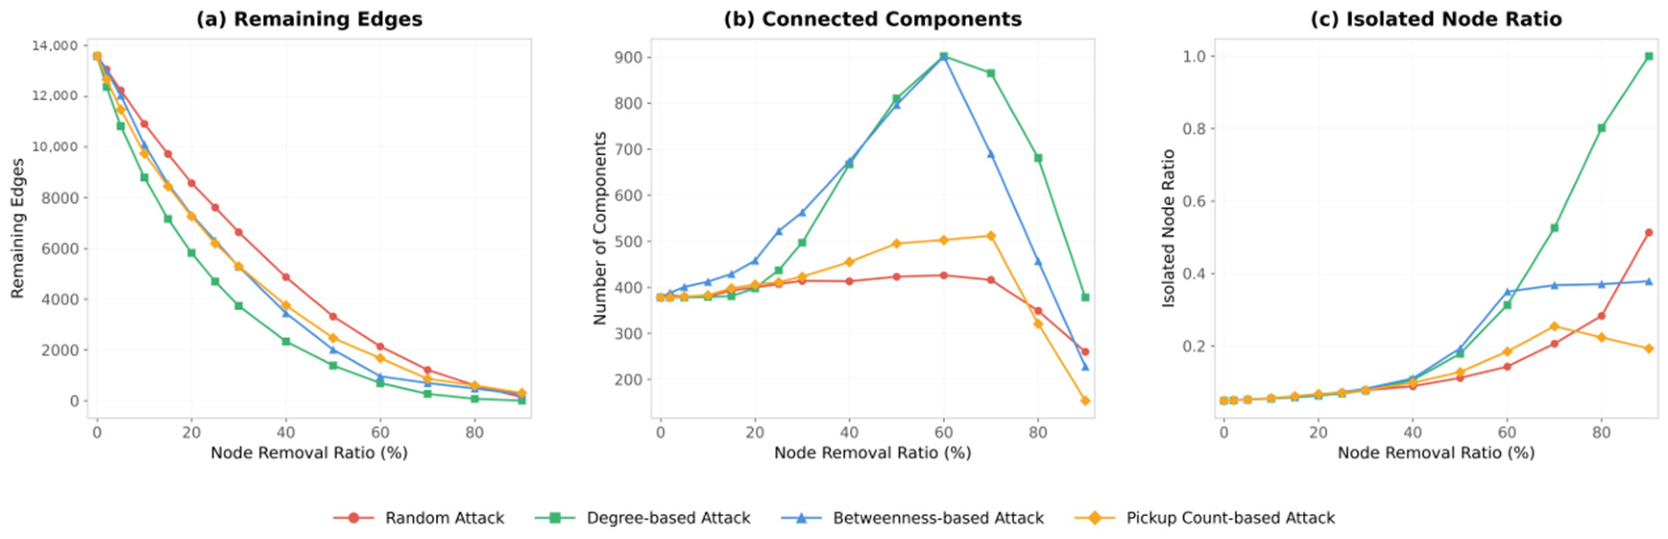
The preceding two subsections have elucidated, through the macroscopic lenses of the LCC Ratio and global efficiency, the differential vulnerability of the autonomous driving pick-up point network under various attack strategies. To develop a deeper understanding of the intrinsic mechanisms governing network collapse and to cross-validate the core findings presented above, this section extends the analysis to four complementary topological dimensions: the number of remaining edges, the number of connected components, the absolute size of the LCC, and the isolated node ratio (
Figure 4).
The decay trajectory of remaining edges (
Figure 4a) reveals fundamental differences in the destructive efficiency of the various attack strategies on the network’s connective fabric. Degree centrality-based attacks exhibit the most rapid rate of edge depletion: following the removal of 10% of high-degree nodes, the edge count decreases from an initial 13,589 to 8803; at a removal fraction of 30%, only 3737 edges survive. Notably, however, despite far exceeding degree-based attacks in LCC Ratio degradation, betweenness centrality-based attacks display a markedly slower rate of edge attrition—10,103 edges remain after the removal of 10% of high-betweenness nodes. This finding illuminates the distinctive destructive mechanism of betweenness-based attacks: rather than dismantling the network through wholesale depletion of connections, they achieve structural fragmentation by surgically severing a small number of critical links, thereby partitioning originally connected large components into multiple mutually inaccessible fragments. In essence, degree-based attacks constitute a quantitative mode of destruction that dismantles the network at the cost of maximizing edge consumption, whereas betweenness-based attacks represent a qualitative mode that achieves maximal structural fragmentation with minimal connection loss. This finding furnishes a mechanistic explanation at the connection level for the superior destructive efficacy of betweenness-based attacks and further corroborates the structural irreplaceability of bridge nodes within the autonomous driving pick-up point network.
The structural disintegration dynamics during network collapse are intuitively captured by the non-monotonic evolution of the number of connected components (
Figure 4b). In contrast to other monotonically varying indicators, the connected component count under targeted attacks follows a nonlinear trajectory—initially ascending, then descending—reflecting two distinct phases of network disintegration. Under both betweenness and degree centrality-based attacks, the component count rises steadily from an initial value of 378, peaks at approximately 60% node removal, and subsequently declines. This evolutionary trajectory corresponds to two topological phase transitions: during the ascending phase, the removal of high-centrality nodes progressively partitions the LCC into smaller independent subgraphs, increasing the total component count and signaling a structural transition from high connectivity to polycentric dispersion; during the descending phase, with the majority of nodes already removed, the remaining small-scale subgraphs disintegrate upon further node elimination, causing the component count to recede in tandem with the diminishing network scale. In stark contrast, under random attacks, the component count fluctuates only within the narrow band of 378–426 throughout the entire removal process, indicating that random node removal does not produce substantive structural fragmentation but rather manifests as a uniform reduction in node density, with the overall topological skeleton preserved.
The ultimate loss of service accessibility is characterized by the evolution of the isolated node ratio (
Figure 4c). In the initial network, the isolated node ratio stands at 4.89%, representing naturally disconnected pick-up points under undisturbed conditions. Under degree centrality-based attacks, this ratio exhibits a pronounced upward trajectory: at a node removal fraction of 90%, it reaches 100%, meaning that all surviving nodes have degenerated into isolated points with zero degree. This demonstrates that degree-based attacks, by eliminating hub nodes with extensive connections, directly sever the topological links of the low-degree nodes attached to them. In contrast, although betweenness centrality-based attacks achieve a higher LCC decay rate, the growth of the isolated node ratio is comparatively moderate, reaching only 37.8% at 90% node removal. This discrepancy reveals a fundamental distinction in the topological destruction mechanisms of the two targeted attack types: betweenness-based attacks preferentially sever bridge edges connecting distinct subgraphs, decomposing the network into multiple small-scale components that retain a degree of internal connectivity; degree-based attacks, conversely, eliminate highly connected hubs, directly stripping large numbers of nodes of their local connectivity. From the perspective of urban transportation resilience, betweenness-based attacks precipitate global network paralysis while preserving limited service accessibility within local areas; degree-based attacks, by contrast, engender the complete structural disintegration of the network, causing all surviving nodes to forfeit their topological associations and, consequently, all capacity for service substitution.
4.4. Identification of Core Hub Regions
The preceding vulnerability analysis has demonstrated that targeted attacks based on betweenness centrality exhibit greater destructive efficiency on network connectivity than those based on degree centrality. While this conclusion identifies the source of network vulnerability, the question of which specific nodes constitute the core hubs that sustain network connectivity—and what differentiation patterns these nodes exhibit in terms of topological characteristics—has not been comprehensively addressed. To this end, this section performs a multi-dimensional classification and feature analysis of the top 100 high-impact nodes in the network based on node-level topological indicators.
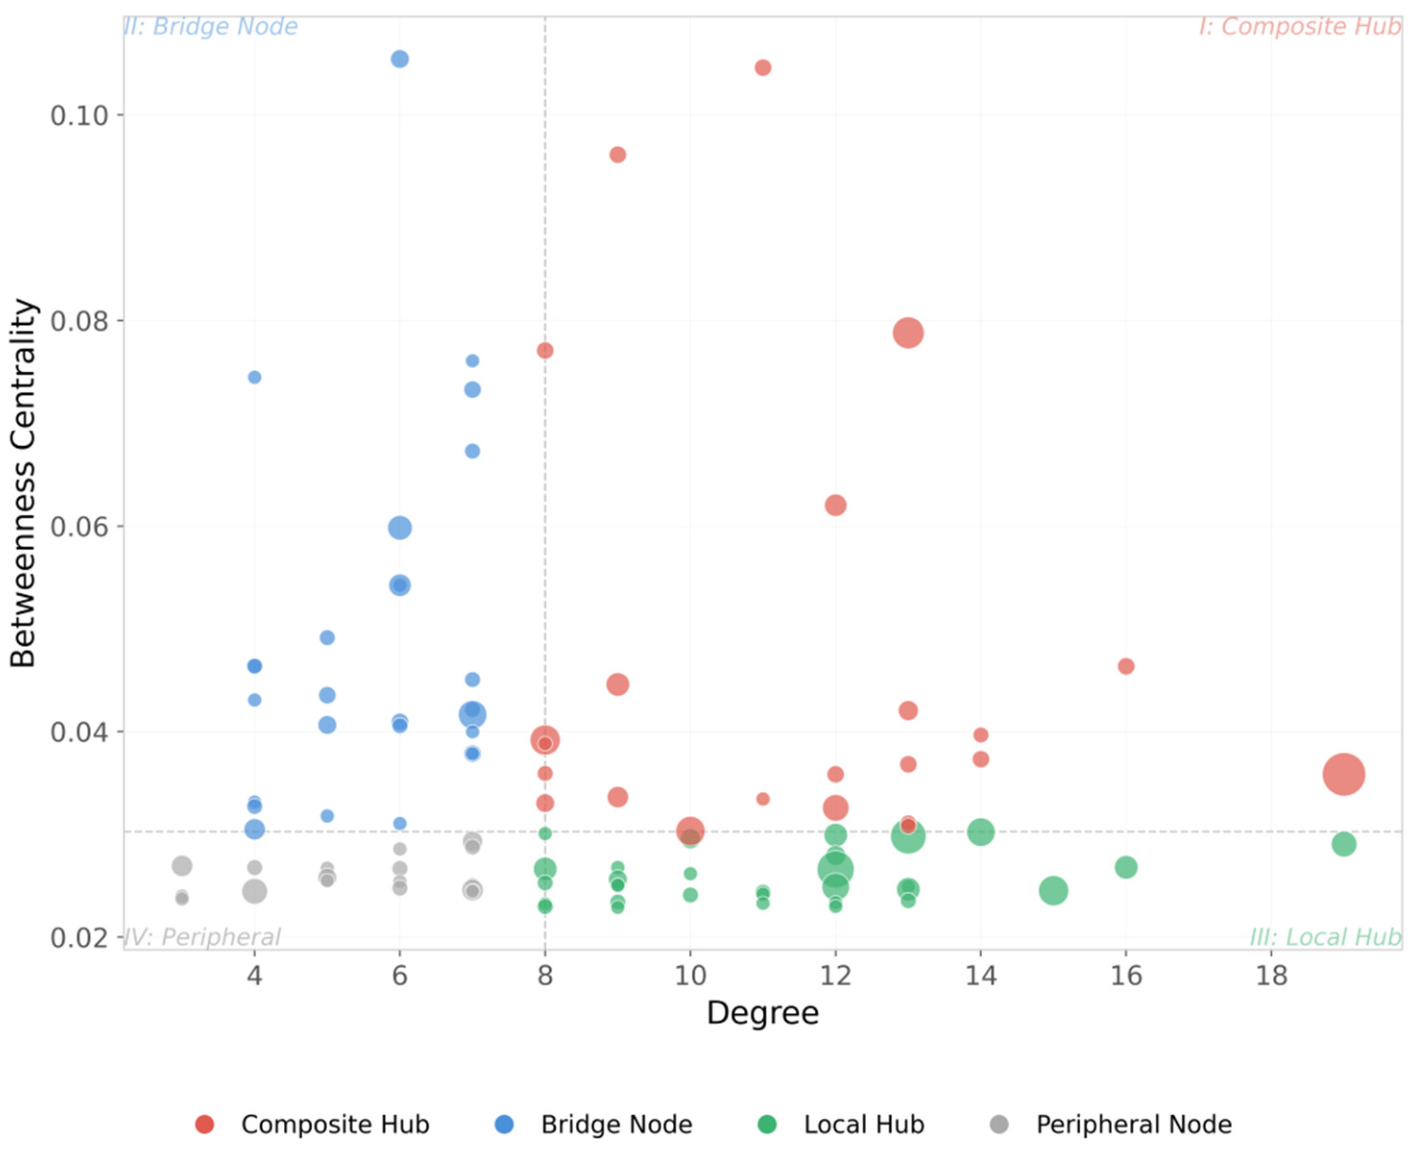
Using the median values of degree and betweenness centrality as thresholds, the nodes were partitioned into four quadrants (as illustrated in
Figure 5). Quadrant I comprises high-betweenness, high-degree nodes (Composite Hubs), totaling 23, which simultaneously possess strong local connectivity and global intermediary functionality. Quadrant II consists of high-betweenness, low-degree nodes (Bridge Nodes), totaling 27, which have relatively few local connections yet serve critical relay functions along global shortest paths. Quadrant III contains low-betweenness, high-degree nodes (Local Hubs), totaling 31, which maintain dense connections within local areas but contribute limitedly to global connectivity. Quadrant IV encompasses low-betweenness, low-degree nodes (Peripheral Nodes), totaling 19, which occupy marginal positions in the topological structure.
The results of the four-quadrant classification reveal a structural characteristic of considerable theoretical and practical significance: the correlation coefficient between degree and betweenness centrality is merely −0.088, indicating a near-absence of linear association between the two metrics. This implies that, within the autonomous driving pick-up point network, no inherent relationship exists between a node’s local connection density and its intermediary role in global information transmission. Further rank-overlap analysis indicates that only 3 nodes overlap between the top 20 ranked by betweenness centrality and the top 20 ranked by degree, and only 4 overlap with the top 20 ranked by pick-up point count. By contrast, 10 nodes overlap between the top 20 by degree and the top 20 by pick-up point count, suggesting that areas with higher service volumes tend to form denser local connections in space; however, this local connectivity advantage does not translate into a corresponding advantage in global topological standing.
Table 3 presents the multi-dimensional topological characteristics of the top 10 core hub nodes by composite ranking. The composite ranking is derived from a weighted summation of the individual rankings of three indicators: betweenness centrality, degree, and closeness centrality.
The results presented in
Table 3 further validate the aforementioned differentiation characteristics. Node 1599, ranked first in the composite ranking, simultaneously possesses high betweenness centrality and degree, with a pick-up point count of 17, qualifying it as a Composite Hub that integrates both global intermediary functionality and local service capacity. Node 1602, ranked seventh, exhibits the highest betweenness centrality among ten hub nodes listed in
Table 3; however, its degree is only 11 and its pick-up point count is merely 3, rendering it a typical hub dominated by global intermediary functionality. In contrast, Node 1623, ranked fifth, possesses the highest degree (19) and the largest pick-up point count (34), yet its betweenness centrality is only 0.0358, indicating a relatively limited relay function along global shortest paths.
Among the 27 nodes identified as Bridge Nodes (high-betweenness, low-degree), there exists a category of nodes that are particularly critical from the perspective of network resilience. Taking Node 508 as an illustrative example—the node with the highest betweenness centrality of 0.1054, ranking first among all nodes, yet possessing a degree of only 6 and a pick-up point count of merely 4—such nodes are inconspicuous at the local scale but serve as essential bridges connecting distinct connected subgraphs at the global topological level. The failure of these low-degree, high-betweenness bridge nodes accounts for the rapid collapse of network connectivity observed under betweenness-based attacks. From an operational management perspective, such nodes are readily overlooked in conventional assessment frameworks predicated on service volume or connection density; nevertheless, their topological standing plays an irreplaceable role in sustaining the global connectivity of the network. When formulating resilience assurance strategies for autonomous driving service networks, urban transportation management authorities should incorporate betweenness centrality into the indicator system for identifying critical nodes, and implement priority protection and redundancy construction in the areas where high-betweenness bridge nodes are located.
4.5. Sensitivity Analysis of Key Parameters
To verify that the findings do not depend on the specific parameter values, two sensitivity analyses were performed: one over the kinematic pre-filtering thresholds and one over the spatial-network construction parameters.
First, the raw trajectories were re-extracted under the loosest bounds, and the full identification-and-network pipeline was re-run for every combination of the displacement threshold in {3, 5, 8} m and the initial-velocity threshold in {1.5, 2.0, 2.5} m/s (
Table 4). Within the physically valid range (displacement ≥ 5 m) the results are stable: the pick-up fraction remains between 18.5% and 23.2%, the two-cluster silhouette between 0.35 and 0.40, and the network retains 3533–3988 nodes with a dominant largest connected component of 60–67%; the initial-velocity threshold has only a minor effect across its entire range. When the displacement threshold is loosened to 3 m, however, the clustering degrades markedly (the pick-up fraction falls to ≈ 6%), because trajectories shorter than ≈ 5 m are geometrically too short for the curvature and heading-change features to be reliable, so minor lateral deviations are amplified into spuriously large apparent turns. This confirms that the 5 m displacement threshold is a principled lower bound—the minimum distance at which curbside-departure geometry is reliably ex-pressed—rather than an arbitrary cut-off.
Second, the grid size (100/200/300 m) and the connection threshold (400/500/600 m) were varied independently while all other settings were held fixed (
Table 5). Across all configurations the network retained its defining structural character: it remained globally sparse (density 0.0012–0.0027) and locally highly clustered (clustering coefficient 0.48–0.67), and always contained a dominant largest connected component (41–79% of nodes) coexisting with a fragmented periphery; a finer grid or a larger threshold monotonically increases connectivity without al-tering the qualitative conclusions.
Crucially, across all nine kinematic configurations and all spatial-network configurations, adaptive targeted attacks on high-betweenness nodes consistently produced the largest and most rapid collapse of the largest connected component (to 14.5–39.1% after removal of only 5% of nodes), while random failures remained the least damaging, and the silhouette-optimal cluster number remained K = 2 throughout. The central conclusions of this study are therefore robust to the choice of all four parameters.
5. Discussion
This study utilizes the Waymo Open Motion Dataset to propose a machine learning-based framework for identifying autonomous vehicle pick-up points and systematically evaluates the topological characteristics and vulnerability of their spatial distribution from a complex network perspective. The findings provide, methodologically, a new paradigm for conducting microscopic traffic-behavior analysis using large-scale trajectory data and, theoretically, a complex-network perspective on the evaluation of autonomous-driving service systems; the discussion below examines what each contribution reveals and where its boundaries lie.
In the existing literature that employs trajectory data to study shared mobility or autonomous driving PUDO, a pervasive yet frequently overlooked methodological flaw is the direct equation of trajectory starting points with passenger boarding and alighting locations. The clustering results substantiate the deficiency of this assumption: 80.7% of the stop-to-go trajectories are in fact departures following traffic signal stops or congestion queuing (
Section 4.1). Without effective filtering of such traffic-related noise, spatial analyses based on raw trajectory starting points would yield severely biased conclusions. The framework proposed in this study, which integrates kinematic stratification with K-Means unsupervised clustering, addresses this issue to a considerable extent. The clustering result at K = 2 is not only statistically optimal but also demonstrates that pick-up behaviors and traffic-related stops constitute two naturally separable behavioral patterns within the kinematic feature space. By incorporating microscopic features capable of reflecting the physical process of a vehicle departing from the curbside—such as lateral offset, heading change, and curvature ratio—the machine learning model separates candidate pick-up points from traffic-related stops in a purely data-driven manner, without requiring manual annotation; the resulting clusters are physically interpretable and their curbside-departure signature is reproduced by an alternative clustering algorithm, although the exact membership carries a degree of classification uncertainty (
Section 4.1). Two implications of this identification result merit emphasis. First, the traffic-related noise is not random but spatially structured: signal-controlled stop-and-go events concentrate along arterials and at intersections, so demand surfaces estimated from raw trajectory origins would be systematically inflated precisely where signal density is highest, biasing infrastructure decisions toward intersections rather than genuine curbside demand. Second, three independent lines of evidence—the physical interpretability of the cluster centroids, the reproduction of the curbside-departure minority by a Gaussian-mixture model, and the blind manual audit (84% versus 6%;
Section 4.1)—converge on the same conclusion while bounding its uncertainty: the identified set is reliable at the aggregate, planning-relevant scale, even though individual memberships near the cluster boundary remain method-sensitive.
This methodology not only circumvents the subjectivity inherent in traditional rule-based filtering but also furnishes a reproducible and extensible analytical template for future trajectory classification research in the absence of ground-truth operational labels.
Abstracting the identified pick-up points into a complex network represents the perspectival contribution of this study. Traditional spatial analyses primarily focus on the geographic clustering intensity and coverage extent of pick-up points, falling within the realm of descriptive research, whereas network vulnerability analysis unveils the topological connectivity logic concealed beneath the spatial distribution. As reported in
Section 4.2, the network combines extreme sparsity with high local clustering, alongside a giant connected component encompassing 66.1% of all nodes. Notably, the local clustering coefficient (0.573) exceeds the global density (0.0019) by more than two orders of magnitude, indicating that the network consists of locally dense, highly clustered subgraphs whose interconnection depends on a small number of nodes—a configuration that, as shown below, explains the network’s asymmetric response to random and targeted disturbances. Under random attack scenarios that simulate unpredictable localized failures, the network demonstrates remarkably strong resilience. However, when attacks target topologically critical nodes within the network, its vulnerability becomes pronounced. Betweenness-targeted attacks are the most damaging: removing 20% of high-betweenness nodes reduces the LCC to 3.5% and fragments the network into hundreds of disconnected components (
Section 4.3). The two responses follow from the same structural property: the high edge redundancy within the locally dense subgraphs absorbs random node losses, whereas connectivity between subgraphs depends on a small number of nodes, whose removal disconnects the network at the global scale. The near-zero correlation between degree and betweenness centrality reported in
Section 4.4 (−0.088) quantifies this decoupling of service volume from structural criticality and explains why betweenness-targeted attacks are decisively more destructive than degree-targeted ones. These characteristics are consistent with, and extend, prior findings in transportation network science. The robust-yet-fragile pattern—strong tolerance of random failures combined with acute sensitivity to attacks on high-centrality nodes—mirrors the classic result of Albert et al. for heterogeneous complex networks and has likewise been reported for road and transit systems [
33,
34,
35]. The severity ordering observed here, in which betweenness-targeted removal dominates degree-targeted removal, agrees with centrality-based attack simulations in other networked systems [
36,
37], against this background, the distinctive feature of the pick-up-point network is the near-complete decoupling of degree from betweenness, which concentrates vulnerability in low-volume connector locations rather than in high-volume service hubs. This finding carries profound theoretical implications. In complex network theory, nodes with high betweenness centrality typically serve as connectors. Within the autonomous driving service network, these nodes may not be the commercial centers with the highest service volumes or the densest concentration of pick-up points, but rather transitional areas that geographically link distinct service zones. Once these areas are paralyzed by unforeseen events, autonomous vehicles will be unable to perform effective dispatching and rebalancing across different zones, resulting in the rapid severance of the entire service network.
The findings of this study offer important policy implications for urban transportation management authorities and autonomous driving operators seeking to optimize service networks and enhance system resilience. Network planning should shift from the sole pursuit of hotspot coverage toward an emphasis on systemic resilience. Currently, autonomous driving operators tend to prioritize covering high-demand hotspot areas when deploying services to maximize operational revenue. However, the vulnerability analysis conducted in this study demonstrates that the nodes with the highest service volumes are not necessarily the most critical for maintaining network connectivity. This suggests a two-level redundancy structure for resilient planning: redundancy within the locally dense subgraphs is largely supplied by demand density itself, whereas redundancy between subgraphs—carried by the low-degree, high-betweenness nodes—is structurally scarce and therefore constitutes the high-est-value target for public investment and operational protection. Accordingly, in future service network planning, operators and urban planners need to devote greater attention to these areas. Identifying and protecting critical nodes is essential. Urban transportation management authorities can leverage the network analysis framework proposed in this study to periodically assess the topological structure of autonomous driving service networks, identify critical nodes with exceptionally high betweenness centrality, and formulate dedicated contingency plans. During congestion or incidents, priority should be given to safeguarding road accessibility in these areas, or guiding autonomous vehicles through alternative routes, thereby minimizing the cascading disruption effects of localized failures on the global service network.
The identification of low-degree, high-betweenness bridge nodes carries direct operational value. For infrastructure planning, transportation agencies can prioritize the road corridors hosting bridge nodes for capacity and reliability investment, dedicated curbside pick-up/drop-off bays, signal priority, and connectivity-preserving links—since these locations disproportionately sustain network-wide accessibility. For redundancy design, operators can pre-provision backup pick-up points within the 500 m catchment of each bridge node, so that the failure of a single critical node leaves a viable alternative and preserves service continuity. For emergency management, because removing a small fraction of bridge nodes fragments the network, these nodes should be monitored in real time and incorporated into incident-response priority lists, with pre-computed rerouting and fleet-rebalancing plans triggered when a bridge node is disrupted by construction, accidents, or extreme weather. For fleet dispatch, routing and rebalancing algorithms can be weighed up to maintain service across bridge nodes rather than optimizing solely for high-demand hotspots; because betweenness centrality is inexpensive to recompute, the proposed framework can be applied periodically as the service footprint expands.
We also note the dual-use nature of critical-node identification: the same betweenness-based diagnosis that could, in principle, indicate where a network is most fragile is intended here to guide its protection. Accordingly, the specific node identifiers reported are illustrative of the aggregate pattern rather than an operational target list, and the findings are deliberately presented together with the mitigation measures above, so that knowledge of critical nodes strengthens, rather than exposes, the service network. In operational practice, we recommend that precise critical-node inventories be treated as security-relevant planning information—shared with transportation authorities and operators for redundancy provisioning and contingency planning at bridge locations—rather than disseminated publicly, while academic reporting, as here, remains at the level of aggregate structural patterns.
Despite the methodological and theoretical contributions of this study, two main limitations should be acknowledged. The first concerns the data. Although the Waymo Open Motion Dataset is exceptionally large in scale, it is dimensionally constrained: it contains vehicle trajectories only, without passenger-demand information, and its 9.1 s scenario windows carry no wall-clock time-of-day, continuous traffic-flow, origin–destination, or signal-timing attributes. Consequently, the analysis characterizes service supply from observed vehicle stops but cannot assess supply–demand matching or the temporal evolution of the network, and the study is accordingly confined to a static, topology-level treatment. Future research could fuse the trajectory data with multi-source urban and demand data to evaluate spatial equity, supply–demand balance, and time-resolved network dynamics.
The second concerns the network representation. The current model is undirected, unweighted, and based solely on spatial proximity, and therefore does not represent road topology, travel time, traffic regulations, directionality, or congestion. These simplifications have a definable direction of influence: because some proximity-based edges would not be traversable on the physical road network, a topology- and direction-constrained network would exhibit lower effective connectivity than the present model, so the reported vulnerability should be read as a conservative structural baseline—a real, constrained network would be at least as vulnerable to targeted attacks—while the identity of the most critical nodes may shift from spatial bridges toward genuine road-network cut points. Deriving such weight is not possible from the trajectory dataset alone; constructing directed, weighted, road-constrained, and time-resolved networks by fusing trajectory data with external traffic and demand data is therefore the priority for future work.
6. Conclusions
Drawing upon 2,316,135 motion trajectories from the Waymo Open Motion Dataset, this study developed a framework that combines machine learning identification of pick-up points with a complex-network analysis of their spatial organization. Unsupervised K-Means clustering on the engineered kinematic and geometric features separated 21,503 candidate pick-up points from 111,321 stop-to-go trajectories, while the remaining 80.7% were departures following signal- or congestion-related stops. This identification is supported quantitatively: the two-cluster solution is silhouette-optimal (0.382), the minority cluster is reproduced by an independent Gaussian-mixture model, and a blind manual audit found curbside-departure geometry in 84% of candidate-cluster samples versus only 6% of traffic-cluster samples. In the absence of ground-truth passenger labels, the identified locations remain candidate pick-up points subject to residual classification uncertainty at cluster boundaries. The network constructed from these candidate points comprises 3780 nodes and 13,589 edges and combines global sparsity (density 0.0019) with high local clustering (clustering coefficient 0.573). Its connectivity is strongly uneven: the largest connected component contains 66.1% of the nodes and covers the urban core as a single connected region, the remaining 33.9% of nodes are distributed over 377 disconnected components, and the global efficiency is low (0.0282). This structure of locally dense subgraphs, whose interconnection depends on a small number of nodes, remained unchanged across grid sizes of 100–300 m, connection thresholds of 400–600 m, and the full range of kinematic pre-filtering thresholds and is therefore not an artifact of parameter choice. The vulnerability analysis shows a pronounced asymmetry between failure types. Under random node removal the largest connected component degrades gradually, whereas targeted removal ordered by betweenness centrality is the most destructive strategy in every configuration examined: removing the top 5% of high-betweenness nodes reduces the largest connected component to 36.7%, and removing 20% reduces it to 3.5% with near-complete loss of global efficiency. The near-zero correlation between degree and betweenness centrality indicates that the nodes critical for connectivity are low-degree, high-betweenness nodes rather than the locations with the highest service volumes, meaning that protecting network connectivity and serving peak demand are largely separate planning objectives. Because the model is an undirected, unweighted structural baseline, the reported vulnerability constitutes a conservative estimate for a road- and direction-constrained network. Methodologically, the study provides a reproducible procedure for constructing a service network from large-scale unlabeled trajectories and quantifying its response to node failures; its principal contribution is the network-level finding that the connectivity of the autonomous-driving service system depends on a small set of structurally critical nodes. Within the scope of the studied dataset and service footprint, these results provide quantitative support for resilience-oriented planning and critical-node protection. Future work should extend this structural baseline toward weighted, directed, road-constrained, and time-varying networks, incorporate dynamic cascading-failure simulations, and undertake cross-city comparisons to establish the generalizability of the observed vulnerability patterns.