1. Introduction
During the service life of oil-immersed electrical equipment such as power transformers and on-load tap changers, low-impedance faults can occur due to aging insulation and changes in the physical and chemical properties of the insulating oil [
1]. These faults often give rise to high-energy arcs, which rapidly decompose the surrounding transformer oil into a mixture of flammable gases, including hydrogen, acetylene, and ethylene [
2]. The intense heat generated by the arc also causes the oil to vaporize almost instantaneously, producing a sudden volumetric expansion. Given the high density and inertia of the liquid phase, the oil cannot adjust immediately to this rapid expansion, leading to localized pressure spikes within gas bubbles [
3]. The resulting pressure wave propagates through the oil, interacting with solid components inside the transformer, reflecting and refracting multiple times before contributing to an overall rise in tank pressure [
4]. If this excess pressure is not quickly relieved, it can impose severe mechanical stress on the tank walls, potentially causing deformation, oil leakage, or even catastrophic rupture, posing serious risks to both equipment and operational safety.
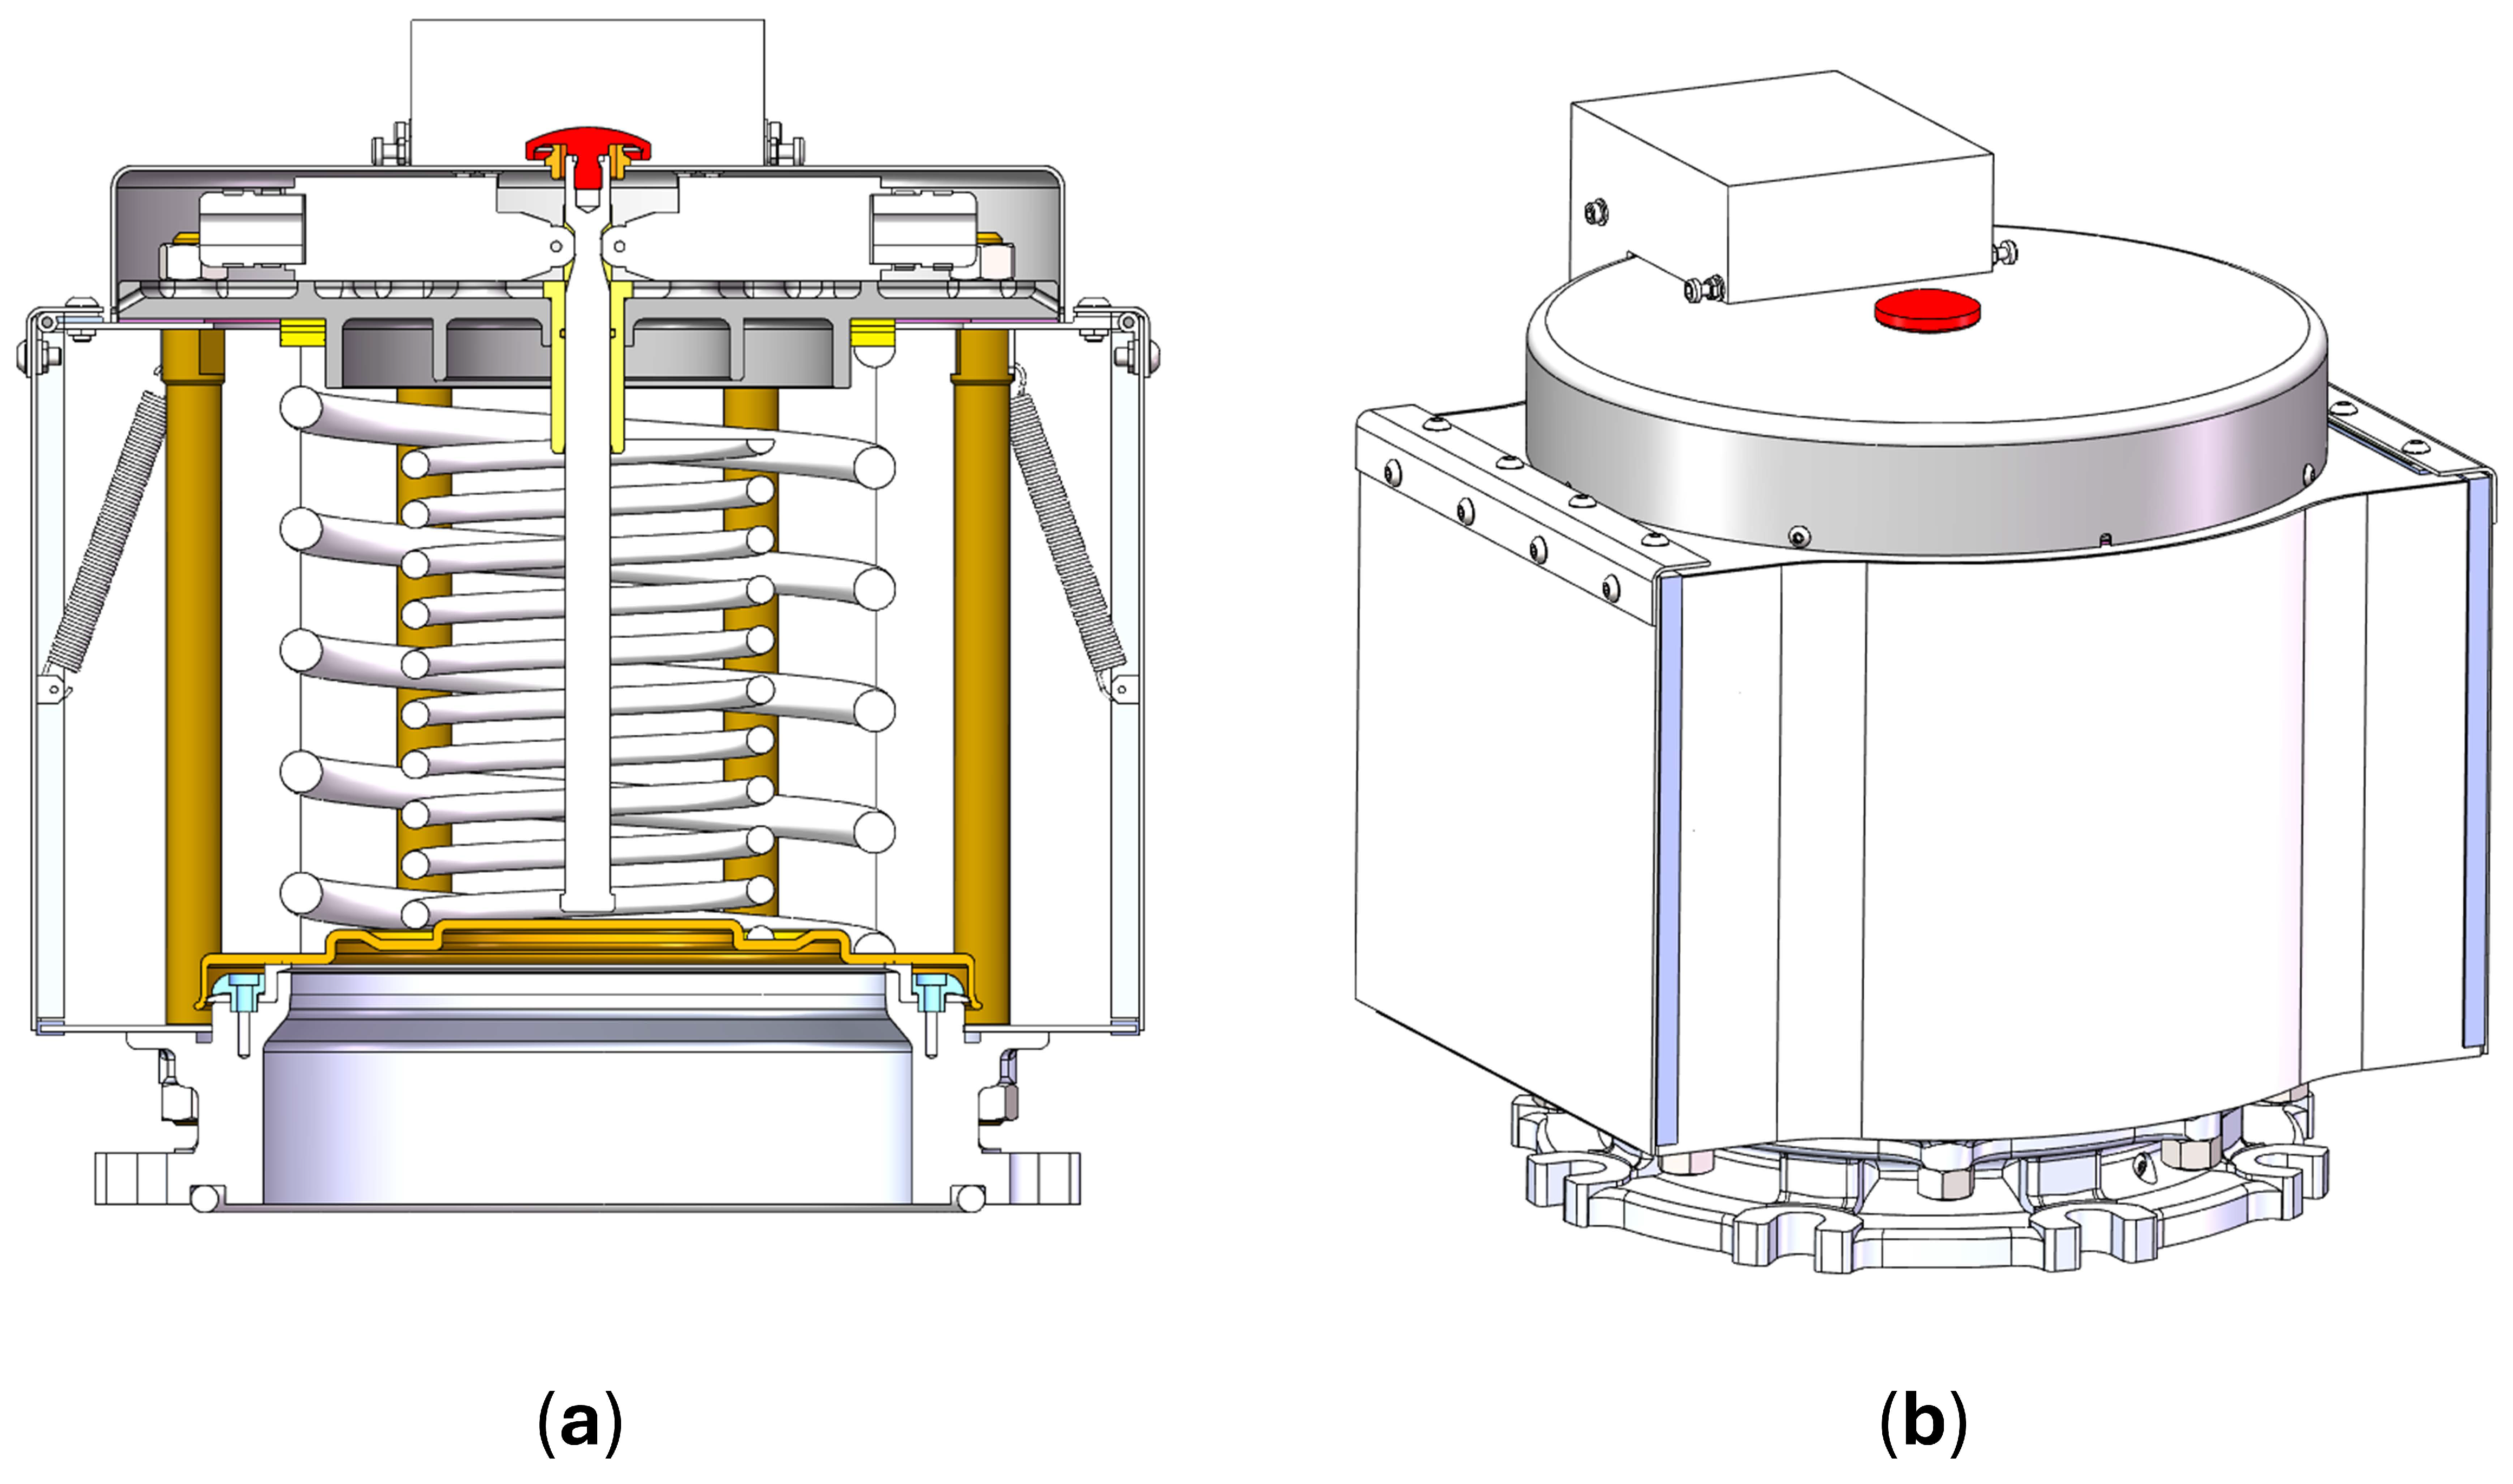
Installed as a final critical safety barrier on transformer tanks, PRVs are widely used to mitigate overpressure risks from internal arc faults [
5]. Their typical operation relies on a spring-loaded disc mechanism: the disc lifts to open a relief passage when internal pressure exceeds a preset threshold and resets once pressure drops below the reseating value, enabling rapid pressure regulation and isolation [
6,
7]. Extensive practical evidence confirms that high-performance PRVs substantially reduce explosion risks associated with arc faults [
8,
9].
Previous investigations on transformer PRVs have primarily focused on opening pressure characteristics, spring stiffness design, dynamic response behavior, and structural reliability. Experimental and numerical studies have demonstrated that valve opening dynamics considerably influence pressure-relief effectiveness and discharge performance [
10,
11,
12]. Similar research has also been conducted on safety valves and relief devices used in hydraulic, petrochemical, and process engineering systems, where valve motion, flow-induced forces, structural vibration, and dynamic stability have been identified as critical factors affecting operational performance [
13,
14]. Recent studies have further expanded the investigation of hydraulic valve performance from conventional structural design to dynamic operating characteristics under complex working conditions. For example, Stosiak et al. investigated the influence of mechanical vibration on a micro-hydraulic relief valve and analyzed the resulting pressure pulsation characteristics through theoretical and experimental approaches [
15]. Another study combined experimental measurements with numerical analysis to investigate vibration-related behaviors of hydraulic valves, further improving the understanding of valves’ dynamic characteristics under practical operating conditions [
16]. These studies have considerably improved the understanding of valve mechanics and dynamic response characteristics.
However, compared with the extensive research on valve opening mechanisms, considerably less attention has been devoted to the internal flow organization during transient pressure-relief processes. In practical transformer PRVs, the discharge flow commonly experiences abrupt contractions, sharp turning passages, and sudden expansions before reaching the outlet. Such complex geometric features can induce flow separation, recirculation zones, vortex structures, and localized pressure losses, thereby reducing the effective conversion of pressure energy into discharge flow [
17]. Previous numerical investigations of safety valves and pressure-relief devices have shown that vortex formation and flow stagnation regions may substantially increase hydraulic losses and weaken discharge performance [
18,
19]. Therefore, improving the internal flow-path configuration represents a promising strategy for enhancing transient discharge efficiency without altering the fundamental operating mechanism of the valve.
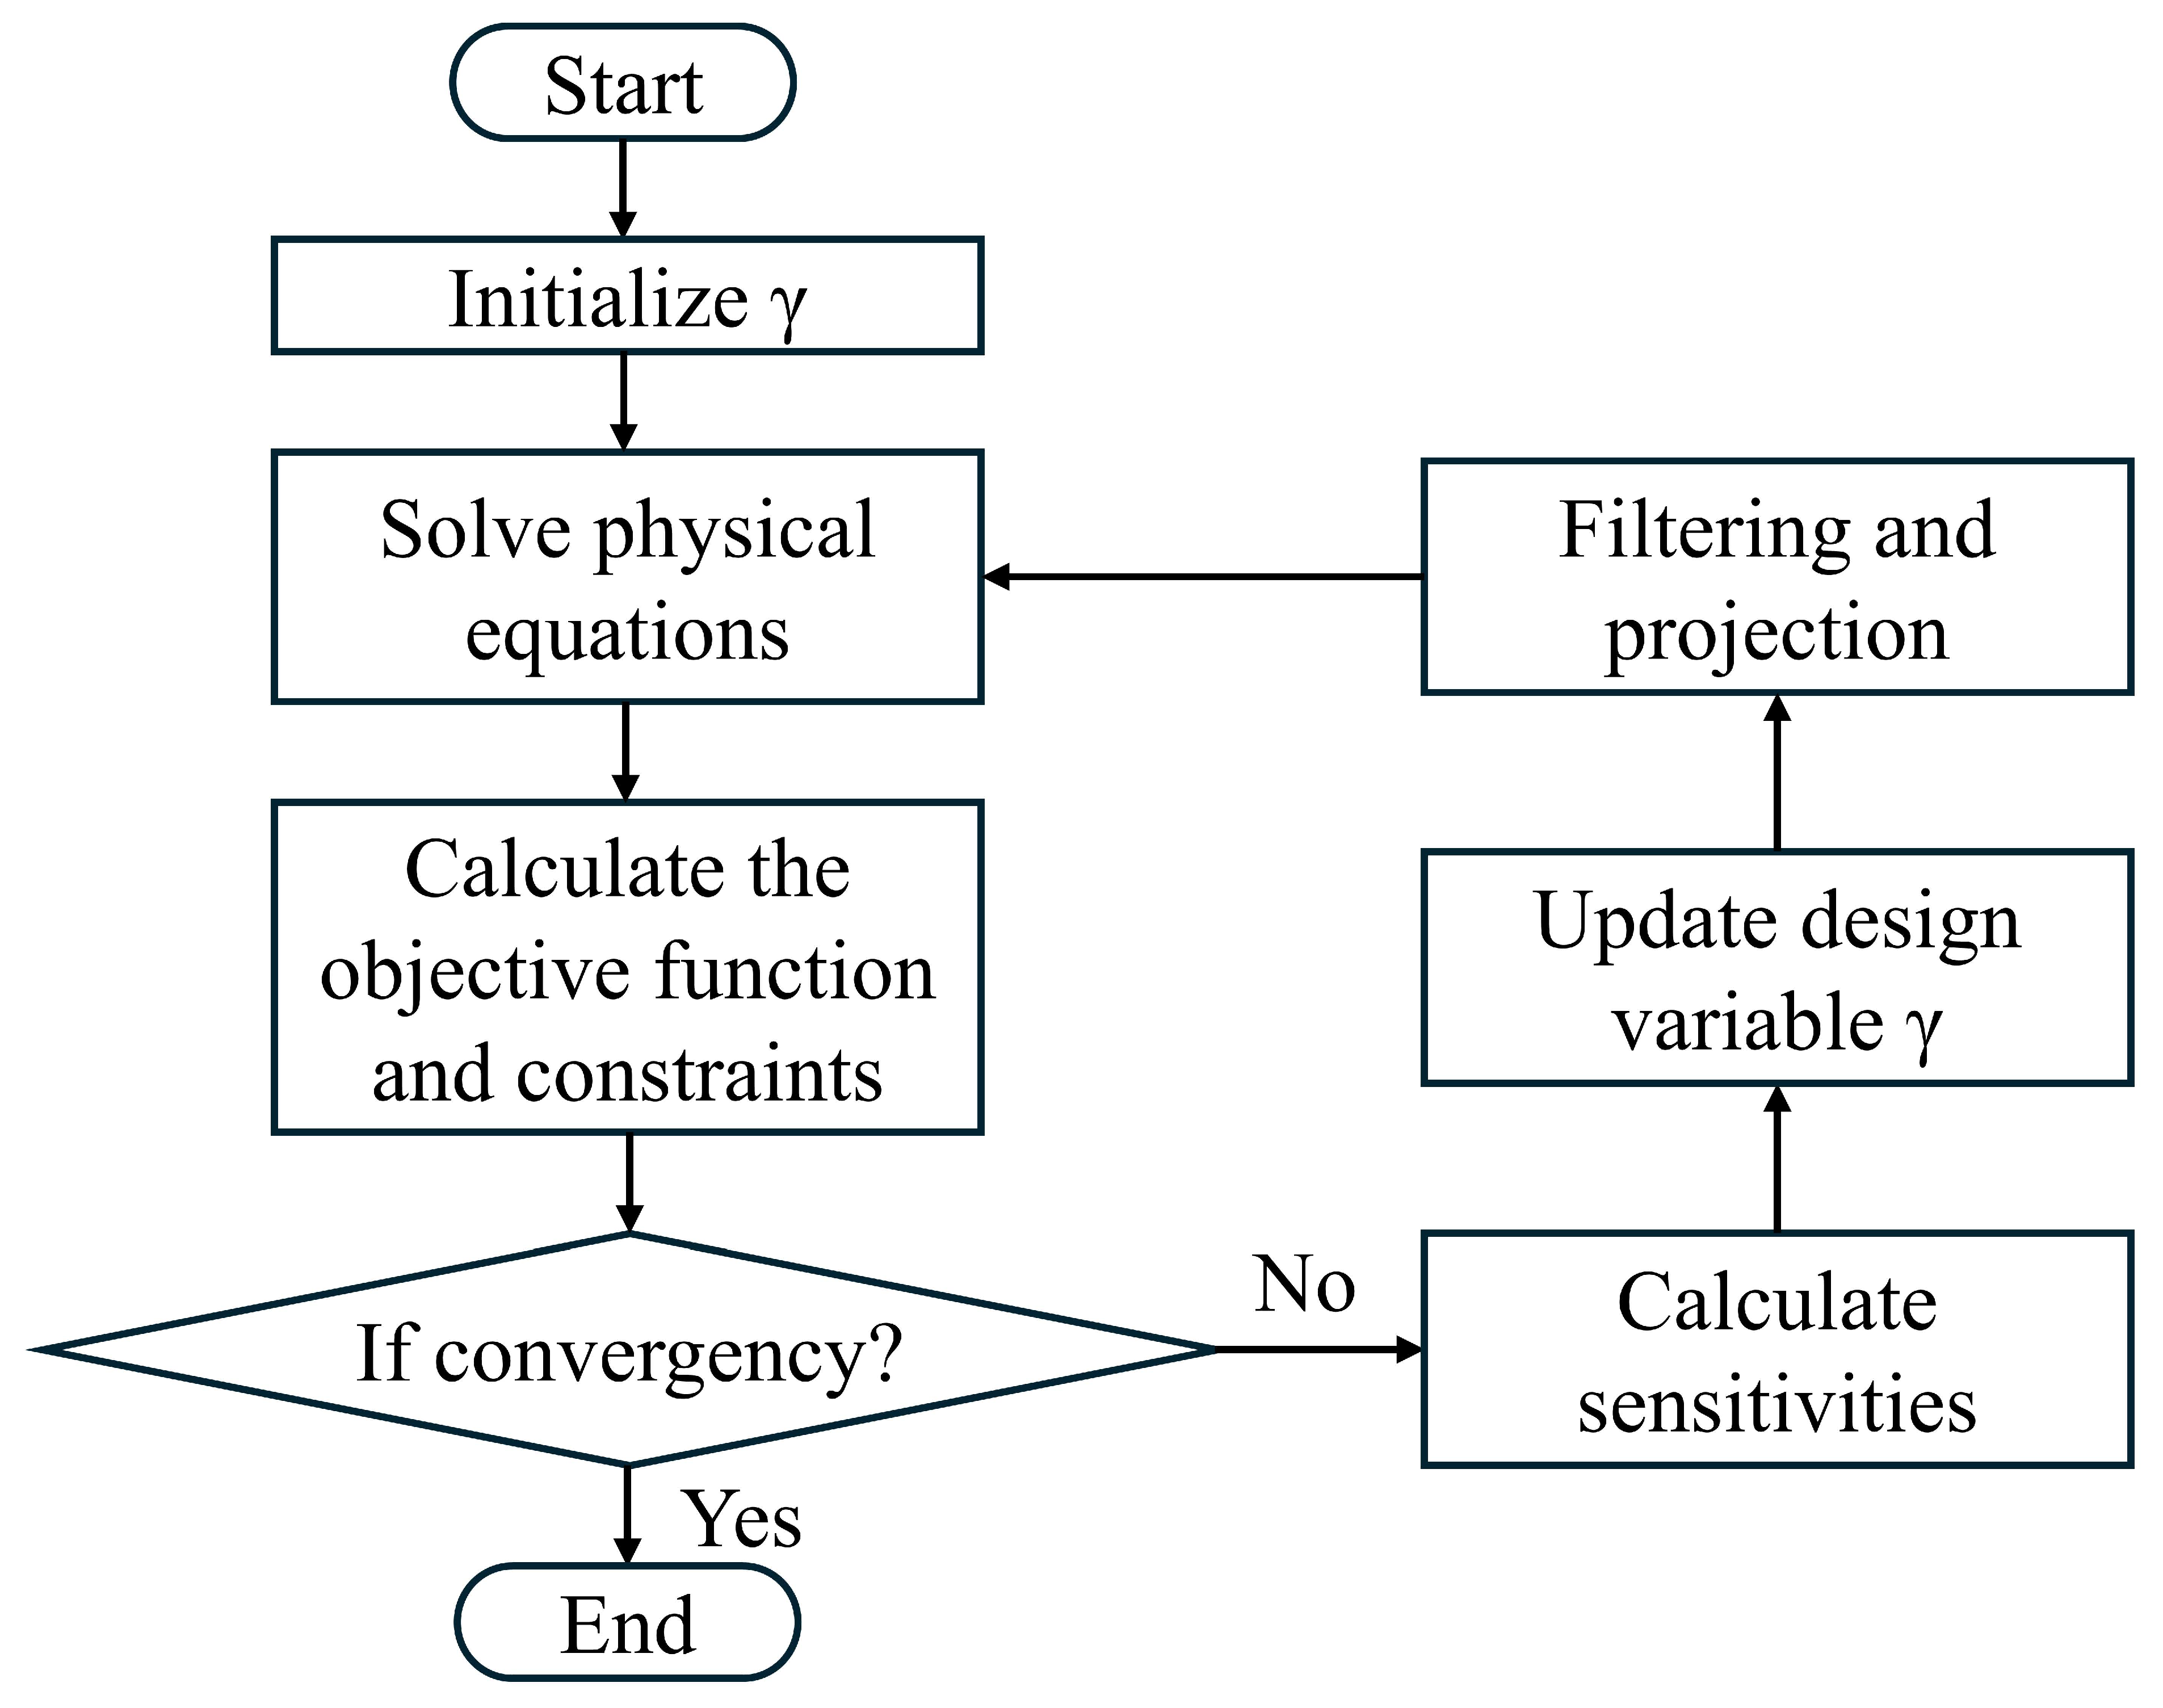
Conventional geometric modifications generally rely on engineering experience and iterative parameter adjustments, which may fail to identify globally optimal flow configurations. In recent years, topology optimization has emerged as a powerful computational design methodology for fluid systems. Unlike traditional size or shape optimization techniques, topology optimization enables material distribution to evolve freely within a prescribed design domain, allowing the automatic generation of non-intuitive flow-guiding structures that are difficult to obtain through conventional engineering intuition [
20].
Since the seminal work of Borrvall and Petersson [
21], density-based topology optimization has become an effective computational design methodology for fluid systems, enabling the automatic generation of optimized flow paths through material redistribution within a prescribed design domain. Olesen et al. [
22] extended the approach to Navier–Stokes flow problems and demonstrated its capability to improve hydraulic performance in fluidic devices. Subsequent developments in topology optimization theory and numerical methods have considerably expanded their applicability to engineering design problems [
23]. More recently, topology optimization has been successfully applied to channel-flow systems [
19], unsteady flow configurations [
24], turbulent flow problems [
25], thermal management devices and heat exchangers [
26], as well as proton-exchange membrane fuel cell flow fields [
27]. These studies have consistently shown that topology optimization can identify non-intuitive flow-guiding structures and achieve substantial reductions in hydraulic losses, offering design solutions that are difficult to obtain through conventional geometric modification and engineering experience alone.
Despite the growing application of topology optimization in fluid engineering, its use in transformer pressure relief valves remains limited. Existing studies have primarily focused on valve actuation and structural design, while the role of internal flow-path configuration in determining transient discharge performance has received comparatively little attention. Therefore, the objective of this study is to investigate the feasibility and effectiveness of applying density-based topology optimization to the internal flow domain of a transformer pressure relief valve. The optimization problem is formulated to minimize hydraulic resistance while preserving the external geometry and functional constraints of the original valve. The topology optimization result is reconstructed into a manufacturable configuration and subsequently evaluated using transient computational fluid dynamics (CFD) simulations. Particular attention is devoted to transient discharge behavior, cumulative venting capacity, pressure evolution, velocity distribution, and flow-field characteristics.
3. Results
3.1. Topology Optimization Result
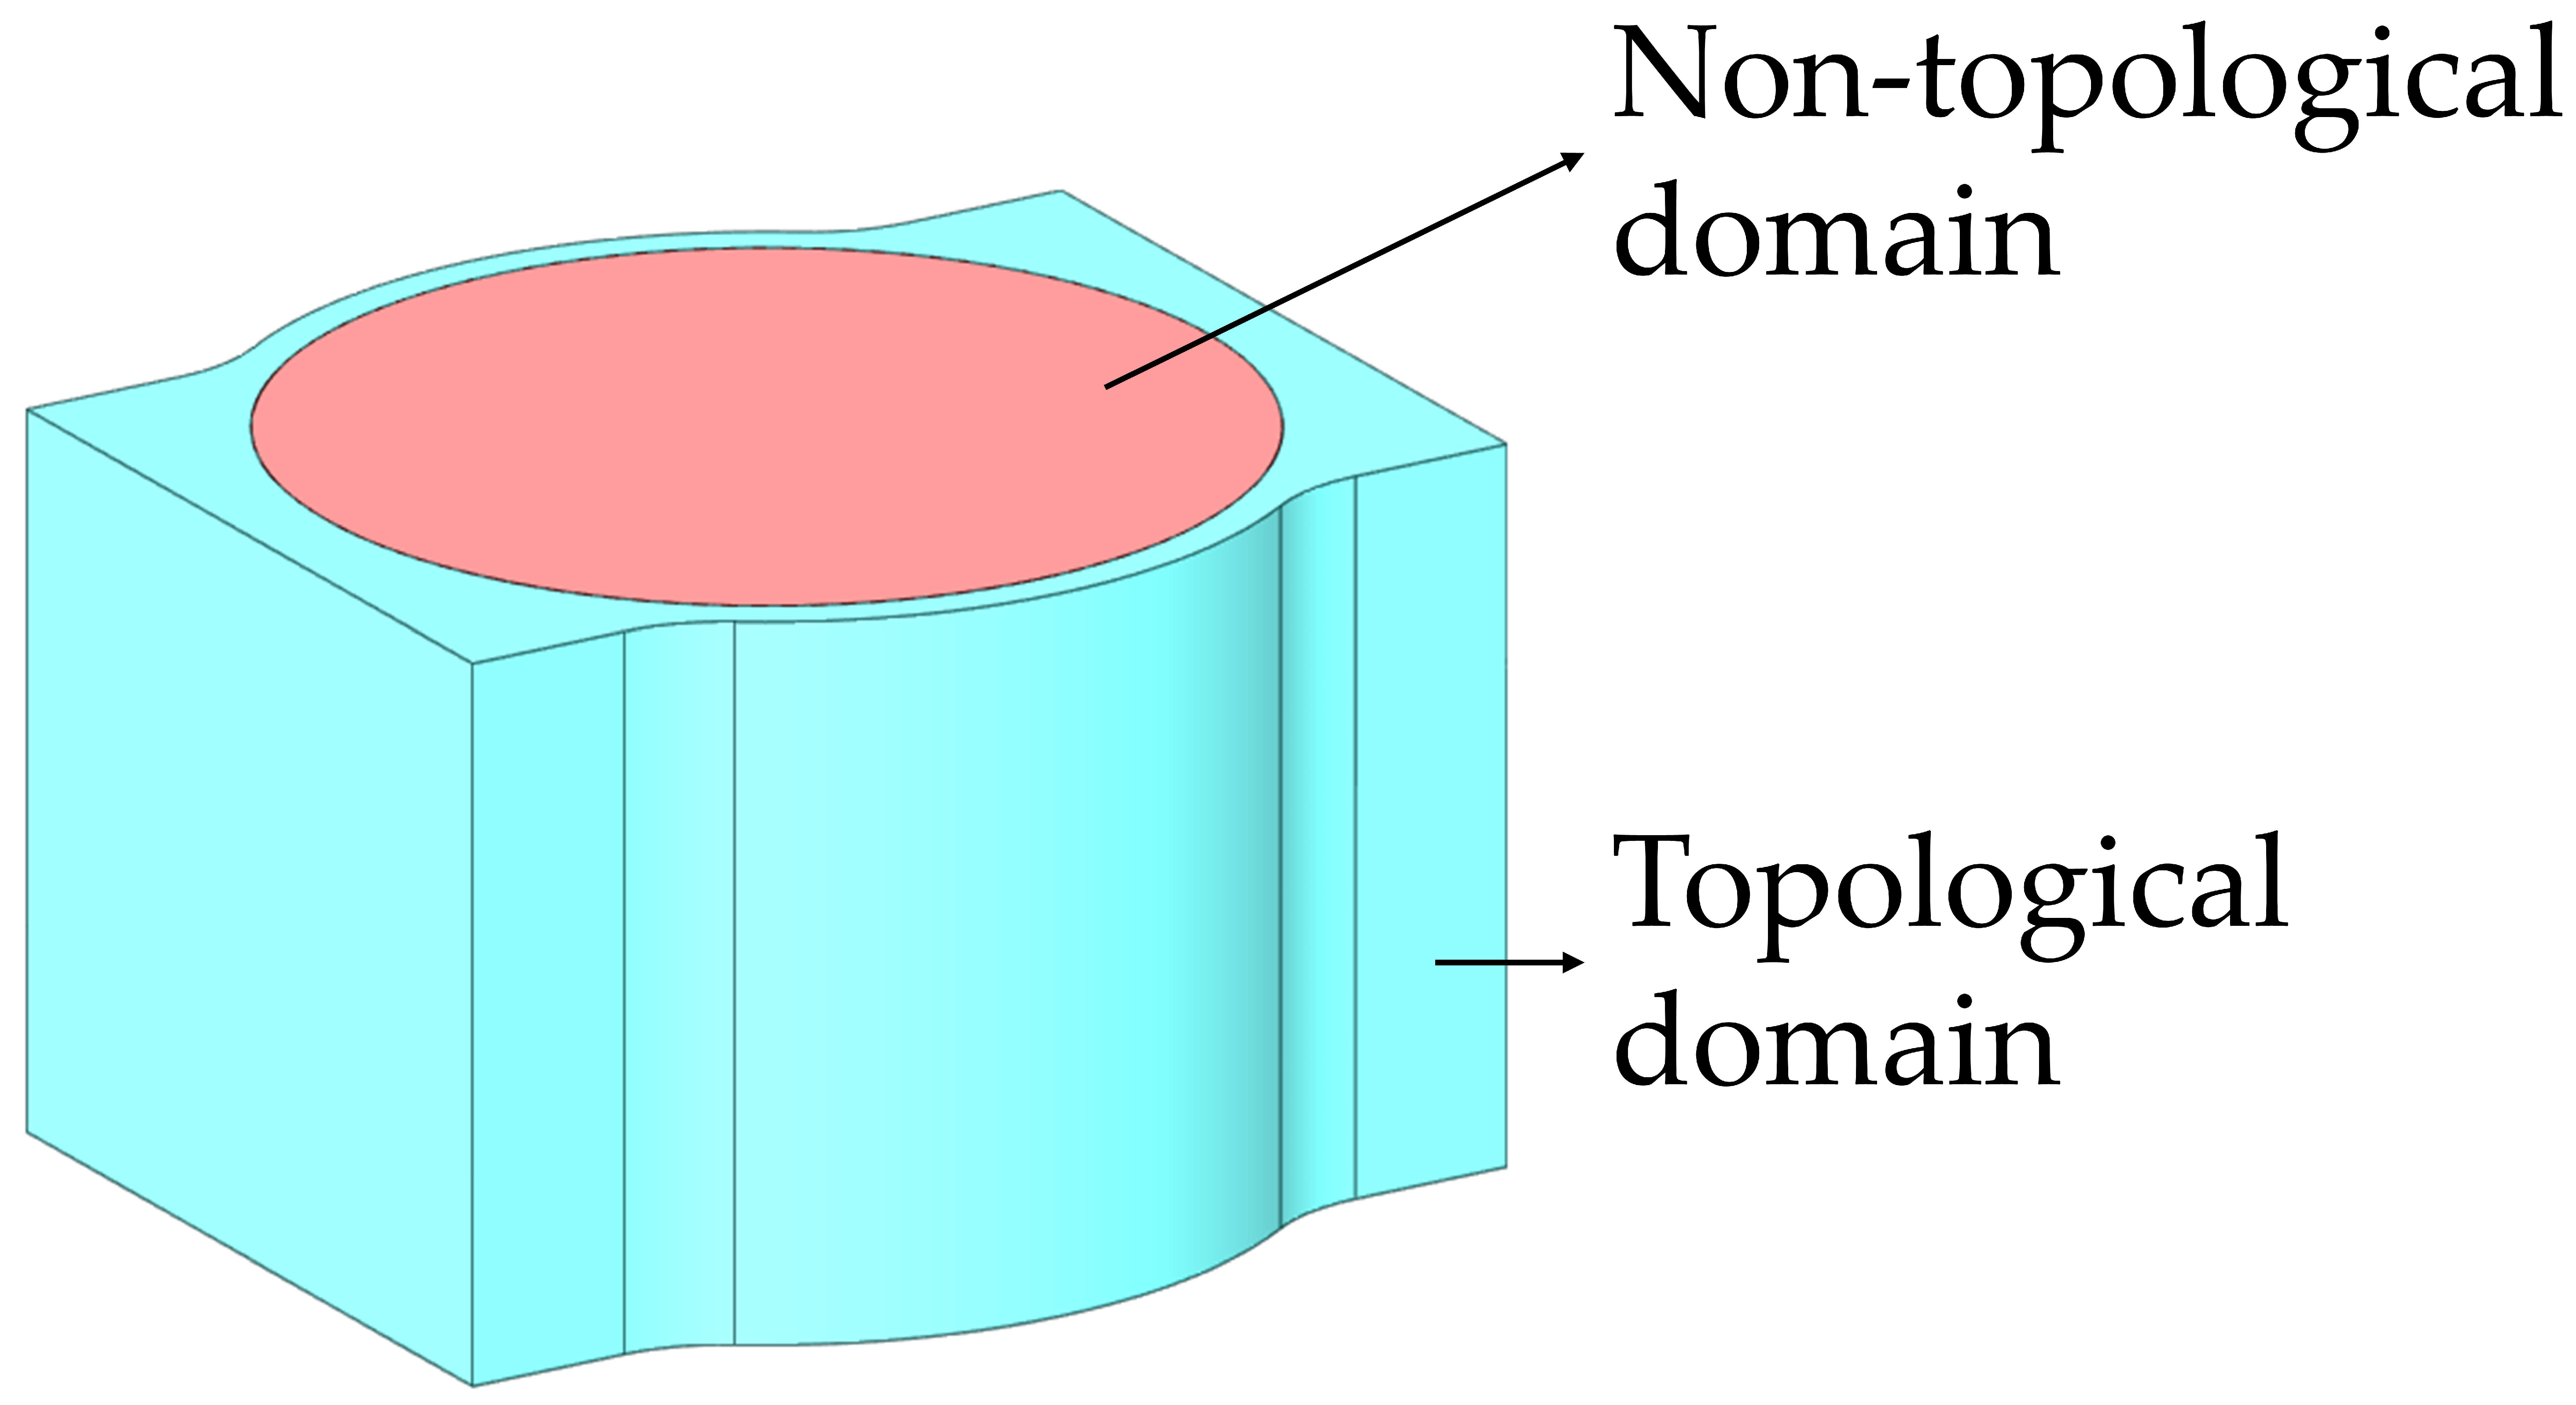
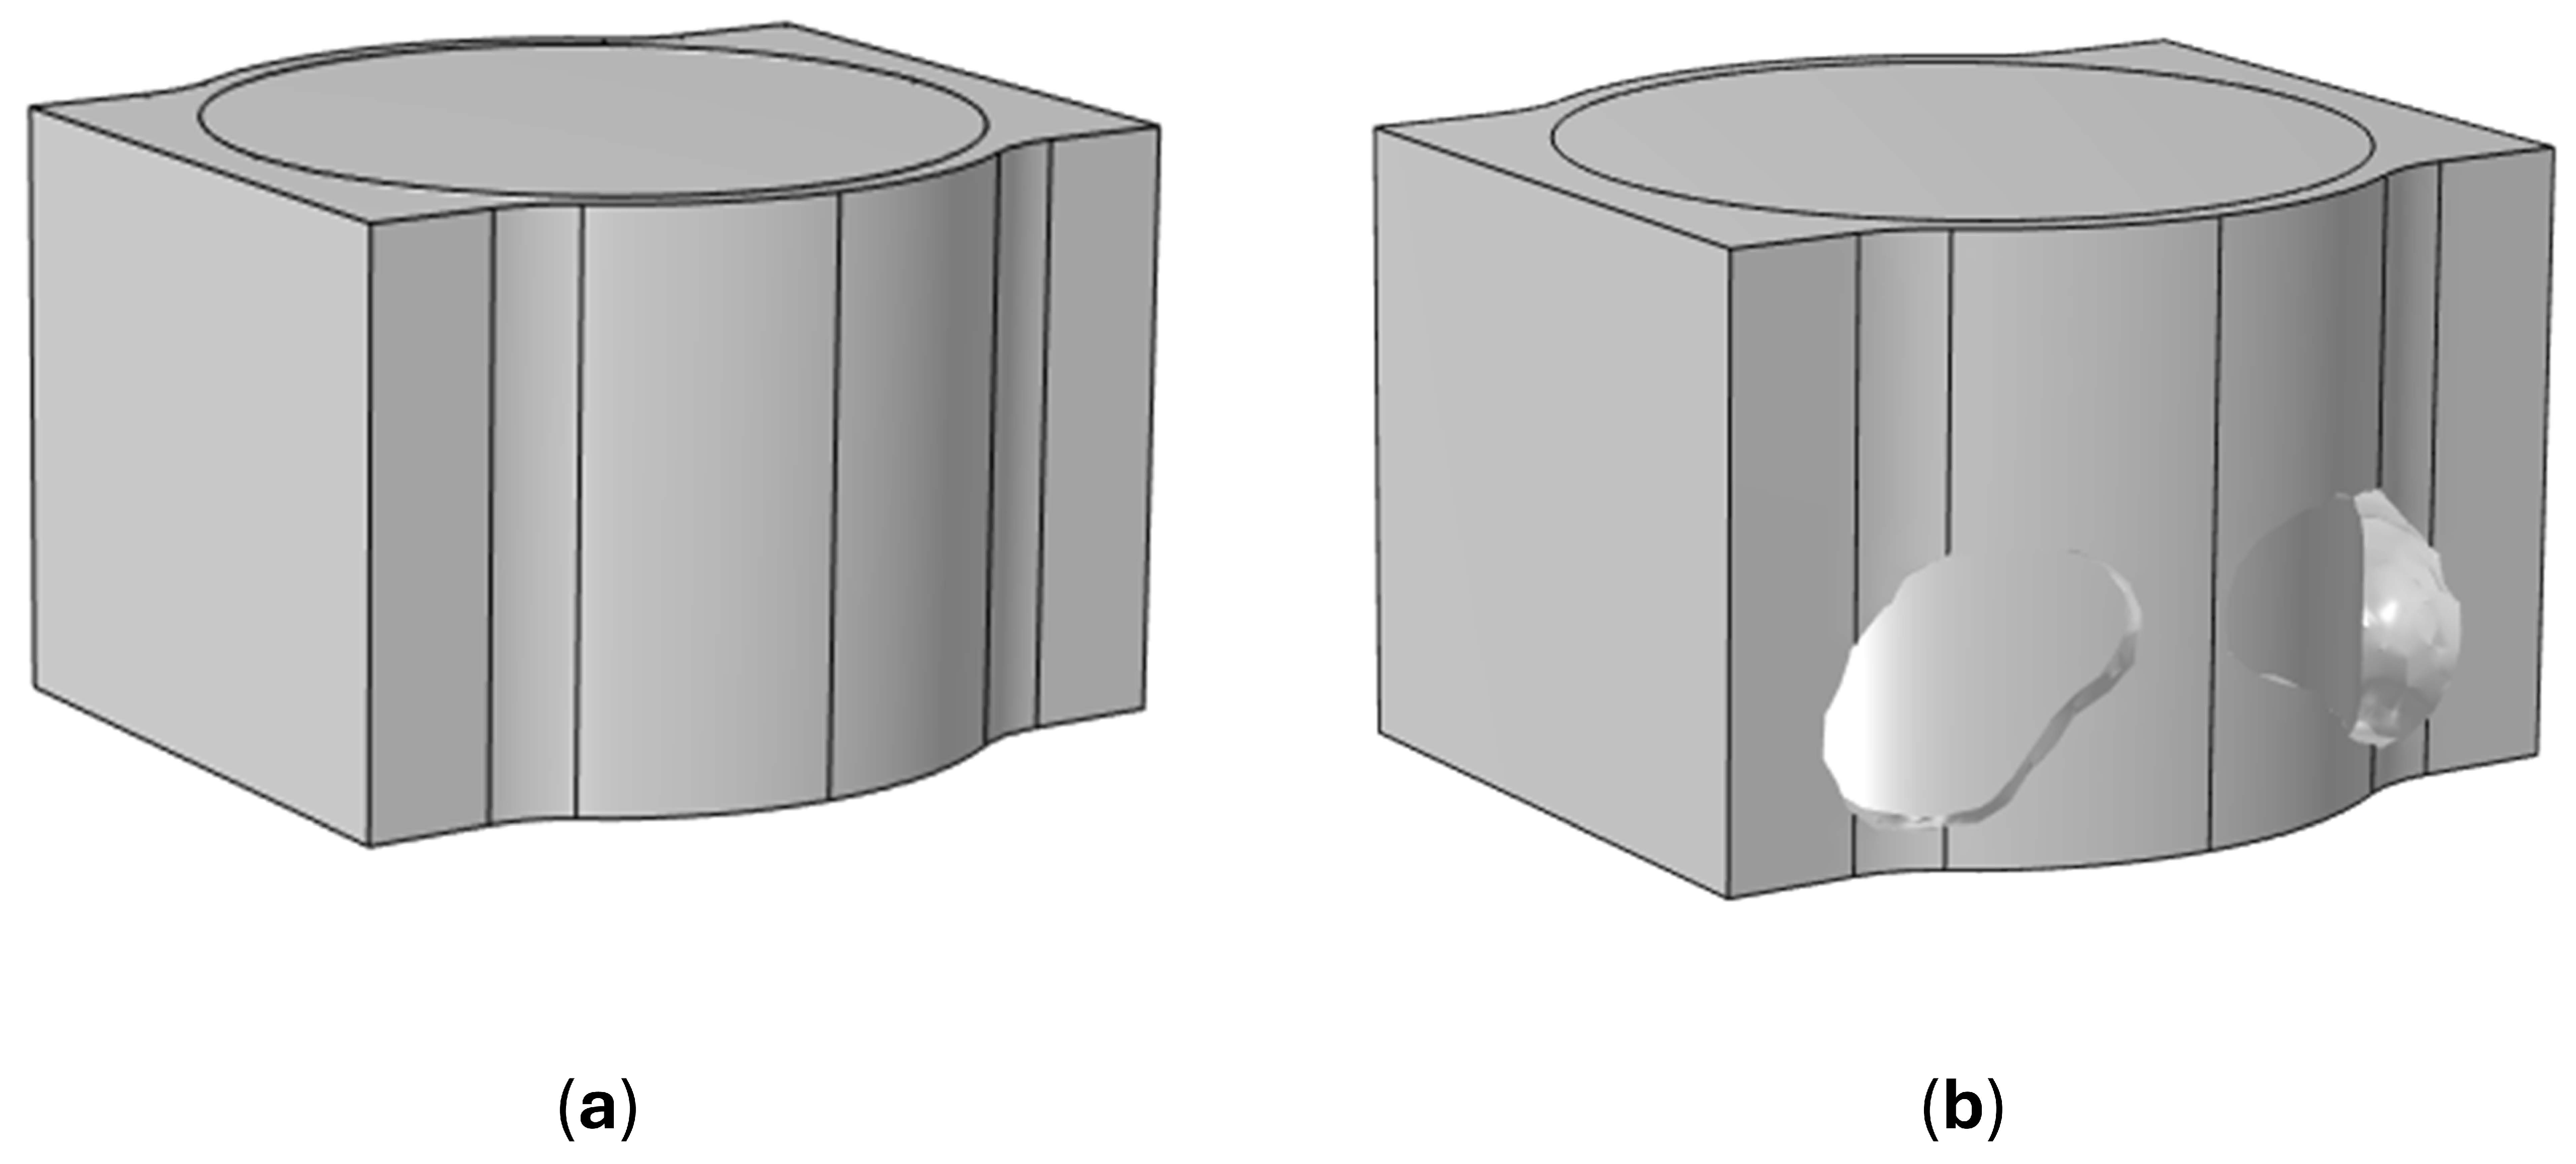
The comparison between the optimized valve flow channel and the original prototype is presented in
Figure 4. To eliminate the influence of intermediate density values, a thresholding operation is applied to the optimized design field based on a commonly used criterion in topology optimization. A threshold value of
is adopted, where regions with
are classified as solid, and regions with
are identified as fluid.
It should be noted that the additional solid regions generated in the optimized flow domain do not represent defects or unnecessary blockages. Instead, they result from the material redistribution process during topology optimization. Although the fluid domain is locally reduced, these regions generally correspond to areas with lower contribution to the optimization objective. The resulting redistribution of the flow domain modifies the internal flow path and provides additional flow guidance toward the outlet.
In practical engineering applications, the topology optimization result is considered a conceptual flow-guiding design rather than a directly manufactured geometry. In the present study, the optimized flow configuration can be implemented by modifying the internal wall surface of the valve housing while maintaining the original external dimensions and functional components. The corresponding solid features may be introduced through local material addition, machining, or integrated manufacturing approaches. Therefore, the optimized topology provides a feasible reference for improving the internal flow configuration of transformer pressure relief valves without requiring fundamental modifications to the existing valve structure.
3.2. CFD Numerical Methodology
Both models were simulated under identical operating conditions to ensure a reliable comparison. The internal flow was treated as an incompressible turbulent flow, and the Reynolds-averaged Navier–Stokes (RANS) approach was adopted. The standard turbulence model was employed to describe the turbulent characteristics of the discharge process. Although more advanced turbulence models, such as SST , Reynolds stress models (RSMs), and large eddy simulation (LES), can provide improved predictions for near-wall effects, turbulence anisotropy, or large-scale unsteady vortex structures, they require higher computational costs and stricter mesh requirements. Since the objective of this study is to compare the relative performance difference between the original and topology-optimized valve designs under identical transient conditions, the standard model was selected as a compromise between computational efficiency and prediction capability for engineering applications.
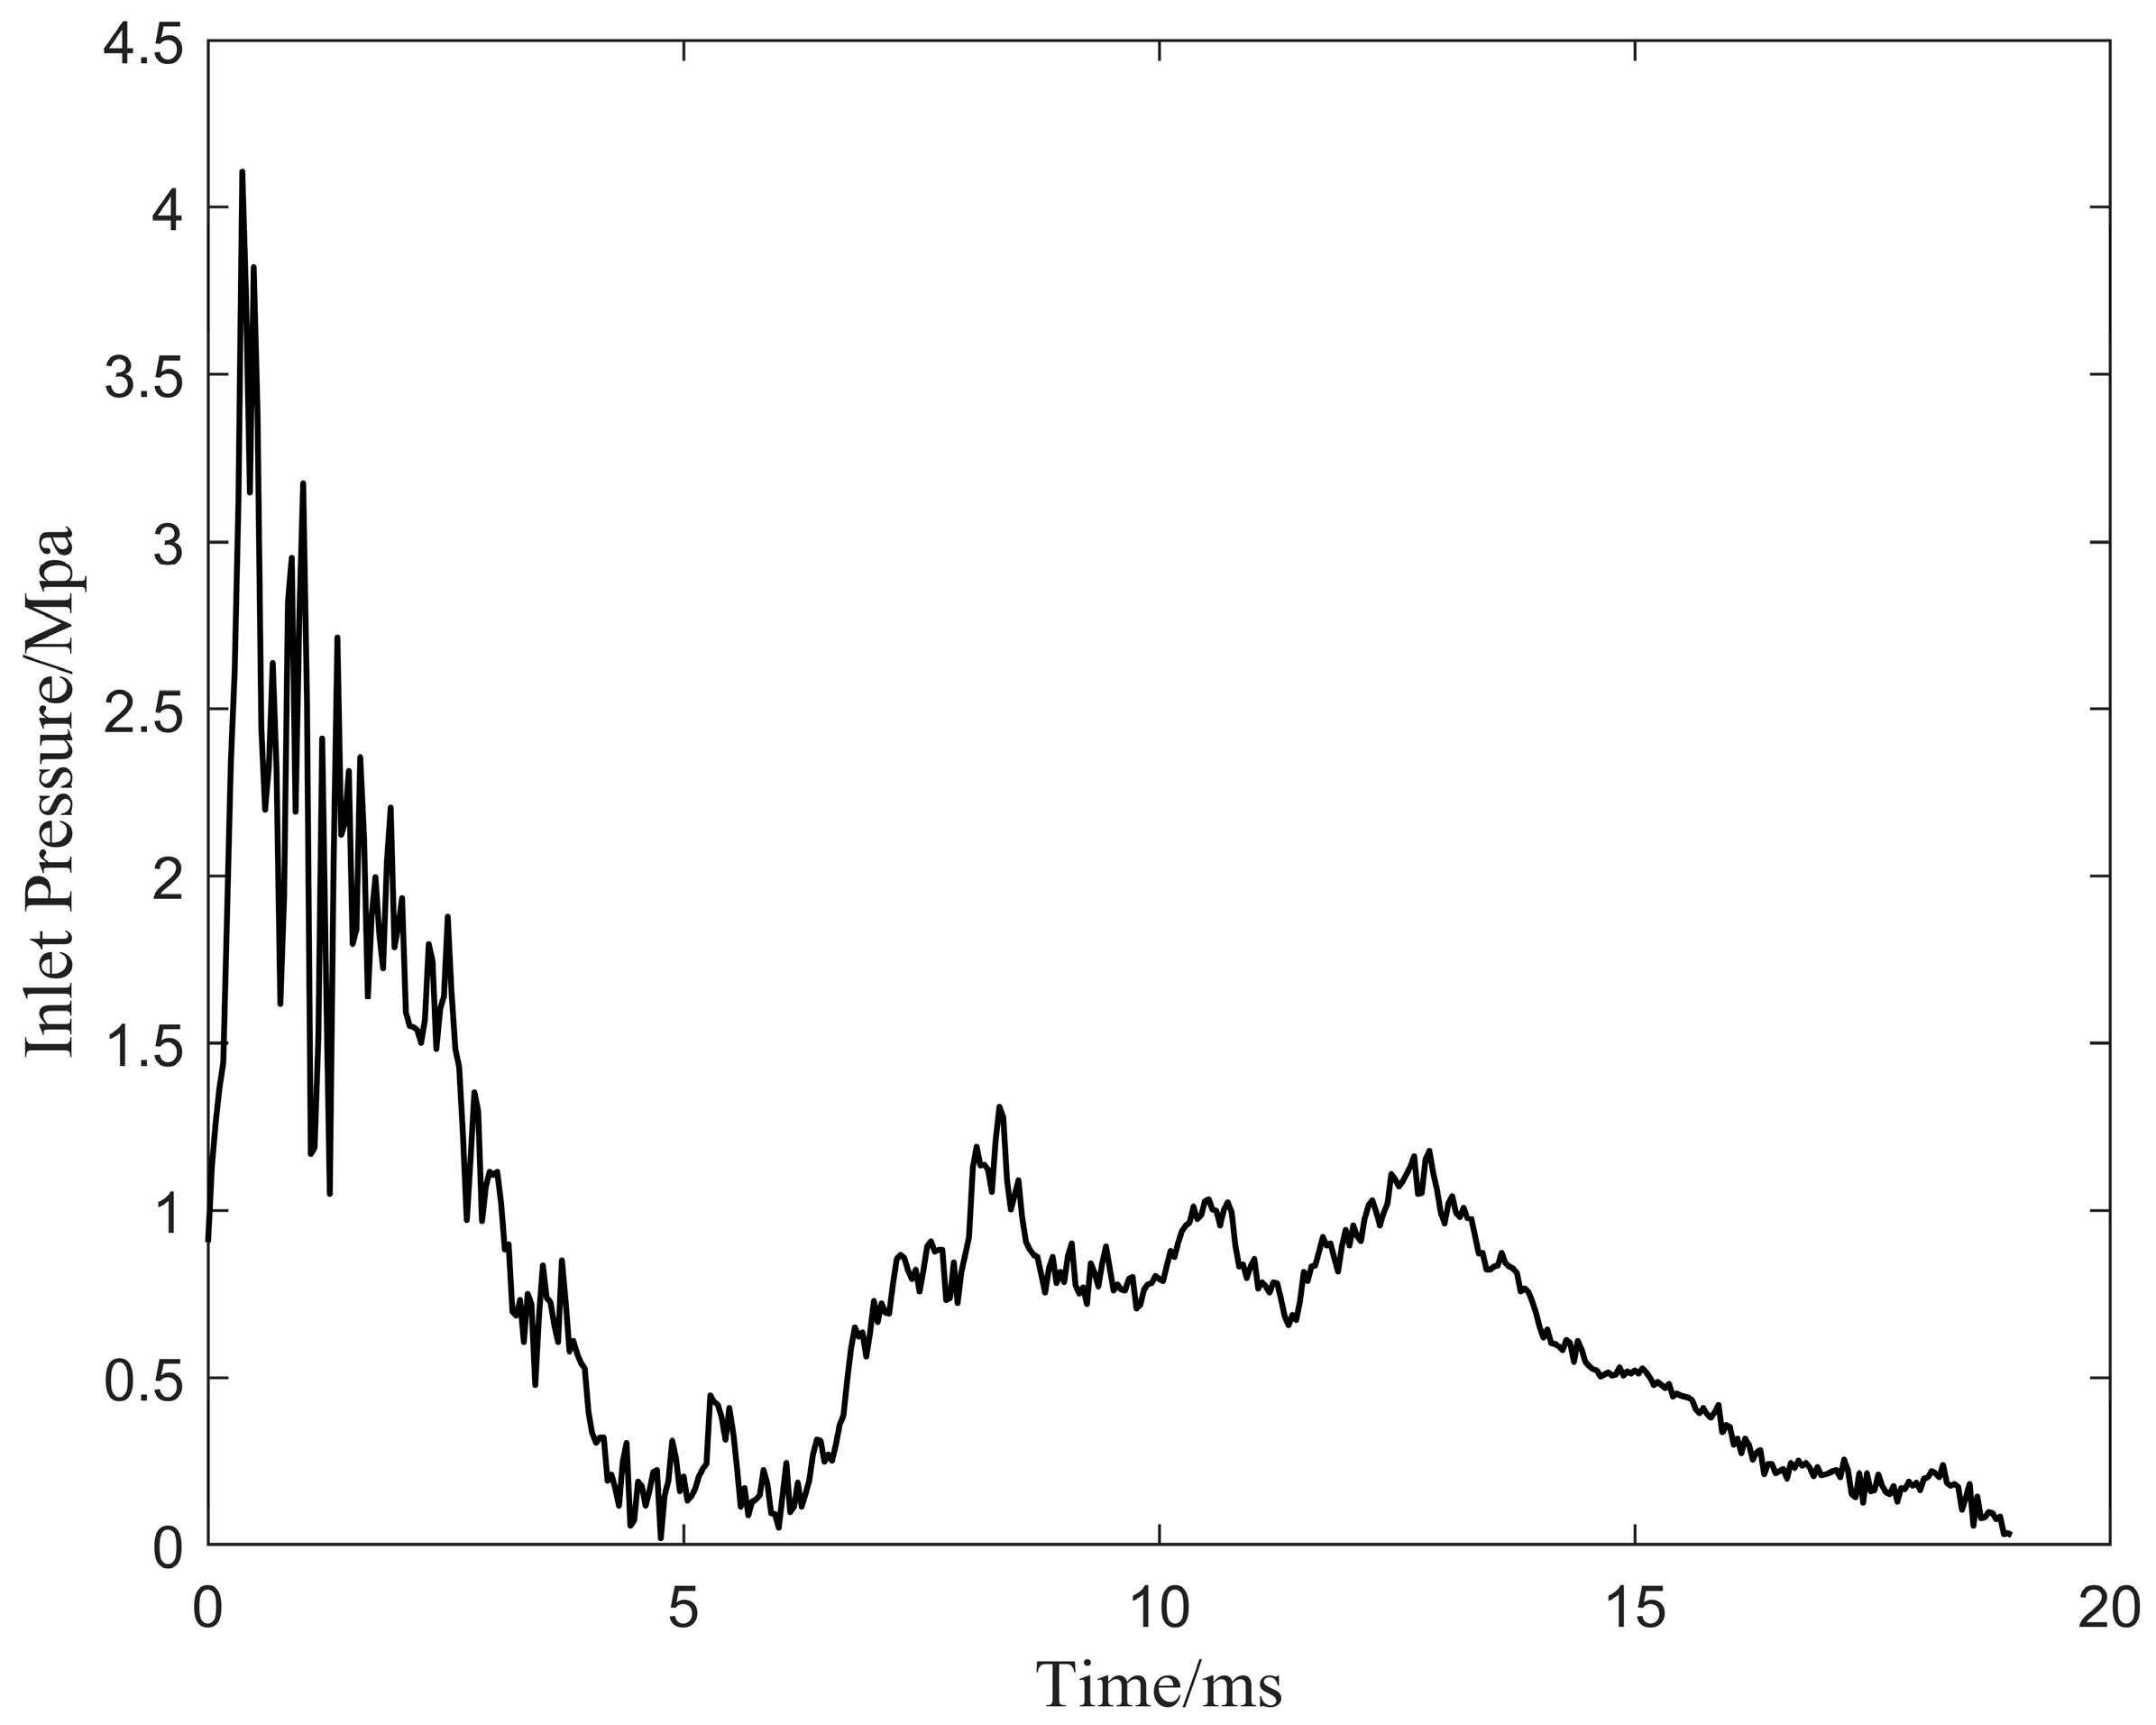
The bottom face of the valve base was defined as the inlet with a prescribed pressure load, as illustrated in
Figure 5. The inlet pressure profile was obtained from the 6 MJ transformer arcing experiment of the prototype valve, thereby representing the actual pressure variation during an internal fault event. The outlet boundaries were defined as pressure outlets, and all solid surfaces were treated as stationary no-slip walls. The valve plate was fixed at its maximum opening position because the opening duration of the valve plate is much shorter than the discharge period investigated in this study. In addition, components including the signal rod, connecting rods, and springs were neglected because their influence on the internal flow field was considered negligible.
The simulations were performed using a pressure-based solver with a transient formulation. The SIMPLE algorithm was applied for pressure–velocity coupling. Second-order upwind discretization schemes were adopted for the momentum equation, turbulent kinetic energy equation, and turbulent dissipation rate equation. The convergence criterion was defined as residual values below for the continuity, momentum, turbulent kinetic energy, and turbulent dissipation rate equations. The working fluid was transformer insulating oil with a density of 885.6 kg/m3 and a kinematic viscosity of 9.64 mm2/s. A time step of 0.04 ms was employed to capture the rapid pressure variation during the discharge process.
A grid independence study was performed to evaluate the influence of mesh resolution on the numerical results. Three mesh resolutions were generated for both the original and optimized valve models. As summarized in
Table 1, the differences between the medium and fine meshes were 0.21% for the original valve and 0.12% for the optimized valve compared with the medium mesh results, respectively. These small variations indicate that the predicted discharge performance is nearly independent of mesh resolution. Therefore, fine meshes containing approximately 0.8 million cells were selected for the subsequent CFD analysis to achieve a balance between computational accuracy and efficiency.
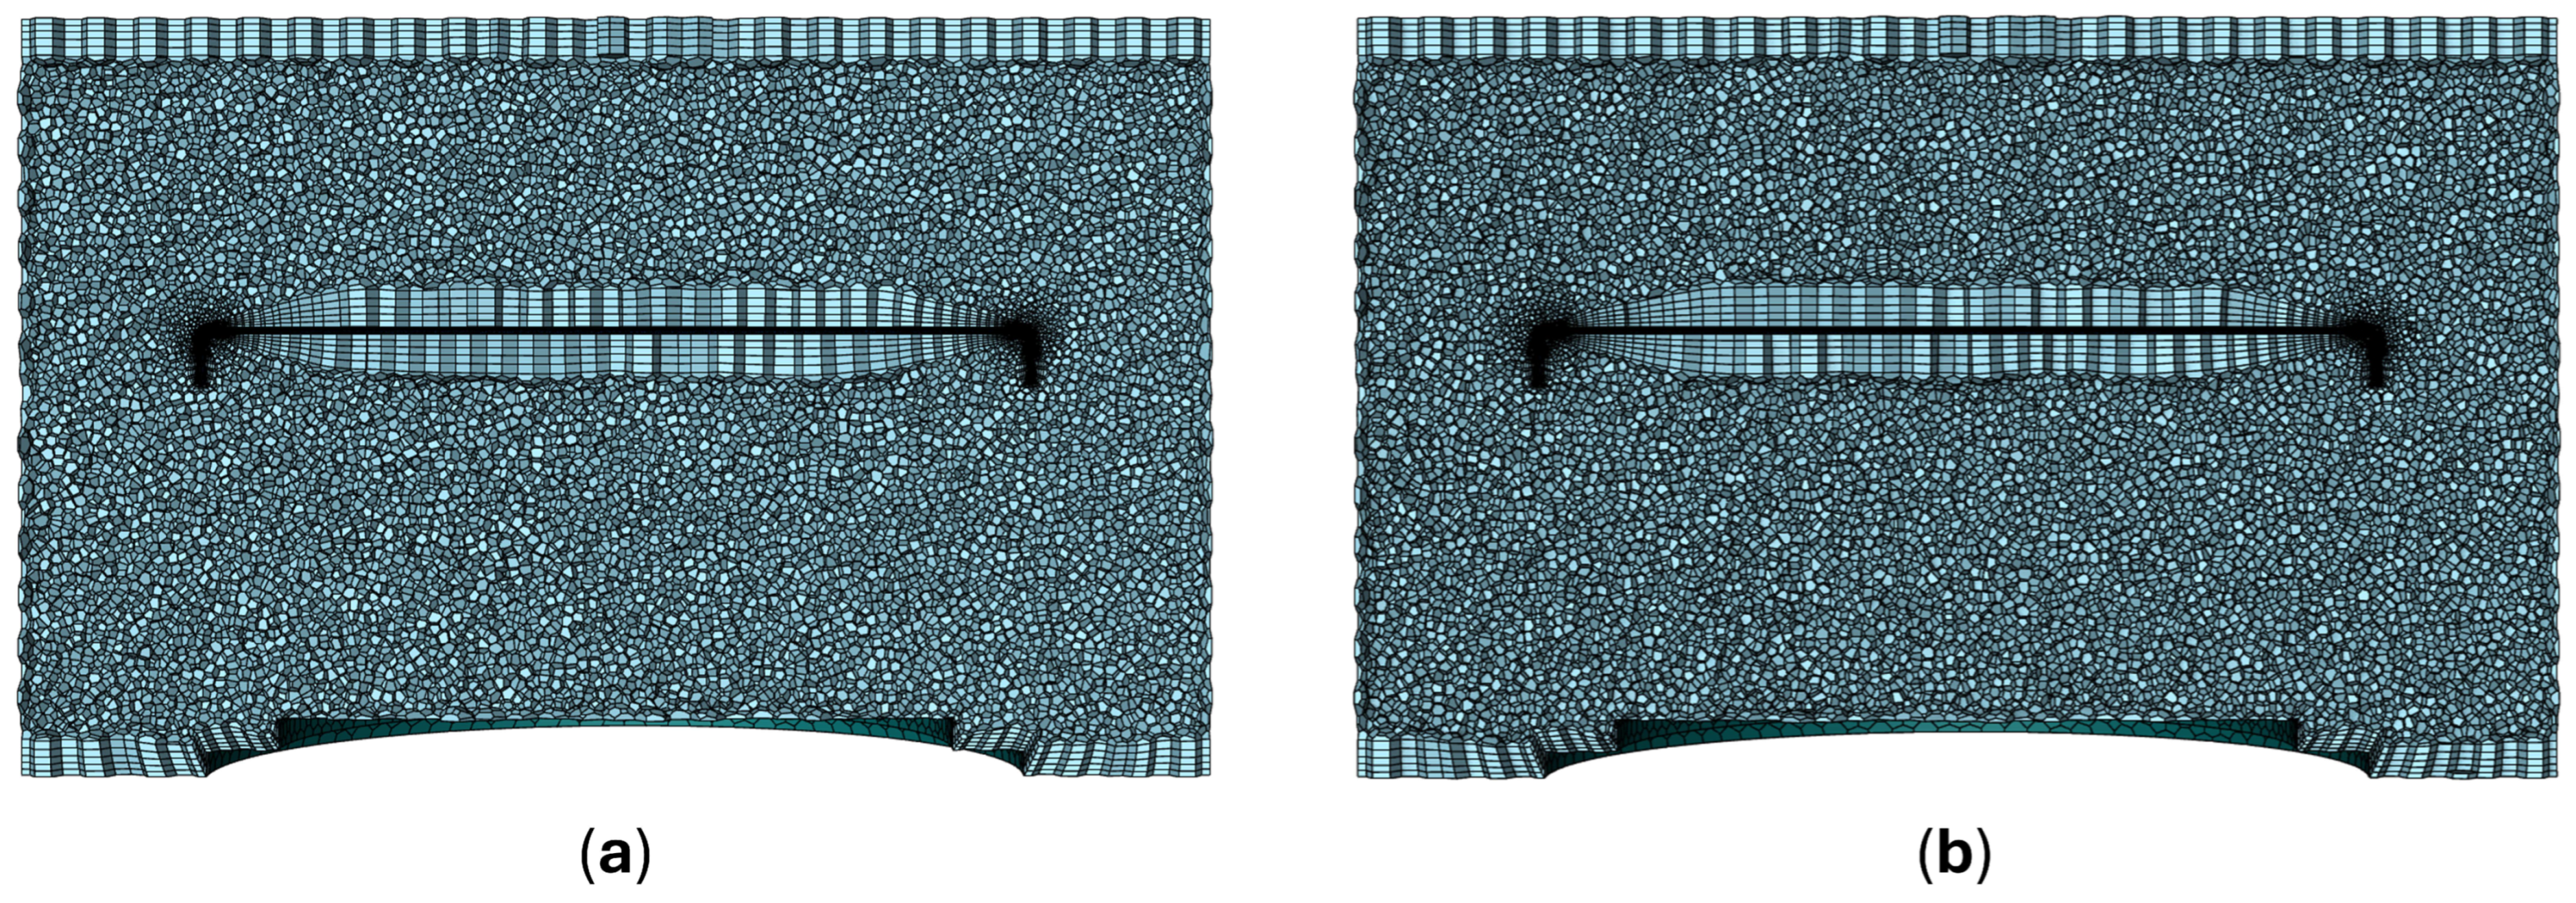
For the selected fine meshes, the original and optimized valve models contained approximately 0.78 million and 0.85 million cells, respectively. Both fluid domains were discretized using polyhedral elements with an average size of 3.5 mm, and five layers of inflation mesh were applied around the valve plate to better capture the near-wall flow characteristics, as shown in
Figure 6. The cell orthogonal quality values of the two meshes were 0.950 and 0.942, respectively, indicating that the generated meshes possess good quality and are suitable for the subsequent transient CFD simulations.
3.3. Transient Discharge Performance
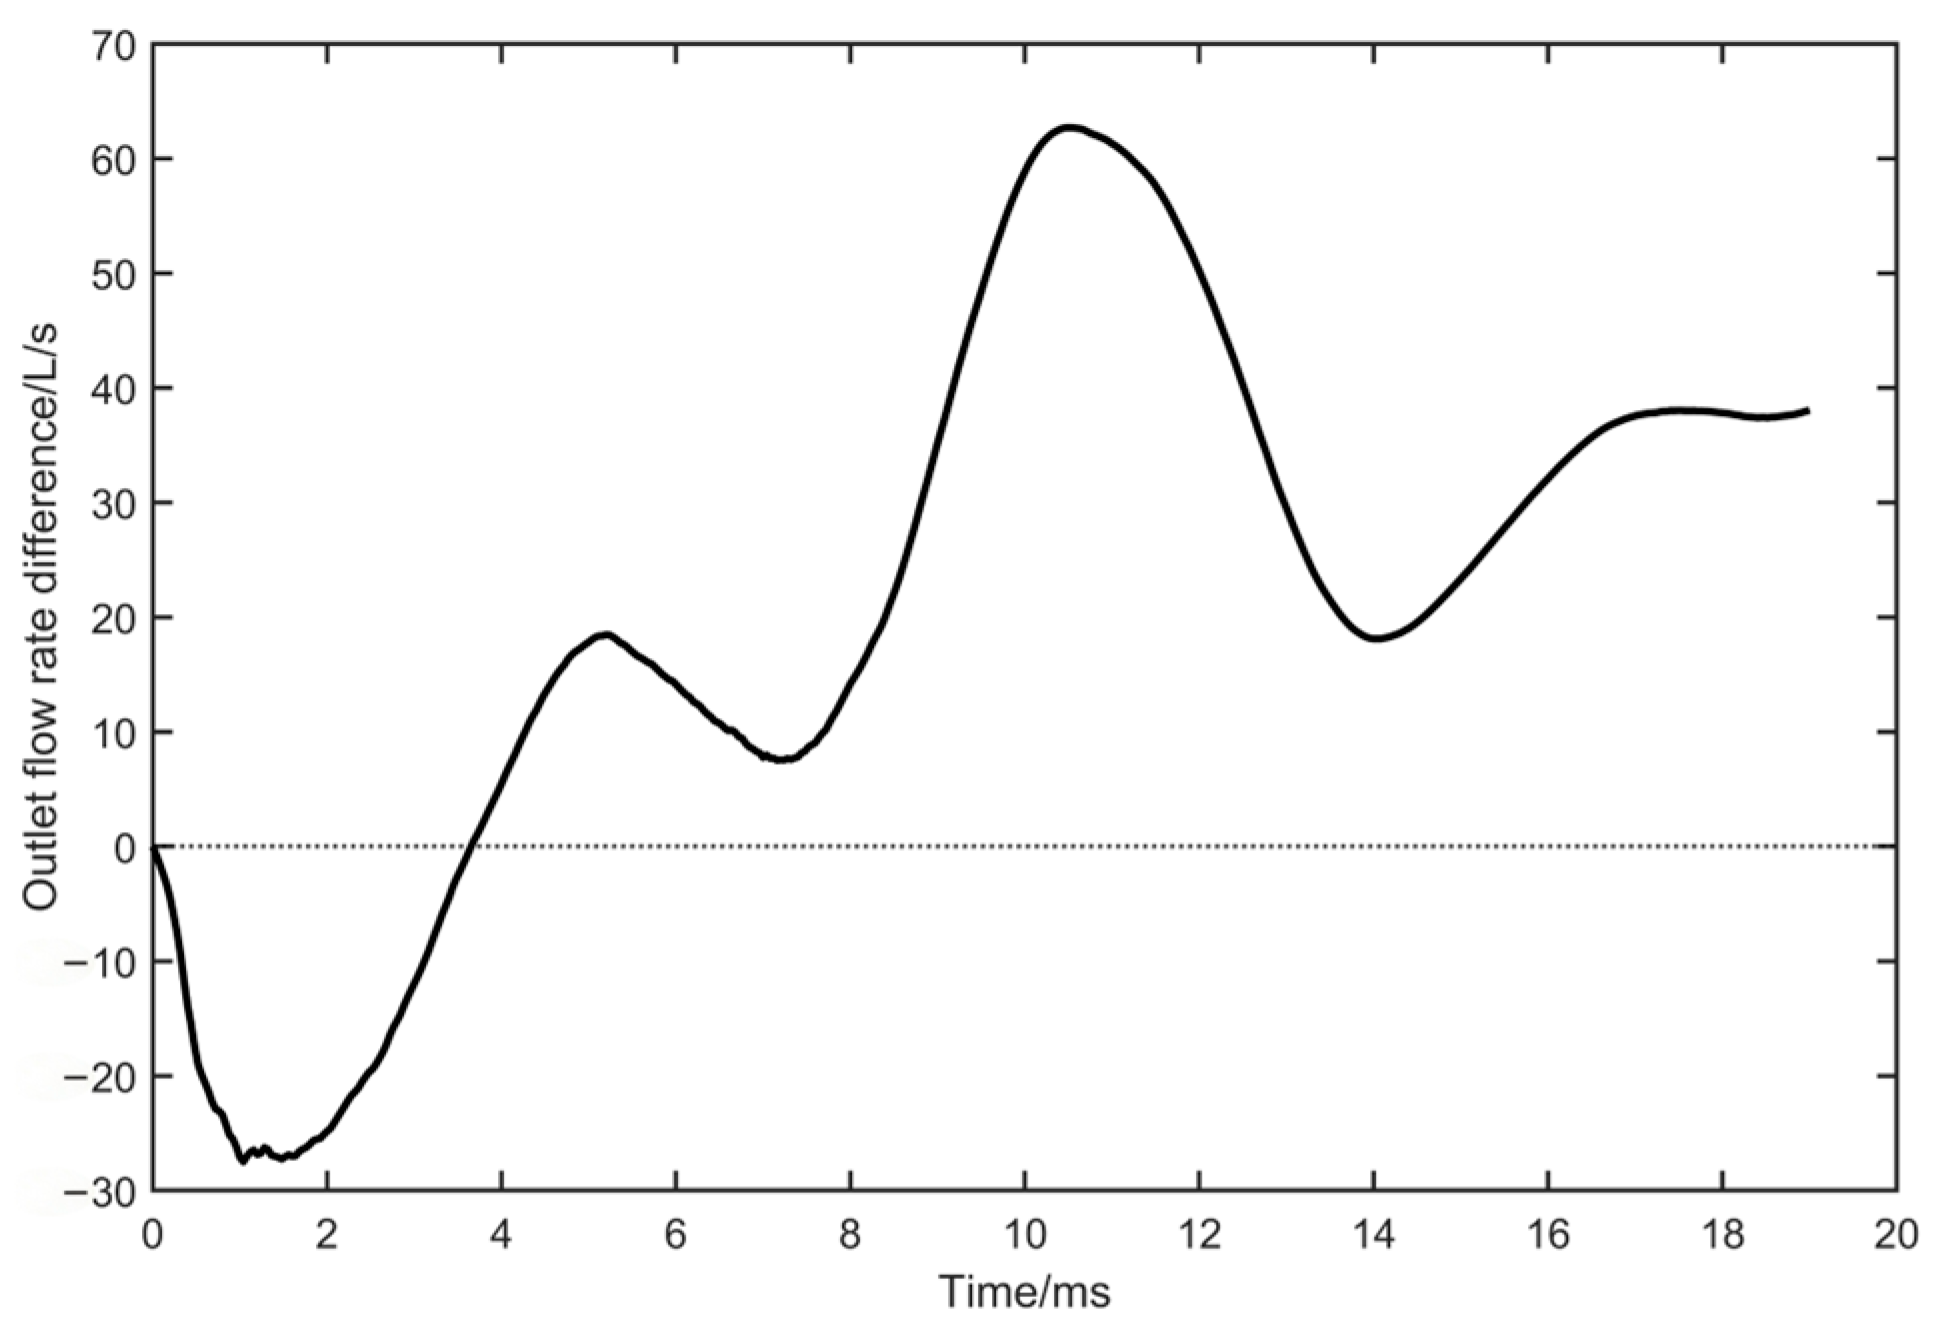
Figure 7 shows the outlet flow rate difference between the two valves. At the initial stage of discharge, the original valve exhibits a slightly higher outlet flow rate than the optimized valve. This difference may be attributed to the early-stage development of the transient flow field, where the effect of the optimized internal flow configuration on the discharge process is not yet fully reflected. After approximately 3.5 ms, the outlet flow rate of the topology-optimized valve becomes higher than that of the original configuration and remains higher throughout the subsequent discharge process.
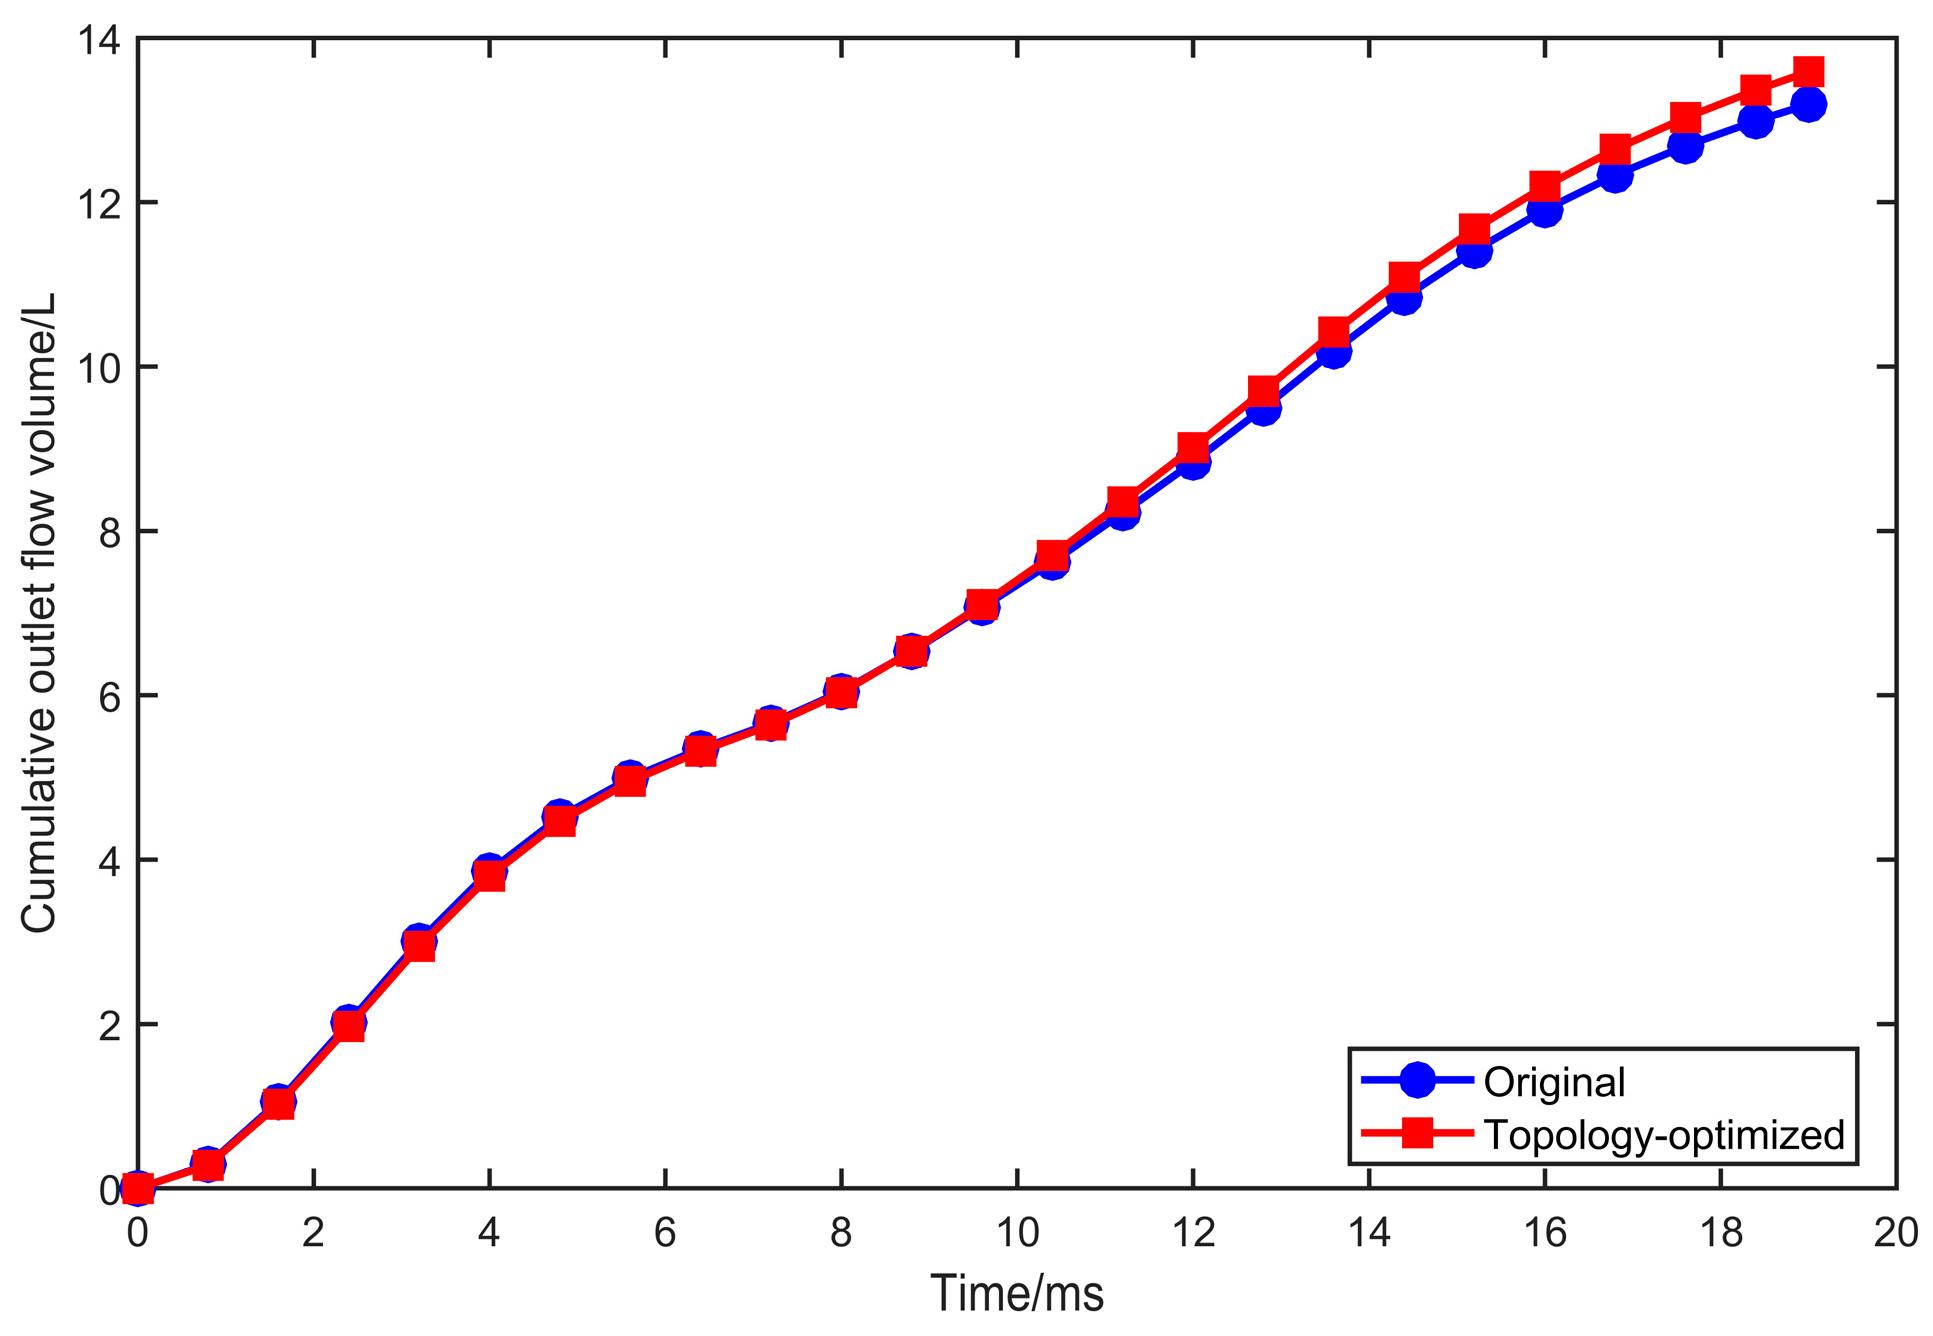
Figure 8 presents the cumulative discharged volume of the two valves under identical transient pressure boundary conditions. The original valve achieves a total discharged volume of 13.219 L, whereas the topology-optimized valve reaches 13.601 L at the end of the discharge period. This corresponds to an improvement of approximately 3% in cumulative discharge capacity. The increased cumulative discharge volume indicates that the optimized internal flow configuration enhances the transient discharge performance of the valve.
3.4. Pressure Field Characteristics
Pressure distribution is one of the primary indicators for evaluating the hydraulic performance of a pressure relief valve. During the discharge process, the pressure difference between the inlet and outlet provides the driving force for fluid transport. Excessive local pressure accumulation usually indicates increased flow resistance and inefficient pressure-energy conversion, while severe low-pressure regions may be associated with flow separation and hydraulic losses. Therefore, analysis of the pressure field provides insight into the effectiveness of the internal flow path in utilizing the available pressure potential.
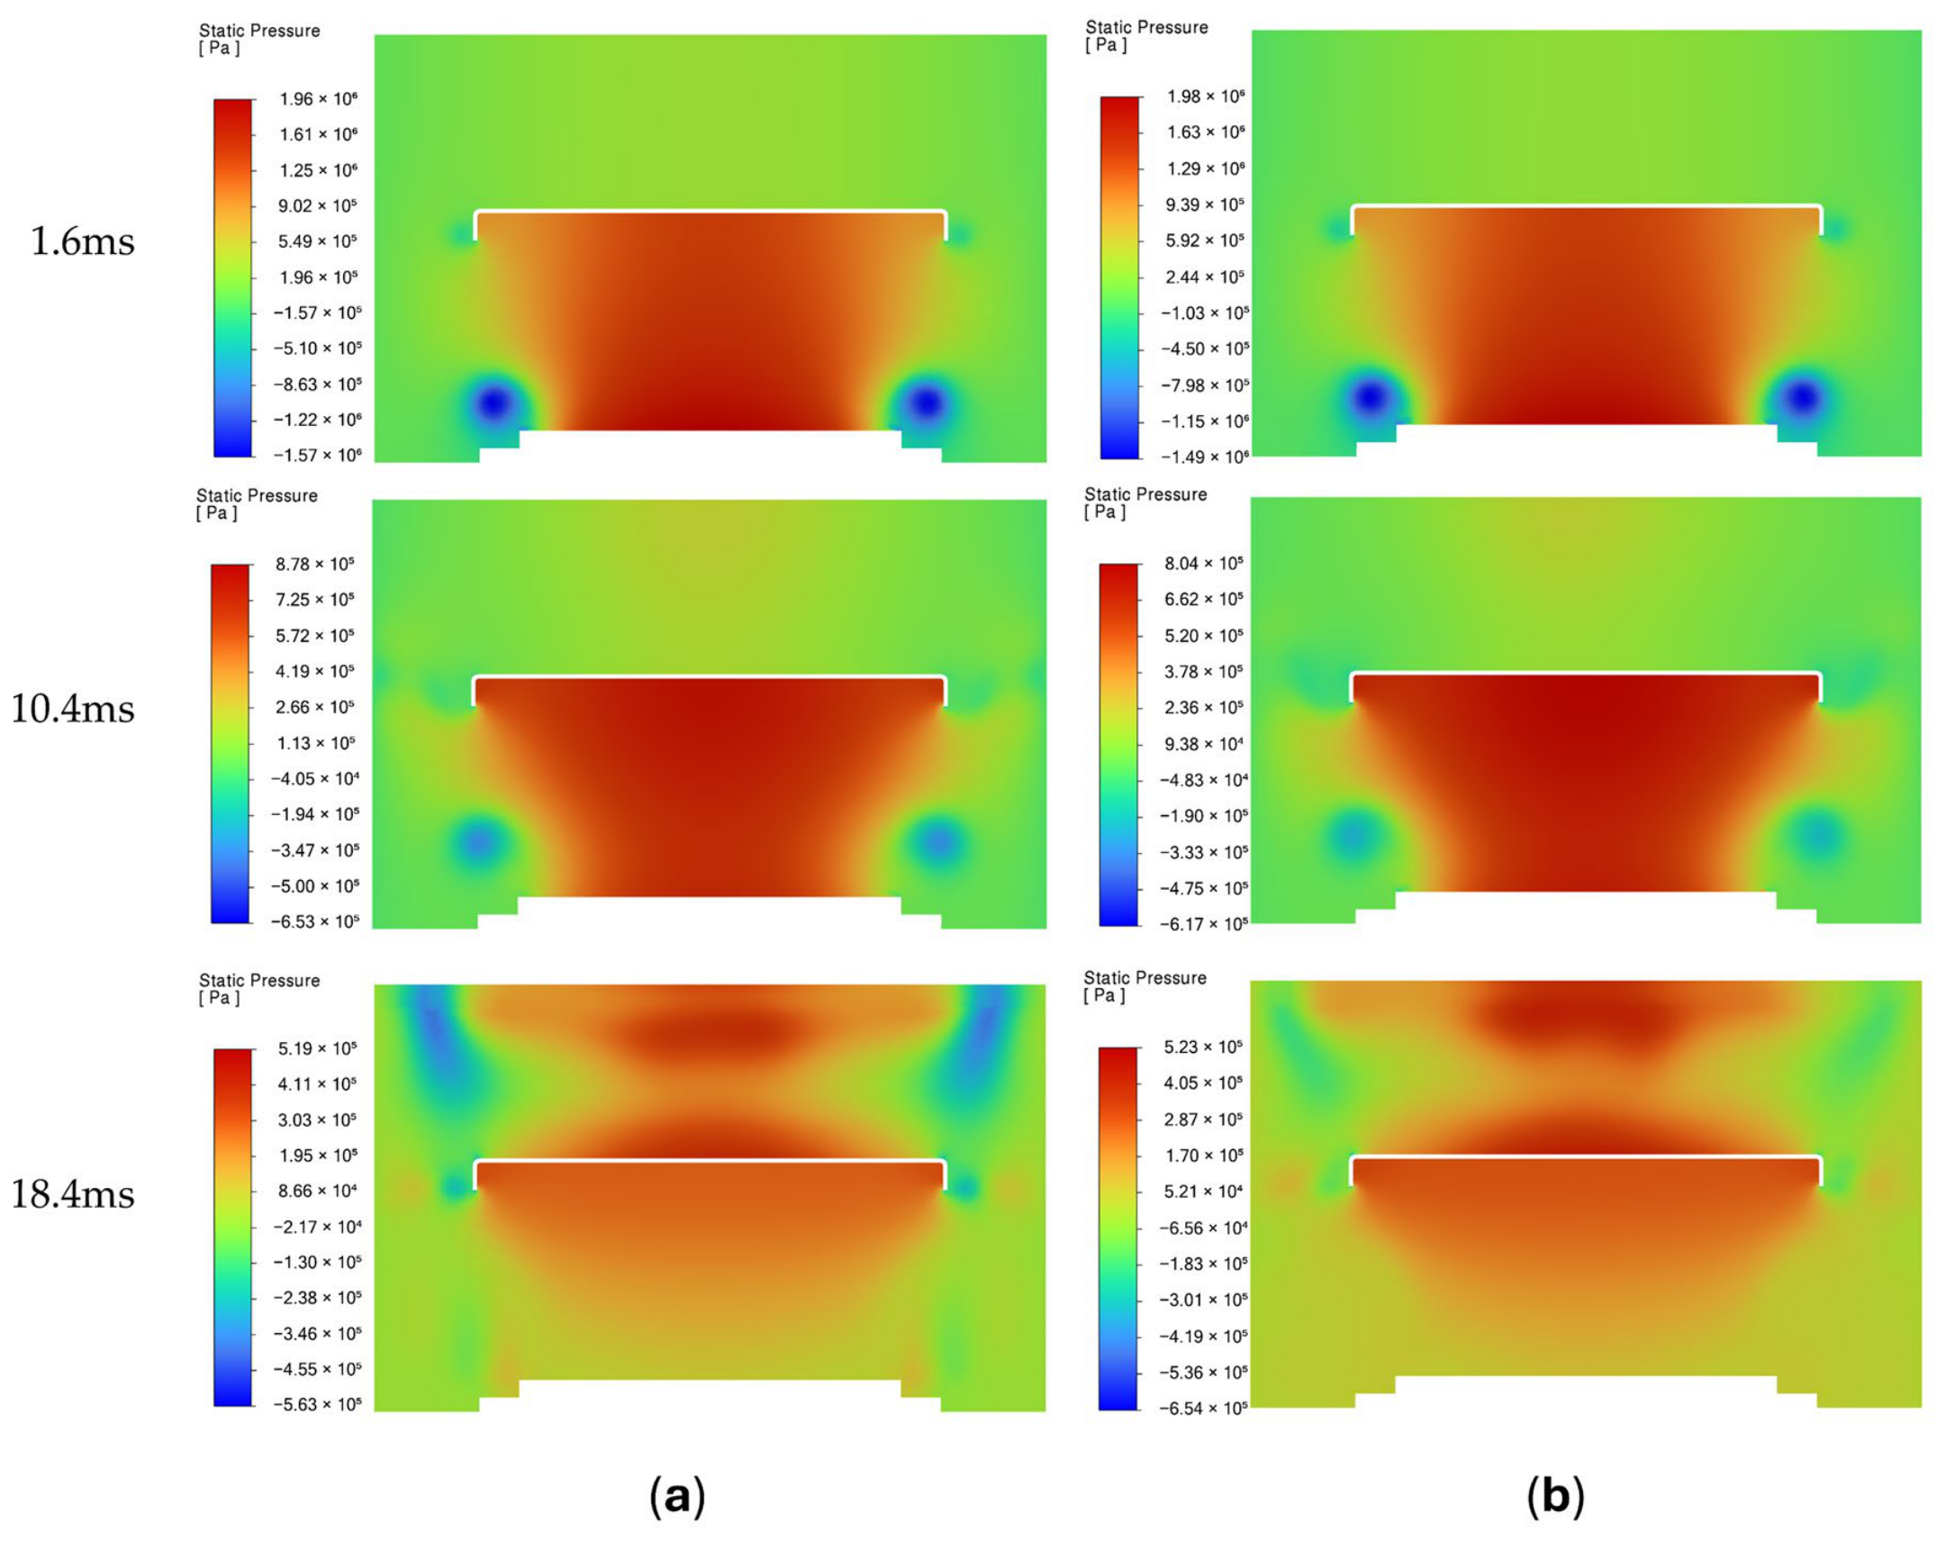
Figure 9 presents the static-pressure distributions of the original and optimized valves at three representative stages of the discharge process. At 1.6 ms, both configurations exhibit a high-pressure region beneath the valve plate due to the rapid pressure rise at the inlet. The overall pressure distributions are similar because the fluid has only begun to accelerate and the influence of the optimized internal geometry remains limited at this stage.
At 10.4 ms, the original valve still exhibits relatively obvious low-pressure zones in the bottom-inlet corner of the valve. The optimized configuration exhibits a smoother pressure transition, and the low-pressure zones become less pronounced. As the flow rate increases, the influence of the optimized flow passage becomes more evident, leading to a more continuous pressure distribution within the valve chamber.
At 18.4 ms, when the discharge process approaches its final stage, the influence of topology optimization becomes most apparent. In the original valve, extensive low-pressure regions are observed near the top of the valve chamber and close to the outlet. After topology optimization, the pressure field becomes more evenly distributed throughout the chamber, and the extent of the low-pressure regions is reduced. The more uniform pressure distribution indicates that the optimized geometry promotes a more effective redistribution of the driving pressure during discharge, thereby reducing localized adverse pressure gradients.
These results indicate that topology optimization improves the pressure distribution characteristics inside the valve chamber and contributes to a more favorable transient discharge process.
3.5. Velocity Field Characteristics
Velocity distribution reflects the utilization efficiency of the available flow domain. In an efficient discharge process, a more uniform velocity distribution generally indicates better utilization of the available flow passage. Conversely, extensive low-velocity regions indicate stagnant flow and ineffective use of the valve chamber volume. Therefore, velocity contours can be used to evaluate the effectiveness of flow development within the valve.
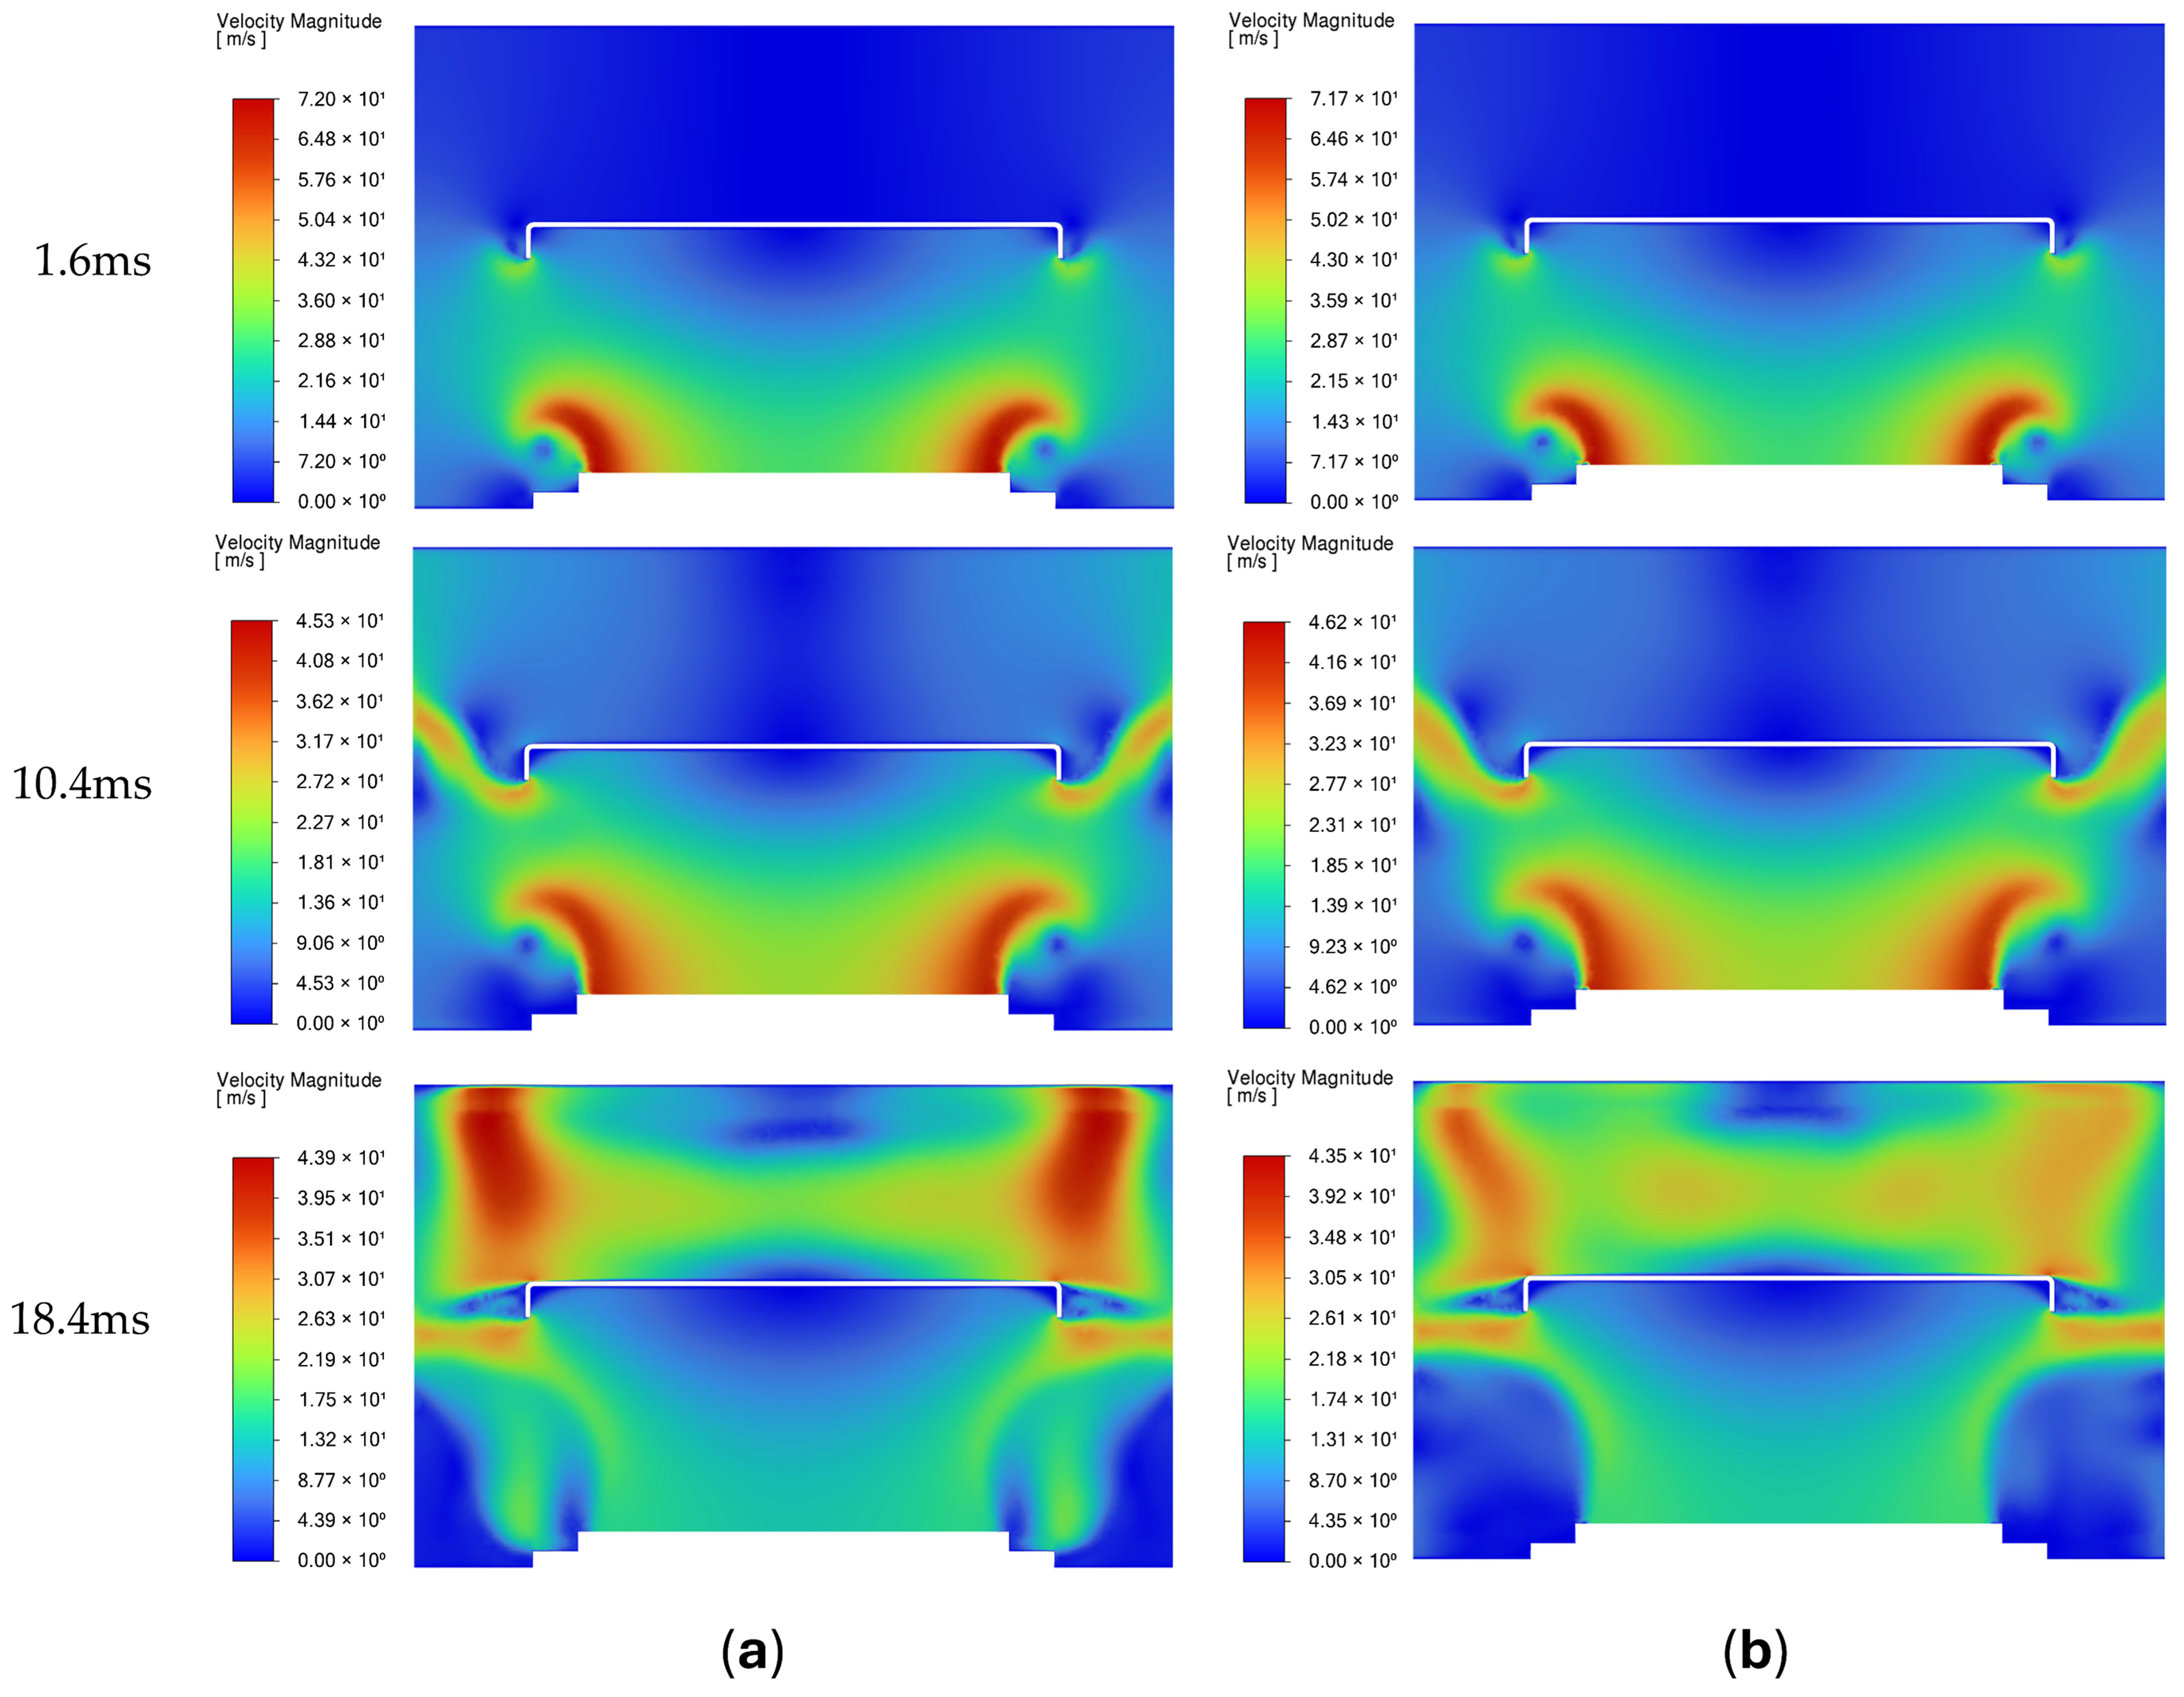
Figure 10 compares the velocity-magnitude distributions of the original and optimized valves. At 1.6 ms, the flow is mainly concentrated near the inlet region, and the velocity fields of the two valves remain similar. The highest velocities are observed around the lower corners adjacent to the inlet, where the fluid first enters the chamber and undergoes rapid acceleration. Since the discharge process has only just begun, the influence of the optimized internal geometry on the overall velocity distribution is still limited.
At 10.4 ms, the velocity fields of the two valves are still similar. However, the optimized valve exhibits slightly higher flow velocity in several regions of the chamber. Although the overall flow pattern changes little, the increase in flow velocity indicates a more effective utilization of the available flow passage during the discharge process.
At 18.4 ms, localized high-velocity regions are observed in the upper chamber of the original valve together with a localized low-velocity zone near the inlet. The velocity distribution suggests the existence of complex local flow structures within the chamber. After topology optimization, the high-velocity zones become less concentrated and the velocity contours in the upper chamber appear more continuous. Meanwhile, the localized low-velocity region near the inlet was substantially reduced. The more uniform velocity distribution suggests that more fluid contributes effectively to the discharge process.
After topology optimization, the overall velocity field remains similar to that of the original valve, while moderately higher flow velocities are observed during the middle and late stages of discharge. The reduction in localized low-velocity regions indicates that the available flow passage is utilized more effectively, which is consistent with the improvement in cumulative discharged volume presented in
Section 3.3.
3.6. Turbulent Kinetic Energy Characteristics
Turbulent kinetic energy (TKE) represents the kinetic energy associated with turbulent velocity fluctuations and is widely used to characterize turbulence intensity and energy dissipation in internal flows. High-TKE regions are generally associated with strong shear layers, recirculation zones, and flow instability. Since part of the mechanical energy is converted into turbulent fluctuations, excessive TKE generally indicates stronger turbulent activity and additional energy dissipation. Therefore, the TKE distribution can be used to evaluate the degree of energy dissipation inside the valve.
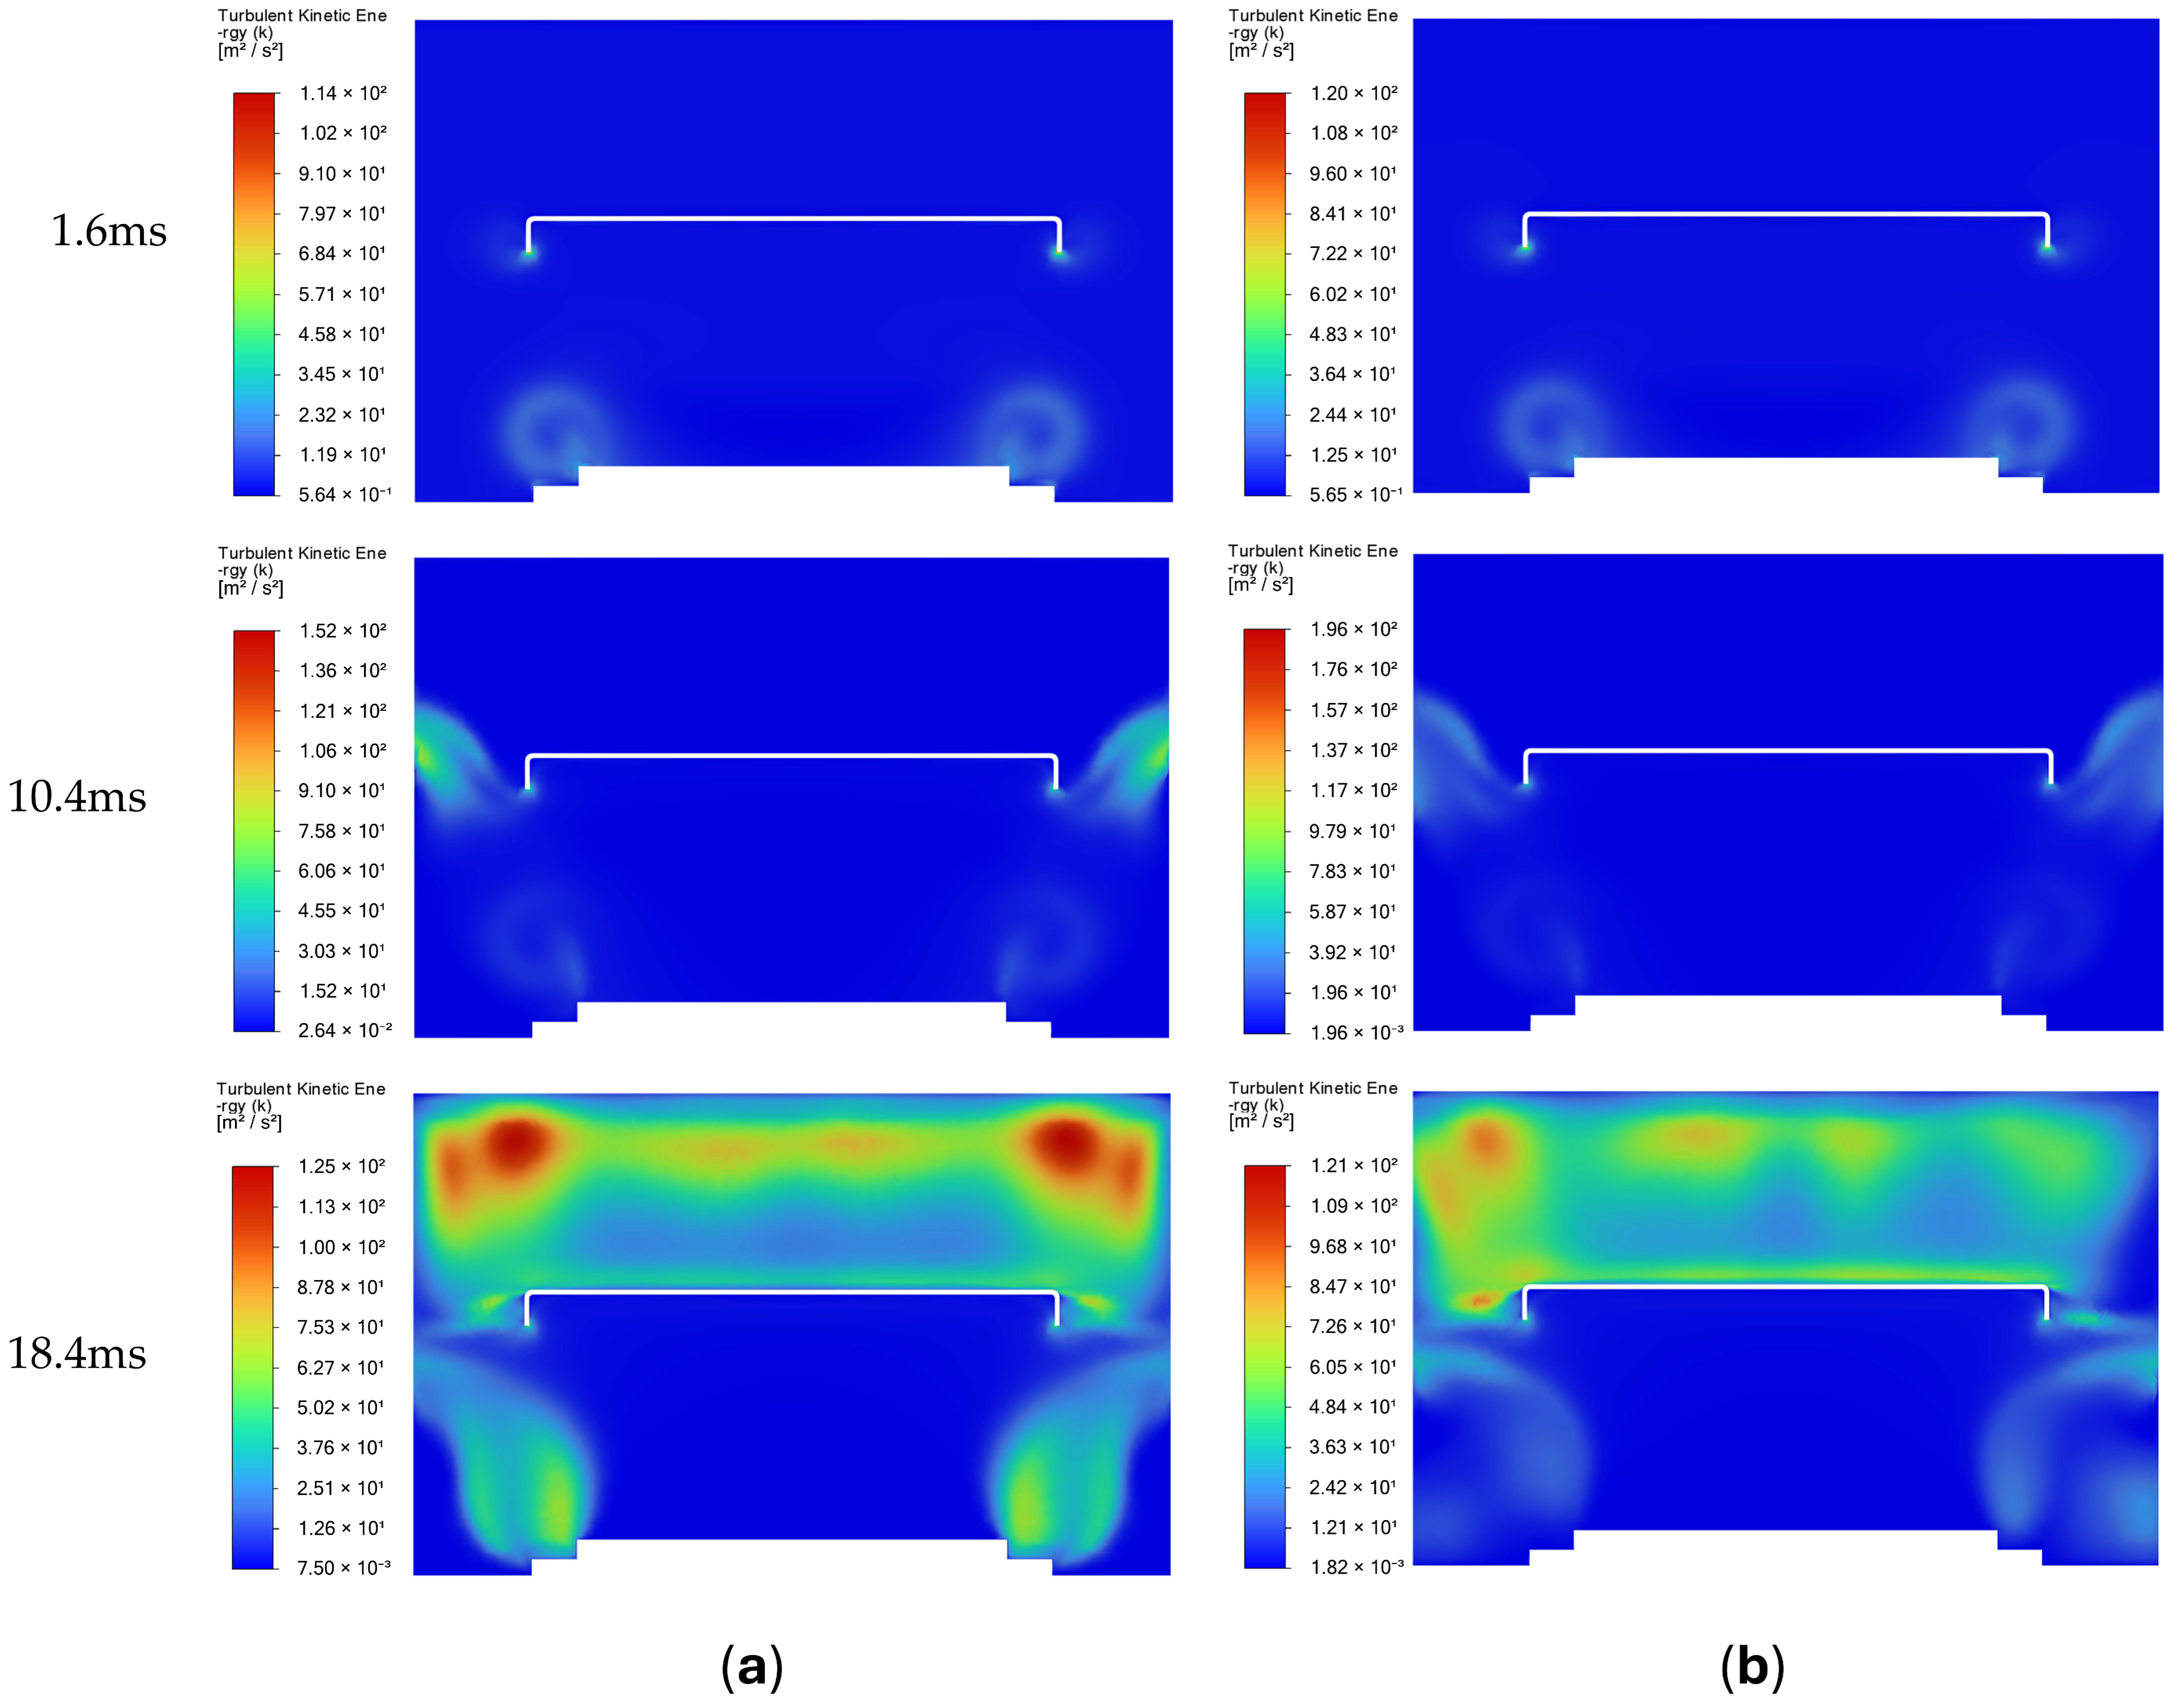
Figure 11 shows the turbulent kinetic energy distributions of the original and optimized valves. At 1.6 ms, the TKE distributions of the two valves are similar, and the levels are relatively low. Localized turbulence is mainly observed near the sharp corners adjacent to the valve plate and inlet region, where the flow undergoes rapid acceleration.
At 10.4 ms, turbulence production becomes more pronounced as the discharge process develops. For the original valve, elevated TKE regions appear near the outlet entrances. The optimized valve exhibits a similar overall distribution pattern, but the intensity of the high-TKE regions is reduced, indicating weaker turbulent fluctuations under comparable flow conditions.
At 18.4 ms, significant differences emerge between the two configurations. The original valve develops extensive high-TKE regions in the upper chamber and near the outlet, indicating strong turbulent activity and enhanced energy dissipation. In contrast, the optimized configuration exhibits a noticeable reduction in both the intensity and spatial extent of these regions. The high-TKE zones become less concentrated, and the overall turbulence level inside the chamber decreases. Compared with the pressure and velocity fields, the difference in TKE between the two configurations becomes more apparent during the late stage of discharge.
The reduction in TKE indicates that the optimized valve experiences weaker turbulent fluctuations during the discharge process. This observation is consistent with the quantitative comparison presented in
Section 3.7, where the optimized valve exhibits a lower volume-averaged TKE while maintaining a higher discharge capacity.
3.7. Quantitative Performance Evaluation
To provide a quantitative comparison between the original and topology-optimized valves, several representative performance indicators are summarized in
Table 2. The flow-field-related parameters, including the outlet mass-weighted average velocity and volume-averaged TKE, are evaluated at 18.4 ms. This instant corresponds to the late stage of the transient discharge process, where the differences between the two valve configurations become more evident in the pressure, velocity, and turbulent kinetic energy fields, making it suitable for quantitative comparison. The cumulative discharged volume is selected as the primary indicator of discharge performance and is calculated over the entire transient discharge period. The outlet mass-weighted average velocity is used to characterize the overall flow transport capability at the outlet because it reflects the characteristic velocity of the discharged fluid while accounting for the non-uniform velocity distribution across the outlet. The volume-averaged TKE is used to evaluate the overall turbulence characteristics inside the valve chamber, providing a quantitative measure of the turbulence intensity within the flow domain.
As summarized in
Table 2, the topology-optimized valve exhibits an increase in cumulative discharge capacity compared with the original configuration, which is consistent with the transient discharge behavior discussed in
Section 3.3. In addition, the outlet mass-weighted average velocity increases from 16.724 m/s to 17.230 m/s, indicating enhanced flow transport through the optimized flow passage.
Meanwhile, the volume-averaged turbulent kinetic energy decreases from 26.441 m
2/s
2 to 24.545 m
2/s
2, representing a reduction of approximately 7.2%. This reduction is consistent with the TKE distributions discussed in
Section 3.6, where the optimized valve exhibits weaker and less concentrated high-turbulence regions. The lower overall turbulence intensity suggests that the optimized geometry suppresses excessive turbulent fluctuations associated with flow separation and recirculation.
Overall, the quantitative comparison confirms that the proposed topology optimization improves the transient discharge performance while modifying the internal turbulence characteristics of the valve. The agreement between the quantitative indicators and the flow-field analyses presented in
Section 3.3,
Section 3.4,
Section 3.5 and
Section 3.6 provides further support for the effectiveness of the proposed optimization strategy.
4. Discussion
The topology optimization results indicate that the optimized configuration differs from the baseline design primarily through the formation of several localized geometric protrusions along the sidewall regions of the valve chamber. These features are mainly located in the middle and lower portions of the side walls near the outlet region. Because the volume-fraction constraint limits the proportion of solid material within the topology domain, the overall geometric characteristics of the flow passage remain similar before and after optimization. Therefore, the observed improvement in discharge performance is primarily associated with changes in the internal flow development process caused by the optimized geometry.
The influence of these geometric modifications can first be observed from the pressure distributions. During the early stage of discharge, both configurations exhibit similar pressure-field characteristics because the pressure difference across the valve is still relatively large. As the discharge process develops, the differences between the two configurations become more apparent. At 18.4 ms, the baseline configuration exhibits a higher pressure-concentration in the upper chamber region, whereas the optimized configuration presents a more distributed pressure field. In addition, the low-pressure regions located near the outlet-side corners become less pronounced after optimization. These observations indicate that the optimized geometry modifies the pressure distribution within the valve chamber and reduces the degree of local pressure concentration. As a result, the pressure field becomes more evenly distributed during the discharge process.
The velocity contours further demonstrate that topology optimization alters the flow-development pattern within the valve chamber. In the baseline configuration, two relatively high-velocity regions are observed above the valve plate, while a lower-velocity zone remains between them. This feature becomes particularly evident during the later stage of discharge. The coexistence of adjacent high- and low-velocity regions indicates that the flow is unevenly distributed across the upper chamber. After topology optimization, the shape and spatial distribution of these velocity regions change noticeably. The low-velocity region located between the two high-velocity zones becomes less pronounced, and the surrounding velocity field is altered accordingly. Meanwhile, the velocity distribution near the outlet region also changes. These observations suggest that the optimized geometry influences the internal flow-development process and modifies the manner in which fluid moves through the valve chamber during discharge.
The effect of topology optimization is also reflected in the turbulent kinetic energy distributions. At the beginning of the discharge process, both configurations exhibit relatively low turbulence intensity because the flow field is still developing. As the discharge proceeds, high-TKE regions gradually appear in the upper chamber and near the outlet region. Compared with the baseline configuration, the optimized design exhibits a different spatial distribution of turbulent kinetic energy during the later stage of discharge. In particular, the locations and extent of the high-TKE regions are modified after topology optimization. This indicates that the optimized geometry affects the turbulence development process within the valve chamber and changes the interaction between the main flow and the surrounding fluid.
Combining the pressure, velocity, and turbulent kinetic energy results, it can be inferred that the localized geometric features generated by topology optimization influence the transient flow development throughout the valve chamber. Rather than substantially changing the overall flow passage, these structures modify local flow characteristics, leading to changes in pressure distribution, velocity distribution, and turbulence intensity. The resulting flow field exhibits a more uniform pressure distribution and a modified flow-development pattern during discharge. These changes collectively contribute to the increase in cumulative discharge volume observed in the optimized design.
Under the same transient pressure-loading condition, the cumulative discharged volume increases from 13.219 L to 13.601 L during the 19 ms discharge process. Considering that the optimization was performed under strict geometric constraints and a prescribed solid-volume constraint, the observed improvement demonstrates that localized modifications of the internal flow domain can influence transient flow behavior and contribute to enhanced discharge performance in transformer pressure relief valves.
5. Conclusions
In this study, a density-based topology optimization approach was proposed to improve the transient discharge performance of a transformer pressure relief valve by modifying its internal flow-path configuration. Unlike conventional geometric optimization methods that rely on predefined parameters, the proposed approach enables automatic redistribution of the internal flow domain while maintaining the original external dimensions and functional components. The optimized configuration was evaluated through transient CFD simulations under experimentally derived pressure loading conditions, providing a numerical framework for assessing the influence of internal flow-path design on rapid pressure-relief processes. The proposed methodology provides a potential strategy for improving internal flow configurations of hydraulic safety devices with complex flow passages. The main conclusions are as follows:
- (1)
The topology optimization successfully generated a new internal flow-guiding structure without increasing the overall valve size. The optimized design redistributed the internal flow passage by reducing ineffective flow regions associated with low-velocity zones and complex flow structures.
- (2)
Under identical transient pressure conditions, the topology-optimized valve achieved a cumulative discharge volume of 13.601 L, compared with 13.219 L for the original valve, corresponding to an improvement of approximately 3%. The improvement was mainly attributed to enhanced flow organization rather than an increase in the available flow area.
- (3)
The CFD results demonstrated that topology optimization modified the internal pressure and velocity distributions and reduced intense turbulent regions. The optimized valve exhibited a more uniform flow field and weaker turbulence intensity, indicating more favorable internal flow characteristics during transient discharge.
Although the improvement in cumulative discharge capacity is moderate, this enhancement is obtained without changing the external dimensions, valve opening mechanism, or major structural components of the existing pressure relief valve. For safety-critical devices such as transformer PRVs, even a moderate increase in discharge capability can provide an additional pressure-relief margin during extremely rapid internal fault events. Therefore, the proposed method provides an effective approach for improving valve performance through internal flow optimization rather than complete structural redesign.
The proposed methodology still has several limitations. The present CFD evaluation was performed with the valve plate fixed at the fully opened position, which represents the flow characteristics after valve opening but does not capture the transient interaction between valve motion and fluid flow during the opening process. In addition, the topology-optimized structure obtained in this study represents a conceptual flow-guiding design and requires further engineering refinement before practical implementation. Future investigations may focus on more comprehensive transient modeling considering valve motion effects, experimental validation of the optimized configuration, and the development of multi-objective optimization strategies as well as both discharge performance and hydraulic losses.