Article

Life-Cycle Safety Evaluation of Arch Dam Abutments: A Comprehensive Framework Considering Spatiotemporal Variation in Fault Mechanical Parameters


1
Water Resources Research Institute of Anhui Province and Huaihe River Water Resources Commission, Ministry of Water Resources, Hefei 230088, China
2
Key Laboratory of Anhui Provincial Water Science and Intelligent Water Conservancy, Hefei 230088, China
3
College of Hydraulic and Environmental Engineering, Three Gorges University, Yichang 443000, China
4
Hubei Key Laboratory of Construction and Management in Hydropower Engineering, Three Gorges University, Yichang 443000, China
*
Author to whom correspondence should be addressed.
Appl. Sci. 2026, 16(14), 7281; https://doi.org/10.3390/app16147281
Submission received: 13 June 2026 / Revised: 14 July 2026 / Accepted: 19 July 2026 / Published: 21 July 2026
(This article belongs to the Section Civil Engineering)

Abstract

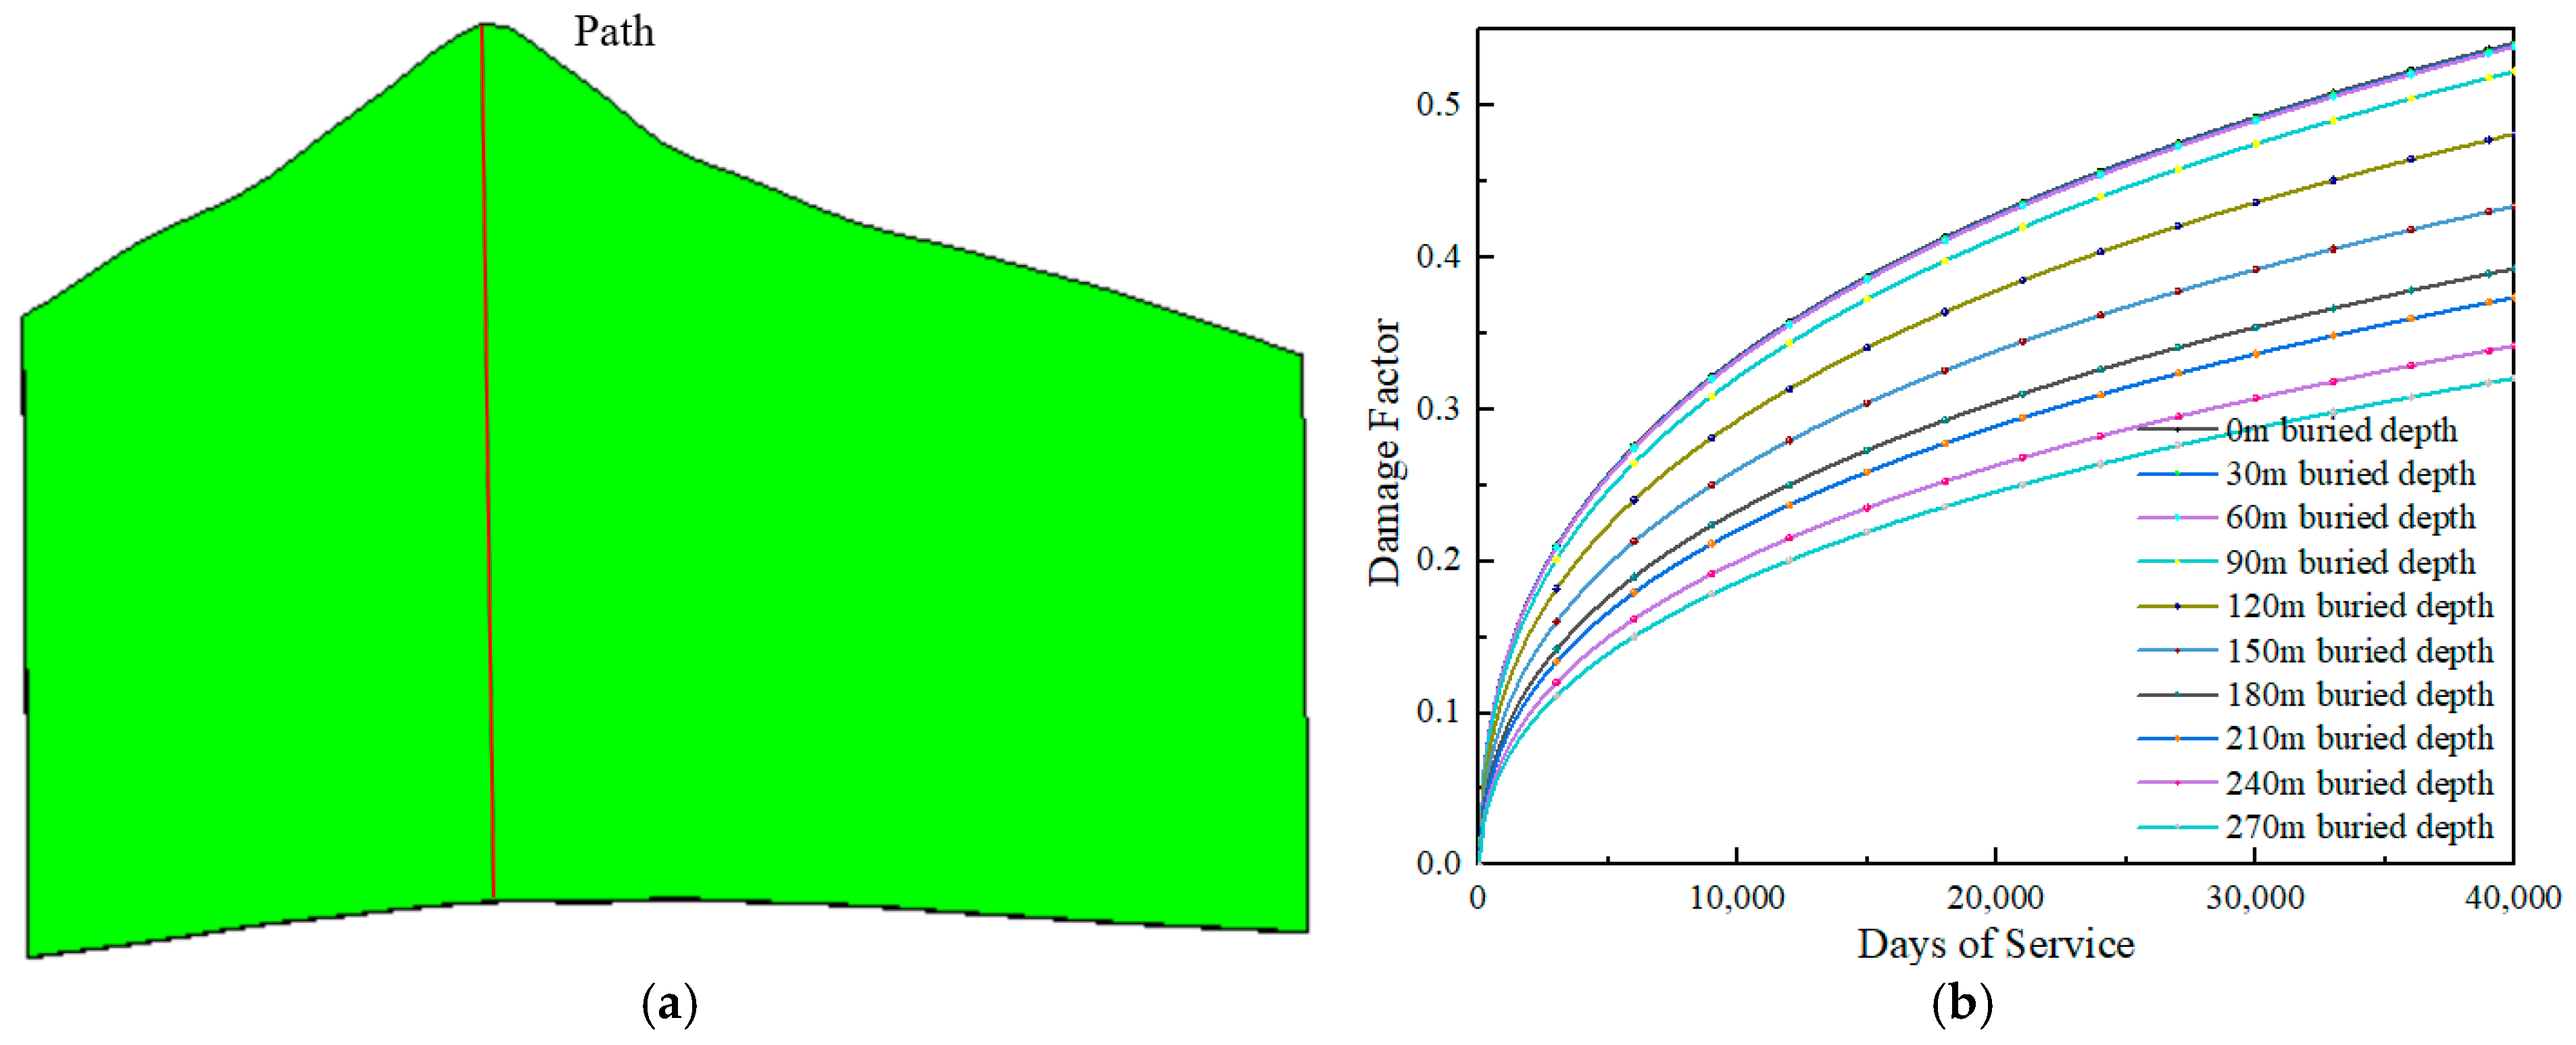
Through-going faults represent critical geological hazards that threaten the long-term operational safety of arch dams. Conventional studies predominantly rely on homogeneous material assumptions and static analysis, neglecting two essential characteristics of natural faults: (1) the discrete, localized distribution of intact rock blocks within fractured zones, and (2) degradation of the mechanical properties of faults with time during the service life of arch dams. These limitations will unavoidably introduce systematic errors into the safety state judgment of operating arch dams. To address these limitations, this paper develops an enhanced constitutive model that couples three key mechanisms: confining pressure strengthening with burial depth, local reinforcement from discrete random rock blocks, and fatigue damage accumulation under cyclic water level fluctuations. The model is implemented via ABAQUS UMAT subroutine development, enabling three-dimensional spatiotemporal evolution simulation of fault mechanical parameters. Furthermore, a multi-index comprehensive evaluation framework is established by integrating normalized dam stress state and abutment strength reduction stability, providing a holistic assessment of arch dam performance throughout its service life. Applied to a practical pumped storage arch dam project, the results demonstrate that: (1) Fault damage evolution is characterized by prominent spatial heterogeneity. The results reveal that the fault damage coefficient at a burial depth of 0 m after 40,000 days of service is nearly twice that of the fault at a burial depth of 270 m. (2) The abutment safety factor decreases from 2.36 to 1.17 after 40,000 days of cyclic operation, entering a critical warning state at approximately 28,000 days. This study provides refined characterization methods and quantitative assessment tools for the long-term safety evaluation of fault-controlled arch dams, with direct implications for engineering risk prevention and reinforcement design.

1. Introduction

In the construction of hydropower projects, as a common type of hydraulic structure, arch dams feature excellent overloading capacity, safety and economic efficiency [1,2,3,4]. In the site selection of planned arch dams in China, the stability of dam abutments is challenged by adverse geological factors such as faults, joints and fractures in abutment rock masses. Among these factors, faults exert a more significant impact on the stability of arch dam abutments due to their large scale [5,6,7,8]. Limited by the early investigation level, the defects of dam abutment rock masses were not fully explored during the construction of existing completed arch dams. With the maturity of investigation technologies, adverse geological structures such as faults have been subsequently revealed to be widely distributed in dam abutment rock masses [9]. It is practically difficult to find a natural dam site free of joints, fractures, weak interlayers or local fractured fault zones. Controlled by the regional tectonic stress field, small and medium-sized geological faults are widely developed in the dam site areas of major hydropower development regions worldwide [10]. The Malpasset Arch Dam in France suffered a sharp rise in water level due to continuous heavy rainfall. The rock mass from the left dam abutment to the F1 fault became unstable, eventually resulting in the dam breach [11]. For the Baihetan Arch Dam in China, unloading relaxation occurred during the dam foundation excavation stage due to the existence of faults [12,13]. Faults are the key geological factors controlling the stability of arch dam abutments, and their development characteristics exert a decisive influence on the anti-sliding stability and deformation stability of dam abutments [14].
Fault zones exhibit the confining pressure effect and the strength regeneration theory. That is, deeper parts of the same fault possess higher confining pressure and superior mechanical properties compared with shallower parts. After a local failure induced by an external disturbance, consolidation can occur under new confining pressure to improve local mechanical properties [15]. This enables faults to present unique mechanical responses under different confining pressure conditions. For large-scale faults, the spatial variation in their material composition further leads to spatial variability in the mechanical properties of faults [16]. In terms of temporal response, during the service period of hydraulic engineering, faults are prone to time-dependent damage induced by cyclic loading and unloading formed by the repeated rise and fall in the upstream water levels [17]. The period, frequency and stress level of cyclic loading are crucial factors dominating its influence on rock masses. The mechanical properties of faults under cyclic or dynamic loading differ from those under static loading conditions [18,19,20].
Many scholars have conducted stability analyses on arch dams with unfavorable geological conditions such as faults. Wang [21] introduced the seepage field and carried out overloading calculation analysis for the LCGX high arch dam containing faults. The upstream water pressure was increased by introducing the water pressure overload coefficient (λ). The final results show that the shear failure of the rock mass above the F119 fault drives the bottom of the dam to move downstream. Combining geomechanical model tests with numerical analysis, Zhang [14] concluded that the deformation of the Yebatan Arch Dam remains within the elastic range under normal water load. With the implementation of the overloading process, the rock mass near the right dam abutment slides along the F29 fault. Zhang [22] conducted a geological model test on the Dagangshan Arch Dam. By comparing the test results before and after foundation treatment, the reinforcement effect of foundation treatment on stress, deformation, failure mode and overall stability was evaluated, and it was concluded that prestressed anchor cables can prevent the sliding of rock masses, faults and dam foundations. At present, most studies on arch dam stability assume that the mechanical properties of faults are homogeneously distributed, and the calculations mainly focus on the instantaneous influence of faults on dam foundation stability in the initial design stage. However, there is still a lack of corresponding consideration and analysis on how the time-varying deterioration effect of faults acts on the structural safety of arch dams throughout the whole life cycle of engineering projects.
Building upon the foundational work of our previous study [16], which initially established the basic framework for considering spatiotemporal variations in fault parameters in arch dam analysis, this paper makes two significant extensions and methodological improvements. First, the characterization method for fault heterogeneity is fundamentally upgraded: the previous study adopted a continuous random field approach that could lead to unrealistic strength weakening and negative parameter values, whereas this paper proposes a discrete random rock block model with node influence domains, which more accurately reproduces the locally concentrated distribution characteristics of intact rock masses within fractured fault zones. Second, the cyclic damage evolution model is refined: the original damage-cycle relationship is corrected by introducing elastic modulus attenuation as a core control variable, enabling differentiated damage evolution at different burial depths and confining pressure levels. These improvements collectively form a more refined and complete technical system for the safety evaluation of fault-controlled arch dams, providing more reliable theoretical support and practical guidance for engineering applications.

2. Method

2.1. Constitutive Theory of Faults Considering Confining Pressure and Discrete Distribution of Intact Rock Blocks

Natural faults are not homogeneous weak media, and the intact rock blocks randomly embedded and distributed inside them have a significant impact on the overall mechanical properties of faults [23]. The spatial variation in confining pressure with burial depth will further enhance the spatial differentiation characteristics of fault strength. Traditional fault constitutive models mostly adopt homogeneous and fixed parameters, only considering the influence of confining pressure intensity unilaterally, without taking into account the random and inhomogeneous distribution of intact rock blocks inside faults, thus failing to reproduce the real mechanical behavior of deep faults. To this end, based on the confining pressure constraint reinforcement theory, this chapter introduces the characterization method of the random discrete node local influence domain strength method, distinguishes between fault fractured media and intact rock masses, and establishes a fault mechanical parameter distribution model coupling the spatial effect of confining pressure and the inhomogeneous randomness of rock masses. Meanwhile, through the secondary development of the ABAQUS 6.14/UMAT subroutine, the engineering application of this model is realized, providing reliable constitutive support for the subsequent refined spatial stress stability analysis of arch dams.

2.1.1. Theoretical Characterization of the Spatial Strengthening Effect of Confining Pressure

The confining pressure of deep rock mass increases linearly with the rise in burial depth. The constraint effect of confining pressure can significantly restrain the opening and propagation of internal fractures within faults, leading to a synchronous enhancement of the overall mechanical strength of faults with increasing burial depth. This process is defined as the spatial strengthening effect of confining pressure. Combined with the evolution law of confining pressure and fault strength in engineering practice [16], the spatial distribution formula of fault mechanical parameters is expressed as follows:
E = 7.72 7.62 × 0.9 1 σ 3 ( R 2 = 0.99 )
c = 4.72 4.51 × 0.8 7 σ 3 ( R 2 = 0.98 )
φ = 27.78 3.20 × 0.83 σ 3 ( R 2 = 0.99 )
where E is the elastic modulus of the fault, GPa; c is the cohesion, MPa; φ is the internal friction angle, °; and σ 3 is the confining pressure, MPa.

2.1.2. Theoretical Characterization of Heterogeneity for Discrete Random Rock Blocks

Natural faults are composed of broken rocks, fragmented media, discrete intact rock blocks, and rock bridges. Intact rock blocks are randomly distributed in a dotted and local manner, which only significantly improves the rock mass strength in a small area, while the remaining broken areas maintain their original mechanical properties and are affected by the confining pressure effect. Traditional continuous random fields have problems, such as random strength weakening, easy occurrence of negative parameters, and inconsistency with the characteristics of the local concentrated development of rock blocks. A deterministic random characterization method combining discrete random nodes, influence domains and local strength amplification is adopted: fixed rock block nodes are randomly generated within the fault calculation domain, each node is assigned a fixed influence radius, and the integration points within the influence radius are determined as intact rock block areas. A reinforcement coefficient is applied to the mechanical parameters of the intact rock block areas in the fault according to the burial depth, while the confining pressure benchmark parameters remain unchanged outside this range.
Let the overall calculation domain of the fault be Ω , and N independent characteristic nodes of rock blocks are randomly generated within the domain, whose coordinates are expressed as follows:
P i ( x i , y i , z i ) Ω ,   i = 1,2 , 3 , , N
The total number of rock block nodes N is determined according to the fault scale and the rock block development density revealed by geological investigation. To ensure that the spatial positions of rock blocks remain fixed during numerical calculations and do not vary with incremental steps or analysis steps, a coordinate hash mapping method is adopted to generate fixed random coordinates. The same spatial position corresponds to an identical rock block distribution pattern throughout the entire calculation process, which conforms to the physical fact that the spatial position of geological structures remains constant.
For any finite element integral point P i ( x i , y i , z i ) , the Euclidean spatial distance is calculated from it to the i-th characteristic node of the rock block:
r i = ( x x i ) 2 + ( y y i ) 2 + ( z z i )
The regional discrimination criterion is establised as follows:
{ min ( r i ) R c min ( r i ) > R c
where R c denotes the influence radius of rock blocks. An integral point within the range less than R c is judged to be located in the influence domain of intact rock blocks; otherwise, it belongs to the fractured zone.

2.1.3. Theoretical Characterization of Confining Pressure-Random Field Coupling Correction

The baseline confining pressure parameters of integral points within the influence domain of rock blocks are amplified and corrected, while the parameters in the fractured zone remain unchanged:
{ E 1 = k s E ( σ 3 ) c 1 = k s c ( σ 3 ) φ 1 = φ ( σ 3 )   min ( r i ) R c
{ E 1 = E ( σ 3 ) c 1 = c ( σ 3 ) φ 1 = φ ( σ 3 )   min ( r i ) > R c
where E ( σ 3 ) , c ( σ 3 ) , φ ( σ 3 ) are the basic parameters considering only the confining pressure effect; and E 1 , c 1 , φ 1 are the spatially heterogeneous mechanical parameters under the combined action of the confining pressure effect and random intact rock blocks.

2.2. Damage Evolution Law Based on Strain Energy Density Under Cyclic Loading

During the operation of pumped storage power stations, the processes of water pumping and power generation are the subject of engineering rock masses to cyclic loading and unloading. Such fatigue loading conditions degrade the mechanical strength and deformation properties of rock masses. Therefore, investigating the damage characteristics and failure mechanisms of rocks under cyclic loading and unloading are of important engineering significance for evaluating the long-term stability of rock masses [24]. Existing studies have established the relationship between the damage factor D and cycle number N based on strain energy density [16], yet they fail to consider the influence of elastic modulus attenuation on damage evolution, resulting in inconsistency with the actual stiffness degradation law. Accordingly, on the basis of the strain energy density framework, this section introduces the elastic modulus as the core control variable and constructs a cyclic loading damage model that better conforms to the actual deterioration mechanism.
The single-cycle strain energy density Δ W for elastically dominated high-cycle fatigue specimens is calculated.
Δ W = 1 2 σ m a x × ε a
where σ m a x is the stress amplitude, and ε a is the strain amplitude.
It is converted via Hooke’s law:
Δ W = σ m a x 2 2 E
Based on the energy equivalence principle, it is assumed that the fault remains primarily in an elastic response stage under the cyclic fluctuation of the reservoir water level. Failure occurs when the cumulative total strain energy density absorbed by different rock masses reaches the critical failure threshold, based on which the energy equivalence relationship is established:
N r o c k × Δ W r o c k = N f a u l t × Δ W f a u l t
Rearranging Equation (11) yields the following:
N f a u l t = N r o c k × Δ W r o c k Δ W f a u l t
According to the research by Yin, the fitting formula of D-N is the following:
D = ( 0.95 + 2.23 N 0.42 ) / ( 69.83 + N 0.42 )
In the previous work, confining pressure effects were incorporated, and the elastic modulus is set to vary gradually with burial depth. The energy equivalence approach with an exponent of 2 enables differentiated quantification of dissipated damage energy at various depths of the fault, simultaneously integrating the temporal cumulative effect and spatial distribution effect of fault damage evolution and failure behavior of faults. Compared with the traditional S-N model, this framework can finely describe the heterogeneous damage evolution behavior of faults with depth, greatly improving the accuracy of numerical predictions and reproducing the real mechanical properties and failure evolution mechanisms of faults. Faults with greater burial depth are subjected to stronger confining pressure constraints and possess a higher elastic modulus, endowing them with a stronger capacity to resist deterioration under cyclic loading. Consequently, they experience less damage impact during long-term operation. It can be seen from Equations (10) and (11) that the cycle number N is positively correlated with the elastic modulus of the fault. On this basis, the evolution relationship between the fault damage factor and cycle number under different burial depth conditions can be further derived through Equation (13):
D = ( 0.95 + 2.23 ( E × N / E f a u l t ) 0.42 ) / ( 69.83 + ( E × N / E f a u l t ) 0.42 )
where E is the elastic modulus of the fault considering the confining pressure effect, and E f a u l t denotes the elastic modulus under zero confining pressure mentioned above.

2.3. UMAT Subroutine for Coupling of Confining Pressure Effect and Cyclic Loading

This section implements the unified coupled characterization of the spatial confining pressure effect, discrete intact rock blocks, and cyclic loading fatigue damage based on the ABAQUS user material subroutine (UMAT). Through the multi-field coupling of integral point coordinates, confining pressure state and cycle number, the following calculations are completed internally within the UMAT.
The UMAT subroutine obtains variables, such as integral point stress, coordinates, and equivalent time, through the interface, and sequentially completes three core calculations:
(1)
Mechanical parameter strengthening induced by confining pressure σ 3 ;
(2)
Spatial random distribution of intact rock blocks inside the fault characterized by a discrete random field;
(3)
Evolution of damage factor related to cyclic loading and elastic modulus;
(4)
Final dynamic correction of mechanical parameters.
Finally, the three-dimensional spatiotemporal evolution of fault mechanical parameters with spatial random distribution of discrete intact rock blocks, confining pressure related to depth, and degradation with cycle number is realized, which is more consistent with the actual geological and engineering operation laws.
Coupling the confining pressure effect with the cyclic loading damage model, the final instantaneous mechanical parameters of the integration points are obtained:
E final = E 1 × ( 1 D )
c final = c 1 × ( 1 D )
φ final = φ 1 × ( 1 D )
The UMAT constructs the tangent stiffness matrix using the finally corrected elastic modulus, and substitutes the final cohesion c final and internal friction angle φ final into the Mohr–Coulomb yield criterion, realizing stress update and plastic correction, so that the constitutive model can reflect the complex mechanical behaviors of discrete inhomogeneity, depth dependence, and cyclic degradation.

2.4. Time-Dependent Safety Model of Arch Dam Considering Time-Varying Characteristics of Fault Materials

To reasonably apply laboratory cyclic test results to practical arch dam engineering and establish a quantitative relationship between reservoir water level fluctuation and long-term mechanical deterioration of faults, this section takes the water pressure acting on faults under different cyclic water depths as the external load. Based on the equivalence principle of strain energy density, the failure cycle number obtained from laboratory tests is converted into the equivalent cycle number under arbitrary water levels. Combined with the daily operation rhythm of the reservoir, the cycle number is further converted into a time variable, and a time-dependent damage evolution model for arch dams during service is established.
Hydrostatic pressure theory states that the normal stress induced by water depth h on the fault plane is as follows:
σ ( h ) = γ w × h
where σ ( h ) is the normal stress acting on the fault under different water depths; h denotes the cyclic water depth acting on the fault zone; and γ w is the unit weight of water.
The laboratory cyclic number can be converted into the equivalent failure cycle number corresponding to an arbitrary water depth h:
N × σ 2 = N ( h ) × σ ( h ) 2
Let the daily water level fluctuation frequency of the reservoir be k. By converting the number of cyclic loads into a time variable, the equivalent service days can be obtained as follows:
t = N ( h ) k
Combining Equations (19) and (20), the relationship between the service days of the arch dam and water level can be obtained:
t = N × σ 2 / ( γ w × h ) 2 × k

2.5. Comprehensive Stability Analysis Method of Arch Dam

The overall stability of an arch dam is the core guarantee for the safe operation of the project, which is controlled by the coupling of multiple factors such as dam stress and the anti-sliding performance of rock masses in the dam foundation and abutments. In accordance with NB/T 10870-2021 Design Code for Concrete Arch Dams [25], this paper selects the dam stress state and strength reduction stability indexes. After normalization treatment, a dimensionless comprehensive stability coefficient is obtained by weighted summation, enabling quantitative evaluation of the overall stability degree of the arch dam.
This method breaks through the limitations of single-index evaluation. It not only considers the rationality of dam stress distribution but also reflects the anti-sliding stability reserve of the dam foundation–dam system. Taking both local stress safety and global anti-sliding stability into account, it conforms to the principle of code-based design and provides a more comprehensive and scientific evaluation.
Since the dam stress state index (MPa) and the strength reduction stability index (dimensionless) have different dimensions, direct weighted summation would render the index weights meaningless. Therefore, it is necessary to normalize the two major indexes and convert them into dimensionless values within the interval [0, 1], so as to eliminate dimensional differences and ensure the comparability and additivity of the indexes.
The normalization strictly follows the limit requirements specified in the code, adopting the code-specified limits as the normalization benchmark. This ensures that the normalized results comply with the safety criteria of engineering design and avoids evaluation deviation caused by unreasonable benchmark selection. The specific normalization logic is as follows: for beneficial indexes such as the strength reduction factor F s , the normalized value increases with the original index; for adverse indexes such as relative stress magnitude, the normalized value decreases with the original index. This arrangement guarantees that the normalized data can truly reflect the influence degree of each index on arch dam stability.

2.5.1. Normalization of Stress State and Safety Factor

1.
Normalization of Stress Index
As a highly statically indeterminate structure, an arch dam inevitably suffers stress concentration at the dam heel, around orifices, and foundation constraint regions. In finite element analysis, such stress concentration often induces extremely high local peak stresses, which are usually confined to very small zones. If the conventional extreme value control method is directly adopted to extract the maximum stress of the dam, local peak stresses caused by numerical singularity or geometric mutation will dominate the overall evaluation index, artificially lower the safety factor, misjudge the global structural safety, and lead to overly conservative or unscientific evaluation results.
By statistically calculating the volume proportion of the over-limit stress region, the evaluation focus is shifted from extreme values to the scope of stress exceeding the limit. This method holds that if the scale of over-limit stress zones is extremely small and discontinuous, the dam still possesses sufficient bearing capacity, relying on its structural integrity and the plastic potential of materials. The judgment of stress indexes by this method makes the comprehensive evaluation results more objective and closer to engineering practice.
For any element, the normalization formula of tensile and compressive stresses can be expressed as follows:
η t / c , i = σ t / c , i / [ σ t / c ]
where σ t / c , i is the tensile/compressive stress of the i-th element, and [ σ t / c ] denotes the allowable tensile/compressive stress of concrete.
Combined with the statistical results of damage statistics, the normalized stress index Sn can be expressed as follows:
S n = 1 S / V
where S is the number of elements with normalized stress value greater than 1; and V is the total number of elements of the dam body.
2.
Normalization of Dam Foundation Safety Factor
The safety factor F s obtained by the strength reduction method is an absolute value, which physically represents the strength reserve multiple from the current structural state to the limit equilibrium state. However, affected by the model scope, constitutive parameters, mesh size, convergence criteria and other factors in the finite element numerical simulation, the absolute value of F s often has a systematic deviation from the traditional safety factor specified in codes, making it difficult to be directly weighted and integrated with the stress safety factor.
For this reason, this paper adopts a hierarchical mapping method based on a risk threshold to normalize F s . The core idea of this method is to no longer rigidly adhere to the absolute magnitude of F s , but convert it into a relative index F n that reflects the structural stability risk level, so as to match the physical significance and numerical range of the stress index.
When F s   ≥ 1.5, the arch dam is considered to have sufficient strength reserve under normal operating conditions with a satisfactory overall stability state and safe operation, and the corresponding normalized index is set as F n   = 1.0;
When F s   = 1.0, it represents the theoretical critical point of the strength reduction method, indicating that the structure reaches the limit equilibrium state. When F s approaches or falls below this value, the dam-foundation system faces a significant instability risk. According to the selection principle of the aforementioned stress normalization index, F n   = 0.8 at this time.
When F s   <   1.0, the structure is below the limit equilibrium state under the current loads with a high overall instability risk, and engineering reinforcement measures must be taken, F n   = 0 at this time.
Based on the above threshold division, a piecewise linear interpolation method is adopted to establish the mapping relationship from F s to F n , and the specific expression is as follows:
F n = { 1.0 ,   F s 1.5 0.8 + 0.4 ( F s 1.0 ) ,   1.0 F s < 1.5 0 ,   F s   < 1.0
The above normalization establishes a quantitative mapping relationship between the strength reduction factor F s and the stability risk index F n , enabling F n to be weighted and integrated with the normalized stress index on the same risk scale, and providing a unified benchmark for the overall safety evaluation of arch dams.

2.5.2. Comprehensive Evaluation Index of Working Behavior

1.
Weighted Summation of Stress and Stability Indexes
The core of the weighted summation is to assign reasonable weight coefficients ( ω 1 , ω 2 ), according to the influence degree of the two major indexes on the overall stability of the arch dam. Among them, ω 1 is the weight of the stress state index, and ω 2 is the weight of the strength reduction stability index, satisfying ω 1 + ω 2 = 1 .
The theoretical basis for weight allocation lies in the influence mechanism of arch dam stability: the dam stress state determines local safety and serves as the foundation of overall stability; the strength reduction factor governs the global anti-sliding capacity and acts as the core of overall stability. Weight allocation should combine engineering realities, such as dam height, geological conditions and load level, and refer to the attention degree paid to stress control and stability safety indexes in relevant codes, so as to ensure the rationality and scientificity of weight assignment.
The calculation formula of the comprehensive stability coefficient K is as follows:
K = ω 1 × S n + ω 2 × F n
where S n is the normalized value of the stress state index, and F n is the normalized value of the strength reduction stability index. A larger value of K indicates better overall stability performance of the arch dam; conversely, a smaller K corresponds to poorer overall stability. By setting the critical value of K determined in combination with code requirements and engineering experience, it can be directly judged whether the overall stability of the arch dam meets the safety requirements.
2.
Determination of Weight Coefficients
The determination of weight coefficients ( ω 1 , ω 2 ) shall take into account the influence mechanism of arch dam stability and refer to the emphasis placed on stress control and stability safety by relevant design codes. For arch dams, overall instability is usually catastrophic and will lead to failure of the entire dam once it occurs; by contrast, local over-limit stress is generally a localized problem. Concrete possesses certain plastic adjustment capacity, so local stress abnormality does not immediately endanger the overall safety. Therefore, the overall stability index should be assigned a higher weight than the stress index in the comprehensive evaluation. For medium and low arch dams (dam height ≤ 70 m), the influence of stress state on overall stability is relatively prominent; for high arch dams (dam height > 70 m), the overall anti-sliding stability plays a more critical role.
In this project, the risk grade mapping method is adopted to divide the comprehensive evaluation index K into the following three grades, as shown in Table 1.
Level I (Safe and Stable): The arch dam operates in an excellent overall safe state. The comprehensive stability coefficient K reaches a high standard value, indicating that the structure possesses not only sufficient safety reserve but also stable performance. At this level, the stress distribution of the dam body remains in an ideal state, with no over-limit regions or only micro-scale local stress concentration ( S n ≈ 1.0); meanwhile, the strength reduction safety factor F s is much higher than the code requirement, and the dam-foundation system maintains an equilibrium state with a high strength reserve.
Level II (Critical State): The arch dam is in a high-risk early-warning state transitioning from stable to unsafe. The comprehensive index K falls below the upper safety threshold. Although it has not yet reached the instability criterion, the stability margin has narrowed significantly. The evaluation at this state is generally characterized by acceptable stress conditions but inadequate strength reserve. No large-scale stress over-limit occurs in the dam body, while the strength reduction safety factor F s decreases evidently, and the overall bearing capacity of the structure approaches the design limit.
Level III (Instability Risk): The arch dam is in an extremely dangerous, critical instability state. The comprehensive stability coefficient K falls below the safety bottom line with extremely poor structural stability. This level represents the red line of engineering safety, signifying that the integrated dam-foundation system is close to or reaches the limit equilibrium state. At this moment, even if the stress index performs perfectly, it cannot cover the fatal deficiency of insufficient overall bearing capacity, and global instability may occur at any time.

3. Application

3.1. Project Overview

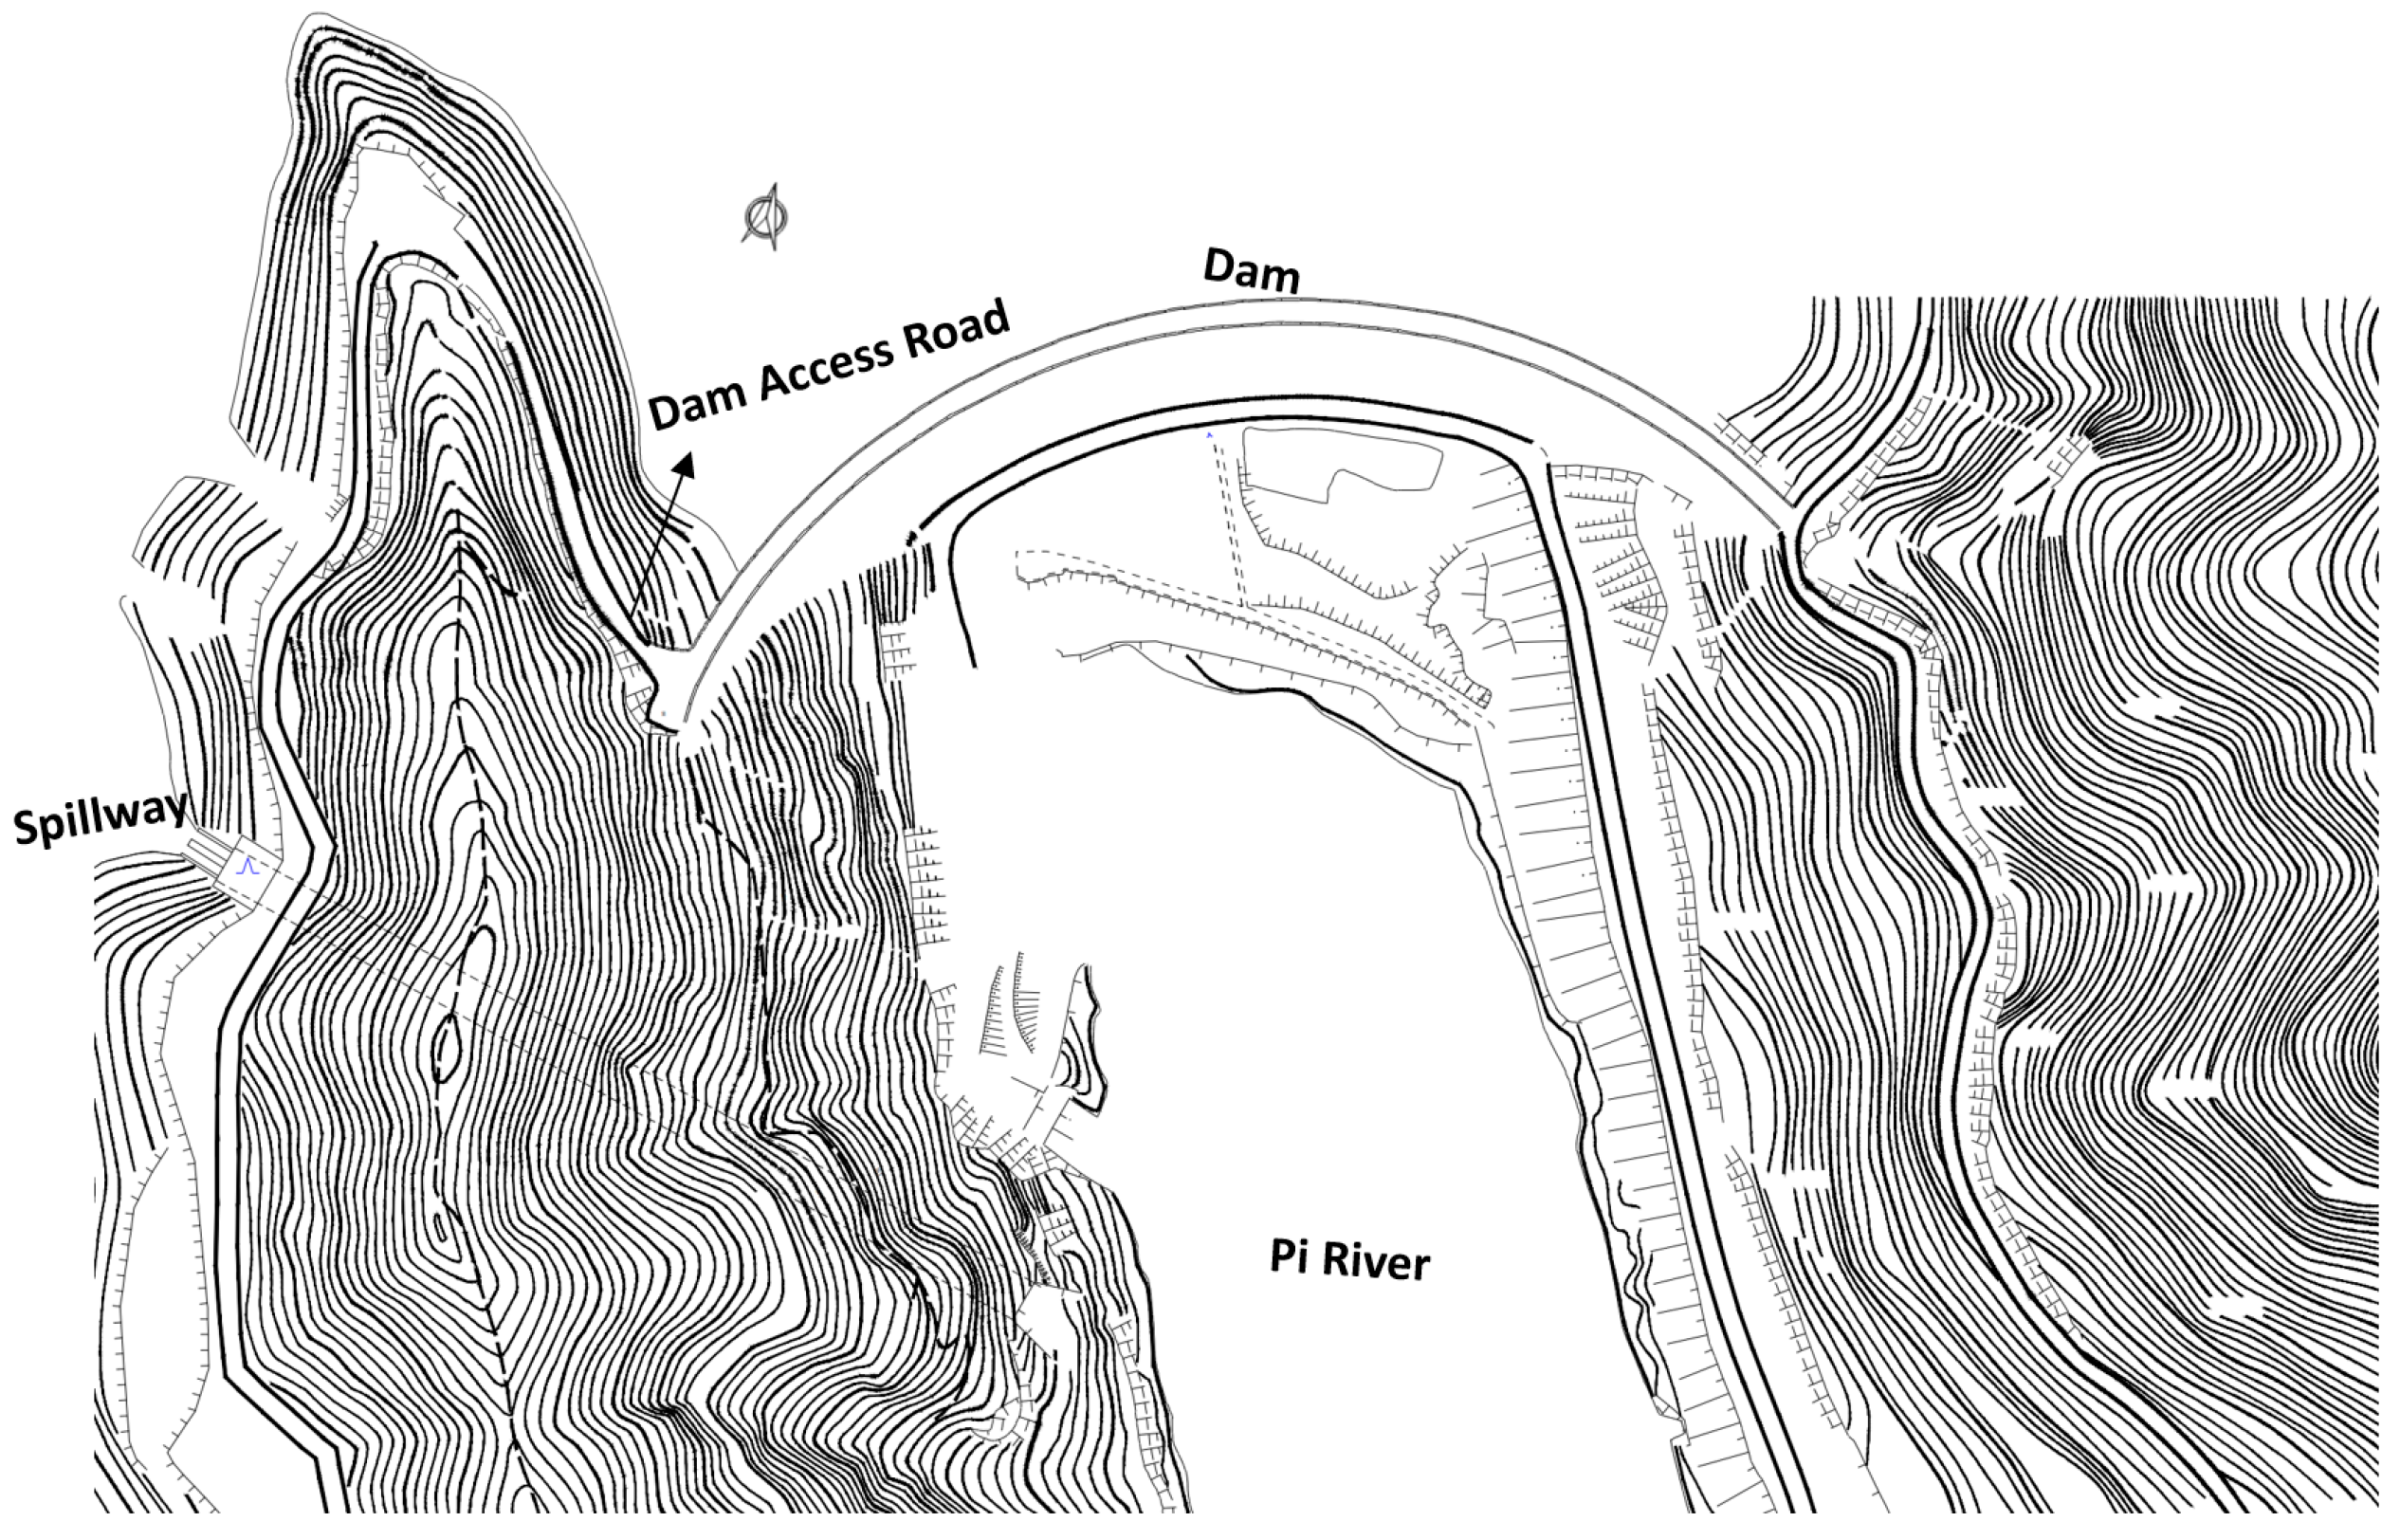
An arch dam is located on the Pi River in Anhui Province, China, serving as a crucial key water conservancy hub project within the Pishihang Irrigation System. The corresponding reservoir acts as the lower reservoir, with the arch dam functioning as the core hub of the reservoir. The pumped storage power station was completed and put into operation in 2001, being the first pumped storage power station in Anhui Province. The layout and topographic map of the arch dam are shown in Figure 1.
Fault F2 is located at the left abutment of the arch dam. It strikes NW20°, dips southwestward with an inclination angle of 53–65°, and belongs to a tensional-shear fault. The hanging wall consists of tuff, while the footwall is composed of trachyte. The rock mass is weathered and covered with yellow and gray cohesive soil, as well as dark brown organic matter of varying thickness. The filler materials are fine-grained with a greasy, slippery feel.
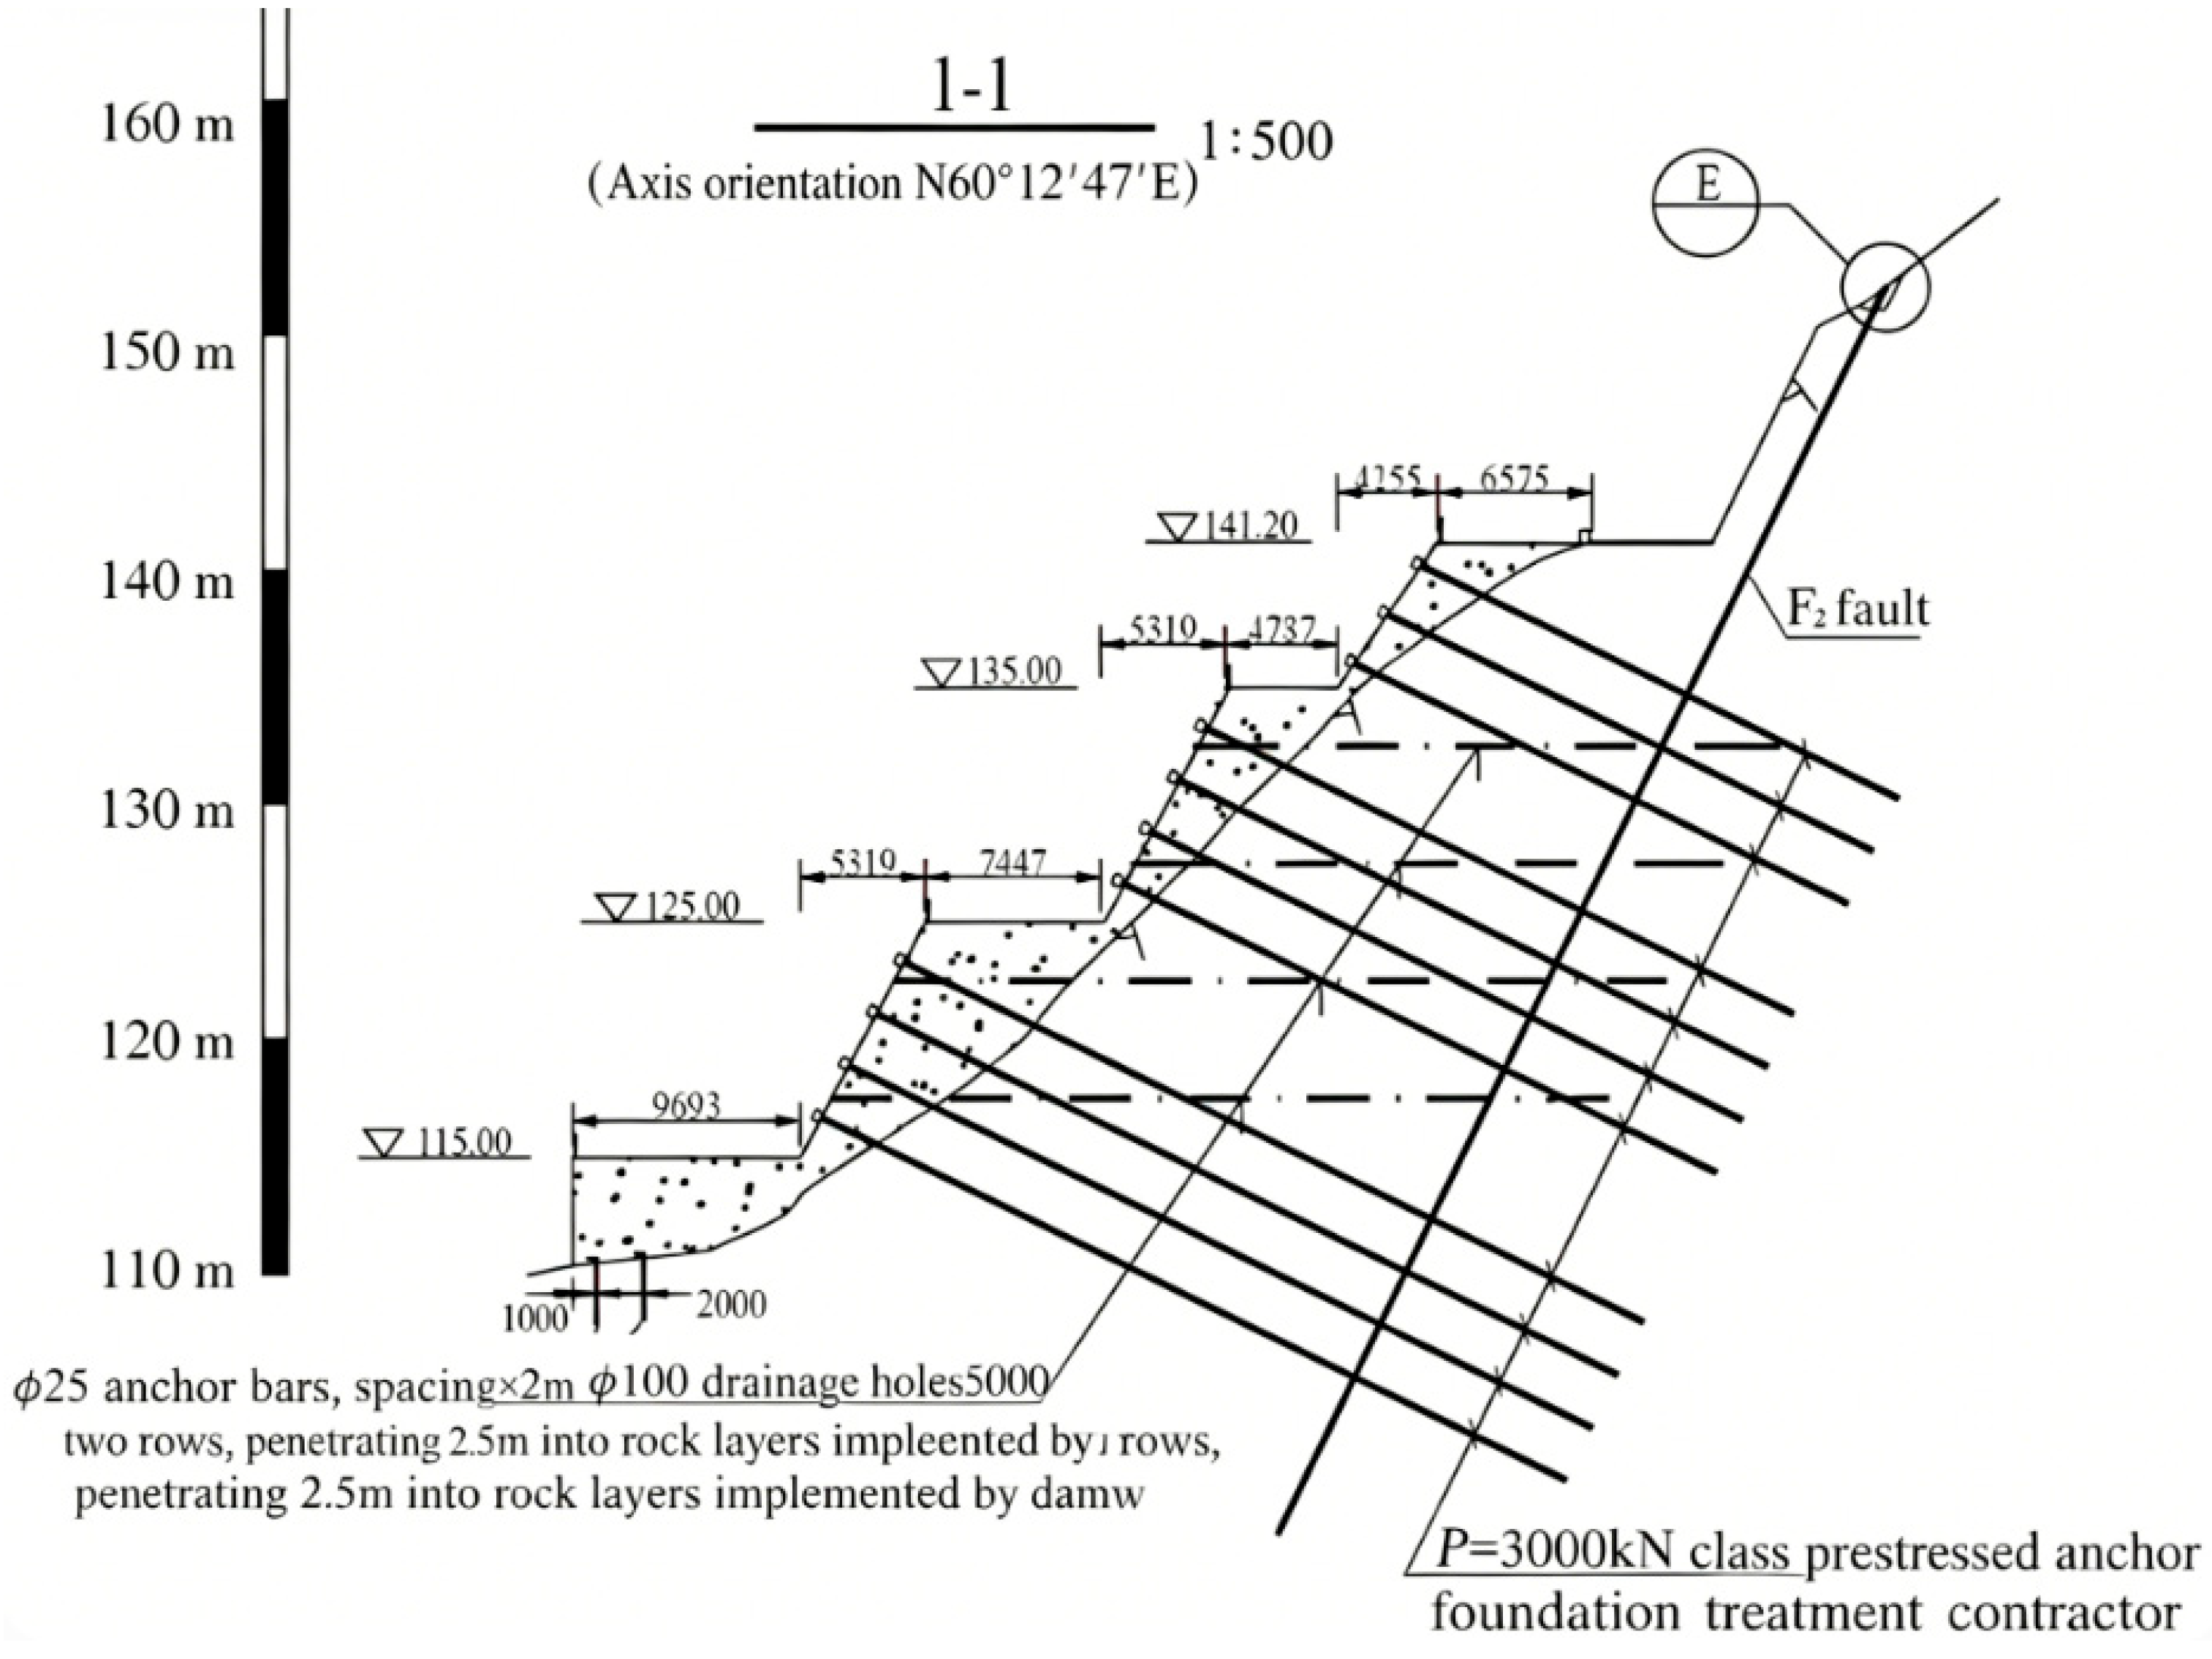
During the demonstration of the reservoir reinforcement scheme from 2008 to 2012, additional reinforcement was determined for Fault F2. A total of 11 rows of prestressed anchor cables were arranged at elevations of 116.25 m to 141.75 m with a spacing of 2.5 m. The anchoring direction is perpendicular to the fracture surface of Fault F2. The designed anchorage force of each single anchor hole is 3000 kN, with a total of 230 holes, as shown in Figure 2.

3.2. Analysis Procedure

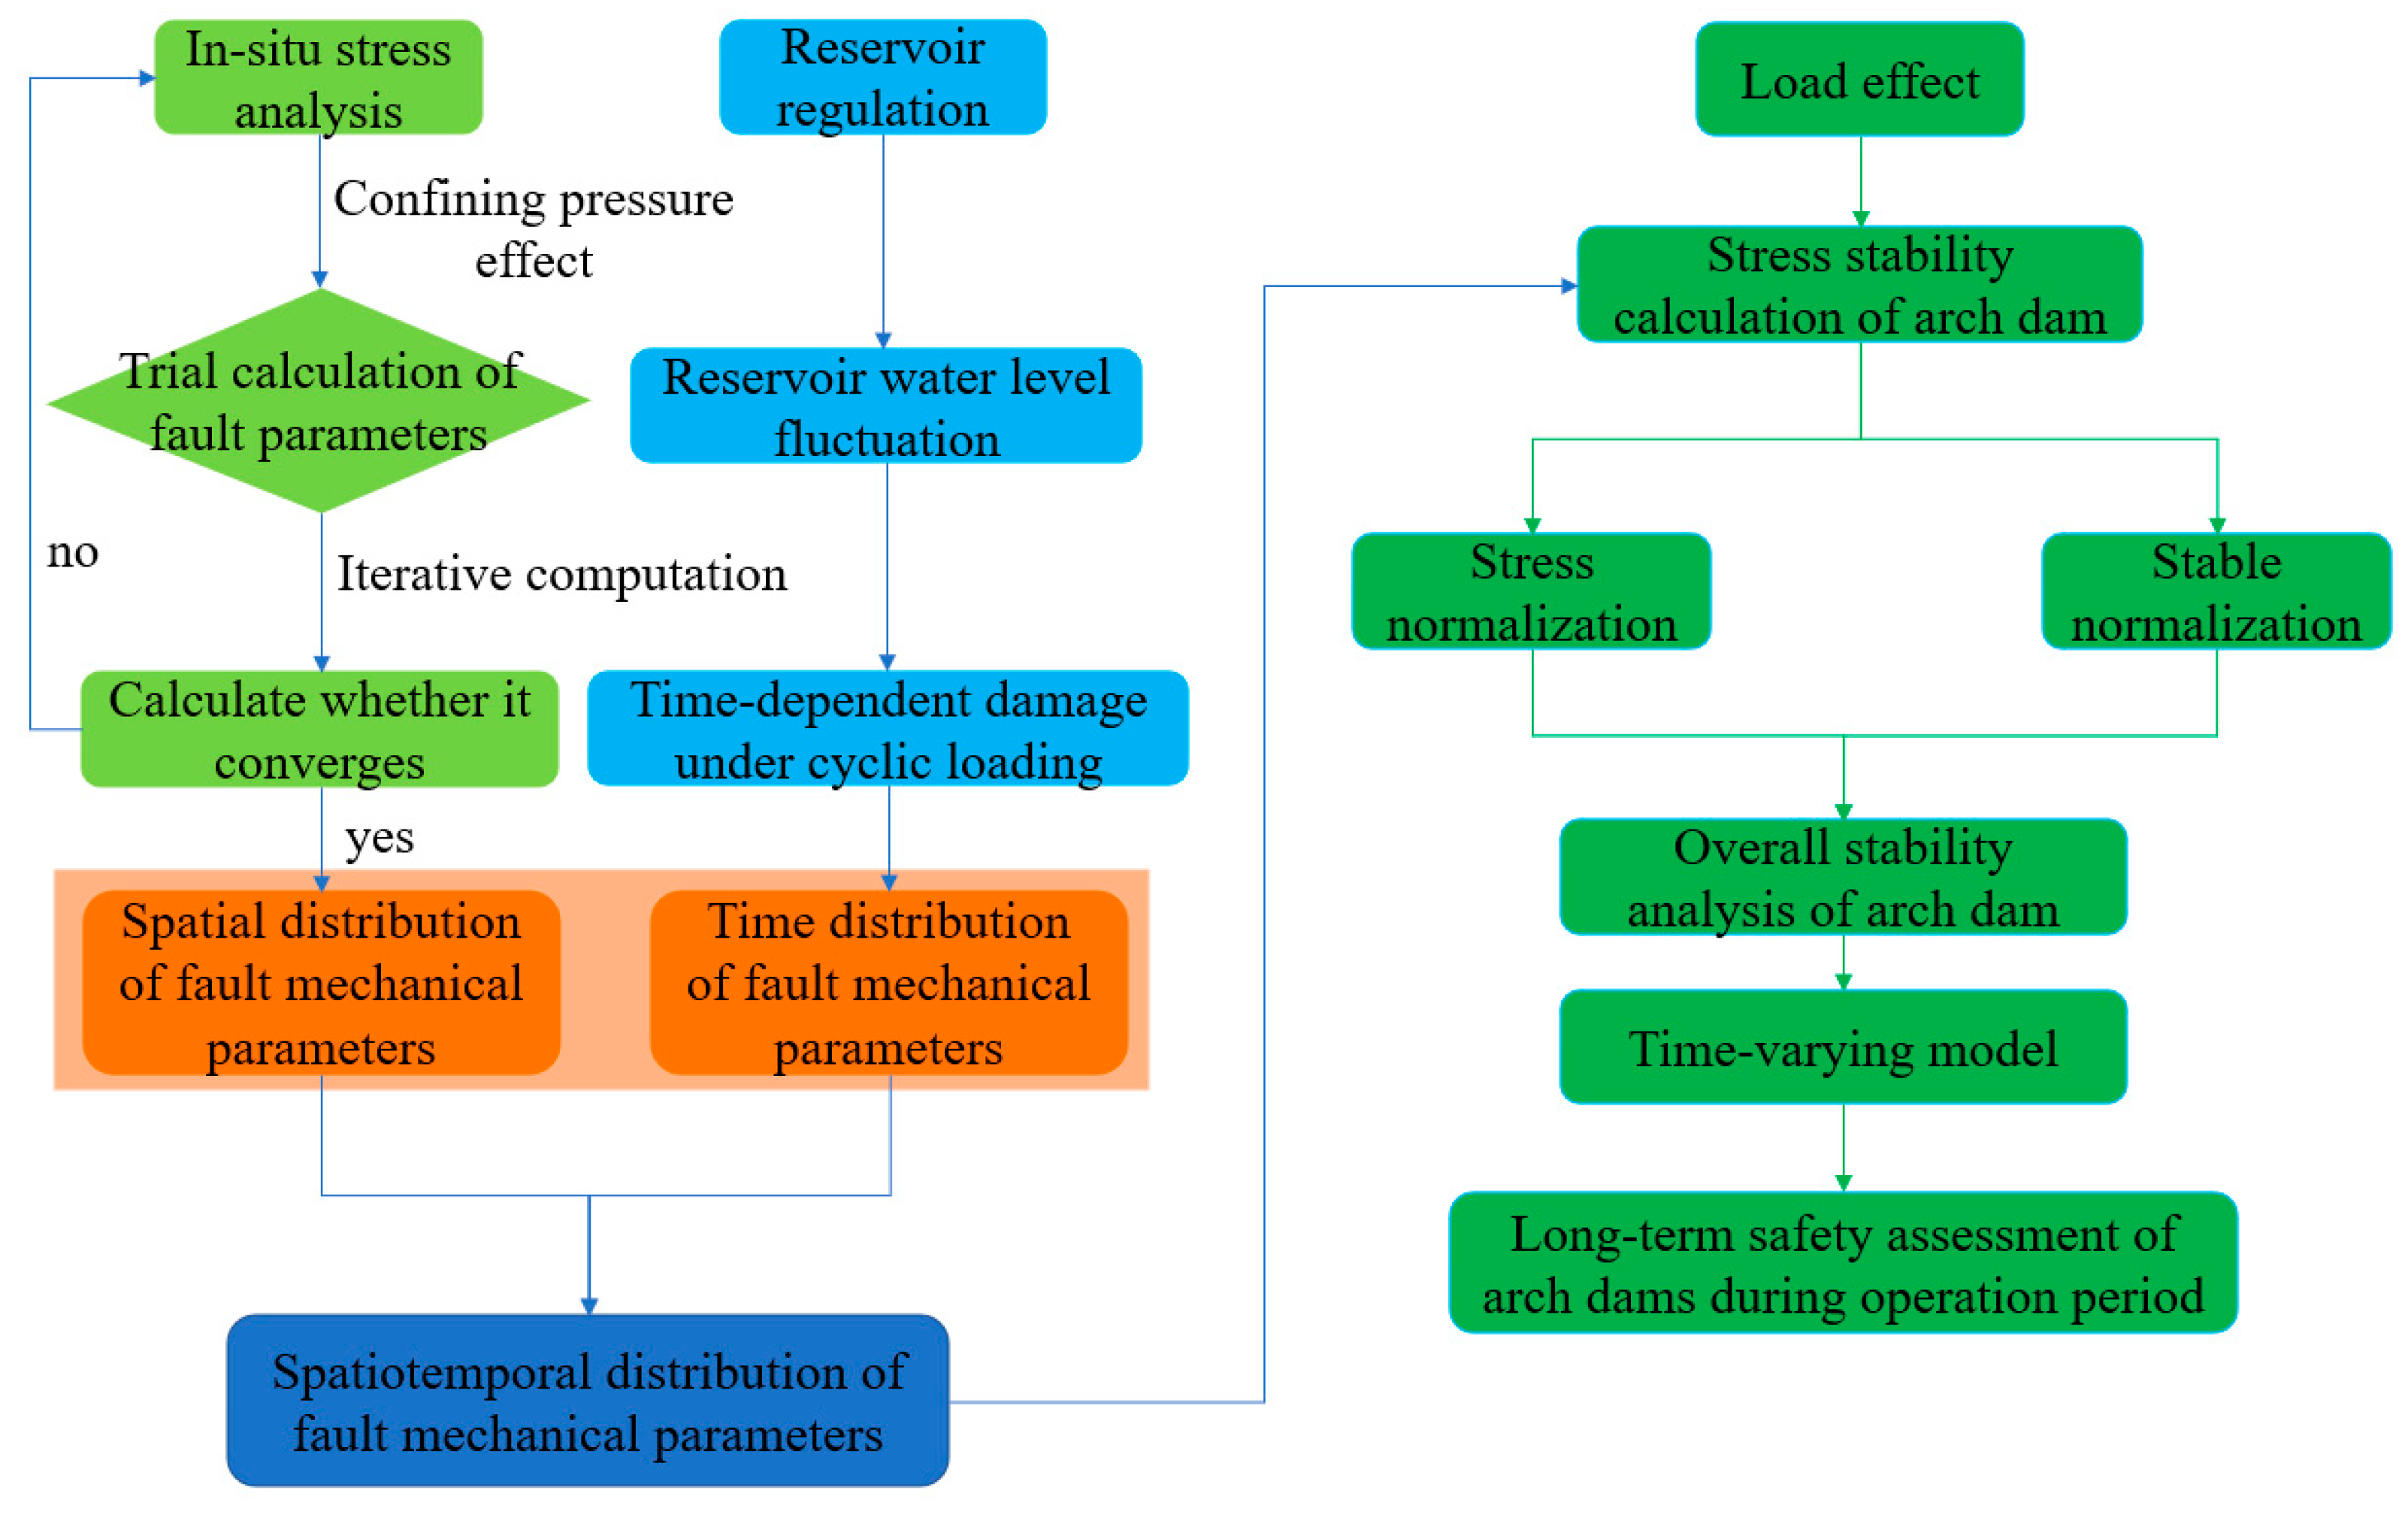
By adopting the UMAT subroutine for iterative calculation, the coupled analysis of fault mechanical parameters and in situ stress is realized to characterize the mechanical behavior of faults under confining pressure. Furthermore, a time-varying damage constitutive model is developed by simulating the cyclic loading and unloading process of the reservoir water level. By integrating the above methods, a comprehensive evaluation framework is established to assess the performance of the arch dam throughout its service life. The specific technical flowchart is presented in Figure 3.

3.3. Calculation Model

In the original design scheme, radial contraction joints (i.e., transverse joints) were arranged at an interval of 14 m along the dam axis. However, during the construction period, the dam was actually poured into 24 monoliths, and the spacing of transverse joints was adjusted accordingly.
For this long-term operated arch dam water conservancy project, the concrete layered pouring process is temporarily neglected in the numerical simulation, and only the mechanical effect of transverse joint grouting is considered. According to the available data, the joint grouting of the dam was implemented in three phases: the first phase completed grouting for the area below the elevation of 78.5 m; the second phase covered the dam section from 78.5 m to 126.5 m in elevation; and the third phase carried out grouting construction for the region above the elevation of 126.5 m.

3.3.1. Finite Element Model

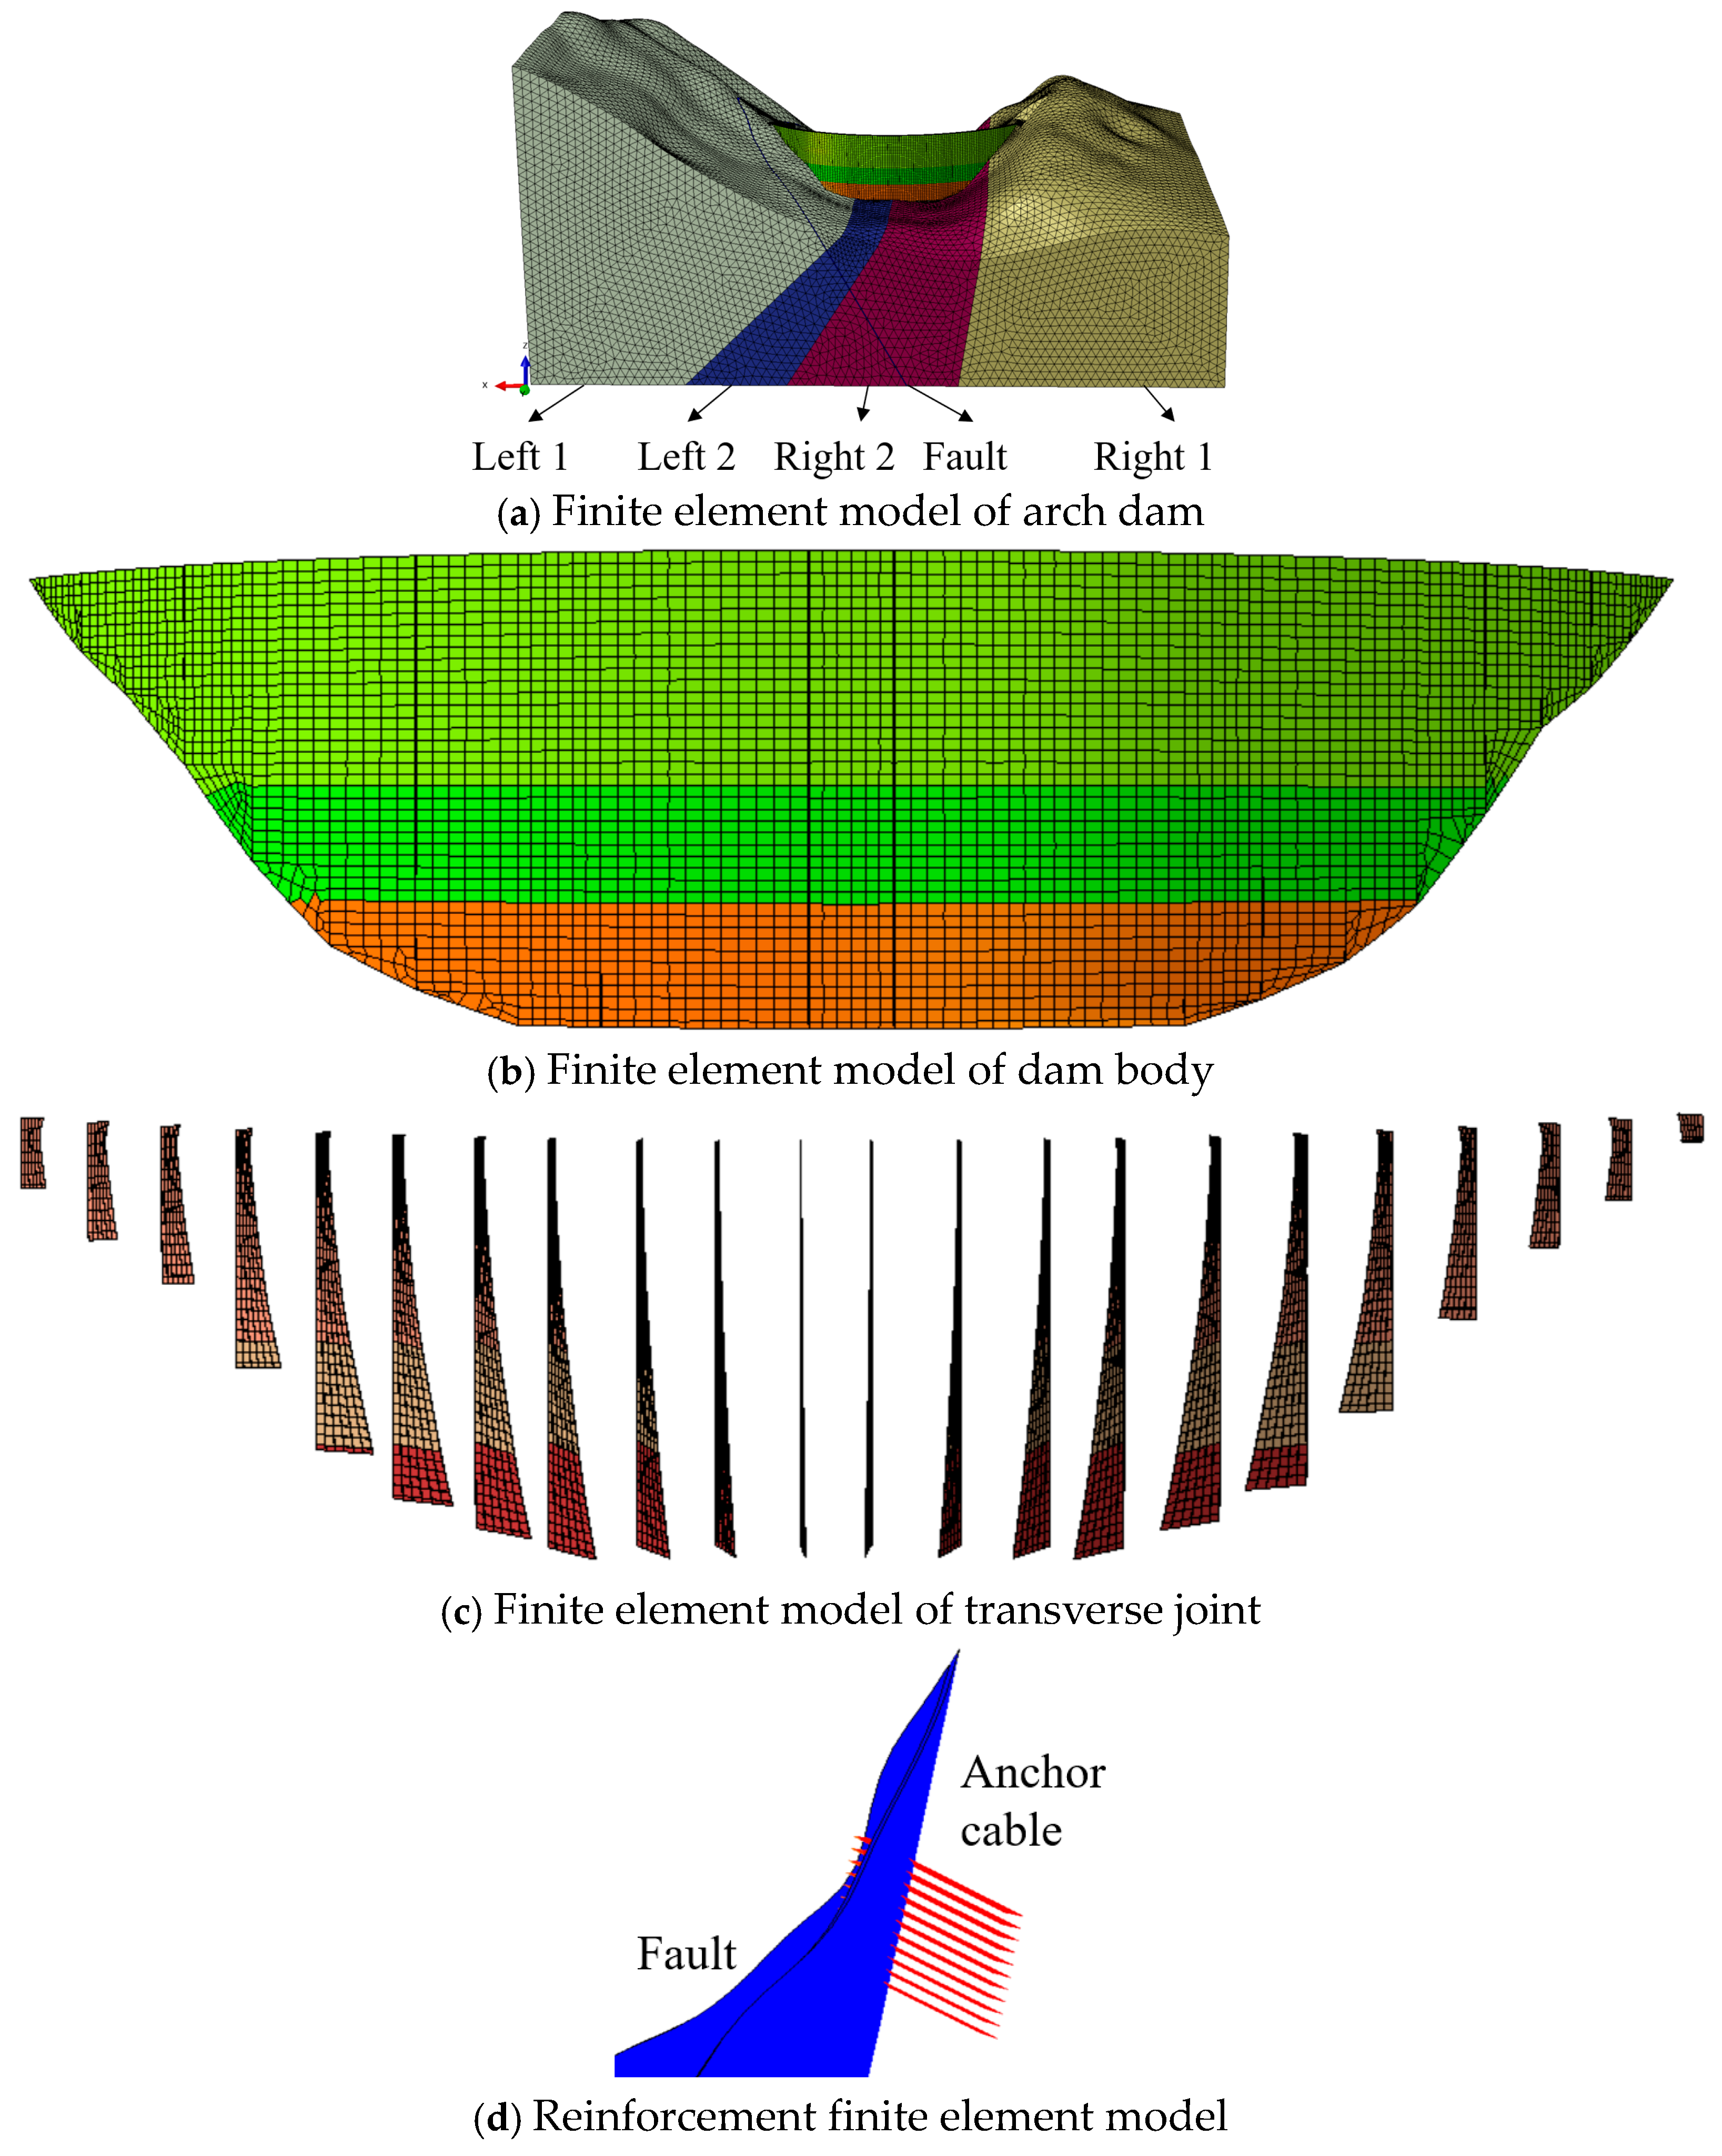
The elevation of the arch dam base is 64 m, and the crest elevation is 143.4 m, with a maximum dam height of 79.4 m. To reduce the influence of boundary constraints on numerical analysis results, taking the center of the dam base as the reference, the horizontal extent is 380 m on both the left and right banks, and 230 m in the upstream and downstream directions. The numerical model contains 364,837 elements and 96,840 nodes, as shown in Figure 4. Both the dam body and the fault are discretized by hexahedral elements (C3D8), while the foundation is meshed with tetrahedral elements (C3D4). To mitigate stress concentration, a thin element layer is arranged at the contact interface between the dam body and the mountain mass, with a thickness of 1/100 of the dam height. The bottom and surroundings of the model are normal constraints.

3.3.2. Calculation Parameters

Material parameters are assigned according to the basic engineering data, as listed in Table 2:
Truss elements are adopted in Abaqus to simulate anchor cables. The prestress of 3000 kN per hole is applied by the temperature drop method, and the anchor cables are embedded into the stress analysis system consisting of the fault, foundation and dam body via the embedded region technique.

3.3.3. Working Conditions and Calculation Loads

1.
Calculation Conditions
In accordance with the Design Code for Concrete Arch Dams and Design Code for Concrete Gravity Dams, the loads considered in this numerical simulation include self-weight, hydrostatic pressure, temperature load, uplift pressure, and sediment pressure. The corresponding calculation working conditions determined according to the load combination are listed in Table 3.
2.
Calculation Loads
The base elevation of the dam is 64 m, with an upstream normal water depth of 61 m and a downstream normal water level of 20 m. The arch dam is located at a river valley bend. When the reservoir is fully impounded, the straight-line distance from the water surface in front of the dam to the opposite bank is only 0.5 km, resulting in negligible wave pressure, which can therefore be ignored.
As the project is situated in a non-cold region, the winter water level generally does not exceed 128 m, so ice pressure is not considered. Meanwhile, the sediment depth in front of the dam is small, and sediment pressure can also be neglected.
For this long-term operating arch dam, the temperature rises, and the temperature difference induced by concrete hydration heat has completely dissipated; thus, the thermal effect during the construction period can be excluded. Only the temperature load caused by ambient temperature fluctuation during the operation period is taken into account, as expressed in the following formula:
Δ T ( x , y , z ) = T act ( x , y , z ) T sta ( x , y , z )
where Δ T is the temperature difference distribution (a positive temperature difference indicates that the actual temperature is higher than the reference temperature, leading to an expansion tendency of the dam body; a negative temperature difference means the actual temperature is lower than the reference temperature, resulting in a contraction tendency of the dam body); T act denotes the actual temperature field under a certain operating condition during the operation period; and T sta represents the steady-state reference temperature field; ( x , y , z ) are the spatial coordinates of the dam body.
According to the specification NB/T 10870-2021 Design Code for Concrete Arch Dams, the annual average water temperature of the steady-state temperature field is calculated as T w m ( y ) = 7.04   +   ( 18     7.04 ) × e ( 0.04 y ) ; the annual average water temperature formula for the temperature-rise temperature field is T w m ( y ) = 8.07   +   ( 30.2     8.07 ) × e ( 0.04 y ) ; and the annual average water temperature formula for the temperature-drop temperature field is T w m ( y ) = 6.38 + ( 2 6.38 ) × e 0.04 y .

3.3.4. Finite Element Calculation Steps

The finite element analysis first conducts an initial geostress balance of the foundation to bring the foundation rock mass into a stable state of stress and settlement. On this basis, the layered and segmented pouring of the dam body and the construction process of joint grouting are simulated. After the completion of dam pouring, prestressed anchor cables are arranged at the fault on the left bank.
In Abaqus, the embedded region constraint is adopted to embed the truss elements of anchor cables into the bedrock, realizing coordinated stress bearing between anchor cables and the foundation. Subsequently, static loads and temperature loads are applied, and the safety factor is finally solved by the foundation strength reduction method. The specific setting of finite element analysis steps is shown in Table 4.

3.4. Stress and Stability Calculation of Dam Body Considering Confining Pressure Effect

3.4.1. Dam Body Stress Based on Finite Element Method

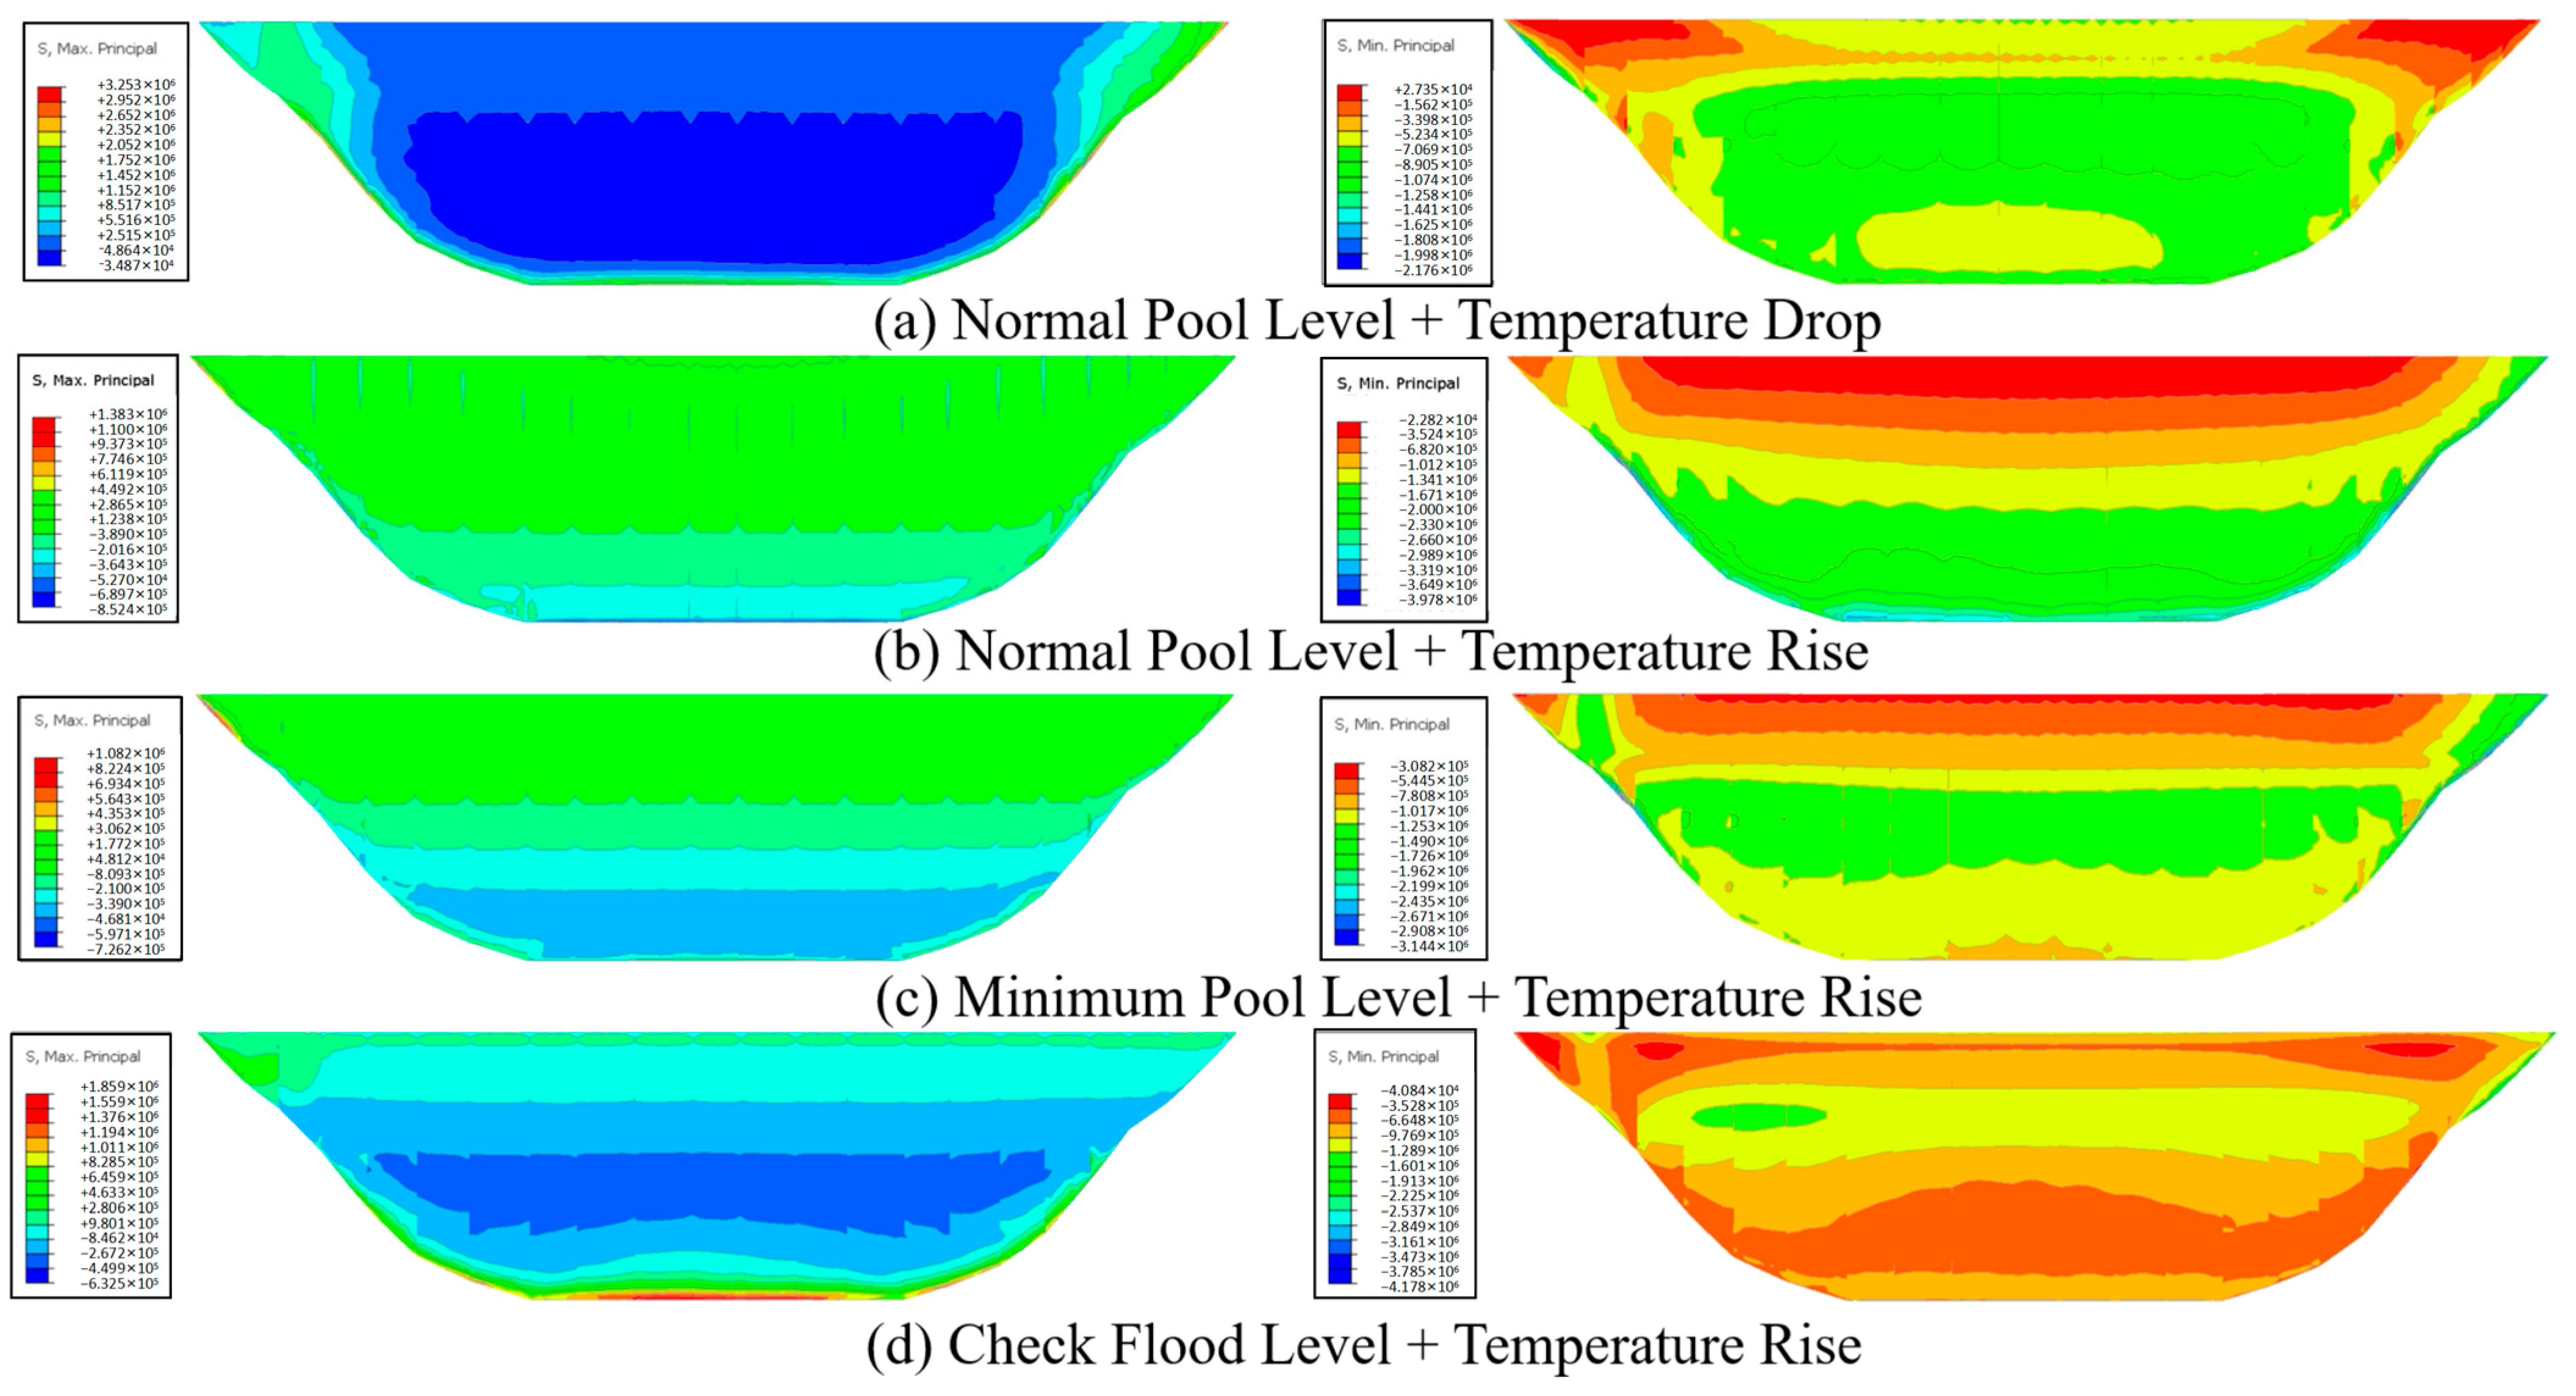
The stress distribution of the dam body is presented in Figure 5. Apart from several local stress concentration zones, the stress levels in all other regions satisfy the tensile and compressive stress limits of concrete. Comparative analysis of multiple arch dam projects with different heights [26,27] shows a high degree of consistency in both the contour characteristics and magnitude ranges of stress distribution.

3.4.2. Equivalent Stress of Dam Body

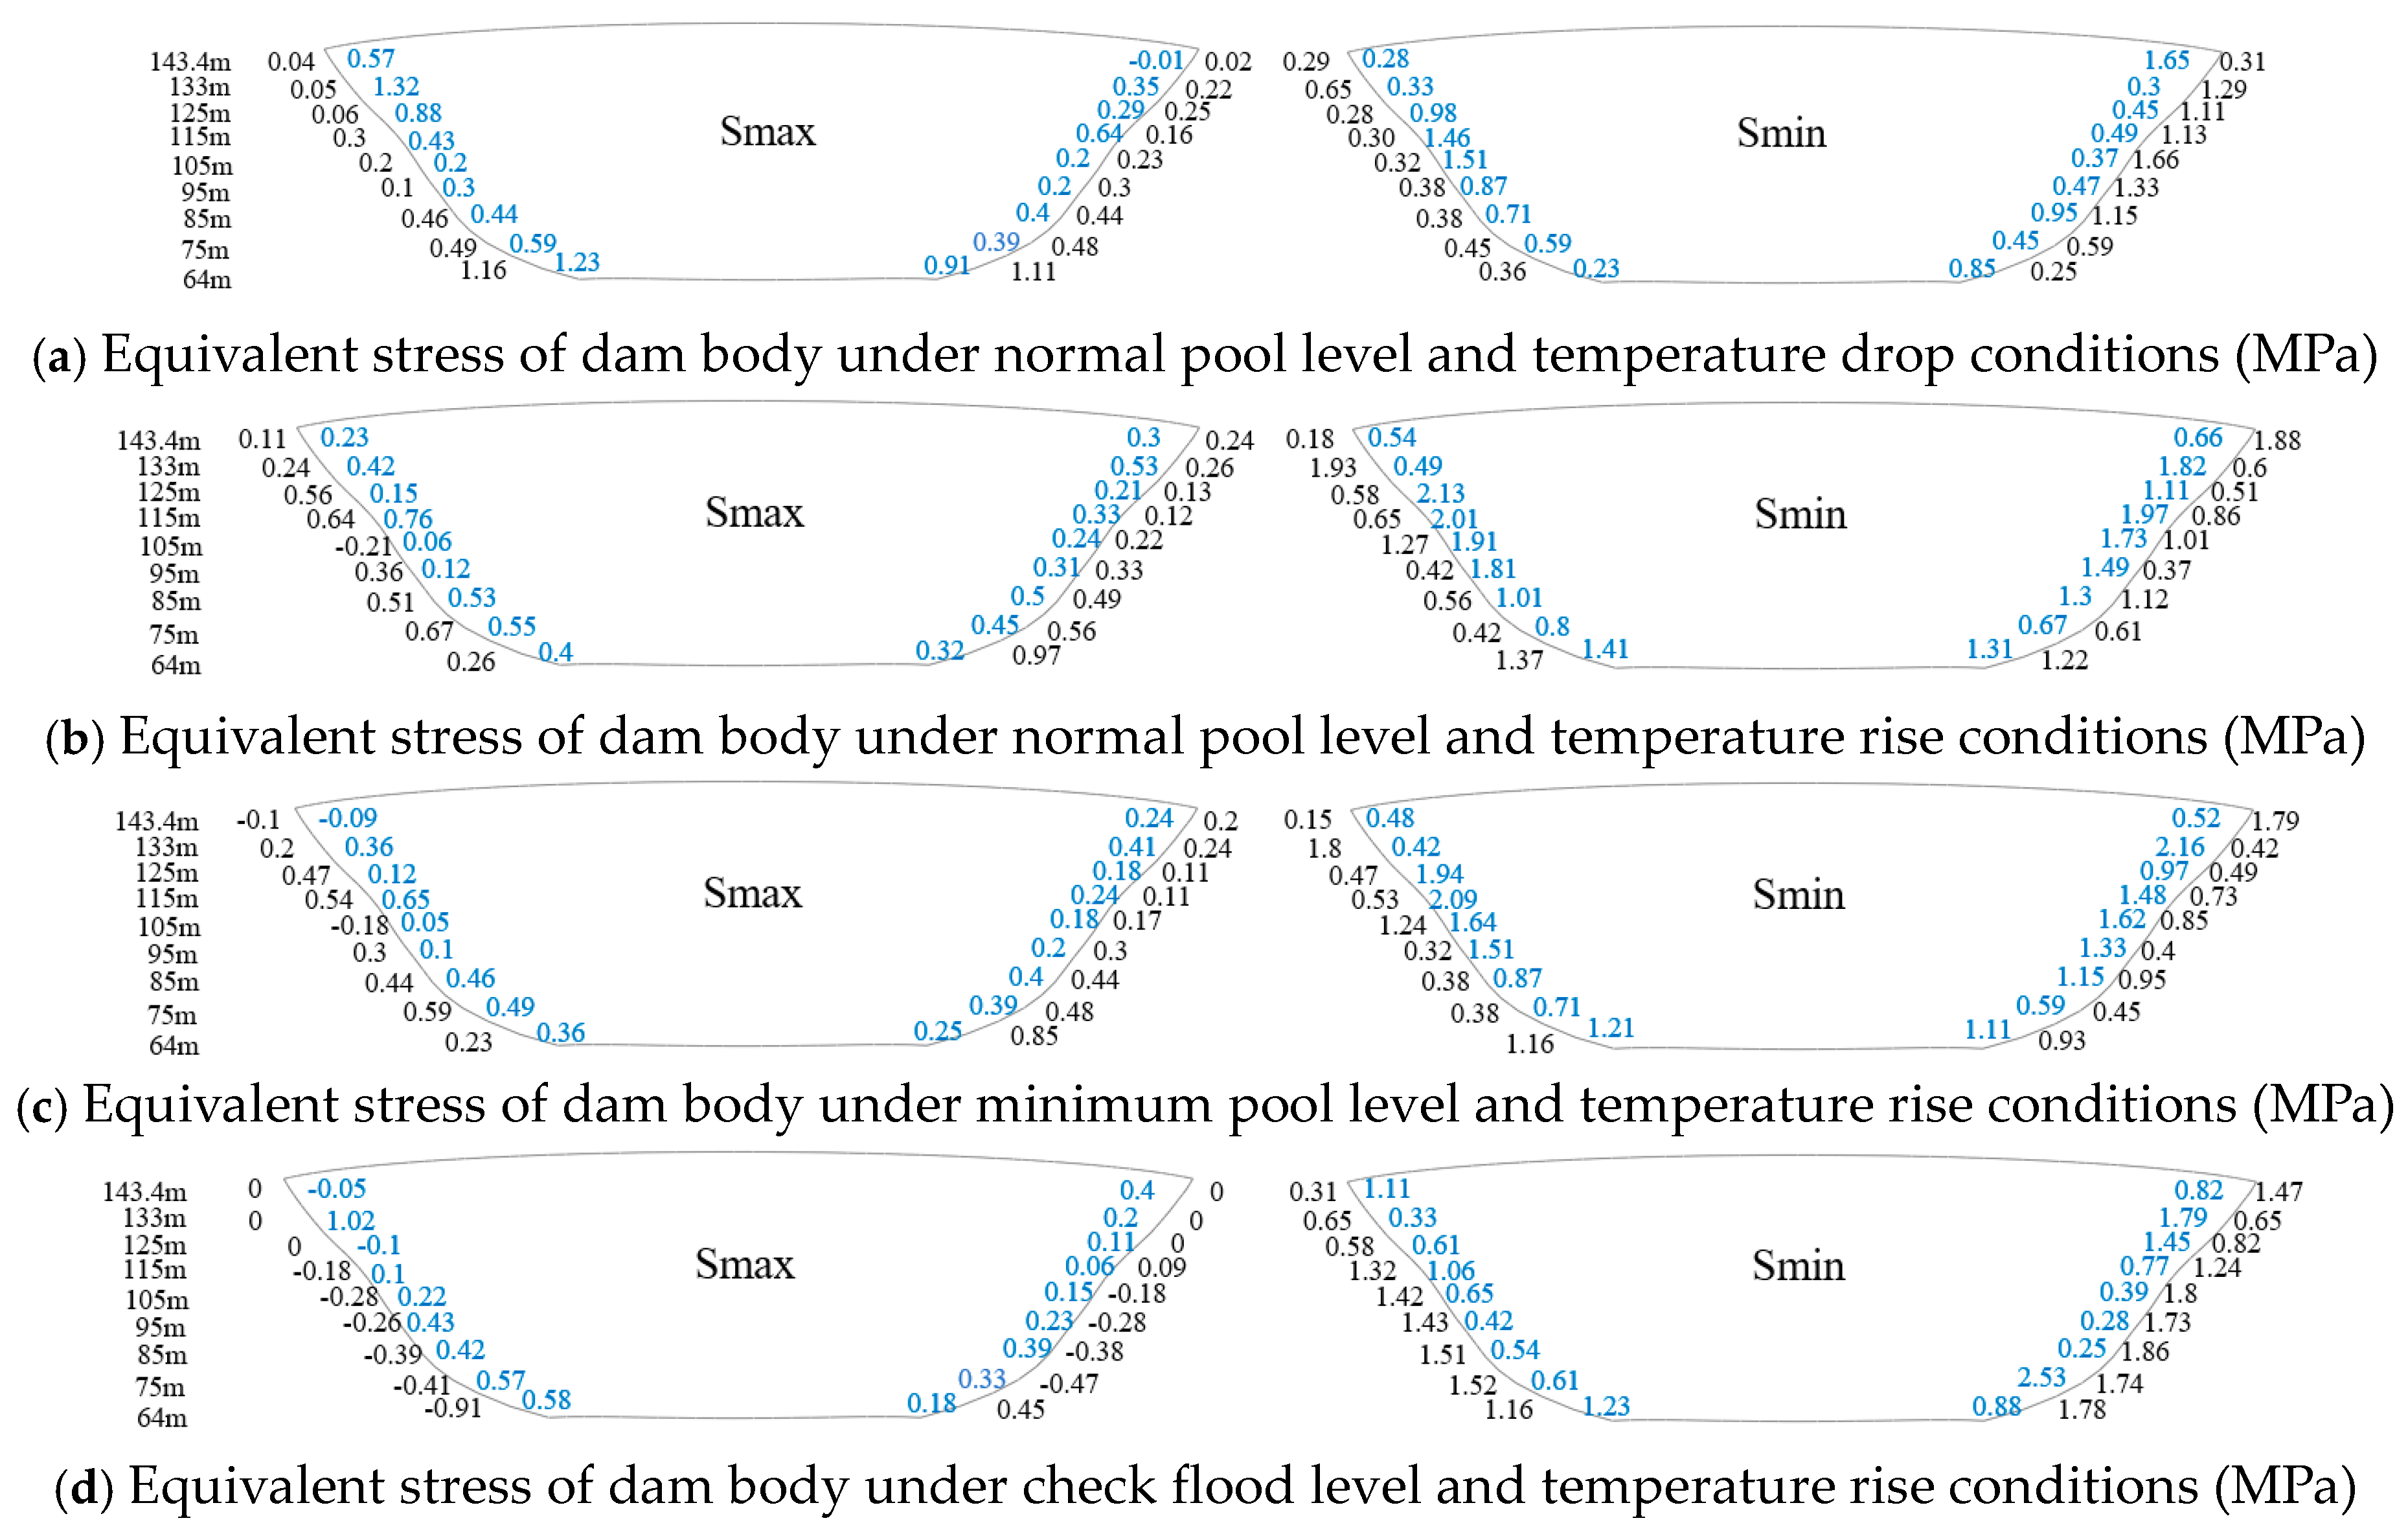
Since the stress concentration in finite element analysis mainly occurs in regions with abrupt material changes, namely the junction between the dam body and the mountain mass, the equivalent stress is only adopted for these contact zones to verify the excessive stress obtained from finite element calculation. As shown in Figure 6, the values marked in blue represent the calculated stresses on the downstream face, while those in black denote the stresses on the upstream face.
After equivalent stress calculation, it can be concluded that: Under the normal pool level and temperature drop conditions, the maximum tensile stress and maximum compressive stress of the dam body are 1.32 MPa and 1.66 MPa, respectively; under the normal pool level and temperature rise conditions, the maximum tensile stress is 0.97 MPa and the maximum compressive stress is 2.13 MPa; under the minimum pool level and temperature rise conditions, the maximum tensile stress is 0.85 MPa and the maximum compressive stress is 2.09 MPa; and under the check flood level and temperature rise conditions, the maximum tensile stress is 1.02 MPa and the maximum compressive stress is 1.86 MPa. All stress values satisfy the requirements for the maximum tensile and compressive stresses of concrete arch dams specified in the design code NB/T 10870-2021.

3.4.3. Abutment Stability Under Confining Pressure Effect

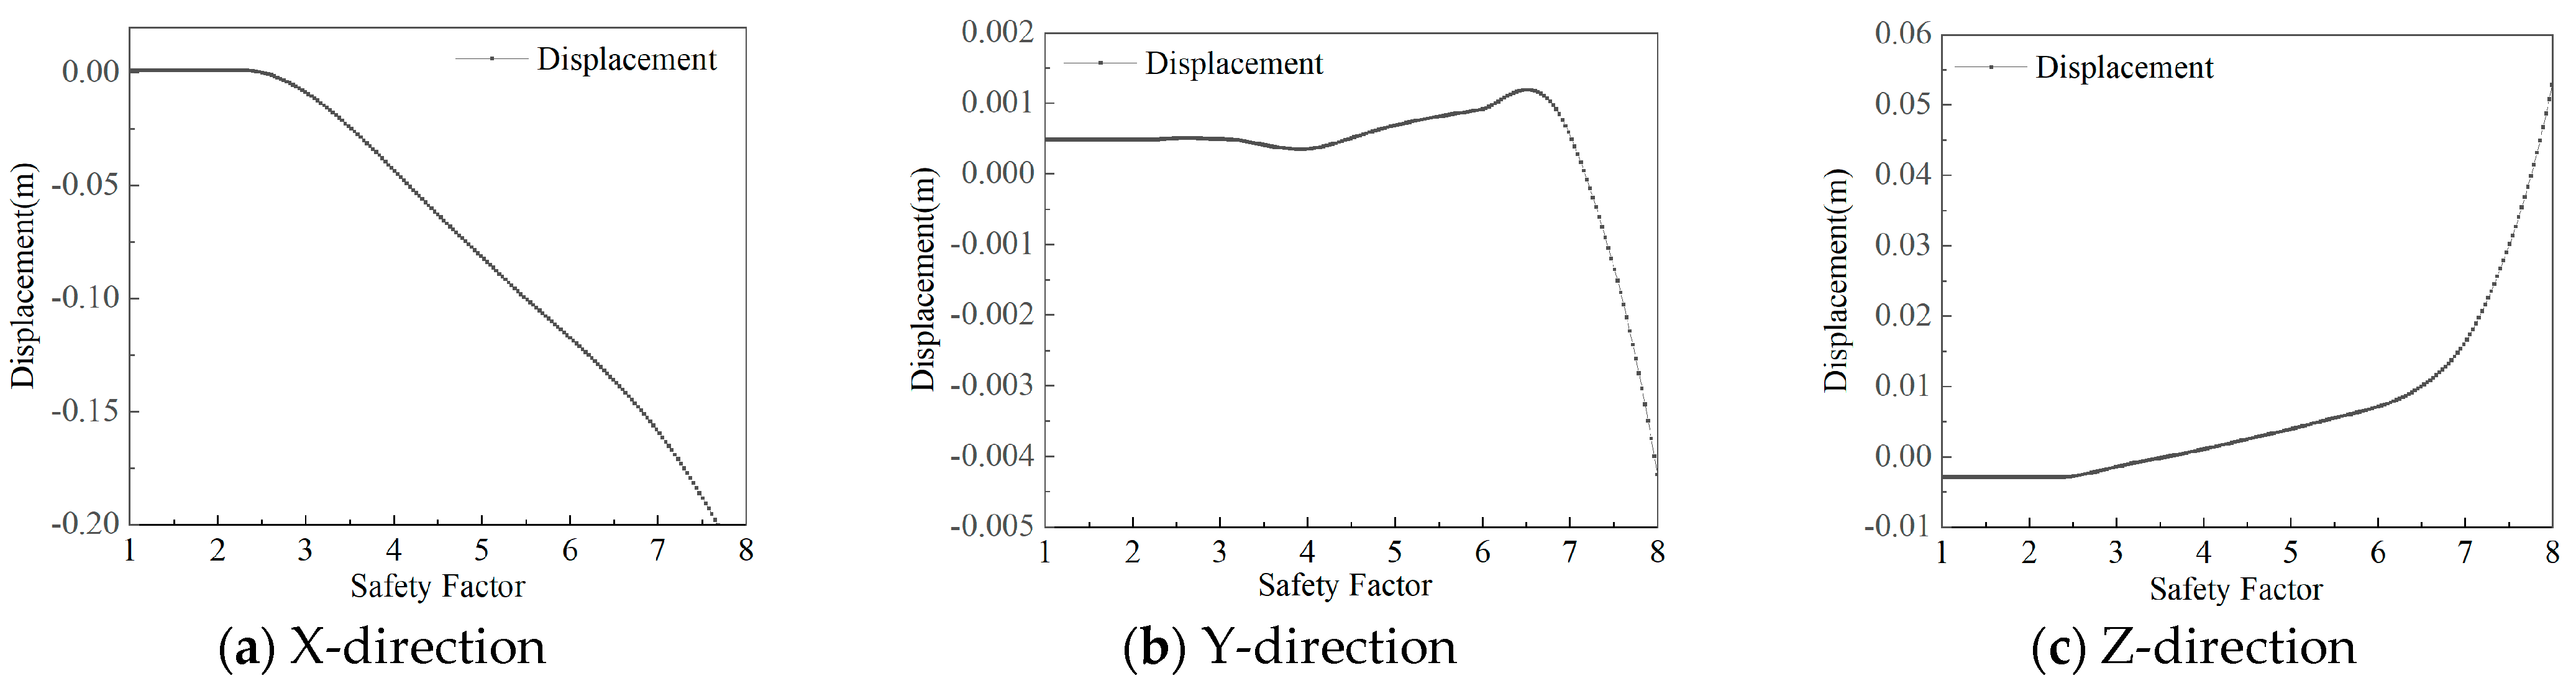
Since a through-going fault exists at the left bank abutment of the project, characteristic points are only selected for the left abutment. The safety factor is analyzed and determined by observing the abrupt displacement variation in these characteristic points during the strength reduction process.
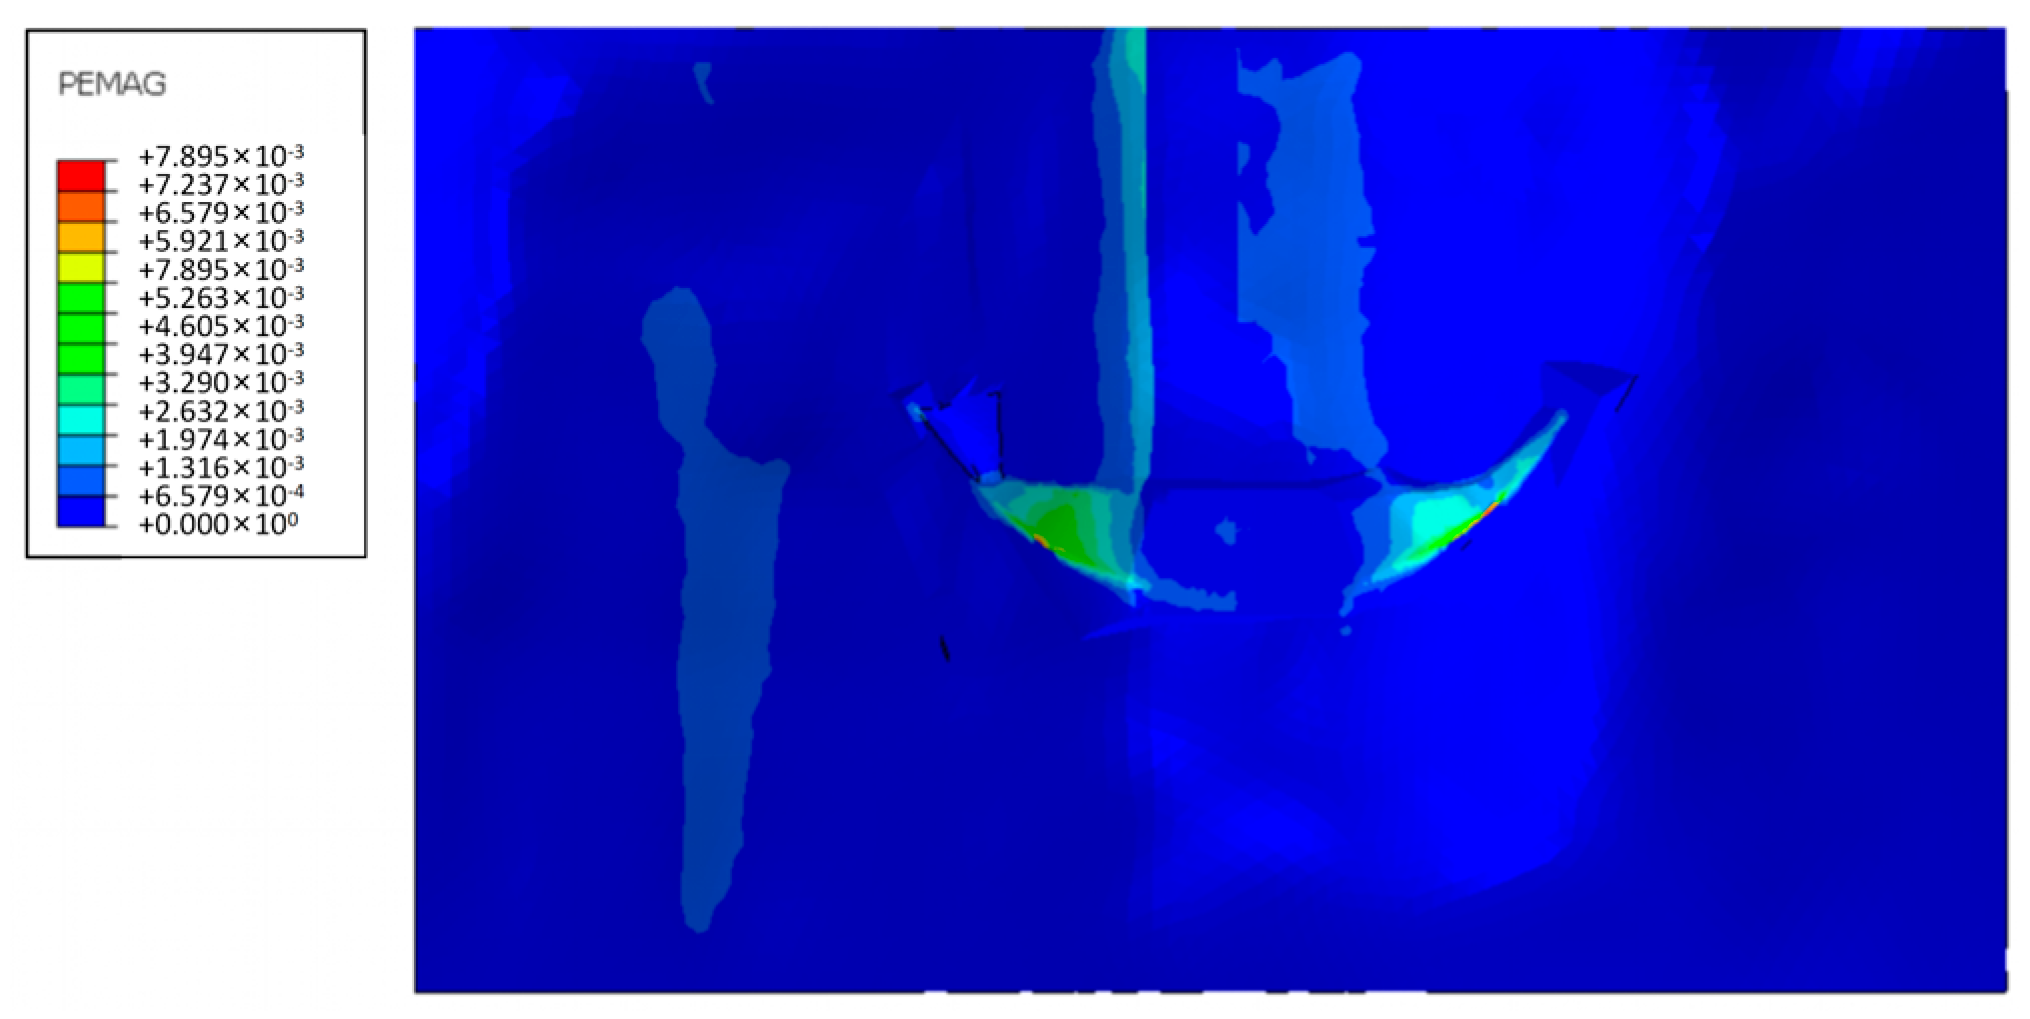
This section analyzes the condition of a normal pool level combined with a temperature drop. The plastic zone distribution is presented in Figure 7. It can be seen that with the progressive strength reduction in the foundation, a through plastic zone develops along the downstream river channel apart from the fault zone. The displacements of characteristic points are extracted to determine the corresponding safety factor as shown in Figure 8.
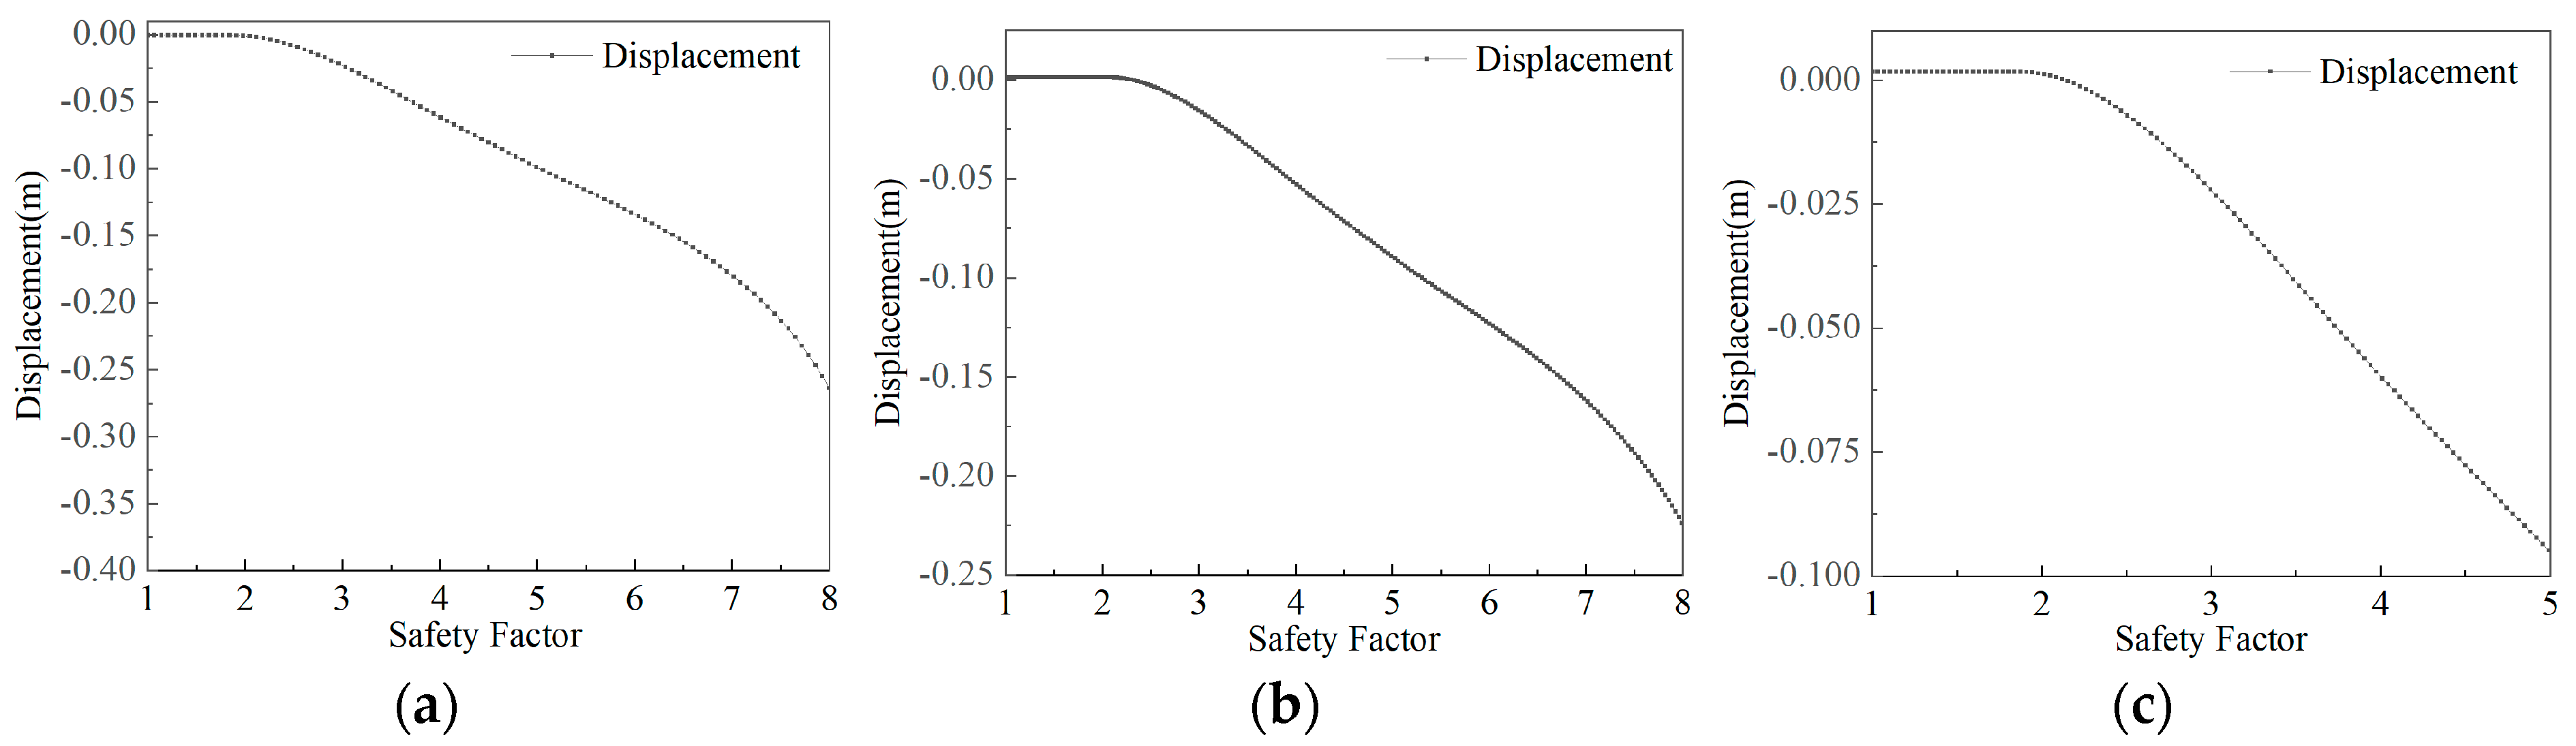
By adopting the same method, the safety factors determined from the displacement inflection points of characteristic points under the other three working conditions can be obtained. The transverse river displacements are extracted and presented in Figure 9 and Table 5.

3.5. Stress and Stability Calculation of Arch Dam Under Combined Action of Confining Pressure Effect and Cyclic Load

3.5.1. Dam Stress Based on Finite Element Method

During the long-term service of the arch dam, the reservoir water level mostly operates at the normal pool level. The temperature rise condition is the most unfavorable load case for dam stability under the normal water level; therefore, only this working condition is adopted for numerical calculation under cyclic loading in this section, so as to evaluate the structural safety of the arch dam under long-term service conditions.
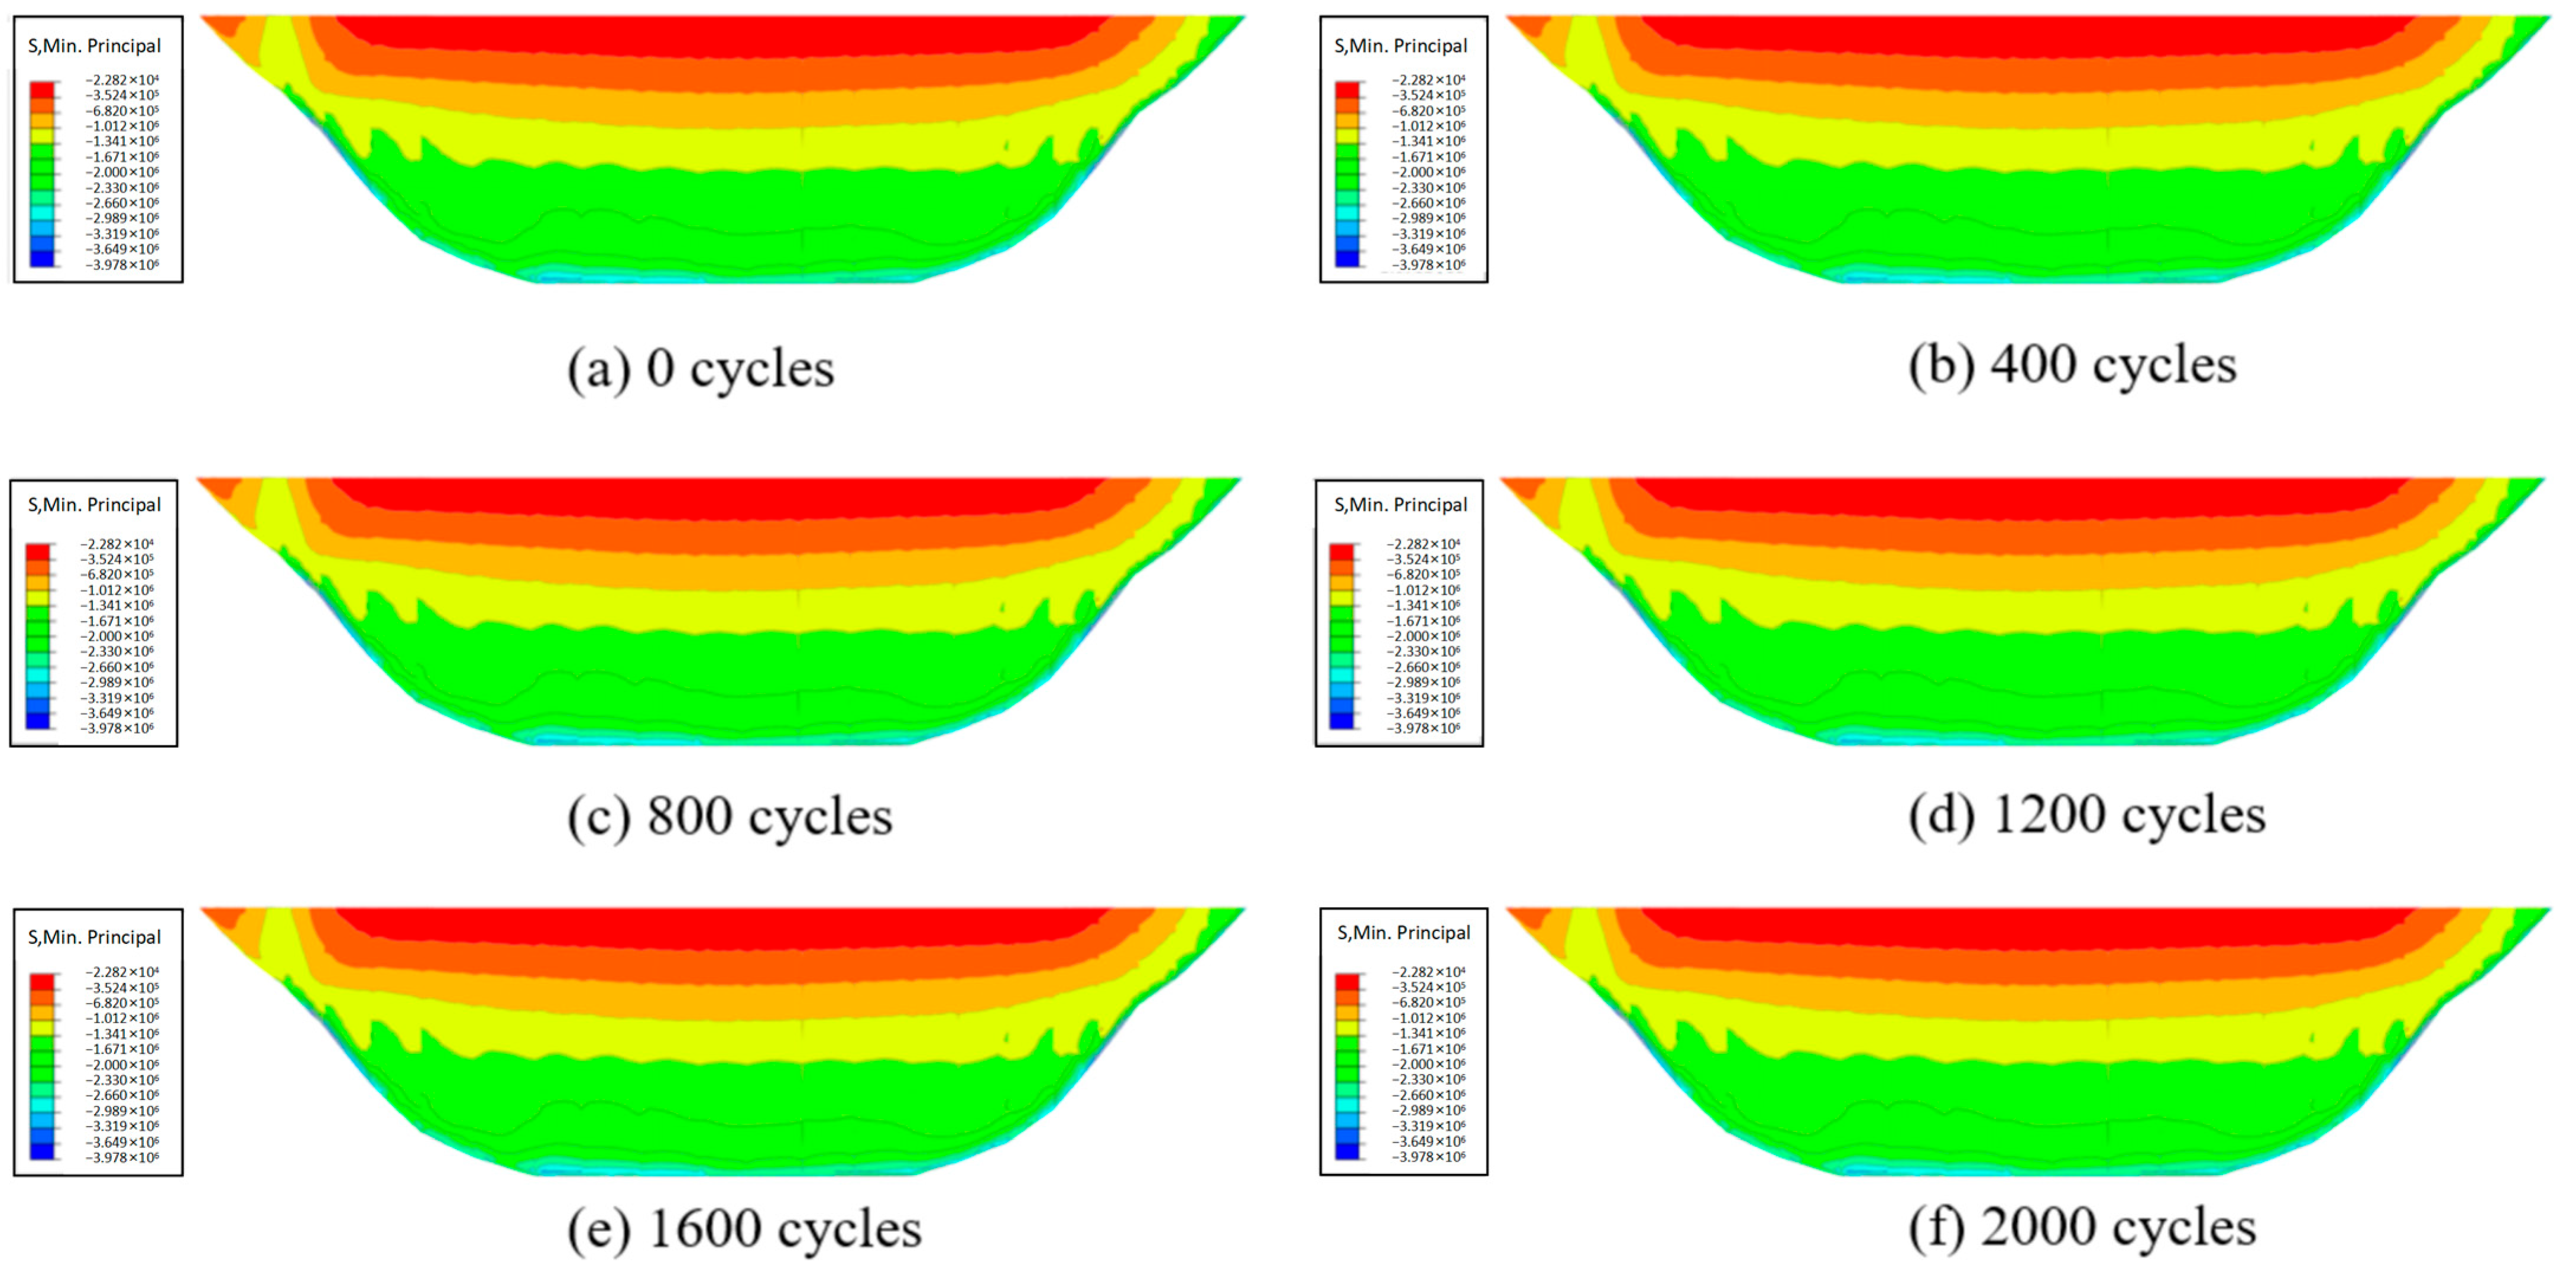
Time simulation is realized by adjusting the time length of incremental steps, and the damage evolution of the fault is simulated in each incremental step according to Equation (14). As shown in Figure 10, the dam stress is basically unaffected under cyclic loading. Although the fault suffers damage induced by cyclic load, the foundation can realize stress redistribution, making the additional stress transferred to the dam almost negligible.

3.5.2. Abutment Stability Under Confining Pressure Effect and Cyclic Loading

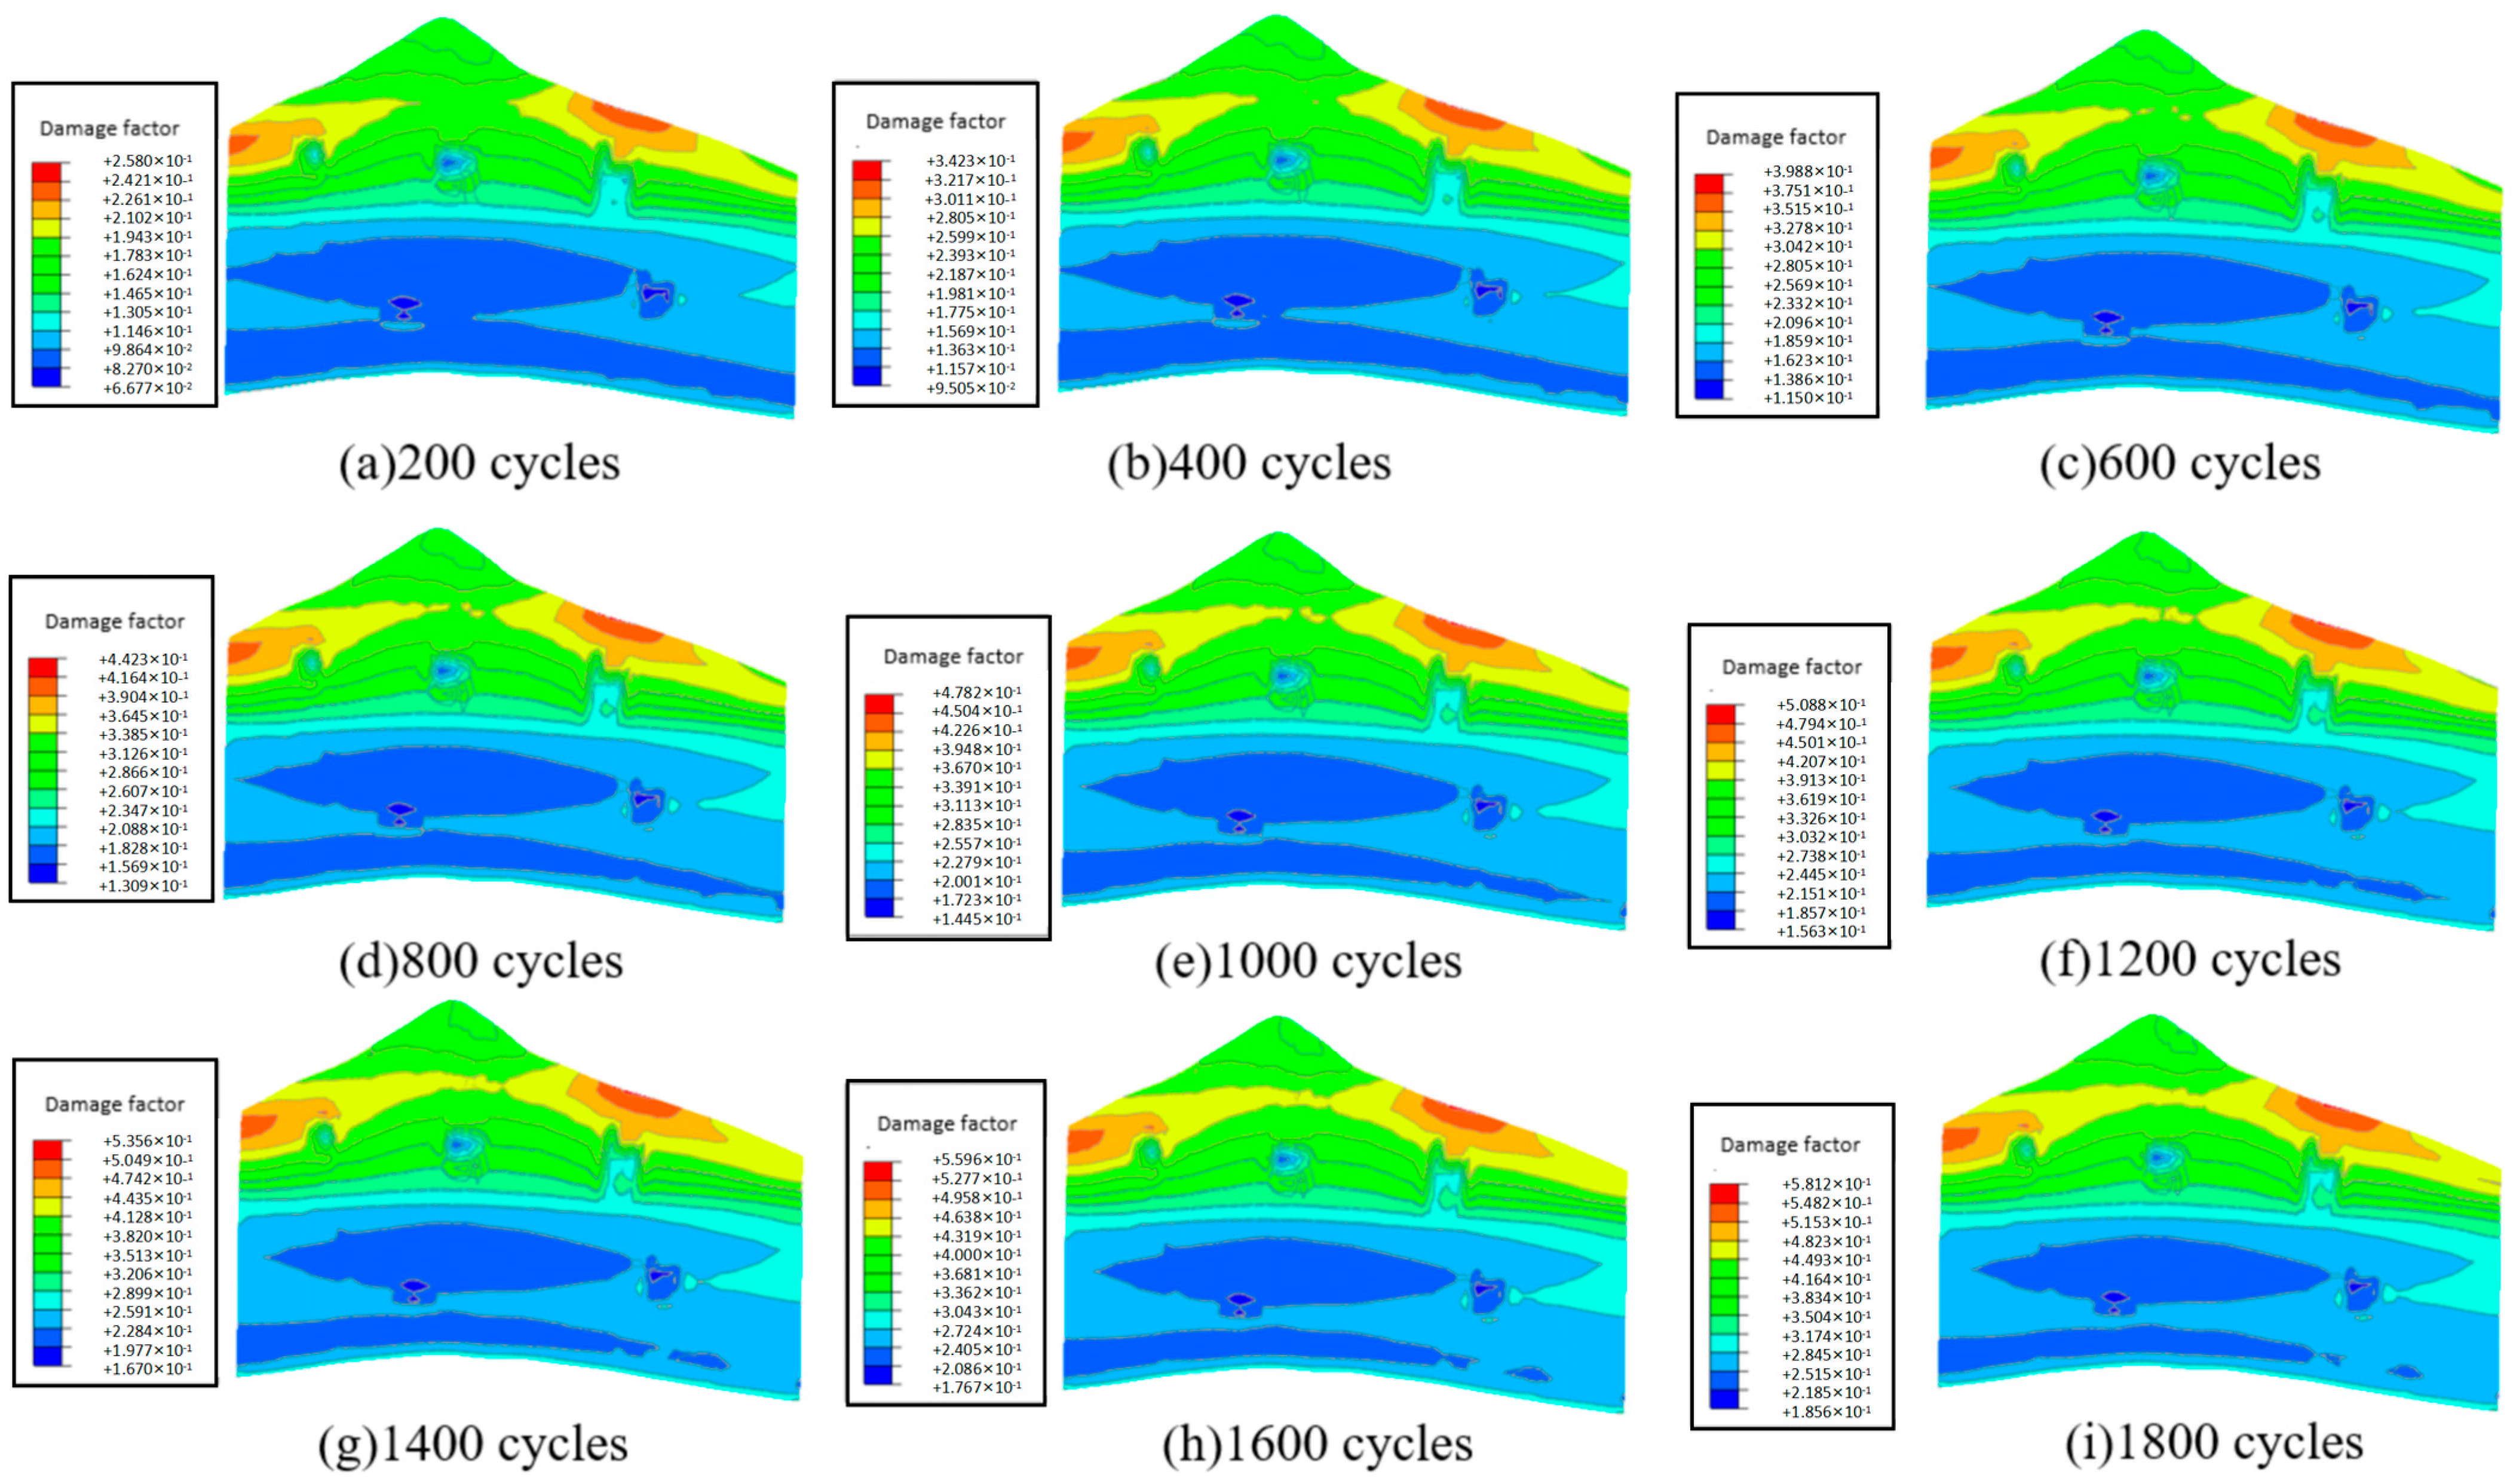
Affected by the confining pressure effect in different regions of the fault, the elastic modulus presents obvious differences, and the corresponding degree of damage evolution also varies significantly. The damage distribution characteristics of the fault under different cycle numbers are shown in Figure 11. It can be observed that the damage evolution law of the entire fault changes slightly with the increase in cycle times.
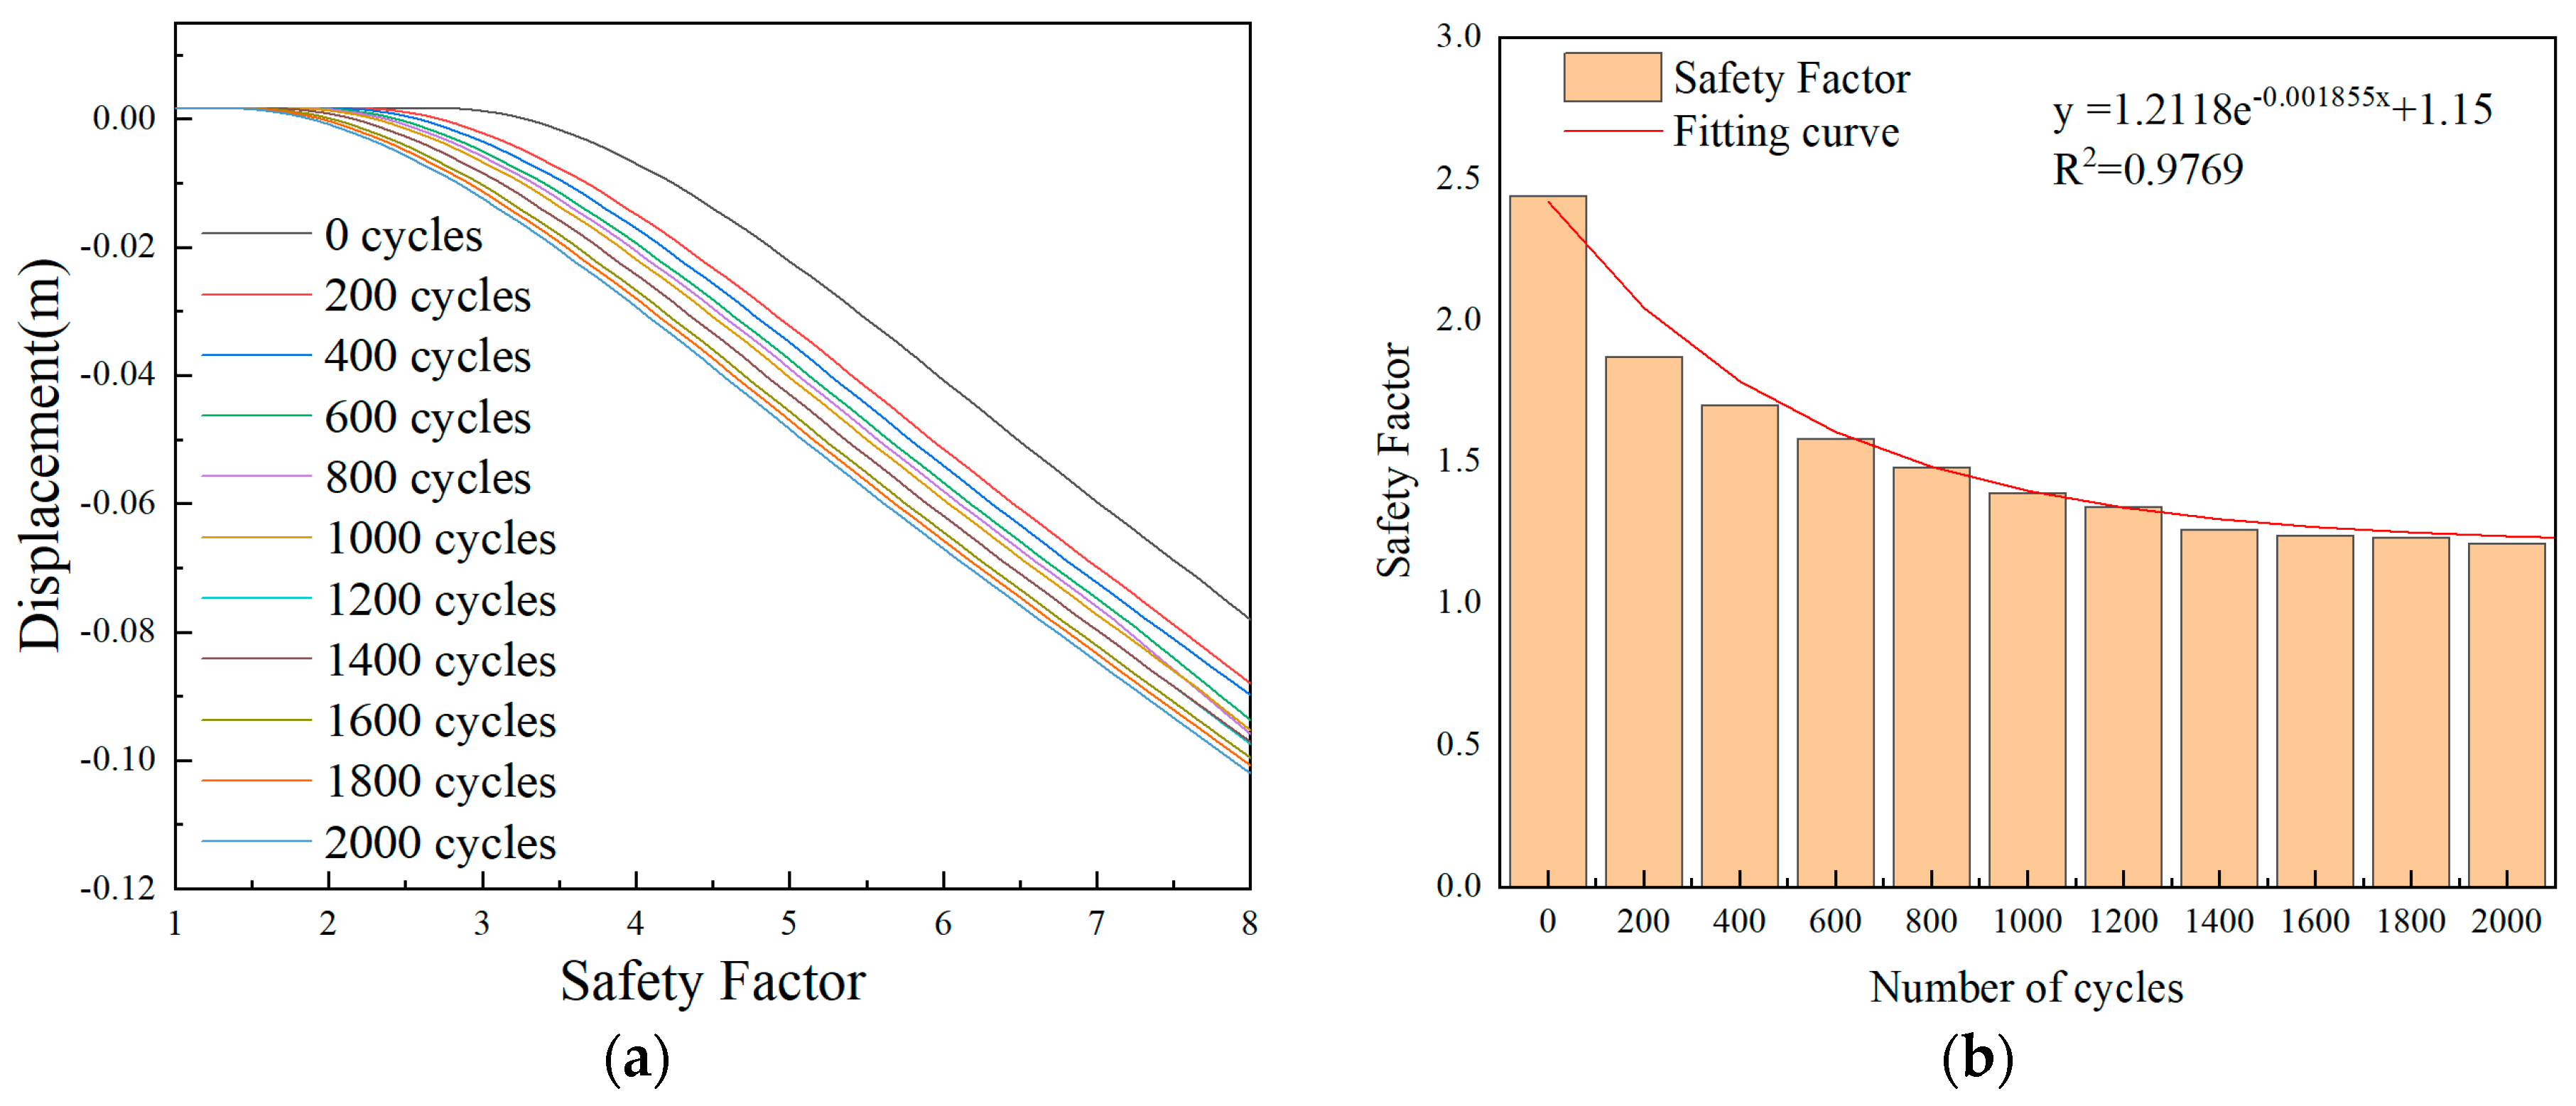
Under the action of cyclic damage, the displacement inflection point of the strength reduction method appears earlier. Under normal operating conditions, the safety factor of the dam abutment under the temperature rise condition is slightly lower than that under the temperature drop condition. Therefore, the normal water level and temperature rise conditions are taken as the criterion for judging the results of the strength reduction method, so as to evaluate the overall safety degree of the arch dam abutment under long-term operation. The calculation results are shown in Figure 12.

3.6. Comprehensive Stability Analysis of Arch Dam

3.6.1. Aging Model

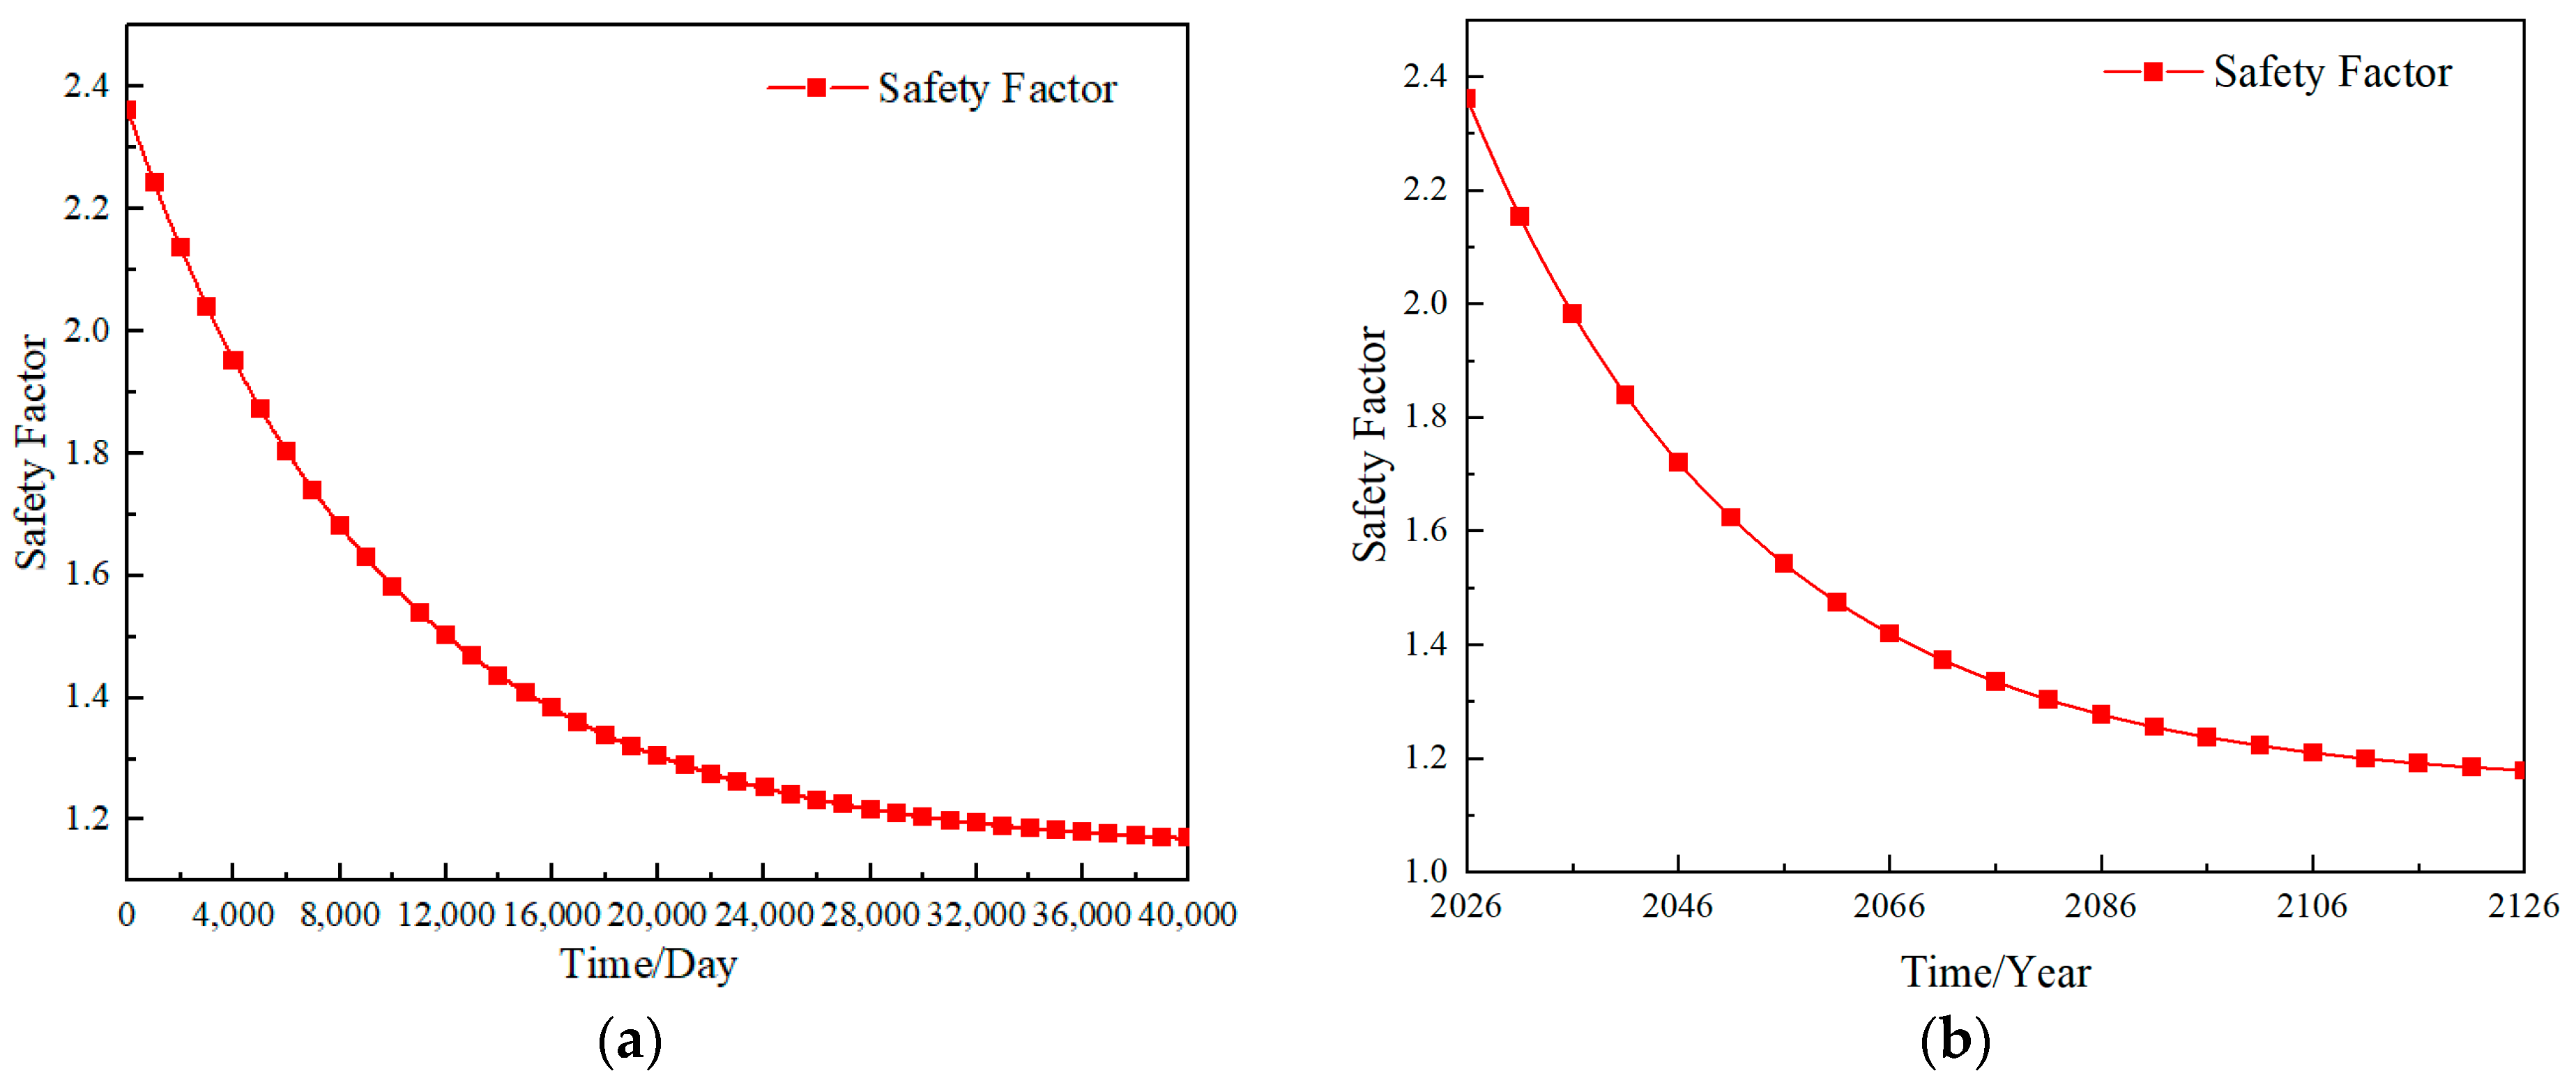
This arch dam serves as the river retaining dam for the lower reservoir of a pumped storage power station. According to operational data, it undergoes two pumped storage condition conversions every day, with a reservoir water level fluctuation of up to 10 m. Based on the relevant theoretical analysis in this paper, the corresponding relational expression between the service days and safety factor of the arch dam during actual operation can be derived as y = 1.2118 e 0.000103 t + 1.15 , and the fitting curve of safety factor versus time is shown in Figure 13.

3.6.2. Comprehensive Stability Evaluation of Arch Dam

Normalized treatment is performed on the dam stress under normal water level and temperature rise conditions. The dam consists of 22,134 elements, and the over-limit stresses of the maximum and minimum principal stresses are shown in Table 6.
The arch dam has a height of 79.4 m. Considering the existence of a through fault at the left dam abutment, the weight coefficients ( ω 1 ,     ω 2 ) in the comprehensive stability calculation should be biased toward the strength reduction stability index ω 2 . Accordingly, ω 1 is set to 0.1 and ω 2 to 0.9 for this project.
By normalizing the over-limit stress proportion and strength reduction index under different cycle times, the comprehensive stability evaluation results of the arch dam under different operation days are presented in Table 7.
It can be seen from the data in the above table that with the increase in operation days, the normalized index of the dam stress state Sn remains basically stable without obvious fluctuations, indicating that the stress distribution of the dam is always in a reasonable range and no significant over-limit stress problem occurs. In sharp contrast, the normalized index of the strength reduction method ( F n ) shows a significant downward trend with the increase in cycle times, becoming the core dominant factor affecting the overall stability of the arch dam. Affected by the decline of F n , the comprehensive stability coefficient of the arch dam ( K ) also decreases gradually, and the overall stability shows a continuous weakening trend.
Specifically, before the number of operation days reaches 28,000, the comprehensive stability coefficient K of the arch dam remains above 0.9, and the overall state is safe and stable with sufficient safety reserves in the structure to ensure normal operation. When the number of cycles exceeds 28,000, the comprehensive stability coefficient K falls below 0.9, entering a critical state. At this stage, although the stress state of the dam remains intact without over-limit stress, the overall anti-sliding bearing capacity of the dam-foundation system has been greatly reduced due to the significant decrease in the strength reduction index ( F n ). With the further increase in the number of cyclic loads, the arch dam will face an increasingly severe instability risk, which requires focused attention and targeted prevention and control measures.

4. Discussion

Based on the secondary development of the UMAT subroutine in ABAQUS, a constitutive model of faults was established, which couples the confining pressure effects, the inhomogeneity of the spatial discrete random field, and the damage caused by cyclic water level changes. This model systematically explores the spatiotemporal evolution law of mechanical parameters of deep buried faults and their influence on the stability of arch dam abutments. By introducing the random distribution characteristics of intact rock blocks and fractured zones inside the fault, the strengthening effect of burial depth and confining pressure, as well as the fatigue degradation effect induced by cyclic water level changes, are considered comprehensively. This achieves the refined characterization of the spatiotemporal evolution of fault mechanical parameters and makes the numerical calculation results more objectively reflect the actual engineering geological conditions and long-term operation response characteristics.
(1) The discrete random rock block characterization method can reasonably describe the heterogeneous structural characteristics inside the fault. Natural faults are composed of weak fractured matrices and randomly embedded, locally concentrated intact hard rock blocks. The mechanical strength of the rock block areas is much higher than that of the fractured medium, and the spatial position and development scale of the rock blocks have obvious random characteristics. This study abandons the characterization idea of the diffuse distribution of continuous random fields and adopts a discrete characterization method that includes randomly selecting characteristic nodes, defining the scope of intact rock blocks, and applying reinforcement coefficients to the intact rock blocks. This method is highly consistent with the actual engineering geological conditions and can more accurately reflect the real structural characteristics inside the fault.
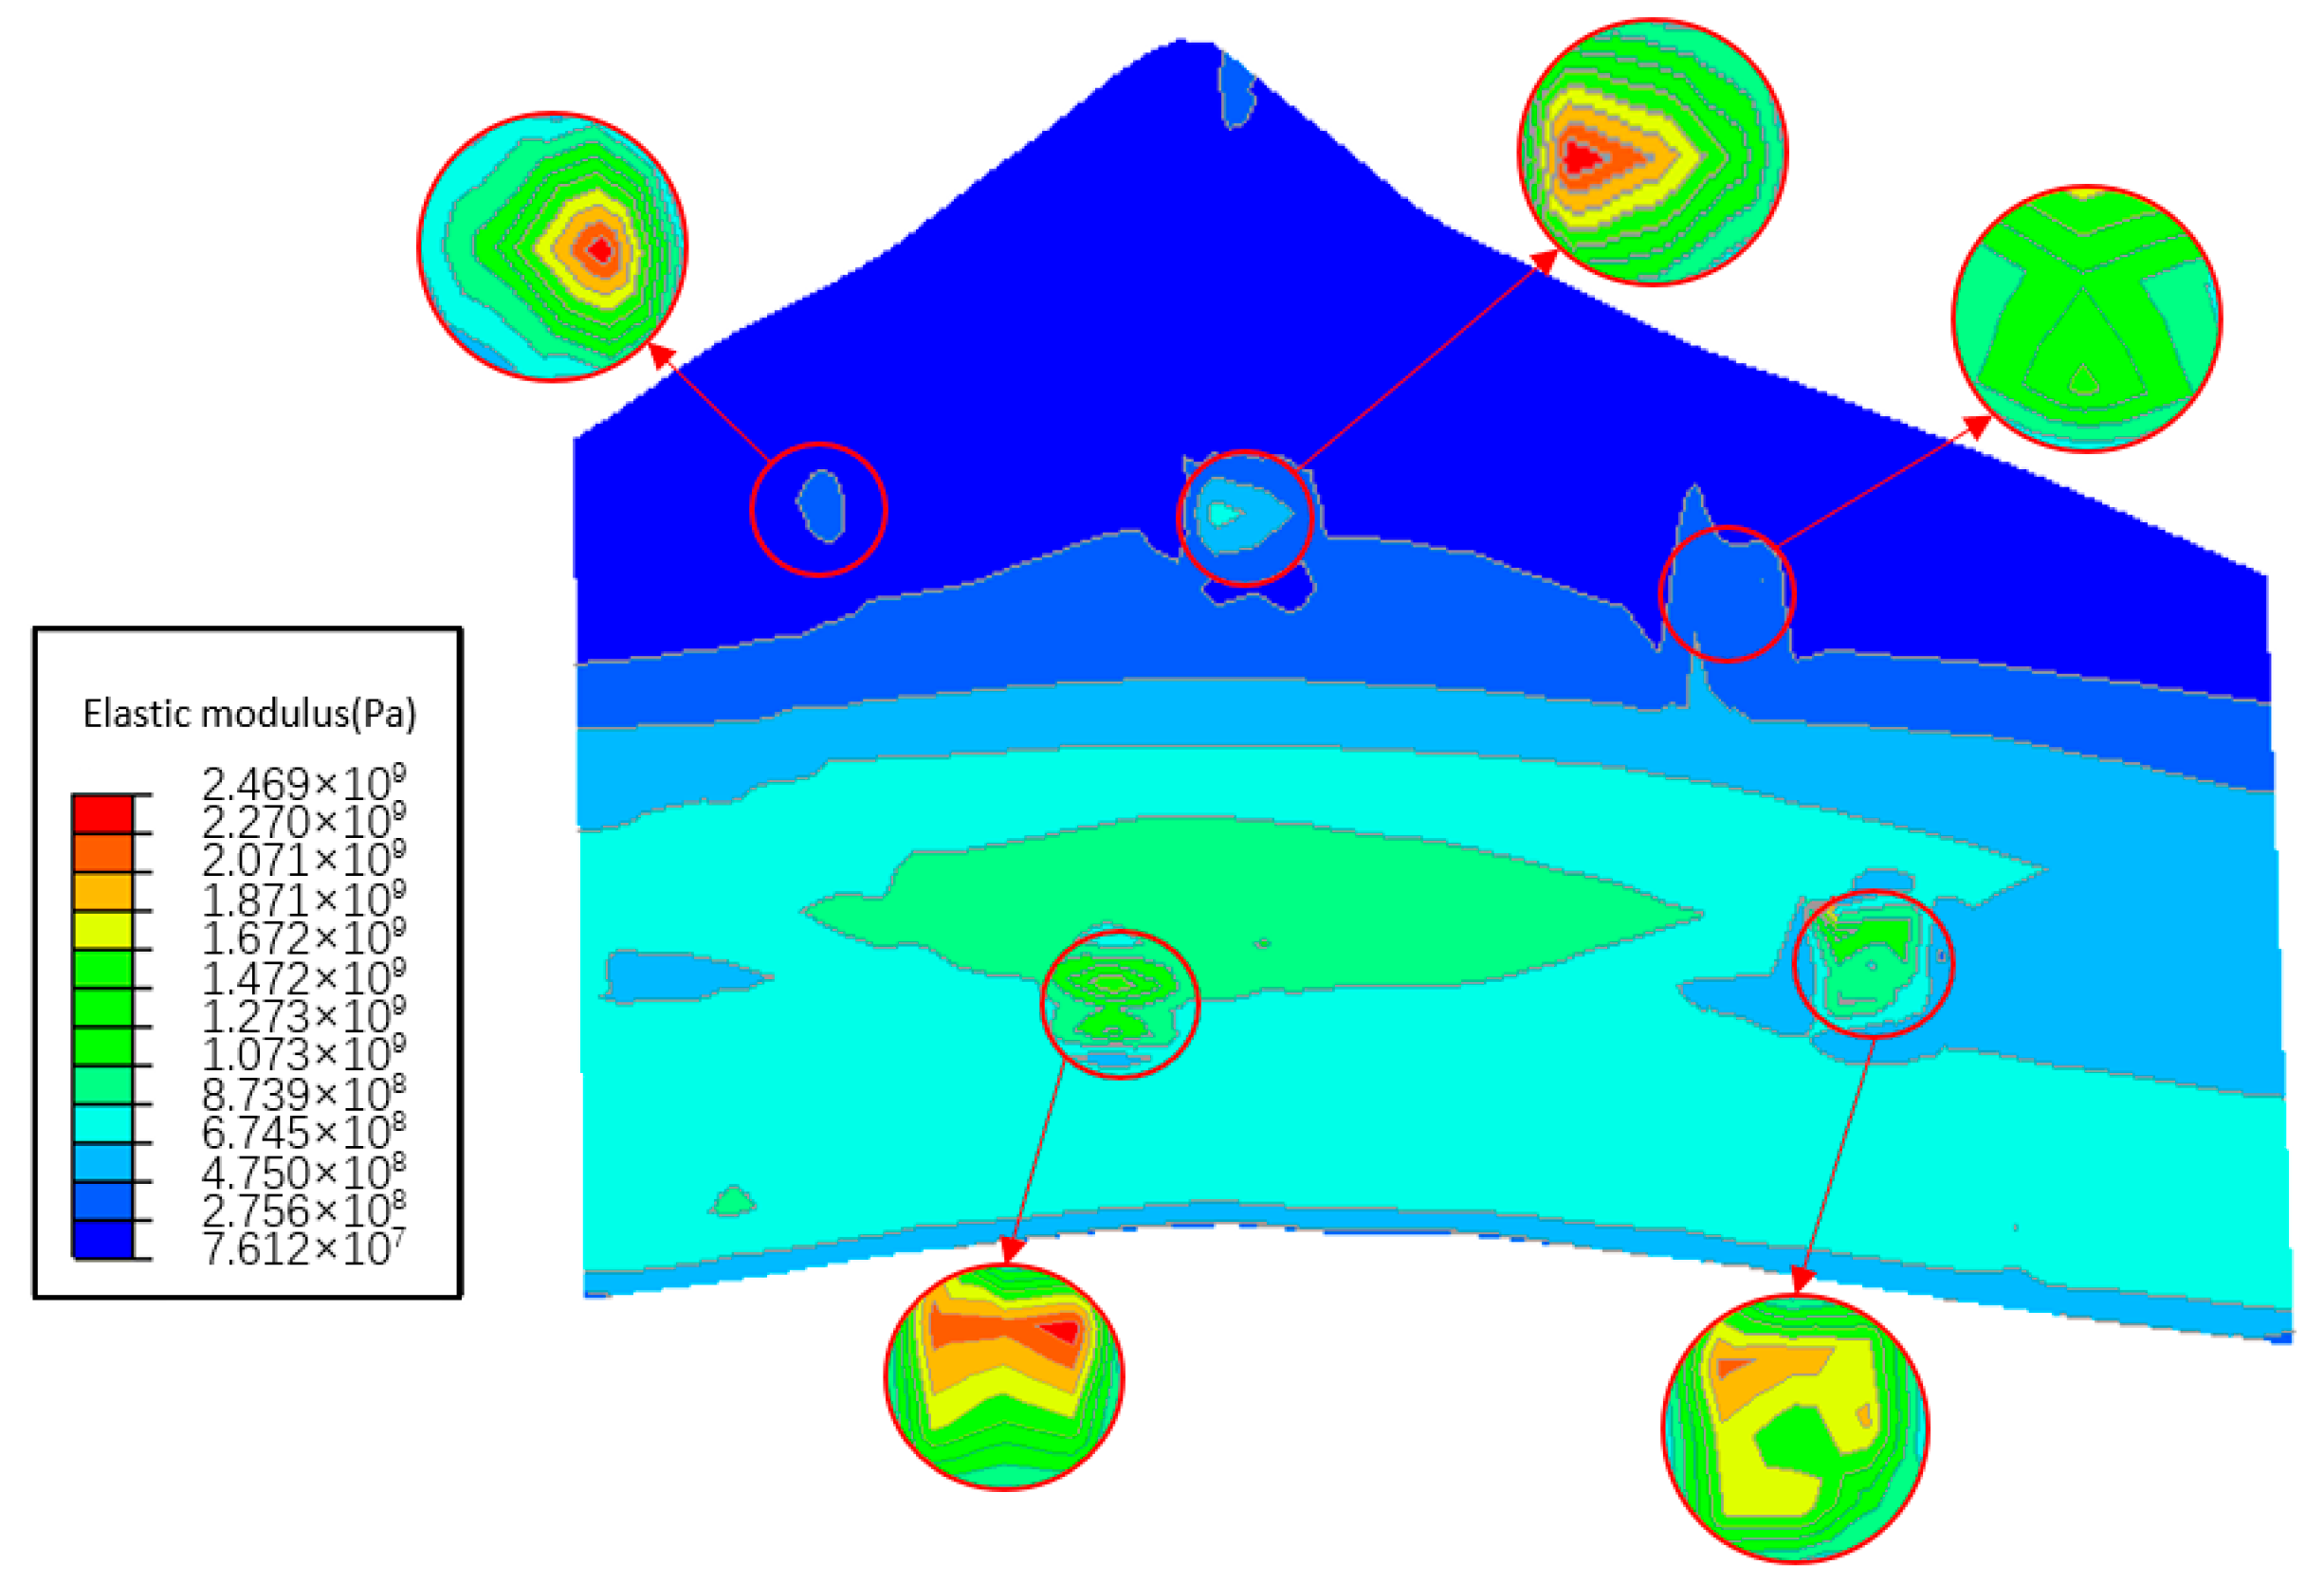
(2) The coupling effect between confining pressure and discrete random rock blocks intensifies the spatial inhomogeneity of the mechanical properties of faults. The coupling interaction between confining pressure and discrete random rock blocks is illustrated in Figure 14. By establishing a comprehensive correction coefficient for confining pressure and intact rock blocks, the coupling of confining pressure reinforcement from burial depth and local reinforcement from rock blocks is realized, achieving refined correction of fault mechanical parameters. Under the same burial depth condition, the stiffness and shear strength within the influence range of intact rock blocks are significantly higher than those of the surrounding fractured zones, forming local high-strength areas. Under the same rock block development condition, the overall mechanical performance of the deep high confining pressure area is significantly better than that of the shallow area. The coupling of the two factors endows the mechanical parameters of the fault with dual characteristics: continuous gradual change with burial depth and local sudden change with rock block distribution, which is more consistent with the spatial distribution law of fault mechanical properties in actual engineering. Meanwhile, this coupling model can accurately identify potential weak parts, such as shallow fractured zones and sparse rock block distribution areas, providing more practical numerical results for the stability evaluation of dam abutments.
(3) Under the action of reservoir water circulation load, the fault presents a differentiated fatigue damage degradation law. The periodic rise and fall in the reservoir water level forms a cyclic load, which promotes the continuous initiation, expansion and connection of microcracks inside the fault, resulting in the gradual attenuation of the fault’s stiffness and strength with the increase in cycle times. Due to the differences in confining pressure and rock block distribution, the damage evolution shows obvious spatial differentiation characteristics: the deep area has high confining pressure and well-developed intact rock blocks resulting in high elastic modulus small strain energy dissipation per cycle slow damage accumulation rate and limited long-term mechanical performance attenuation; the shallow area is dominated by fractured rock mass with low stiffness sensitive deformation response more significant deterioration under cyclic load and it is prone to become a weak link affecting the long-term stability of the arch dam as shown in Figure 15. It can be seen that the long-term stability evaluation of the high arch dam abutment cannot be calculated only by static homogeneous parameters but must comprehensively consider the combined effect of confining pressure, stratification effect, discrete rock block spatial inhomogeneity, and cyclic fatigue damage so as to objectively predict the long-term deformation and stability evolution characteristics of the fault.

5. Conclusions

Taking the arch dam of a pumped storage power station in Anhui Province as the engineering background, aiming at the F2 through fault at the left bank dam abutment, this study adopts UMAT secondary development and three-dimensional finite element numerical simulation to systematically carry out the analysis of arch dam stress and long-term stability of the dam abutment under the coupled action of confining pressure effect and cyclic load-induced damage, and the main conclusions are as follows:
(1) The influence mechanism of fault mechanical characteristics on arch dam stability was clarified. By introducing the spatially inhomogeneous distribution model of fault mechanical parameters and the time-weakening effect under long-term operation, the refined characterization of fault mechanical behavior was realized. This study effectively makes up for the deviation in judgment caused by the neglect of the discrete distribution characteristics of intact rock blocks inside the fault and the difference in time-dependent damage evolution in existing studies, providing key theoretical support and numerical basis for the long-term stability evaluation of arch dams.
(2) Spatially, a heterogeneous characterization method, including discrete random node layout, local influence domain discrimination and positive amplification of in-region strength, is adopted, which realizes the synergistic coupling between the confining pressure and burial depth effect and the local reinforcement of intact rock blocks, significantly improving the fineness and rationality of the spatial distribution of fault mechanical parameters; temporally, based on the difference in damage evolution under cyclic water load, the mechanical law that the damage development of high-stiffness and high-confining-pressure sections is slower is revealed, and the quantitative evolution relationship between the fault damage factor and the number of cycles under different burial depths is established through fitting.
(3) This study quantifies the inherent correlation between the operation days of the arch dam and the safety factor, and clarifies the impact of operational factors such as water level fluctuations and cycle times on the safety of the arch dam. Meanwhile, a set of comprehensive stability evaluation systems for the arch dam is established, with the dam stress state and dam abutment stability as the evaluation indicators, and the weight coefficients are reasonably allocated to strengthen the leading role of the strength reduction index, and the grading standards for different levels are clarified. The results show that under 28,000 days of water level cycling, the strength reduction index decreases by 48%, and the comprehensive stability evaluation of the arch dam drops to the critical state. At the same time, the comprehensive stability of the arch dam under multiple cycles is clarified, and corresponding solutions are proposed, which provide a specific and operable theoretical basis and practical guidance for on-site operation monitoring, risk prevention and control, and reinforcement treatment of the project, fully verifying the practical engineering application value of this study.

Author Contributions

Conceptualization, J.Z. and D.Y.; methodology, B.C.; formal analysis, J.L., S.W.; data curation, Z.L.; writing—original draft preparation, J.L.; funding acquisition, J.Z. All authors have read and agreed to the published version of the manuscript.

Funding

This research was funded by the joint fund of the Anhui Provincial Natural Science Foundation Project (2308085US02).

Institutional Review Board Statement

Not applicable.

Informed Consent Statement

Not applicable.

Data Availability Statement

The raw data supporting the conclusions of this article will be made available by the authors on request.

Acknowledgments

This work was supported by the Joint Fund of the Anhui Provincial Natural Science Foundation under Grant No. 2308085US02. The authors also appreciate all contributors for their efforts and valuable contributions to this research.

Conflicts of Interest

The authors declare no conflict of interest.

References

  1. Shao, C.F.; Xu, Y.; Chen, H.; Zheng, S. Ordinary kriging interpolation method combined with fem for arch dam deformation field estimation. Mathematics 2023, 11, 1106. [Google Scholar] [CrossRef]
  2. Li, Y.; Zhao, E.; Hu, L.; Shao, C.; Dong, Z.; Zhong, Q. Assessment on safety and performance of super-high arch dam with asymmetric foundation and its reinforcement effect identification. Structures 2024, 70, 107812. [Google Scholar] [CrossRef]
  3. Peng, H.; Wang, M.; Jiang, L.; Zheng, B. Research on the Application of Equivalent Stress Analysis Across the Entire Dam Surface of Arch Dams Under Seismic Action. Appl. Sci. 2026, 16, 2128. [Google Scholar] [CrossRef]
  4. Zhao, E.; Wu, C. Long-term safety assessment of large-scale arch dam based on non-probabilistic reliability analysis. Structures 2021, 32, 298–312. [Google Scholar] [CrossRef]
  5. Lin, P.; Shi, J.; Zhou, W.Y.; Wang, R.-K. 3D geomechanical model tests on asymmetric reinforcement and overall stability relating to the Jinping I super-high arch dam. Int. J. Rock Mech. Min. Sci. 2018, 102, 28–41. [Google Scholar] [CrossRef]
  6. Lin, P.; Wei, P.; Wang, W.; Huang, H. Cracking risk and overall stability analysis of Xulong high arch dam: A case study. Appl. Sci. 2018, 8, 2555. [Google Scholar] [CrossRef]
  7. Conde, A.; Toledo, M.Á.; Salete, E. Cracks in Arch Dams: An Overview of Documented Instances. Appl. Sci. 2024, 14, 7580. [Google Scholar] [CrossRef]
  8. Lin, P.; Xiang, Y.F.; Li, Z.C.; Peng, H.; Liu, Y. Reinforcement mechanism and design method for geological defects in arch dam abutments. Rock Mech. Rock Eng. 2026, 59, 437–460. [Google Scholar] [CrossRef]
  9. Zhao, E.F.; Li, J.; Jiang, Y.F. The seepage evolution law under the fault creep in right bank of Longyangxia Dam. Eng. Fail. Anal. 2014, 44, 306–314. [Google Scholar] [CrossRef]
  10. Liu, X.; Li, Z.; Sun, L.; Khailah, E.Y.; Wang, J.; Lu, W. A critical review of statistical model of dam monitoring data. J. Build. Eng. 2023, 80, 108106. [Google Scholar] [CrossRef]
  11. Duffaut, P. Geology, Engineering & Humanities: 3 sciences behind the Malpasset dam failure(France, 2 December 1959). Q. J. Eng. Geol. Hydrogeol. 2019, 52, 445–458. [Google Scholar] [CrossRef]
  12. Fan, Q.X.; Wang, Z.L.; Xu, J.R.; Zhou, M.; Jiang, Q.; Li, G. Study on deformation and control measures of columnar jointed basalt for Baihetan super-high arch dam foundation. Rock Mech. Rock Eng. 2018, 51, 2569–2595. [Google Scholar] [CrossRef]
  13. Lin, P.; Shi, J.; Wei, P.C.; Fan, Q.; Wang, Z. Shallow unloading deformation analysis on Baihetan super-high arch dam foundation. Bull. Eng. Geol. Environ. 2019, 78, 5551–5568. [Google Scholar] [CrossRef]
  14. Zhang, W.; Chen, Y.; Yang, B.Q.; Zhang, L.; Zhang, C.; Liu, X.-Q. Experimental and numerical analyses on working performance of a high arch dam with deep-seated joints: Yebatan arch dam, China. Arab. J. Geosci. 2019, 12, 103. [Google Scholar] [CrossRef]
  15. Nie, D.X.; Zhang, X.G.; Han, W.F. Studies on the correlation between the effect of confining pressure and the physical and mechanical properties of weak interactions. In Proceedings of the 6th International Congress International Association of Engineering Geology; A Balkema: Amsterdam, The Netherlands, 1990; pp. 2473–2479. [Google Scholar]
  16. Yin, D.S.; Li, Z.K.; Chen, B.F.; Zhang, J.; Luo, J. Research on arch dam performance considering spatiotemporal effects of fault parameters. Results Eng. 2025, 28, 108008. [Google Scholar] [CrossRef]
  17. Liu, Y.; Wang, H.; Yan, L.; Yu, J.; Zeng, W.; Xu, W. Study on Valley shrink deformation of the high arch dam with large faults near dam area during initial impoundment. Water 2024, 16, 2694. [Google Scholar] [CrossRef]
  18. Attawel, P.B.; Farmer, I.W. Fatigue behavior of rock. Int. J. Rock Mech. Min. Sci. Geomech. Abstr. 1973, 10, 1–9. [Google Scholar] [CrossRef]
  19. Erarslan, N.; Williams, D.J. The damage mechanism of rock fatigue and its relationship to the fracture toughness of rocks. Int. J. Rock Mech. Min. Sci. 2012, 56, 15–26. [Google Scholar] [CrossRef]
  20. Vaneghi, R.G.; Ferdosi, B.; Okoth, A.D.; Kuek, B. Strength degradation of sandstone and granodiorite under uniaxial cyclic loading. J. Rock Mech. Geotech. Eng. 2018, 10, 117–126. [Google Scholar] [CrossRef]
  21. Wang, H.; Liu, Y.; Yan, L.; Lyu, C.; Xu, X.; Xu, W. Failure analysis of arch dam under fault action based on intergenerational coordination. Eng. Fail. Anal. 2024, 164, 108721. [Google Scholar] [CrossRef]
  22. Zhang, L.; Liu, Y.R.; Yang, Q. Evaluation of reinforcement and analysis of stability of a High-Arch dam based on geomechanical model testing. Rock Mech. Rock Eng. 2015, 48, 803–818. [Google Scholar] [CrossRef]
  23. Wang, P.F.; Xing, X.Y.; Jin, Y.C.; Bai, J.-B.; Li, C.-H. Experimental study on mechanical properties of s-rm with different rock block proportions in fault zone. Sci. Rep. 2025, 15, 4757. [Google Scholar] [CrossRef] [PubMed]
  24. Huang, Y.; Chen, S.; Yu, B. Experimental study on progressive damage of dolomite under cyclic loading. Water Resour. Hydropower Eng. 2025, 56, 231–243. [Google Scholar] [CrossRef]
  25. NB/T 10870-2021; Code for Design of Concrete Arch Dams. China WaterPower Press: Beijing, China, 2021.
  26. Li, Y.; Liu, X.; Jin, J. Three-dimensional finite element static and dynamic force analysis of high arch dam under complex conditions. J. Water Resour. Power 2025, 43, 137–141. [Google Scholar] [CrossRef]
  27. Luo, D.; Lin, P.; Li, Q.; Zheng, D.; Liu, H. Effect of the impounding process on the overall stability of a high arch dam: A case study of the Xiluodu dam, China. Arab. J. Geosci. 2015, 8, 9023–9041. [Google Scholar] [CrossRef]
Figure 1. Layout and topographic map of an arch dam.
Applsci 16 07281 g001
Figure 2. Prestressed anchor cable layout map.
Applsci 16 07281 g002
Figure 3. Analysis flow chart.
Applsci 16 07281 g003
Figure 4. Arch dam model.
Applsci 16 07281 g004
Figure 5. Stress of dam body under different working conditions.
Applsci 16 07281 g005
Figure 6. Equivalent stress nephograms of dam body under various working conditions (MPa).
Applsci 16 07281 g006
Figure 7. Plastic zone distribution of foundation under normal pool level and temperature drop conditions.
Applsci 16 07281 g007
Figure 8. Displacement curve of characteristic points at left abutment under normal pool level and temperature drop conditions.
Applsci 16 07281 g008
Figure 9. Longitudinal river displacements of characteristic points under different working conditions. (a) Normal pool level + temperature rise; (b) Minimum pool level + temperature rise; (c) Check flood level + temperature rise.
Applsci 16 07281 g009
Figure 10. Stress distribution of dam body under different cycle numbers.
Applsci 16 07281 g010
Figure 11. Fault damage distribution under different cycle numbers.
Applsci 16 07281 g011
Figure 12. Characteristic point displacement diagram and safety factor under different cycle numbers. (a) X-direction displacement of characteristic points under different cycle numbers; (b) Safety factors under different cycle numbers.
Applsci 16 07281 g012
Figure 13. Relationship diagram between safety factor and service time of arch dam. (a) Variation curve of safety factor with service days; (b) Variation curve of safety factor with service years.
Applsci 16 07281 g013
Figure 14. Distribution map of fault elastic modulus under the coupling effect of discrete random rock blocks and confining pressure.
Applsci 16 07281 g014
Figure 15. Schematic diagram of the relationship between fault damage factor and service days at different burial depths. (a) Path at the fault center; (b) Curve diagram of fault damage factors and service days at different burial depths.
Applsci 16 07281 g015
Table 1. Comprehensive stability evaluation index of an arch dam.
Safety LevelCriterion
Level I (Safe and Stable)K ≥ 0.90
Level II (Critical State)0.85 ≤ K < 0.9
Level III (Instability Risk) K < 0.85
Table 2. Geological material parameters.
MaterialDensity
γ / ( k g / m 3 )
Elastic Modulus
E/GPa
Poisson’s Ratio
ν
Cohesion
c /MPa
Internal Friction Angle
φ
Dam body2400250.23
Transverse joint2300150.23
Fault2200Equations (1)–(3)
Left foundation rock ①26008.70.233.339
Left foundation rock ②25506.20.242.436
Right foundation rock ①260012.30.22444
Right foundation rock ②25507.40.233.438
Table 3. Load combination conditions.
Load CombinationMain Consideration ConditionLoad Category
Self-WeightHydrostatic PressureTemperature LoadUplift Pressure
Temperature DropTemperature Rise
Working Condition1. Normal pool level
2. Normal pool level\
3. Check flood level\
4. Minimum pool level\
Table 4. Finite element calculation step procedure.
Analysis StepConstruction ContentAnalysis StepConstruction Content
1Initial geostress equilibrium7Joint grouting of dam body at elevation 126.5–143.4 m
2Concrete pouring of dam body at elevation 64–78.5 m8Layout of prestressed anchor cables
3Joint grouting of dam body at elevation 64–78.5 m9Application of static loads
4Concrete pouring of dam body at elevation 78.5–126.5 m10Application of temperature loads
5Joint grouting of dam body at elevation 78.5–126.5 m11Strength reduction in foundation rock mass
6Concrete pouring of dam body at elevation 126.5–143.4 m
Table 5. Safety factors under different working conditions.
Combined Working ConditionSafety Factor
Normal pool level + temperature drop2.71
Normal pool level + temperature rise2.43
Minimum pool level + temperature rise2.84
Check flood level + temperature rise2.03
Table 6. Proportion table of over-limit stress.
Stress TypeThreshold ConditionNumber of ElementsProportion to Total Dam Elements
First principal stress>1.5 MPa350.1%
Third principal stress<−3 MPa890.4%
Table 7. Comprehensive stability evaluation of an arch dam.
Operation DaysProportion of Over-Limit StressStrength Reduction IndexComprehensive Stability Index of Arch Dam
K
Comprehensive Stability Evaluation
00.25%2.360.99975Safe and Stable
40000.25%1.950.99975Safe and Stable
80000.25%1.680.99975Safe and Stable
12,0000.25%1.500.99975Safe and Stable
16,0000.25%1.380.95655Safe and Stable
20,0000.25%1.300.92775Safe and Stable
24,0000.25%1.250.90975Safe and Stable
28,0000.25%1.220.89895Critical State
32,0000.25%1.190.88815Critical State
36,0000.25%1.180.88455Critical State
40,0000.25%1.170.88095Critical State
Disclaimer/Publisher’s Note: The statements, opinions and data contained in all publications are solely those of the individual author(s) and contributor(s) and not of MDPI and/or the editor(s). MDPI and/or the editor(s) disclaim responsibility for any injury to people or property resulting from any ideas, methods, instructions or products referred to in the content.