1. Introduction
With the rapid growth of photovoltaic installations in desert, coastal, and open-field regions, the structural safety of photovoltaic supports under strong wind actions has attracted increasing attention [
1]. Fixed photovoltaic supports are continuously subjected to environmental loads such as wind, snow, temperature variation, and foundation settlement during long-term service [
2]. Among these factors, fluctuating wind load is considered one of the dominant causes of structural vibration, local deformation, and connection failure because of its randomness and dynamic characteristics [
3,
4]. Previous studies have shown that wind pressure distribution on photovoltaic modules is strongly affected by wind direction, tilt angle, row spacing, and array arrangement [
5,
6]. Wind tunnel experiments and CFD (Computational Fluid Dynamics) simulations further demonstrated that local flow separation and aerodynamic interference can significantly amplify the wind-induced response of photovoltaic arrays [
7,
8]. In addition, the first row and edge regions of photovoltaic arrays are more vulnerable to unfavorable wind loads than interior regions due to shielding effects and non-uniform pressure distribution [
9,
10]. Existing numerical studies also indicate that purlins, beam connections, and support joints are often the weak regions under fluctuating wind loads because of their relatively limited local stiffness [
11,
12]. Therefore, accurate analysis of wind-induced response and weak-component identification is essential for improving the safety and reliability of fixed photovoltaic support systems.
Existing research on photovoltaic support structures has mainly focused on wind load characteristics, aerodynamic response, and structural optimization during the design stage of new support systems [
13]. Aerodynamic optimization methods, such as adjusting tilt angle and improving module arrangement, can reduce local wind pressure concentration under certain wind conditions [
14,
15]. Structural optimization measures, including increasing member stiffness, modifying support layout, and improving connection configurations, have also been widely investigated to improve wind-resistant performance [
16,
17]. Some studies introduced additional wind-resistant members and damping devices to suppress vibration response and improve structural stability under fluctuating wind loads [
18,
19]. However, most previous studies concentrated on newly designed photovoltaic supports, while the reinforcement of existing in-service fixed photovoltaic supports has received relatively limited attention [
20]. Conventional reinforcement methods usually require replacement of purlins or extensive dismantling of photovoltaic modules, which may interrupt power generation and increase construction cost [
21]. Sun [
22] and Xu [
23] observed that the configuration of photovoltaic panels significantly affects the wind load distribution on the photovoltaic modules. Yan [
24] and Yemenici [
25] investigated the effects of tilt angle on the wind-induced vibration response of photovoltaic systems. Nevertheless, research on low-disturbance in situ reinforcement methods for existing fixed photovoltaic supports under fluctuating wind loads remains insufficient. Therefore, this study focuses on the wind-induced response analysis and in situ non-destructive reinforcement of an existing ground-mounted fixed photovoltaic support, aiming to provide a practical reinforcement strategy for improving wind-resistant stability without dismantling existing structural components.
Existing studies on the strengthening of photovoltaic (PV) support structures have mainly focused on four aspects: connection enhancement, member restraint, support system optimization, and section strengthening. Du and Becker [
26] investigated the restraining effect of PV modules on the lateral–torsional buckling behavior of C-section purlins and demonstrated that reliable purlin–module connections can significantly delay buckling and enhance structural capacity. Elsworth and Van Geet [
27] further proposed measures such as through-bolted module connections, three-rail mounting systems, dual-pile supports, and closed-section structural members to improve the overall wind resistance and resilience of PV racking systems. Some structural strengthening studies adopt dampers or limiting devices to reduce vibration responses; for example, in purlin roof structures, some research has proposed installing damping-limit devices at purlin connection points [
28]. In addition, for C-section purlins that have experienced excessive deformation or exhibit insufficient strength, researchers have proposed replacing them with thicker and larger cross-section purlins to directly increase stiffness and load-carrying capacity. However, this method requires the removal of PV modules, resulting in significant construction disturbance and extended system downtime. Therefore, a practical in situ reinforcement method that can improve the stiffness of existing purlins without removing modules or changing the original structural system is still needed.
Therefore, this study investigates an existing ground-mounted photovoltaic support in Yuli County, Xinjiang, China. A fluctuating wind model based on the Davenport spectrum and a one-way fluid–structure interaction method are used to identify the unfavorable wind direction and weak components. Based on the identified purlin weakness, an internal auxiliary reinforcement method is proposed to improve local stiffness while minimizing disturbance to the existing support system.
The main contributions of this study are as follows:
1. A fluctuating wind response analysis method for existing photovoltaic supports is established based on the Davenport spectrum and one-way fluid–structure interaction.
2. The wind-induced response characteristics of the photovoltaic support under different wind direction angles are compared, and the most unfavorable wind direction is identified.
3. The purlin and its connection regions are identified as the main weak components under fluctuating wind loads.
4. A low-disturbance in situ reinforcement method is proposed by inserting internal auxiliary members into the original purlins, without dismantling any existing components, replacing purlins, or changing the original load-transfer system.
5. The reinforcement thickness is optimized, and the engineering applicability of the proposed method is verified using an array-scale photovoltaic support model.
The remainder of this paper is organized as follows:
Section 2 introduces the related theories and methods.
Section 3 presents the wind-induced response analysis and reinforcement design.
Section 4 discusses the results and engineering applicability, and finally,
Section 5 summarizes the conclusions and future work.
2. Materials and Methods
2.1. Engineering Background and Photovoltaic Support Model
The studied structure is an existing ground-mounted photovoltaic support located in Yuli County, Xinjiang, China. The support system consists mainly of photovoltaic modules, purlins, beams, columns, and diagonal braces. The photovoltaic modules are connected to the support system through purlins, which transfer wind loads to the main load-bearing members.
To improve computational efficiency while maintaining the main mechanical characteristics of the structure, the geometric model was simplified appropriately. Small local components and bolt details were neglected, whereas the main load-transfer path among the photovoltaic modules, purlins, beams, columns, and braces was retained. The bottom of the columns was fixed to simulate the connection between the support and foundation. The connections between structural members were treated as rigid connections.
The incoming wind was simplified as a uniform wind profile in the present study. Similar assumptions have also been adopted in previous CFD (Computational Fluid Dynamics) analyses of photovoltaic support systems [
29], where a uniform inflow velocity was used to simplify the numerical model and focus on the wind-induced structural response. In reality, atmospheric boundary-layer winds exhibit vertical variation with height and are affected by terrain roughness. Consequently, the use of a uniform wind profile may influence the absolute values of wind pressure and structural displacement. However, because the investigated photovoltaic support system has a relatively low installation height and the same wind profile was consistently applied to all simulation cases, including different wind directions and reinforcement configurations, the influence on the comparative assessment of weak components and reinforcement effectiveness is expected to be limited.
The connections between structural members were modeled as rigid connections. In actual photovoltaic support systems, bolted joints may exhibit local flexibility, clearance, and slip under repeated wind loading. Consequently, the rigid-connection assumption may underestimate local deformation and stress concentration around the joints. Nevertheless, the objective of this study is to identify vulnerable structural members and evaluate the effectiveness of the proposed reinforcement strategy at the system level. Therefore, the rigid-connection assumption is considered acceptable for capturing the global load-transfer mechanism and deformation characteristics of the support structure.
The support members investigated in this study were fabricated from Q355 + ZM275 steel according to the design specifications of the photovoltaic power station from which the structural configuration was obtained, as shown in
Figure 1. Q355 is a low-alloy high-strength structural steel specified in GB/T 1591-2018, with a minimum yield strength of 355 MPa and good weldability, toughness, and structural reliability [
30]. The metallic coating designation ZM275 refers to a zinc–aluminum–magnesium coating with a nominal coating mass of 275 g/m
2, which provides enhanced corrosion resistance for outdoor applications.
The use of Q355 + ZM275 steel is consistent with current engineering practice for ground-mounted photovoltaic support systems, where both structural strength and long-term durability are required. The photovoltaic (PV) modules used in the numerical model are standard monocrystalline silicon panels, consisting of a tempered glass front layer, a silicon wafer-based photovoltaic cell layer, an encapsulant (EVA), and a backsheet of polymer composite. The material properties adopted in this study were obtained from the original engineering design documents and manufacturer specifications of the photovoltaic support system. Therefore, the selected material parameters accurately represent the actual structural conditions of the investigated photovoltaic installation. The main material properties used in the numerical model are listed in
Table 1.
2.2. Fluctuating Wind Model Based on the Davenport Spectrum
In the early stages of wind engineering, most structural studies focused only on the effects of mean wind loads, treating wind pressure as a static load acting on wind-resistant structures. In reality, however, wind fields are highly complex and dynamic, and the effects of fluctuating wind in the incoming flow cannot be neglected. Unlike mean wind loads, fluctuating wind speed and wind pressure vary irregularly with time and, under certain conditions, may induce resonance with structures, leading to unpredictable damage. Therefore, the effects of fluctuating wind must be carefully considered in structural design to ensure both structural stability and economic feasibility.
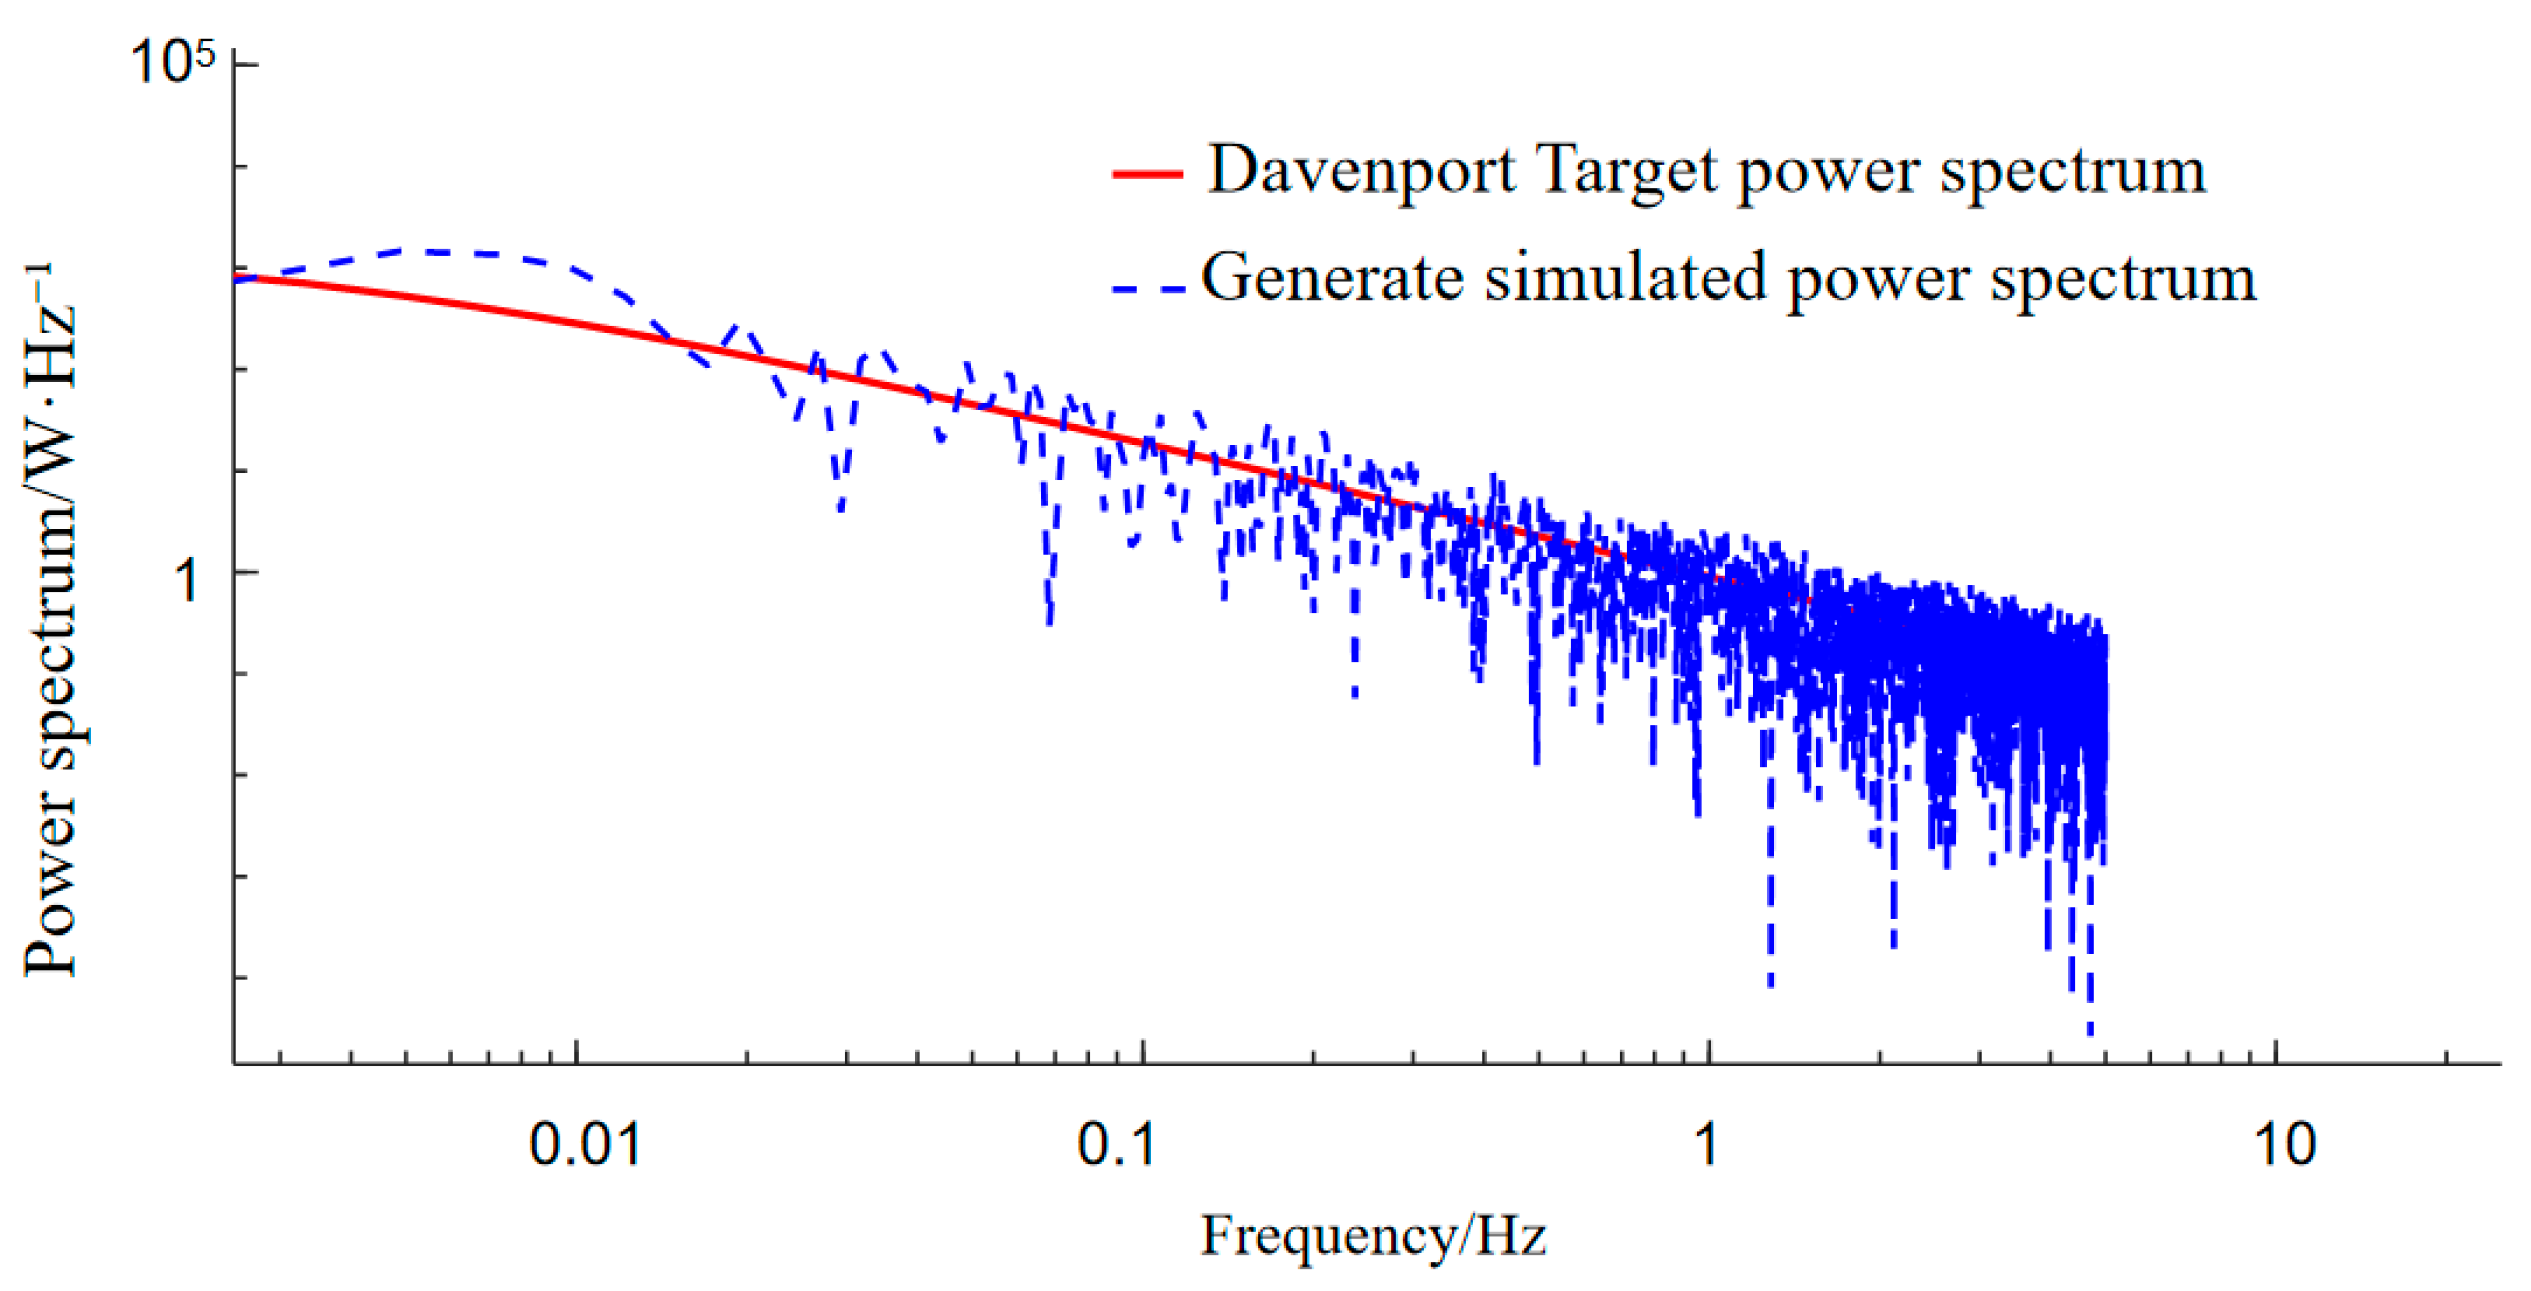
In this study, the harmonic superposition method was used to simulate the time history of fluctuating wind. As shown in
Figure 2, the power spectral density of the fluctuating wind velocity was modeled using the Davenport spectrum model [
31]:
The fluctuating wind velocity is given by the following equation [
32]:
where
is the fluctuating wind velocity at time
;
is the power spectral density of the wind velocity at frequency
;
is the frequency interval;
is a random phase angle uniformly distributed between
; and
is the total number of discrete frequencies.
Figure 2 compares the power spectral density of the simulated fluctuating wind field with the target Davenport spectrum at a reference wind speed of 28 m/s. It can be observed that the simulated spectrum agrees well with the target spectrum over the dominant frequency range of approximately 0–5 Hz [
33], indicating that the generated fluctuating wind field successfully reproduces the main energy distribution characteristics of natural atmospheric turbulence.
The close agreement between the simulated and target spectra demonstrates the reliability of the harmonic superposition and FFT-based wind-field generation procedure. Since the dynamic response of lightweight photovoltaic support structures is highly sensitive to low-frequency turbulent fluctuations, accurate reproduction of the spectral energy distribution is essential for obtaining realistic wind-induced displacement and stress responses.
Compared with previous studies that mainly employed the Davenport spectrum to investigate wind-pressure distributions or vibration characteristics of newly designed photovoltaic support systems, the present study uses the validated fluctuating wind field as the loading basis for identifying weak components and evaluating reinforcement strategies of an existing in-service ground-mounted photovoltaic support. Therefore,
Figure 2 is not only a verification of the wind-field generation method but also provides the foundation for the subsequent fluid–structure interaction analysis and reinforcement design.
The results confirm that the generated fluctuating wind field possesses sufficient spectral fidelity for engineering applications, ensuring that the identified unfavorable wind direction, weak purlin regions, and reinforcement effectiveness are based on realistic wind-loading conditions rather than simplified steady-wind assumptions.
2.3. Computational Fluid Domain and Boundary Conditions
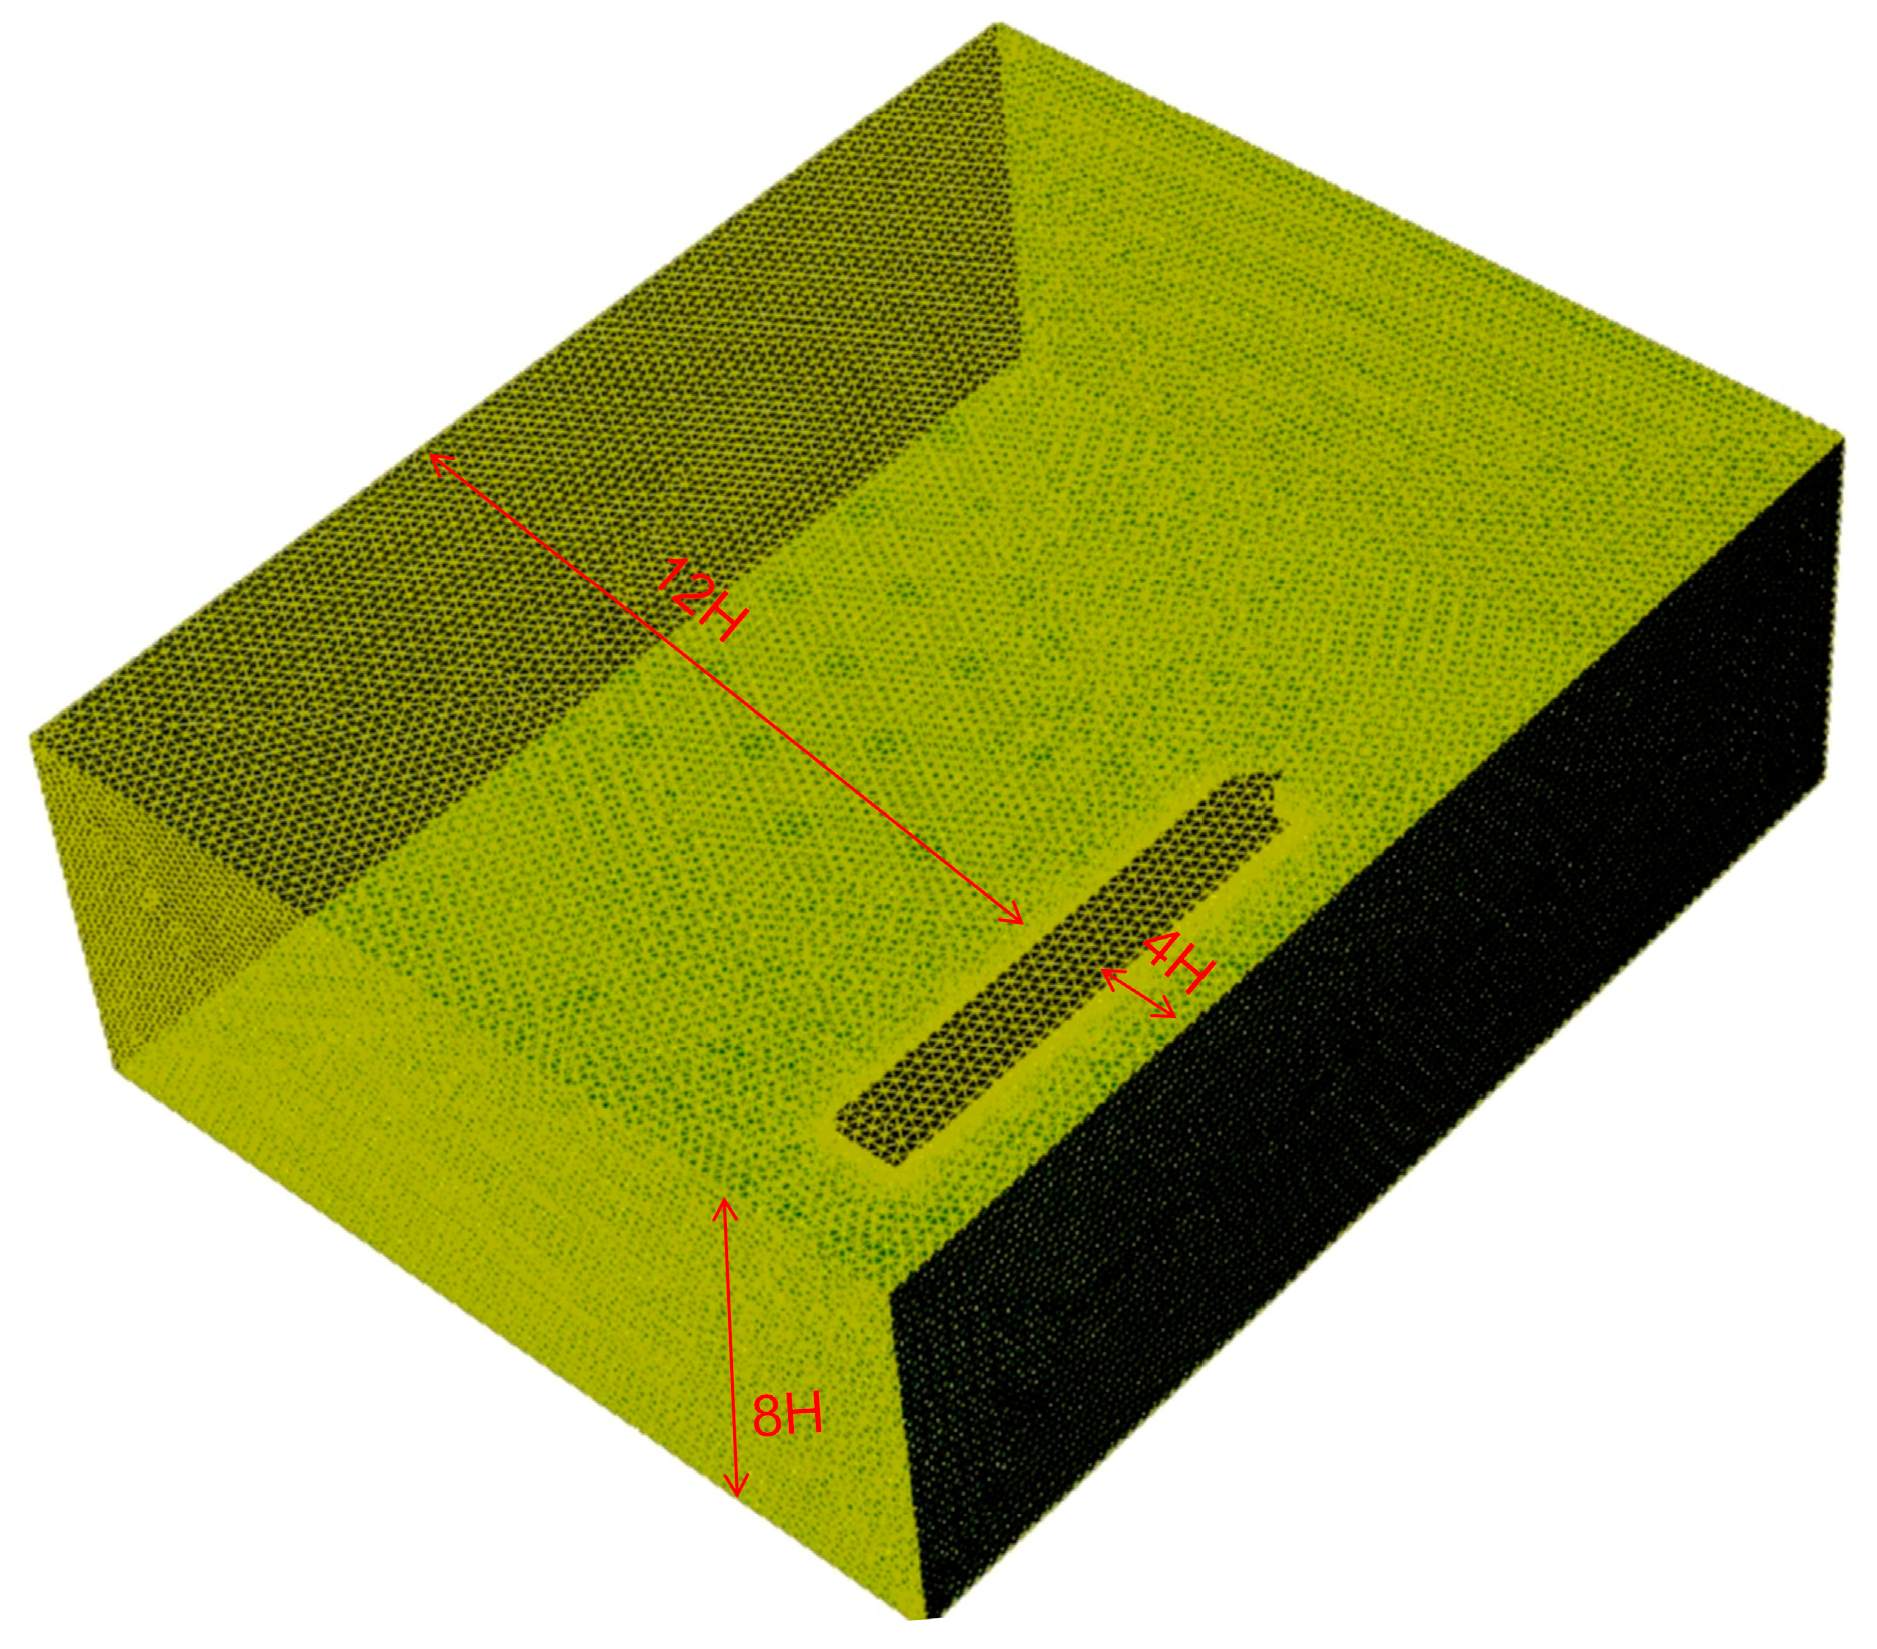
A computational fluid domain was established around the photovoltaic support to obtain the wind pressure distribution on the support surface. To reduce the influence of boundary effects, sufficient distances were reserved in the inflow, outflow, lateral, and vertical directions. The inlet boundary was located 4H upstream of the support, and the outlet boundary was located 12H downstream, as shown in
Figure 3. The lateral boundaries and the top boundary were located 8H away from the support, where H represents the total height of the photovoltaic support.
Inlet boundary condition: The inlet was defined as a velocity inlet. A random wind-speed timeseries control algorithm suitable for the wind-field inlet was developed using an integral fitting function and an exponential function. The wind-speed boundary layer was implemented in Fluent through a user-defined function (UDF), and the inlet wind speed was calculated as follows:
where
is the inlet wind speed (m/s),
is the 50-year return-period basic wind speed at the model location (m/s), and
is the fluctuating wind speed (m/s).
According to the Load Code for the Design of Building Structures [
34], the basic wind pressure for photovoltaic support structures should be determined based on the 50-year return-period wind pressure in the study area. According to Appendix D, Table D.4 of GB 50009-2012 (Load Code for the Design of Building Structures), the 50-year return-period basic wind pressure in the study area is 0.4 kN/m
2, equivalent to 400 Pa. The relationship between wind speed and dynamic pressure is expressed as:
where
is the 50-year return-period basic wind pressure in Yuli, taken as 400 Pa;
is the air density, taken as 1.25 kg/m
3 and
is the corresponding 50-year return-period basic wind speed in Yuli, calculated as 25.3 m/s. For safety considerations,
was taken as 28 m/s.
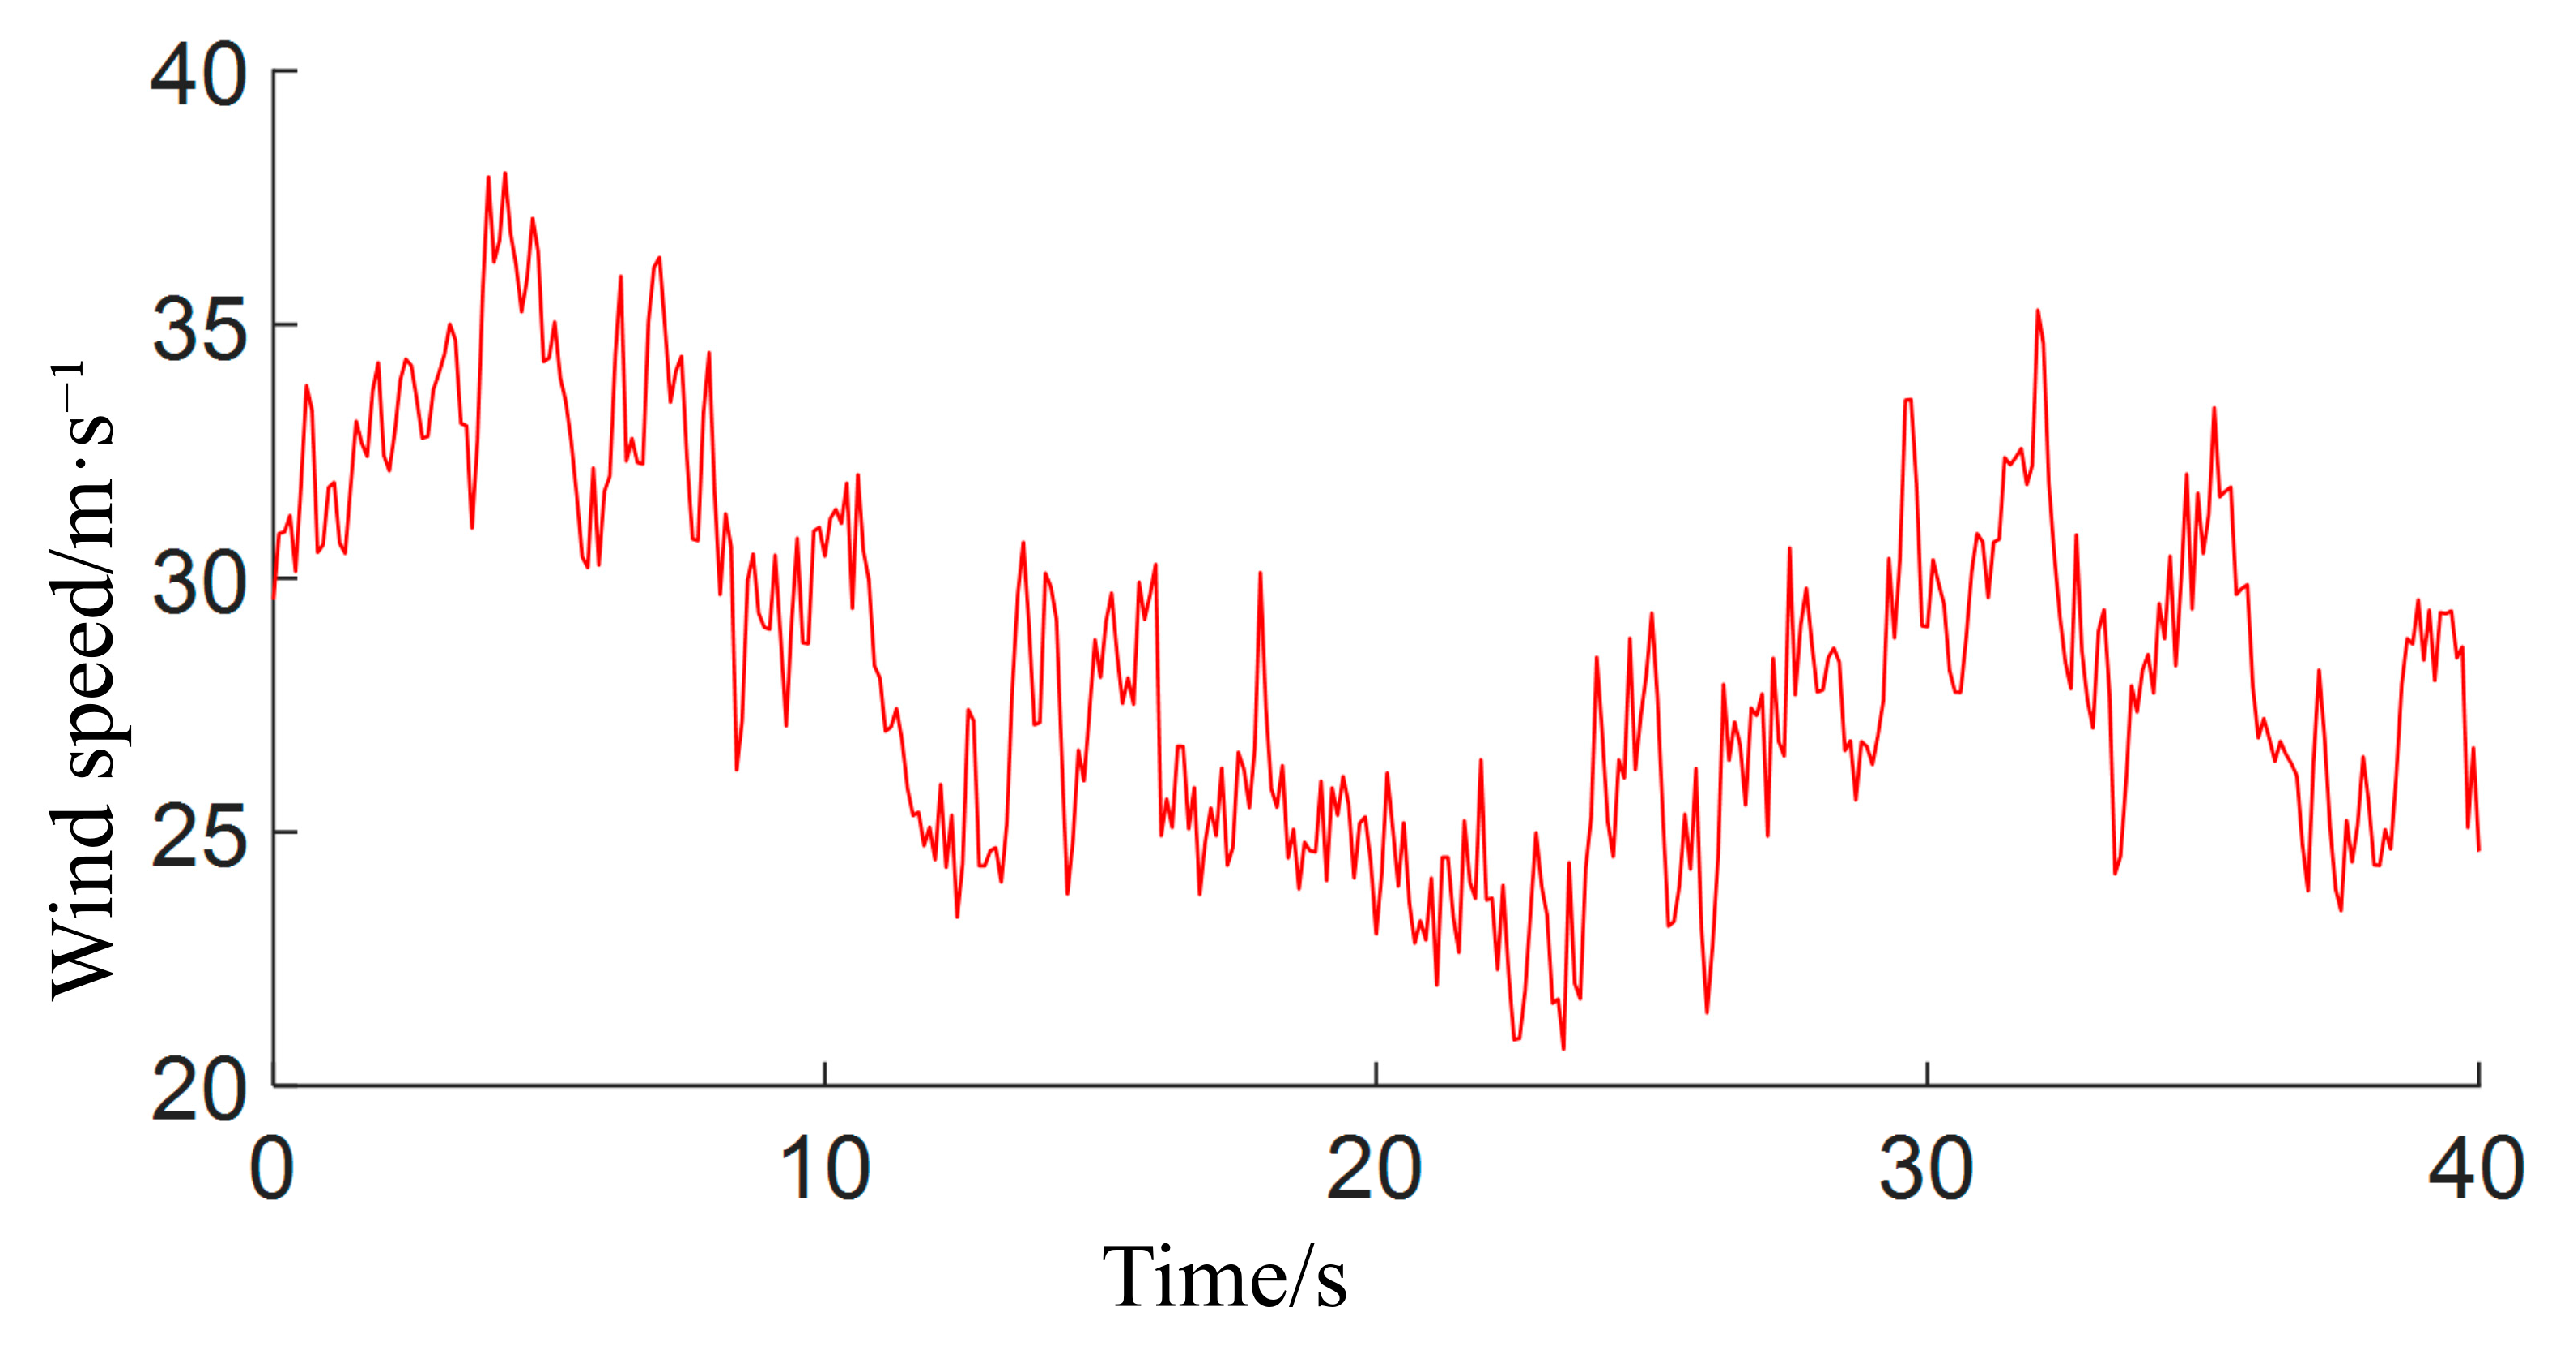
In this study, the incoming wind speed was assumed to be uniformly distributed, with a reference wind speed of 28 m/s at a height of 10 m, as shown in
Figure 4. Although the actual wind-speed distribution generally follows the atmospheric boundary-layer profile, typically described by logarithmic or power-law functions and affected by factors such as surface roughness, a uniform wind-speed assumption was adopted to simplify the model and focus on the wind-induced response. This assumption keeps the wind speed constant throughout the computational domain and avoids the additional complexity associated with calculating the wind profile. The inlet boundary condition also needs to reflect the turbulence characteristics of the incoming flow. The turbulent kinetic energy and turbulence dissipation rate were calculated as follows [
35]:
where
is the turbulent kinetic energy (m
2/s
2);
is the mean inlet wind speed (m/s); I is the turbulence intensity;
is the turbulence dissipation rate (m
2/s
3);
is an empirical constant, taken as 0.09; and
is the turbulence length scale (m).
A standard atmospheric pressure condition was applied at the outlet. This setting effectively represents the pressure equilibrium between the photovoltaic module surface and the surrounding atmosphere, prevents unrealistic pressure gradients at the outlet, and improves the accuracy of the numerical results. To simplify the model and reduce computational cost, symmetry boundary conditions were applied to the top and lateral boundaries, thereby avoiding unnecessary wall effects [
36]. No-slip boundary conditions were imposed on the fluid–solid interfaces of the photovoltaic modules and on the ground surface to realistically capture the interaction between the airflow and solid surfaces, ensuring that the fluid velocity at these boundaries was zero, consistent with physical conditions.
2.4. Wind Direction Cases
To investigate the influence of wind direction on the wind-induced response of the photovoltaic support,
Table 2 considers four typical wind directions: 0°, 30°, 45°, and 90°. The 0° wind direction represents wind acting normally on the windward side of the photovoltaic modules, while the 90° wind direction represents side wind. The same reference wind speed and fluctuating wind parameters were used for all cases to ensure comparability.
2.5. One-Way Fluid–Structure Interaction Method
The motion of a continuous fluid medium follows the fundamental principles of classical mechanics and fluid mechanics. Based on the actual operating conditions of the photovoltaic tracking support structure, the fluid was assumed to be continuous, homogeneous, and incompressible, while the effects of temperature and the energy equation were neglected. In a fixed coordinate system, the governing equations of fluid motion can be expressed as follows:
where
is the fluid density, in kg/m
3;
is the time, in seconds;
is the velocity vector, in m/s;
is the divergence operator, representing the divergence of a vector field;
is the stress tensor, in Pa;
is the body force vector, in
The solid finite element governing equation is:
where
is the solid density, in kg/m
3;
is the acceleration vector of the solid, in m/s
2;
is the divergence operator, which represents the divergence of a vector field;
is the Cauchy stress tensor, in Pa;
is the body force vector, in N/
.
At the fluid–structure interface, the continuity conditions of stress, displacement, and other relevant variables must be satisfied to ensure equality or conservation across the interface. This requirement can be expressed as follows:
where
and
are the stress tensors of the fluid and solid domains, n Pa;
and
are the outward unit normal vectors at the fluid and solid interfaces; and
and
denote the displacement vectors of the fluid and solid domains, in
A one-way fluid–structure interaction approach was employed, in which the wind pressure obtained from the CFD (Computational Fluid Dynamics) analysis was transferred to the structural model without deformation feedback to the flow field. This simplification is considered reasonable because the maximum structural displacement predicted in this study is only several millimeters, which is negligible compared with the characteristic dimensions of the photovoltaic modules and support system. Therefore, structural deformation is unlikely to significantly alter the surrounding flow field. However, under extreme wind conditions associated with large deformation or structural failure, two-way fluid–structure interaction may be required to capture the coupled aerodynamic–structural behavior more accurately.
Overall, these modeling assumptions may affect the absolute values of wind pressure, displacement, and stress. However, because the same assumptions were consistently applied to all simulation cases, the relative comparisons among different wind directions, reinforcement thicknesses, and before–after reinforcement models remain meaningful. Therefore, the main conclusions regarding weak-component identification and reinforcement effectiveness are not expected to be significantly affected. Future work will consider atmospheric boundary-layer wind profiles, semi-rigid bolted connections, and two-way fluid–structure interaction to further improve the quantitative accuracy of the model.
2.6. Mesh and Time-Step Independence Verification
To ensure the reliability of the numerical results, mesh independence verification should be performed before the formal simulations.
Table 3 uses five different meshes for comparison. The maximum displacement of the photovoltaic support under the 0° wind direction can be selected as the evaluation index.
As shown in
Table 3, when the surface mesh size decreased from 0.050 m to 0.030 m, the number of elements increased from 1,321,048 to 2,969,718. However, the outlet velocity, outlet pressure, and maximum velocity changed only slightly. The outlet velocity remained approximately 20.06 m/s, the outlet pressure remained approximately 248 Pa, and the maximum velocity remained approximately 20.75–20.86 m/s. This indicates that further mesh refinement had a limited influence on the main flow-field results.
Considering both computational accuracy and efficiency, the mesh scheme with a surface mesh size of 0.040 m was selected for the subsequent simulations. This scheme contained 337,060 nodes and 1,818,875 elements, which provided stable flow-field results while avoiding excessive computational cost.
For the transient wind-induced response analysis, the time step should be small enough to capture the main frequency components of the fluctuating wind field. Since the fluctuating wind energy simulated based on the Davenport spectrum is mainly concentrated within 0–5 Hz, and the selected frequency range was 0–6 Hz, the time step was determined according to the sampling requirement of the transient wind field. The selected time step was 0.001 s, which ensured the temporal resolution of the fluctuating wind speed history and the stability of the transient calculation.
All numerical simulations were performed using ANSYS 2024 R1 for finite element analysis and computational fluid dynamics simulations. The one-way fluid–structure interaction was conducted within the ANSYS Workbench environment. Structural displacements, stresses, and strains were recorded with an accuracy of up to four decimal places to ensure reliable identification of weak components and evaluation of reinforcement effectiveness. Post-processing and visualization of flow fields and structural responses were carried out using Tecplot 360. Data analysis and plotting were performed using Origin 2023, while velocity and frequency spectra were obtained and analyzed using MATLAB 2018.
3. Wind-Induced Response of Photovoltaic Support
3.1. Wind Pressure Distribution Under Different Wind Directions
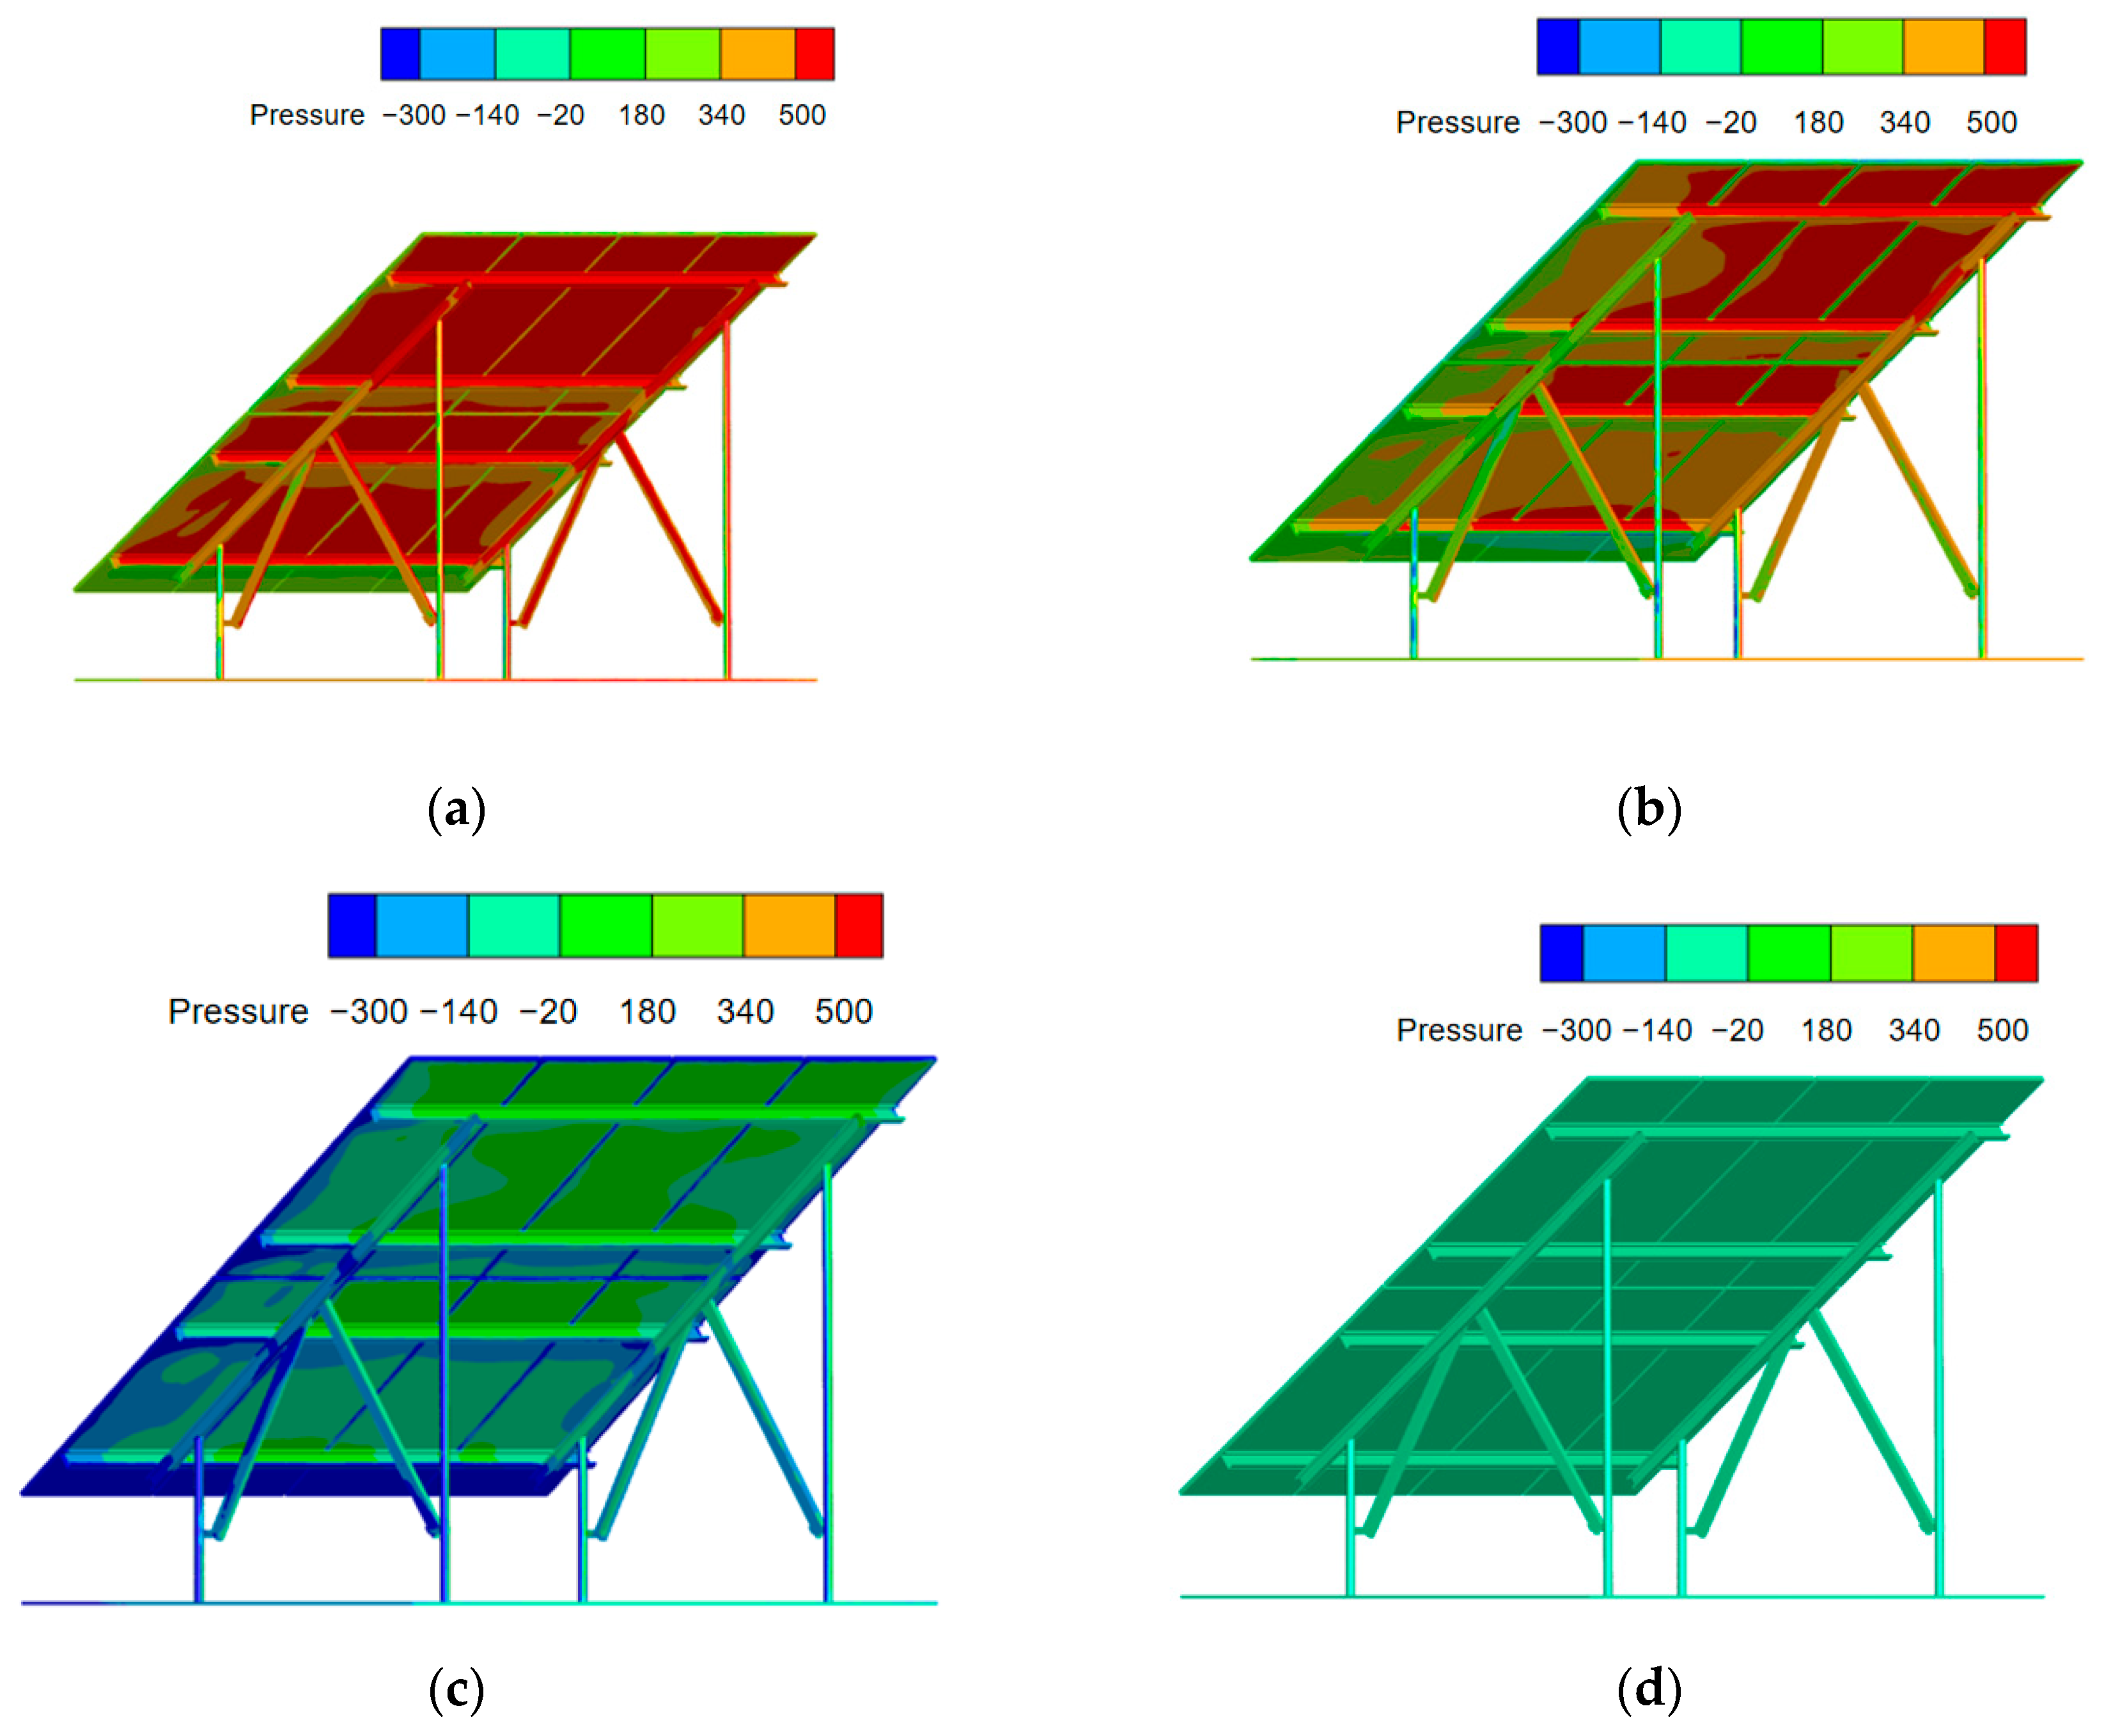
Wind direction is an important factor affecting the wind pressure distribution and structural response of photovoltaic supports. Because photovoltaic modules are installed with a certain inclination angle, the relative relationship between the incoming wind and the module surface changes with the wind direction. This variation further changes the positive-pressure region, negative-pressure region, local flow separation, and wind-induced deformation of the support.
The influence of wind direction on the aerodynamic behavior of the photovoltaic support can be explained by the change in the relative orientation between the incoming airflow and the inclined photovoltaic modules. When the wind direction angle is 0°, the airflow impinges directly on the windward surface of the modules, resulting in a large stagnation region and a significant positive-pressure zone. Simultaneously, flow separation occurs at the module edges, generating a large wake region and strong negative pressure on the leeward side. The resulting pressure difference across the module surface reaches its maximum value, leading to the largest wind-induced structural response.
As shown in
Figure 5, the wind direction angle increases to 30° and 45°, the normal component of the incoming wind velocity decreases, and the airflow tends to move along the module surface rather than directly impacting it. Consequently, the stagnation pressure is reduced, while the flow field becomes more three-dimensional. The pressure distribution becomes more uniform, and the intensity of flow separation and wake vortices decreases. These effects reduce both the local pressure concentration and the overall wind load acting on the support structure.
Under the 90° wind direction, the airflow is approximately parallel to the array arrangement, resulting in the smallest effective windward area. The direct aerodynamic loading on the module surfaces is significantly weakened, and the pressure gradient between the windward and leeward sides becomes much smaller. In addition, the formation of large-scale separation vortices is suppressed, leading to a more uniform pressure distribution and the lowest displacement response among all investigated wind directions.
These results indicate that the aerodynamic response of photovoltaic supports is governed not only by wind speed but also by the interaction between wind direction, flow separation, vortex formation, and pressure redistribution. The findings further explain why the 0° wind direction represents the most unfavorable loading condition and provide a physical basis for selecting this condition for subsequent reinforcement design and structural assessment.
3.2. Displacement Response Under Fluctuating Wind Loads
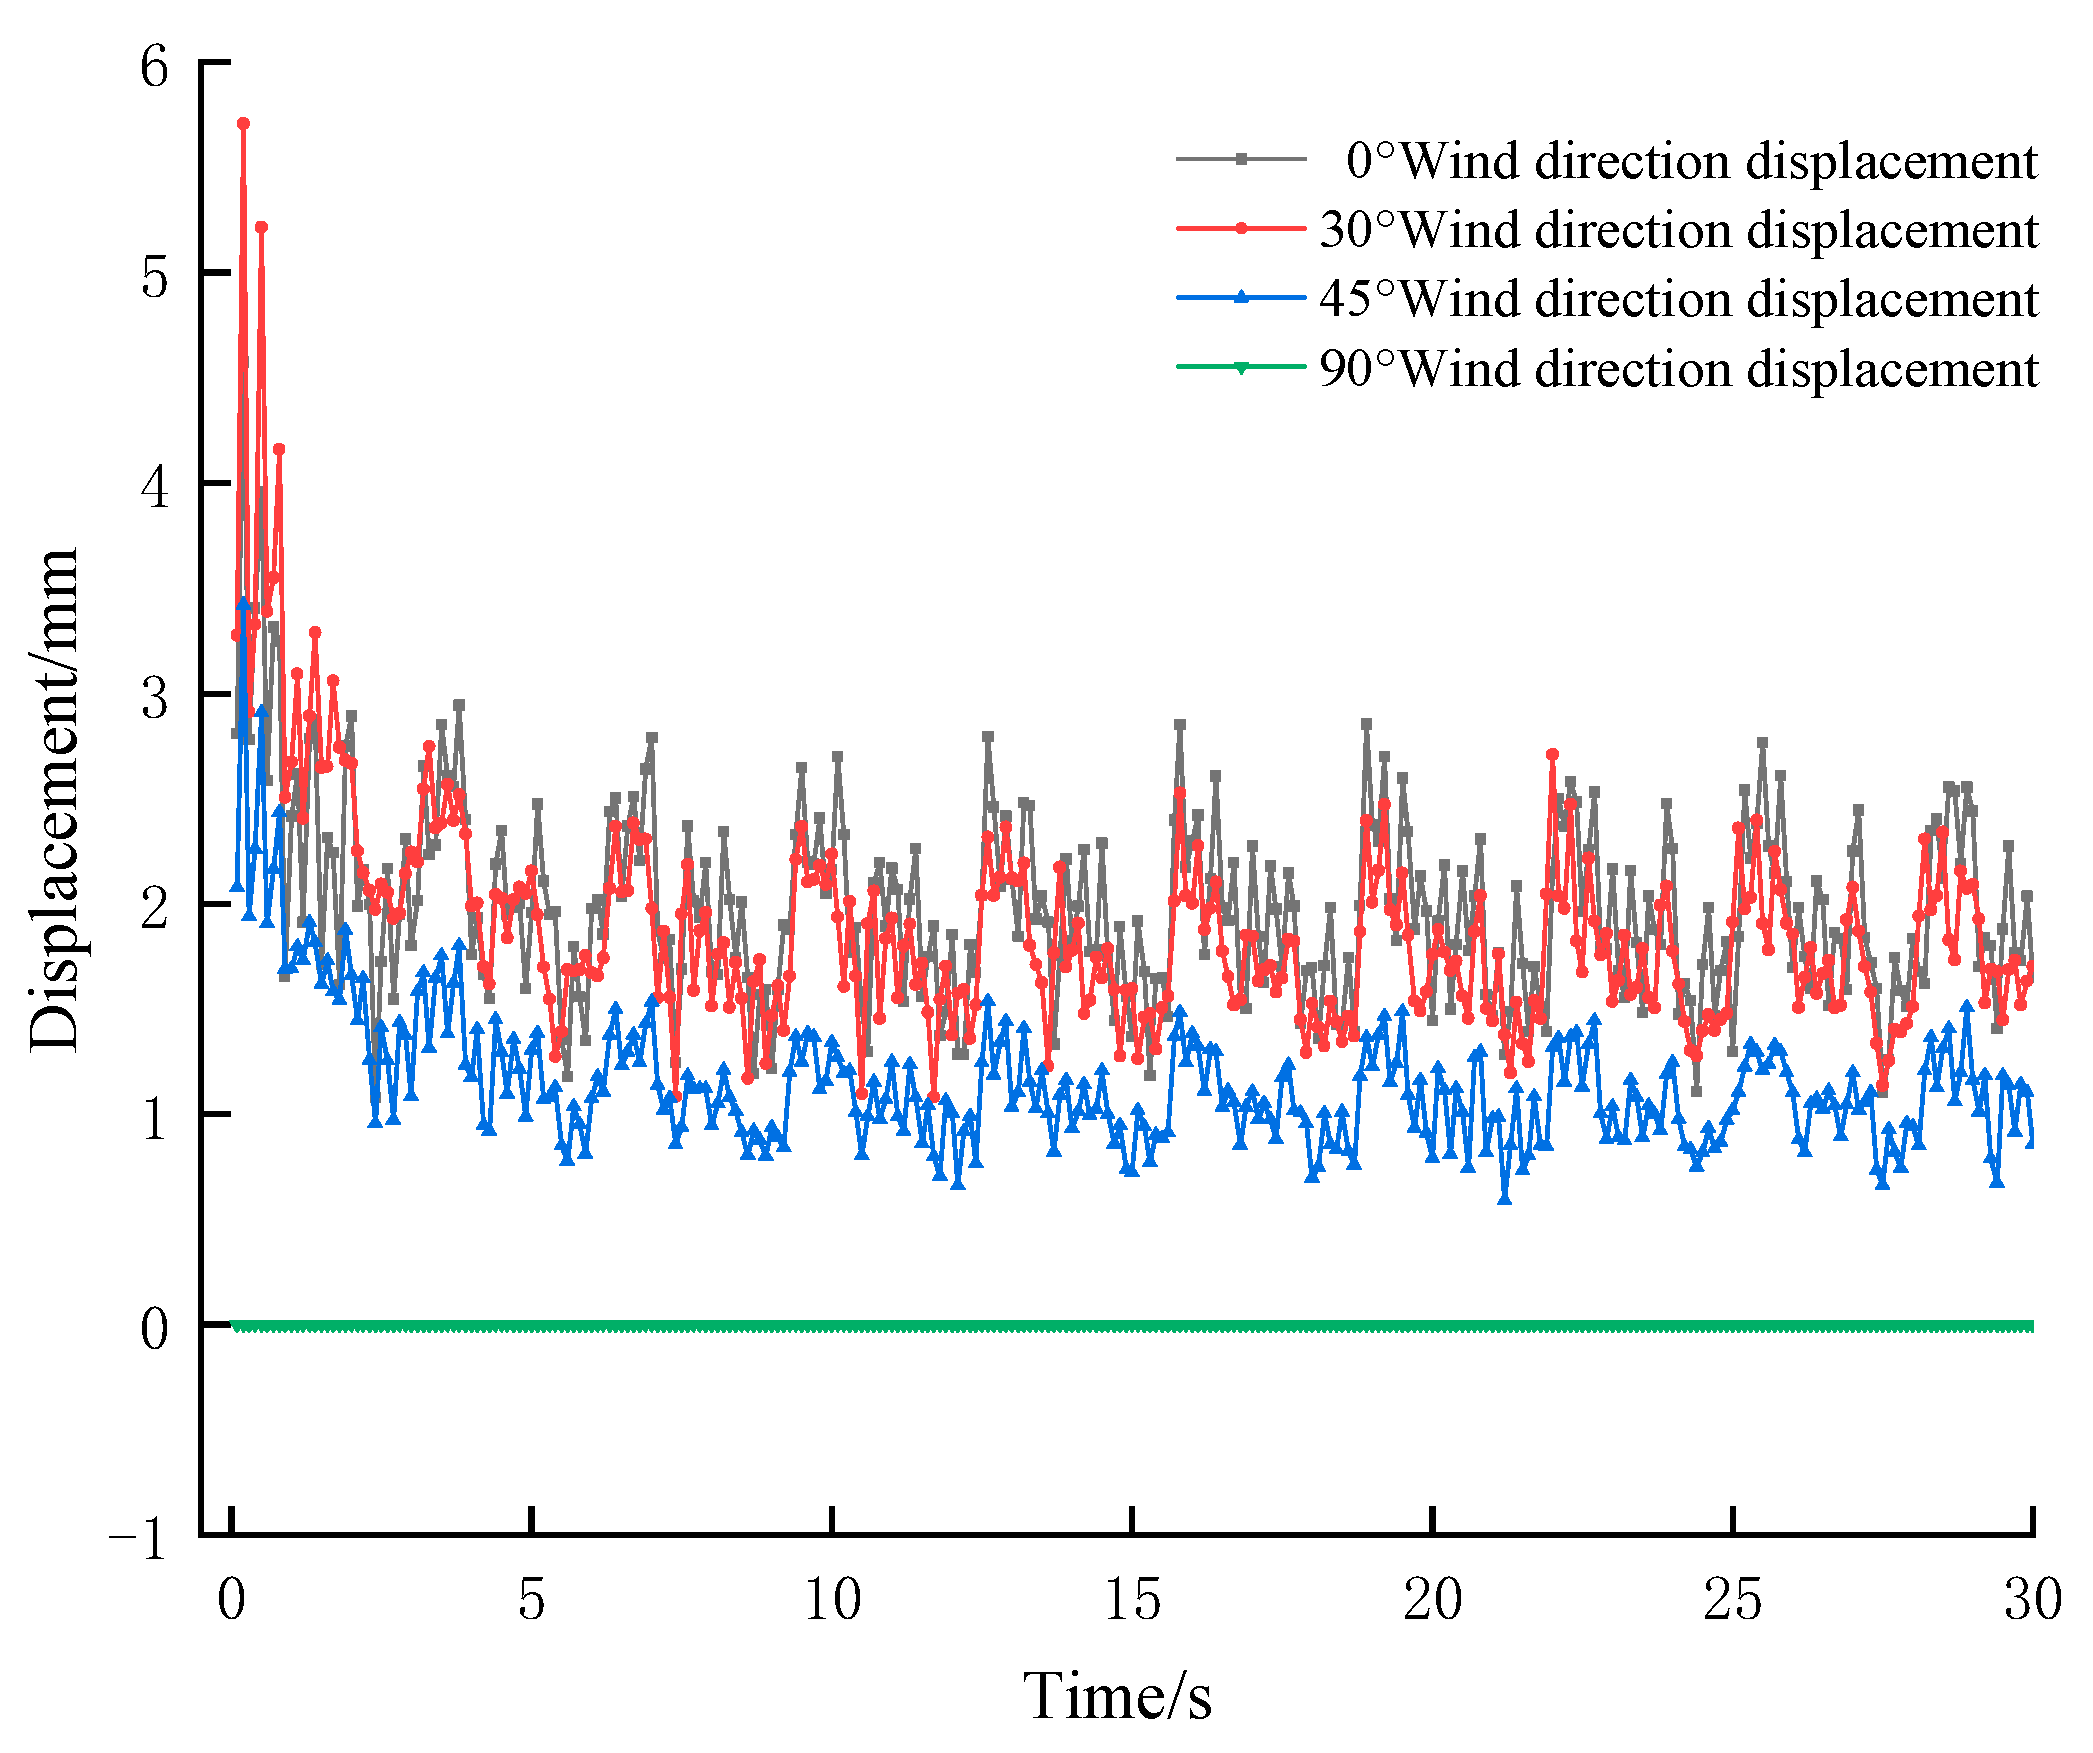
Under fluctuating wind loads, the displacement response of the photovoltaic support showed obvious random fluctuation characteristics. The displacement time histories under different wind direction angles were extracted and compared. The results show that the wind direction angle had a significant influence on the structural displacement response.
Figure 6 shows that the displacement response of the photovoltaic support exhibits obvious random fluctuation characteristics under fluctuating wind loads. This behavior is mainly attributed to the stochastic nature of the incoming wind field generated from the Davenport spectrum. Since wind pressure is approximately proportional to the square of wind velocity, even small fluctuations in wind speed can produce significant variations in aerodynamic loading, resulting in continuous changes in structural displacement over time.
The influence of wind direction on the displacement response is closely related to the wind-pressure distribution discussed in
Section 3.1. Under the 0° wind direction, the incoming airflow directly impacts the windward surface of the photovoltaic modules, generating the largest pressure difference between the windward and leeward sides. Consequently, the support structure is subjected to the highest aerodynamic loading, leading to the largest displacement fluctuations and peak response. As the wind direction changes to 30° and 45°, the normal component of the incoming wind velocity decreases, resulting in lower aerodynamic forces and reduced structural deformation.
For the 90° wind direction, the airflow acts approximately parallel to the photovoltaic array, producing the smallest effective windward area and the most uniform pressure distribution. As a result, the overall wind load acting on the support structure is significantly reduced, and the displacement response reaches its minimum value among all investigated cases.
The displacement contours further indicate that the maximum deformation is concentrated in the purlin region. This phenomenon can be explained by the structural role of the purlins within the load-transfer path. The purlins directly receive wind loads from the photovoltaic modules and transfer these loads to the beams and columns. Compared with the primary supporting members, the purlins possess relatively lower bending stiffness and sectional moment of inertia. According to beam bending theory, structural deformation increases as flexural stiffness decreases. Therefore, the purlins experience larger deformation than other structural components under fluctuating wind loads.
These findings provide important insight into the structural vulnerability of the photovoltaic support system. The concentration of displacement in the purlin region indicates that the purlins govern the overall wind-induced response of the structure and therefore represent the most critical target for subsequent reinforcement design.
3.3. Stress Concentration and Weak Component Identification
The stress distribution was further analyzed to identify the weak components of the photovoltaic support. The results show that high-stress regions were mainly concentrated in the purlins and their connection regions. Certain stress concentrations were also observed near the connections between beams and joints. The stress distribution was generally consistent with the displacement response, indicating that the purlins and their connection regions were not only the main deformation areas but also the main stress-concentration areas.
Based on the comparison of wind pressure distribution, displacement response, and stress distribution under different wind direction angles, the following conclusions can be drawn. As shown in
Figure 7, excluding the photovoltaic modules, the purlins have the most significant influence on the wind-induced response. First, the 0° wind direction is the most unfavorable wind direction for the studied photovoltaic support. Second, the purlins and their connection regions are the dominant weak components under fluctuating wind loads. Third, although stress concentration also occurs at some beam-joint connections, the corresponding deformation is relatively small compared with that of the purlins. Therefore, the purlin region was selected as the primary target for the subsequent non-destructive reinforcement design, while the deformation of the photovoltaic modules was not the focus of this study.
3.4. In Situ Non-Destructive Reinforcement Design
3.4.1. Reinforcement Scheme
Based on the weak component identification results in
Section 3.3, the purlin region was selected as the primary reinforcement target. The purlins directly transfer wind loads from the photovoltaic modules to the main support system, and the numerical results show that large displacement and local stress concentration mainly occur in the purlins and their connection regions.
Compared with conventional reinforcement methods such as purlin replacement, external bracing, and connection strengthening, the proposed method reinforces the existing purlin by inserting an internal auxiliary member. This method does not require the removal of photovoltaic modules or the replacement of original purlins, and the original load-transfer path of the support system is preserved. Therefore, the proposed reinforcement strategy is characterized by low construction disturbance, good compatibility with existing structures, and improved local bending stiffness of the purlins.
After reinforcement, the internal auxiliary member increases the equivalent bending stiffness of the purlin section and helps reduce local deformation under fluctuating wind loads. Therefore, the proposed method is suitable for low-disturbance reinforcement of existing ground-mounted photovoltaic supports.
3.4.2. Local Surface-Pressure Loading Method for Purlin Reinforcement Analysis
To compare the local displacement response of the original and reinforced purlins, a local purlin model was established. The analyzed segment was taken from the purlin span between two adjacent columns, with a length of 3.35 m and a width of 0.60 m. The two side ends of the purlin segment were fixed to represent the constraint provided by the adjacent support members.
The equivalent pressure load of 400 Pa used in this section was not arbitrarily selected. It was determined based on the maximum local wind pressure obtained from the wind-pressure analysis presented in the previous section under the most unfavorable wind direction. Therefore, the applied load represents a conservative loading condition for evaluating the structural performance of the reinforced purlin.
It should be noted that the objective of this stage was not to reproduce the complete fluid–structure interaction process, but rather to identify the most suitable reinforcement thickness among several candidate configurations. Performing full transient CFD–FSI (Computational Fluid Dynamics and Fluid–Structure Interaction) simulations for each reinforcement thickness would require substantial computational resources and significantly increase the optimization cost. Therefore, an equivalent uniform pressure loading method was adopted as an efficient parameter-screening approach.
Under this method, identical boundary conditions, material properties, and loading conditions were applied to all reinforcement schemes, while the reinforcement thickness was treated as the only design variable. Consequently, although the absolute displacement values may differ slightly from those obtained under a realistic fluctuating wind field, the relative performance differences among the candidate reinforcement schemes remain representative and suitable for comparative evaluation.
A uniform downward surface pressure of 400 Pa was applied to the internal upper surface of the purlin to simulate the equivalent load transferred from the photovoltaic modules under wind action. The purlin was made of Q355 steel, with an elastic modulus of 206 GPa and a Poisson’s ratio of 0.3. The cross-section of the purlin was C120 × 50 × 20 × 2.5 mm. The equivalent line load can be expressed as follows:
where
is the equivalent line load,
is the design wind pressure, and
is the effective tributary width of the purlin.
To determine a reasonable thickness for the internal auxiliary reinforcement member, five models were established, including the original purlin without reinforcement and four reinforced purlins with internal auxiliary plates of 1.0 mm, 2.0 mm, 2.5 mm, and 3.0 mm thicknesses. The comparison results are listed in
Table 4. The results indicate that the displacement decreases progressively with increasing reinforcement thickness. A noticeable improvement is achieved when the thickness reaches 2.5 mm, whereas further increasing the thickness to 3.0 mm results in only marginal displacement reduction.
The results show that the maximum displacement decreases as the reinforcement thickness increases. Compared with the original structure, the maximum displacement decreased from 4.8563 mm to 3.6573 mm when the reinforcement thickness was 2.5 mm, corresponding to a reduction of 24.69%. This indicates that the internal auxiliary reinforcement member can effectively improve the local stiffness of the purlin and reduce wind-induced deformation.
However, when the thickness increased from 2.5 mm to 3.0 mm, the maximum displacement only decreased from 3.6573 mm to 3.5832 mm. The additional reduction was only 0.0741 mm, indicating that the improvement became limited after the thickness reached 2.5 mm. Therefore, considering both structural performance and material efficiency, the 2.5 mm reinforcement member was selected as the optimal reinforcement configuration for subsequent full-model verification.
This equivalent-load-based optimization strategy establishes a rational link between the wind-pressure analysis and the reinforcement design process, providing a computationally efficient yet scientifically sound basis for determining the final reinforcement scheme.
3.5. Verification of Reinforcement Effect
3.5.1. Displacement Response Before and After Reinforcement
To verify the effectiveness of the proposed in situ non-destructive reinforcement method, the displacement responses of the photovoltaic support before and after reinforcement were compared. According to the parameter optimization results in
Section 3.4, the 2.5 mm-thick internal auxiliary reinforcement member was selected as the final reinforcement scheme. The same wind load, boundary conditions, material parameters, and numerical method were used for both the original and reinforced models to ensure comparability.
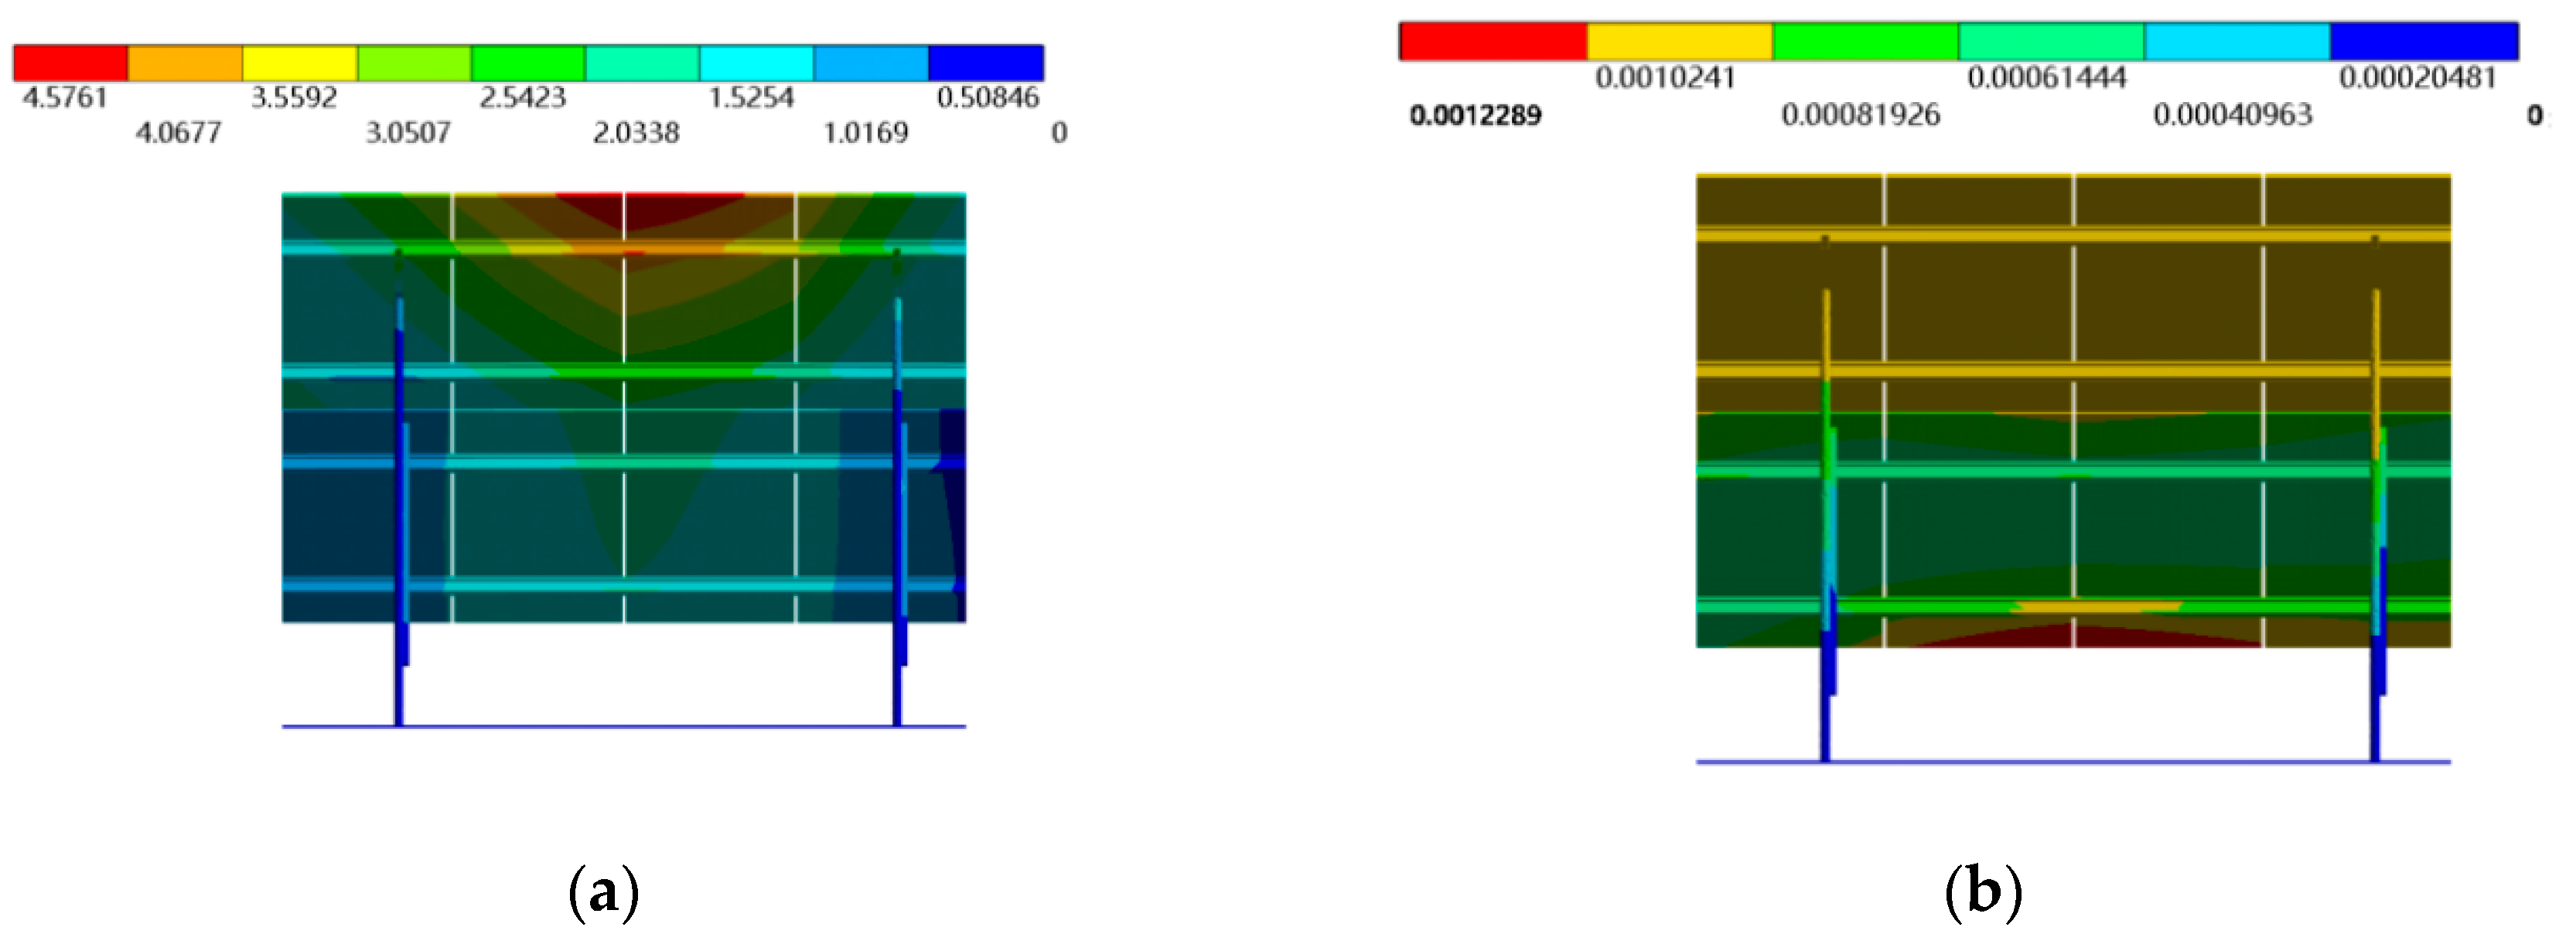
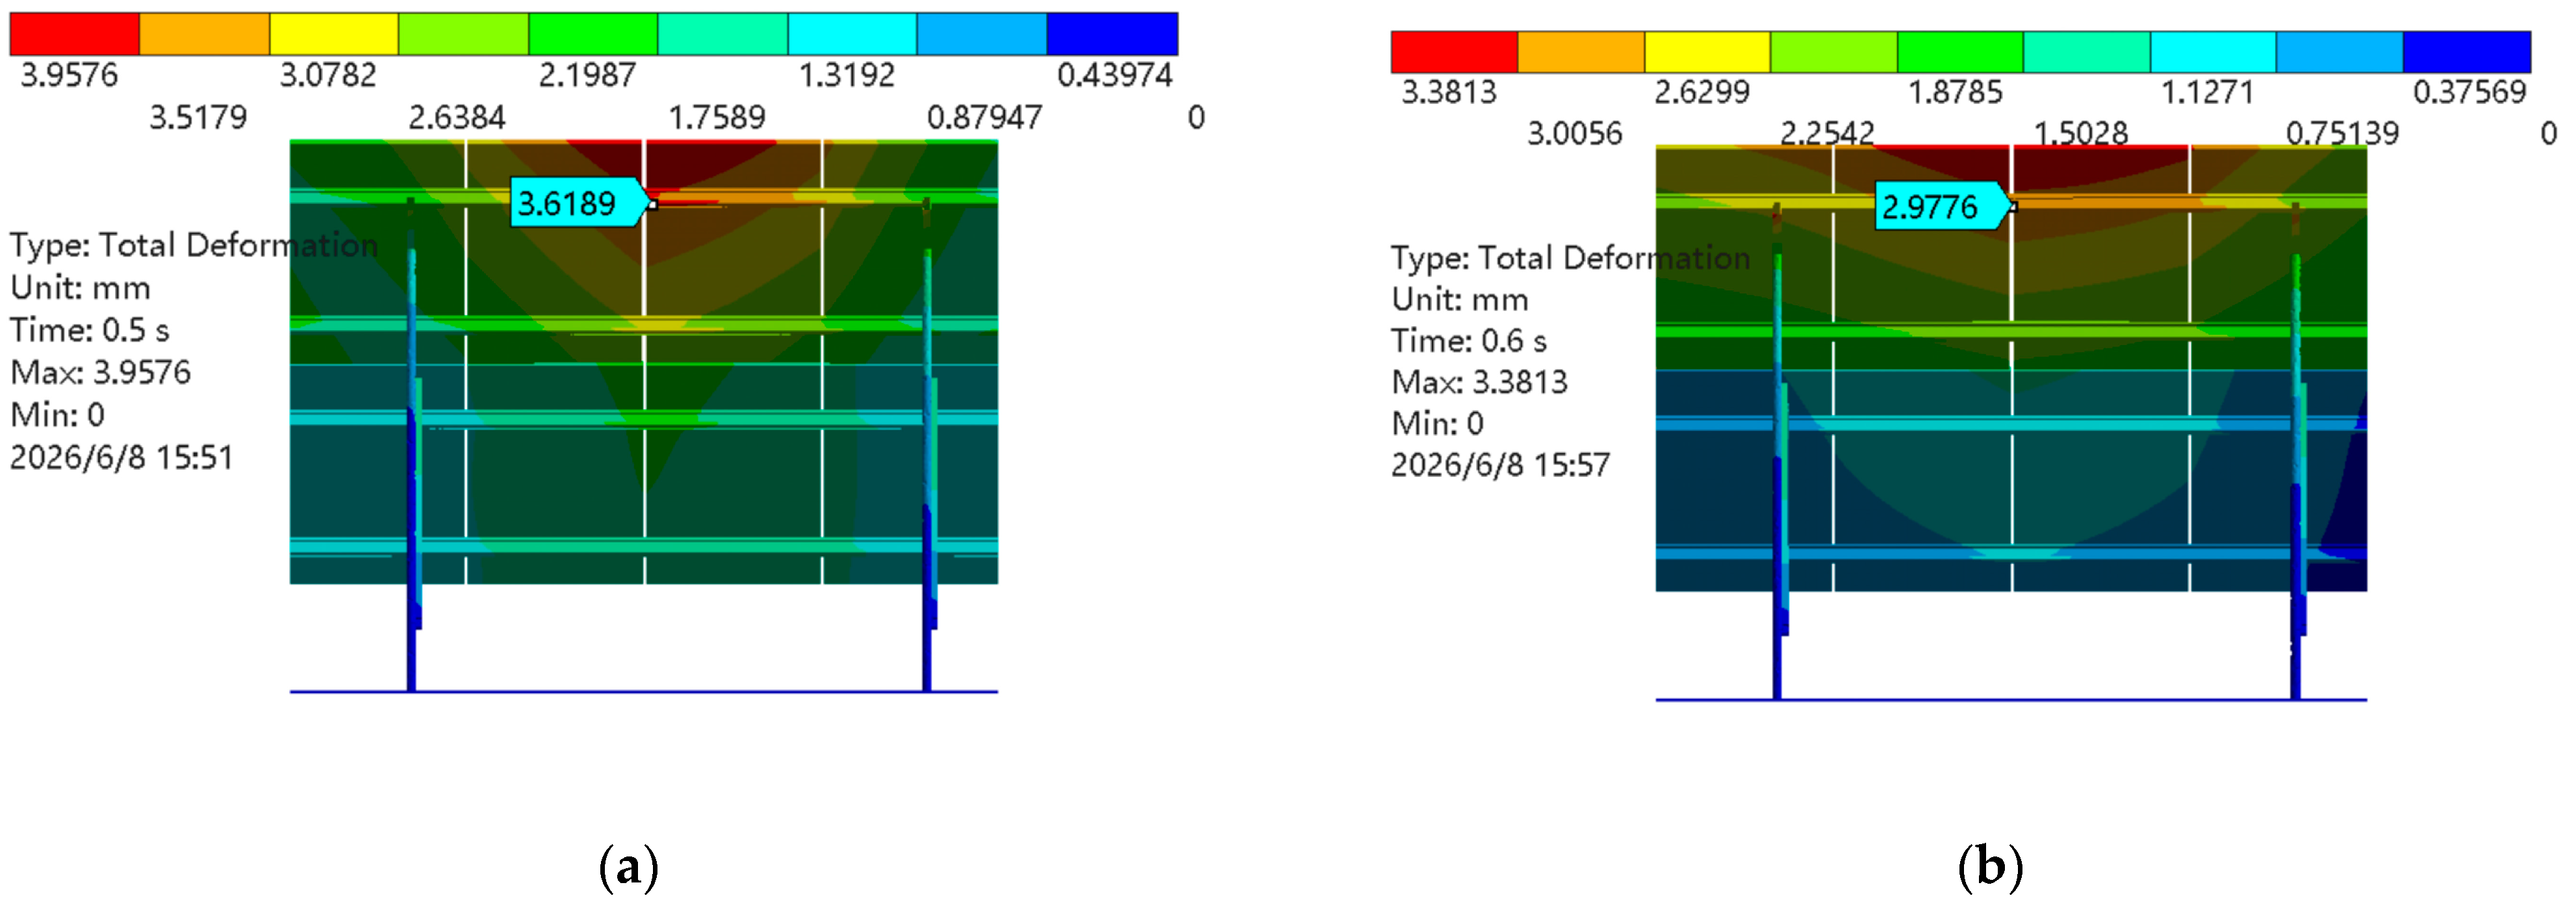
Figure 8 compares the displacement contours of the photovoltaic support before and after reinforcement under the most unfavorable wind-loading condition. Before reinforcement (
Figure 8a), the maximum displacement reached 3.6189 mm and was concentrated in the central purlin region. The displacement distribution exhibits a typical bending-deformation pattern, with the largest deformation occurring near the mid-span of the purlin, while smaller displacements are observed near the supporting columns. This behavior is consistent with the load-transfer mechanism of the structure, where wind loads acting on the photovoltaic modules are transmitted through the purlins to the main supporting members.
After the installation of the internal reinforcement member (
Figure 8b), the maximum displacement decreased to 2.9776 mm, corresponding to a reduction of approximately 17.7%. Although the location of the maximum displacement remained near the purlin mid-span, the extent of the high-displacement region was significantly reduced. This indicates that the reinforcement did not alter the structural load path or boundary conditions but effectively increased the local stiffness of the purlin.
The reduction in displacement can be attributed to the increase in the effective bending stiffness of the purlin section. After reinforcement, the original purlin and the internal auxiliary member acted together as a composite load-bearing unit, increasing the sectional moment of inertia and improving resistance to wind-induced bending deformation. As a result, deformation became more uniformly distributed throughout the support structure, and local displacement concentration was alleviated.
These results demonstrate that the proposed reinforcement method improves not only the peak displacement response but also the overall deformation characteristics of the photovoltaic support system. The more uniform displacement distribution suggests enhanced structural stability under fluctuating wind loads and confirms the effectiveness of the reinforcement strategy in mitigating wind-induced deformation.
3.5.2. Improvement in Local Purlin Response
The purlin is the key load-transfer member between the photovoltaic modules and the main support system. In the original structure, the purlin had relatively limited sectional stiffness and was prone to large bending deformation under repeated fluctuating wind loads. This deformation could further cause local displacement concentration near the purlin-connection regions.
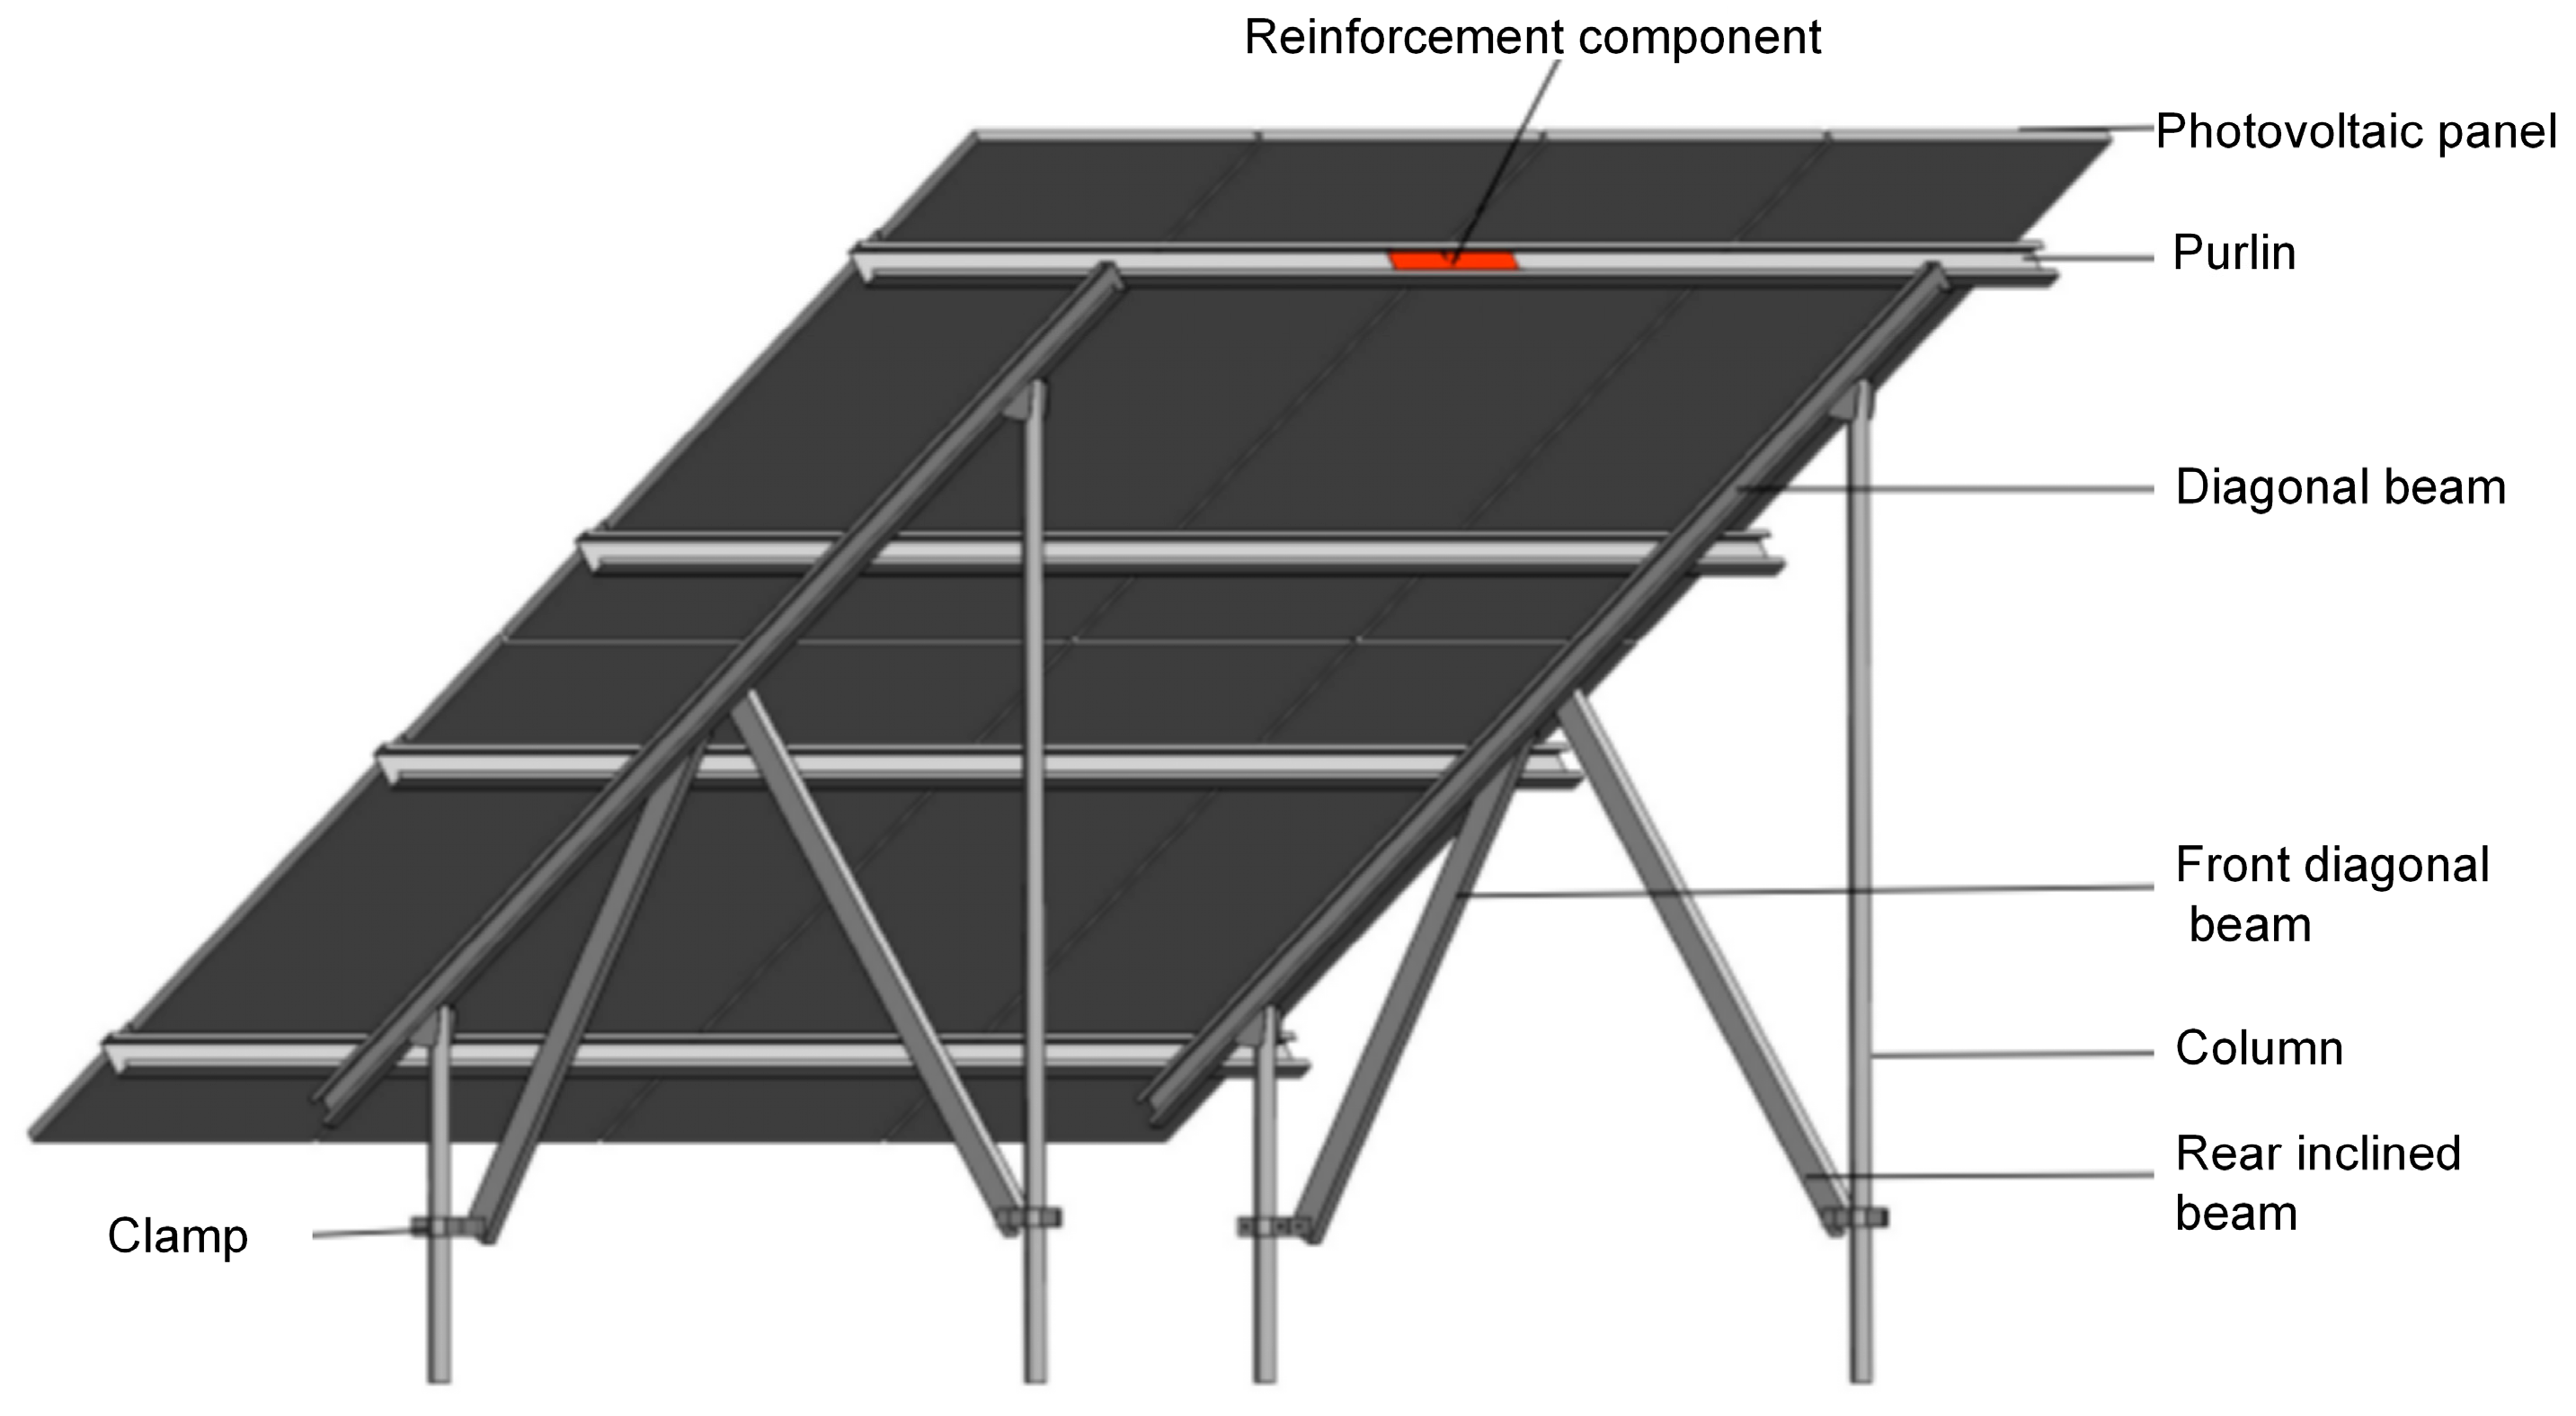
After the internal auxiliary reinforcement member was installed, as shown in
Figure 9, the original purlin and the reinforcement member formed a local composite load-bearing unit. The equivalent bending stiffness of the purlin section was increased, and part of the wind-induced bending effect was shared by the reinforcement member. As a result, the local deformation of the purlin was effectively restrained.
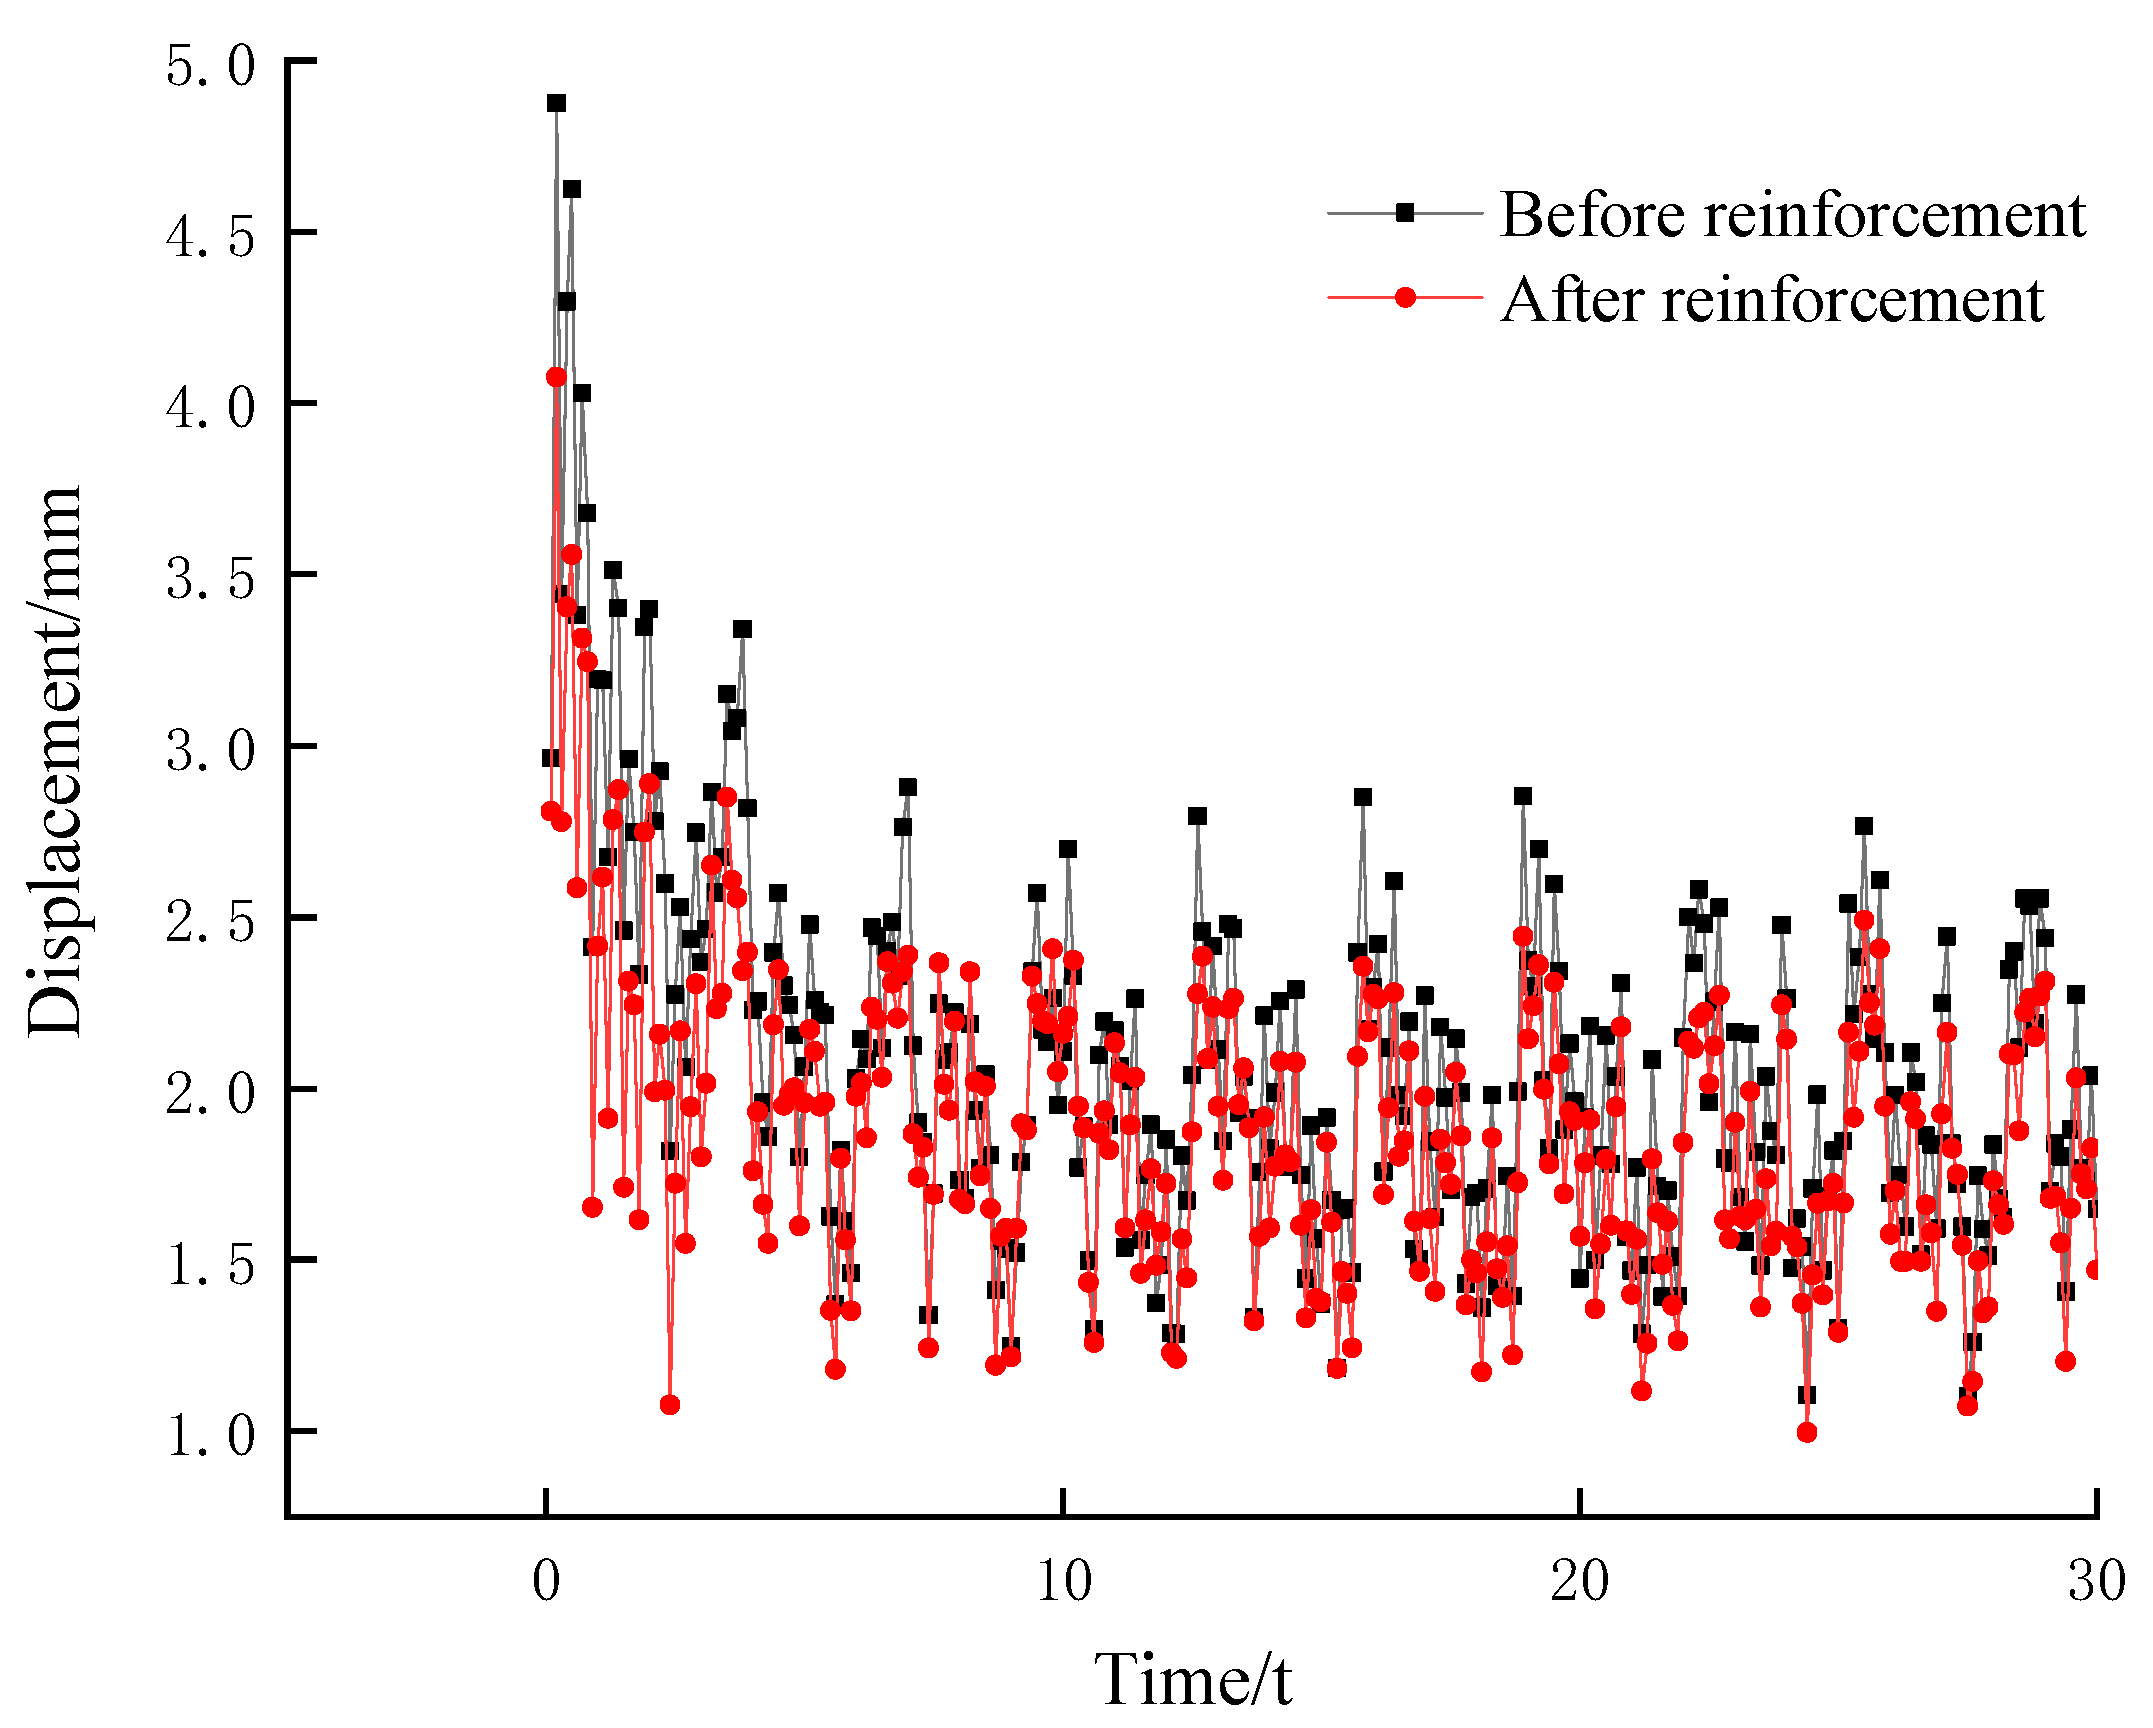
Reinforcing the purlins can effectively suppress this vibration. As shown in
Figure 10, the fluctuation amplitude of purlin displacement decreased from approximately 2.0 mm to 1.5 mm after reinforcement. The displacement fluctuation amplitude of the purlins decreased from approximately 2.0 mm to 1.5 mm after reinforcement, corresponding to a reduction of about 25%. This indicates that the proposed reinforcement method can reduce not only the maximum displacement but also the local displacement fluctuation of the purlin under fluctuating wind loads.
3.5.3. Preliminary Qualitative Demonstration Using 3D-Printed Specimens
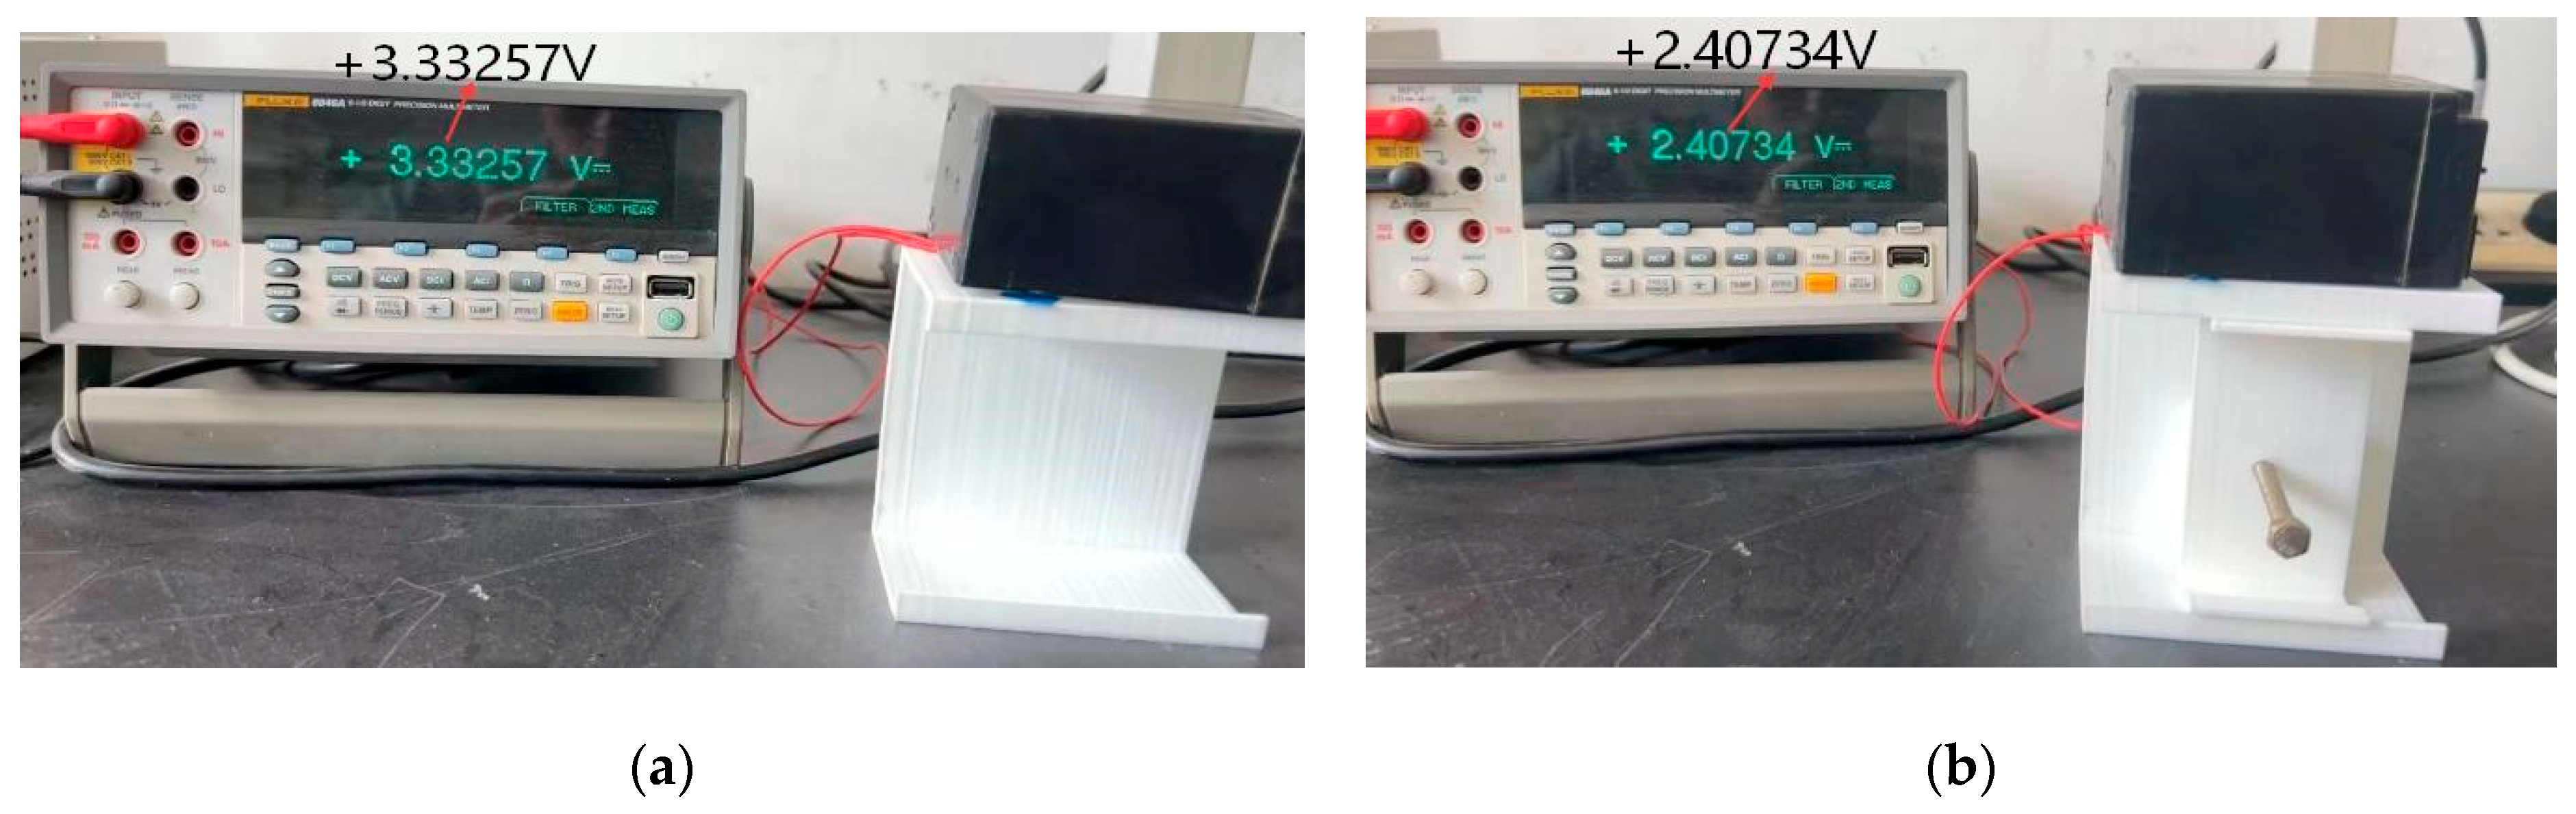
To provide a preliminary qualitative demonstration of the proposed internal purlin reinforcement concept, scaled 3D-printed specimens were prepared. Two specimens were compared: an unreinforced purlin specimen and a reinforced purlin specimen with an internal auxiliary member. The purpose of this supplementary test was not to quantitatively validate the reinforcement effect, but to visually and qualitatively illustrate the feasibility of the proposed reinforcement arrangement.
Strain gauges were attached to the specimens, and voltage responses were recorded under the same loading and measurement conditions. As shown in
Figure 11, the measured voltage responses differed between the reinforced and unreinforced specimens. However, because a voltage–strain calibration relationship was not established in this preliminary test, the measured voltage values cannot be directly converted into strain, stress, or displacement. Therefore, these results should be interpreted only as a qualitative indication of different local mechanical responses between the two specimens.
Accordingly, the 3D-printed specimen test is used only as supplementary qualitative evidence for the feasibility of the reinforcement concept. The quantitative evaluation of the reinforcement effect in this study is mainly based on the numerical comparison of displacement responses before and after reinforcement.
3.5.4. Field Observation and Preliminary Validation
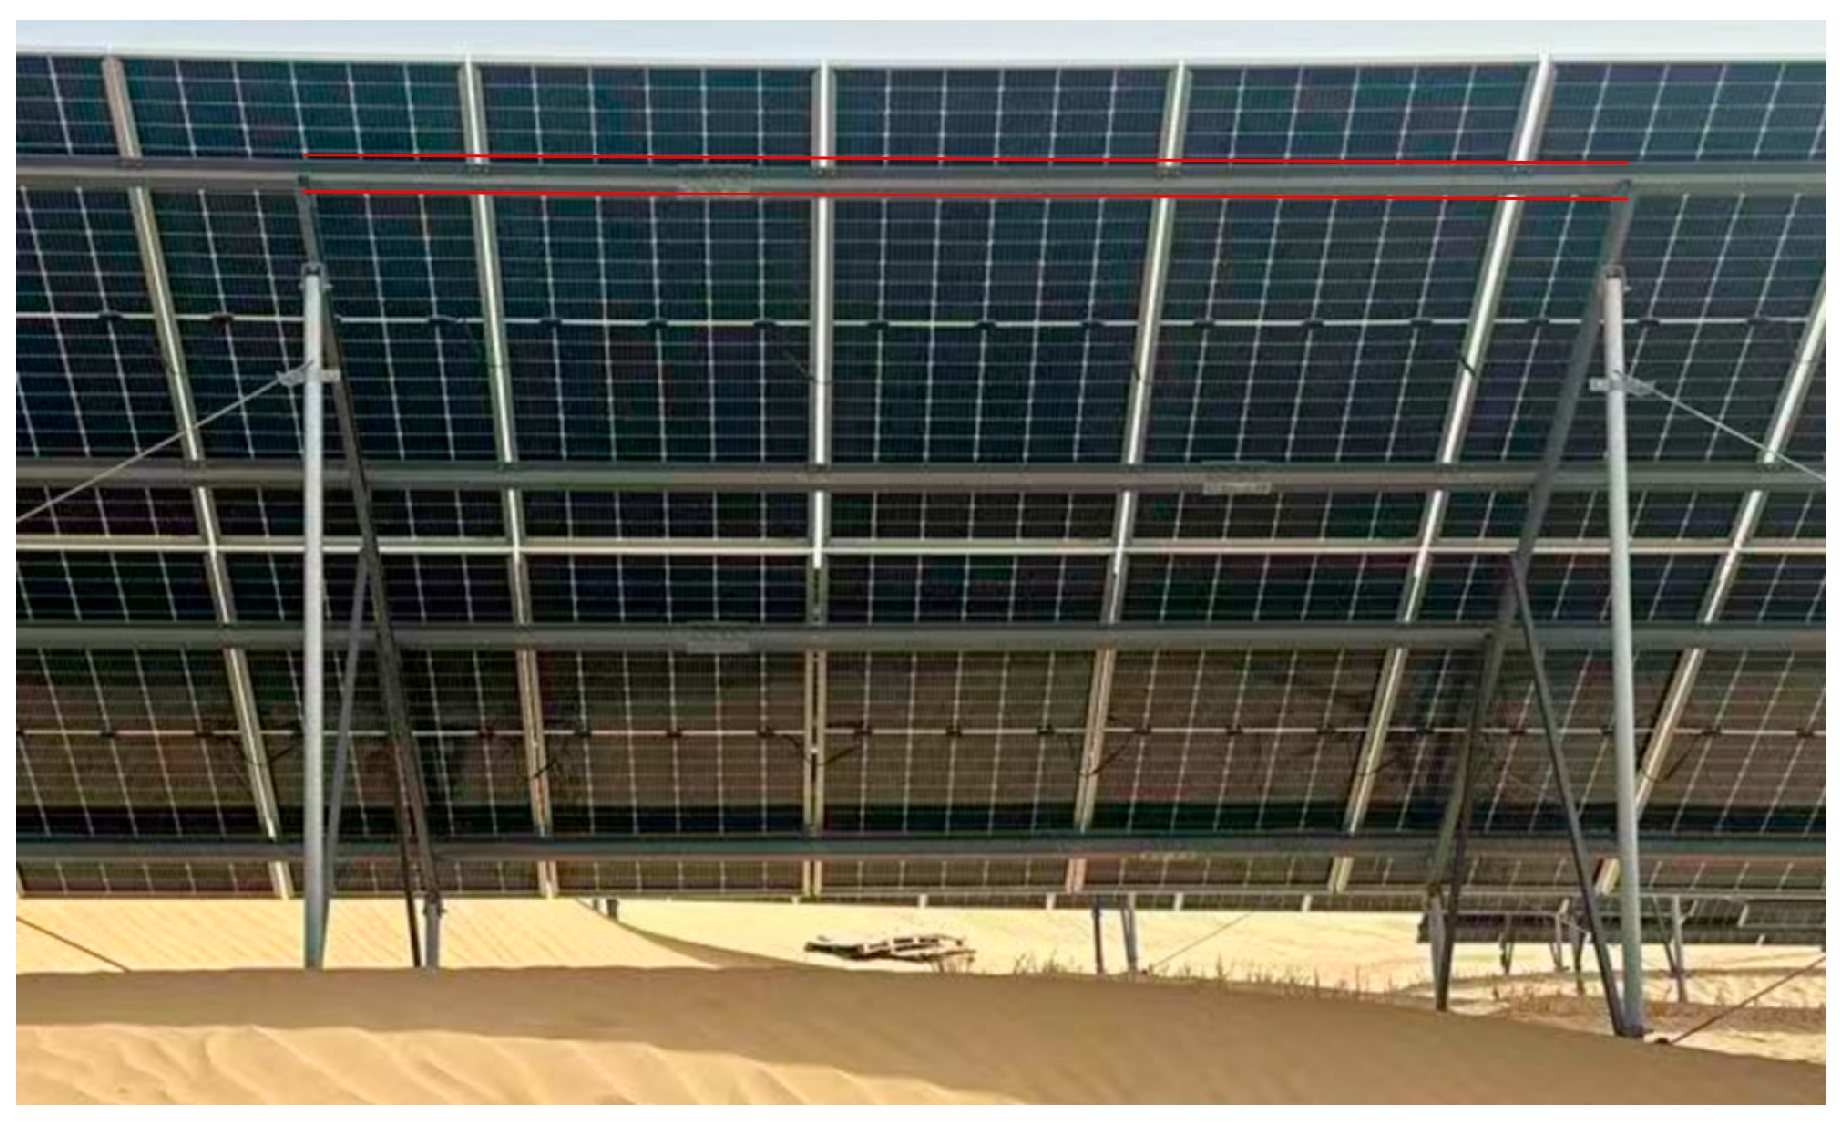
To further assess the practical relevance of the numerical results, field inspections were conducted at the investigated photovoltaic power station after long-term operation under natural wind conditions. As shown in
Figure 12, noticeable bending deformation was observed in several purlins, whereas no obvious damage was found in the primary load-bearing members such as columns and braces.
The maximum residual deformation measured in the damaged purlins was approximately 8.6 mm. It should be noted that this measured deformation represents the accumulated effect of long-term fluctuating wind actions during service rather than the instantaneous deformation caused by a single wind event. In contrast, the numerical simulations presented in this study mainly describe the short-term structural response under a design wind speed condition. The two red lines are used to highlight the bending deformation of the purlins, making the deformation behavior easier to observe.
Both the field observations and simulation results indicate that the purlins are the most vulnerable components of the photovoltaic support system under wind loading. The agreement in the location and mode of deformation provides preliminary support for the reliability of the weak-component identification and the proposed reinforcement strategy.
Therefore, the field measurements and observations provide supplementary evidence that the purlins are the critical structural members governing the wind-resistant performance of the studied photovoltaic support system.
3.5.5. Array-Scale Engineering Verification
To further evaluate the engineering applicability of the proposed reinforcement method, an array-scale photovoltaic support model was established. Compared with a single-support model, the array-scale model better represents the actual arrangement of photovoltaic supports in a power station. The first row of supports was selected for reinforcement verification because it is directly exposed to incoming wind and experiences relatively unfavorable wind loads.
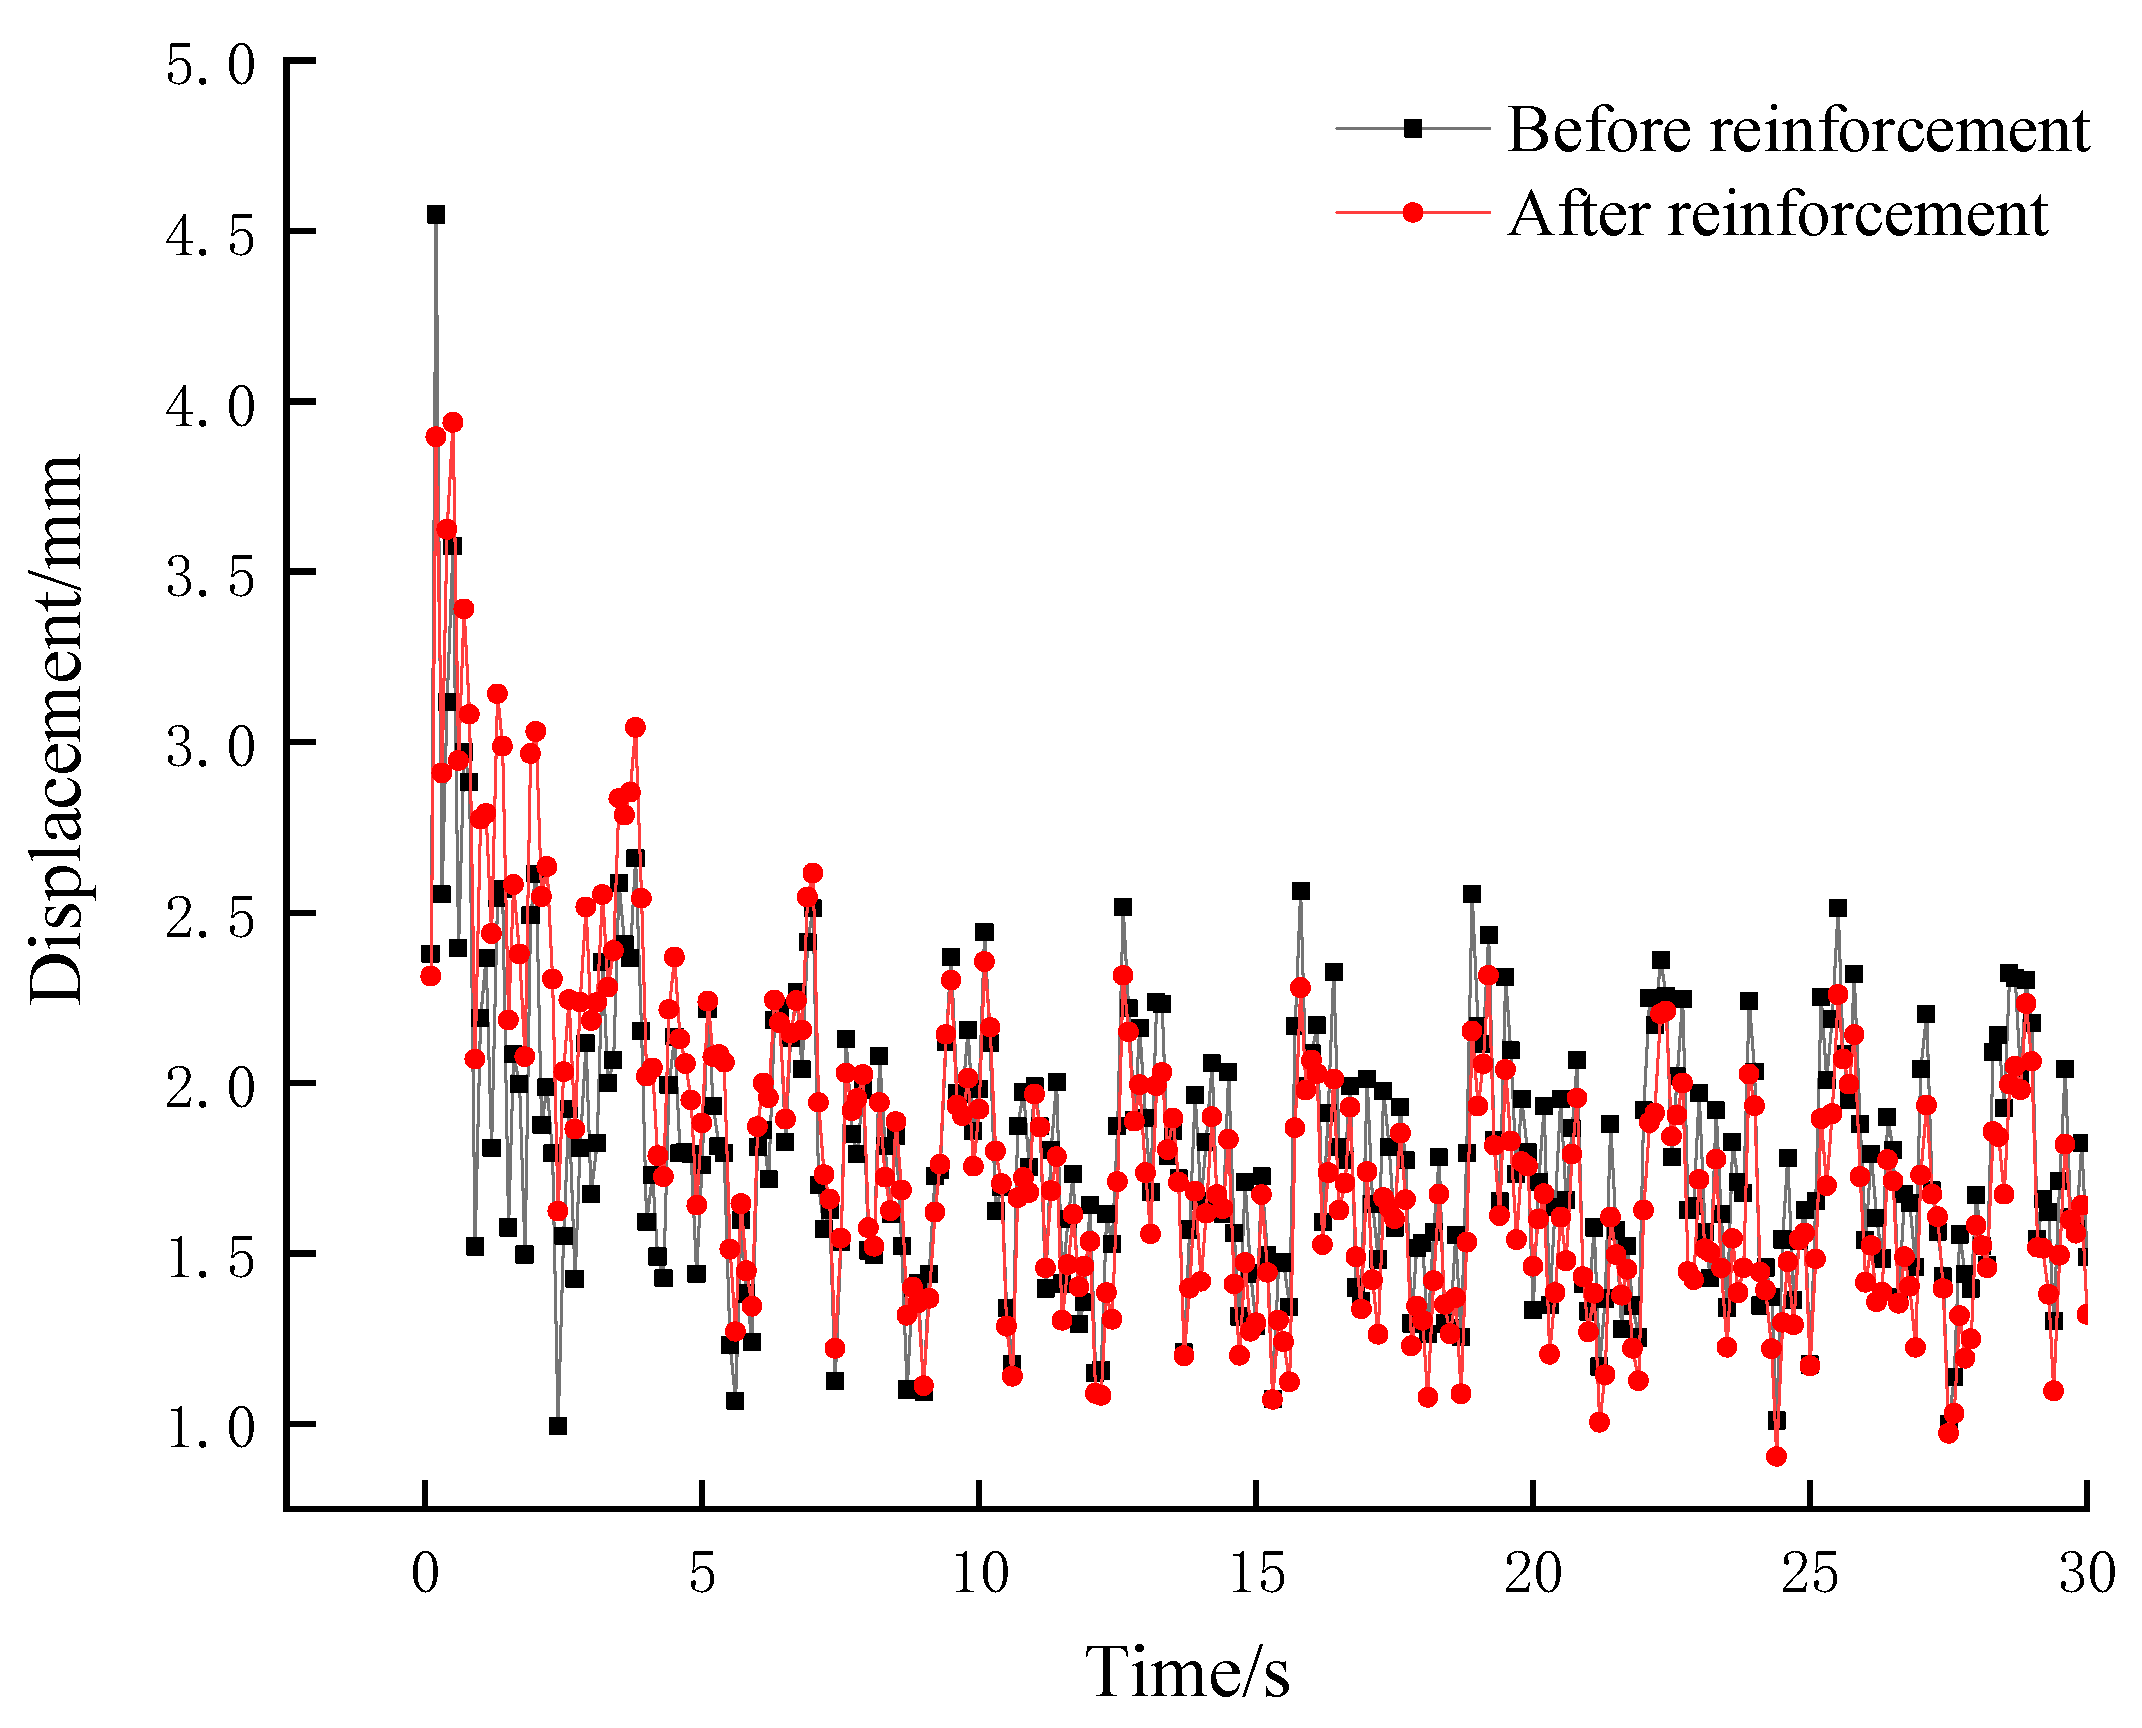
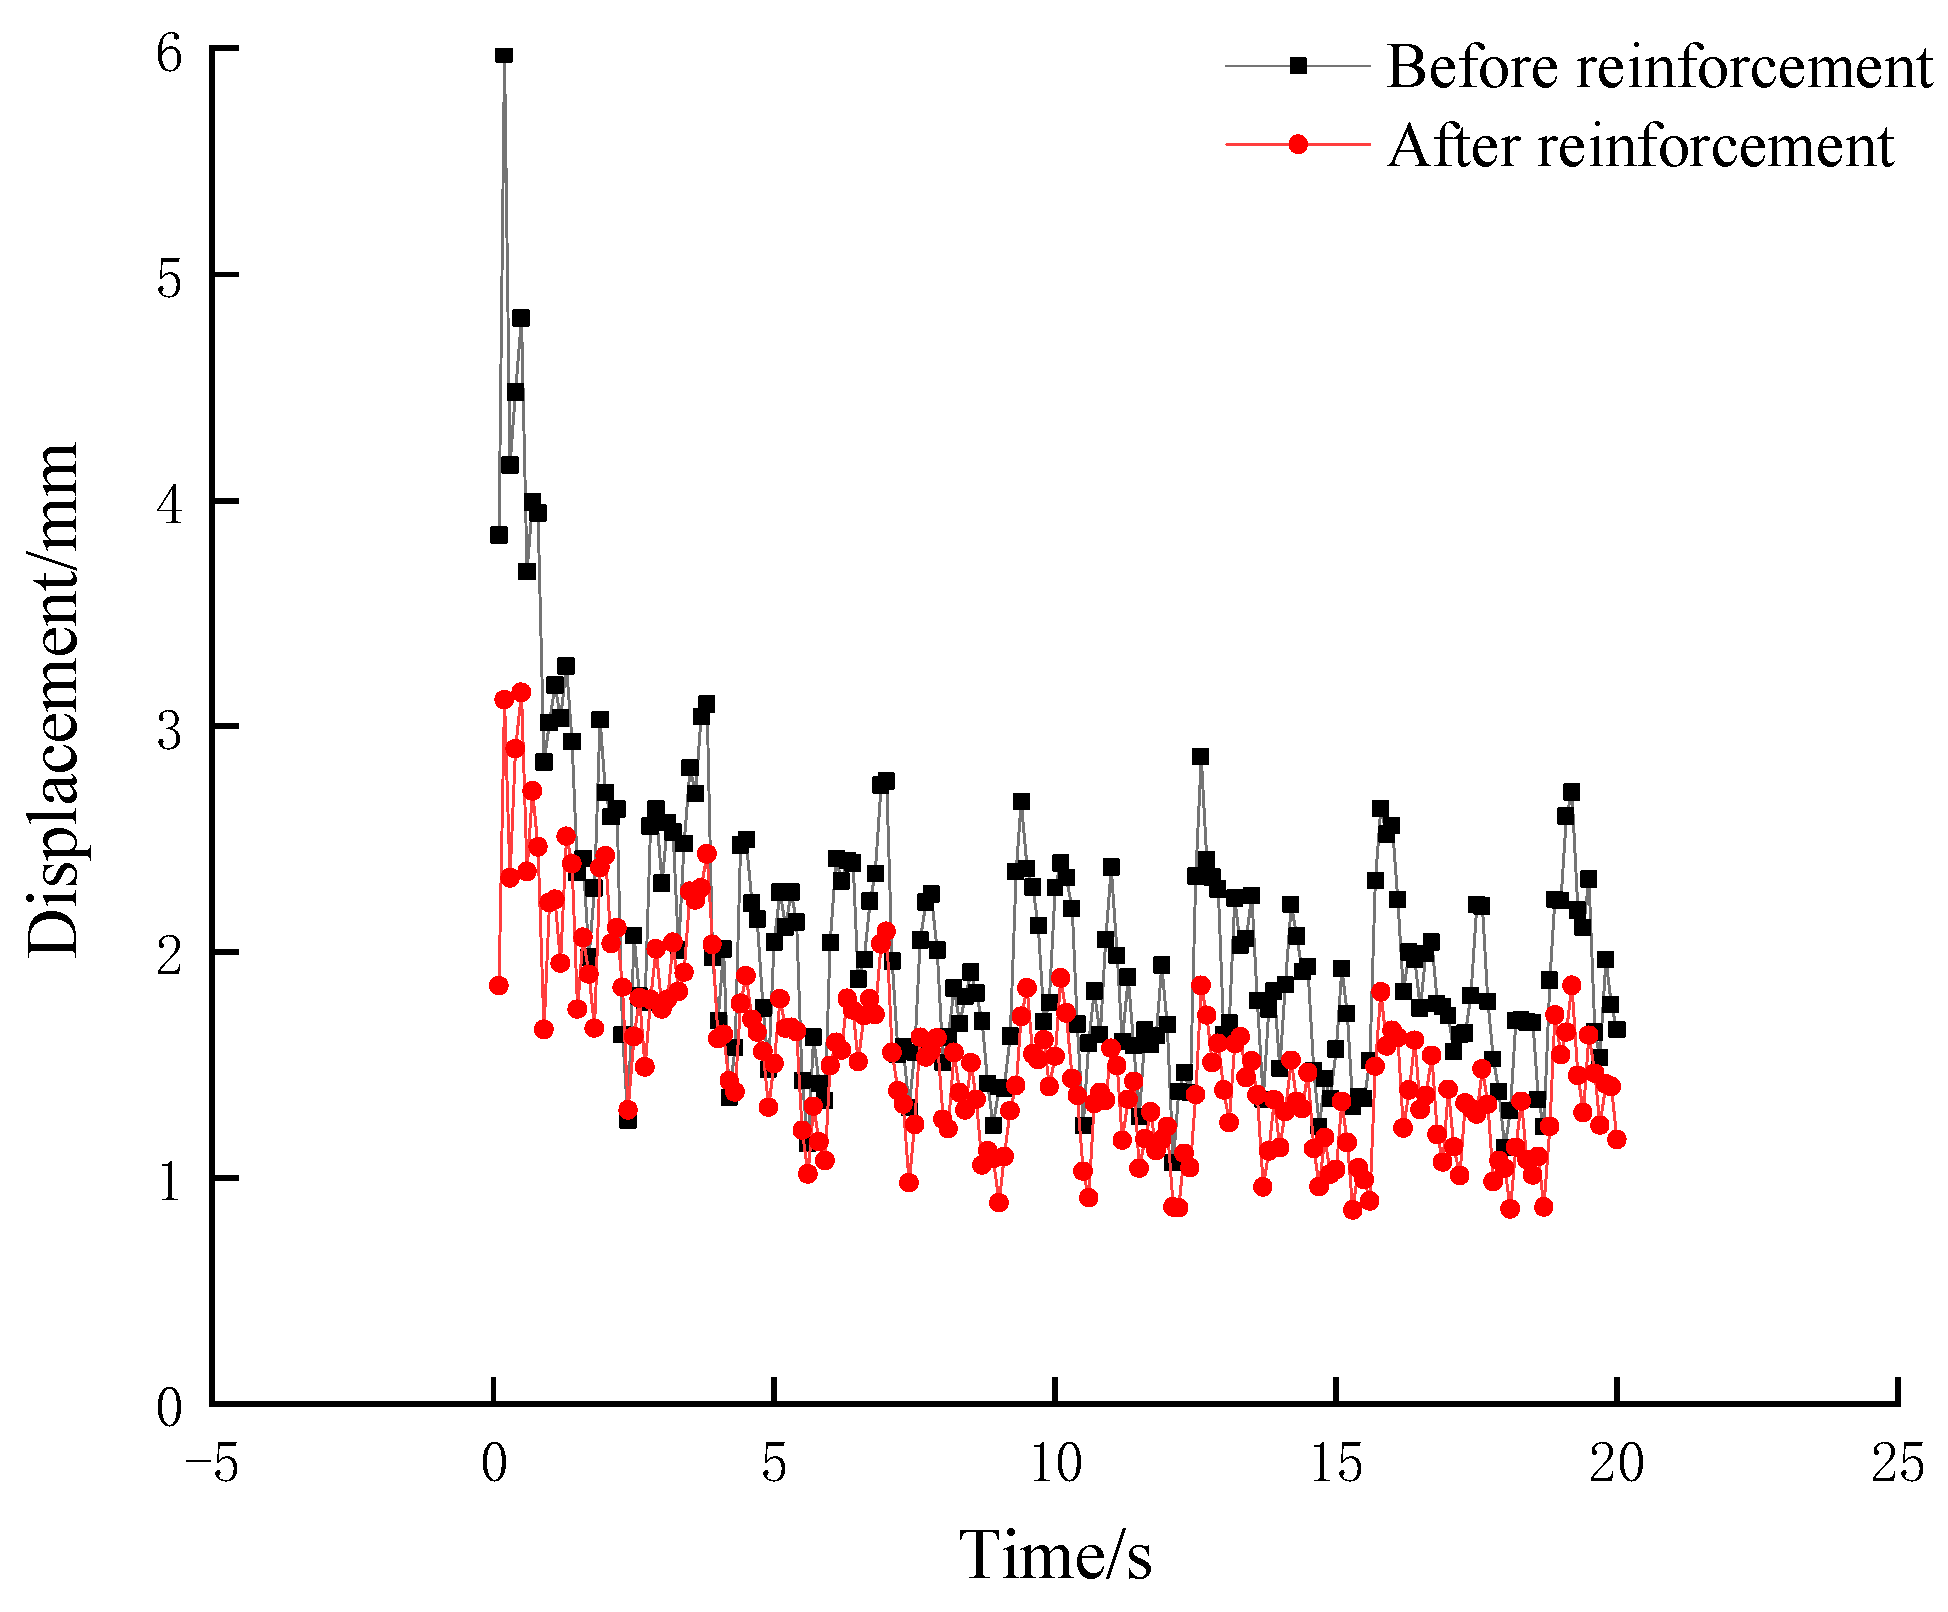
Under the 0° wind direction, the displacement responses of the array-scale model before and after reinforcement were compared. The results show that the maximum displacement of the first-row support decreased from 5.9738 mm to 3.9377 mm after reinforcement. The reduction was approximately 34.1%. In addition, the displacement fluctuation amplitude decreased significantly after reinforcement, indicating that the structural response became more stable.
As shown in
Figure 13, the array-scale results demonstrate that the proposed internal auxiliary reinforcement method can effectively improve the wind-resistant performance of photovoltaic supports at the engineering scale. The method reduces the maximum displacement and suppresses displacement fluctuation without replacing the original purlins, extensively dismantling photovoltaic modules, or changing the original load-bearing system.
It should be emphasized that the single-support model and the array-scale model have different boundary ranges, wind-exposed areas, and structural constraint relationships. Therefore, maximum displacement values obtained from different model scales should not be directly compared. However, within the same array-scale model, the comparison between the original and reinforced structures clearly indicates the effectiveness of the proposed reinforcement scheme.
The displacement statistics of the photovoltaic support before and after reinforcement are summarized in
Table 5. The results show that the proposed internal auxiliary reinforcement method significantly improved the structural response under fluctuating wind loads. Before reinforcement, the maximum displacement of the support reached 5.9738 mm, while the mean displacement and standard deviation were 2.06634 mm and 0.67506 mm, respectively. After reinforcement, the maximum displacement decreased to 3.9377 mm, corresponding to a reduction of approximately 34.1%. Meanwhile, the mean displacement decreased from 2.06634 mm to 1.51763 mm, and the standard deviation decreased from 0.67506 mm to 0.42256 mm.
The reduction in maximum displacement indicates that the internal auxiliary reinforcement member effectively improved the local stiffness and overall wind-resistant performance of the photovoltaic support. In addition, the decrease in standard deviation suggests that the fluctuation amplitude of the structural response became smaller after reinforcement, indicating a more stable dynamic response under fluctuating wind loads. These results demonstrate that the proposed reinforcement method can not only reduce the peak deformation of the support but also suppress the displacement fluctuation caused by wind-induced vibration.
3.5.6. Stress Distribution and Effect of Reinforcement
To evaluate the effectiveness of the proposed in situ reinforcement strategy, the stress distribution of the photovoltaic support array under the most unfavorable wind direction (0°) was analyzed. Comparisons were made between the original unreinforced configuration and the array reinforced with internal auxiliary members.
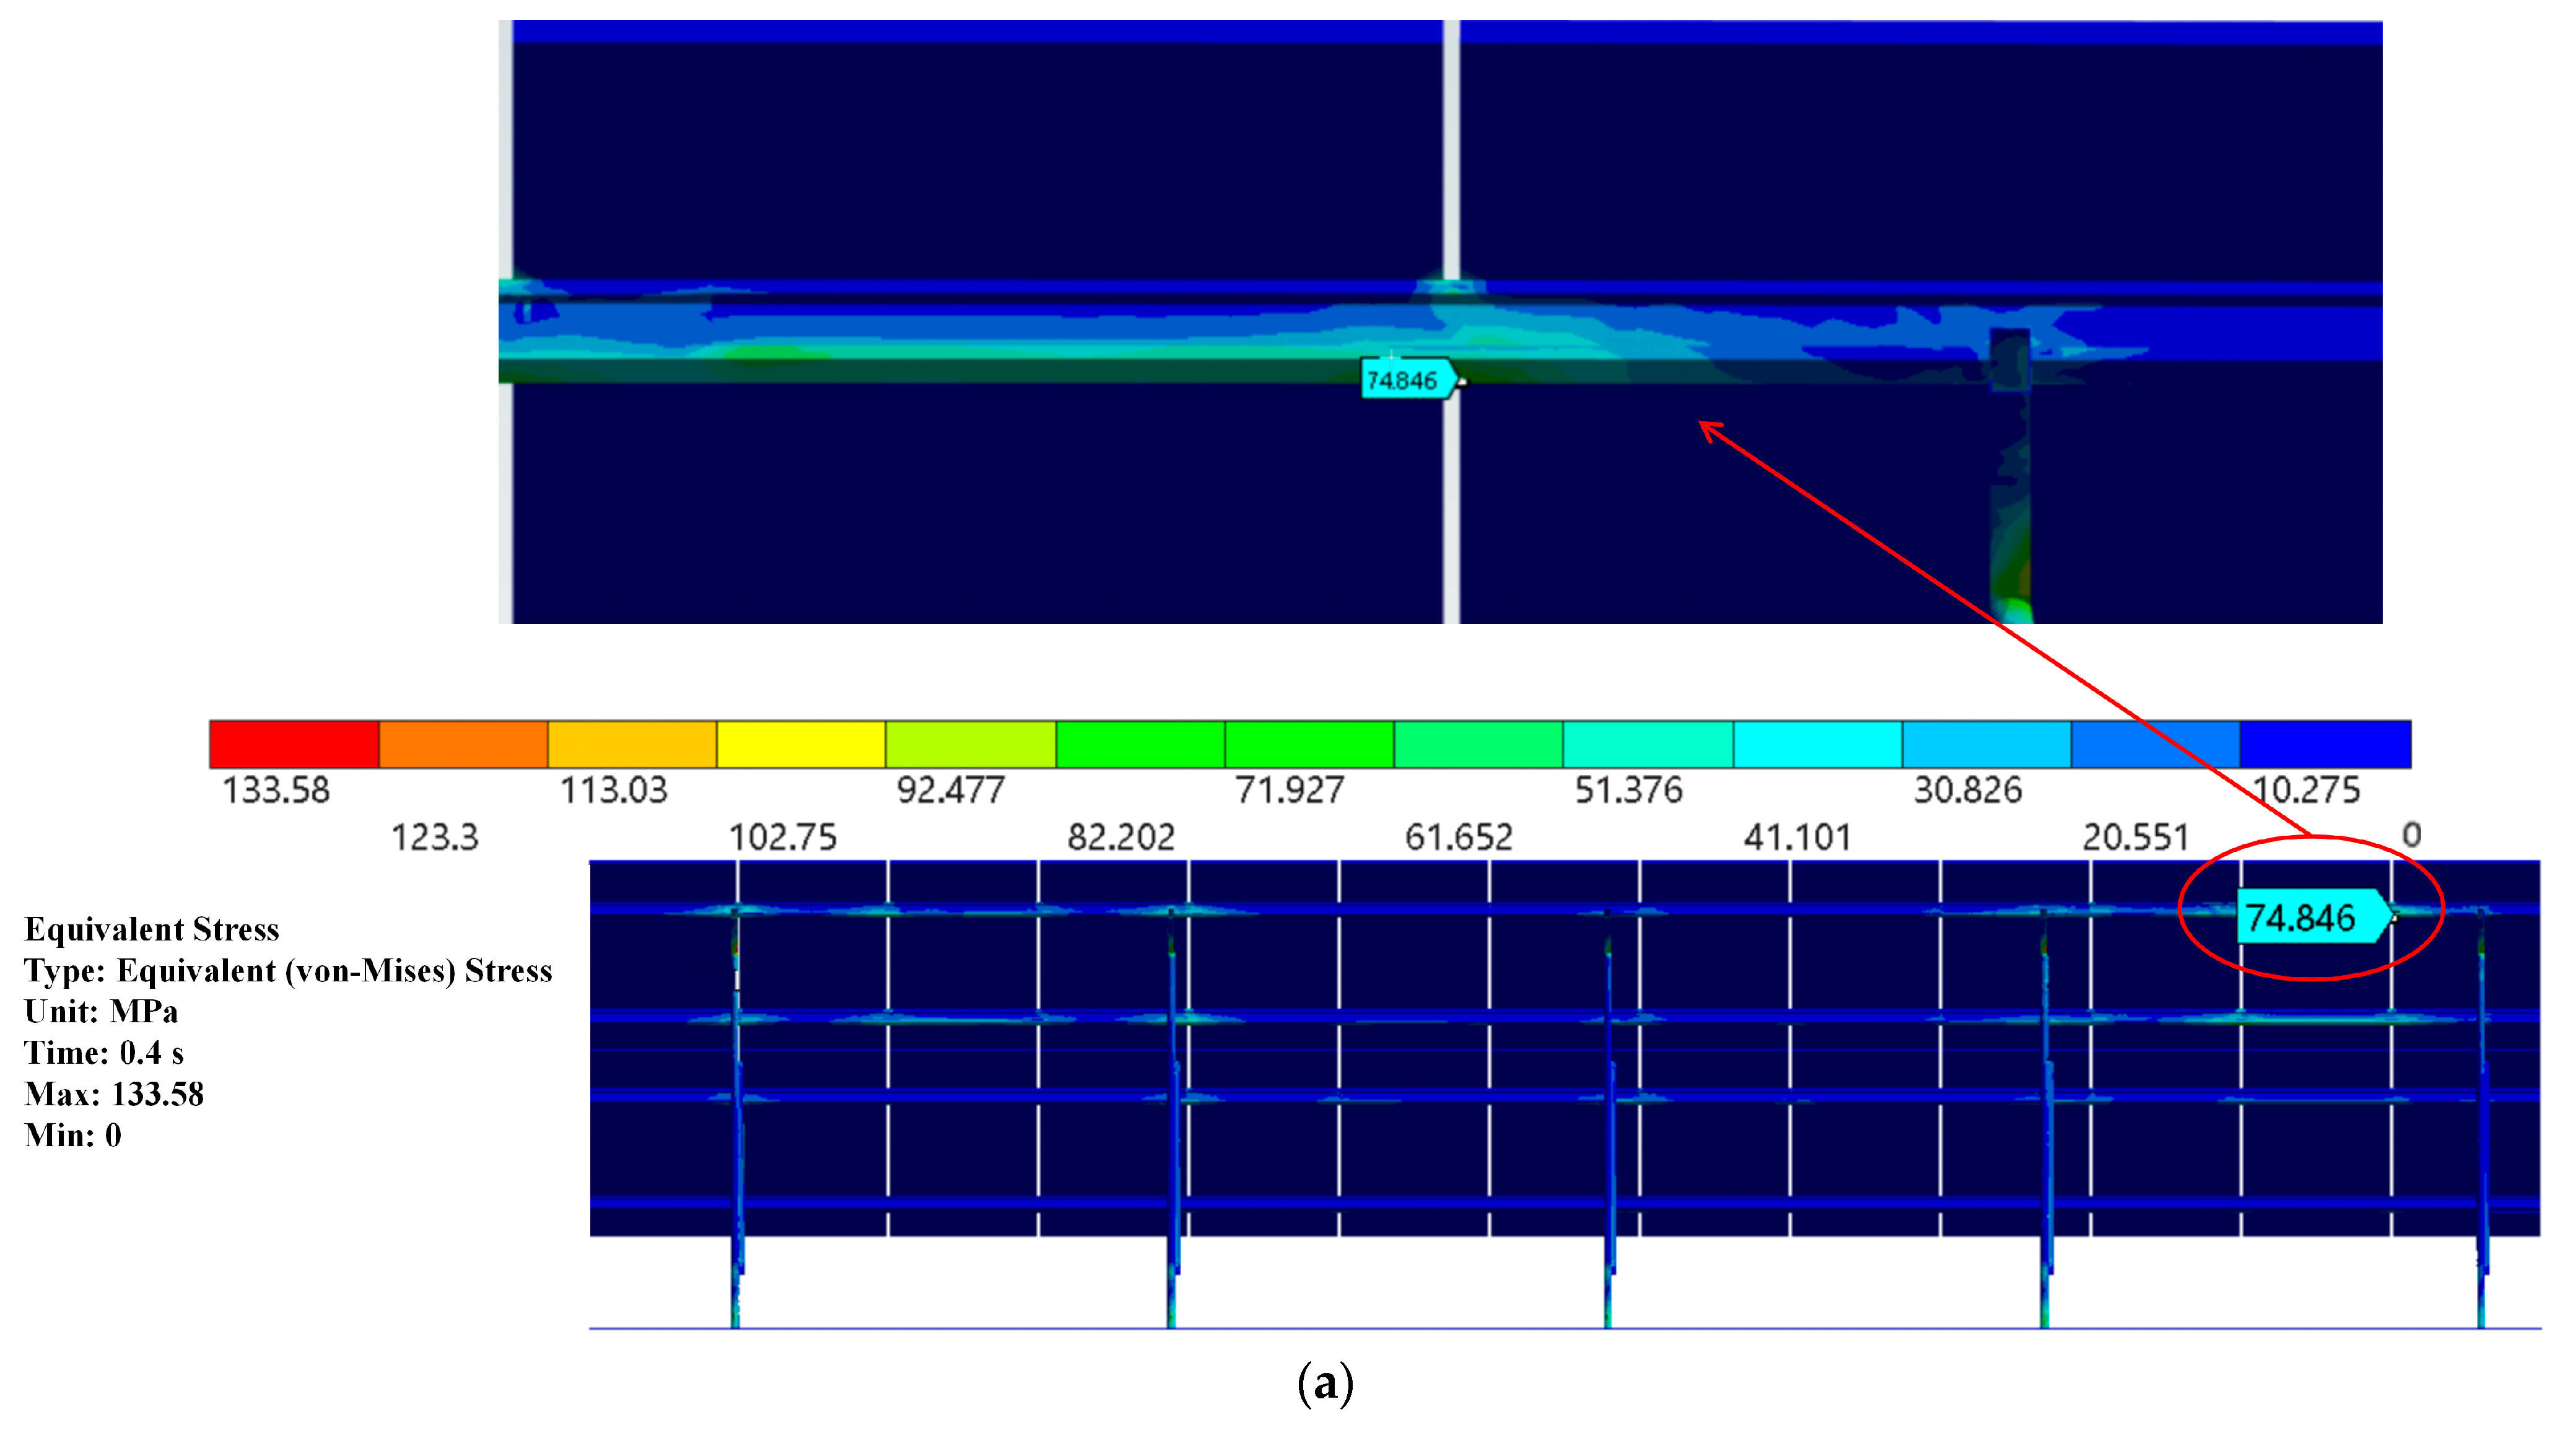
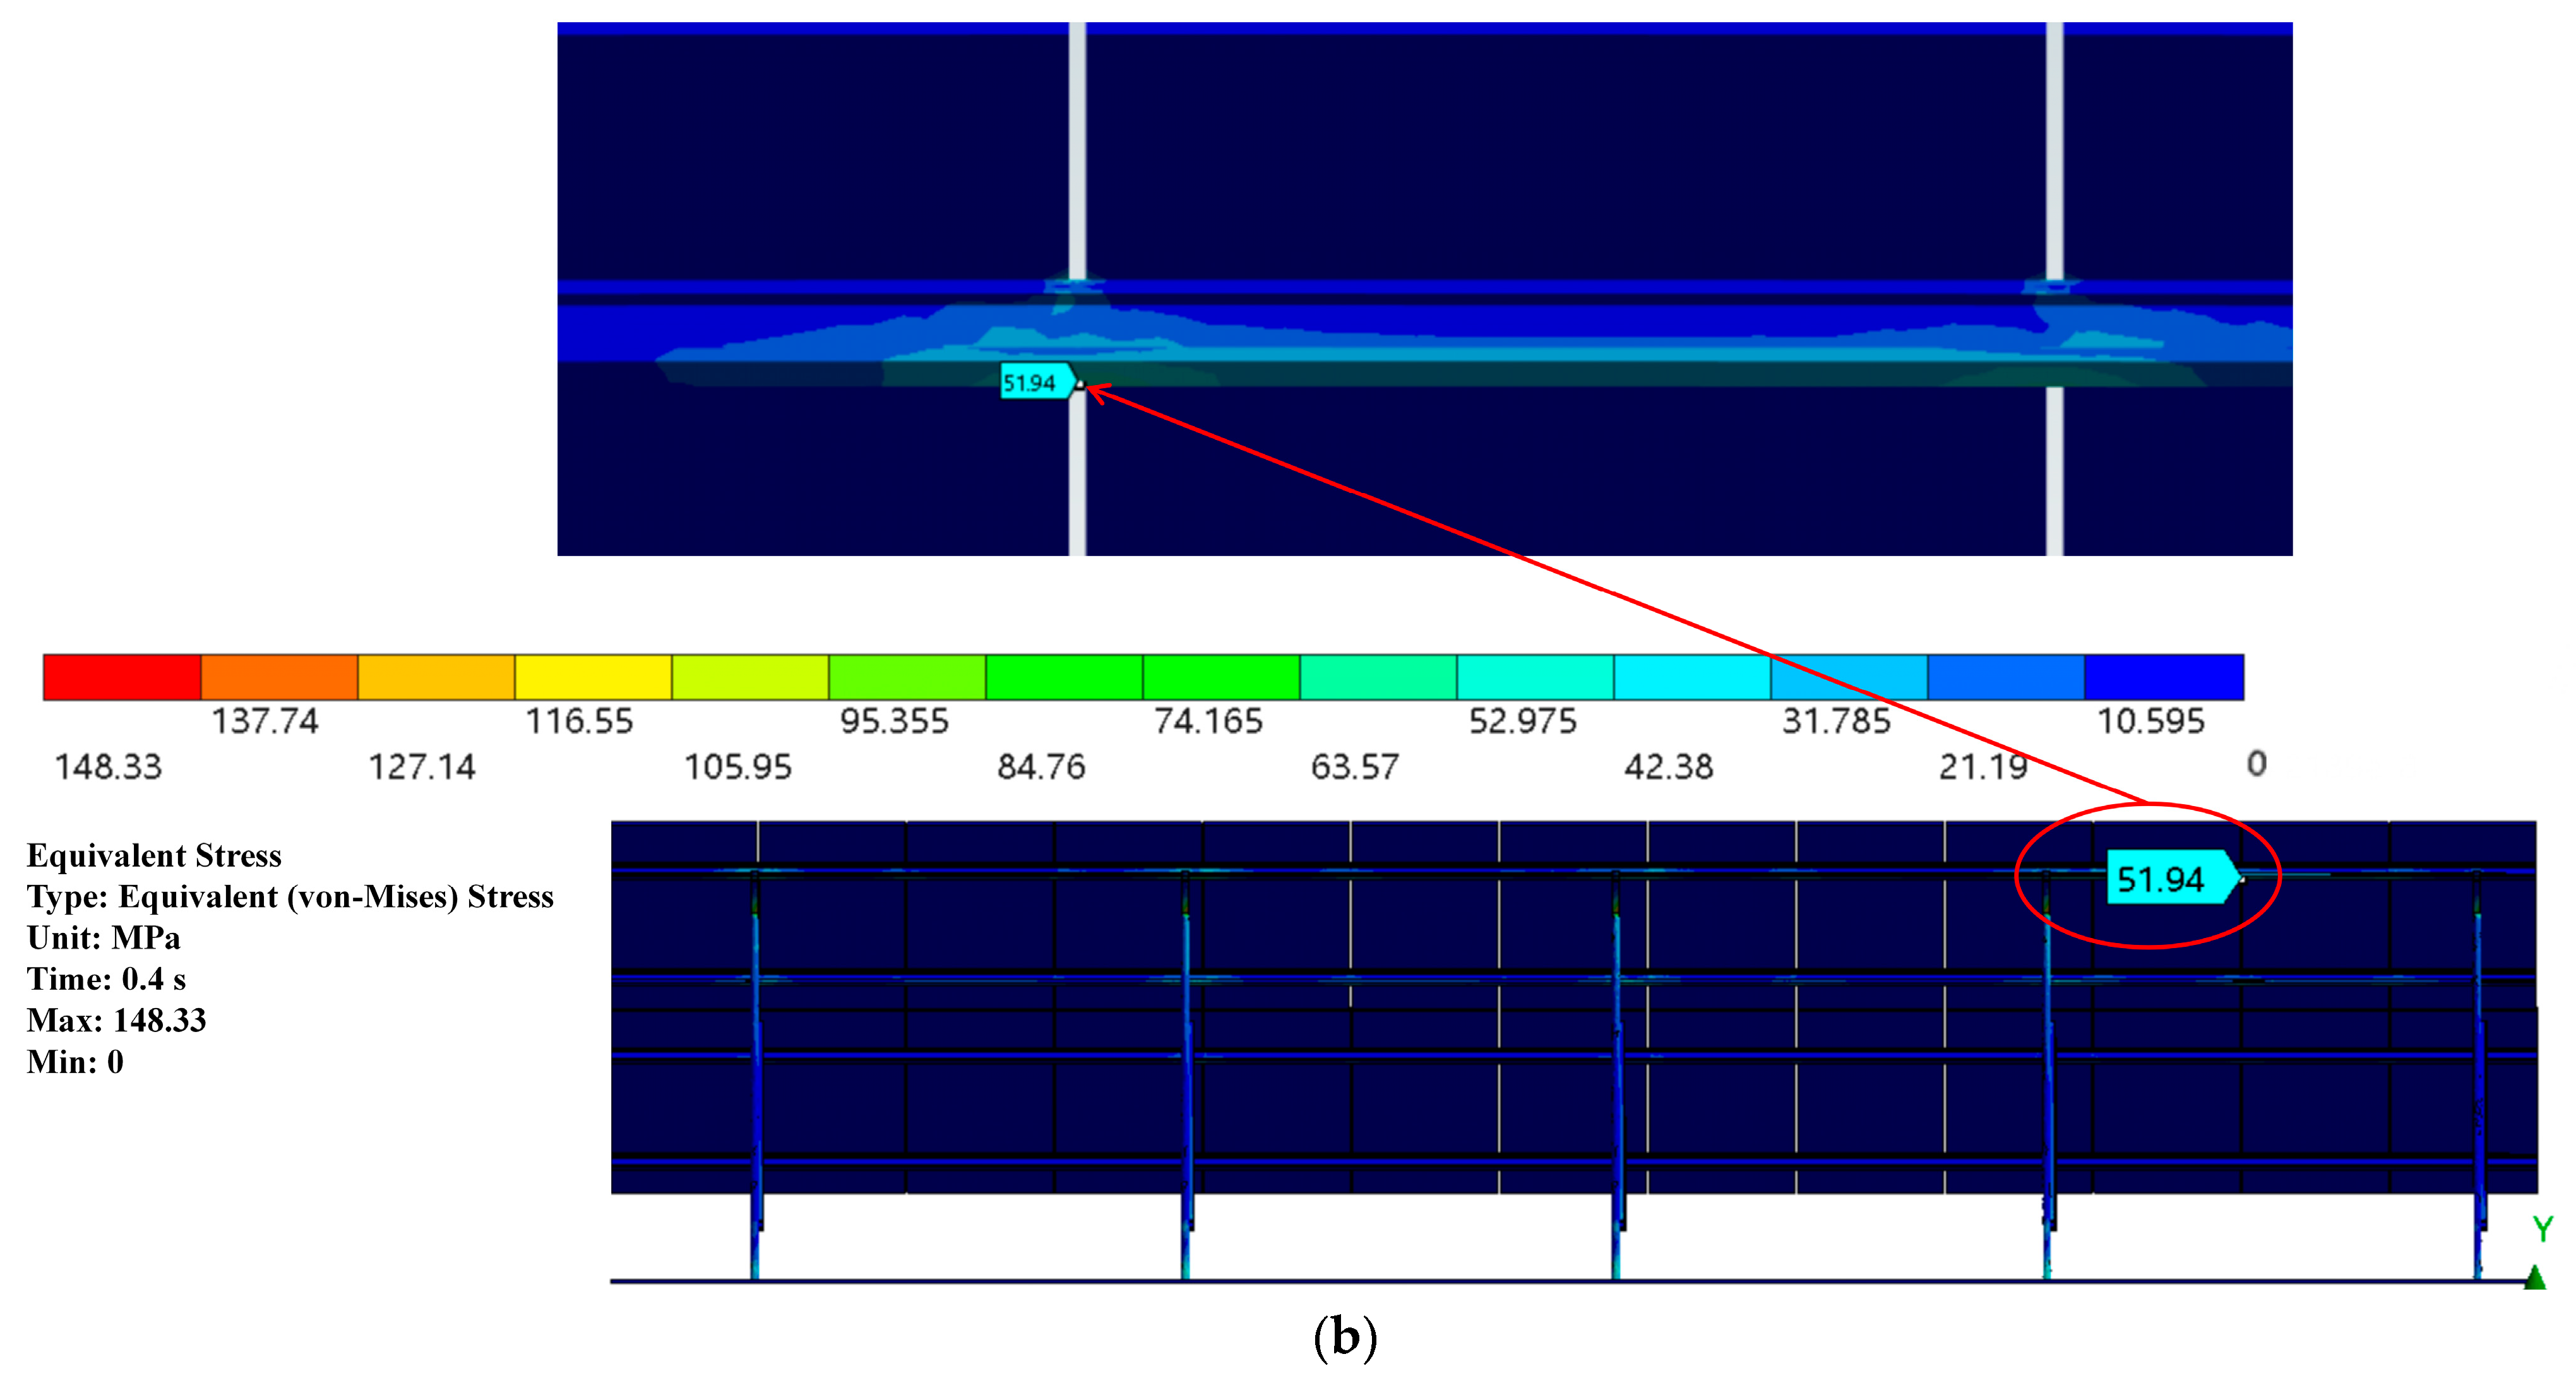
Figure 14 presents the von Mises stress contours for both configurations. In the unreinforced array, the stress was observed at the mid-span of the central purlins, reaching 74.846 MPa, while significant stress concentrations were also noted near the purlin–beam connection regions. After reinforcement, the stress at the mid-span decreased to 51.94 MPa, corresponding to a reduction of approximately 30.6%.
The observed reduction in stress is primarily attributed to the increase in local bending stiffness provided by the internal reinforcement members. By acting in conjunction with the original purlins, the reinforced sections form a composite load-bearing unit that distributes wind-induced loads more evenly along the array, thereby mitigating peak stress concentrations. This effect is most pronounced at the mid-span and connection regions, which were identified as the most critical areas in the unreinforced array.
The stress comparison confirms that the proposed in situ reinforcement method effectively reduces local stress concentrations and enhances the structural resilience of existing ground-mounted photovoltaic supports, providing a practical solution for low-disturbance strengthening of operational arrays.
3.6. Modal Analysis of Photovoltaic Modules
Modal analysis is employed to identify the modal parameters of a system, which serve as the foundation for vibration characteristic evaluation, fault diagnosis and prognosis, and the optimization of structural dynamic behavior. Therefore, prior to analyzing the wind-induced vibration characteristics of photovoltaic modules, a modal analysis should be conducted [
37].
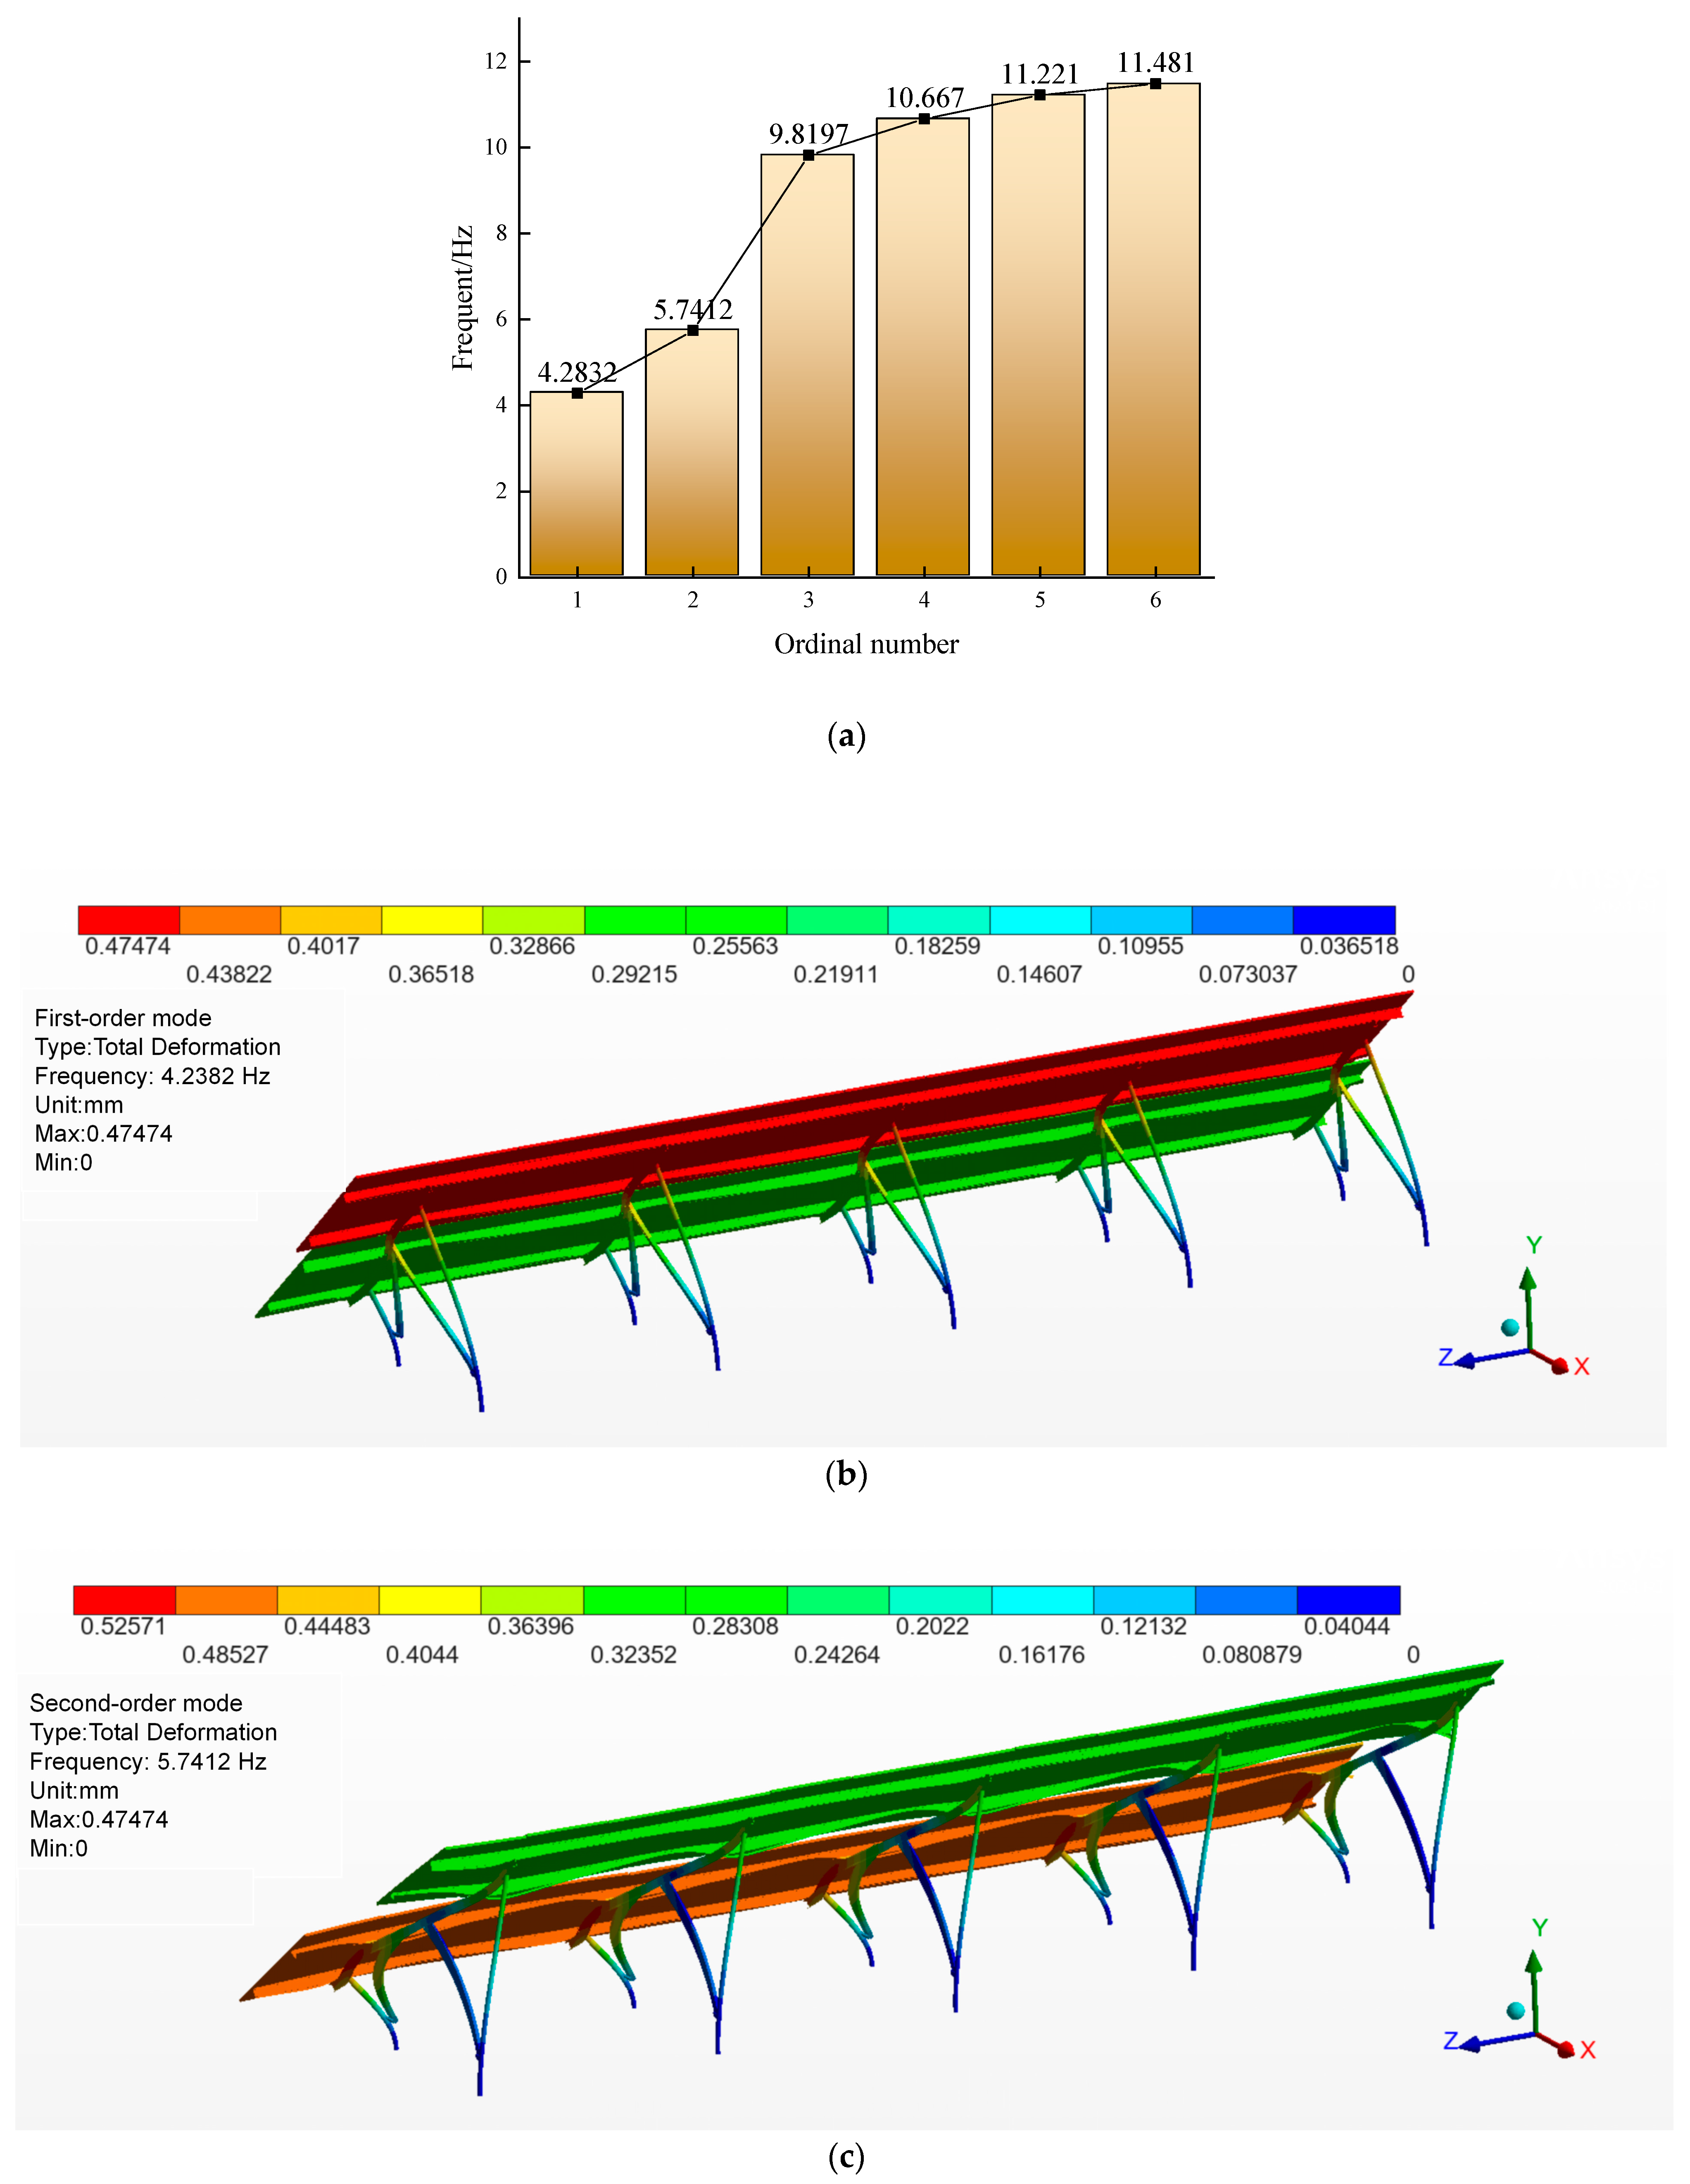
As shown in
Figure 15, the modal frequencies increase gradually, with no obvious discontinuities between modes, reflecting a transition of the support structure from global motion to local deformation. The first mode of the photovoltaic array support corresponds to a longitudinal bending mode, while the second mode represents a higher-order bending mode. Modal analysis primarily focuses on the lower-order modes [
38], as the first-order mode represents the main vibration pattern and frequency of the structure. Typically, the wind-induced vibration response of large-span flat-top structures is dominated by the first-order mode. The first six modes are concentrated in the low-frequency range of 4.2382 Hz to 11.481 Hz, indicating that the dynamic characteristics of the photovoltaic array structure are complex and that it has a relatively uniform stiffness distribution.
4. Discussion
The present study extends existing research on wind-resistant photovoltaic (PV) support structures by focusing on the reinforcement of existing in-service systems rather than the optimization of newly designed supports. Previous studies have mainly investigated wind-pressure characteristics, aerodynamic behavior, and structural optimization during the design stage of PV support systems. Although these studies improved the understanding of wind-induced responses, practical reinforcement strategies for aging or already-installed PV supports remain relatively limited.
The results demonstrate that wind direction plays a critical role in determining the structural response of ground-mounted PV supports. Among the investigated cases, the 0° wind direction produced the largest displacement and stress concentration because the airflow directly impinged on the module surface, generating the greatest pressure difference between the windward and leeward sides. This finding is consistent with previous aerodynamic studies that reported higher wind loads under normal wind incidence. However, the present work further identifies how these aerodynamic effects are transferred through the structural system and reveals that the purlins and their connection regions are the primary weak components governing the overall wind-induced response.
A significant scientific contribution of this study is the identification of purlins as the dominant vulnerability in existing PV support systems under fluctuating wind loads. While previous research often focused on global support behavior or module-level wind effects, the present study demonstrates that local stiffness deficiencies in purlins can control the overall structural deformation. This finding provides a more targeted basis for reinforcement design and suggests that improving local purlin stiffness may be more efficient than implementing large-scale modifications to the entire support structure.
Another important contribution is the development of a low-disturbance in situ reinforcement strategy. Conventional reinforcement methods generally require the removal of PV modules, replacement of structural members, or significant interruption of power generation. In contrast, the proposed reinforcement method increases the stiffness of the existing purlins by inserting internal auxiliary members without dismantling modules or altering the original load-transfer system. This approach not only improves structural performance but also minimizes construction complexity and operational downtime, making it particularly suitable for large-scale PV power stations already in service.
The reinforcement parameter analysis further shows that increasing reinforcement thickness does not lead to proportional improvements in structural performance. When the reinforcement thickness increased beyond 2.5 mm, the reduction in displacement became marginal. This observation indicates the existence of a stiffness-efficiency threshold and highlights the importance of balancing structural improvement with material consumption. Therefore, the selected 2.5 mm reinforcement configuration provides an optimal compromise between performance enhancement and economic efficiency.
From an engineering perspective, the array-scale verification confirms that the proposed reinforcement method remains effective when applied to practical PV support systems. The observed reduction in maximum displacement demonstrates that local purlin strengthening can significantly improve the global wind-resistant behavior of the support structure. These findings provide a feasible retrofit solution for existing ground-mounted PV installations located in regions exposed to strong winds.
Nevertheless, several limitations should be acknowledged. The numerical model adopted a uniform wind profile, rigid connection assumptions, and one-way fluid–structure interaction. Although these simplifications are acceptable for comparative analysis and reinforcement evaluation, they may influence the absolute values of displacement and stress. Future studies should incorporate atmospheric boundary-layer wind profiles, semi-rigid joint behavior, and two-way fluid–structure interaction to further improve prediction accuracy. In addition, experimental validation through wind tunnel testing or full-scale field monitoring would provide further verification of the proposed reinforcement method.
Overall, the primary scientific contribution of this study lies in establishing a complete framework that integrates fluctuating wind-field simulation, weak-component identification, and low-disturbance reinforcement design for existing photovoltaic support structures. The proposed methodology not only improves understanding of wind-induced structural vulnerability but also provides a practical reinforcement solution that can be directly applied to operating photovoltaic power stations.
5. Conclusions
This study investigated the wind-induced response and reinforcement strategy of an existing ground-mounted photovoltaic support in Yuli County, Xinjiang, China. A fluctuating wind model based on the Davenport spectrum was established, and a one-way fluid–structure interaction method was used to analyze the wind pressure distribution, displacement response, and weak regions of the support under different wind direction angles. The following conclusions can be drawn:
First, wind direction has a strong influence on the aerodynamic and structural responses of the photovoltaic support. The 0° wind direction is the most unfavorable condition, producing the largest displacement response and more significant pressure concentration than the 30°, 45°, and 90° wind directions.
Second, the purlins and their connection regions are identified as the primary weak components under fluctuating wind loads. The maximum displacement and stress concentration are mainly distributed in these regions, indicating that local stiffness improvement of the purlins is an effective reinforcement target.
Third, an innovative in situ non-destructive reinforcement method is proposed by installing internal auxiliary members inside the original purlins. This method does not require dismantling photovoltaic modules, purlins, or any existing support components, nor does it modify the original load-transfer system.
Fourth, the 2.5 mm-thick internal auxiliary reinforcement member provides an effective reinforcement scheme. Array-scale simulation shows that the maximum displacement decreases from 5.9738 mm to 3.9377 mm after reinforcement, with a reduction of approximately 34.1%. Therefore, the proposed method can effectively improve wind-resistant stability and provide a practical reference for the reinforcement design of existing photovoltaic support structures.