Article

Adsorption of Pharmaceutical Formulations onto Non-Conventional Biocarbons

1
Department of Pharmacology, University of the Basque Country EHU, 48080 Bilbao, Spain
2
Department of Chemical Engineering, University of the Basque Country EHU, 48080 Bilbao, Spain
3
Department of Chemistry, School of Sciences, University of Navarra, 31008 Pamplona, Spain
4
BIOMA Institute, University of Navarra, 31008 Pamplona, Spain
*
Author to whom correspondence should be addressed.
Appl. Sci. 2026, 16(14), 7157; https://doi.org/10.3390/app16147157
Submission received: 14 May 2026 / Revised: 1 July 2026 / Accepted: 13 July 2026 / Published: 16 July 2026
(This article belongs to the Special Issue Advanced Research in Activated Carbon Adsorption—2nd Edition)

Abstract

This study investigated the adsorption of pharmaceutical formulations (aspirin, enantyum, ibuprofen, metamizol, nolotil, paracetamol, and termalgin) and simultaneous binary mixtures of them onto activated carbons derived from olive stone (OSPC) and pine nut shell (PNSPC). Both biocarbons exhibited superior properties without prior washing, exhibiting the highest adsorption capacity (45 mg/g) with 1.0 g OSPC/L and 50 mg ENA/L at pH 2. FTIR analysis identified oxygenated and phosphate-related surface groups in both carbons, with OSPC exhibiting stronger functionalization, and revealed minimal differences in adsorption between commercial formulations and pure active ingredients. Raman spectroscopy showed small increases in the ID/IG ratio after adsorption, attributed to slight increases in defect density, without significantly altering the carbon structure. SEM analysis revealed that OSPC exhibited a more heterogeneous and porous structure than PNSPC, consistent with its larger BET surface area. The presence of surface phosphate groups was detected using XRD, and they were found to be more pronounced in OSPC; this was attributed to the fact that the adsorbents were not washed beforehand. Finally, OSPC was used to adsorb each of the six drugs independently in 14–15 consecutive cycles, with removal efficiency exceeding 85%; thus, its use could be considered in the treatment of wastewater containing the drugs from this study, in line with the circular economy, which aims to achieve zero waste.

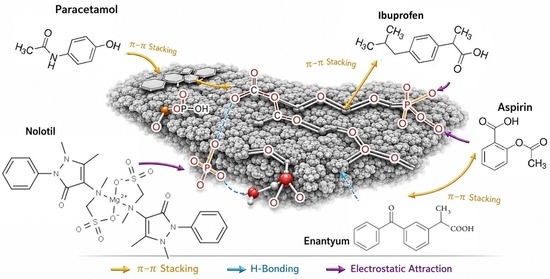
Graphical Abstract

1. Introduction

Pharmaceuticals are essential for improving human and animal health. The primary route of drug elimination is through the kidneys, and drugs can also be excreted in their original and/or modified form (metabolites) [1]. These compounds—which are recognized as emerging pollutants and enter aquatic environments largely via human and animal excretion, improper disposal of unused or expired medications, and the discharge of untreated or inadequately treated effluents from hospitals, pharmaceutical manufacturing plants, and municipal wastewater treatment facilities [2,3]—can have adverse effects on the environment, impacting ecosystems and, in the long term, potentially human health [2,4,5,6]. Wastewater treatment plants cannot filter out all pharmaceutical substances present, so even after treatment, water may contain pharmaceuticals that are released into the environment [7].
Among the vast array of pharmaceuticals, non-steroidal anti-inflammatory drugs (NSAIDs) as well as analgesics and antipyretics are particularly problematic, representing some of the most widely consumed medicinal compounds globally [2,3,4]. This includes drugs such as ibuprofen (IBP), naproxen (NPX), acetylsalicylic acid (ASA; often referred to as aspirin), ketoprofen (KTP), and paracetamol (PCT; also known as acetaminophen). The annual global consumption of NSAIDs alone is measured in thousands of tons, necessitating effective remediation strategies [2]. Once in the environment, these compounds exhibit unique physicochemical properties, including hydrophilicity, high water solubility, and high stability, allowing them to remain in the aqueous phase for extended periods [2,5]. This inherent resistance to degradation means that conventional wastewater treatment processes are often inefficient at completely removing these compounds [4,6]. Consequently, NSAIDs and analgesics/antipyretics are frequently detected in various environmental compartments worldwide, spanning surface waters, groundwater, tap water, wastewater, and even sediments [2,4,5,6,7,8,9,10,11]. Concentrations vary widely depending on the location, ranging from nanograms per liter (ng/L) to micrograms per liter (μg/L).
While various methods have been explored for removing pharmaceuticals from wastewater, including photocatalytic degradation, microextraction, oxidation, biodegradation, chlorination, biofiltration, electrocoagulation–flotation, electrochemical oxidation, and membrane separation processes like nanofiltration and reverse osmosis, adsorption technology stands out as a highly attractive and widely utilized approach [2,4,5,6,9,10,11,12]. Adsorption is commonly characterized by high efficiency, simple design and operation, cost-effectiveness, environmental friendliness, absence of hazardous byproduct formation, and adsorbent reusability [2,4,8,9,11,12]. The adsorption process involves the accumulation of pollutants (adsorbates) from water onto the surface of a solid material (adsorbent) through various physical and chemical interactions. Among the diverse range of adsorbents, carbonaceous materials are particularly prominent and have demonstrated exceptional performance in removing NSAIDs and analgesics/antipyretics [2,4,8,9,10,12]. Activated carbons (ACs) are the most conventional and extensively studied carbonaceous adsorbents in wastewater treatment due to their high porosity, large specific surface area (typically 500–3000 m2/g), high uptake capacity, and chemical stability [2,8], and they are capable of removing a wide range of organic pollutants, including pharmaceutical compounds. IBP and NPX have demonstrated maximum adsorption capacities on AC of up to 417 and 290 mg/g, respectively [6], and for PCT, granular AC has shown uptake capacities up to 579 mg/g [12]. While effective, commercial AC can be costly, prompting research into alternative, low-cost precursors like agricultural waste [3,4,8,12,13]. For instance, a granular AC from babassu coconut mesocarp has been explored as a material for ASA adsorption, achieving a maximum uptake of 89.9 mg/g at pH 2 [14]. Similarly, an AC derived from Butia capitata with a microporous structure and a surface area of 820 m2/g, prepared through pyrolysis at 650 °C and ZnCl2 activation, yielded maximum adsorption capacities of 109 mg/g for KTP and 101 mg/g for PCT [15]. This AC exhibited a decrease in removal percentage of less than 2% over five cycles when using NaOH as an eluent. Another ZnCl2-activated AC was synthesized from Erythrina speciosa tree pods at 800 °C, with a surface area of 795 m2/g and a mean pore volume of 0.422 cm3/g, and showed maximum adsorption capacities of about 32 mg/g for IBP and 37 mg/g for PCT at pH 3 [16]. A further advancement in biomass-derived adsorbents is the use of super AC from sheep manure, chemically activated with ZnCl2, which achieved an exceptionally high surface area of 2170 m2/g and an outstanding maximum adsorption capacity of 7790 mg/g for NPX at pH 4, in line with the Langmuir isotherm model [17]. A study also investigated activated carbons prepared from plastic and agro-industrial wastes, such as PET, cork powder, and peach stones, through chemical activation with K2CO3 or physical activation with CO2 [18]. Another highly mesoporous AC carbon, derived from soybean curd wastes and prepared via two-step pyrolyzing coupled with KOH activation, showed an extremely large surface area (3306 m2/g), a high total pore volume (2.31 cm3/g), and a remarkable maximum adsorption capacity of 646 mg/g for PCT [19]. Furthermore, AC from Jacaranda mimosifolia, prepared by pyrolysis at 700 °C, presented a high surface area (928 m2/g) and pore volume (0.521 cm3/g), showing an optimal adsorption capacity of 304 mg/g for KTP at pH 2, with a decreasing removal rate of about 9.1% after five regeneration cycles with ethanol [20].
Biochar, a carbon-rich, porous material produced through the pyrolysis of biomass, has emerged as a sustainable and eco-friendly alternative to conventional activated carbons [3,4,8,10]. Its effectiveness is attributed to its unique properties, including a high density of micropores and mesopores, a large surface area, and an abundance of functional groups (e.g., –OH, –COOH, –NH2), which facilitate the trapping of dissolved pollutants and engagement in various interactions. Its preparation process, influenced by factors like pyrolysis temperature, significantly affects its surface area, pore size distribution, and surface functional groups, thereby impacting adsorption capacity [3,4]. For IBP, biochar adsorption capacities typically range from 9.69 to 309 mg/g [13]. Peanut shell biochar has shown promising results for NPX removal, with a maximum capacity of 324 mg/g [21], while spherical biochar from pomelo peel achieved a maximum PCT adsorption of 286 mg/g [3]. Biochar derived from Ginkgo biloba leaves, activated with KOH and urea through one-step carbonization at 700 °C, with a surface area of 1425 m2/g and a pore volume of 0.863 cm3/g, exhibited a high removal rate of 99.1% for IBP and a large adsorption capacity of 160 mg/g; this was maintained after five regeneration cycles with methanol [22]. Modified biochar derived from sewage sludge has also demonstrated high efficiency for NPX removal, with an adsorption capacity of 127 mg/g [23], while thermally activated biochars derived from yeast, cork, and coffee wastes reached dipyrone adsorption capacities at pH 6 of 30.9, 52.1, and 47.08 mg/g and corresponding efficiencies of 31%, 52%, and 47% [24]. On ash obtained by burning eucalyptus wood chip biomass at pH values ranging from 2 to 12, dipyrone achieved an adsorption capacity of 42 mg/g and an efficiency of 86% [25].
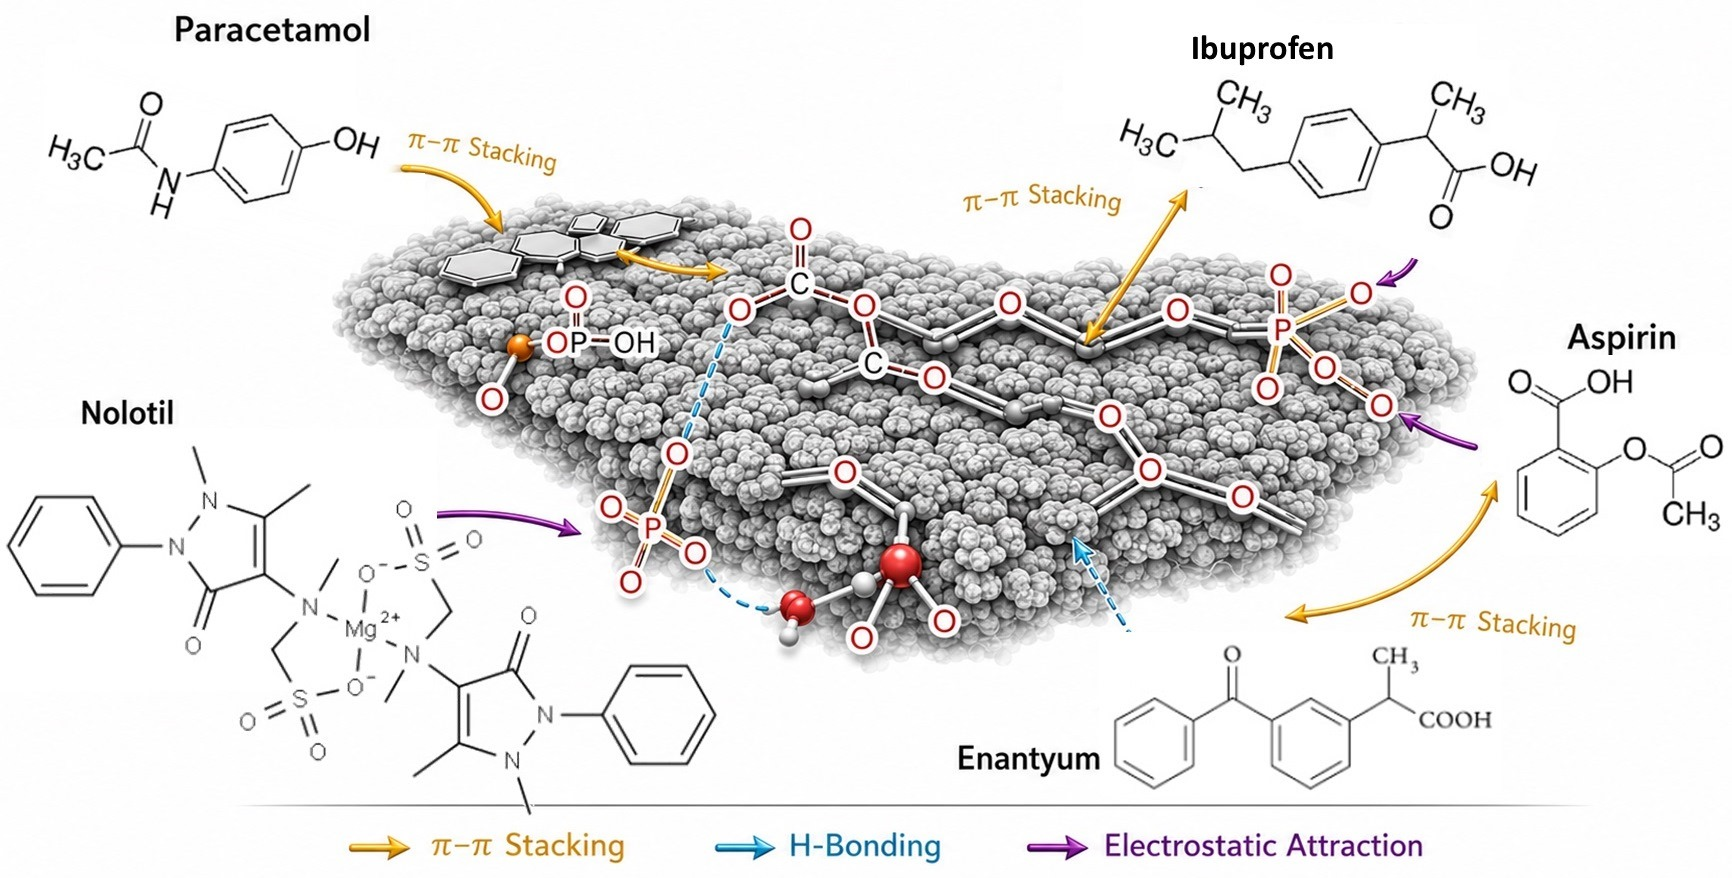
The mechanisms governing the adsorption of these pharmaceutical compounds onto adsorbents are complex and involve multiple interactions [3,5,8,9,10,11,12]. The key mechanisms include π-π interactions (π-π stacking between drug aromatic rings and graphitic surfaces of carbonaceous sorbents), hydrogen bonding (between drug H-donor/acceptor groups and functional groups on the sorbent surface), electrostatic interactions (through attraction/repulsion between charged species), hydrophobic interactions (between drugs’ non-polar parts and adsorbent hydrophobic regions), pore filling of micropores and mesopores through internal diffusion, and Van der Waals forces. These mechanisms can operate simultaneously, and their dominance depends on the properties of the adsorbent (surface area, pore size distribution, surface functional groups, and surface charge) and the adsorbate (molecular size, solubility, pKa, and hydrophobicity), as well as the experimental conditions (pH, initial concentration, contact time, and temperature).
Another crucial aspect is the reusability and regeneration of spent adsorbents [2,4,8,9,10,11,12]. The ability to regenerate adsorbents, typically through desorption using appropriate effluents, is vital for ensuring economic feasibility and sustainability, and the long-term stability and performance of regenerated materials require further investigation. Furthermore, the safe disposal of used adsorbents after they reach their saturation limit or can no longer be effectively regenerated is a pressing environmental concern, as improper disposal risks re-releasing pollutants into the environment, negating the purpose of the treatment [10].
On the other hand, the complexity of real wastewater matrices poses a significant challenge. Most studies are conducted in laboratory settings using model water spiked with single pollutants, which does not accurately reflect the diverse mixture of inorganic ions, natural organic matter, and other pharmaceutical compounds present in actual effluents [2,10,11]. Competitive adsorption between target pharmaceuticals and co-existing species can significantly reduce removal efficiencies [9,10]. For example, natural organic matter can cause pore blockage, and other pharmaceuticals can compete for active adsorption sites, impacting the uptake of the target molecule. The effect of ionic strength, which can weaken electrostatic interactions or cause adsorbent clustering, also requires further exploration in real-world scenarios [10,11].
Population increase and water quality deterioration, linked to the environmental problems caused by chemical substances in wastewater (including emerging contaminants that conventional treatment plants are unable to filter) prompted this study’s exploration of two unconventional adsorbents derived from lignocellulosic biomass waste—olive stones and pine nut shells—as green alternatives for pollutant adsorption, with reduced environmental impact and waste management costs. The relevance of this topic lies in the advancement of the circular economy by eliminating molecules of widely used pharmaceuticals, replacing expensive commercial activated carbons with low-cost, high-efficiency, zero-waste agro-industrial byproducts as bioadsorbents. The goal is to minimize the negative impact of pharmaceutical formulations that could be applied to improving irrigation water allowed for use in agriculture. Furthermore, equilibrium studies demonstrate that these biocarbons exhibit high adsorption capacities for certain contaminants due to their high chemical stability, which traps them within their porous matrices. This study presents innovative work on the removal of pharmaceuticals in their commercial forms—analgesics, antipyretics, and non-steroidal anti-inflammatory drugs—and the minimization of water consumption by using activated adsorbents without the need for washing at pH 2, thus contributing to compliance with the Royal Decree on Water Resources [26]. These biochars could be employed in wastewater treatment plant filters, primarily olive stone filters, with the final step being controlled combustion at high temperatures, preventing the release of polluting molecules back into the environment.

2. Materials and Methods

2.1. Materials

2.1.1. Pharmaceuticals

Six widely consumed pharmaceuticals were studied in this work, including the analgesic and antipyretic drugs paracetamol (acetaminophen), termalgin (acetaminophen plus codein), aspirin (acetylsalicylic acid), and nolotil (metamizol); the non-steroidal anti-inflammatory drug (NSAID) ibuprofen; and the analgesic, anti-inflammatory and antipyretic drug enantyum (dexketoprofen). Paracetamol and ibuprofen were purchased from Stada, Bad Vilbel, Germany; nolotil from Normon, Tres Cantos, Spain; enantyum from Menarini, Florencia, Italy; termalgin from Haleón, Weybridge, England; and aspirin from Bayer, Leverkusen, Germany. The drug formulations (commercial formats), including their active principles, properties and excipients, are shown in Table 1.

2.1.2. Calibration of Pharmaceuticals

The concentration of pharmaceuticals in the solutions was quantified by measuring absorbance using a UV-VIS Shimadzu UV-1280 spectrophotometer (Shimadzu, Kyoto, Japan). To determine the absorbance–concentration calibration of pharmaceuticals, several solutions with known concentrations of pharmaceuticals ranging from 1.5 to 50 mg/L were prepared. Once a concentration of zero was achieved with deionized water, a wavelength scan was conducted in the range of 190–1100 nm to determine the spectra and wavelengths corresponding to the highest absorbance peaks of the pharmaceuticals. The quantitative analysis of the binary mixtures of drugs by UV-vis spectrophotometry was performed according to the Vierordt method [27].
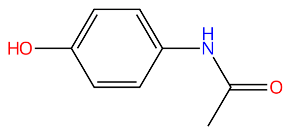
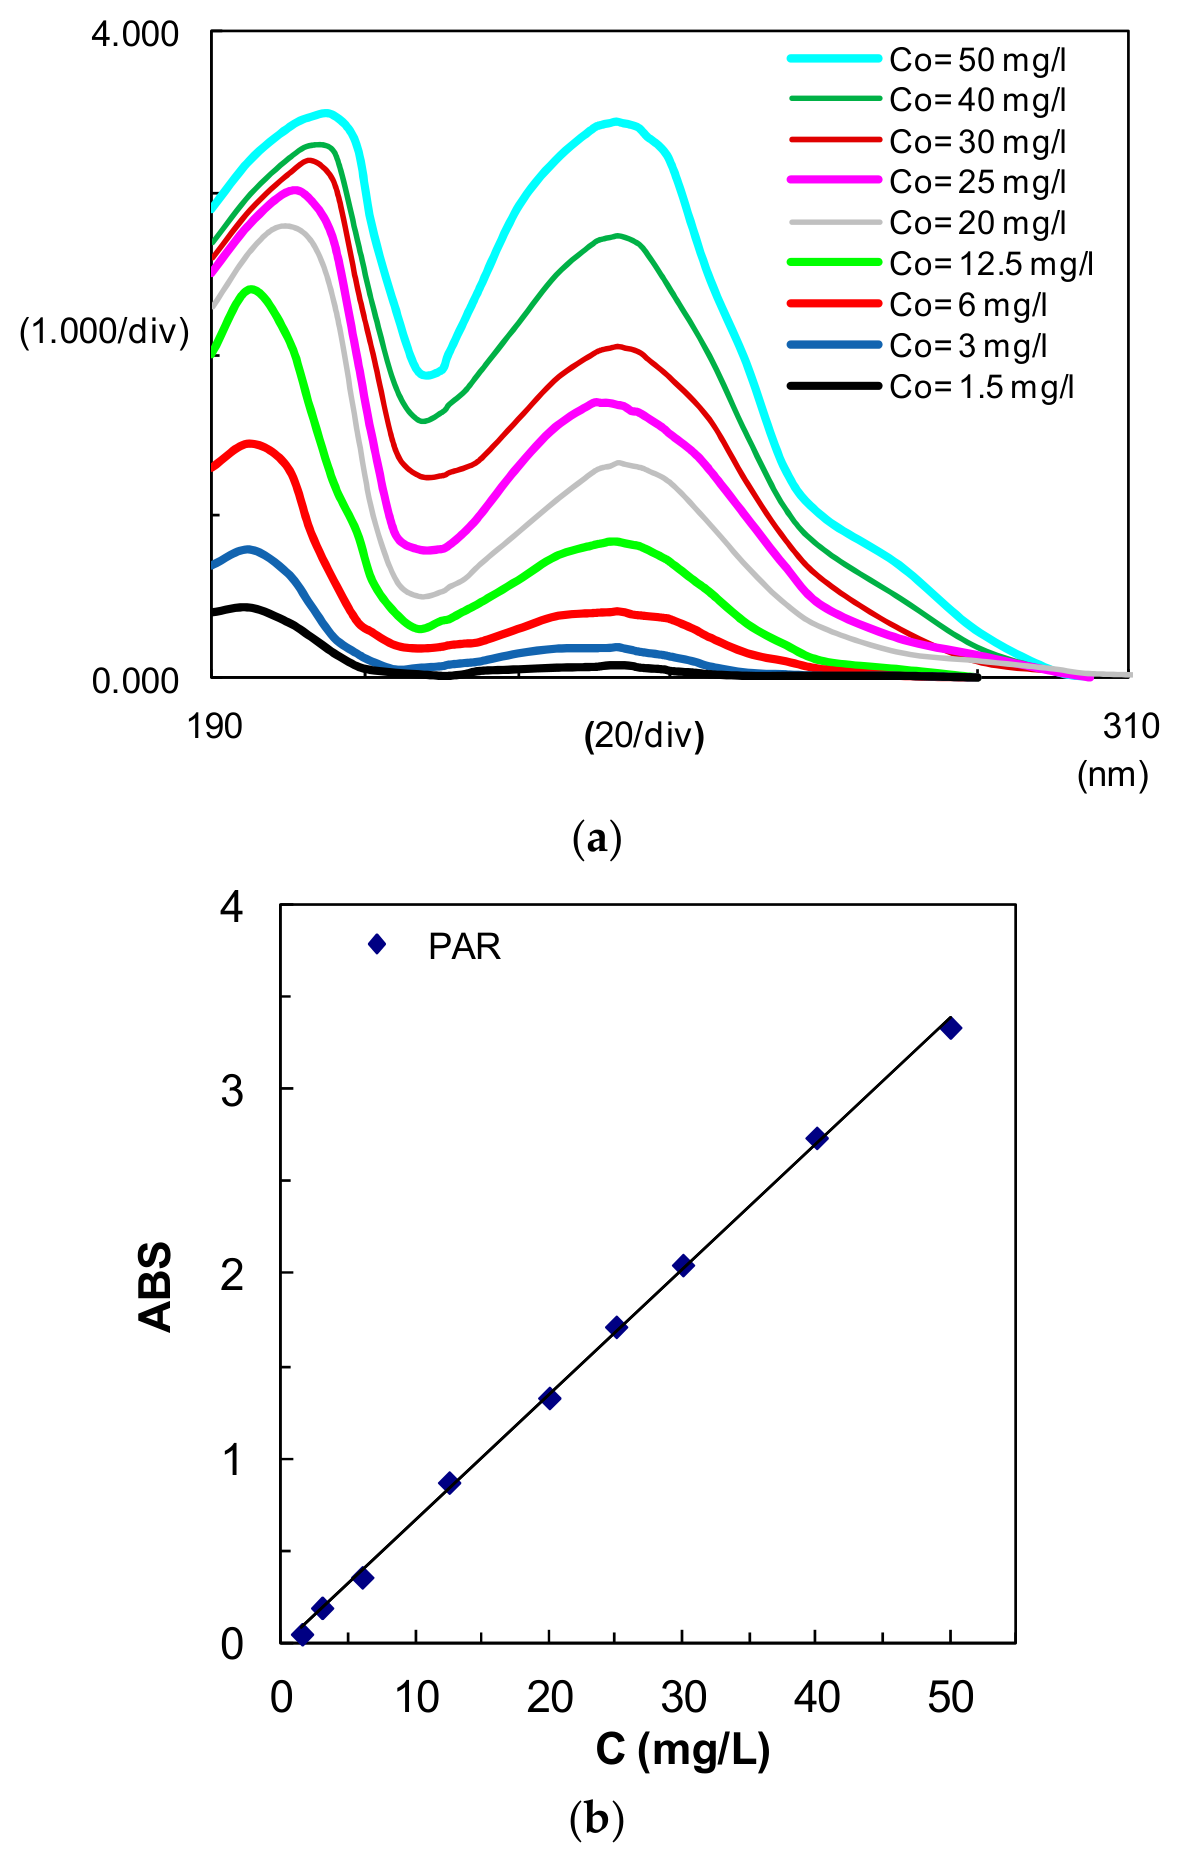
A spectrum of solution absorbance with different initial concentrations of paracetamol is depicted in Figure 1a within a wavelength range of 190–310 nm, as an example. Figure 1b illustrates the absorbance–concentration calibration line of paracetamol according to the linear Beer–Lambert relationship, where the goodness of fit of the experimental absorbance values (points) to a straight line exhibits a high coefficient of determination (R2 0.9992) and an RSS of 0.01. The maximum absorbance values corresponds to wavelengths of 243 nm for paracetamol, 222 nm for ibuprofen, 260 nm for nolotil, 240 nm for enantyum, 243 nm for termalgin, and 200 nm for aspirin. The main parameters describing the quality of the calibration curves are listed in the Supplementary Material (Table S1). Six replicates were carried out to determine the limits of detection (LODs) as three times the signal-to-noise ratio, and the limits of quantification (LOQs).

2.2. Adsorbent Preparation

The two adsorbents used for the adsorption process were prepared from lignocellulosic biomass waste (olive stones and pine nut shells) through thermochemical activation, Figure 2. The activation procedure was described in detail in a previous paper [28]. However, while in the previous paper, the adsorbent was washed with deionized water until pH 7 was reached [28], in this work, the samples were divided into several fractions: one that was not washed and was used at pH 2; some that were washed separately with deionized water to varying degrees to obtain different pH values between 2 and neutral; and some to which different amounts of a 0.1 M NaOH (Merck, Darmstadt, Germany) solution were added to obtain pH values ranging between 7 and 11.
The point of zero charge (pHPZC) of the adsorbents, defined as the pH value at which the total net charge (external and internal) of the particles on the adsorbent surface is neutral, provides information about the electrostatic forces between the sorbent and the sorbate and allows an adequate pH to be chosen for adsorption. To determine pHPZC, 50 mL solutions of deionized water were prepared, and the pH was adjusted to the range of 2–11 by adding the required amounts of 0.1 M HCl (Merck) or 0.1 M NaOH (Merck). Then, 0.5 g of adsorbent was added to each of the solutions and they were stirred continuously at room temperature (20 ± 1 °C). After 48 h, the solutions were filtered to separate the adsorbent and their pH values were determined.

2.3. Characterization of the Adsorbents

The surface chemistry of the activated carbons as well as the main functional groups present on the surface activated carbon were analyzed via FTIR-ATR spectroscopy (Shimadzu IRAffinity-1S spectrophotometer with a Golden Gate Diamond ATR unit, Shimadzu, Kyoto, Japan). Each spectrum was obtained by taking 32 scans in the 4000–600 cm−1 range. The OSPC and PNSPC adsorbents analyzed were those obtained after activation without washing, and those obtained following the pharmaceutical adsorption process after filtering and drying in an oven a 40 °C for 24 h, without washing.
The structural disorder of the activated carbons was determined by Raman spectroscopy (Renishaw Qontor inVia confocal Raman microscope, Renishaw, Wotton-under-Edge, UK) equipped with 532 nm laser.
Surface morphology of the activated carbons was obtained by Scanning electron microscopy (SEM) at an accelerating voltage of 10 kV (Carl Zeiss AG, FESEM Zeiss Sigma 300 VP, Jena, Germany).
The structure of biocarbons was evaluated by X-ray diffractometry (Bruker D-8 Advance ECO, Bruker, Billerica, MA, USA). Each sample was measured at an angular range of 10° to 80° using Cu-Kα radiation (λ = 0.154 nm), with a step size of 0.02° and 2 s per step, and the diffractograms were analyzed using the EVA 5.1 software package from Bruker.
The morphological structure of biochars was characterized by nitrogen isotherm analysis (Micromeritics ASAP 2020 analyzer, Micromeritics, Norcross, GA, USA). Approximately 0.034–0.068 g of sample was degassed under vacuum at 90 °C for 2 h, followed by 200 °C for 48 h, with a heating rate of 10 °C·min−1. Nitrogen adsorption–desorption isotherms were recorded at −196 °C over a relative pressure (P/P0) range of 7.5·10−5–1.0. The specific surface area was calculated by the BET model.

2.4. Adsorption Process

The adsorption process for the kinetic studies was performed based on the ASTM D3860-98 standard [29]. A mass of PNSPC or OSPC adsorbent varying between 1 and 5 g/L was added to 100 mL solutions, with the initial pharmaceutical concentration varying from 10 to 50 mg/L. Binary mixtures were prepared by mixing 50 mL of each pharmaceutical taken from 50 mg/L individual solutions. To assess the effect of pH on adsorption efficiency, the process was carried out with adsorbent washed at pH values ranging from 2 to 11.
Throughout the adsorption process, liquid samples were collected at regular time intervals while the solutions were stirred at 500 rpm at room temperature (20 ± 1 °C), and the pH was recorded every 30 min. The samples were centrifuged (using an Eppendorf 5804 R centrifuge, Eppendorf, Hamburg, Germany) for 20 min at 3600 rpm and then filtered. UV–visible spectroscopy was conducted to determine the pharmaceutical concentrations according to the calibration lines obtained at different concentrations. Each adsorption test was repeated three times, and the mean and standard deviation were calculated.

3. Results

3.1. Pharmaceutical Adsorption

3.1.1. FTIR Spectroscopy Results for Pharmaceutical Adsorption

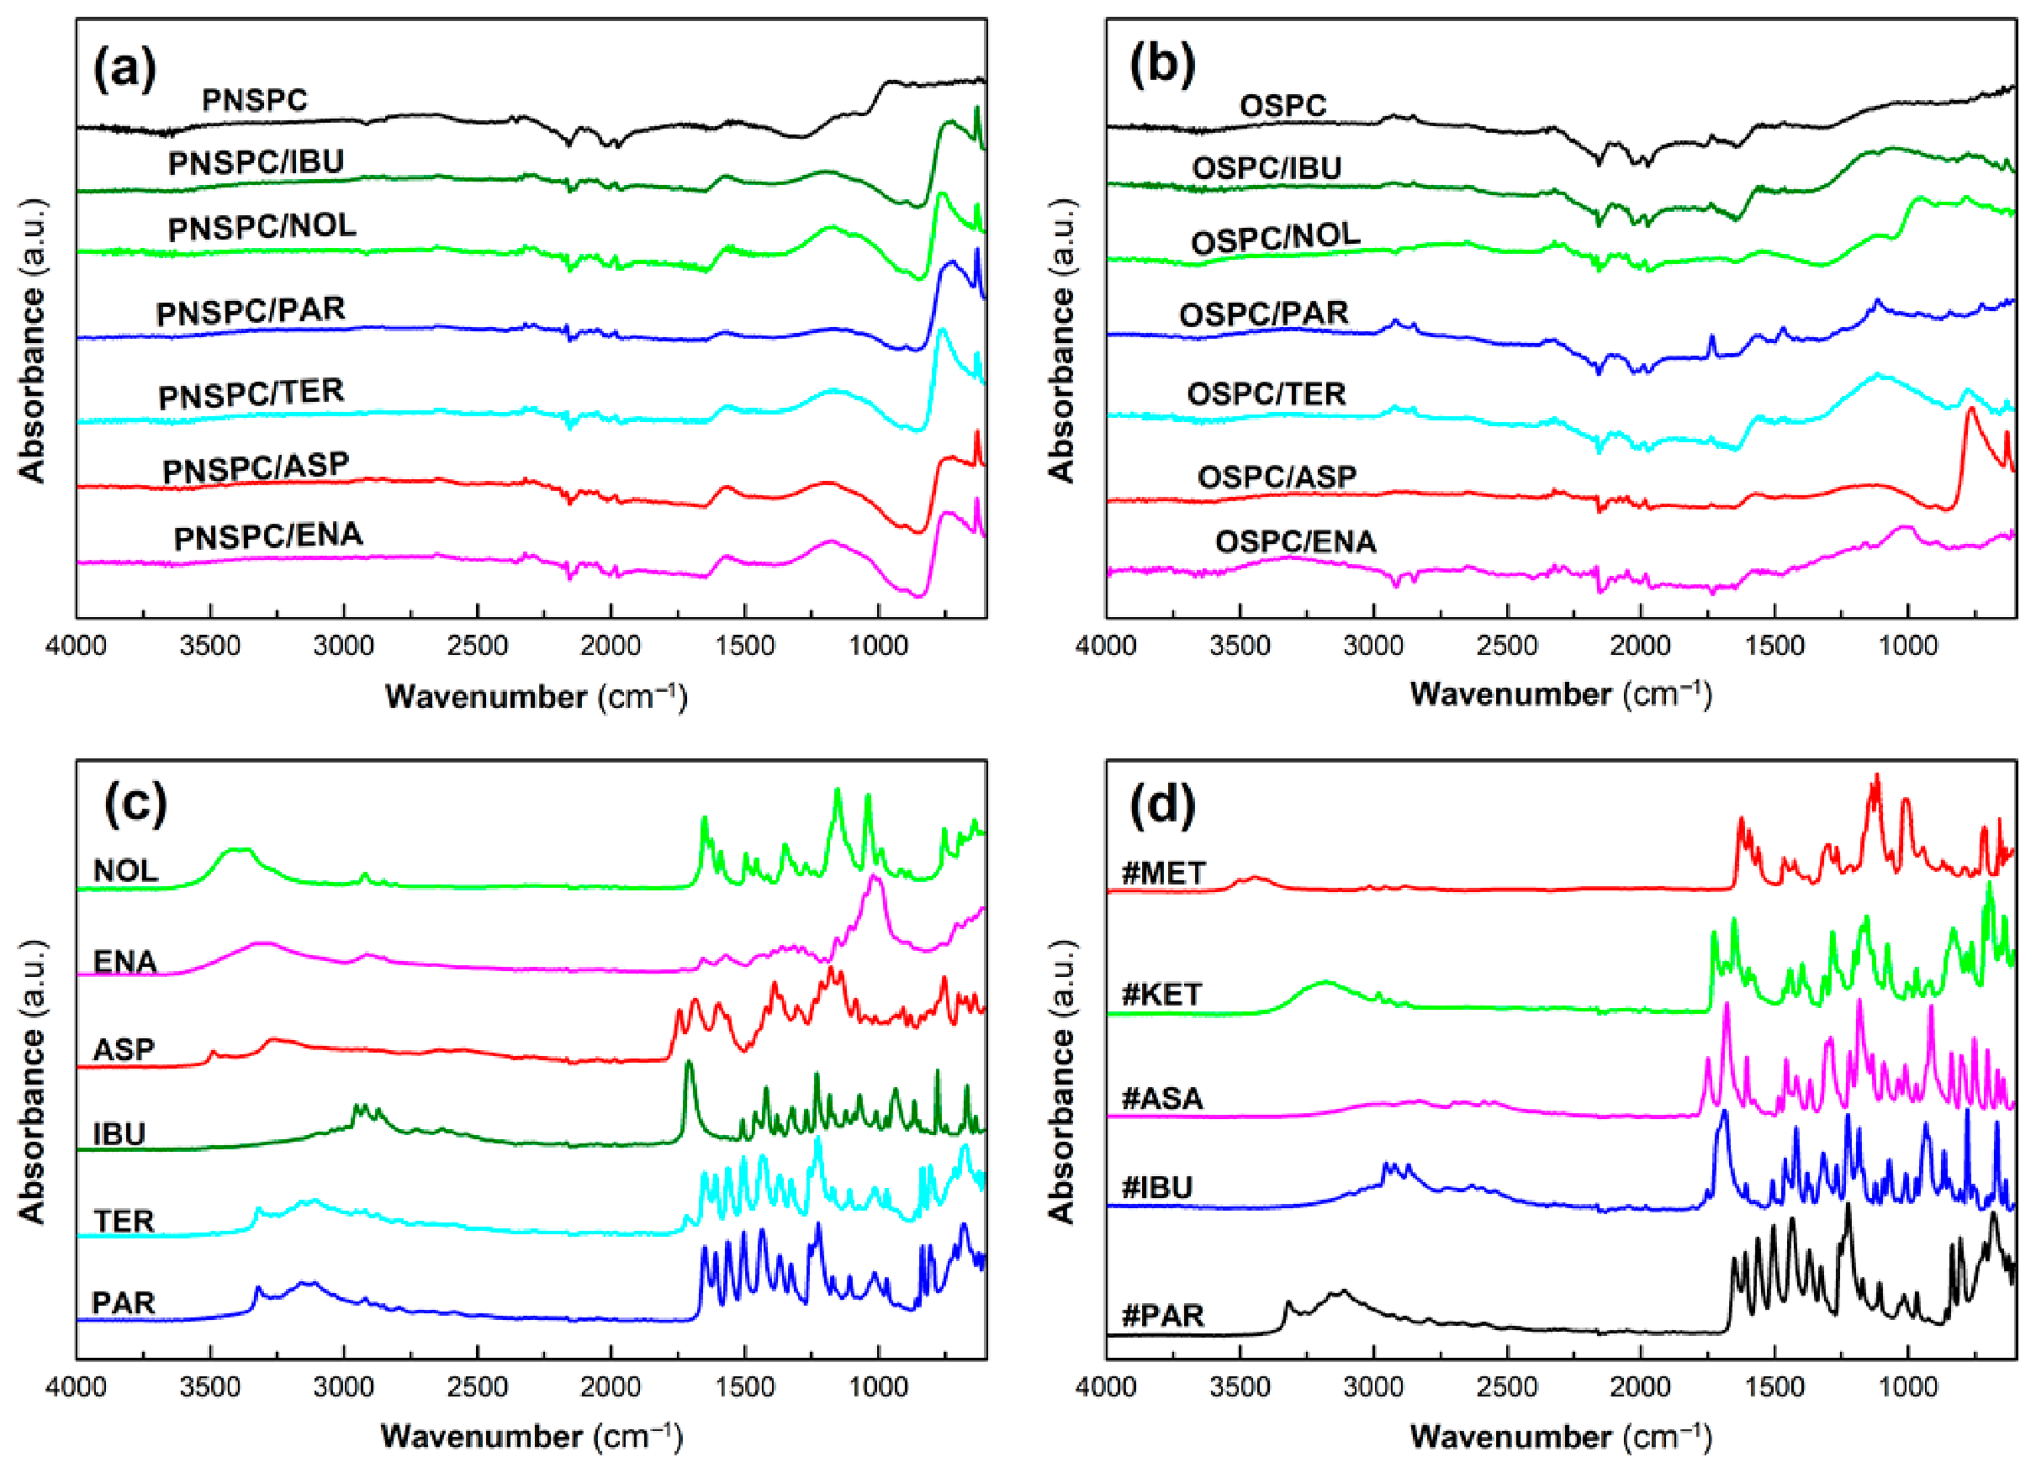
The FTIR spectra for each activated carbon (before and after drug adsorption) are shown in Figure 3 for OSPC (Figure 3a) and PNSPC (Figure 3b). The spectra obtained for the commercial drug forms are plotted in Figure 3c as reference. Both fresh adsorbents (OSPC and PNSPC) exhibit the typical FTIR fingerprints of H3PO4-activated lignocellulosic carbons [30,31], and a broad band is found at 3600–3000 cm−1, corresponding to O–H stretching vibrations of hydroxyl groups (phenols, alcohols) and adsorbed water. Additional weaker bands are observed around 2920–2850 cm−1, indicating aliphatic C–H stretching of residual methyl and ethyl groups. The band region around 1700 cm−1 is assigned to C=O stretching of oxygenated functional groups (carboxylic acids, lactones, quinones), whereas the bands at 1620–1580 cm−1 are attributed to aromatic C=C skeletal vibrations and/or conjugated carbonyls. Absorption in the 1250–1000 cm−1 range is associated with C–O stretching of phenols, ethers, and phosphate esters. Finally, the bands below 900 cm−1 correspond to out-of-plane aromatic C–H bending modes. A key difference between OSPC and PNSPC is that the former shows stronger oxygenated and phosphate-related bands, revealing higher surface functionalization, which typically enhances adsorption via hydrogen bonding and electrostatic interactions.
The spectra of the pure pharmaceutical formulations (Figure 3c) display vibrational bands corresponding to their active ingredients and excipients [31]. Paracetamol (PAR) shows a broad band at 3320–3200 cm−1 due to overlapping O–H and N–H stretching vibrations. Amide C=O stretching appears at 1653 cm−1, while aromatic C=C vibrations and N–H bending are observed between 1600 and 1500 cm−1. The bands at around 1250–1170 cm−1 correspond to C–N stretching and phenolic C–O vibrations. Ibuprofen (IBU) is characterized by a broad O–H stretching band spanning between 3000 and 2500 cm−1, characteristic of hydrogen-bonded carboxylic acids. The strong band at 1710 cm−1 is assigned to the carboxylic C=O group, along with aliphatic C–H stretching bands at around 2950–2850 cm−1. Additional bands at 1450–1375 cm−1 correspond to CH3 bending, and the 1250–1050 cm−1 region reflects C–O stretching vibrations. Metamizole (NOL) exhibits prominent aromatic bands at 1649 cm−1 (C=O), C=C at 1591 cm–1 (C=C), and N–N and aromatic vibrations at 1500–1400 cm−1. Strong absorptions at 1180–1040 cm−1 are assigned to S=O stretching of sulfonate groups, and multiple sharp peaks reflect contributions from excipients. The broad, prominent band centered at 3400 cm−1 is assigned to the gelatin excipient, whereas the band near 2900 cm−1 corresponds to C–H stretching vibrations from the erythrosine excipient. Dexketoprofen (ENA) displays a carboxylic band at 1652 cm−1, along with aromatic C=C vibrations at 1570 cm−1 and C–O stretching bands between 1250 and 1100 cm−1. The broad band near 3400–3300 cm−1 is attributed to O–H stretching from corn starch and sodium starch glycolate, and the latter excipient also led to CH2 symmetric stretching at 2914 cm−1 and C–O–C ether stretching vibrations at 1000–1200 cm−1. Termalgin (TER), a paracetamol-based formulation, presents very similar features to PAR but with additional contributions from other excipients such as stearic acid (C=O at 1708 cm−1). Aspirin-based effervescent granules (ASP) show two distinct carbonyl bands at about 1750 cm−1 (ester) and 1690 cm−1 (carboxylic acid), aromatic C=C at 1600 cm−1, and C–O stretching at 1300–1000 cm−1, along with ester C–O–C stretching vibrations at 1220 cm−1 and 1140 cm−1. Additionally carbonate-related bands at 1400 and 870 cm−1 arise from the sodium bicarbonate excipient, and a broad O–H band around 3000–2500 cm−1 from acid and excipients.
The adsorption of pharmaceutical formulations onto activated carbons led to marked spectral changes (Figure 3a,b), confirming interaction between the adsorbates and the carbon surfaces. Changes are evident in the fingerprint region (below 1500 cm−1), arising from overlapping contributions of drug-related C–O vibrations and surface phosphate groups; this further demonstrates structural alterations on the surface of both carbons, based on the fact that chemical activation alters the structure of the material even before the heating stage. A general characteristic of all loaded samples is overall attenuation of intensity across the entire spectrum, which is most pronounced in PNSPC. This observed reduction in band intensities for drug-loaded activated carbon systems is attributed to surface and structural effects due to the drugs’ occupation of sorbent active sites [32]. The primary effect of the adsorption of active pharmaceutical ingredients and excipients onto the highly porous carbon surface is partial coverage of its intrinsic functional groups (e.g., hydroxyl, carbonyl), reducing their direct interaction with infrared radiation and hindering pore accessibility. Shifts in the peak positions of some characteristic bands (O–H stretching, around 3400 cm−1; C=O stretching, 1800–1600 cm−1; and C–O stretching, 1250–1000 cm−1) would reveal interactions between the pharmaceuticals and the adsorbent functional groups, such as hydrogen bonding or π–π interactions [32]. On the other hand, intermolecular interactions between the carbon surface and pharmaceutical formulations alter the local electronic environment, thereby decreasing the dipole moment variation associated with vibrational modes and resulting in weaker absorption bands. In addition, a dilution effect is also observed, as the relative proportion of activated carbon decreases within the composite system, leading to reduced spectral contribution from its characteristic functional groups. Furthermore, overlapping absorption bands from the loaded compounds may mask or interfere with the intrinsic signals of the carbon matrices. A comparison between the two activated carbons reveals that the olive stone-derived carbon (OSPC) exhibited more pronounced spectral changes after drug adsorption than the pine-nut shell-derived carbon (PNSPC). This suggests that OSPC exhibits stronger interactions with pharmaceuticals, likely due to its higher content of oxygenated and phosphorus-containing functional groups. Conversely, the spectra of PNSPC-based samples show more subtle changes, indicating a greater contribution of physical adsorption mechanisms such as π–π interactions and pore filling.
FTIR analysis revealed that the commercial formulations largely preserved the characteristic spectral features of their corresponding active pharmaceutical ingredients (APIs), indicating that the formulation process did not alter the chemical structure of the drugs. Differences between the pharmaceutical formulations and pure APIs (Figure 3c,d) were primarily related to band broadening, intensity changes, and increased complexity in the fingerprint region, which can be attributed to the presence of excipients. The greatest differences between the FTIR spectra of the drugs and their respective APIs were observed in the formulations with the lowest API content (less than 15% mass ratio): ENA and ASP. In the other formulations, with API contents between 50% for PAR and 96% for NOL), the shielding effect of excipients was much smaller. Hydroxyl-rich excipients such as starches, microcrystalline cellulose, lactose, and gelatin contributed to broader absorption in the 3600–3000 cm−1 region through hydrogen-bonded O–H stretching vibrations. Excipients containing polysaccharide or ether functionalities, including starch derivatives and povidone, increased the intensity of the 1200–900 cm−1 region due to overlapping C–O and C–O–C stretching modes, while lipid-based additives such as magnesium stearate, stearic acid, and glycerol distearate contributed minor enhancements in the aliphatic C–H stretching region (2950–2850 cm−1). Among the formulations, ASP exhibited the greatest spectral deviation from pure acetylsalicylic acid because of the strong infrared contributions of citric acid and sodium bicarbonate present in the effervescent matrix. Overall, the observed spectral differences arise primarily from additive excipient contributions rather than significant API–excipient interactions or chemical degradation.

3.1.2. Results of Pharmaceuticals Adsorption by Raman Spectra Technology

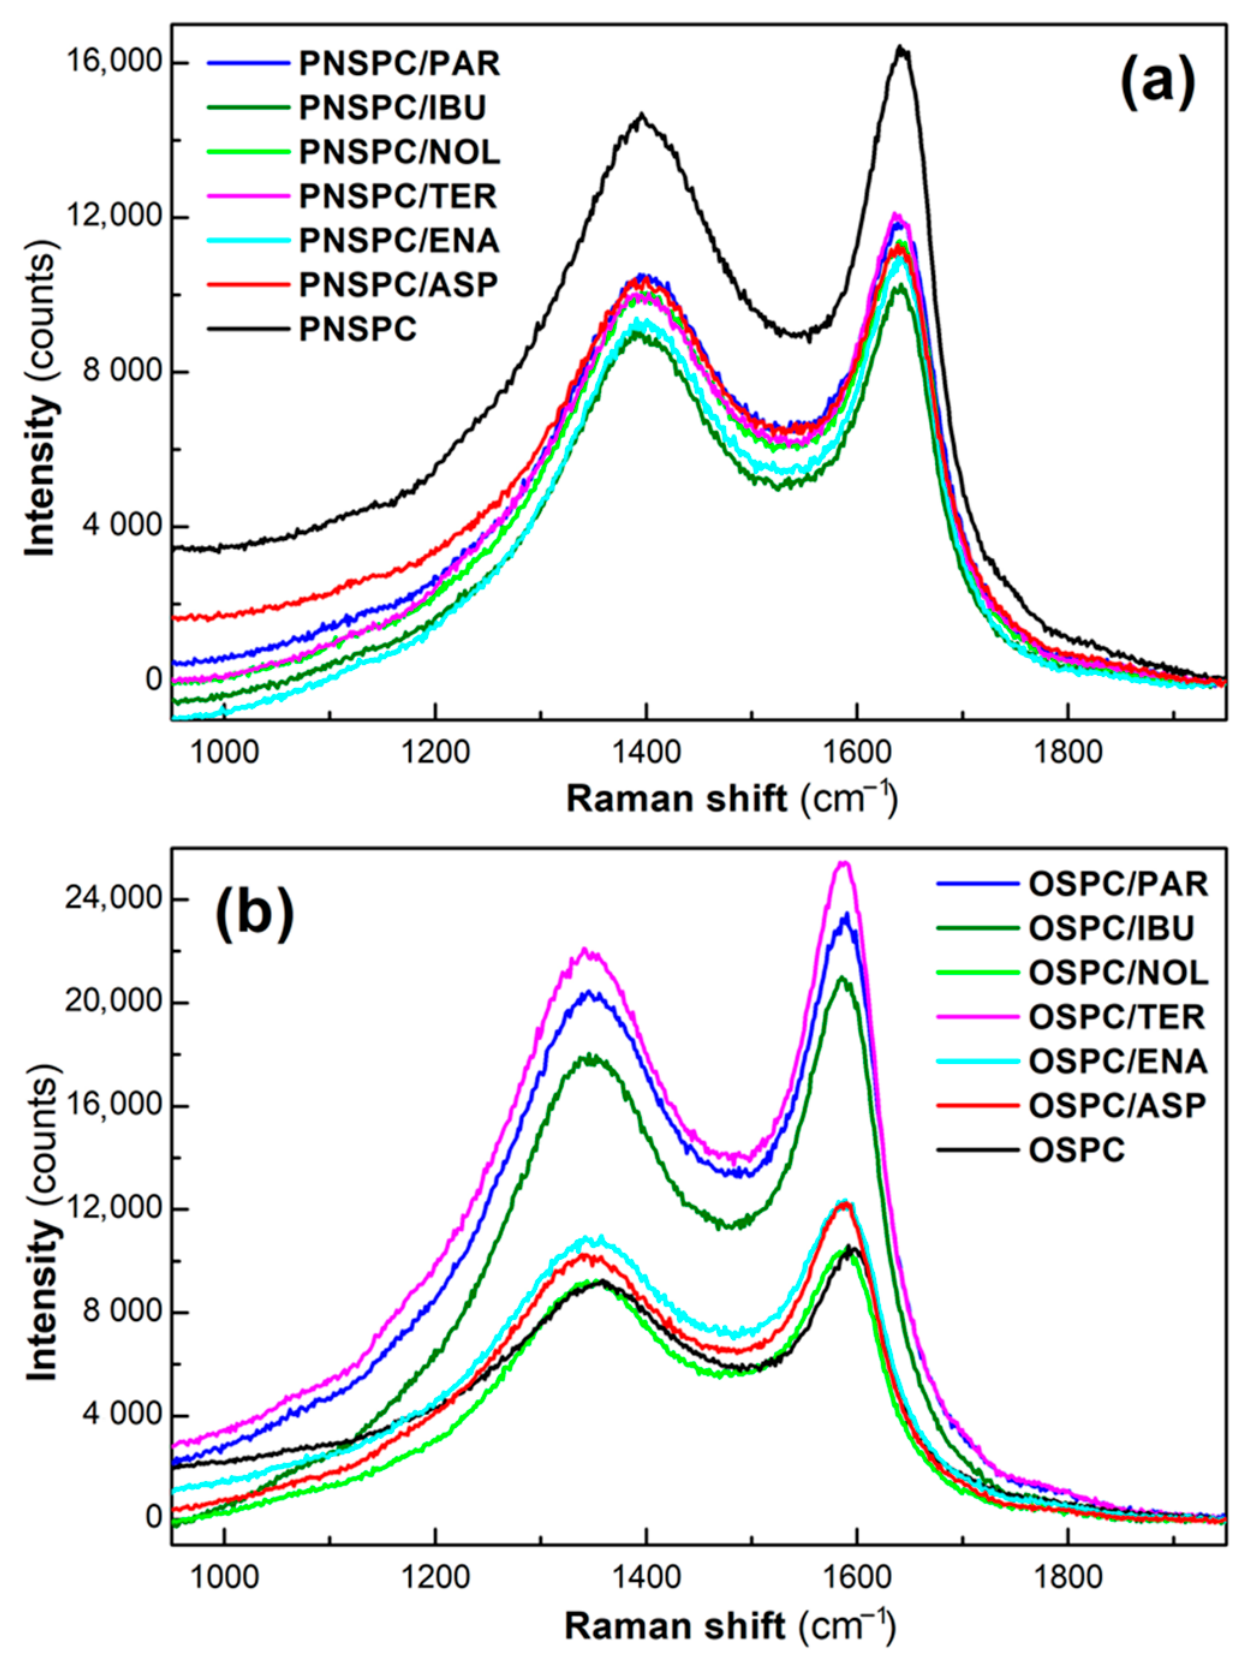
The Raman spectra obtained with both pristine activated carbons and after drug adsorption are shown for PNSPC in Figure 4a and OSPC Figure 4b, respectively. All of them exhibited two characteristic peaks: the G-band (graphitic band near 1580 cm−1) and the D-band (disorder band at 1350 cm−1). The intensity ratio of both bands (ID/IG) provides a semi-quantitative measure of structural disorder and crystallite size, with a higher ratio indicating greater defect density and smaller crystallite size [28]. The crystallite size (La) was calculated according to the Cançado model [33], and all samples showed broad D- and G-bands, typical of activated carbons with nanometer-scale graphitic domains, with similar ID/IG ratios (~0.86) and La values (~22 nm) (Table 2). The ID/IG values of fresh OSPC and PNSPC were slightly higher than those obtained in a recent study (0.801 and 0.684, respectively) employing the same raw materials and preparation method, except for a final washing step [28]. Overall, the adsorbed drugs produced a slight shift in the location of the characteristic bands, indicating that adsorption of the pharmaceutical formulations produced only minor changes in the structural ordering of these activated carbons. This small difference may reflect surface interactions between sorbates and carbon defect sites. Thus, with the loaded drugs, the Raman shift values for OSPC changed from 1598 and 1351 cm−1 in the D-band and G-band, respectively, to 1588 and 1348 cm−1. In the case of PNSPC, these values changed from 1597 and 1346 cm−1 to 1588 and 1344 cm−1, respectively. The slight variation observed in the crystallite size of graphitic domains suggests that the adsorption process modified the surface electronic structure of such domains, but did not significantly alter the bulk carbon framework. In general, the adsorbed pharmaceuticals somewhat increased the ID/IG ratio (with average values of 0.84 for fresh carbons and 0.87 after adsorption), suggesting an apparent rise in defect density and possibly deposition of organic excipient residues within the porous structure. This was also confirmed by the clear increase in the overall Raman signal intensity observed for all samples (compared to the corresponding unloaded adsorbent), and by the D-band intensity always increasing more than that of G-band. Aromatic rings of the pharmaceutical molecules can interact strongly with graphitic carbon domains through π–π stacking interactions. Excipients can also cause minor changes in Raman spectra and increase the density of defect sites by introducing additional oxygen-containing functional groups and electronic interactions with graphitic domains.

3.2. Characterization of the Morphological Structure of Adsorbents

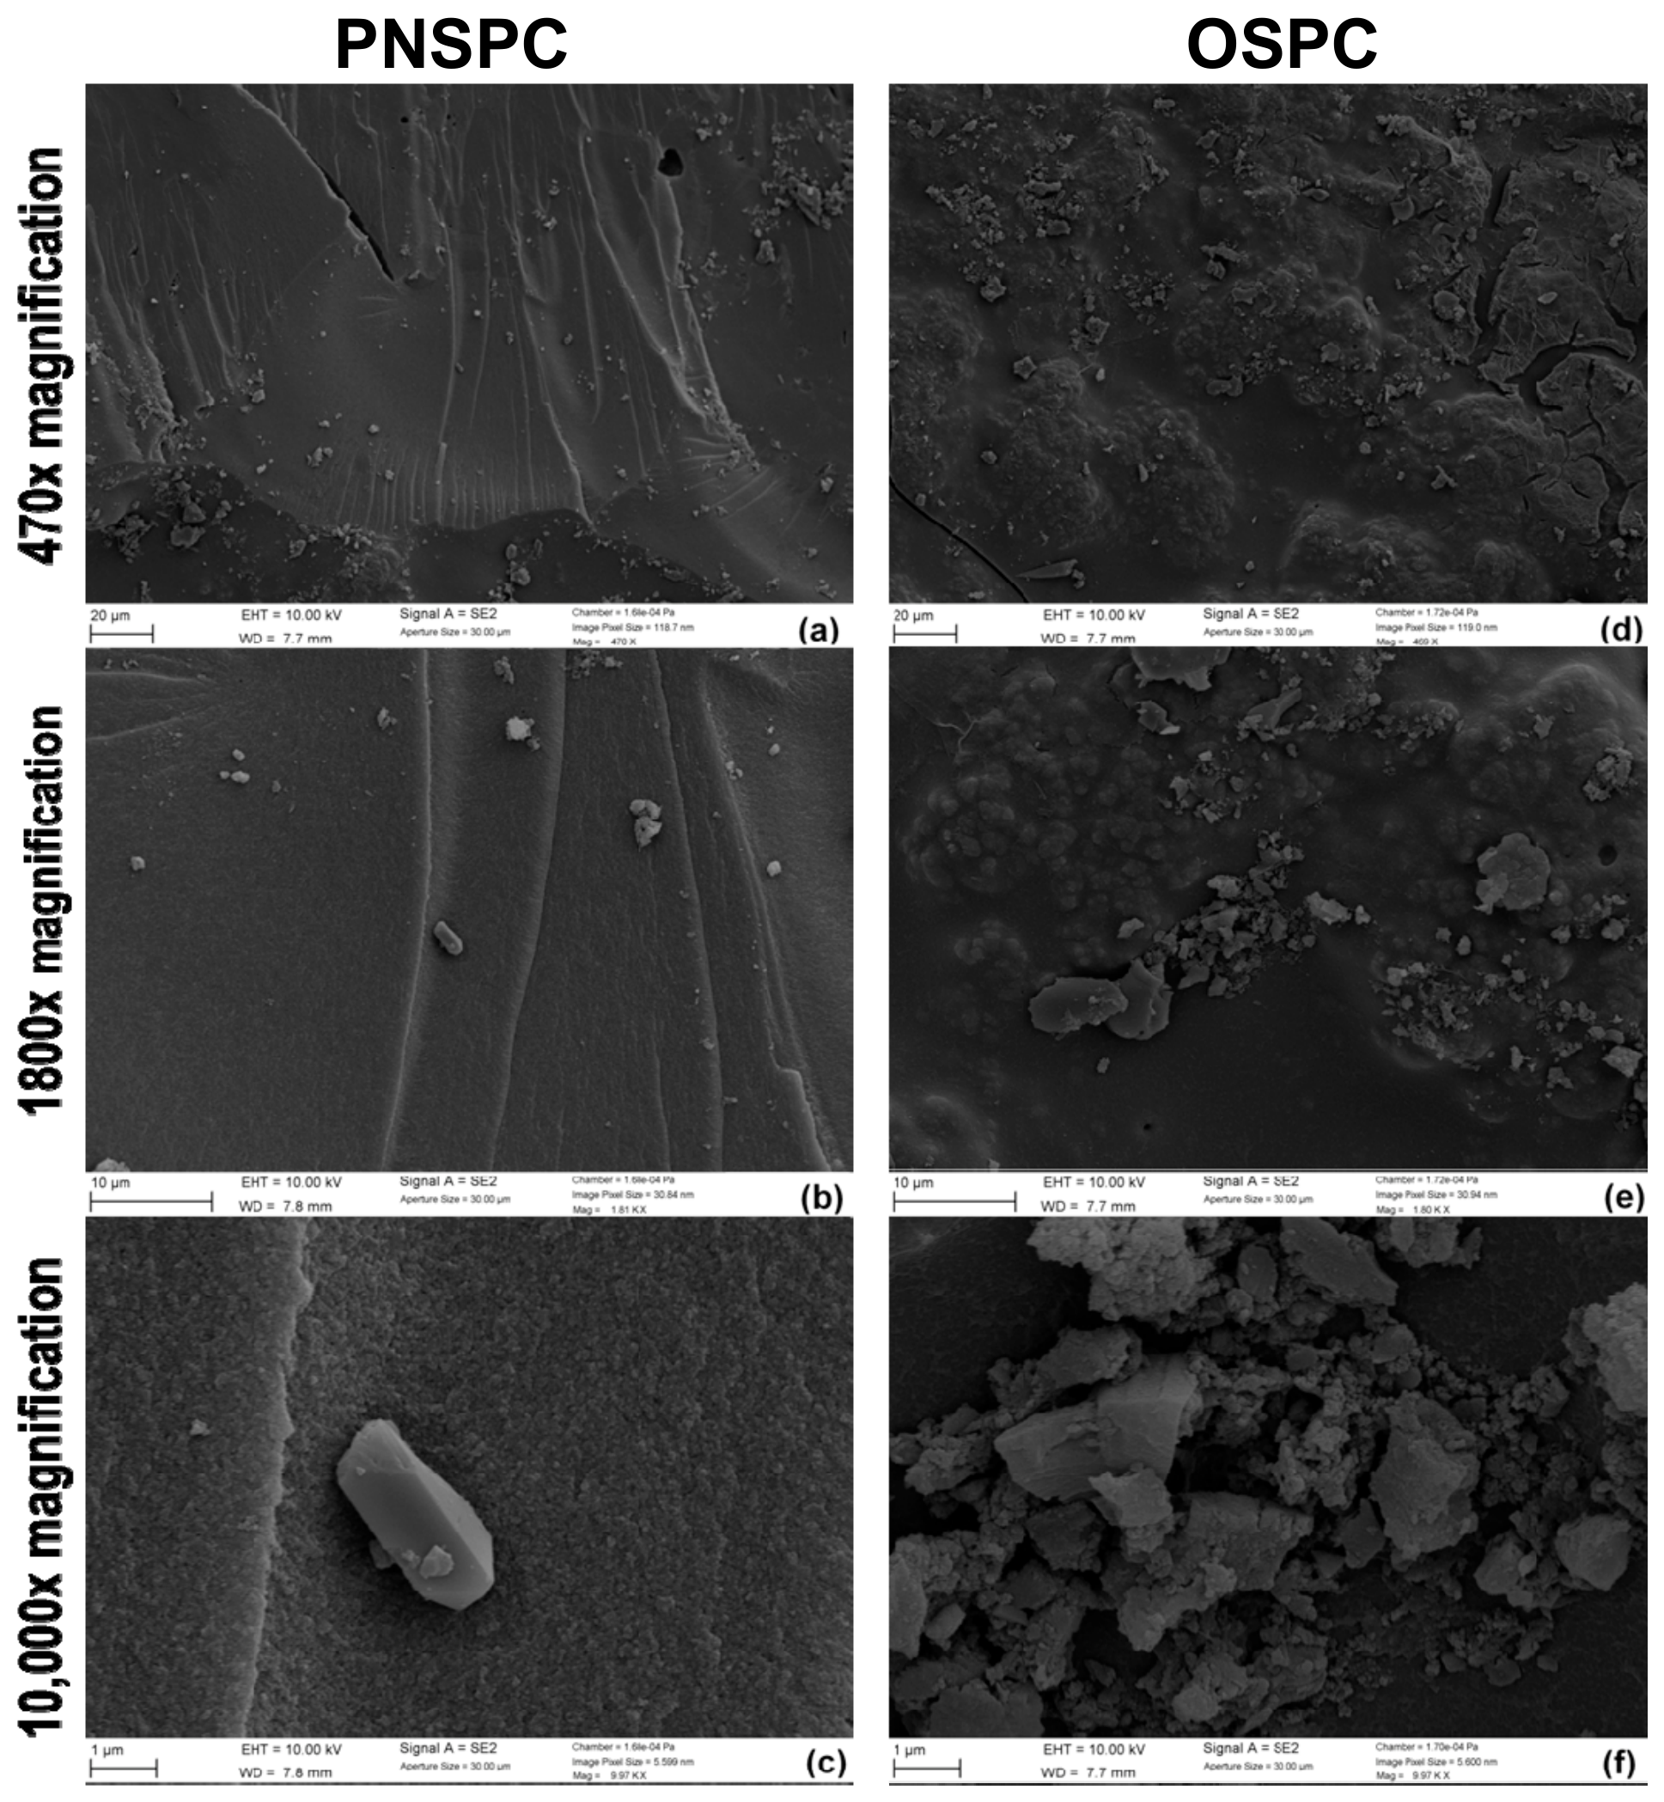
Scanning electron microscopy was used to evaluate the PNSPC and OSPC samples (Figure 5). Despite being produced via the same activation procedure, the micrographs revealed significant differences in the samples’ texture and structural organization, which is attributed primarily to the intrinsic lignocellulosic architecture of the precursor biomass. PNSPC exhibited a relatively continuous, plate-like surface with conchoidal fractures and elongated grooves, reflecting its dense, fibrous lignocellulosic origin. Even at high magnification (10,000×), the PNSPC surface remains compact and predominantly microporous, with minimal visible macroporosity, which may restrict adsorption kinetics due to limited pore accessibility. This morphology suggests a more organized or vitreous carbon matrix, indicating that the activation process did not significantly penetrate the bulk of the pine nut shell precursor, thus failing to generate a highly developed external network with larger pores. Conversely, OSPC displayed a highly heterogeneous and rugged topography characterized by extensive cracking, fissures, and an “island-like” surface texture. This fragmented architecture suggests more significant structural breakdown during precursor activation, yielding a hierarchical pore network encompassing micro-, meso-, and macropores. The increased surface roughness and open inter-particle voids in OSPC provide superior accessibility to active sites and facilitate faster mass transfer. Overall, OSPC displayed a significantly more heterogeneous and porous surface compared with the relatively compact morphology observed for PNSPC. This morphological evidence is consistent with the measured BET surface areas, which are substantially higher for OSPC (1535 m2/g) than for PNSPC (1076 m2/g), further supporting the superior adsorption capacity of the olive-stone-derived activated carbon (see Section 3.3).
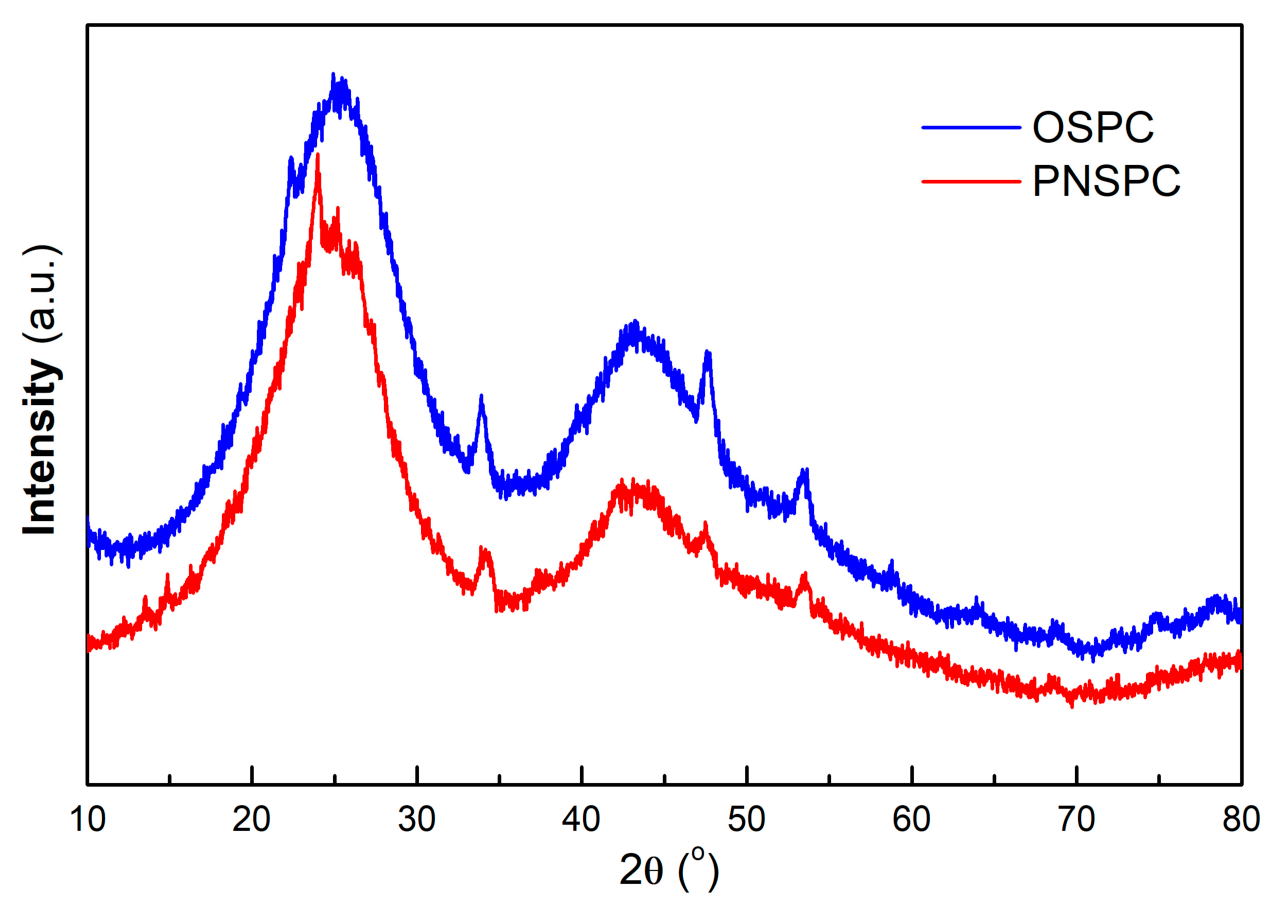
The X-ray diffractograms of the OSPC and PNSPC samples are plotted in Figure 6. The XRD patterns showed the typical features of predominantly amorphous carbonaceous materials with turbostratic graphitic structures, with OSPC exhibiting higher intensities than PNSPC. Both biocarbons exhibited two broad peaks centered at approximately 24–25° and 43–44° (2θ), corresponding to the (002) and (100) planes, respectively [34]. Weak peaks were observed at around 34°, 48°, and 54°, which are likely to correspond to inorganic phosphate phases, given that no washing was performed after the H3PO4 treatment.

3.3. Textural Properties of the Adsorbents

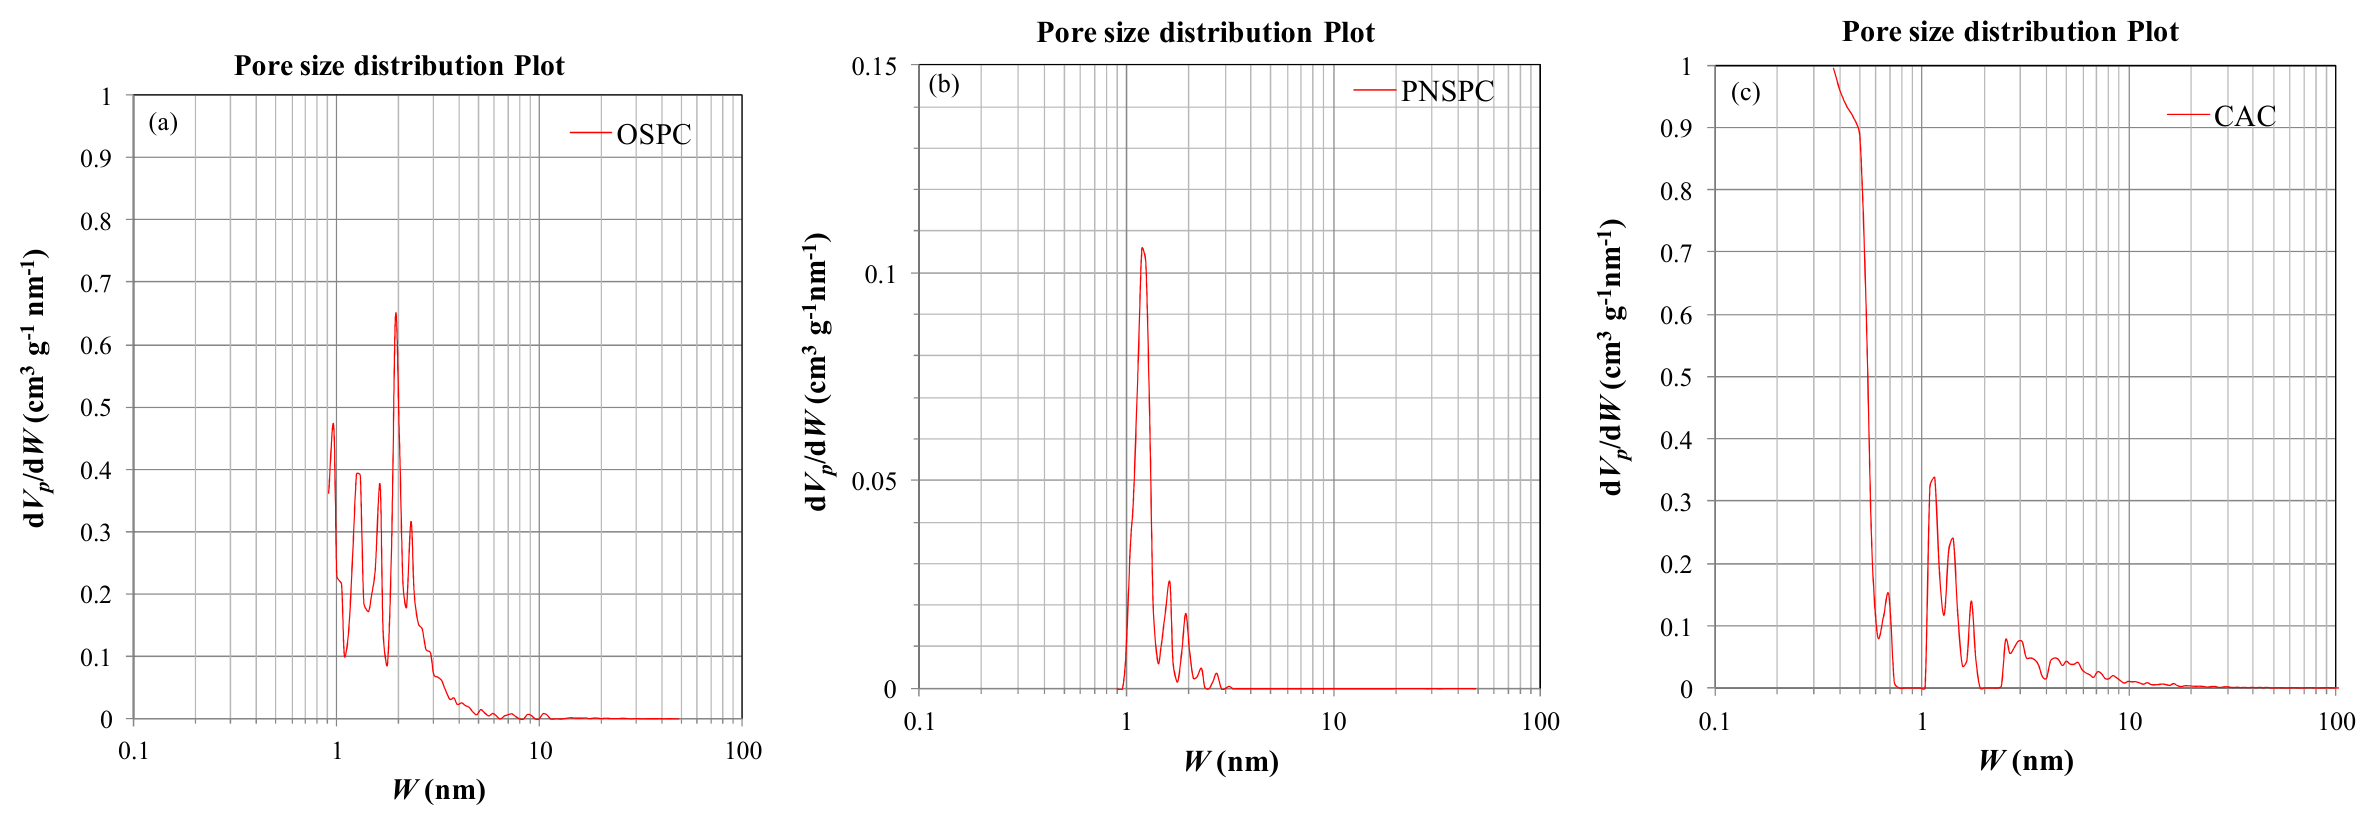
Table 3 summarizes the main results of the N2 adsorption–desorption isotherms at 77 K for OSPC and PNSPC and for commercial activated carbon (CAC), as the BET surface area, the total pore volume, and the average pore diameters determined by the pore size distribution (plotted in Figure 7), in accordance with the nonlocal density functional theory (NLDFT). The results indicate that high BET surfaces areas were obtained. The BET surface area of OSPC is 42% higher than that of PNSPC and 66% higher than that of CAC, whereas the surface area of PNSPC is in the same order as that of CAC, close to 1000 m2/g. The BET surface area of OSPC is three orders higher than that of thermally activated olive stones (1.17 m2/g) [35], almost twenty times higher than that reported by Wafaa et al. [36] for olive stones chemically activated with H3PO4 (74.86 m2/g), and around 60% higher than that of olive stones thermochemically activated with H3PO4 by Ozcan et al. [37] (970 m2/g) and by García-Mateos et al. [38] (990 m2/g). The surface area of PNSPC is significantly higher than that of pine nut shells chemically activated with NaOH by Nashuad et al. [39] (176 m2/g); carbonized, impregnated with H2SO4, and co-precipitated by Hashemzadeh et al. [40] (182.5 m2/g); and thermally activated by Kim et al. [41] (47.6 m2/g). The total pore volume of OSPC is nearly two times greater than that of PNSPC and around 25% higher than that of CAC, inferring a high adsorption capacity. Furthermore, the average pore diameter of OSPC is similar to that of CAC and is slightly higher than that of PNSPC, allowing fast diffusion. The total pore volume reported by García-Mateos et al. [38] for olive stones (0.91 cm3/g) is similar to that obtained for OSPC in this study. The total pore volume determined by Hashemzadeh et al. [40] (0.33 cm3/g) is lower than that obtained for PNSPC in this study and a third of that obtained for OSPC.

3.4. Effect of the Operating Variables on the Adsorption Process of Pharmaceuticals

After determining the behavior of the activated PNSPC and OSPC adsorbents using the proof of concept of methylene blue and methyl orange [28], the adsorption of the six pharmaceuticals—paracetamol (acetaminophen) (PAR), ibuprofen, nolotil (metamizol) (NOL), enantyum (dexketoprofen) (ENA), termalgin (TER), and aspirin (acetylsalicylic acid) (ASP)—was conducted.
The adsorption capacity, the amount of each pharmaceutical adsorbed on the adsorbents, and the adsorption efficiency were calculated, using Equations (1) and (2), as the difference between the initial concentration and the concentration in the solutions at different times.
q = V × (Co − C)/S
η = (Co − C)/Co × 100
Here, q represents the adsorption capacity (mg g−1), V is the volume of the solution (mL), Co is the initial concentration of the adsorbate (mg L−1), C is the concentration of the adsorbate at time t (mg L−1), S is the mass of the adsorbent (g), and η is the adsorption efficiency.

3.4.1. Effect of the pH

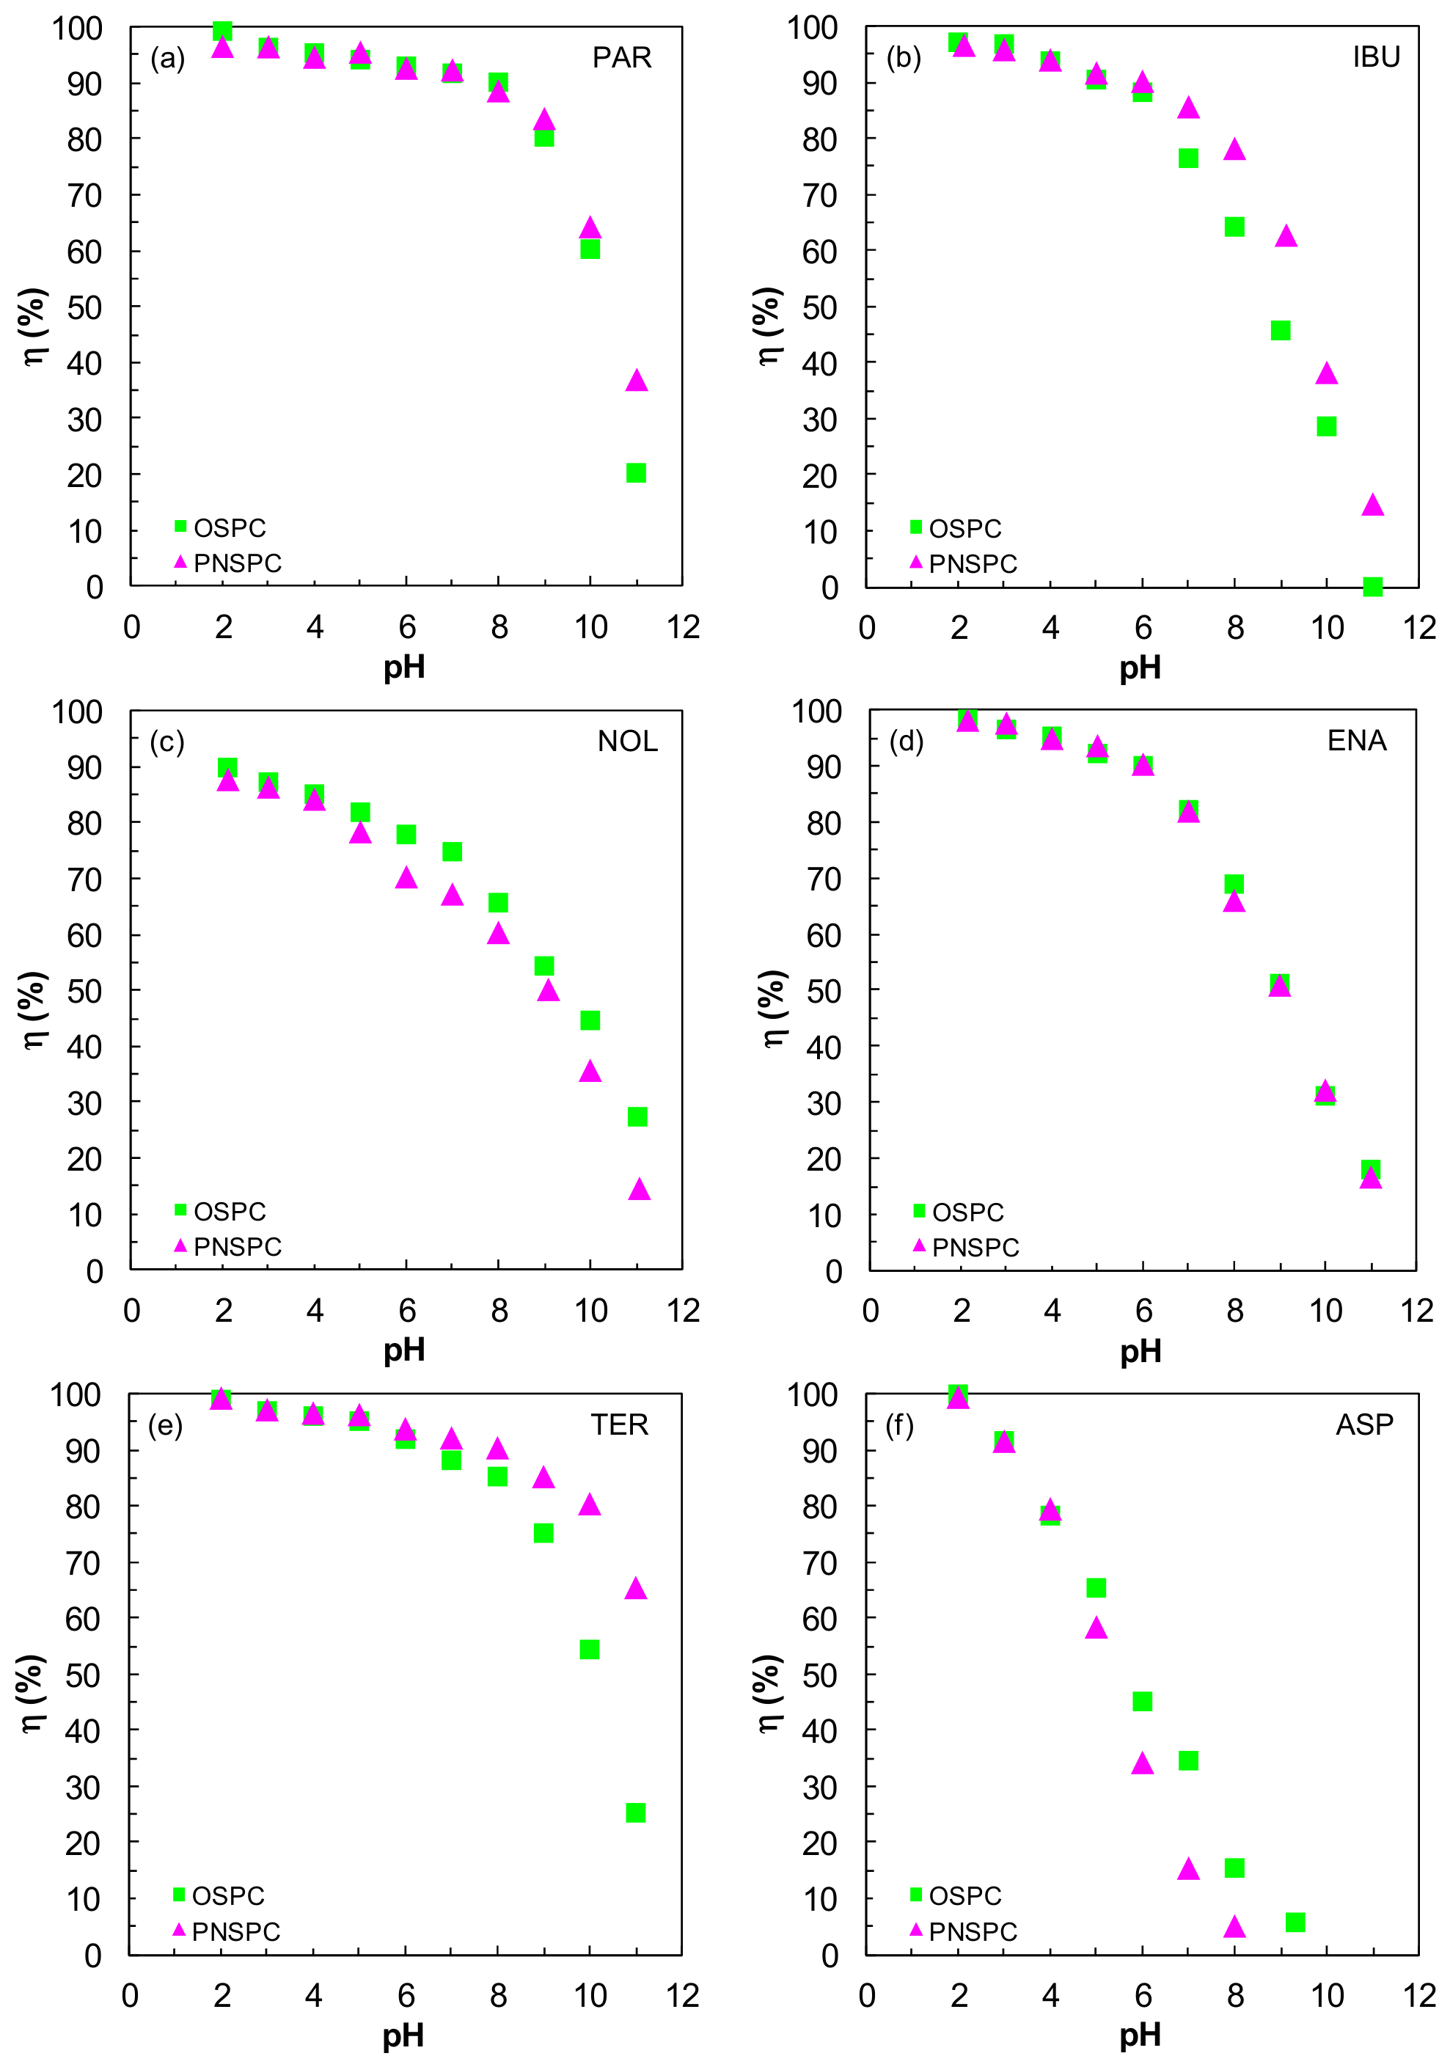
Figure 8 illustrates the effect of pH on the adsorption efficiency of the six pharmaceuticals onto OSPC and PNSPC under pH values ranging from 2 to 11. The pH values and adsorption capacities present a negative correlation. Thus, for both adsorbents, the maximum adsorption efficiency of PAR (Figure 8a), 99.23%, is obtained at pH 2 and shows a slight decrease of less than 10% (91.68%) up to a pH value of 7; however from the pKa value (9.5), efficiency decreases sharply up to pH 11 (21.26%). The adsorption efficiency of IBU (Figure 8b) remains above 90% up to pH 4, reaching a maximum value (97.12%) at pH 2.15, and from the pKa value (4.45), efficiency decreases sharply up to pH 11. For NOL (Figure 8c), adsorption efficiency is over 80% up to pH 9, and this value drops sharply up to pH 11. The adsorption efficiency of ENA (Figure 8d) remains over 90% up to pH 6, then falls considerably up to pH 11. Regarding the adsorption efficiency of TER (Figure 8e), up to pH 9, it remains above 90%, after which it declines up to pH 11. The adsorption efficiency of ASP (Figure 8f) remains at 90% at pH 2, but decreases sharply as pH increases from pH corresponding to its pKa value (3.5). Since the adsorption efficiency of the six pharmaceuticals, with both adsorbents and without washing, was highest at pH 2, this pH value was used in the subsequent experiments.
This could be because at neutral or acidic pH, below the pharmaceuticals’ pKa, the equilibrium is strongly shifted to the left and is not dissociated. Being the predominant form the neutral molecule, while at a pH above its pKa, the dissociated (ionic) form is the most abundant. PAR tends to deprotonate at pH above its pKa (9.5) obtaining the phenoxide form. IBU is hydrolyzed to obtain its conjugate base, ibuprofenoate over its pKa value (4.5). NOL dissociates into the metamizole radical and magnesium ions. ENA dissociates at pH over its pKa (4.5) to obtain the anion dexketoprofenato. ASP has a carboxyl group that can release a proton at pH above its pKa (3.5) and obtain its conjugate base the acetylsalicylate ion. As the pharmaceuticals remain in their neutral form, the adsorption is not governed by electrostatic mechanisms, but by hydrogen and hydrophobic bonds. On the contrary, at a pH higher than their pKa, the pharmaceuticals are dissociated, generating repulsive electrostatic interactions between the anions and the negatively charged adsorbent surface, over their points of zero charge (pHPZC)—6.7 for OSPC and 6.5 for PNSPC—resulting in lower adsorption efficiency. Below their pHPZC, there is electrostatic attraction between the molecules of the pharmaceuticals and the adsorbent, whose surface is positively charged. The pH values of the solutions of PAR, IBU, NOL, ENA, TER, and ASP before adding the adsorbent were 5.63, 3.90, 4.38, 6.29, 5.62, and ASP, respectively.

3.4.2. Effect of the Adsorbent Concentration

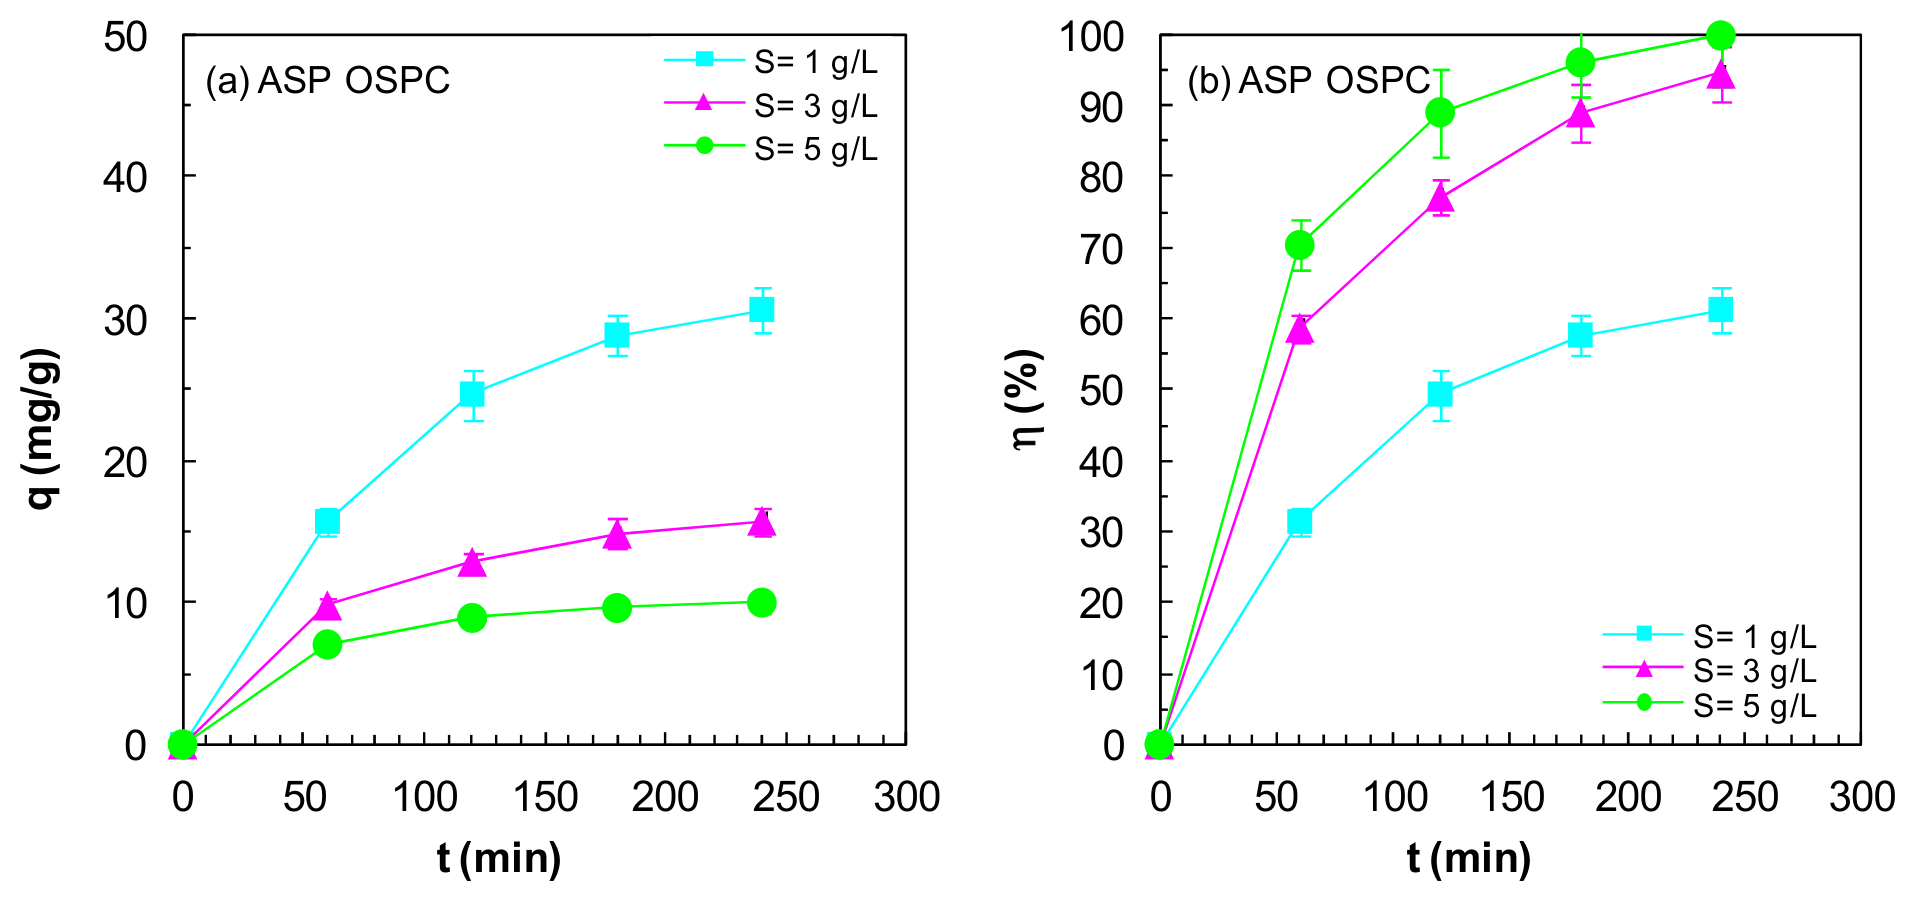
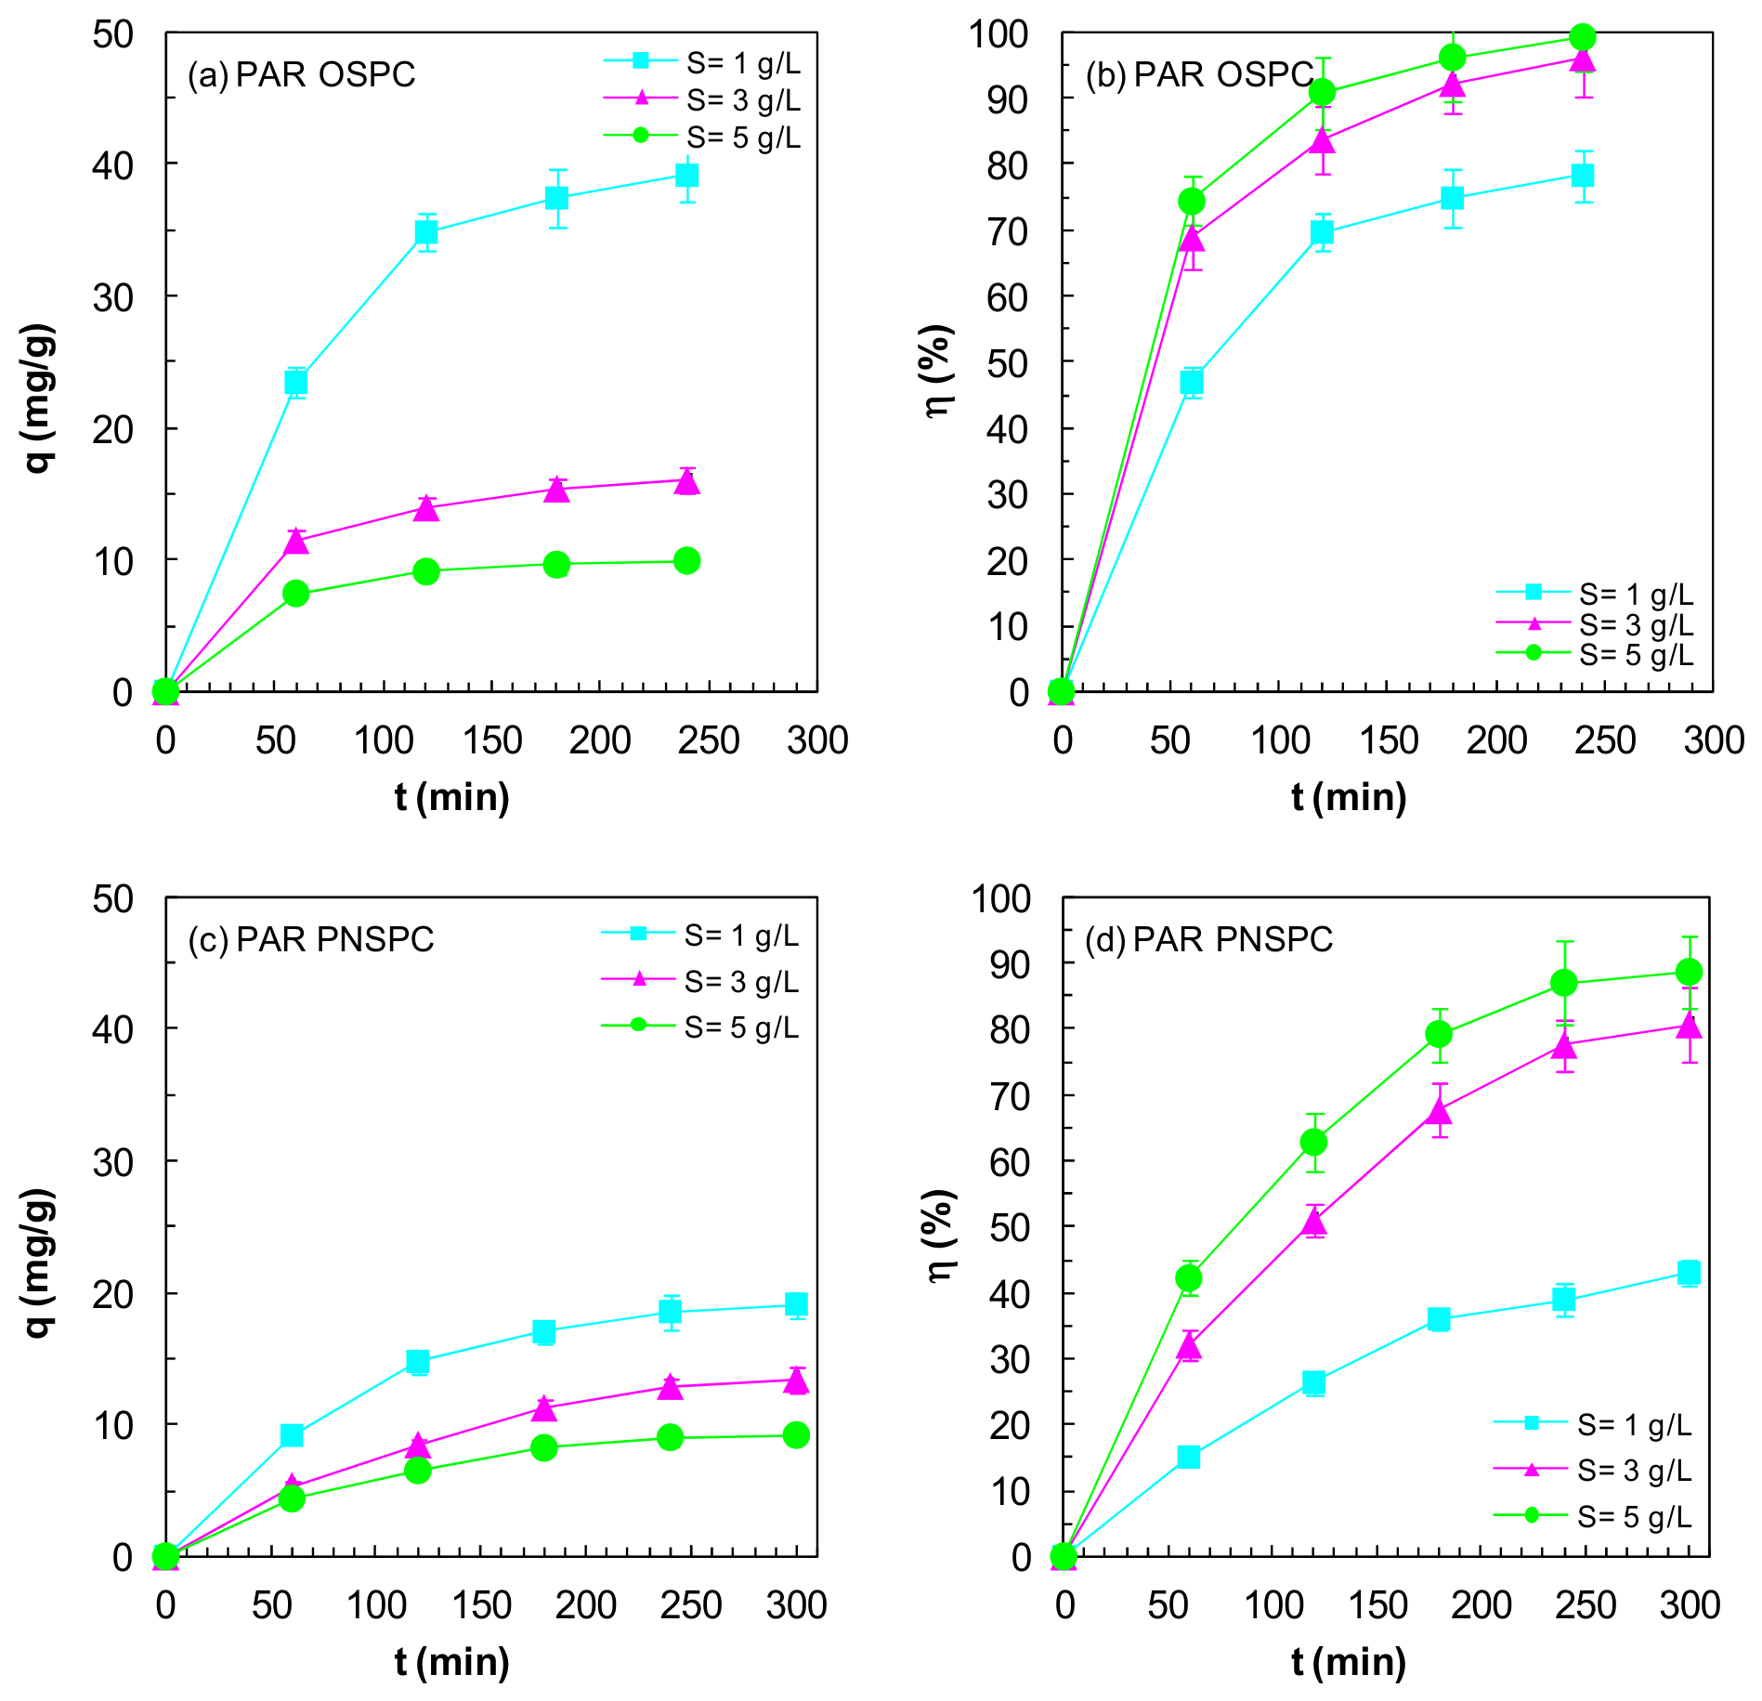
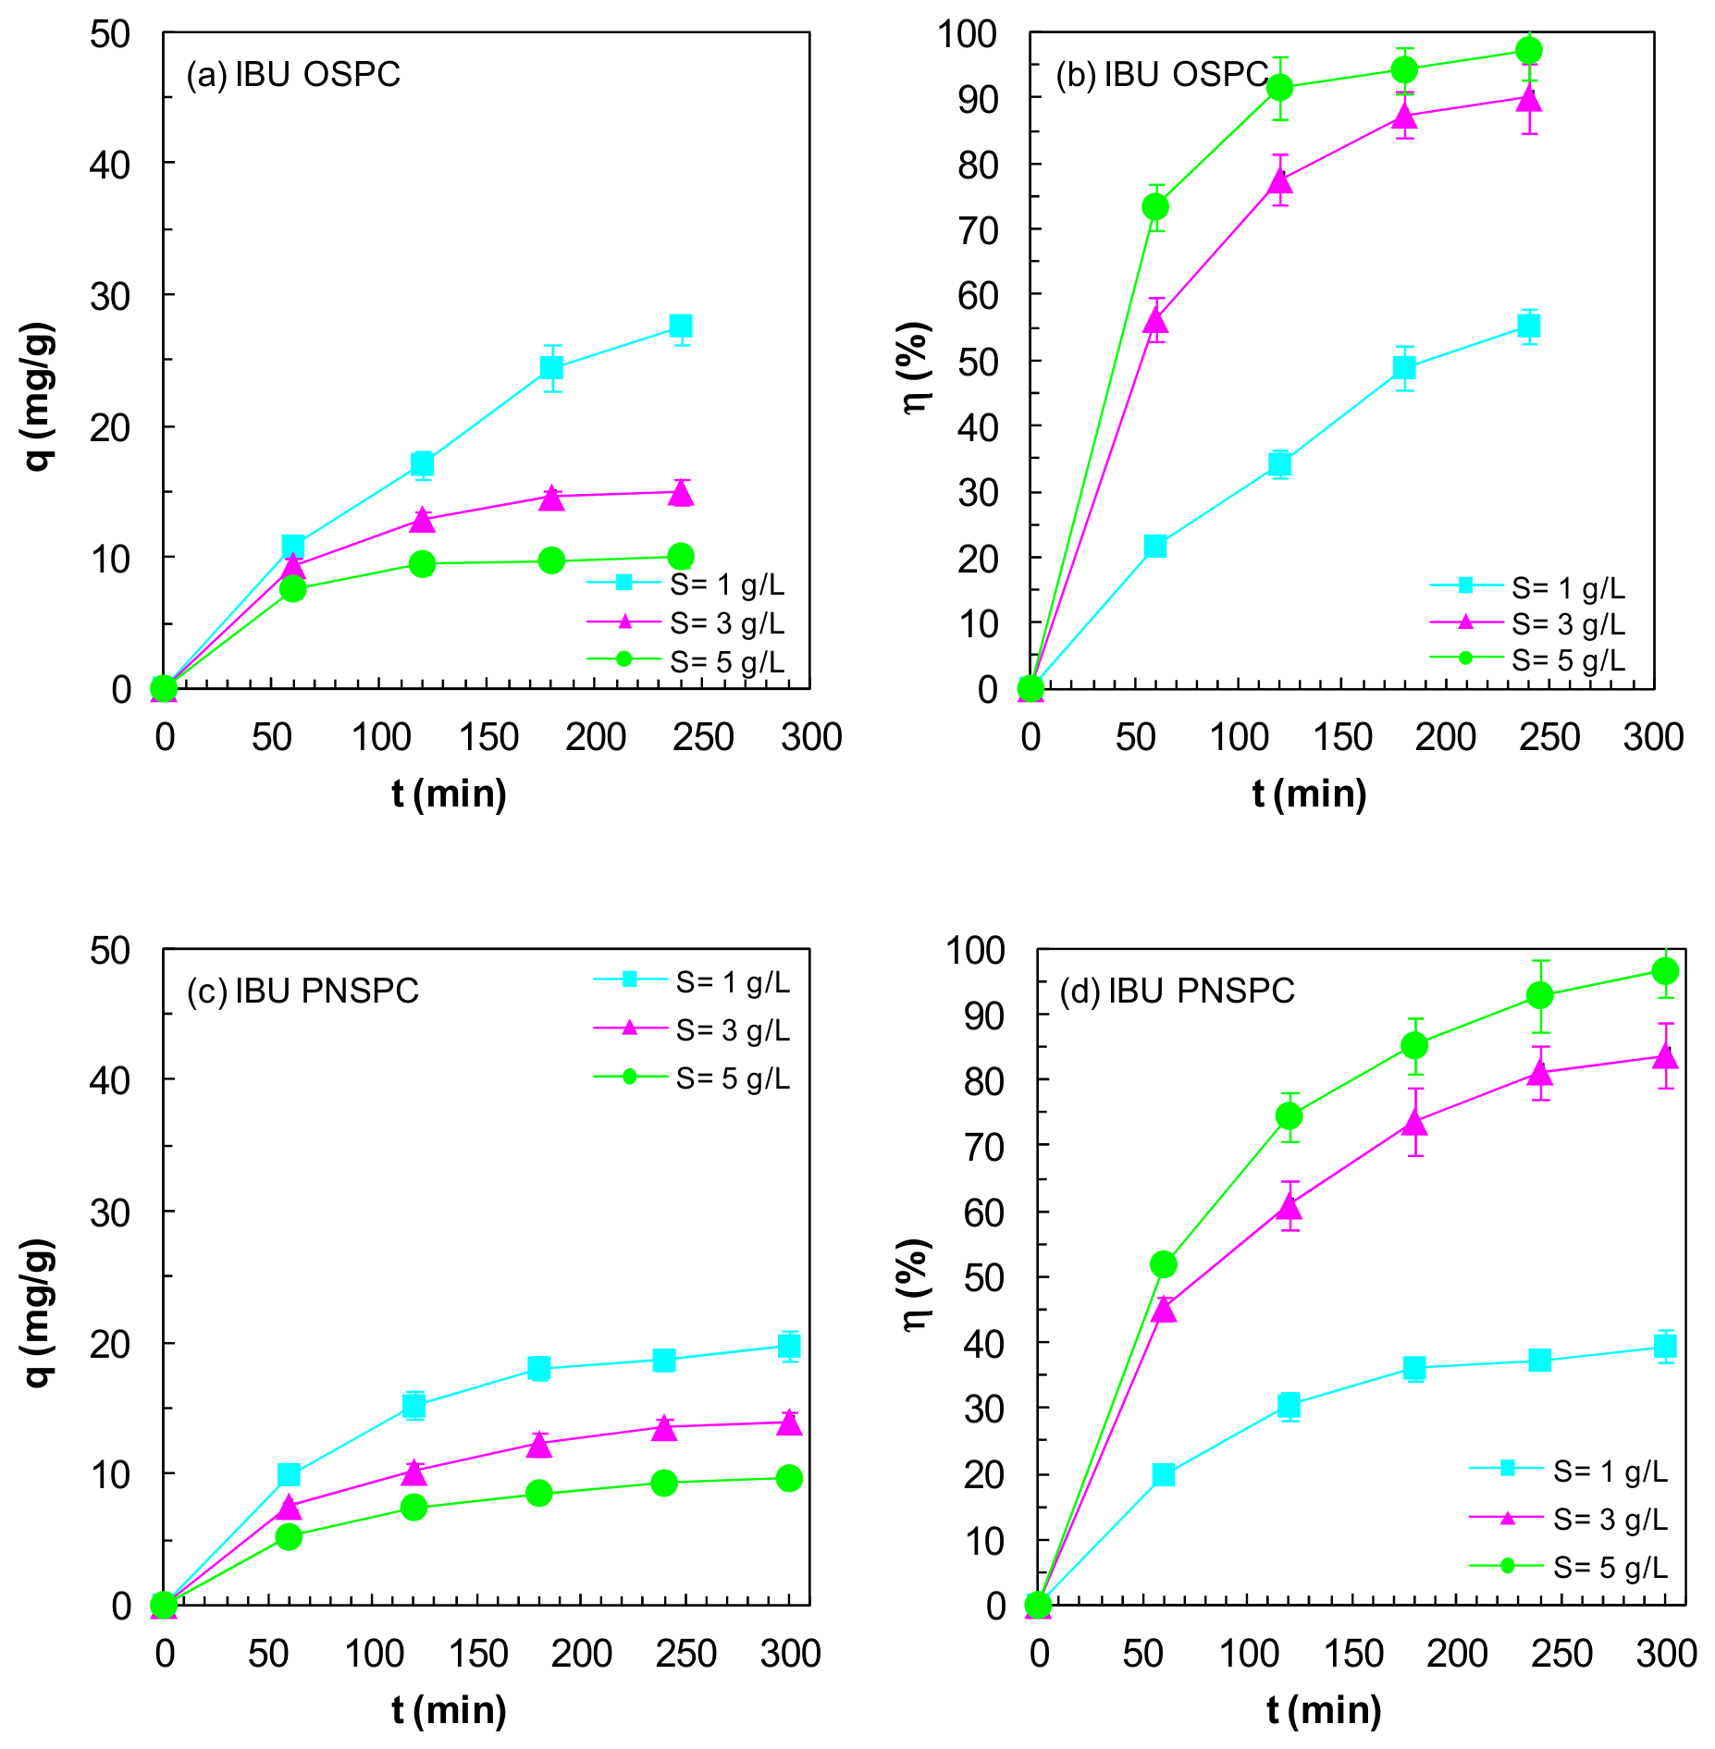
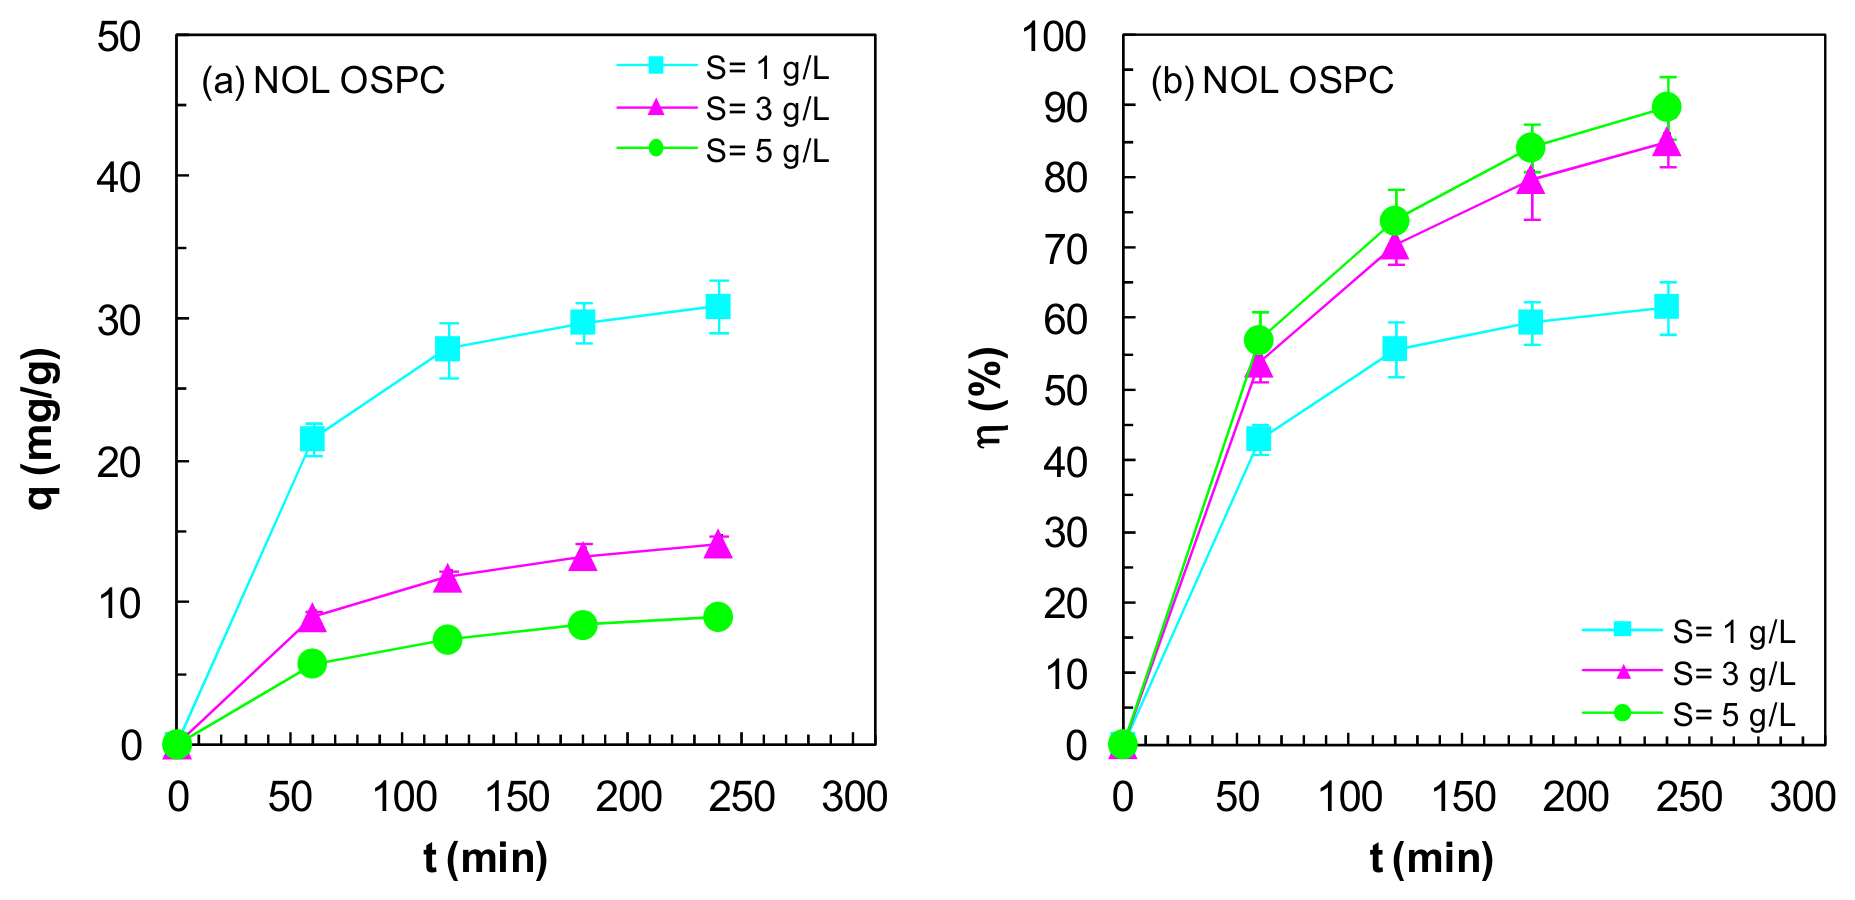
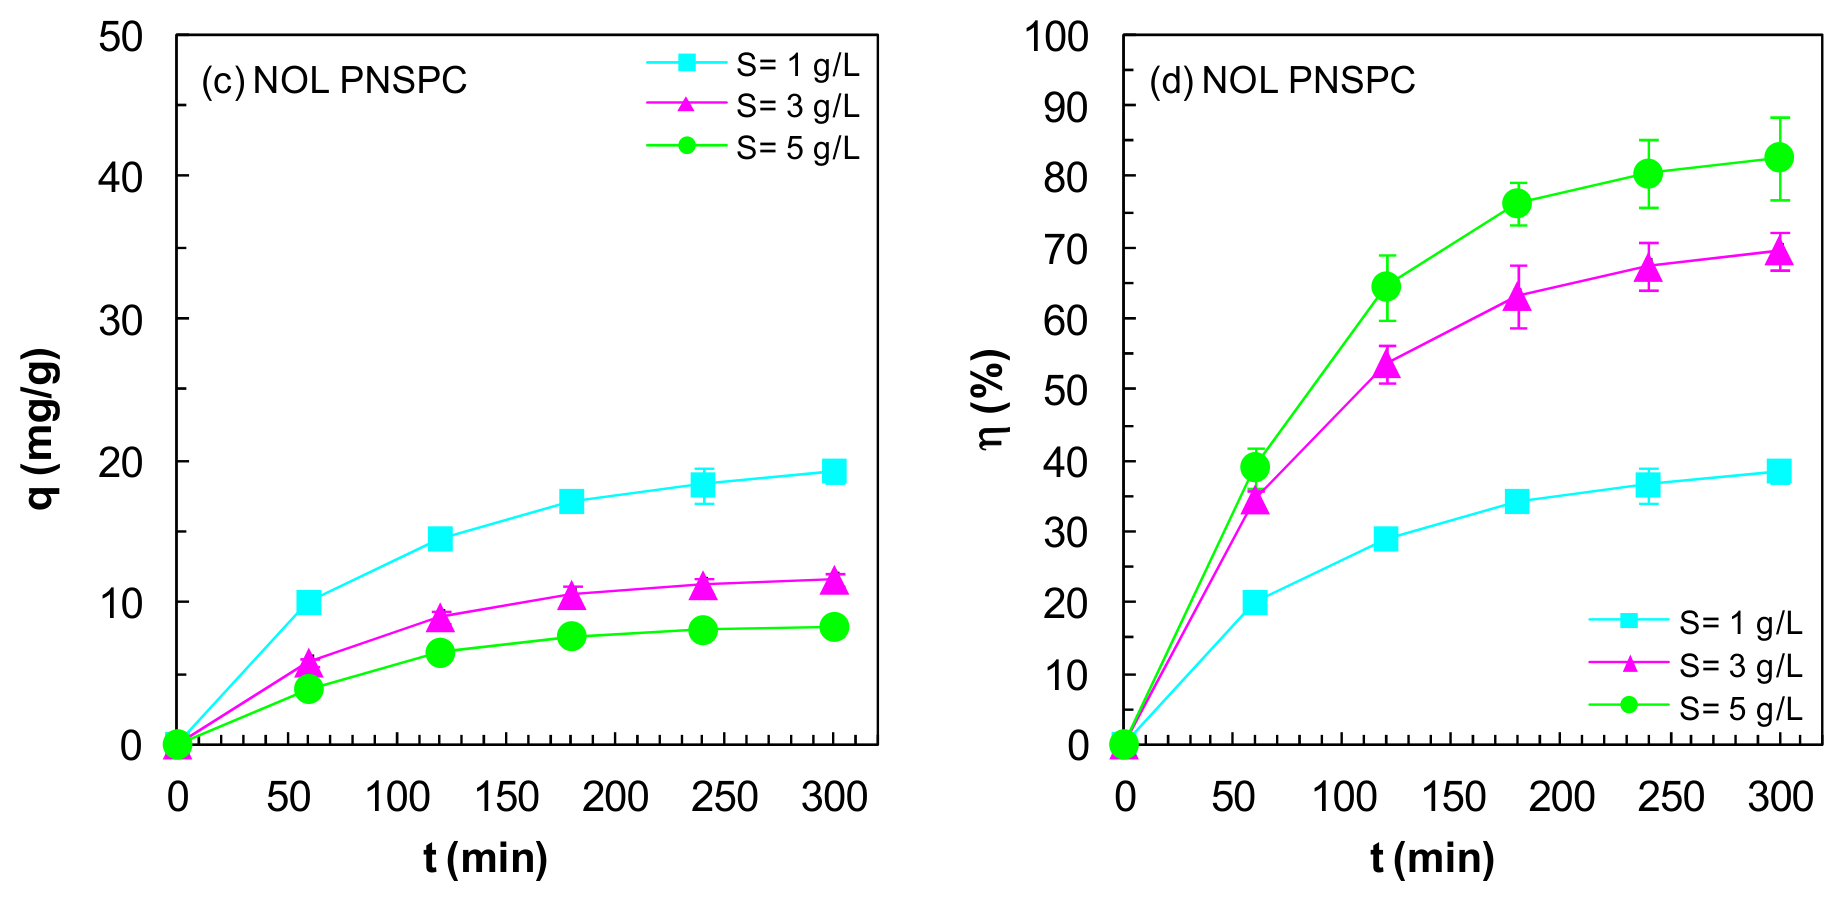
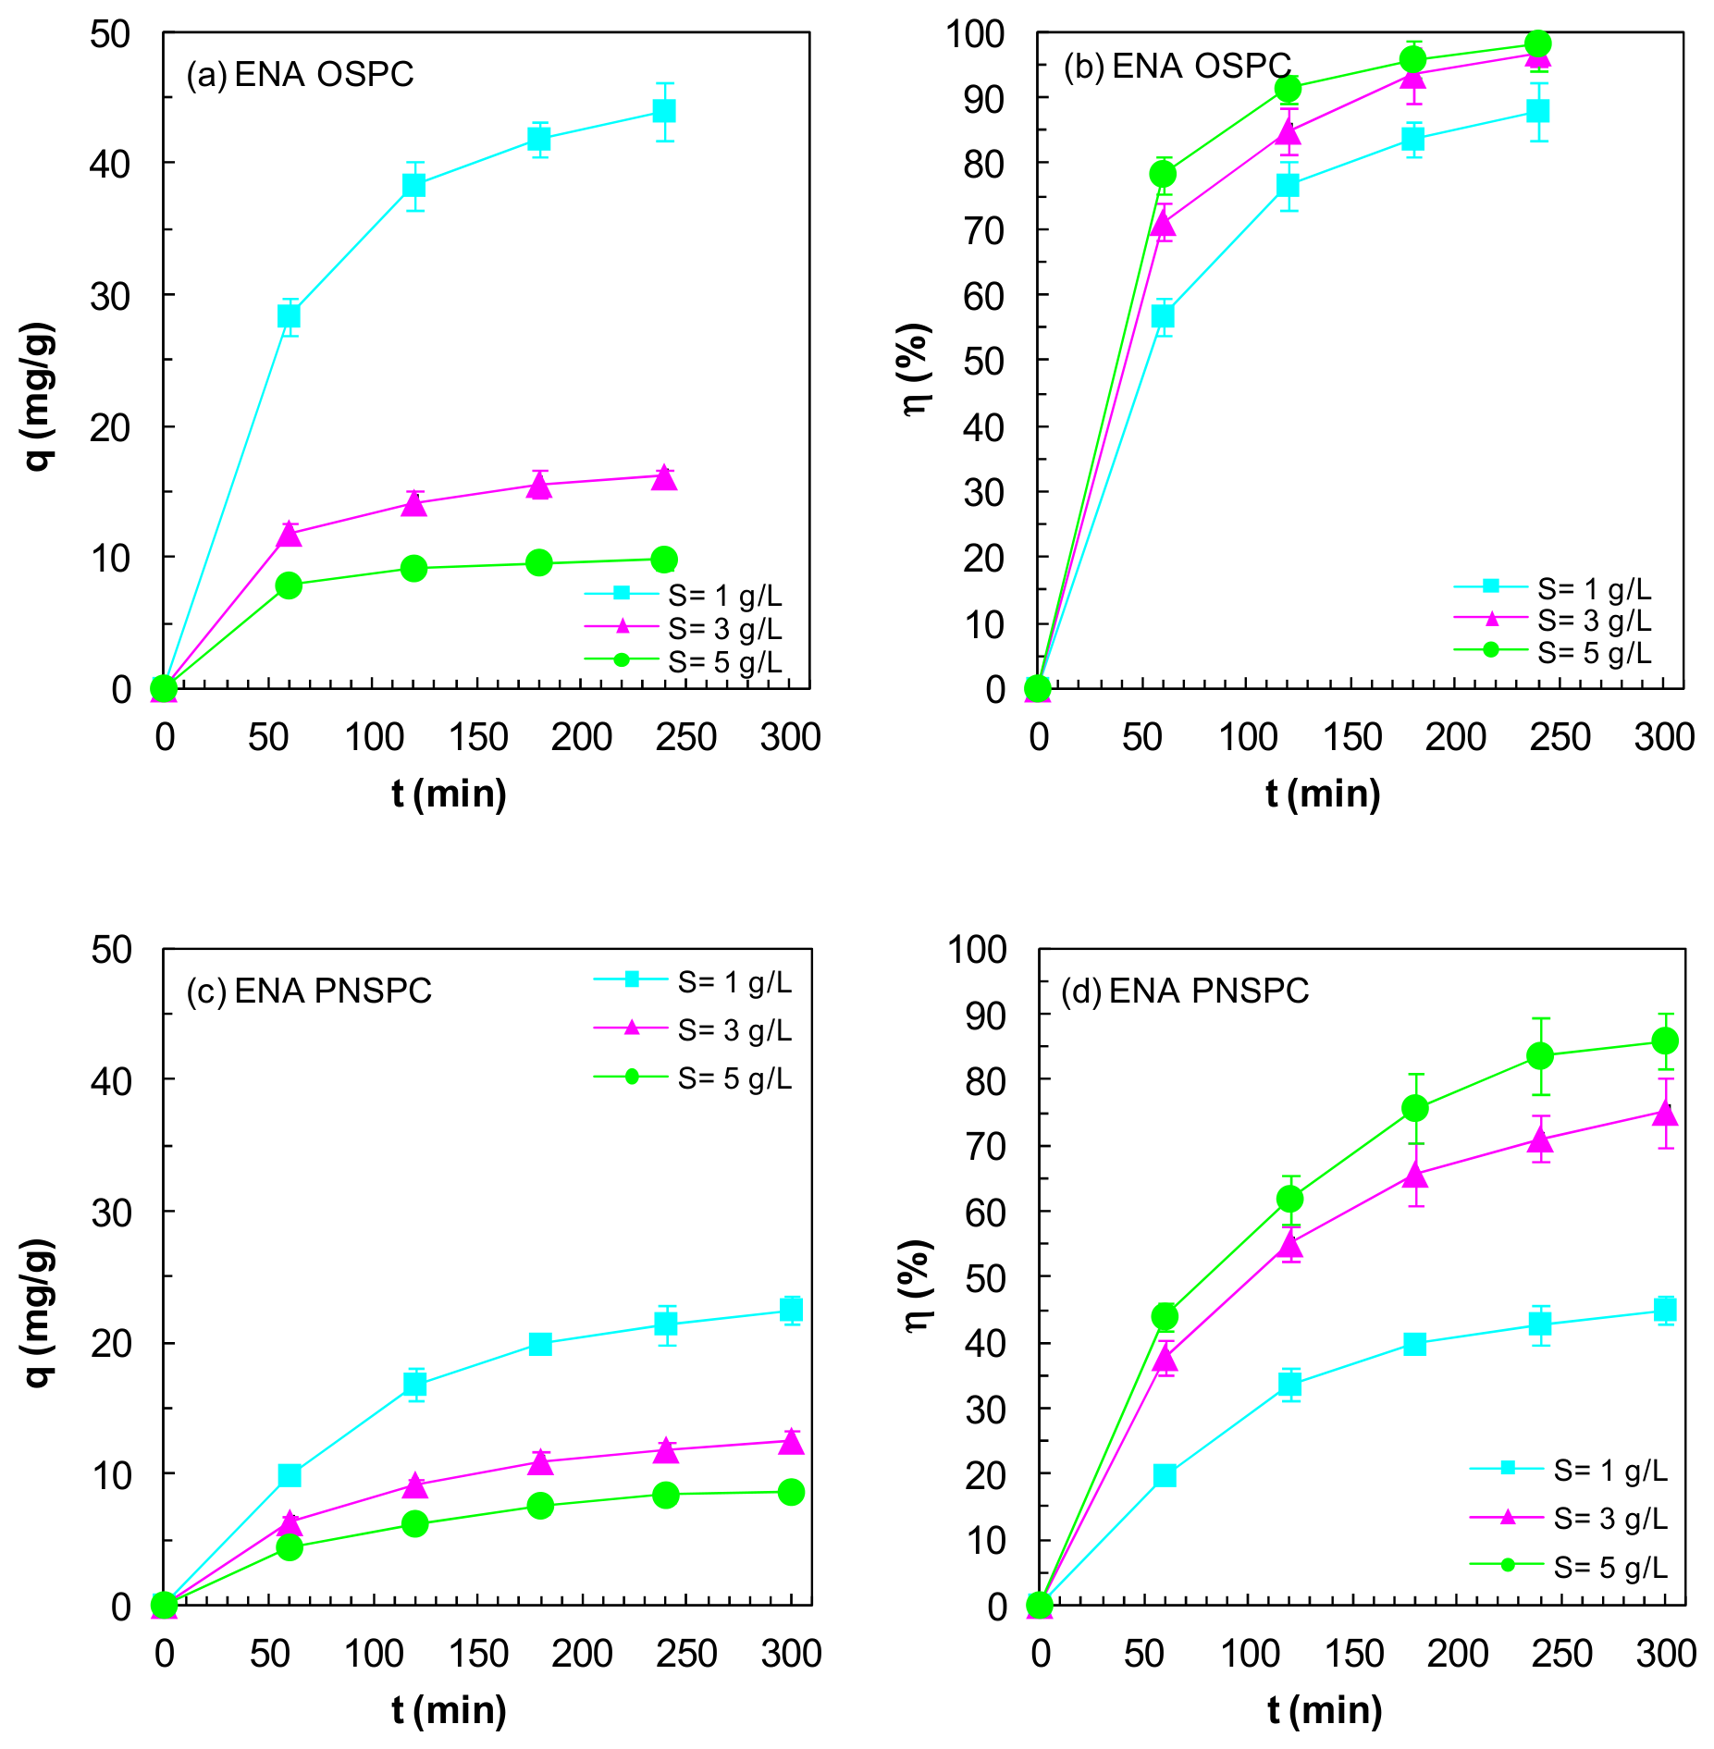
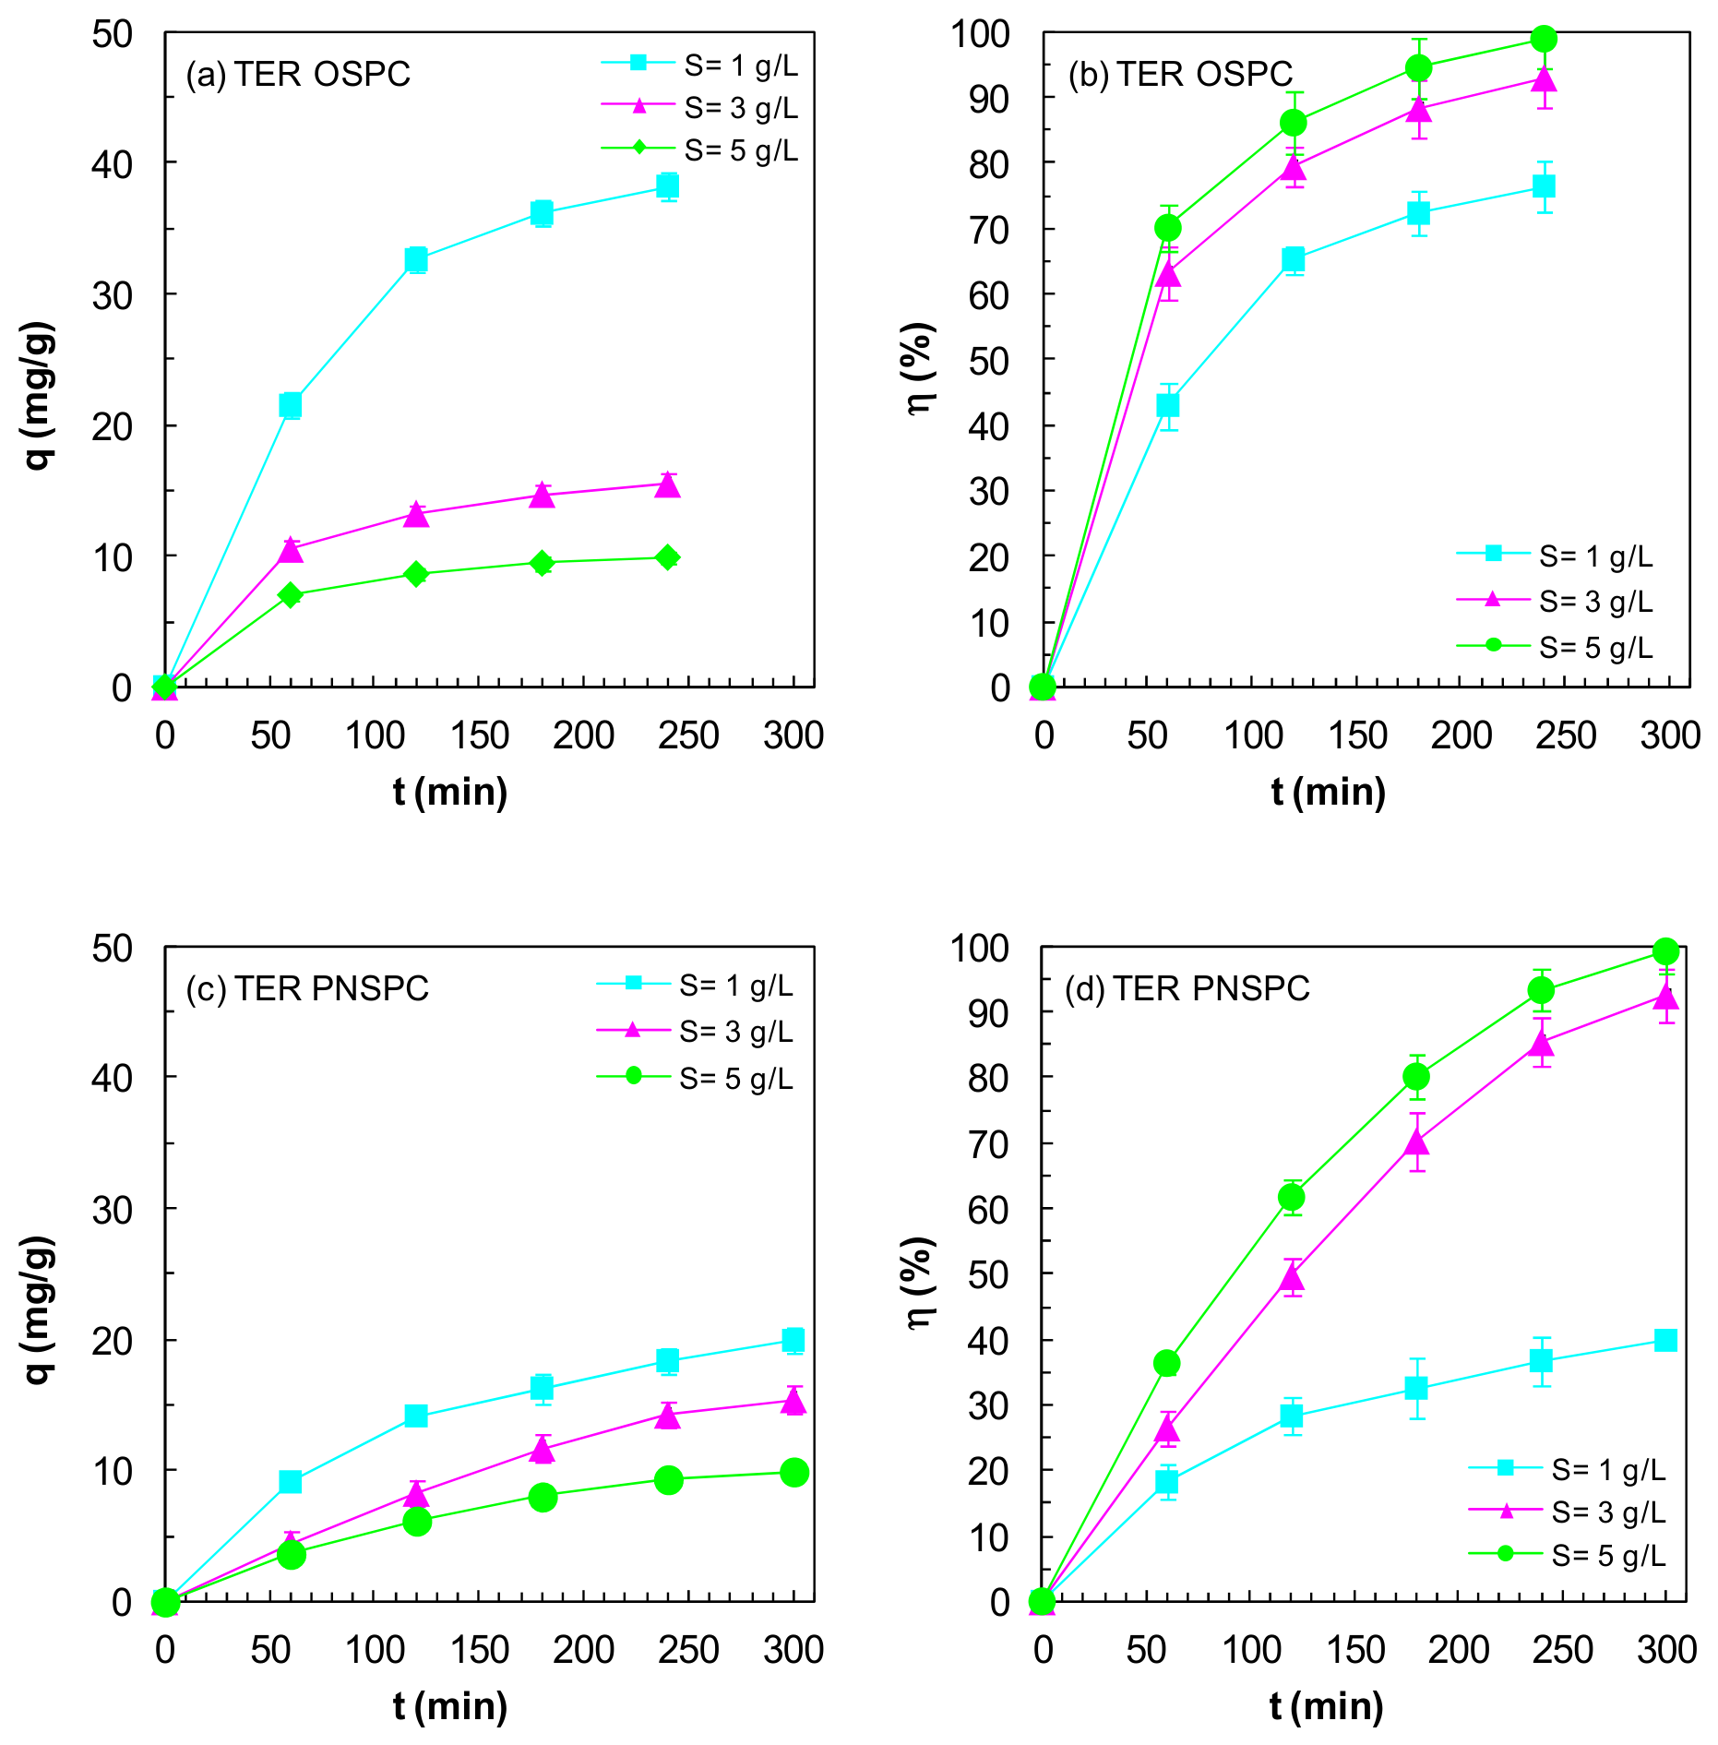
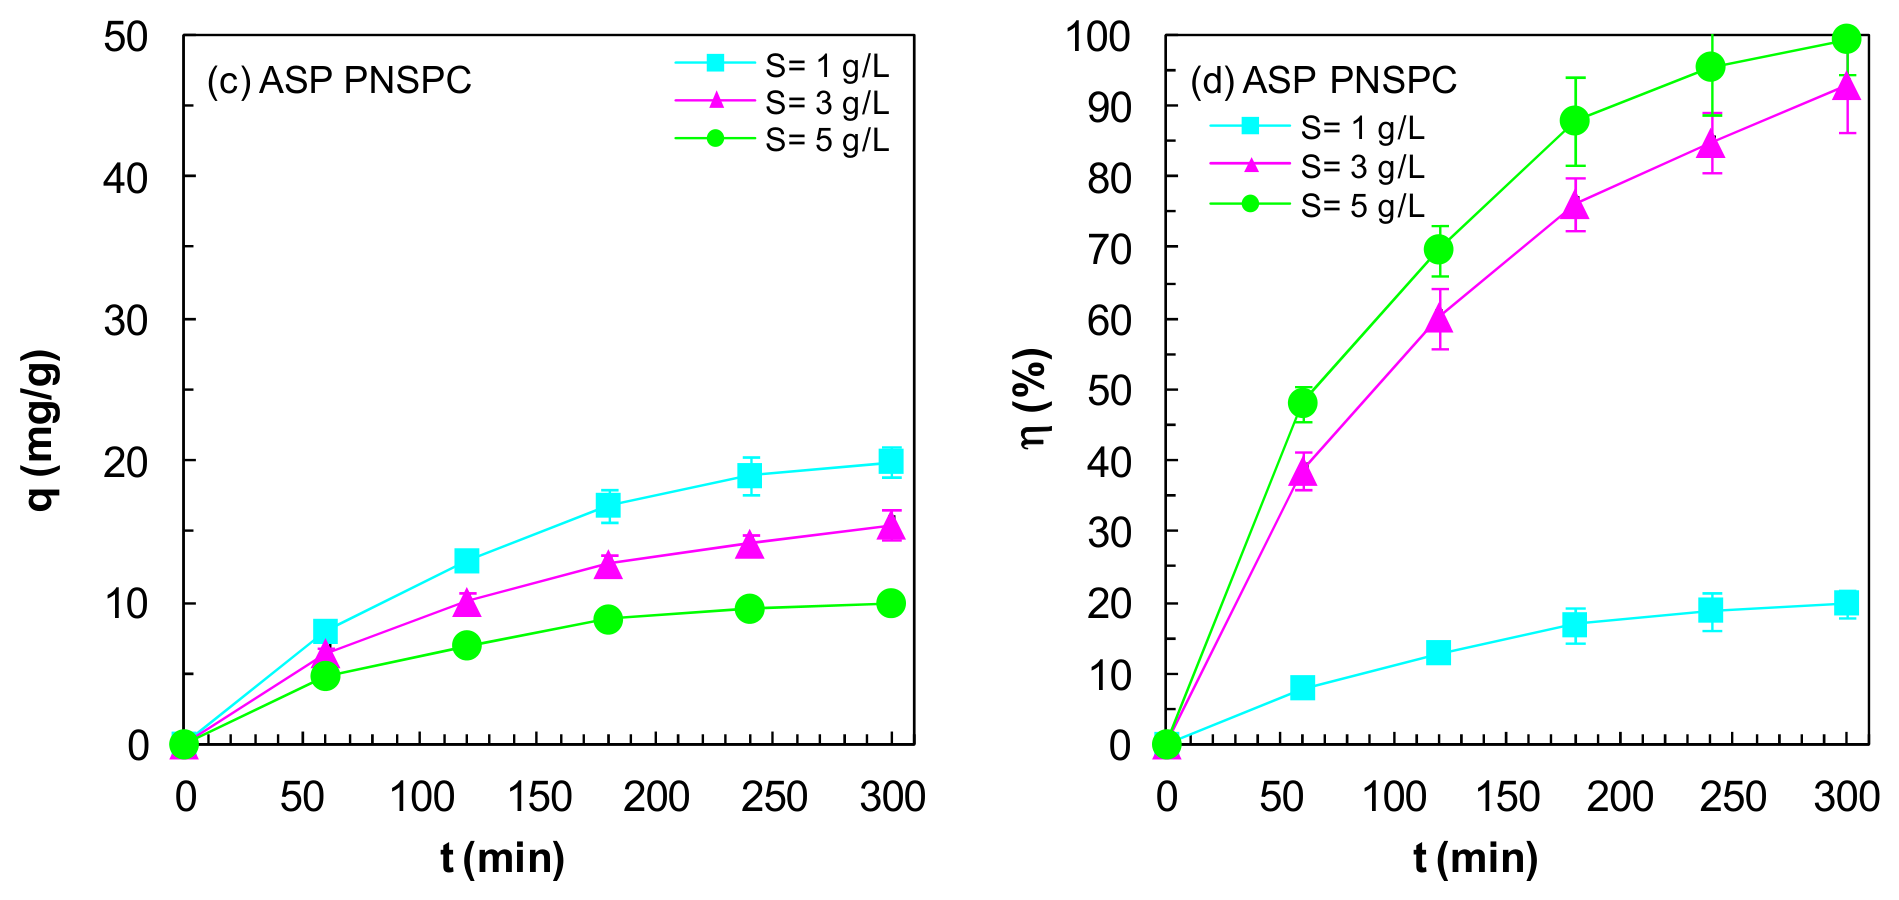
Figure 9, Figure 10, Figure 11, Figure 12, Figure 13 and Figure 14 present the temporal evolution of the mean adsorption capacity and adsorption efficiency of the six drugs on OSPC and PNSPC, without washing and at pH 2, at various adsorbent concentration values (1, 3, and 5 g/L OSPC and PNSPC) at an initial concentration of 50 mg/L. The maximum standard deviation from the mean of the three adsorption experiments was 0.87 mg/g.
These figures indicate that adsorption capacity follows the same trend in all six pharmaceuticals with both adsorbents. It increases sharply over time at the beginning and asymptotically as it approaches equilibrium.
The adsorption capacity at equilibrium decreases as the concentration of the adsorbent is increased, particularly from 1 to 3 g/L. The adsorption capacity is nearly four times higher at 1g/L than at 5 g/L when using OSPC, and two times higher when using PNPSC. This is because the quantity of adsorption sites is greater at higher adsorbent concentrations. The adsorption capacity for ENA of the OSPC adsorbent with a concentration of 1 g/L is greater than but very close to that for PAR; its PAR adsorption capacity is slightly higher than that for TER; its TER adsorption capacity is higher than that for NOL; and its NOL adsorption capacity is practically equal to that for ASP and slightly higher than that for IBU. In fact, the adsorption capacities for ENA, PAR, TER, NOL, ASP, IBU are 44 mg/g, 39.14 mg/g, 38.22 mg/g, 30.85 mg/g, 30.63 mg/g, and 28.62 mg/g, respectively. These results are consistent with our finding that OSPC has superior characteristics to PNSPC, including a greater surface area (1535 m2 g−1 vs. 1076 m2 g−1), a greater pore volume (0.854342 cm3 g−1 vs. 0.433962 cm3 g−1) and a greater mean pore diameter (2.2264 nm vs. 1.6126 nm). Regarding molecular size, there was no significant difference in adsorption capacity between molecules of different sizes. Since the characteristics of olive stone biocarbon are exceptional, it is prioritized with respect to molecular size.
Regarding the adsorption capacity of the OSPC and PNSPC adsorbents, the adsorption capacity of OSPC is higher than that of PNSPC in all cases studied. The adsorption capacity of OSPC for ENA, PAR, and TER is double that of PNSPC at an adsorbent concentration of 1 g/L. At an adsorbent concentration of 3 g/L, the adsorption capacity of OSPC is approximately 25% greater than that of PNSPC, and practically the same values are obtained for OSPC and PNSPC at a concentration of 5 g/L. The adsorption capacity of OSPC is 40–50% greater than that of PNSPC for IBU, NOL, and ASP, with an adsorbent concentration of 1 g/L; between 10 and 20% greater for an adsorbent concentration of 3 g/L; and practically the same for an adsorbent concentration of 5 g/L.
The adsorption efficiency was over 80% at OSPC and PNSPC concentrations of 3 and 5 g/L. For the OSPC adsorbent, the adsorption efficiency was almost 100% at 5 g/L and over 90% at 3 g/L, except for NOL, whereas for PNSPC, the efficiency was about 11% lower. In addition, the time required to achieve equilibrium and maximum efficiency was 20% shorter for OSPC (240 min) than for PNSPC (300 min).

3.4.3. Effect of the Initial Adsorbate Concentration

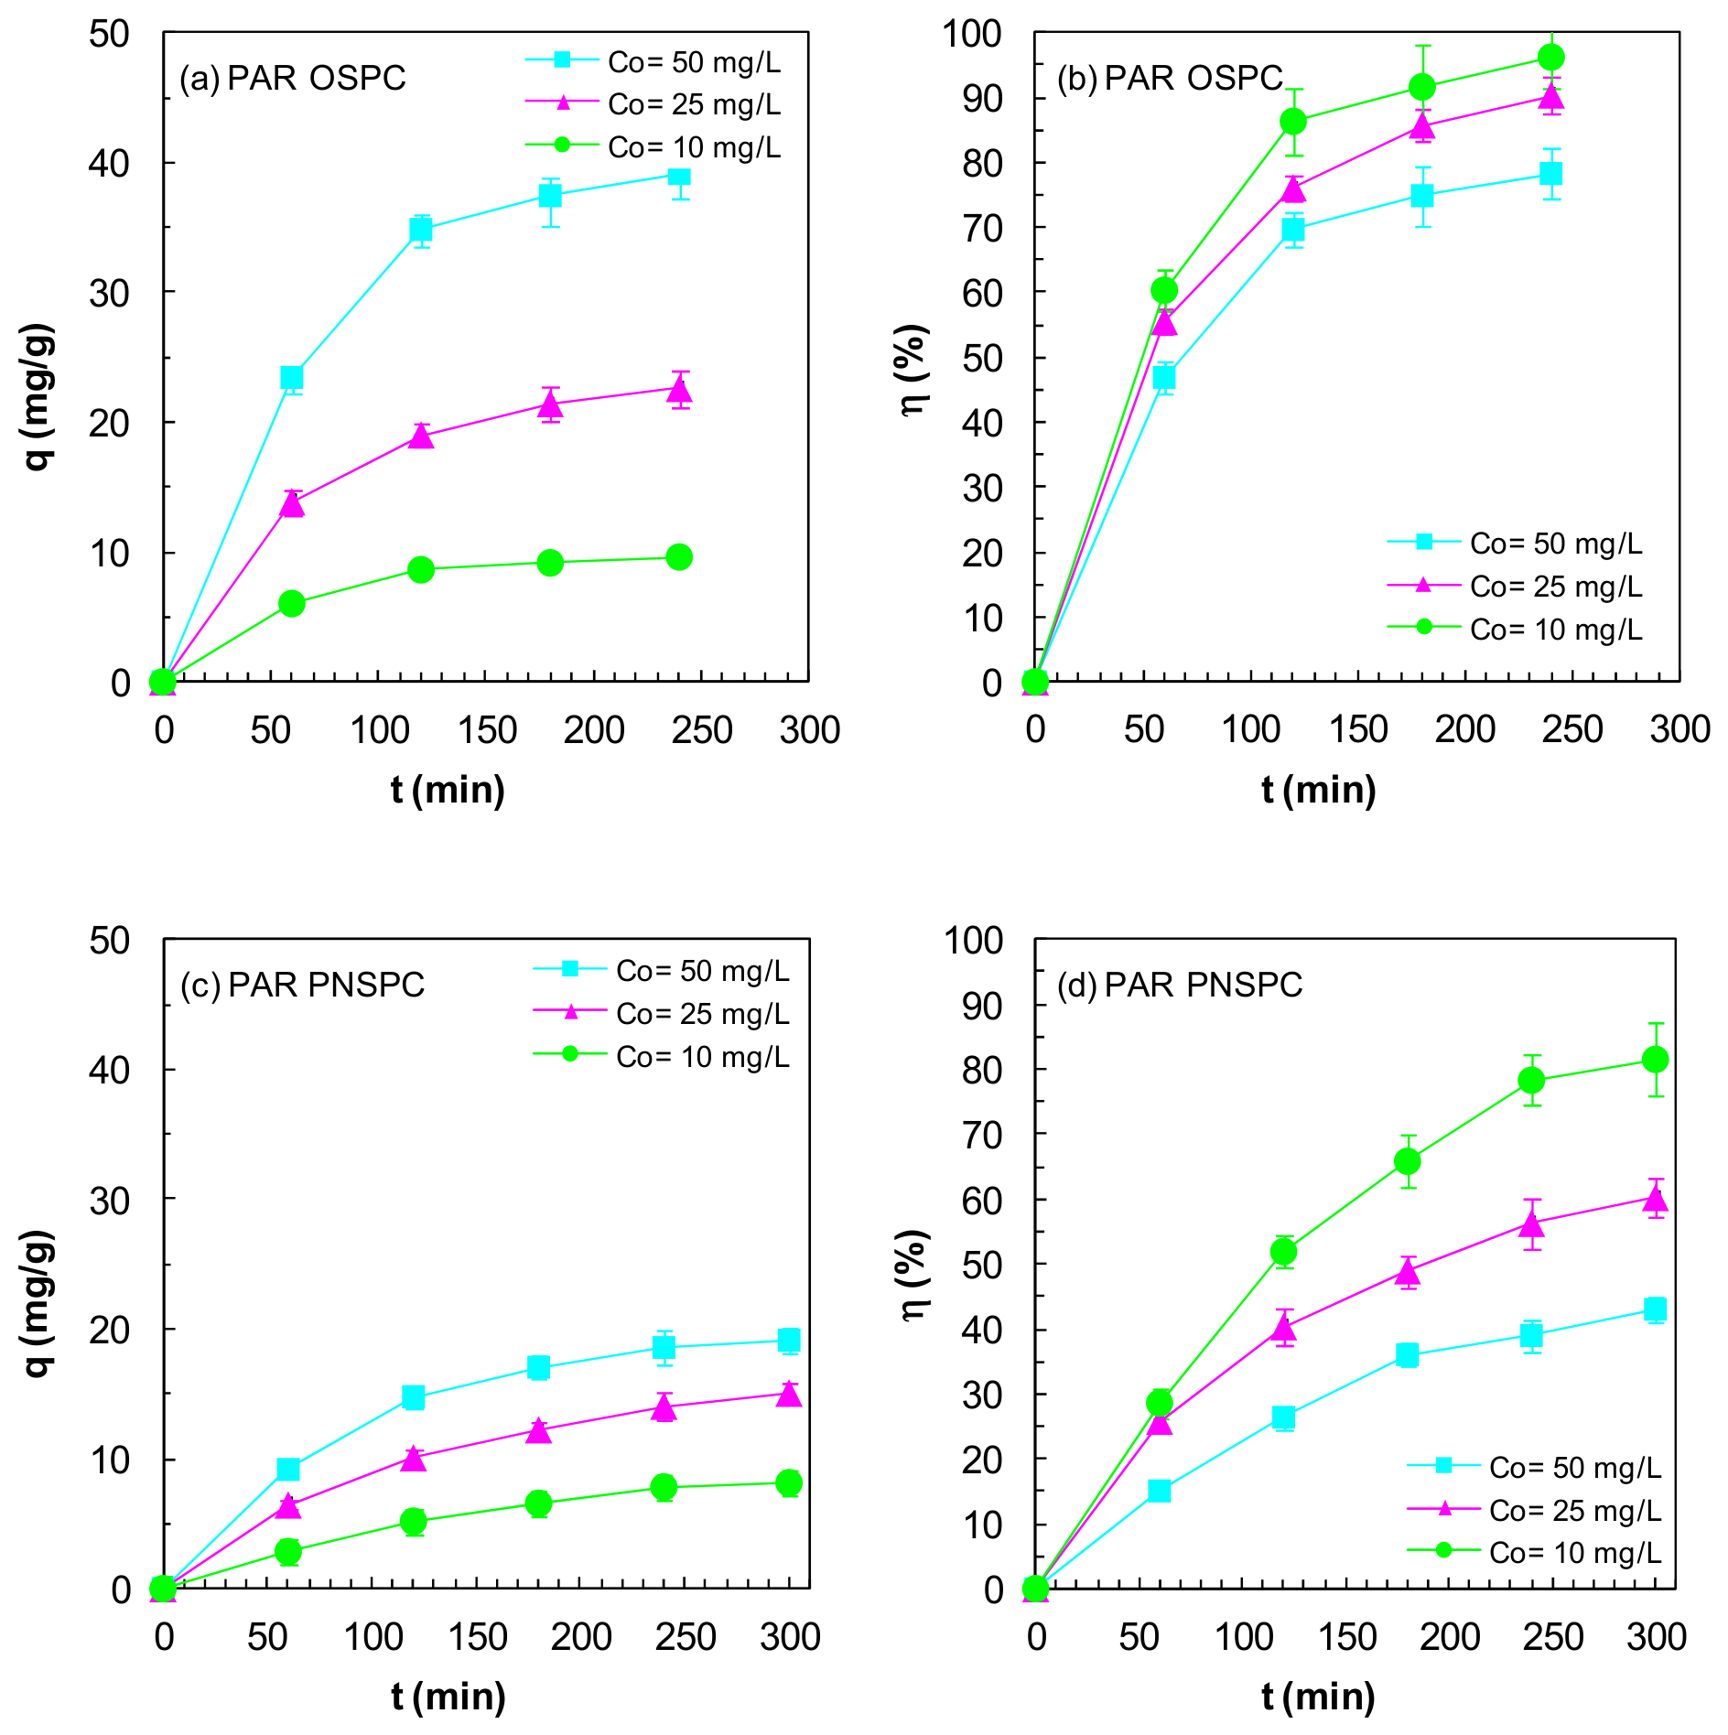
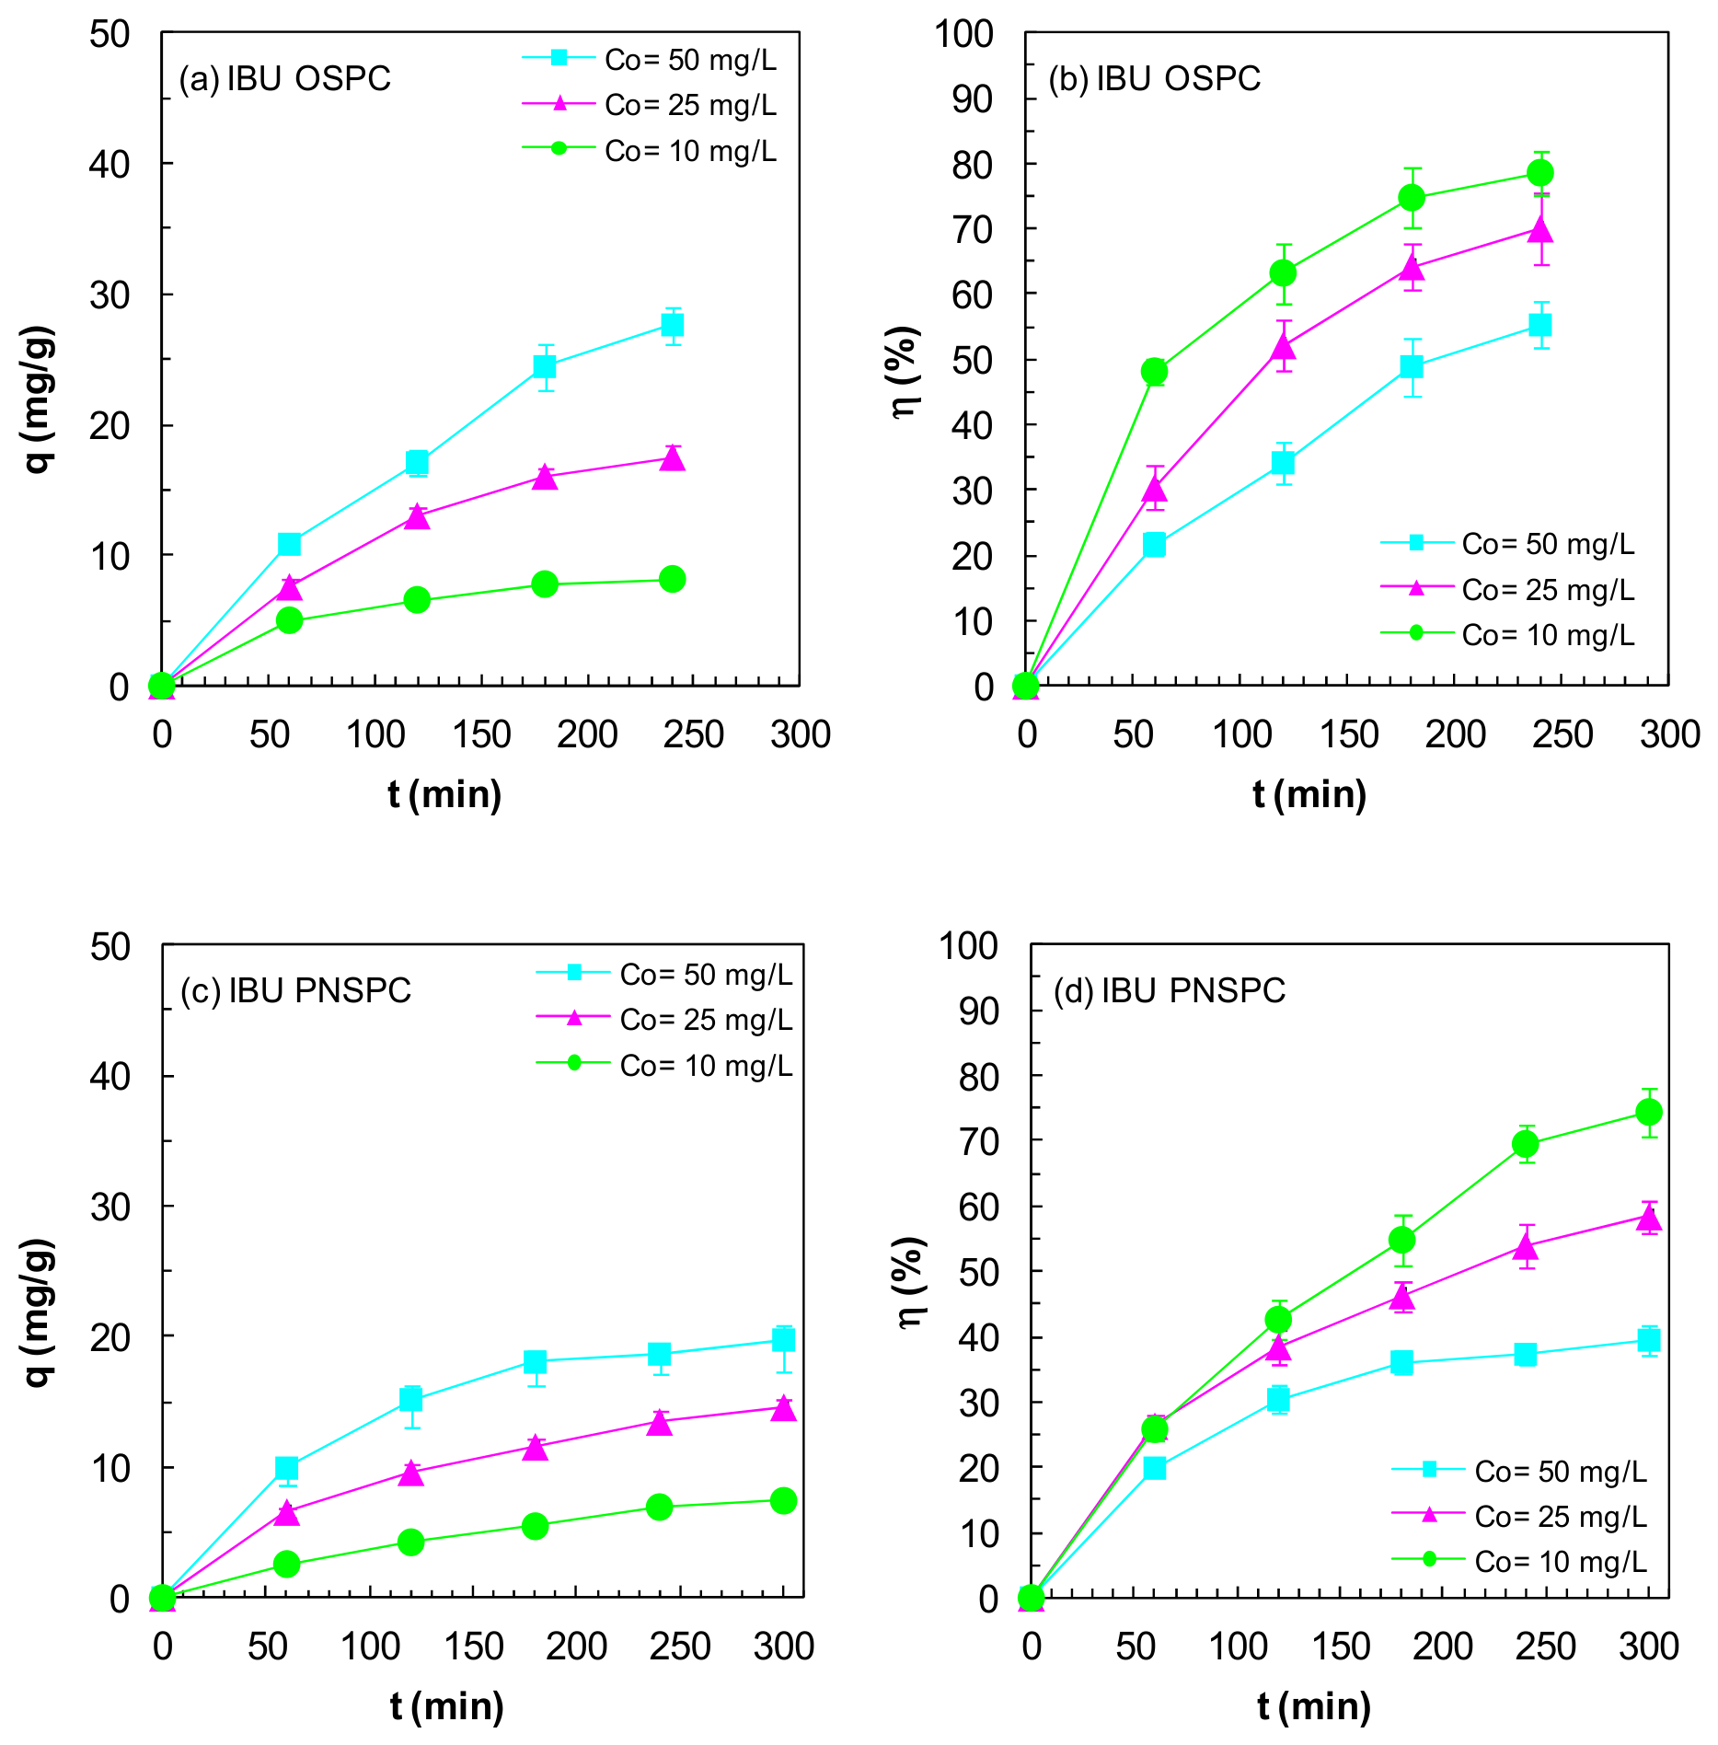
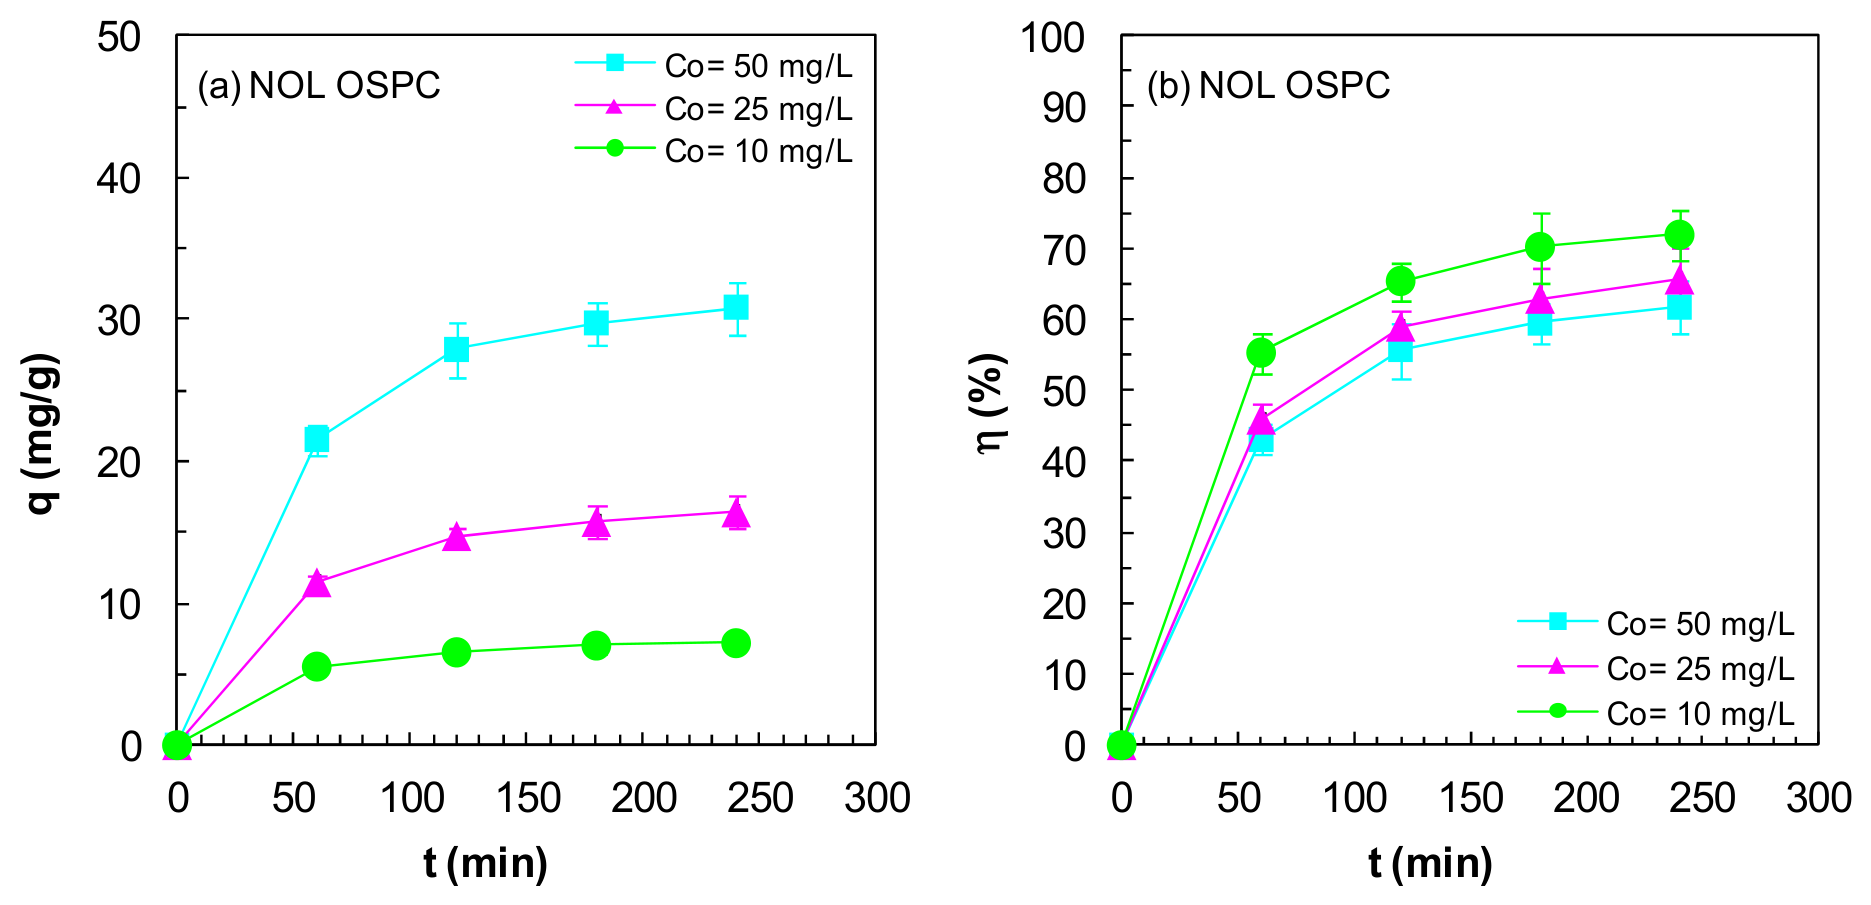
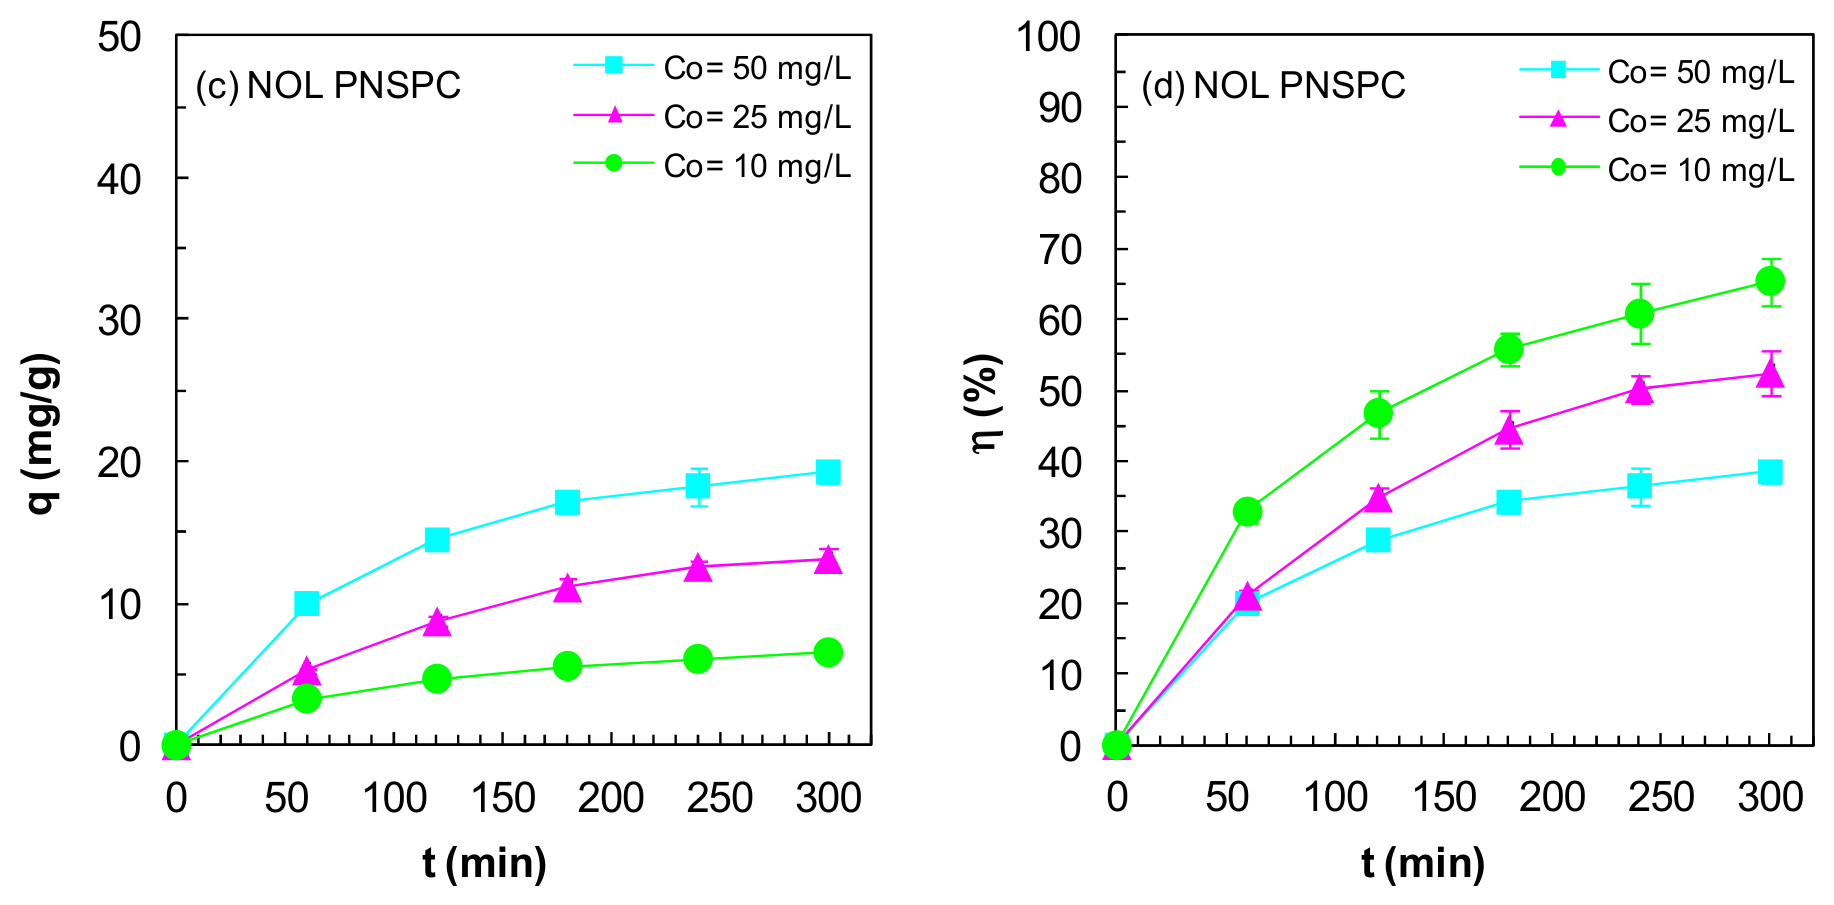
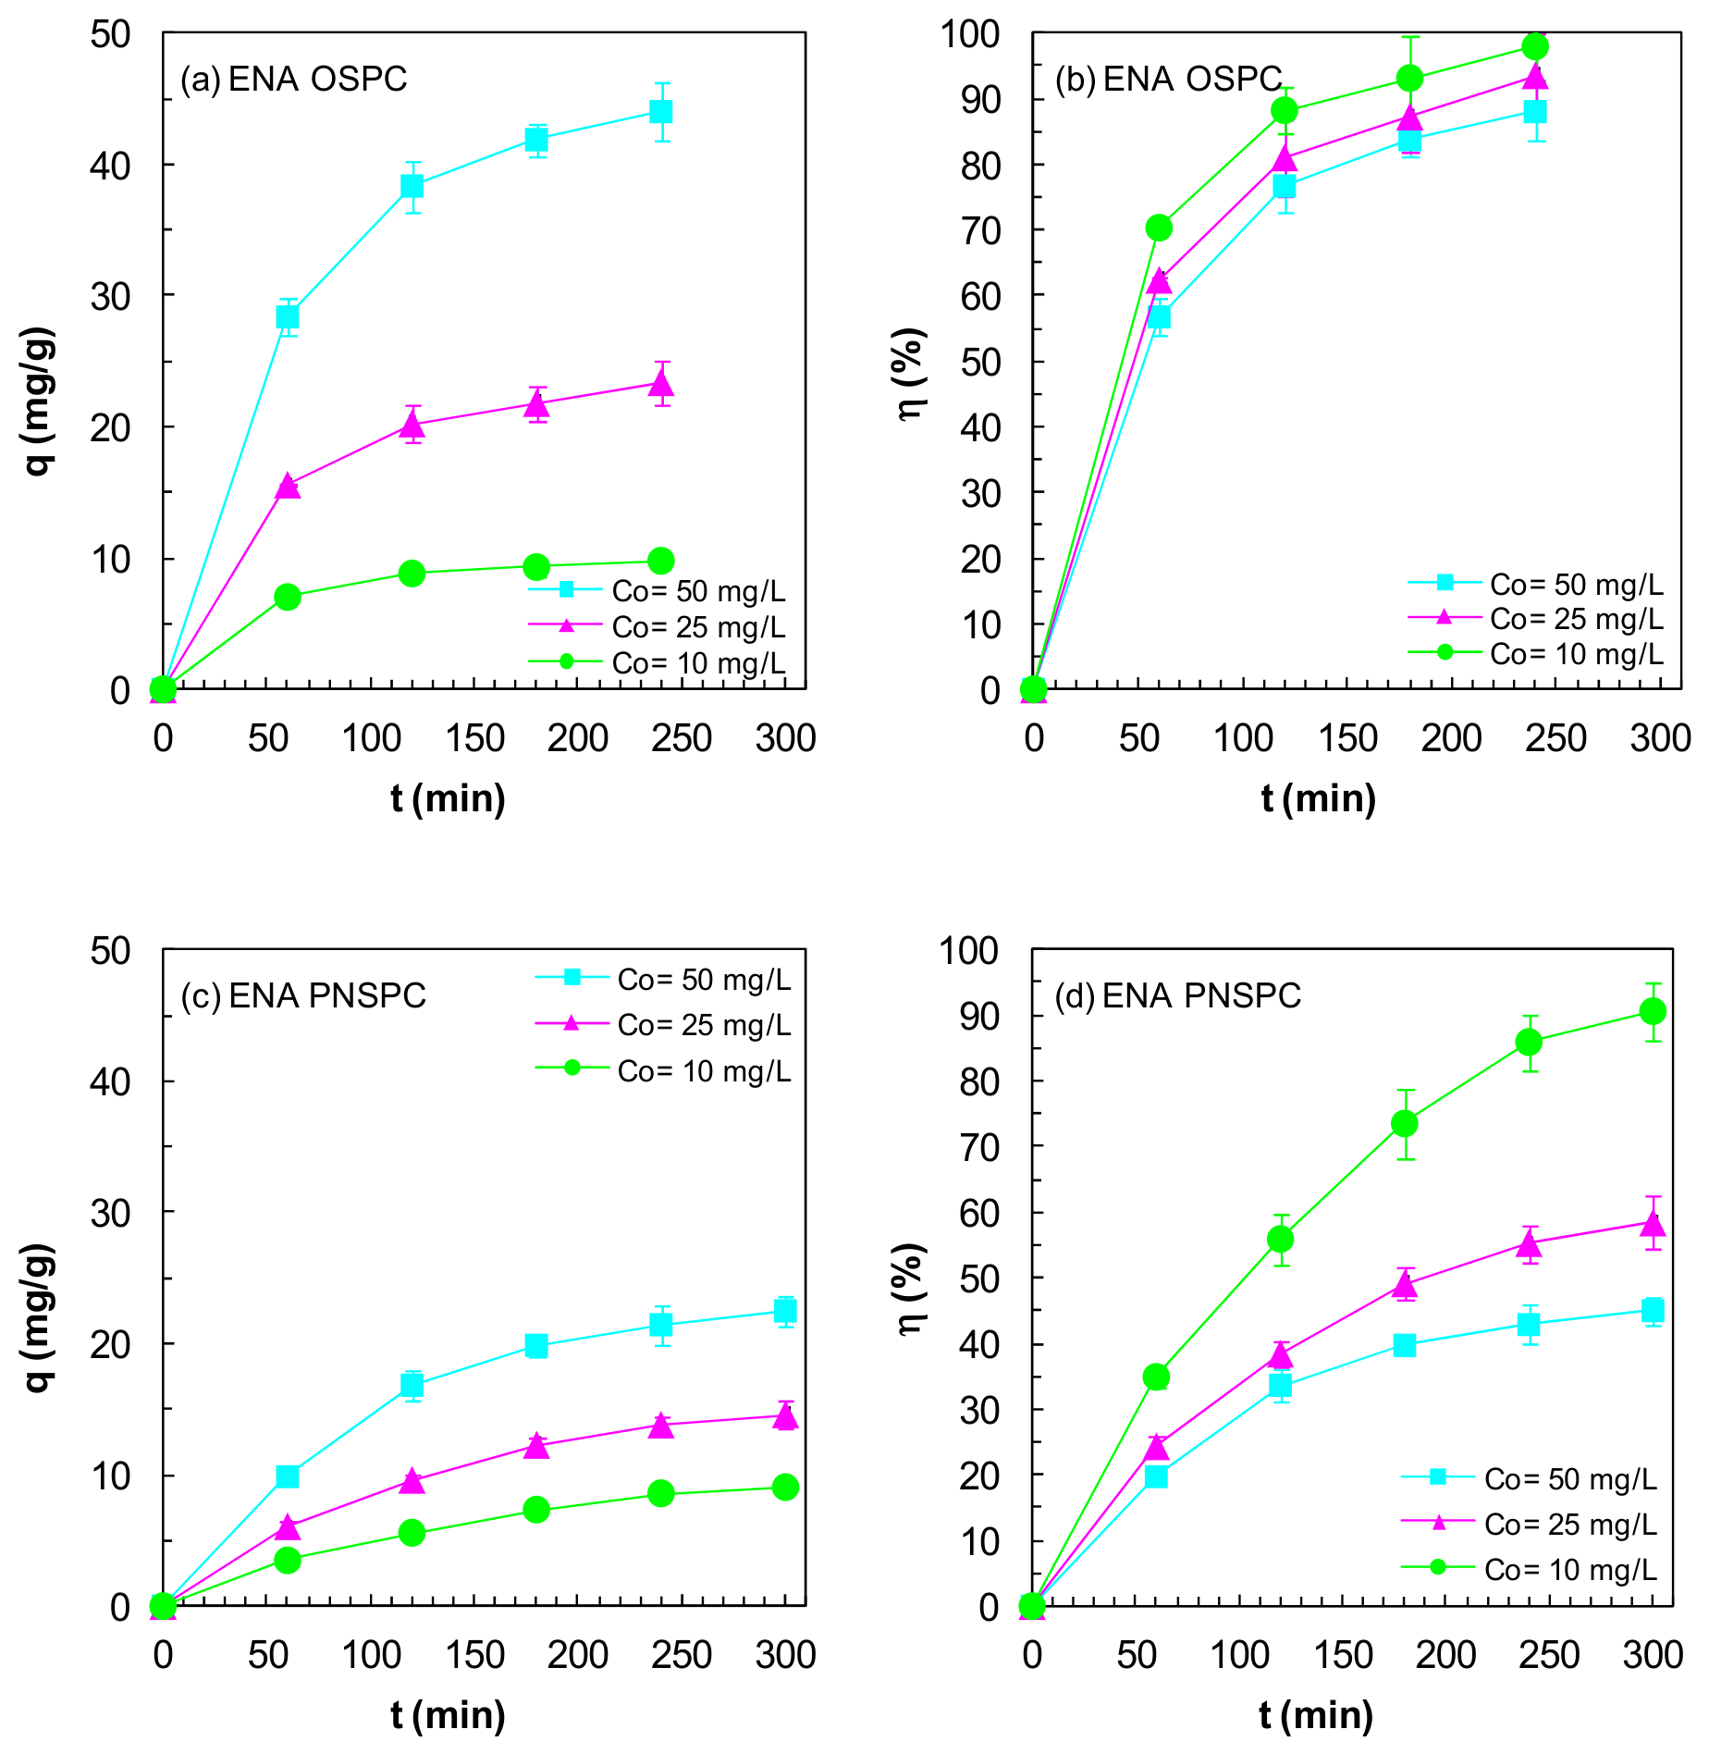
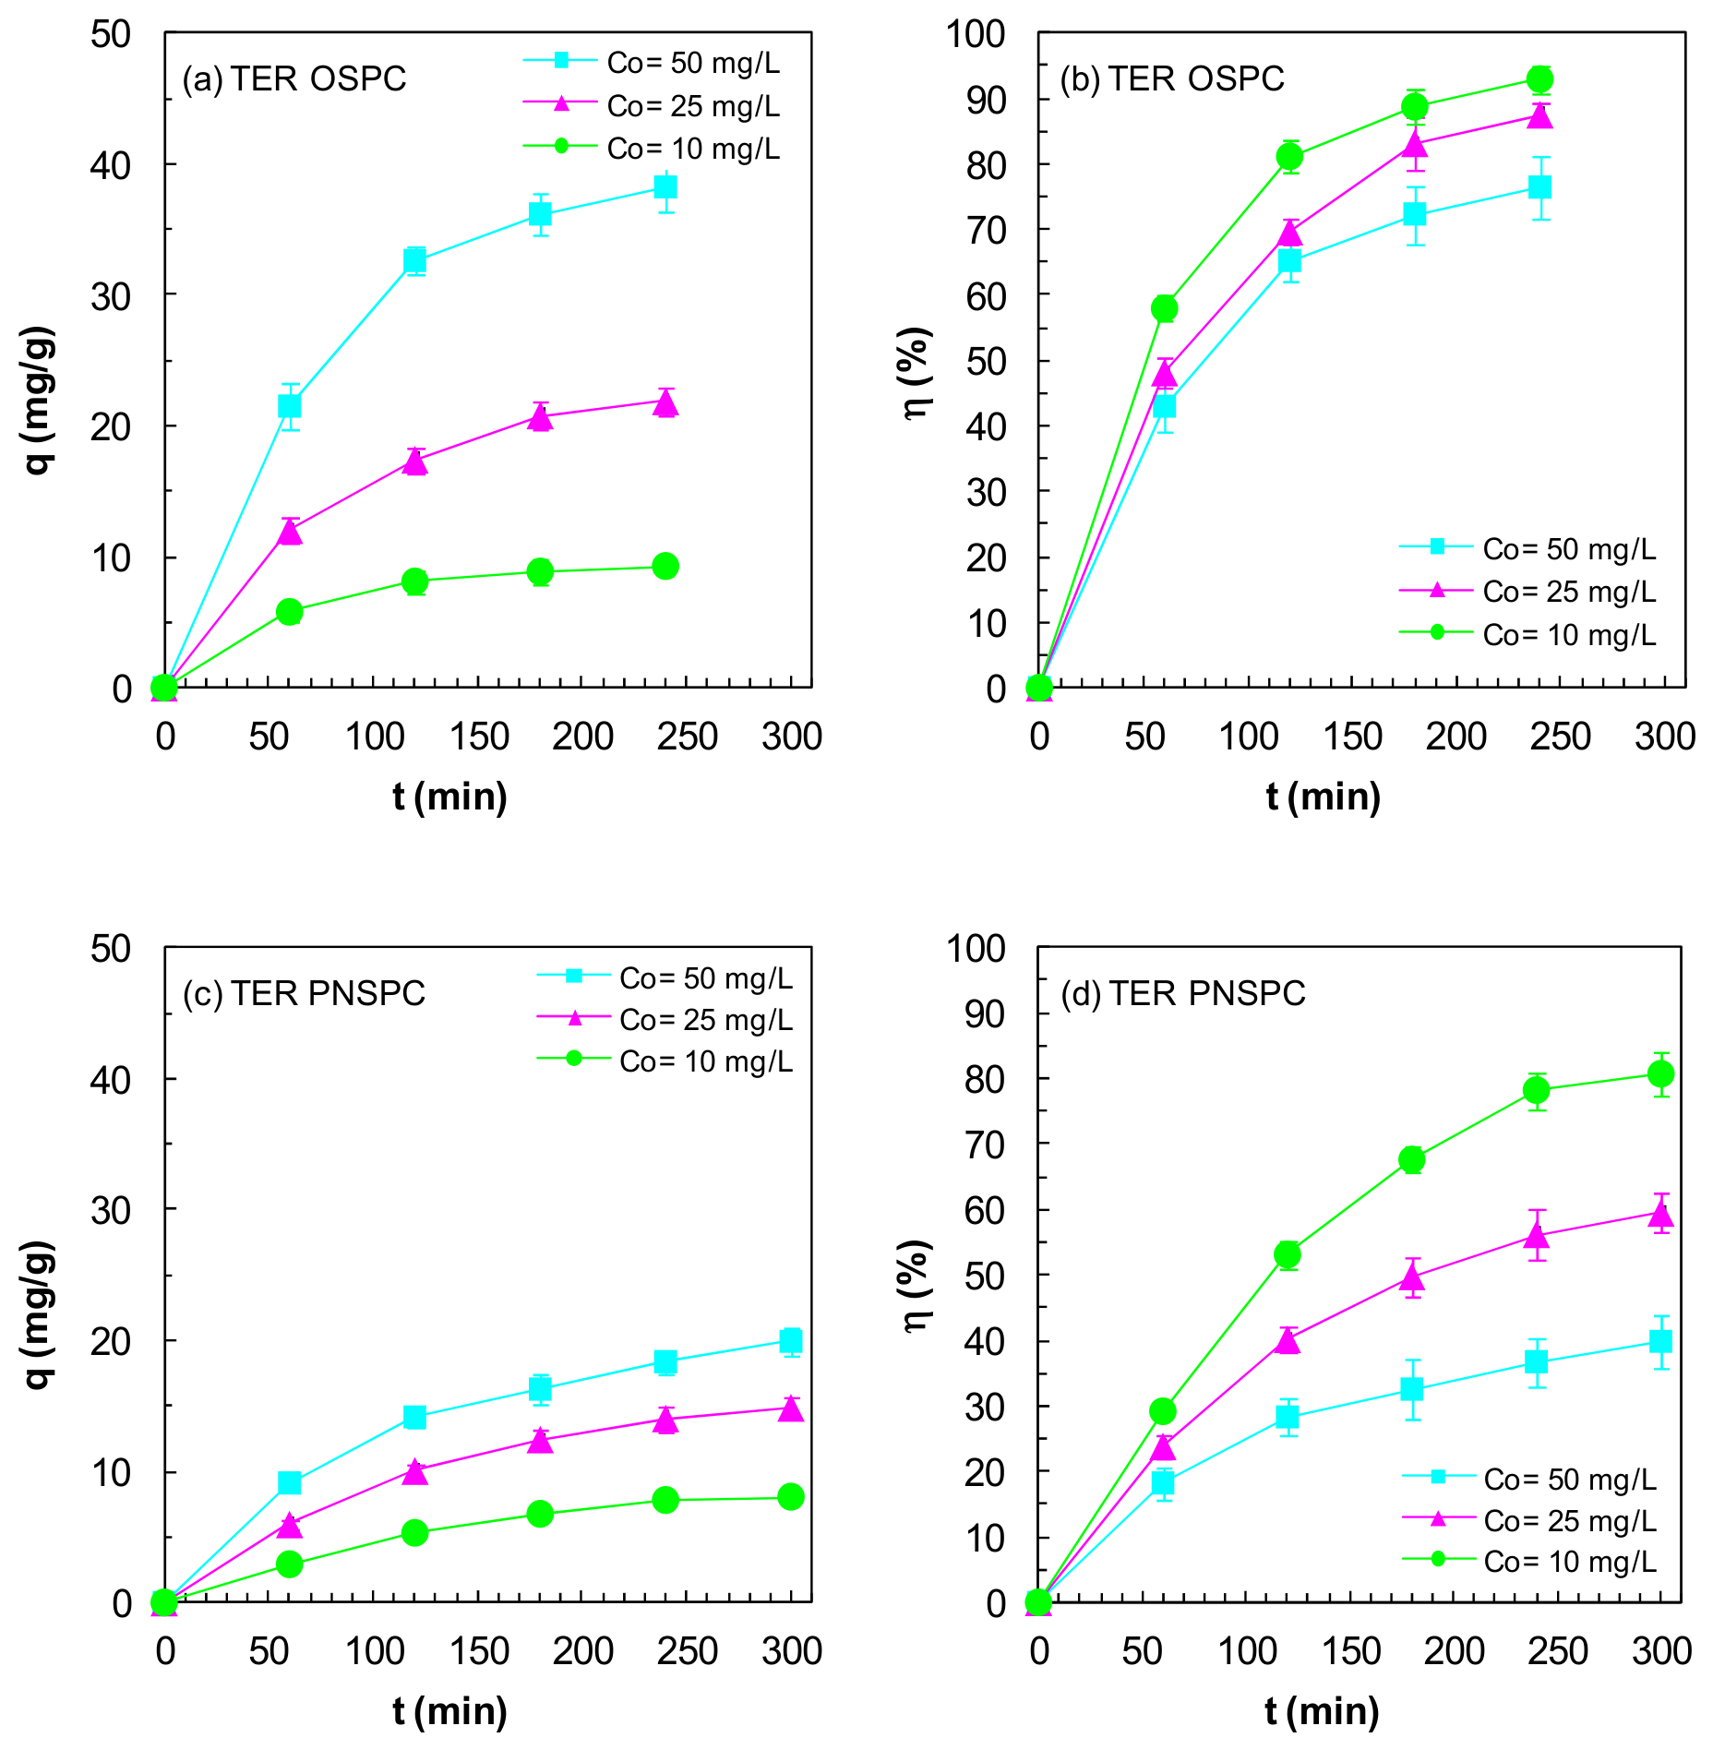
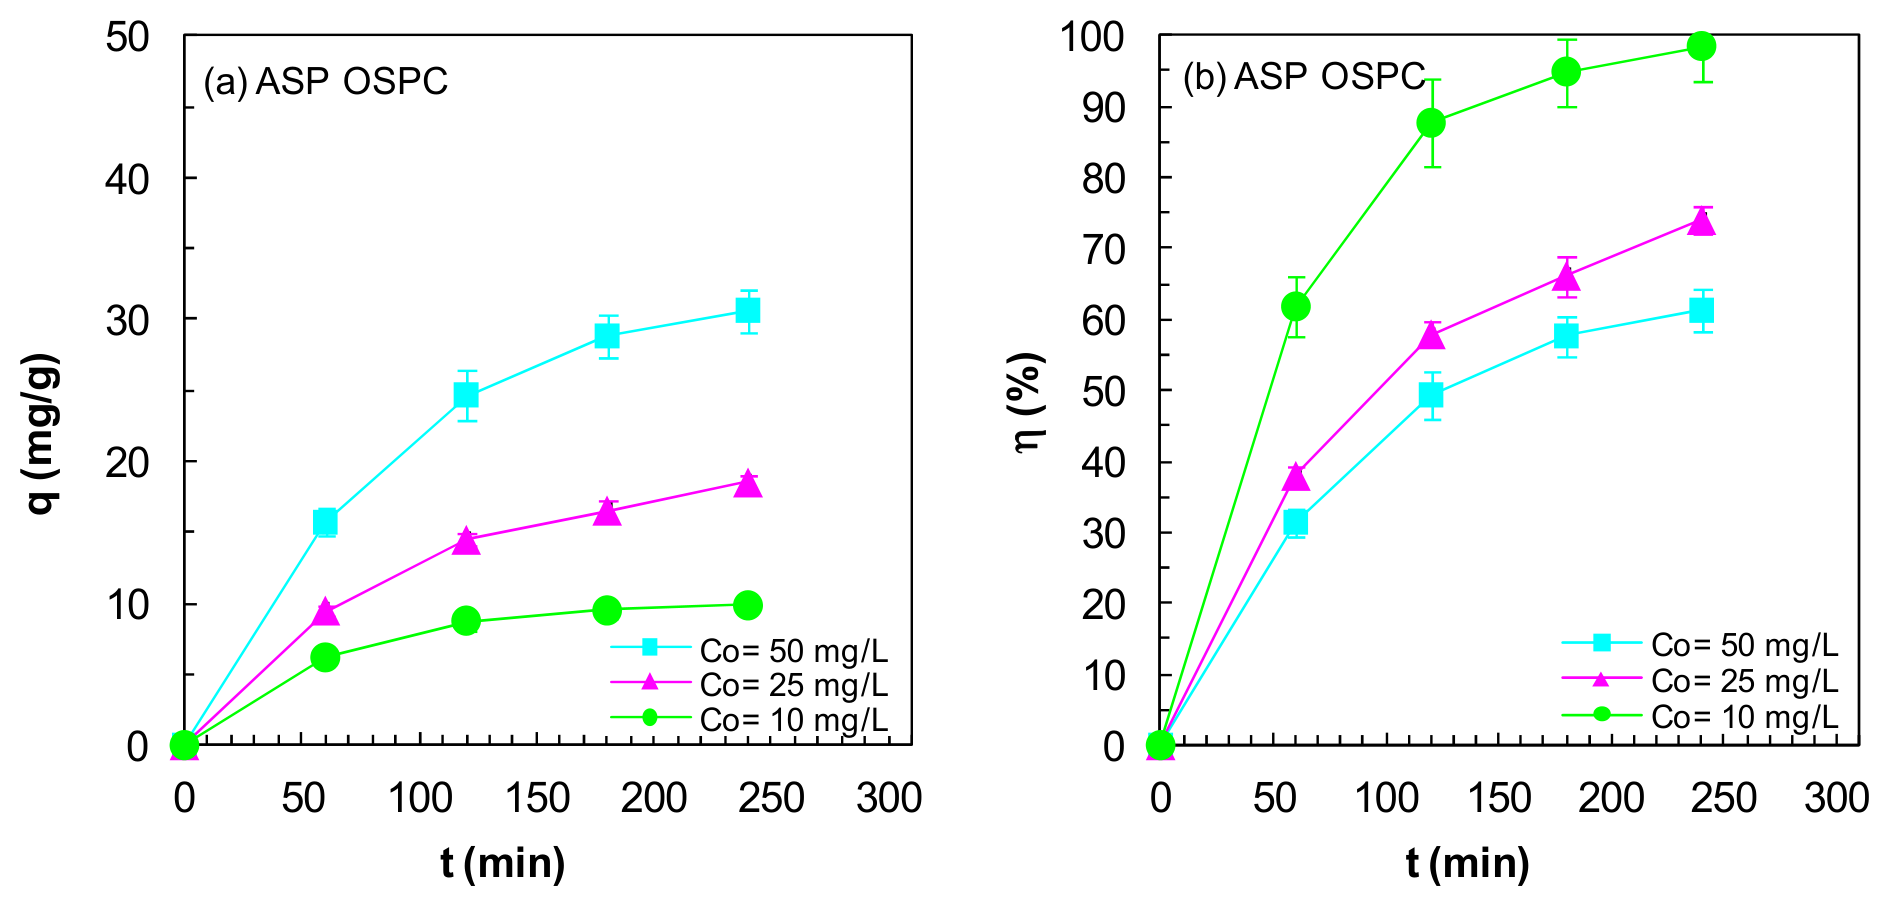
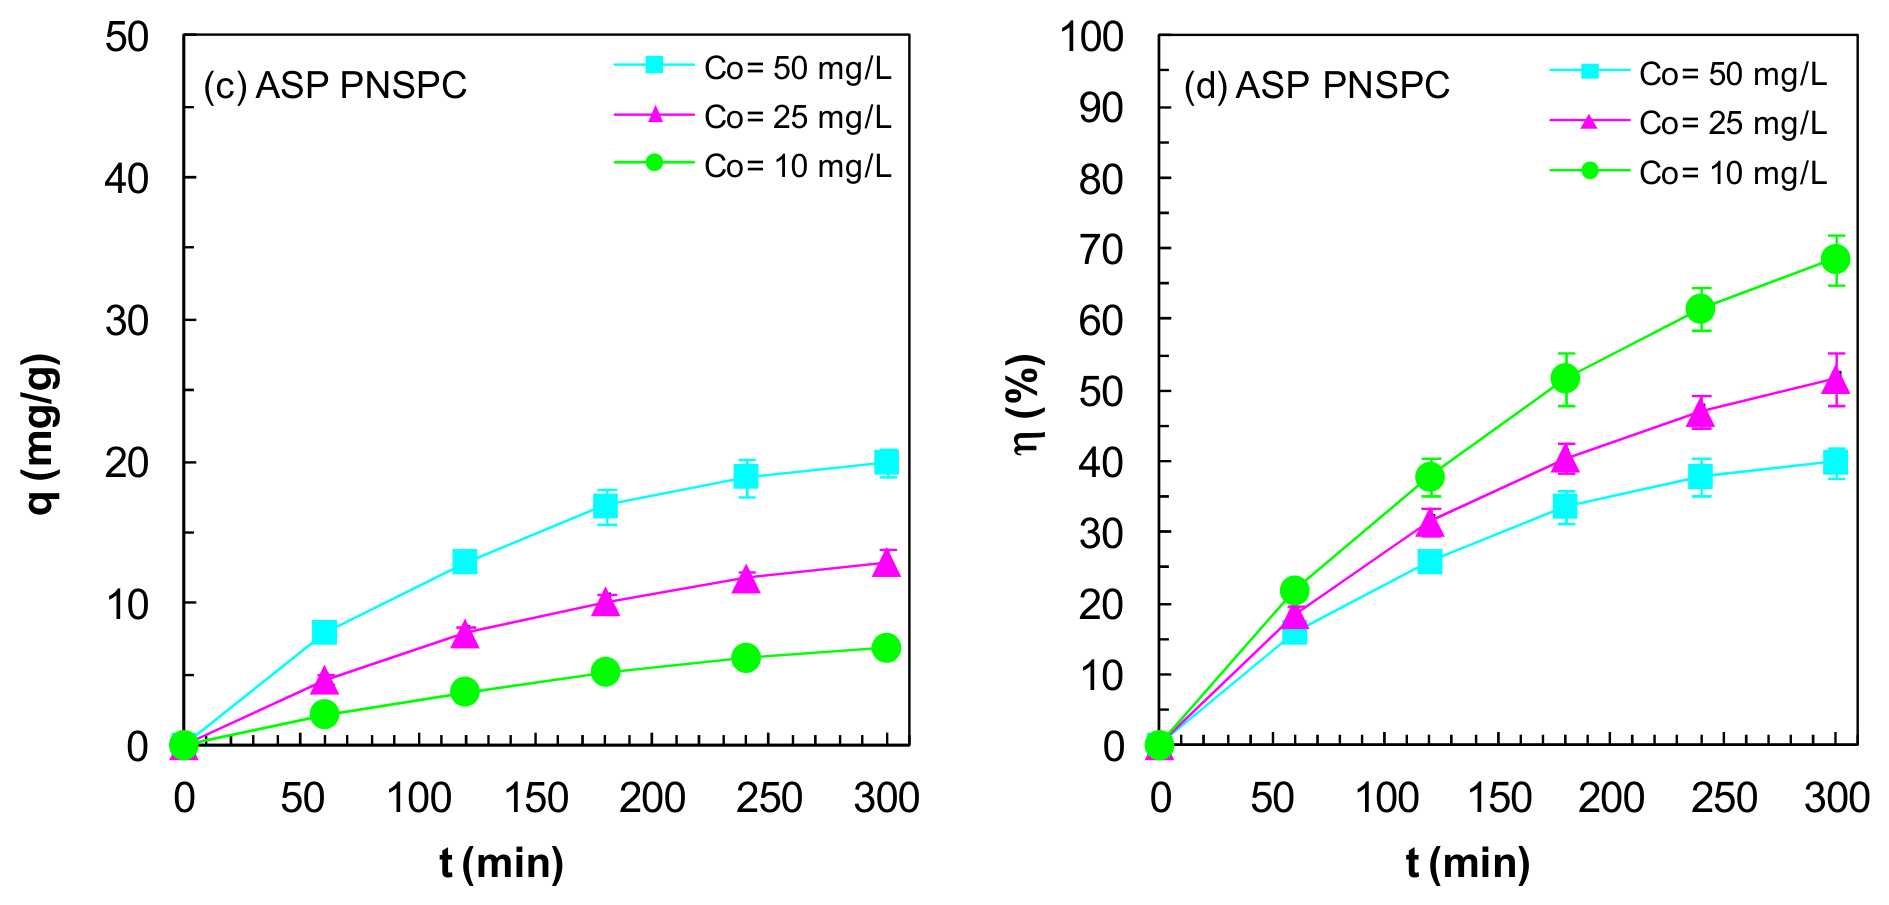
Figure 15, Figure 16, Figure 17, Figure 18, Figure 19 and Figure 20 illustrate the influence of the initial adsorbate concentration on the adsorption capacity and efficiency with initial pharmaceutical concentrations of 10, 25, and 50 mg/L, on 1 g/L OSPC and PNSPC adsorbents, without washing and at pH 2. An increase in the initial concentration of the pharmaceuticals from 10 to 50 mg/L results in a fourfold increase in equilibrium adsorption capacity for the OSPC adsorbent and a twofold increase for the PNSPC adsorbent.
Moreover, despite the general similarity in adsorption capacity and efficiency between both adsorbents, OSPC exhibits a higher adsorption capacity at shorter contact times. However, this difference diminishes as the initial concentration decreases. The adsorption capacity corresponding to OSPC is around double that for PNSPC with an initial concentration of 50 mg/L, while the values for OSPC are just under 20% higher than for PNSPC with a concentration of 10 mg/L.
By decreasing the concentration of the adsorbate from 50 to 10 mg/L, the adsorption efficiency increased by over 20% for OSPC and by double this value for PNSPC, with the efficiency of OSPC being 20% higher than that of PNSPC for an initial concentration of 10 mg/L and almost double this value for the concentration of 50 mg/L.
The adsorption capacity and efficiency values obtained for the OSPC and PNSPC adsorbents were comparable with those obtained using commercial activated charcoal, although with the charcoal, the results were obtained in a quarter of the time compared to OSPC and in a fifth of the time compared to PNSPC.
The adsorption capacity of the studied drugs on OSPC and PNSPC biocarbons was compared with that of other biocarbons previously reported in the literature (Table 4). The adsorption capacity for PAR of OSPC biocarbon activated with phosphoric acid and thermal treatment without washing was ten times greater than that achieved using washed olive stone waste in [42], and of the same order as the values obtained with adsorbents from olive stone waste in [38,43]. The PAR adsorption capacity of PNSPC was half that reported by Hashemzadeh et al. [40], although these authors used half the drug concentration and twice the adsorbent concentration. In the case of IBU adsorption, the adsorption capacity for both OSPC and PNSPC biocarbons was three orders higher than that found by Delgado-Moreno et al. [35]. The NOL adsorption capacity of OSPC biocarbon was of the same order as that obtained for dipyrone (metamizol) standard solutions by Guimarães et al. [24] and by dos Reis Oliveira et al. [25]. Finally, the salicylic acid adsorption capacity presented by Narloch et al. [44] was slightly lower than that obtained in this study for the adsorption of ASP onto PNSPC and half that obtained for the absorption of ASP onto OSPC.

3.4.4. Adsorbent Reutilization

The experimental pharmaceutical adsorption efficiency values obtained for both adsorbents were nearly 100% for a concentration of 5 g/L, which indicates that the sites of the adsorbents were not completely saturated, allowing their use in multiple cycles. After each cycle, the adsorbents were filtrated to be reused in another cycle.
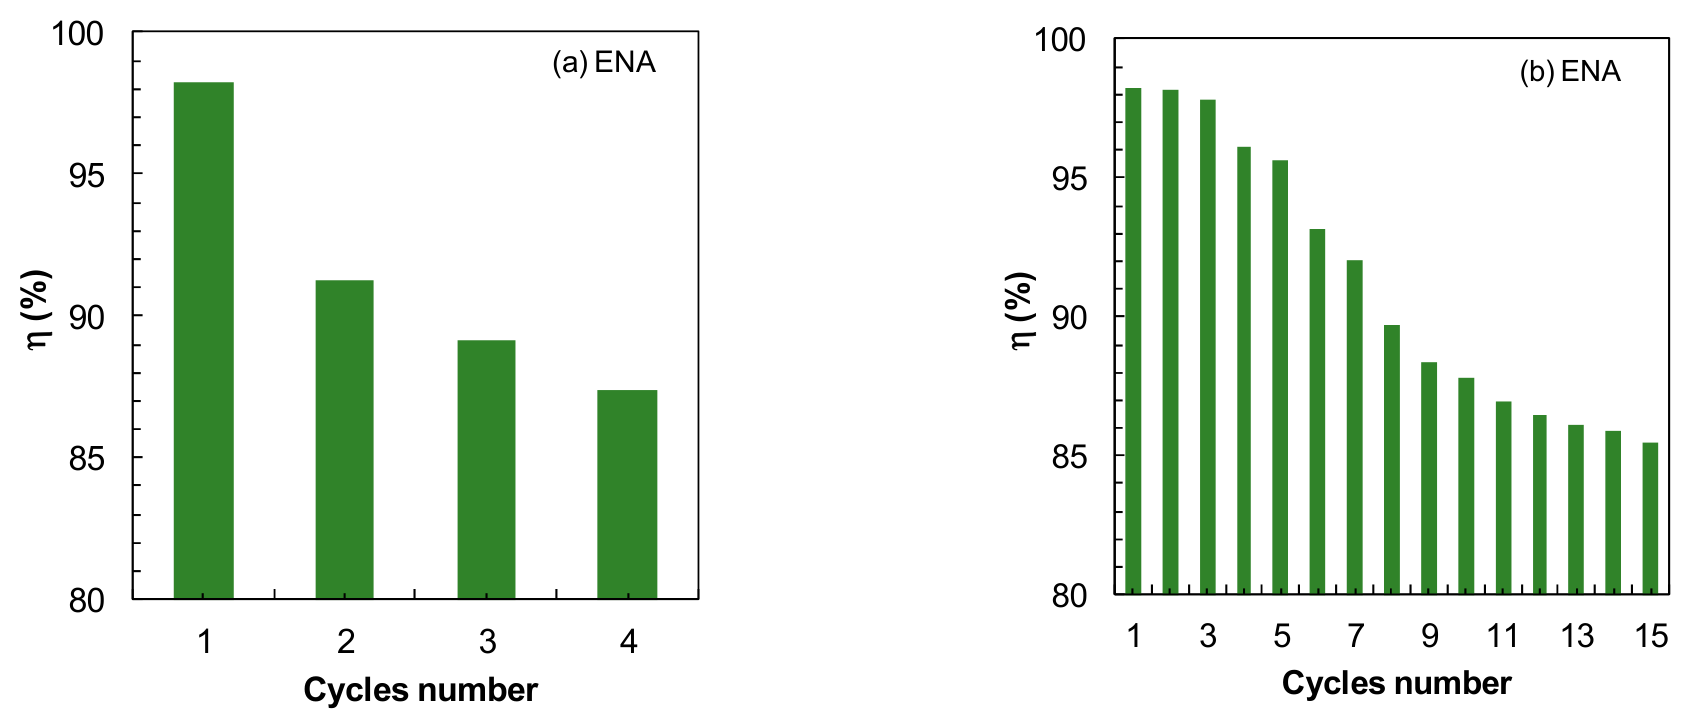
Figure 21a illustrates the evolution of drug adsorption efficiency on OSPC biocarbon without washing at pH 2, with a set number of cycles, for an initial pharmaceutical concentration of ENA of 50 mg/L and using 5 g/L of biocarbon. Since the OSPC biocarbon with a concentration of 5 g/L could be used in 3–4 consecutive cycles with efficiency higher than 85%, the reuse of the OSPC biocarbon with a concentration four times higher (20 g/L) was proposed, with an initial concentration of 50 mg/L of each of the six drugs independently. Figure 21b shows that OSPC biocarbon can be reused in 15 consecutive cycles of ENA, with efficiency exceeding 85%. The adsorption efficiency and the amount of drug removed obtained through mass balance are summarized in Table 5. Reusing adsorbents in consecutive cycles allows for a reduction in the consumption of activated adsorbent, thus potentially reducing the energy cost [45].

3.4.5. Adsorption of Binary Mixtures

The adsorption of several solutions consisting of binary mixtures of two pharmaceutical formulations was carried out on 1 g/L of OSPC. Table 6 summarizes the removal percentages obtained for each component of the mixture. The highest removal percentage was observed for ENA in the NOL+ENA mixture, followed by PAR in the PAR+TER mixture, and in the PAR+IBU mixture. NOL was removed at a similar percentage in the NOL+ASP mixture as in the NOL+IBU mixture, and at a higher percentage than in the NOL+ENA mixture. The lowest removal percentage was observed for ASP in the NOL+ASP mixture. In the case of the mixture PAR-TER since the wavelengths overlap, the absorbances were added together.

3.5. Adsorption Kinetics

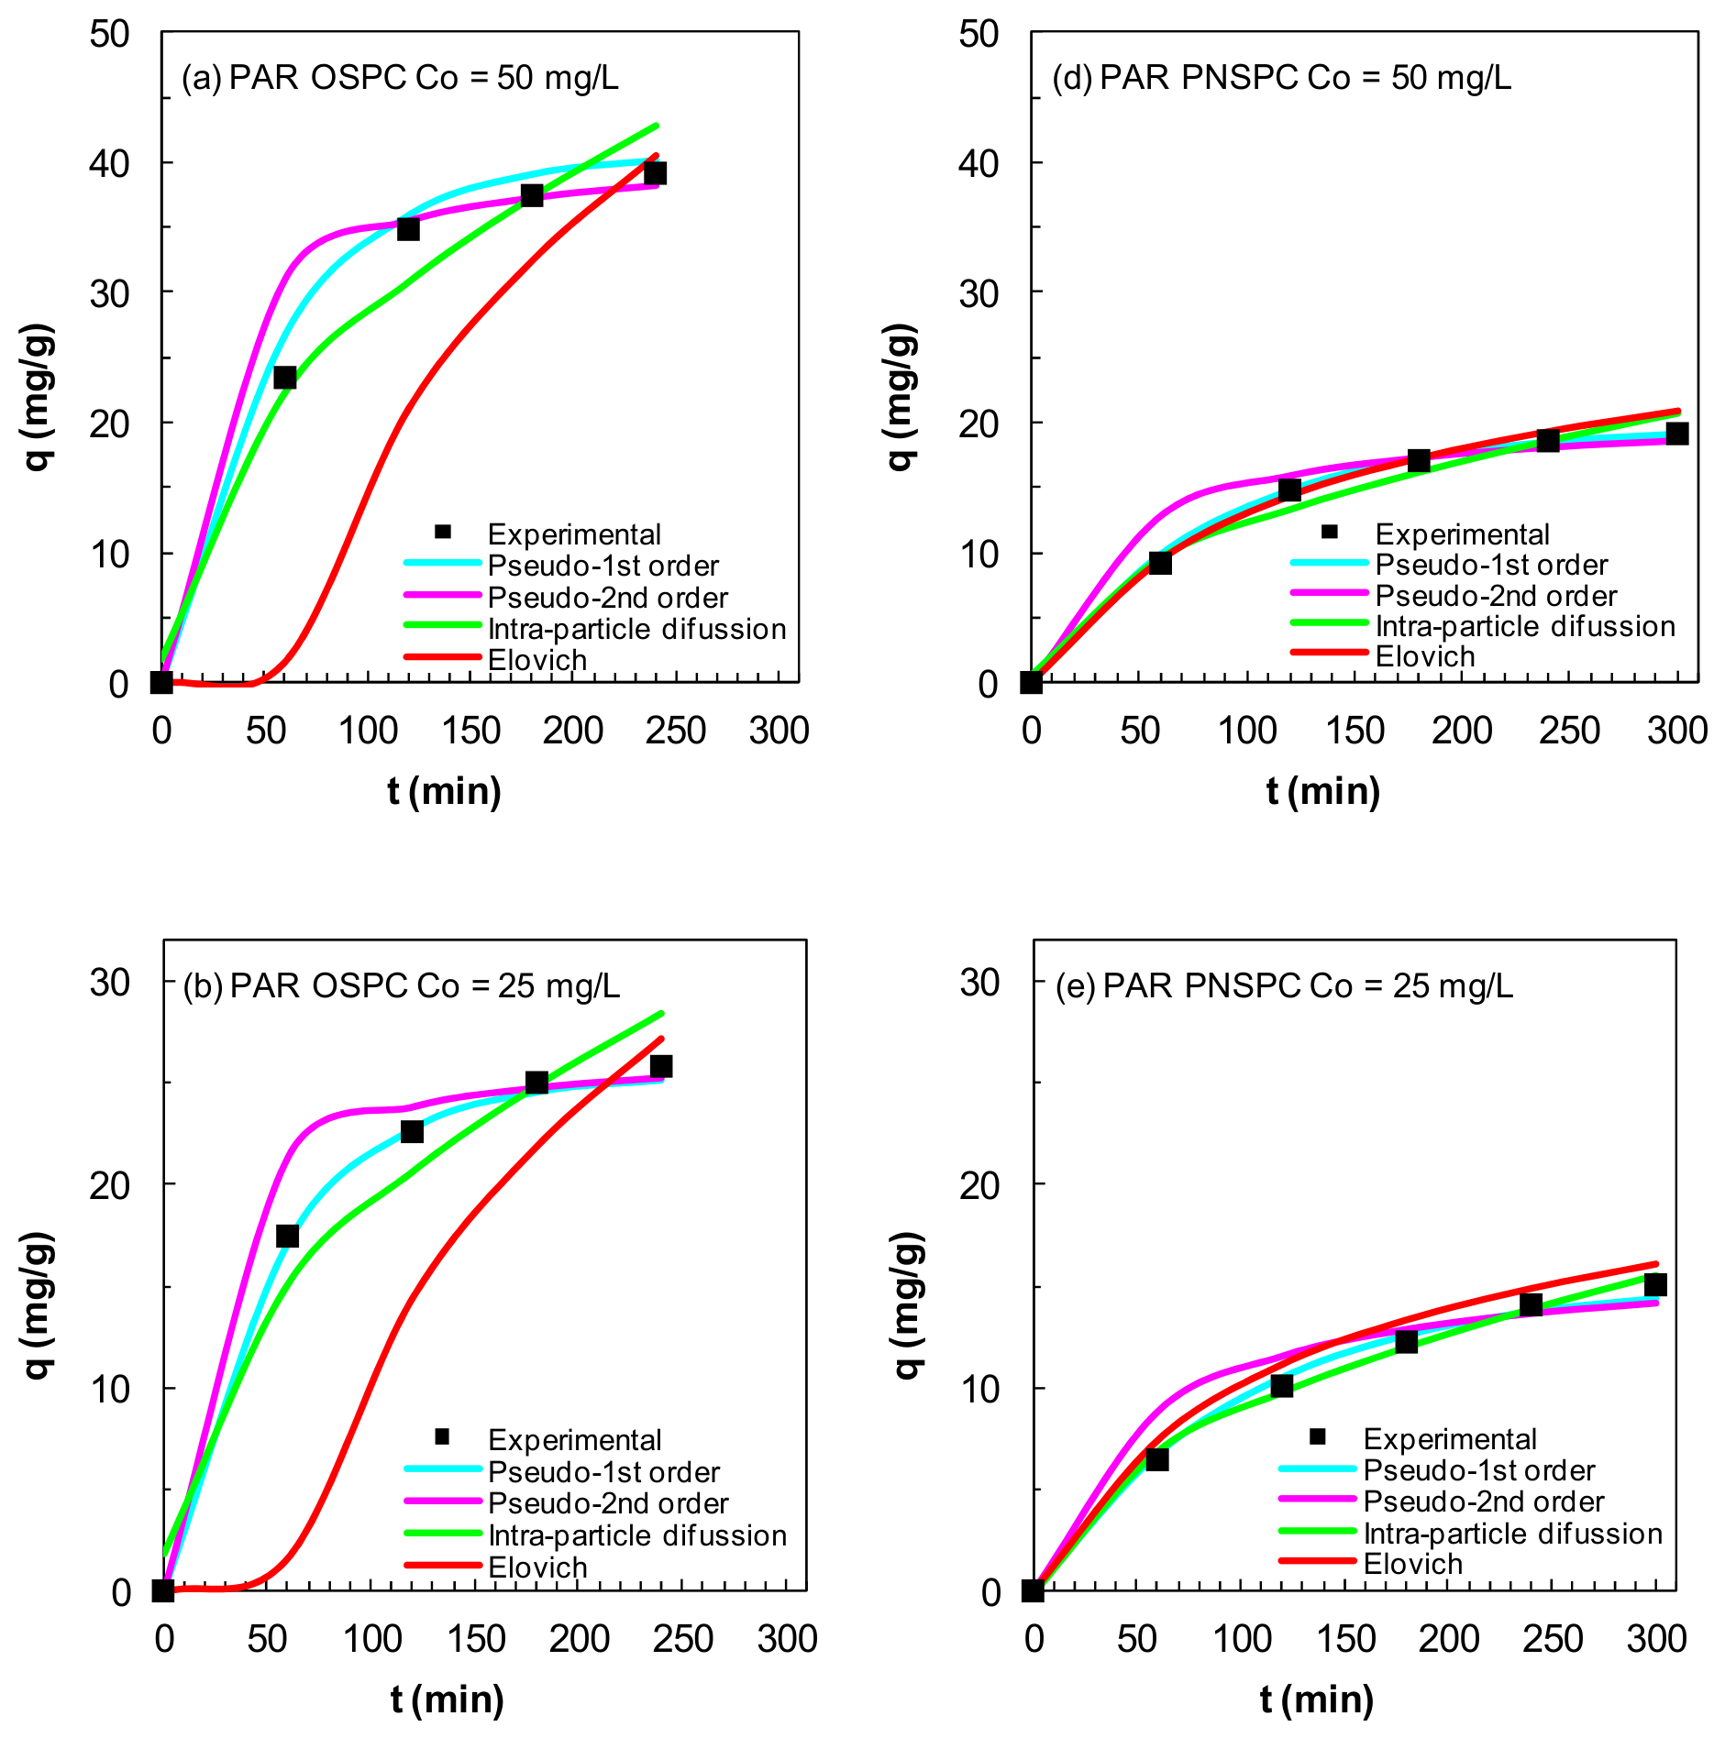
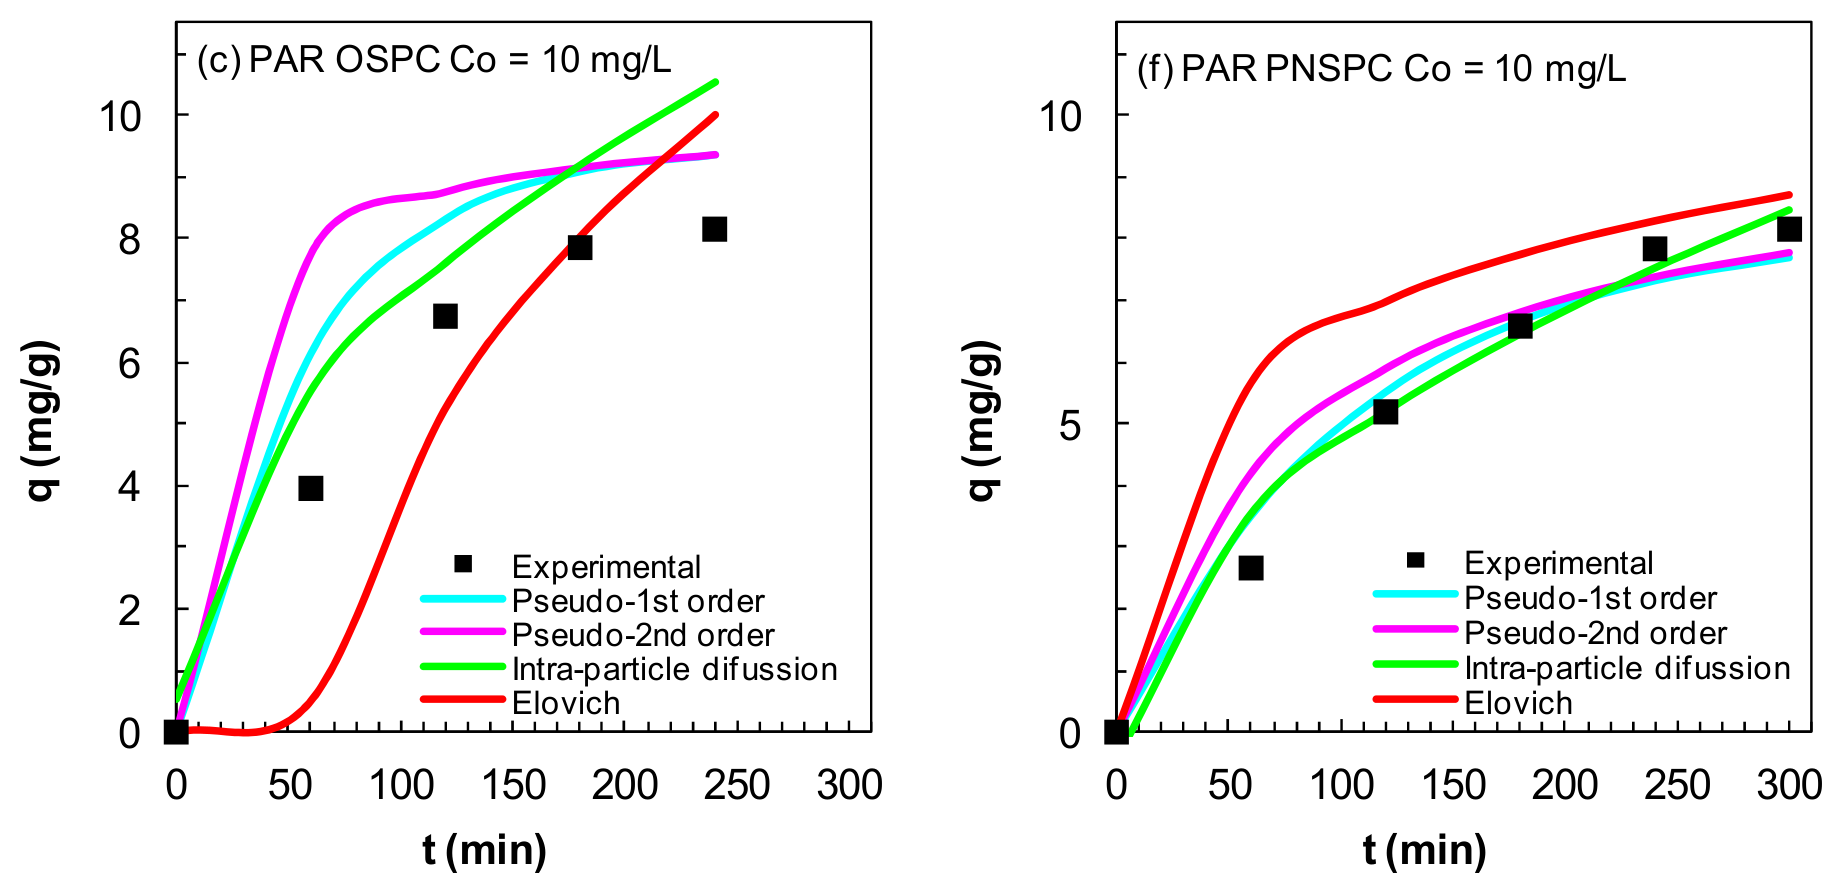
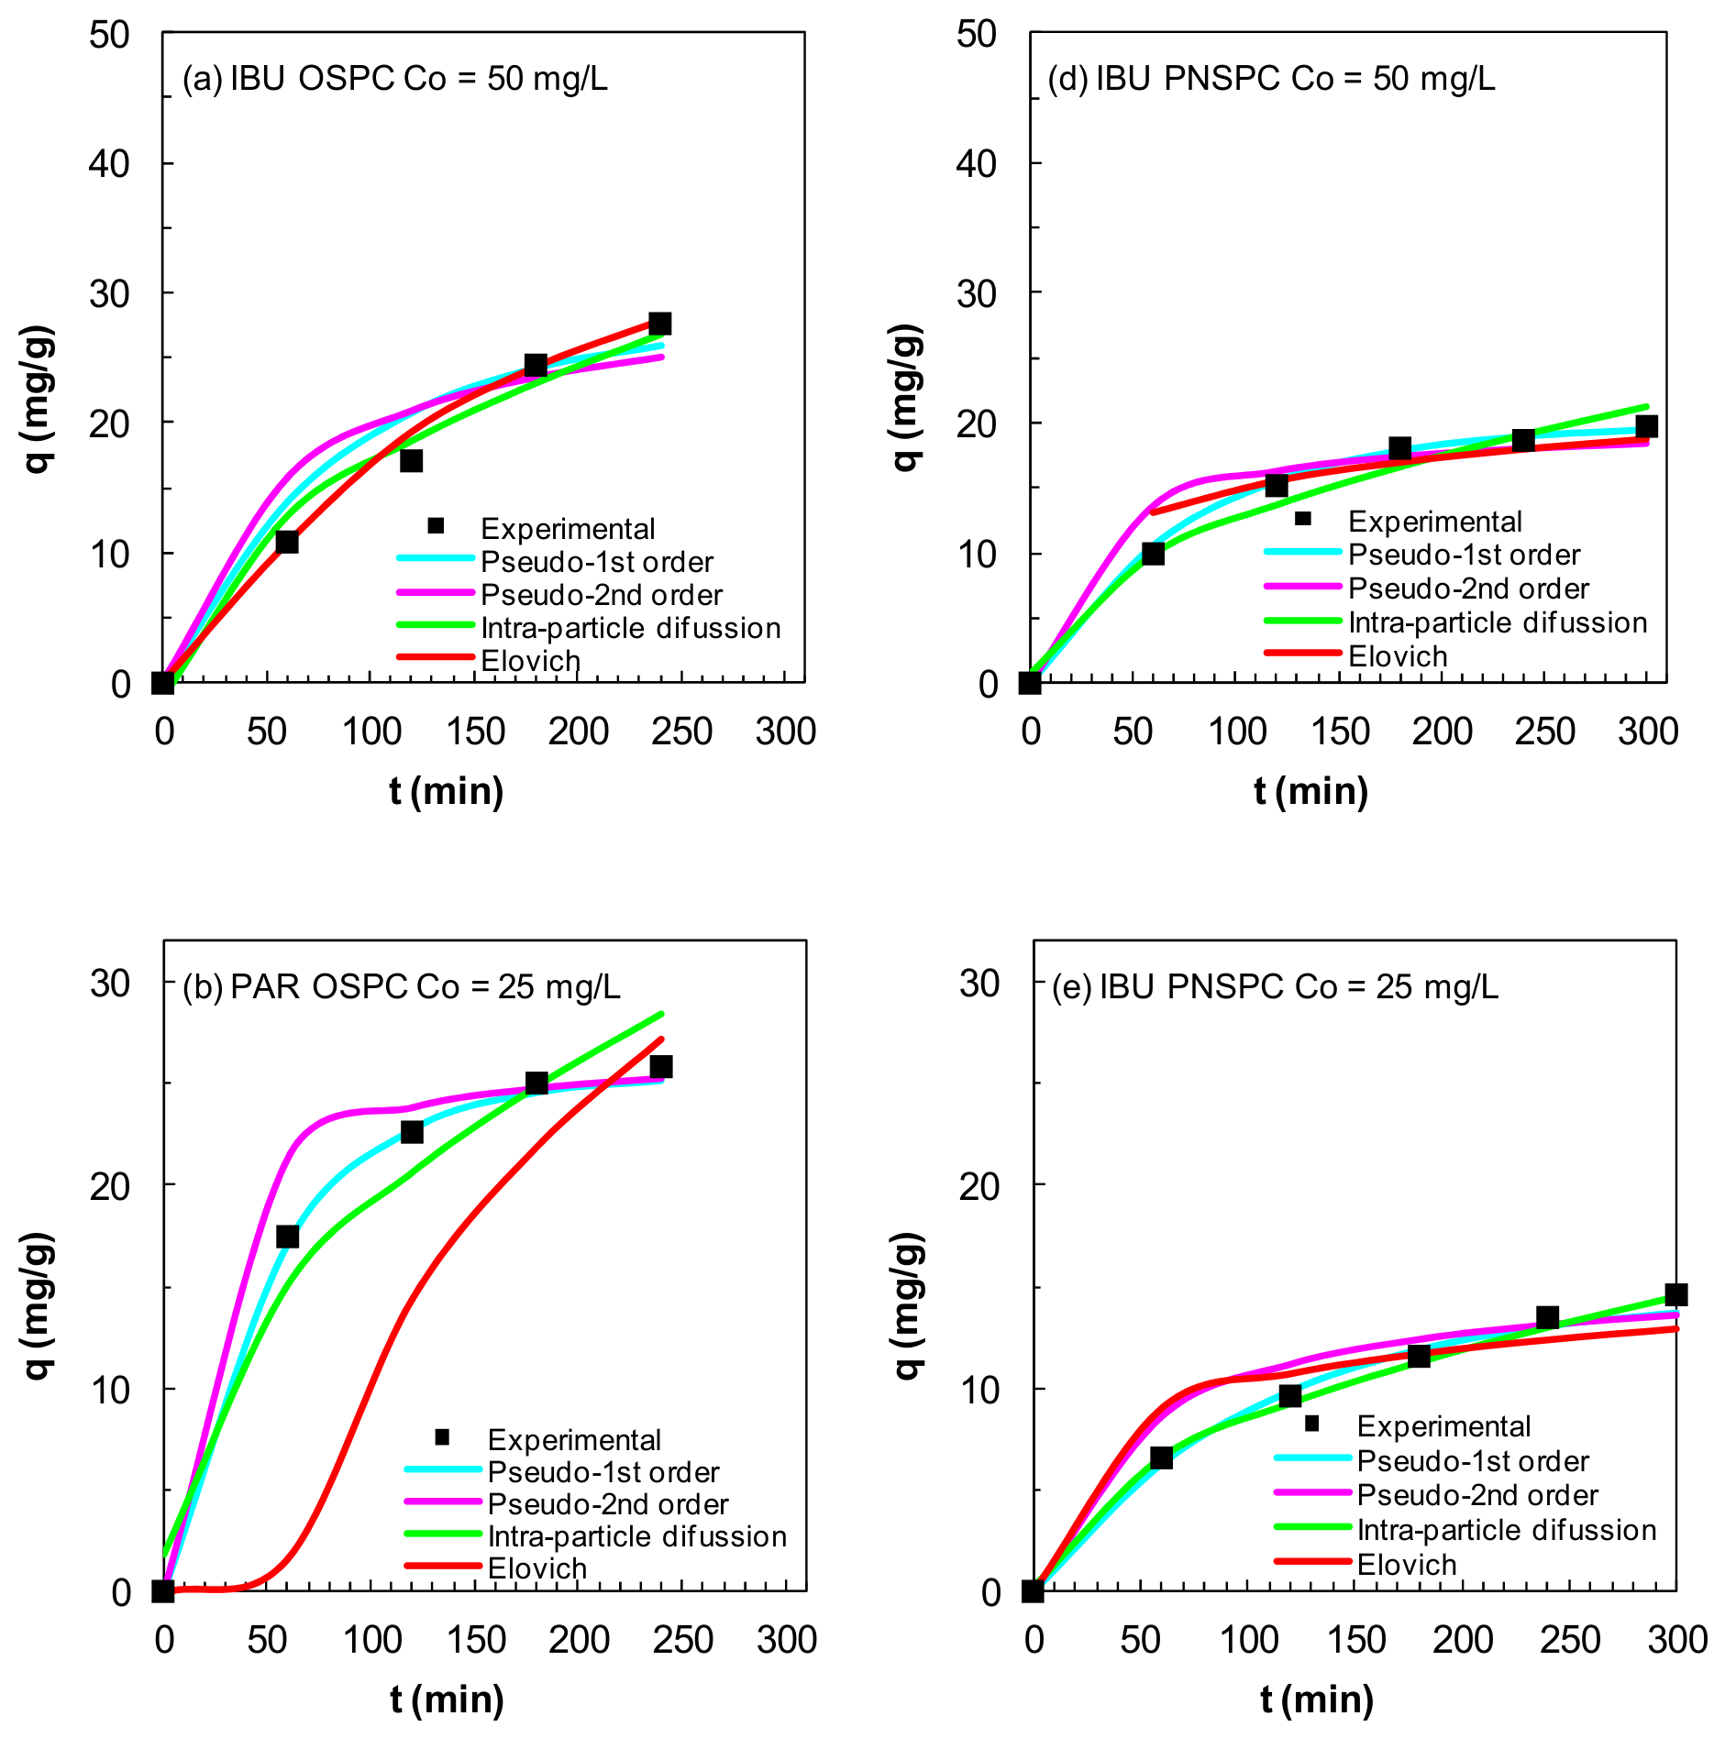
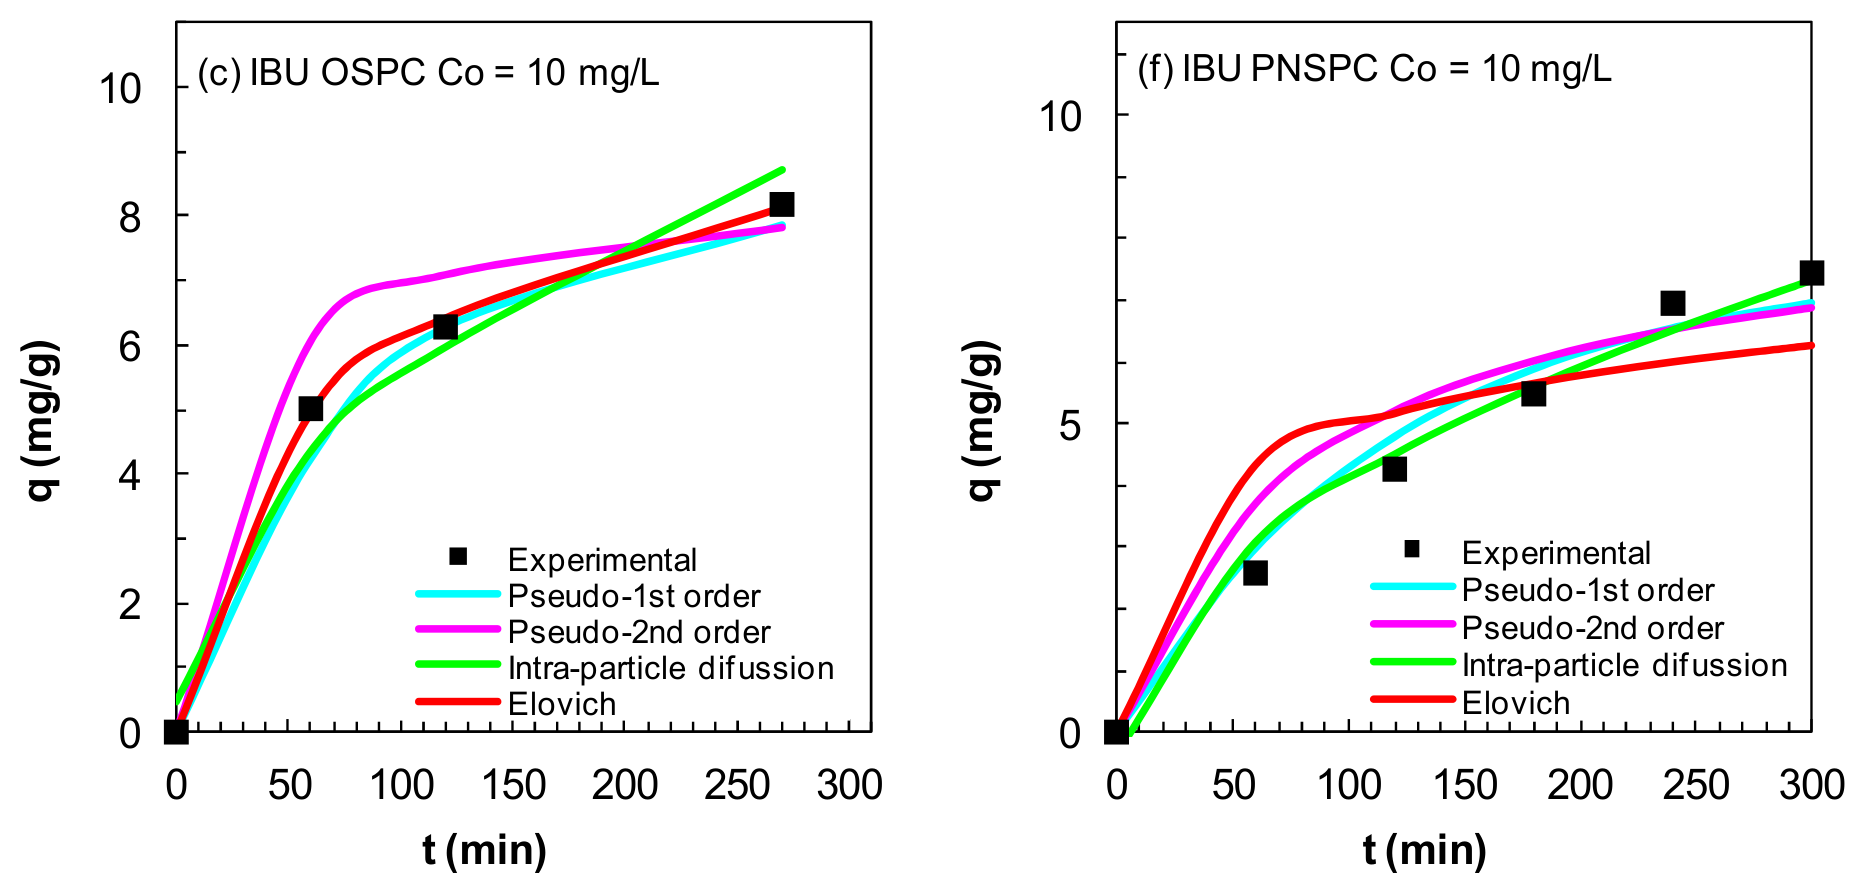
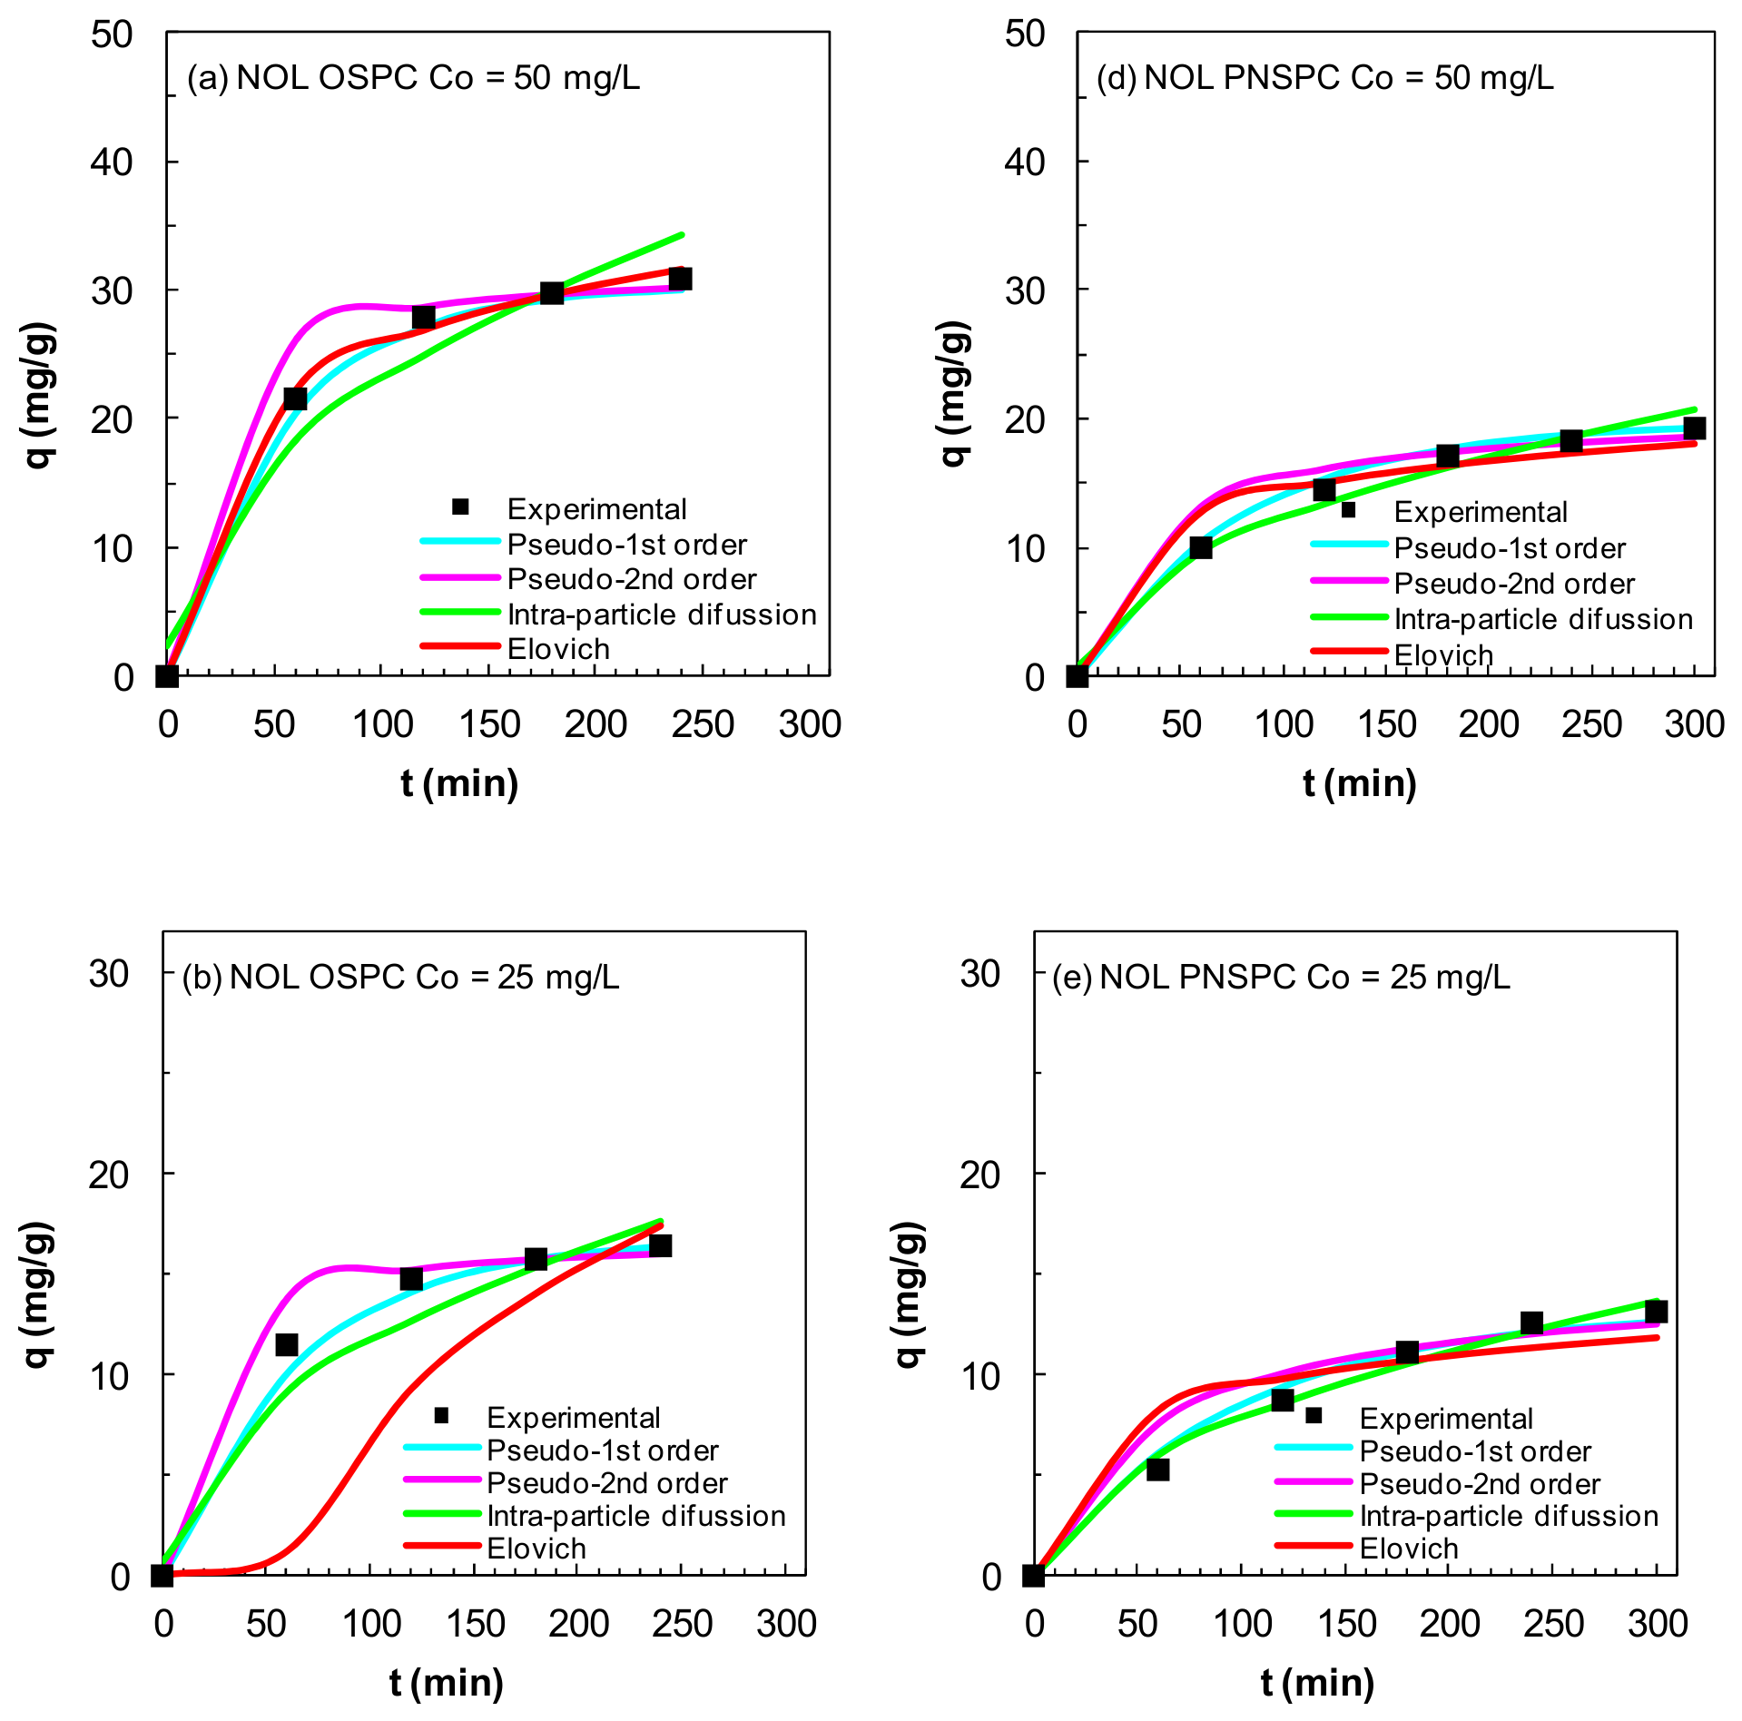
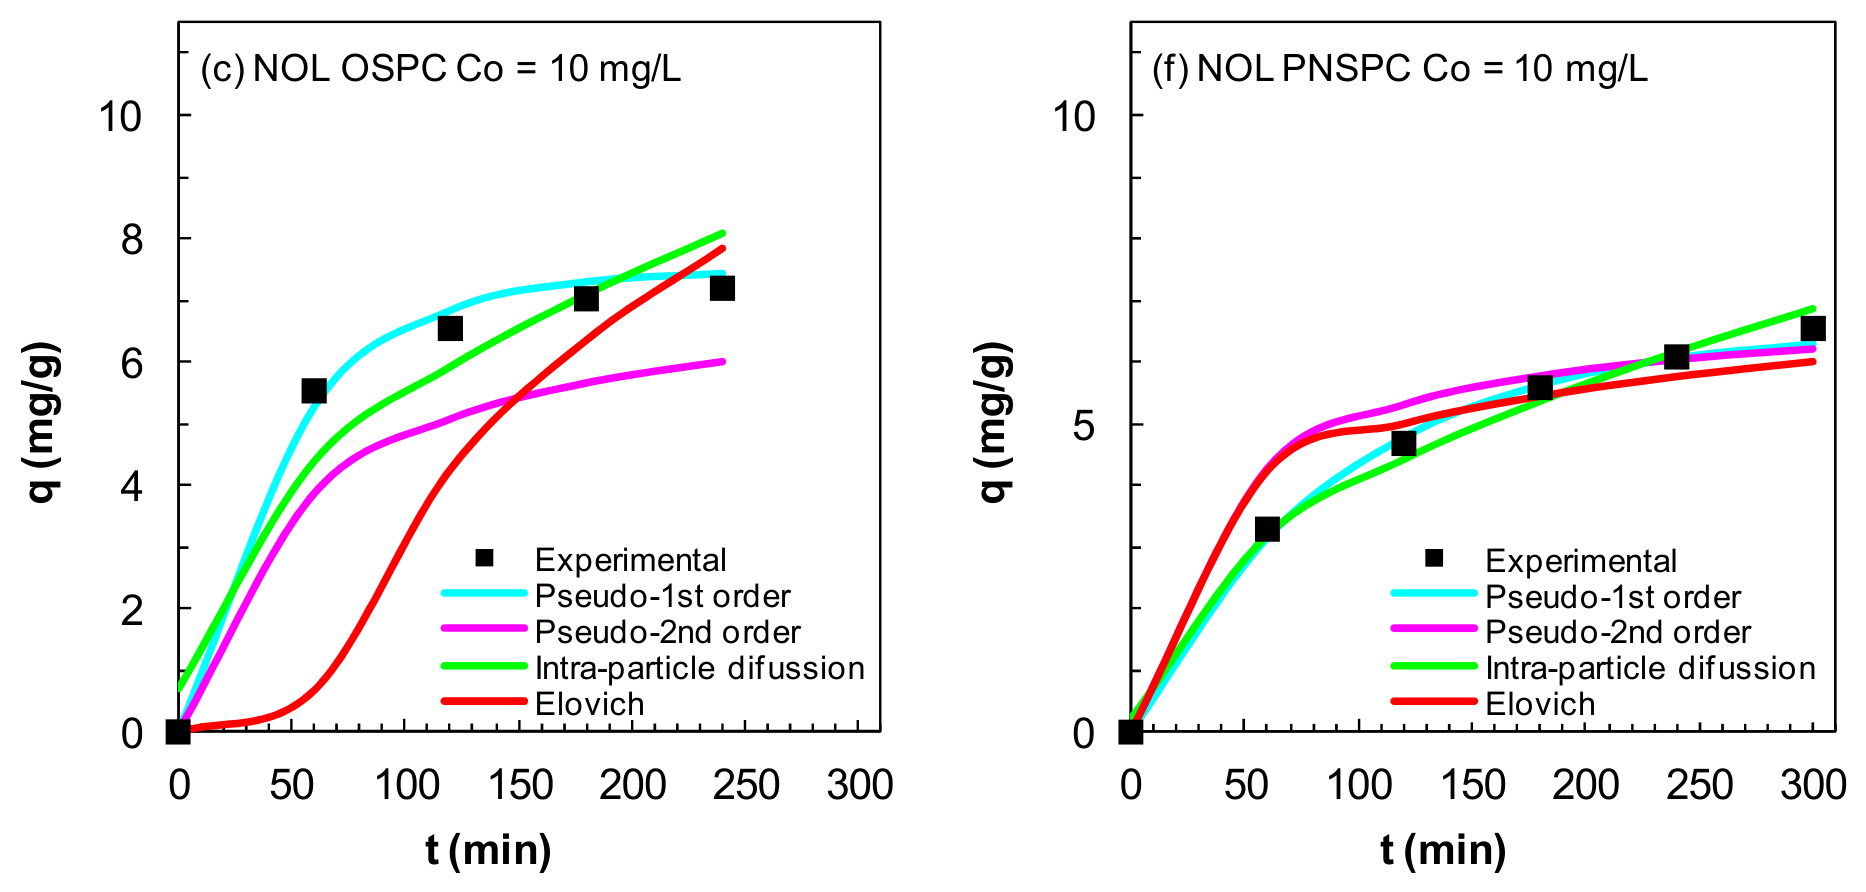
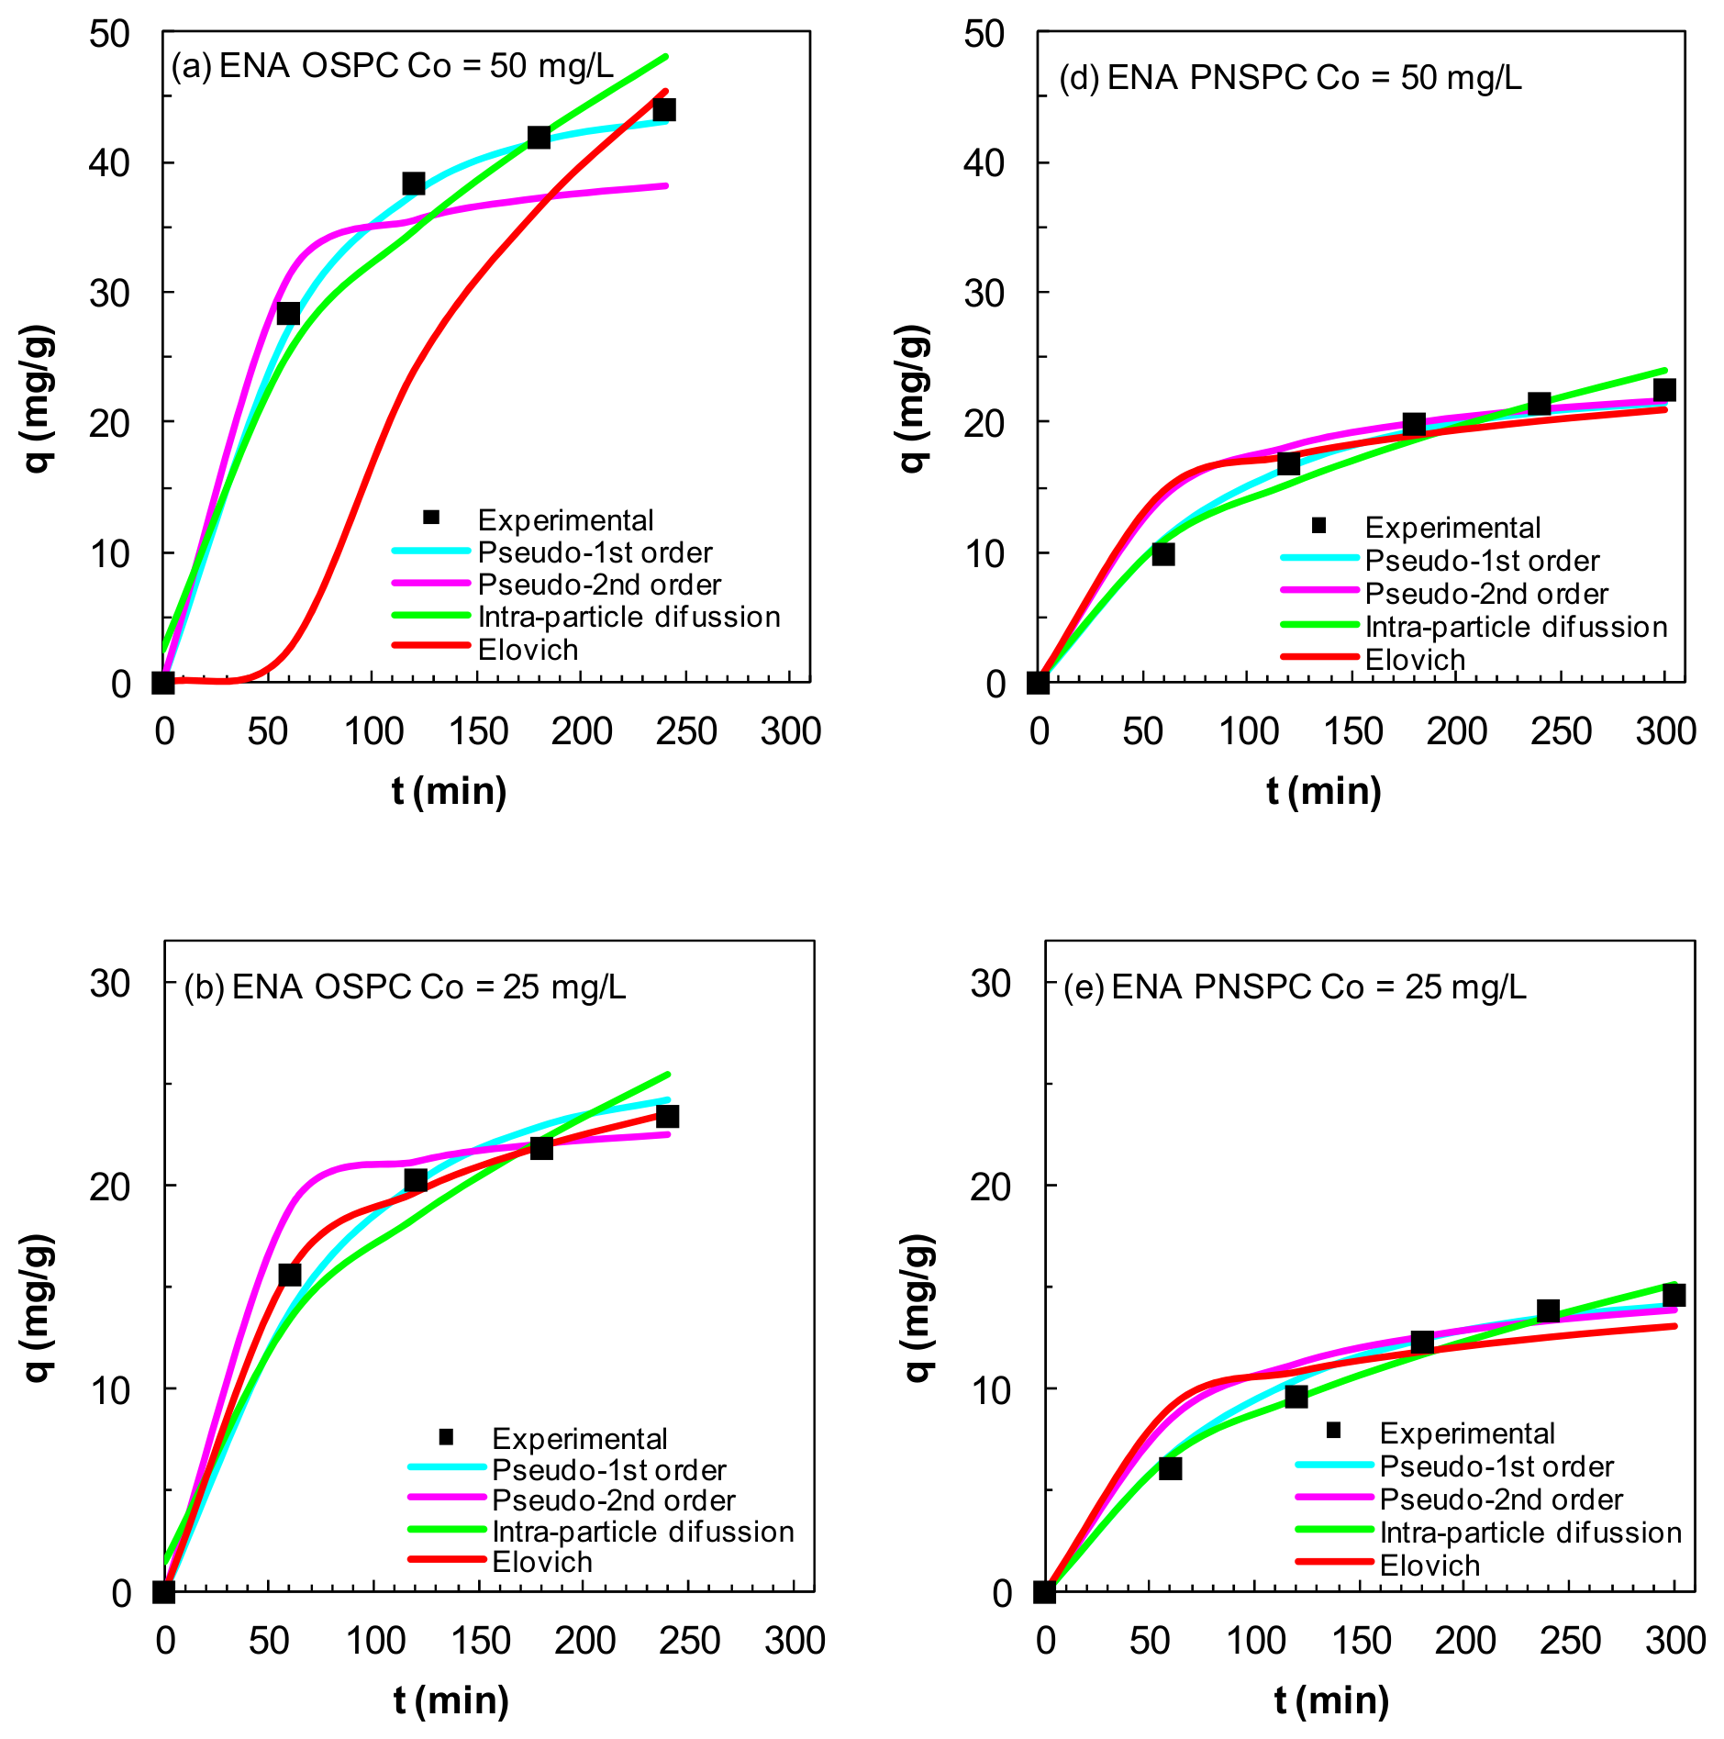
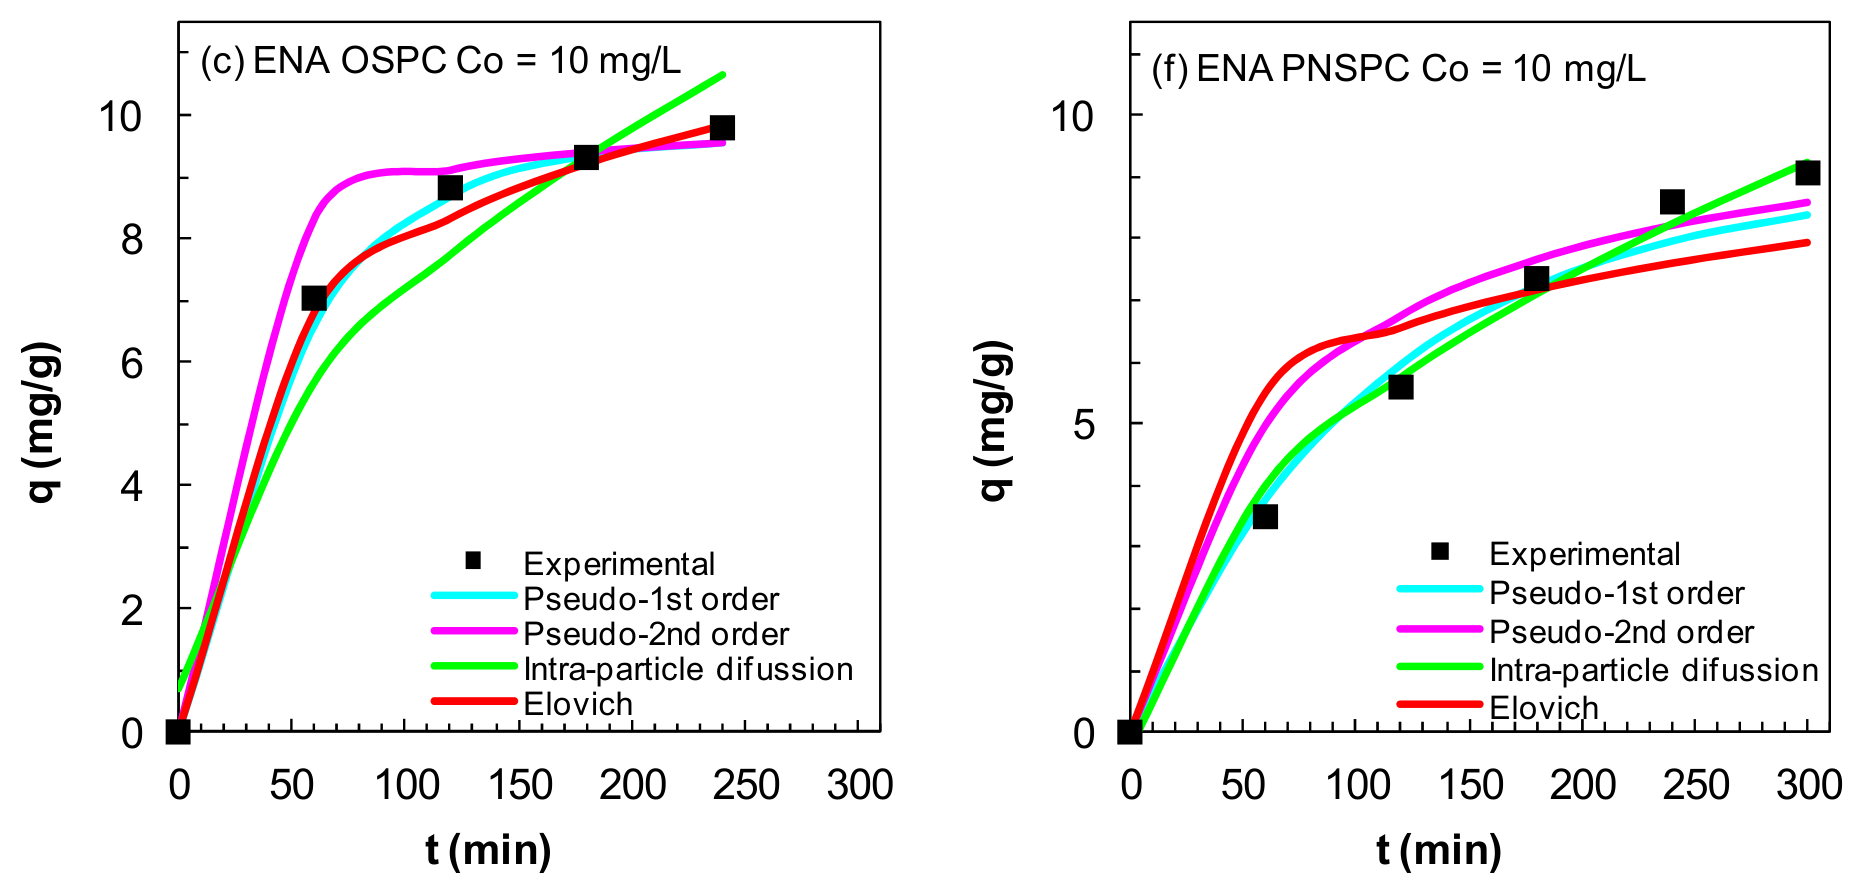
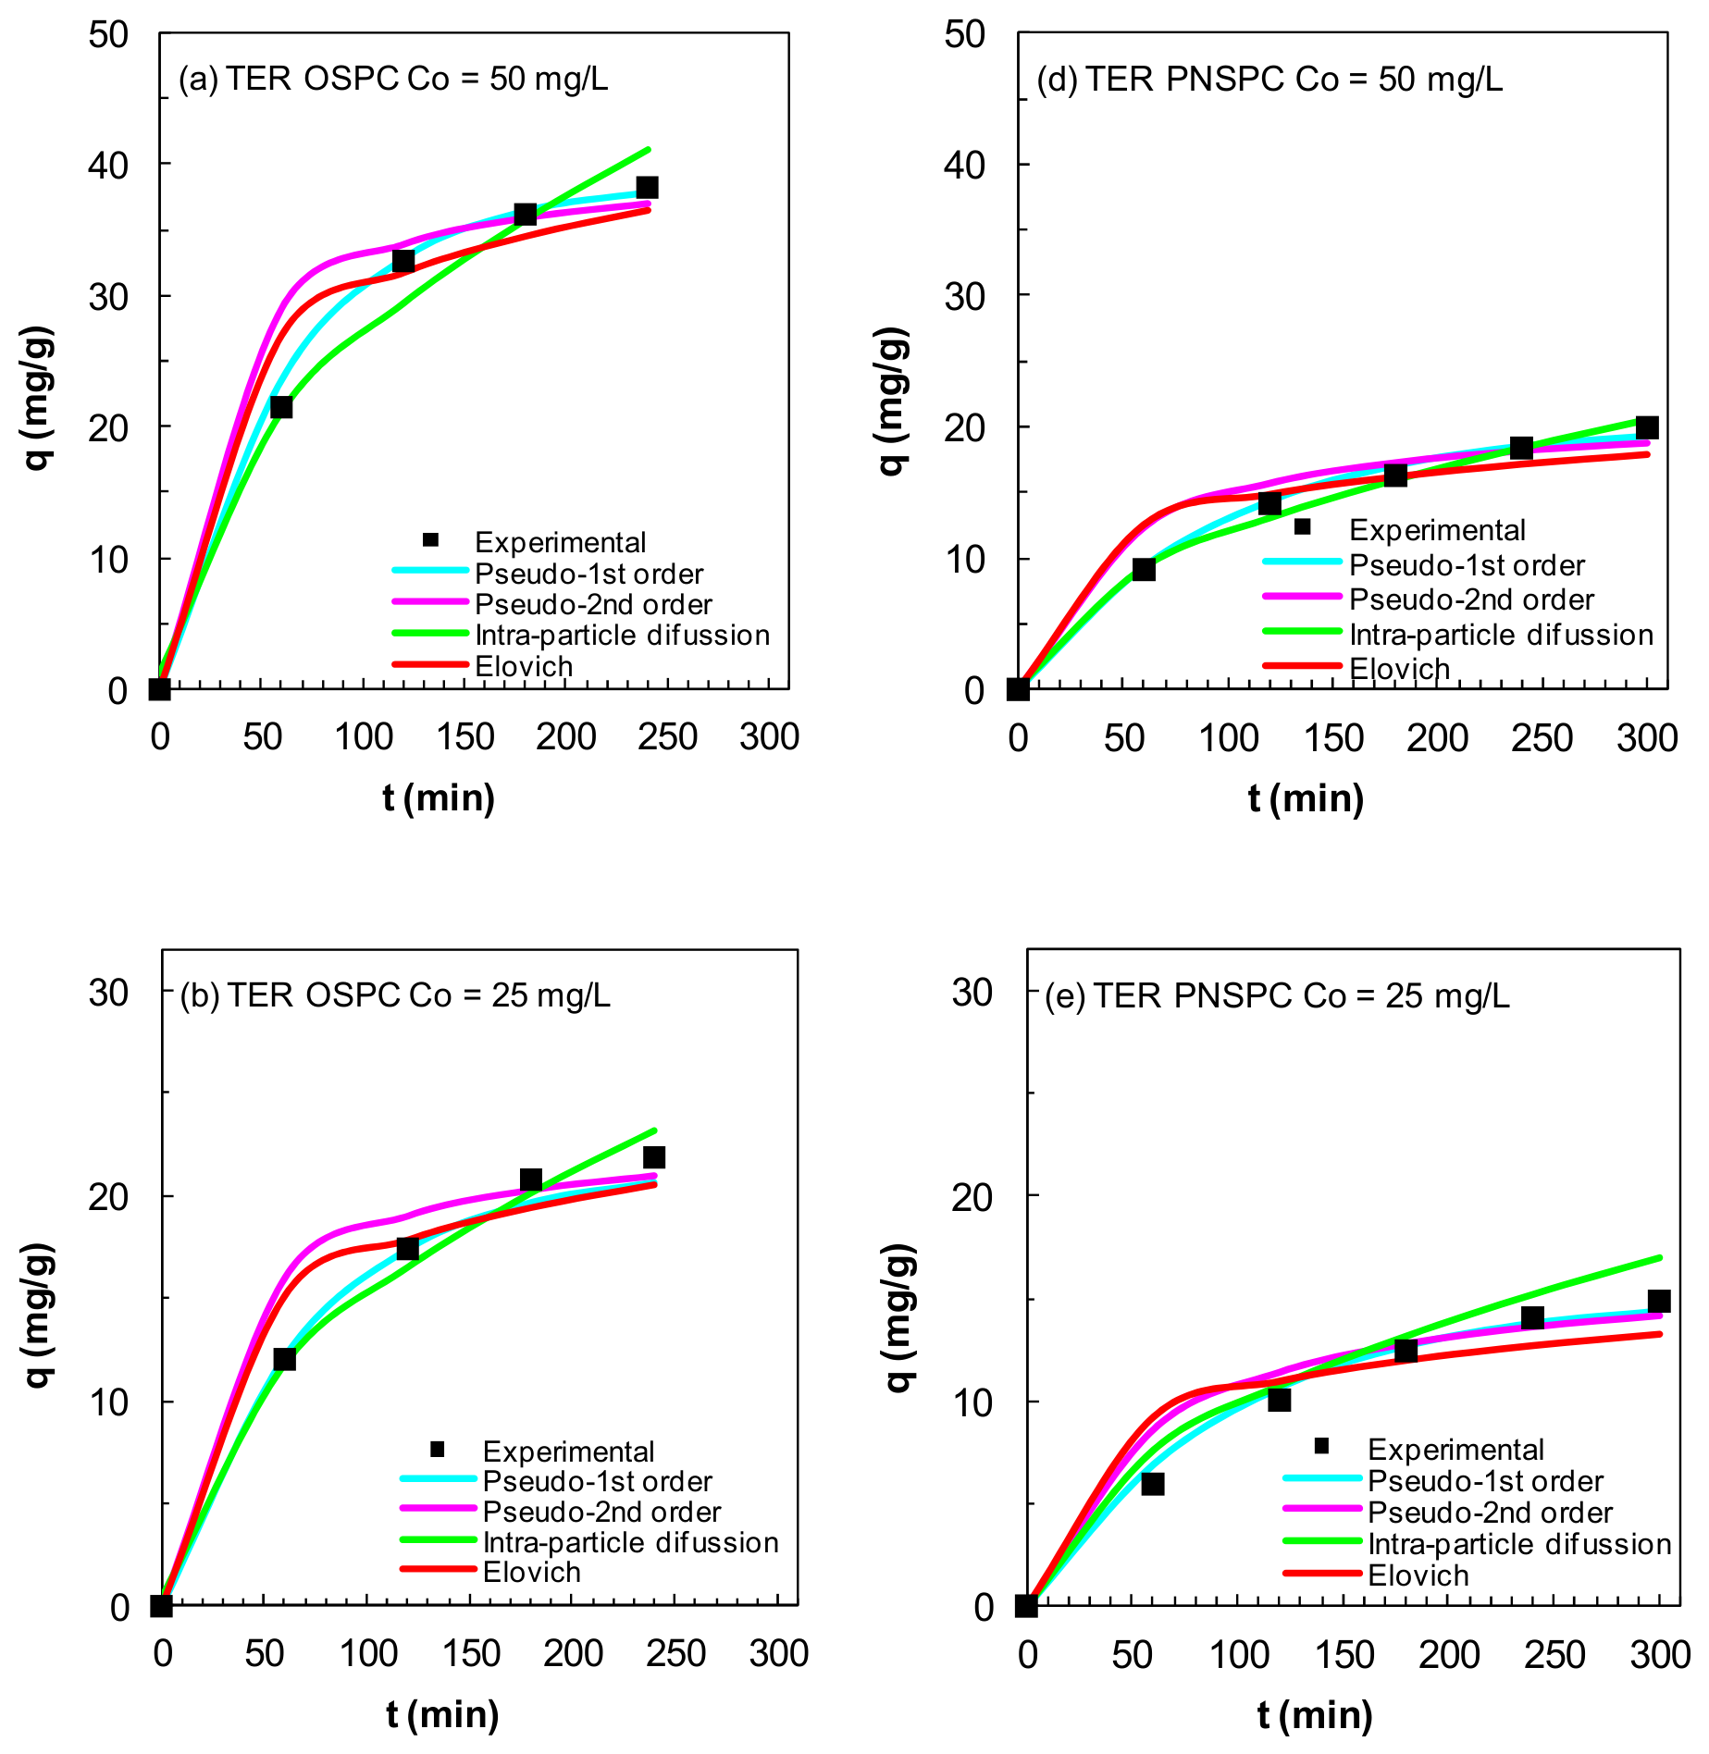
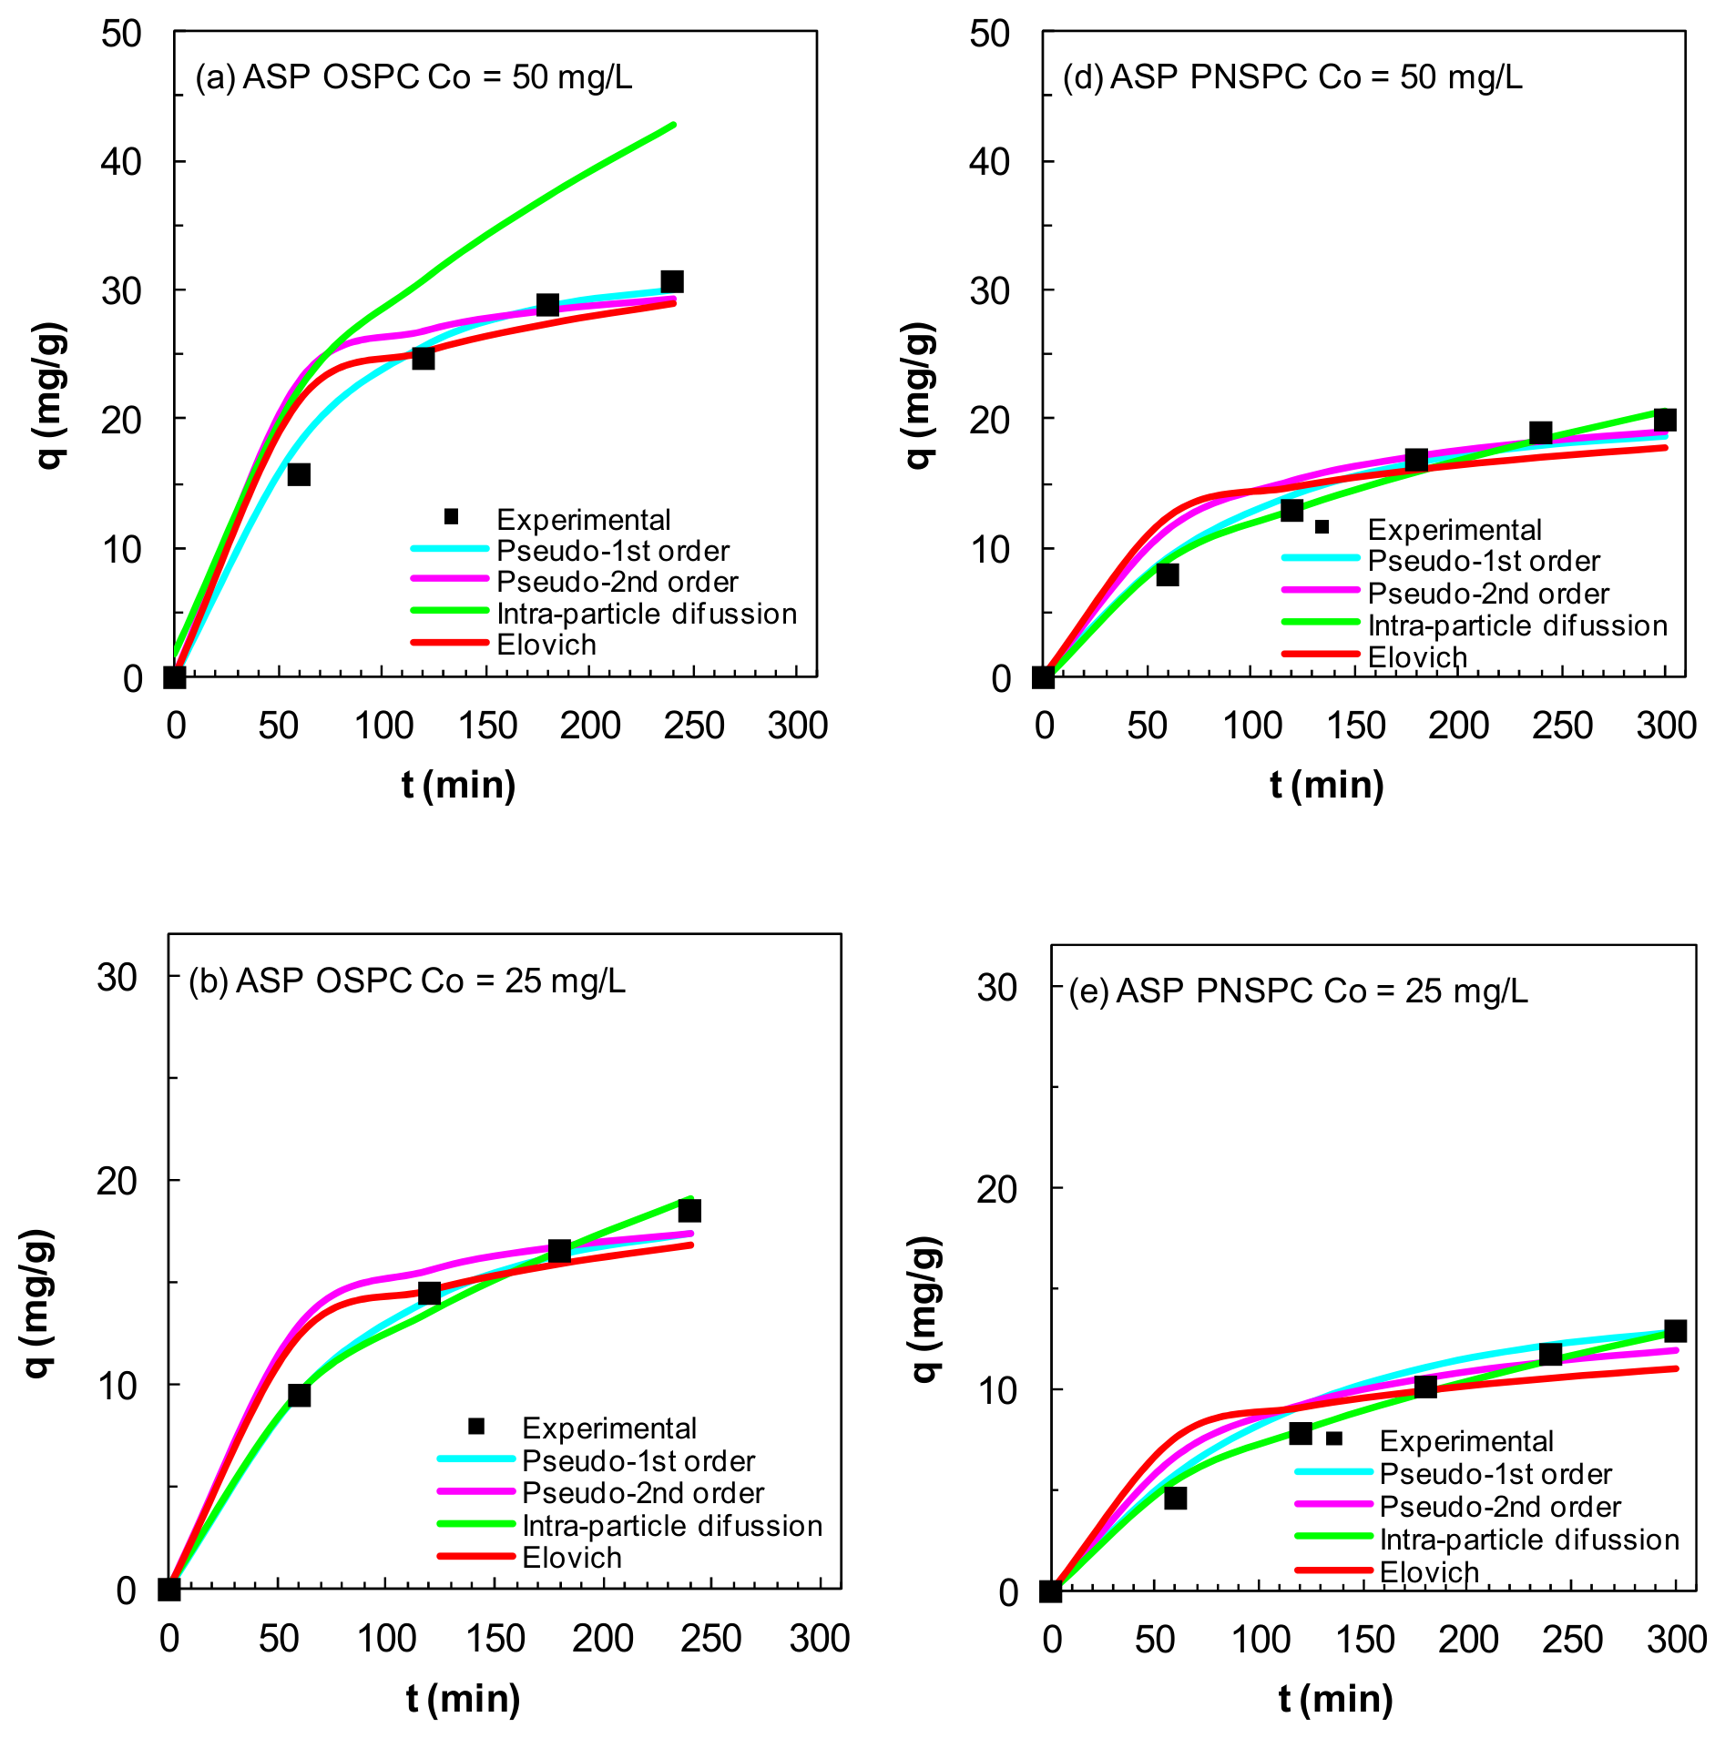
Adsorption kinetics contributes to our knowledge of adsorption mechanisms and the prediction of adsorption behavior. Herein, the experimental data on the temporal evolution of adsorption capacity were fitted to the pseudo-first-order (PFO), pseudo-second-order (PSO), intra-particle diffusion, and Elovich kinetic models (Equations (3)–(6)), listed in Table 7, via non-linear regression using the fminsearch command in MATLAB 2025b software.
The fit of the experimental data on the adsorption of the six drugs (at initial concentrations of 10, 25, and 50 mg/L) to the kinetic models is illustrated in Figure 22, Figure 23, Figure 24, Figure 25, Figure 26 and Figure 27 for S = 1 g/L of OSPC and PNSPC. Tables S2–S7 (Supplementary Material) summarize the kinetic and statistical parameters of the models for OSPC and PNSPC.
According to the statistical parameters, the pseudo-first-order (PFO) and pseudo-second-order (PSO) models are suitable for describing the adsorption capacity of the OSPC and PNSPC adsorbents for the studied pharmaceuticals. The coefficient of determination (R2) ranged from 0.958 to 0.999 for the PFO model, from 0.854 to 0.985 for the PSO model, from 0.918 to 0.999 for the intra-particle diffusion model, and from 0.842 to 0.999 for the Elovich model. The root-mean-square error (RMSE) varied between 0.138 and 2.530 for the PFO model, between 0.631 and 4.177 for the PSO model, between 0.320 and 3.111 for the intra-particle diffusion model, and between 0.079 and 15.017 for the Elovich model, which shows that the best-fitting model is the PFO. k1 and k2 in the pseudo-first-order and pseudo-second-order models decrease as the initial concentration of adsorbate increases.

3.6. Adsorption Isotherms

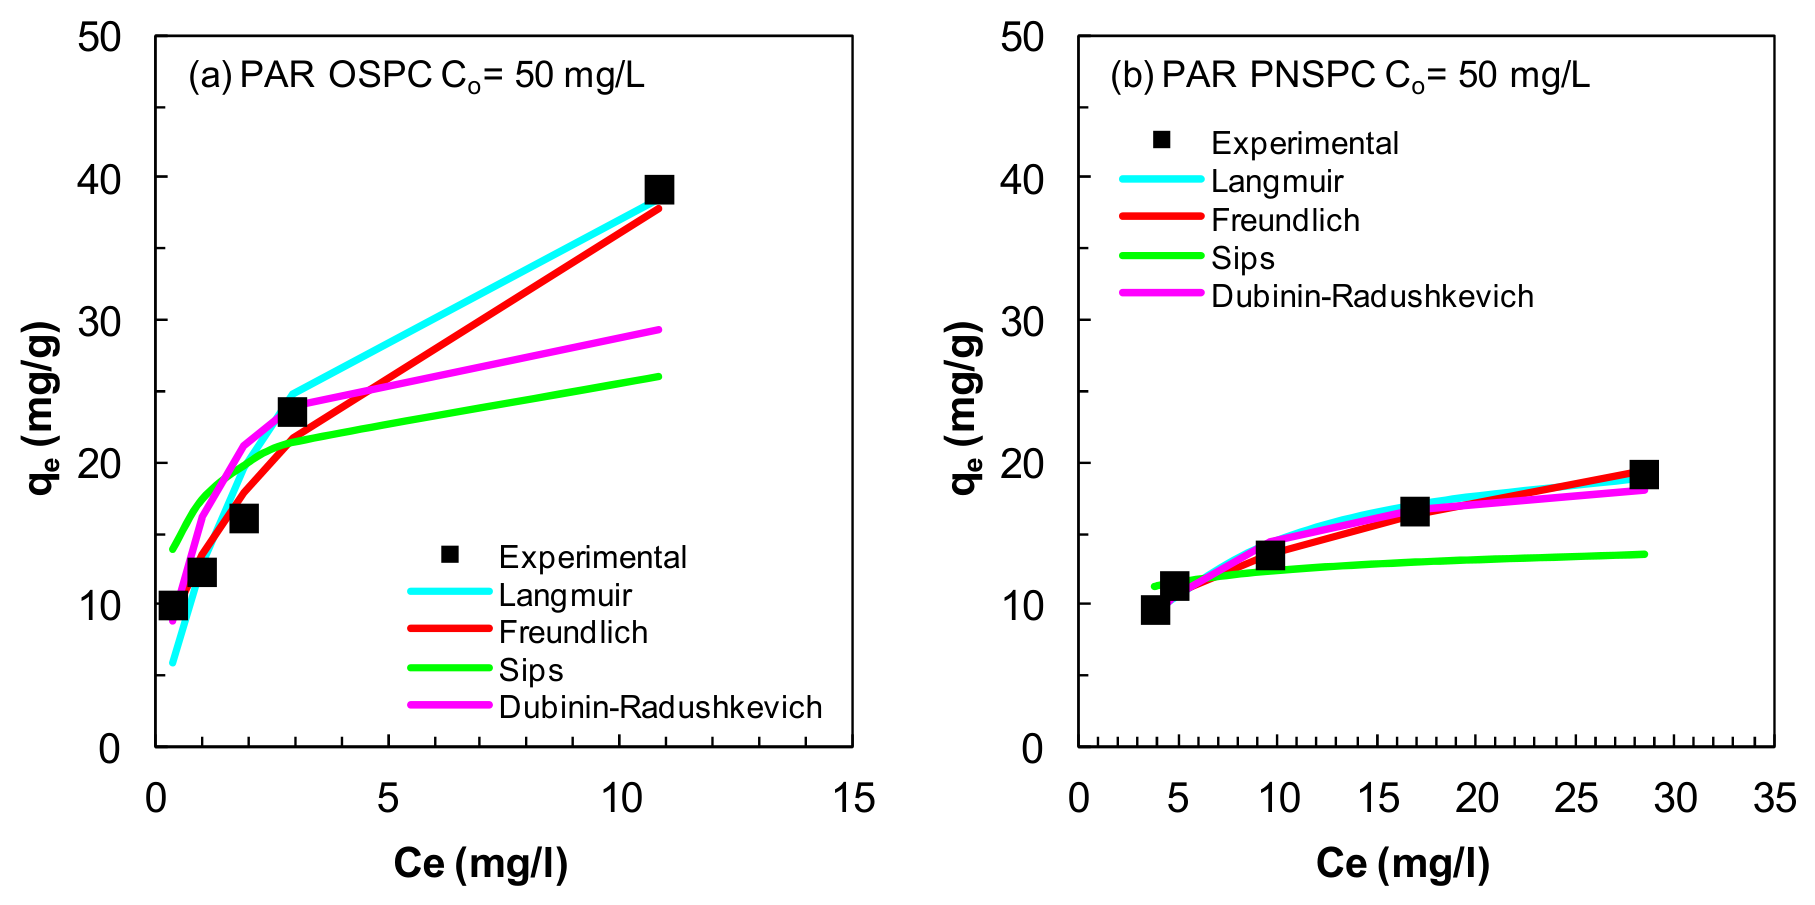
The adsorption isotherm describes the non-linear dynamic equilibrium relationship between the amount of a substance adsorbed on an adsorbent, qe, and its concentration in the solution at constant temperature in the solution, Ce. Adsorption isotherm models offer insights into the adsorption mechanism between the adsorbent and the adsorbate, and are therefore valuable for the design and optimization of the adsorption process. The concentration equilibrium for the solutions of the six drugs at an initial concentration of 50 mg/L with different amounts of OSPC and PNSPC adsorbents (S = 1, 2, 3, 4, and 5 g/L) were fitted to the Langmuir, Freundlich, Sips, and Dubinin–Radushkevich isotherm models, summarized in Table 8, via a non-linear regression method using the fminsearch command in MATLAB 2025b software. The adsorption isotherms are plotted in Figure 28 and Figures S1–S5 (Supplementary Material), along with the isotherm models. The estimated parameters of the isotherms and the statistical indicators are listed in Table 9 for OSPC and PNSPC. In general, the calculated values of adsorption capacity approximate the experimental ones. The adsorption capacity is directly proportional to the number of free sites available on the adsorbent surface, mainly in the initial stages of the adsorption process, where the concentration gradient is high and the adsorbate diffuses onto the surface. This is in accordance with the value of average free energy of adsorption—for the Dubinin–Radushkevich isotherm model, this is higher than 8 kJ mol−1, attributed to physisorption—favored by the adsorption with the phosphoric acid related to the pore size distribution. According to the statistical indicators, although the Langmuir and Freundlich isotherm models are appropriate for describing the adsorption of the six drugs, the Langmuir model better explains the adsorption of all the studied drugs onto the PNSPC adsorbent and of NOL and ENA drugs onto OSPC adsorbent, consistent with other studies on adsorption of drugs [24,25,38,40,43]. Additionally, the Freundlich multilayer adsorption isotherm model is slightly more appropriate to represent the adsorption of PAR, IBU, TER, and ASP adsorbates onto OSPC adsorbent, as was found by other authors [35,44]. However the difference would not be significant. This difference could be attributed to the fact that PAR, IBU, TER, and ASP pharmaceuticals have O-H band in the FTIR, and ENA also has similar O-H bonding structures to NOL.
Regarding adsorption kinetics, studies frequently report that the pseudo-second-order model best represents the data, indicating that the adsorption rate is often dependent on the concentration of both the adsorbate and the available adsorption sites, suggesting a chemisorption nature [6,9,10,12]. For adsorption isotherms, the Langmuir model is commonly found to be the best fit for these drugs, that describes homogeneous adsorption of the adsorbate in a monolayer on an adsorbent surface [6,9,12]. Thermodynamically, the adsorption of these pharmaceuticals is often found to be spontaneous and sometimes endothermic, suggesting that higher temperatures may favor the process in certain cases, although some studies suggest that temperature has a negligible effect, possibly due to the balance between endothermic dehydration and exothermic attachment processes [6,8,12]. For instance, a study on an AC prepared from ivory coral tree pods via pyrolysis at 800 °C and ZnCl2 activation revealed that IBP adsorption capacity increased to 96.3 mg/g with rising temperature, while it decreased to 50.4 mg/g for PCM, suggesting different thermodynamic behaviors [16].

4. Conclusions

The adsorption of six commercial pharmaceutical formulations of analgesics, antipyretics, and non-steroidal anti-inflammatory drugs (PAR, IBU, NOL, ENA, TER, and ASP) and their binary mixtures was studied at laboratory scale. Two biochars, one derived from olive stone (OSPC) and the other from pine nut shell (PNSPC), were used as they possess high removal efficiency. It is worth noting that both biochars demonstrated adequate adsorption capacity without the need for prior washing, which could improve the management and sustainability of water resources. The morphology of OSPC consisted of a highly developed hierarchical pore network, while PNSPC showed a more compact structure with restricted macroporosity, which likely limits its adsorption kinetics. Consequently, OSPC biochar provided greater accessibility and density of functional sites for the removal of pharmaceutical contaminants from aqueous matrices, highlighting the fundamental role of the precursor biomass architecture and surface chemistry in the design of efficient carbonaceous adsorbents. This morphological evidence was consistent with the BET surface areas, which were substantially larger for OSPC (1535 m2/g) than for PNSPC (1076 m2/g), further supporting the superior adsorption capacity of activated carbon derived from olive stones. It is worth mentioning that pharmaceutical formulations and their pure active ingredients differ minimally in terms of adsorption, with slight shielding of the excipients reducing the intensity of adsorption, particularly for ENA and ASP. Spectroscopic evidence from FTIR and Raman confirmed that adsorption occurs through a combination of pore filling, π-π interactions, and hydrogen bonding. The highest adsorption capacities for all drug formulations studied were achieved at pH 2. OSPC biochar exhibited the highest retention capacities for all drugs, varying between 28 mg/g for IBU and 45 mg/g for ENA. However, for PNSPC, the highest adsorption capacity was for ENA (22 mg/g), with a value of 19 mg/g obtained for the other drugs. Regarding the effect of adsorbent dosage, when its concentration increased from 1.0 to 5.0 g/L, adsorption efficiency improved by 30% for OSPC and 60% for PNSPC, reaching almost 100% for both biochars. The adsorption capacity of OSPC biochar at a 1 g/L dosage quadrupled when the initial drug concentration decreased from 50 to 10 mg/L, while for PNSPC, it doubled under the same conditions. Both biochars exhibited better-fitting kinetics for both pseudo-first-order and pseudo-second-order models, with the former slightly better for PNSPC and the latter for OSPC. The compounds in the binary mixtures of drugs could be removed in the simultaneous adsorption of two drugs. It is worth mentioning that ENA presented the greatest removal in the NOL+ENA mixture, followed by PAR in the PAR+IBU mixture. NOL was eliminated at a comparable percentage in the NOL+ASP mixture as in the NOL+IBU mixture followed by in the NOL+ENA mixture. ASP had the lowest removal in the NOL+ASP mixture. Since the wavelengths in the combination PAR-TER coincide, the absorbances were combined together. Furthermore OSPC biochar was applied to remove pharmaceutical formulations (initial concentration, 50 mg/L) for 14–15 consecutive cycles of each drug. This suggests that this biochar would be an alternative to consider for the treatment of water containing concentrations of the drugs from this study. It is worth noting that reusing this biochar in multiple cycles is more economical and may consume less energy than conventional thermal regeneration. Therefore, OSPC biochar, due to its excellent adsorption characteristics, could have future industrial applications. Specifically, its use is proposed for the removal of emerging contaminants as well as analgesic, antipyretic, and non-steroidal anti-inflammatory drugs in wastewater treatment plants.

Supplementary Materials

The following supporting information can be downloaded at: https://www.mdpi.com/article/10.3390/app16147157/s1, Figure S1: Experimental isotherm values (points) and values calculated by the isotherm models of IBU (Co = 50 mg/L, S = 1, 2, 3, 4, and 5 g/L) on (a) OSPC, (b) PNSPC; Figure S2: Experimental isotherm values (points) and values calculated by the isotherm models of NOL (Co = 50 mg/L, S = 1, 2, 3, 4, and 5 g/L) on (a) OSPC, (b) PNSPC; Figure S3: Experimental isotherm values (points) and values calculated by the isotherm models of ENA (Co = 50 mg/L, S = 1, 2, 3, 4, and 5 g/L) on (a) OSPC, (b) PNSPC; Figure S4: Experimental isotherm values (points) and values calculated by the isotherm models of TER (Co = 50 mg/L, S = 1, 2, 3, 4, and 5 g/L) on (a) OSPC, (b) PNSPC; Figure S5: Experimental isotherm values (points) and values calculated by the isotherm models of ASP (Co = 50 mg/L, S = 1, 2, 3, 4, and 5 g/L) on (a) OSPC, (b) PNSPC; Table S1: Calibration parameters for drug adsorption in biochars; Table S2: Parameters and statistical indicators of the nonlinear regression of the adsorption kinetics models for adsorption of PAR on OSPC and PNSPC adsorbents; Table S3: Parameters and statistical indicators of the nonlinear regression of the adsorption kinetics models for adsorption of IBU on OSPC and PNSPC adsorbents; Table S4: Parameters and statistical indicators of the nonlinear regression of the adsorption kinetics models for adsorption of NOL on OSPC and PNSPC adsorbents; Table S5: Parameters and statistical indicators of the nonlinear regression of the adsorption kinetics models for adsorption of ENA on OSPC and PNSPC adsorbents; Table S6: Parameters and statistical indicators of the nonlinear regression of the adsorption kinetics models for adsorption of TER on OSPC and PNSPC adsorbents; Table S7: Parameters and statistical indicators of the nonlinear regression of the adsorption kinetics models for adsorption of ASP on OSPC and PNSPC adsorbents.

Author Contributions

Conceptualization, R.L., M.J.S.J., S.A. and F.J.P.; methodology, R.L., M.J.S.J., S.A. and F.J.P.; software, R.L., M.J.S.J., S.A. and F.J.P.; validation, R.L., M.J.S.J., S.A. and F.J.P.; formal analysis, R.L., M.J.S.J., S.A. and F.J.P.; investigation, R.L., M.J.S.J., S.A. and F.J.P.; resources, R.L., M.J.S.J., S.A. and F.J.P.; data curation, R.L., M.J.S.J., S.A. and F.J.P.; writing—original draft preparation, R.L., M.J.S.J., S.A. and F.J.P.; writing—review and editing, R.L., M.J.S.J., S.A. and F.J.P.; visualization, R.L., M.J.S.J., S.A. and F.J.P.; supervision, M.J.S.J.; project administration, M.J.S.J.; funding acquisition, M.J.S.J. All authors have read and agreed to the published version of the manuscript.

Funding

This research was funded by the Spanish Ministry of Science, Innovation and Universities, MICIU/AEI/10.13039/501100011033/, and by European Regional Development Fund “ERDF A way of making Europe” grant number PID2021-126331OB-I00.

Institutional Review Board Statement

Not applicable.

Informed Consent Statement

Not applicable.

Data Availability Statement

The original contributions presented in this study are included in the article. Further inquiries can be directed to the corresponding author.

Conflicts of Interest

The authors declare no conflicts of interest.

Nomenclature

1/nfactor of heterogeneity of the Freundlich isotherm model (-)
a adsorption constant of the Elovich kinetic model (mg g−1)
b initial rate of adsorption of the Elovich kinetic model (mg g−1)
Ce, Co, Cconcentration of the adsorbate at the equilibrium, initial concentration of the adsorbate and concentration of the adsorbate at the time t, respectively (mg L−1)
Eaverage free energy of adsorption (kJ mol−1)
I value of the thickness of the boundary layer (mg g−1)
KD–Rthe activity coefficient related to mean free energy of adsorption of the Dubinin–Radushkevich isotherm model (mol2 kJ−2)
KFadsorbent–adsorbate equilibrium constant of the Freundlich isotherm model (mg1−1/n g−1L1/n)
KLadsorbent–adsorbate equilibrium constant of the Langmuir isotherm model (l mg−1)
KSadsorbent–adsorbate equilibrium constant of the Sips isotherm model (l mg−1)
k1equilibrium constant of the pseudo-first-order kinetic adsorption model (min−1)
k2equilibrium constant of the pseudo-second-order kinetic model (g mg−1 min−1)
kiequilibrium constant of the intra-particle diffusion kinetic model (mg g−1/min−0.5)
q, qm, qe, qtadsorption capacity, maximum adsorption capacity, adsorption capacities at the equilibrium and at any time, respectively (mg g−1)
Runiversal gas constant (8.314 J mol−1 K−1)
Smass of the adsorbent (g)
Tabsolute temperature (K)
Vvolume of the solution (mL)
Greek Letters
ɛPolanyi potential (kJ mol−1)
ηadsorption efficiency (%)

Abbreviations

The following abbreviations are used in this manuscript:
ASPaspirin
CACcommercial activated carbon
ENAenantyum
IBUibuprofen
NOLnolotil
OS olive stones
OSPColive stones activated with H3PO4 and carbonized
PARparacetamol
PNSpine nut shells
PNSPCpine nut shells activated with H3PO4 and carbonized
TERtermalgin

References

  1. Hogerzeil, H.V. The concept of essential medicines: Lessons for rich countries. BMJ 2004, 329, 1169–1172. [Google Scholar] [CrossRef] [Scilit] [PubMed]
  2. Lin, J.Y.; Zhang, Y.; Bian, Y.; Zhang, Y.X.; Du, R.Z.; Li, M.; Tan, Y.; Feng, X.S. Non-steroidal anti-inflammatory drugs (NSAIDs) in the environment: Recent updates on the occurrence, fate, hazards and removal technologies. Sci. Total Environ. 2023, 904, 166897. [Google Scholar] [CrossRef] [Scilit] [PubMed]
  3. Nand, S.; Singh, P.P.; Verma, S.; Mishra, S.; Patel, A.; Shukla, S.; Srivastava, P.K. Biochar for mitigating pharmaceutical pollution in wastewater: A sustainable solution. Sci. Total Environ. 2025, 966, 178743. [Google Scholar] [CrossRef] [Scilit] [PubMed]
  4. Huynh, N.C.; Nguyen, T.T.T.; Nguyen, D.T.C.; Tran, T.V. Occurrence, toxicity, impact and removal of selected non-steroidal anti-inflammatory drugs (NSAIDs): A review. Sci. Total Environ. 2023, 898, 165317. [Google Scholar] [CrossRef] [Scilit] [PubMed]
  5. Mlunguza, N.Y.; Ncube, S.; Mahlambi, P.N.; Chimuka, L.; Madikizela, L.M. Adsorbents and removal strategies of non-steroidal anti-inflammatory drugs from contaminated water bodies. J. Environ. Chem. Eng. 2019, 7, 103142. [Google Scholar] [CrossRef] [Scilit]
  6. Ahmed, M.J. Adsorption of non-steroidal anti-inflammatory drugs from aqueous solution using activated carbons. J. Environ. Manag. 2017, 190, 274–282. [Google Scholar] [CrossRef] [Scilit] [PubMed]
  7. Lillenberg, M.; Yurchenko, S.; Kipper, K.; Herodes, K.; Pihl, V.; Lõhmus, R.; Ivask, M.; Kuu, A.; Kutti, S.; Litvin, S.V.; et al. Presence of fluoroquinolones and sulfonamides in urban sewage sludge and their degradation as a result of composting. Int. J. Environ. Sci. Technol. 2010, 7, 307–312. [Google Scholar] [CrossRef] [Scilit]
  8. Ayati, A.; Tanhaei, B.; Beiki, H.; Krivoshapkin, P.; Krivoshapkina, E.; Tracey, C. Insight into the adsorptive removal of ibuprofen using porous carbonaceous materials: A review. Chemosphere 2023, 323, 138241. [Google Scholar] [CrossRef] [Scilit] [PubMed]
  9. Igwegbe, C.A.; Aniagor, C.O.; Oba, S.N.; Yap, P.S.; Iwuchukwu, F.U.; Liu, T.; Costa de Souza, E.; Ighalo, J.O. Environmental protection by the adsorptive elimination of acetaminophen from water: A comprehensive review. J. Ind. Eng. Chem. 2021, 104, 117–135. [Google Scholar] [CrossRef] [Scilit]
  10. Oba, S.N.; Ighalo, J.O.; Aniagor, C.O.; Igwegbe, C.A. Removal of ibuprofen from aqueous media by adsorption: A comprehensive review. Sci. Total Environ. 2021, 780, 146608. [Google Scholar] [CrossRef] [Scilit] [PubMed]
  11. Radovic, S.; Pap, S.; Niemi, L.; Prodanović, J.; Sekulic, M.T. A review on sustainable technologies for pharmaceutical elimination in wastewaters—A ubiquitous problem of modern society. J. Mol. Liq. 2023, 383, 122121. [Google Scholar] [CrossRef] [Scilit]
  12. Islam, M.A.; Nazal, M.K.; Sajid, M.; Suliman, M.A. Adsorptive removal of paracetamol from aqueous media: A review of adsorbent materials, adsorption mechanisms, advancements, and future perspectives. J. Mol. Liq. 2024, 396, 123976. [Google Scholar] [CrossRef] [Scilit]
  13. Zhan, D.; Ye, A.; Hou, T. Research progress on biochar-based material adsorption and removal of ibuprofen. Front. Environ. Sci. 2023, 11, 1327000. [Google Scholar] [CrossRef] [Scilit]
  14. Hoppen, M.I.; Carvalho, K.Q.; Ferreira, R.C.; Passig, F.H.; Pereira, I.C.; Rizzo-Domingues, R.C.P.; Lenzif, M.K.; Bottini, R.C.R. Adsorption and desorption of acetylsalicylic acid onto activated carbon of babassu coconut mesocarp. J. Environ. Chem. Eng. 2019, 7, 102862. [Google Scholar] [CrossRef] [Scilit]
  15. Kerkhoff, C.M.; Martinello, K.D.B.; Franco, D.S.; Netto, M.S.; Georgin, J.; Foletto, E.L.; Piccilli, D.G.A.; Silva, L.F.O.; Dotto, G.L. Adsorption of ketoprofen and paracetamol and treatment of a synthetic mixture by novel porous carbon derived from Butia capitata endocarp. J. Mol. Liq. 2021, 339, 117184. [Google Scholar] [CrossRef] [Scilit]
  16. Bouzidi, M.; Sellaoui, L.; Mohamed, M.; Franco, D.S.; Erto, A.; Badawi, M. A comprehensive study on paracetamol and ibuprofen adsorption onto biomass-derived activated carbon through experimental and theoretical assessments. J. Mol. Liq. 2023, 376, 121457. [Google Scholar] [CrossRef] [Scilit]
  17. Dilekoglu, M.F.; Yapici, M. Adsorption of naproxen pharmaceutical micropollutant from aqueous solutions on superior activated carbon synthesized from sheep manure: Kinetics, thermodynamics, and mechanism. J. Mol. Liq. 2023, 381, 121839. [Google Scholar] [CrossRef] [Scilit]
  18. Cabrita, I.; Ruiz, B.; Mestre, A.S.; Fonseca, I.M.; Carvalho, A.P.; Ania, C.O. Removal of an analgesic using activated carbons prepared from urban and industrial residues. Chem. Eng. J. 2010, 163, 249–255. [Google Scholar] [CrossRef] [Scilit]
  19. Ninh, P.T.T.; Dat, N.D.; Nguyen, M.L.; Dong, N.T.; Chao, H.P.; Tran, H.N. Two-stage preparation of highly mesoporous carbon for super-adsorption of paracetamol and tetracycline in water: Important contribution of pore filling and π-π interaction. Environ. Res. 2023, 218, 114927. [Google Scholar] [CrossRef] [Scilit] [PubMed]
  20. Georgin, J.; Salomón, Y.L.D.O.; Franco, D.S.; Netto, M.S.; Piccilli, D.G.; Perondi, D.; Silva, L.F.O.; Foletto, E.L.; Dotto, G.L. Development of highly porous activated carbon from Jacaranda mimosifolia seed pods for remarkable removal of aqueous-phase ketoprofen. J. Environ. Chem. Eng. 2021, 9, 105676. [Google Scholar] [CrossRef] [Scilit]
  21. Tomul, F.; Arslan, Y.; Kabak, B.; Trak, D.; Kendüzler, E.; Lima, E.C.; Tran, H.N. Peanut shells-derived biochars prepared from different carbonization processes: Comparison of characterization and mechanism of naproxen adsorption in water. Sci. Total Environ. 2020, 726, 137828. [Google Scholar] [CrossRef] [Scilit] [PubMed]
  22. Su, Q.; Ren, F.; Zhang, Y.; Wang, Y.; Cao, S.; Li, Z.; Shen, Y.; Li, H.; Su, Y.; Wang, Y.; et al. Adsorption of ibuprofen using biomass carbon derived from one-step pyrolysis of ginkgo leaves. Ind. Crops Prod. 2025, 226, 120739. [Google Scholar] [CrossRef] [Scilit]
  23. Czech, B.; Kończak, M.; Rakowska, M.; Oleszczuk, P. Engineered biochars from organic wastes for the adsorption of diclofenac, naproxen and triclosan from water systems. J. Clean. Prod. 2021, 288, 125686. [Google Scholar] [CrossRef] [Scilit]
  24. Guimarães, T.G.S.; Barros, L.A.; Silva, R.S.; Gonzalez, M.H.; Carrilhoc, E.N.V.M.; Labutoa, G. Synthesis and characterization of biochars modified with natural deep eutectic solvent (NADES) for dipyrone removal from aqueous medium. Sustain. Chem. Pharm. 2023, 35, 101205. [Google Scholar] [CrossRef] [Scilit]
  25. dos Reis Oliveira, M.; Paulino, I.M.R.; Resende, J.F.; Simão, L.; Vieira, M.F.; Bergamasco, R.; Vieira, A.M.S. Valorization of biomass ash for the effective removal of dipyrone from water: An efficient and low-cost option. J. Chem. Technol. Biotechnol. 2023, 98, 1690–1702. [Google Scholar] [CrossRef] [Scilit]
  26. Royal Decree 1/2001, of July 20, Which Approves the Consolidated Text of the Water Law. BOE. 2001. Available online: https://www.boe.es/eli/es/rdlg/2001/07/20/1 (accessed on 4 May 2026).
  27. Vyas, A.J.; Jha, S.A.; Patel, A.B.; Patel, A.I.; Shah, S.R.; Sheth, D.B. Review on simultaneous equation method (Vierodt’s Method). Asian J. Pharm. Anal. 2022, 12, 149–156. [Google Scholar] [CrossRef] [Scilit]
  28. San José, M.J.; López, R.; Alvarez, S.; Peñas, F.J. Bioadsorbents for the Removal of Pollutants in Wastewater: Adsorption Kinetics, Validation Test Using Methylene Blue and Methyl Orange. Appl. Sci. 2026, 16, 1512. [Google Scholar] [CrossRef] [Scilit]
  29. D3860-98; Standard Practice for Determination of Adsorptive Capacity of Activated Carbon by Aqueous Phase Isotherm Technique. ASTM International: West Conshohocken, PA, USA, 2020.
  30. Coates, J. Interpretation of Infrared Spectra, A Practical Approach. In Encyclopedia of Analytical Chemistry; Meyers, R.A., Ed.; Wiley: Chichester, UK, 2000; Volume 12, pp. 10815–10837. [Google Scholar]
  31. Silverstein, R.M.; Webster, F.X.; Kiemle, D.J.; Bryce, D.L. Infrared Spectroscopy. In Spectrometric Identification of Organic Compounds, 8th ed.; Wiley: Chichester, UK, 2014; pp. 71–125. [Google Scholar]
  32. Al-Ma’abreh, A.M.; Al-Essa, E.M.; Hmedat, D.A.; Edris, G.; Odeh, F.F.; Hamed, M. Green remediation: Casuarina equisetifolia fruit-based activated carbon for pharmaceutical removal. Sci. Prog. 2025, 108, 00368504251382003. [Google Scholar] [CrossRef] [Scilit] [PubMed]
  33. Cançado, L.G.; Takai, K.; Enoki, T.; Endo, M.; Kim, Y.A.; Mizusaki, H.; Jorio, A.; Coelho, L.N.; Magalhães-Paniago, R.; Pimenta, M.A. General equation for the determination of the crystallite size La of nanographite by Raman spectroscopy. Appl. Phys. Lett. 2006, 88, 163106. [Google Scholar] [CrossRef] [Scilit]
  34. Bouchelkia, N.; Benazouz, K.; Mameri, A.; Belkhiri, L.; Hamri, N.; Belkacemi, H.; Zoukel, A.; Amrane, A.; Aoulmi, F.; Mouni, L. Study and characterization of H3PO4 activated carbons prepared from jujube stones for the treatment of industrial textile effluents. Processes 2023, 11, 2694. [Google Scholar] [CrossRef] [Scilit]
  35. Delgado-Moreno, L.; Bazhari, S.; Gasco, G.; Ménde, A.; El Azzouzi, M.; Romero, E. New insights into the efficient removal of emerging contaminants by biochars and hydrochars derived from olive oil wastes. Sci. Total Environ. 2021, 752, 141838. [Google Scholar] [CrossRef] [Scilit] [PubMed]
  36. Wafaa, Y.; Akazdam, S.; Zyade, S.; Chafiq, M.; Ko, Y.G.; Chafi, M.; Tahiri, M.; Alrashdi, A.A.; Lgaz, H. Mechanistic insights into methylene blue removal via olive stone-activated carbon: A study on surface porosity and characterization. J. Saudi Chem. Soc. 2023, 27, 101692. [Google Scholar] [CrossRef] [Scilit]
  37. Ozcan, D.O.; Hendekcï, M.C.; Ovez, B. Enhancing the adsorption capacity of organic and inorganic pollutants onto impregnated olive stone derived activated carbon. Heliyon 2024, 10, e32792. [Google Scholar] [CrossRef] [Scilit] [PubMed]
  38. García-Mateos, F.J.; Ruiz-Rosas, R.; Marqués, M.D.; Cotoruelo, L.M.; Rodríguez-Mirasol, J.; Cordero, T. Removal of paracetamol on biomass-derived activated carbon: Modeling the fixed bed breakthrough curves using batch adsorption experiments. Chem. Eng. J. 2015, 279, 18–30. [Google Scholar] [CrossRef] [Scilit]
  39. Naushad, M.; Khan, M.A.; Alothman, Z.A.; Khan, M.R.; Kuma, M. Adsorption of methylene blue on chemically modified pine nut shells in single and binary systems: Isotherms, kinetics, and thermodynamic studies. Desalin. Water Treat. 2016, 57, 15848–15861. [Google Scholar] [CrossRef] [Scilit]
  40. Hashemzadeh, F.; Ariannezhad, M.; Derakhshandeh, S.H. Sustainable removal of tetracycline and paracetamol from water using magnetic activated carbon derived from pine fruit waste. Sci. Rep. 2024, 14, 16346. [Google Scholar] [CrossRef] [Scilit] [PubMed]
  41. Kim, H.J.; Han, J.W.; Yu, J.H.; Jun, B.M.; Chon, K. Adsorption of charged synthetic organic dyes by pine nut husk biochars modified with hydroxyapatite: Adsorption mechanisms and reusability. Desalin. Water Treat. 2025, 321, 100970. [Google Scholar] [CrossRef] [Scilit]
  42. Al-sharify, Z.T.; Muhaisen, L.F.; Alsharify, T.A.; Al-sharify, N.; Faisa, F. Removal of Analgesic Paracetamol From Wastewater Using Dried Olive Stone. Int. J. Mech. Eng. Technol. 2018, 9, 293–299. [Google Scholar]
  43. Medjdoub, F.; Louhab, K.; Hamouche, A. Comparative study of the adsorption of paracetamol from aqueous solution on olive stones and date pits. Desalin. Water Treat. 2018, 10, 225–233. [Google Scholar] [CrossRef] [Scilit]
  44. Narloch, I.; Wejnerowska, G.; Wojewodzki, P. Biosorption of Aspirin, Salicylic Acid, Ketoprofen, and Naproxen in Aqueous Solution by Walnut Shell Biochar: Characterization, Equilibrium, and Kinetic Studies. Molecules 2025, 30, 4731. [Google Scholar] [CrossRef] [Scilit] [PubMed]
  45. Tanhaei, B.; Ayati, A.; Iakovleva, E.; Sillanpää, M. Efficient carbon interlayed magnetic chitosan adsorbent for anionic dye removal: Synthesis, characterization and adsorption study. Int. J. Biol. Macromol. 2020, 164, 3621–3631. [Google Scholar] [CrossRef] [Scilit] [PubMed]
Figure 1. (a) UV-Vis spectra of a solution of paracetamol. (b) Concentration-absorbance calibration of paracetamol.
Applsci 16 07157 g001
Figure 2. Block diagram of the preparation of adsorbents.
Applsci 16 07157 g002
Figure 3. FTIR spectra of (a) OSPC and the corresponding loaded samples, (b) PNSPC and the corresponding loaded samples, (c) pure pharmaceutical formulations, (d) active pharmaceutical ingredients.
Applsci 16 07157 g003
Figure 4. Raman spectra of fresh and drug-loaded activated carbons: (a) PNSPC, and (b) OSPC.
Applsci 16 07157 g004
Figure 5. SEM images of the activated carbons: (a) PNSPC at 470× magnification, (b) PNSPC at 1800×, (c) PNSPC at 10,000×, (d) OSPC at 470×, (e) OSPC at 1800×, (f) OSPC at 10,000×.
Applsci 16 07157 g005
Figure 6. XRD diffractograms of OSPC and PNSPC biocarbons.
Applsci 16 07157 g006
Figure 7. Pore size distribution of (a) olive stones, (b) pine nut shells, and (c) commercial activated carbon.
Applsci 16 07157 g007
Figure 8. Effect of pH on drug adsorption efficiency on OSPC and PNSPC according to triplicate adsorption experiments. Co = 50 mg/L and S = 5 g/L. (a) PAR, (b) IBU, (c) NOL, (d) ENA, (e) TER, (f) ASP.
Applsci 16 07157 g008
Figure 9. Temporal evolution of paracetamol adsorption performance of OSPC and PNSPC. Co = 50 mg/L. Adsorption capacity (a) and adsorption efficiency (b) of OSPC, S = 1 g/L (pH of the solution 2.49), 3 g/L (pH of the solution 2.23), and 5 g/L (pH of the solution 2.15); adsorption capacity (c) and adsorption efficiency (d) of PNSPC, S = 1 g/L (pH of the solution 2.61), 3 g/L (pH of the solution 2.38), and 5 g/L (pH of the solution 2.17).
Applsci 16 07157 g009
Figure 10. Temporal evolution of ibuprofen adsorption performance of OSPC and PNSPC. Co = 50 mg/L. Adsorption capacity (a) and adsorption efficiency (b) of OSPC, S = 1 g/L (pH of the solution 2.37), 3 g/L (pH of the solution 2.25), and 5 g/L (pH of the solution 2.15); adsorption capacity (c) and adsorption efficiency (d) of PNSPC, S = 1 g/L (pH of the solution 2.31), 3 g/L (pH of the solution 2.24), and 5 g/L (pH of the solution 2.15).
Applsci 16 07157 g010
Figure 11. Temporal evolution of nolotil adsorption performance of OSPC and PNSPC. Co = 50 mg/L. Adsorption capacity (a) and adsorption efficiency (b) of OSPC, S = 1 g/L (pH of the solution 2.36), 3 g/L (pH of the solution 2.17), and 5 g/L (pH of the solution 2.11); adsorption capacity (c) and adsorption efficiency (d) of PNSPC, S = 1 g/L (pH of the solution 2.66), 3 g/L (pH of the solution 2.54), and 5 g/L (pH of the solution 2.32).
Applsci 16 07157 g011aApplsci 16 07157 g011b
Figure 12. Temporal evolution of enantyum adsorption performance of OSPC and PNSPC. Co = 50 mg/L. Adsorption capacity (a) and adsorption efficiency (b) of OSPC, S = 1 g/L (pH of the solution 2.40), 3 g/L (pH of the solution 2.24), and 5 g/L (pH of the solution 2.15); adsorption capacity (c) and adsorption efficiency (d) of PNSPC, S = 1 g/L (pH of the solution 2.42), 3 g/L (pH of the solution 2.29), and 5 g/L (pH of the solution 2.17).
Applsci 16 07157 g012
Figure 13. Temporal evolution of termalgin adsorption performance of OSPC and PNSPC. Co = 50 mg/L. Adsorption capacity (a) and adsorption efficiency (b) of OSPC, S = 1 g/L (pH of the solution 2.39), 3 g/L (pH of the solution 2.21), and 5 g/L (pH of the solution 2.18); adsorption capacity (c) and adsorption efficiency (d) of PNSPC, S = 1 g/L (pH of the solution 2.45), 3 g/L (pH of the solution 2.26), and 5 g/L (pH of the solution 2.11).
Applsci 16 07157 g013
Figure 14. Temporal evolution of aspirin adsorption performance of OSPC and PNSPC. Co = 50 mg/L. Adsorption capacity (a) and adsorption efficiency (b) of OSPC, S = 1 g/L (pH of the solution 2.49), 3 g/L (pH of the solution 2.36), and 5 g/L (pH of the solution 2.20); adsorption capacity (c) and adsorption efficiency (d) of PNSPC, S = 1 g/L (pH of the solution 2.52), 3 g/L (pH of the solution 2.41), and 5 g/L (pH of the solution 2.23).
Applsci 16 07157 g014aApplsci 16 07157 g014b
Figure 15. Time evolution of paracetamol adsorption performance. S = 1 g/L. Adsorption capacity (a) and adsorption efficiency (b) of OSPC, Co = 10 mg/L (pH of the solution 2.40), 25 mg/L (pH of the solution 2.47), and 50 mg/L (pH of the solution 2.49); adsorption capacity (c) and adsorption efficiency (d) of PNSPC, Co = 10 mg/L (pH of the solution 2.48), 25 mg/L (pH of the solution 2.52), and 50 mg/L (pH of the solution 2.61).
Applsci 16 07157 g015
Figure 16. Time evolution of Ibuprofen adsorption performance. S = 1 g/L. Adsorption capacity (a) and adsorption efficiency (b) of OSPC, Co = 10 mg/L (pH of the solution 2.13), 25 mg/L (pH of the solution 2.24), and 50 mg/L (pH of the solution 2.31); adsorption capacity (c) and adsorption efficiency (d) of PNSPC, Co = 10 mg/L (pH of the solution 2.25), 25 mg/L (pH of the solution 2.31), and 50 mg/L (pH of the solution 2.37).
Applsci 16 07157 g016
Figure 17. Time evolution of Nolotil adsorption performance. S = 1 g/L. Adsorption capacity (a) and adsorption efficiency (b) of OSPC, Co = 10 mg/L (pH of the solution 2.31), 25 mg/L (pH of the solution 2.33), and 50 mg/L (pH of the solution 2.36); adsorption capacity (c) and adsorption efficiency (d) of PNSPC, Co = 10 mg/L (pH of the solution 2.33), 25 mg/L (pH of the solution 2.48), and 50 mg/L (pH of the solution 2.66).
Applsci 16 07157 g017aApplsci 16 07157 g017b
Figure 18. Time evolution of Enantyum adsorption performance. S = 1 g/L. Adsorption capacity (a) and adsorption efficiency (b) of OSPC, Co = 10 mg/L (pH of the solution 2.27), 25 mg/L (pH of the solution 2.37), and 50 mg/L (pH of the solution 2.40); adsorption capacity (c) and adsorption efficiency (d) of PNSPC, Co = 10 mg/L (pH of the solution 2.31), 25 mg/L (pH of the solution 2.38), and 50 mg/L (pH of the solution 2.42).
Applsci 16 07157 g018
Figure 19. Time evolution of Termalgin adsorption performance. S = 1 g/L. Adsorption capacity (a) and adsorption efficiency (b) of OSPC, Co = 10 mg/L (pH of the solution 2.16), 25 mg/L (pH of the solution 2.24), and 50 mg/L (pH of the solution 2.39); adsorption capacity (c) and adsorption efficiency (d) of PNSPC, Co = 10 mg/L (pH of the solution 2.21), 25 mg/L (pH of the solution 2.27), and 50 mg/L (pH of the solution 2.45).
Applsci 16 07157 g019
Figure 20. Time evolution of Aspirin adsorption performance. S = 1 g/L. Adsorption capacity (a) and adsorption efficiency (b) of OSPC, Co = 10 mg/L (pH of the solution 2.39), 25 mg/L (pH of the solution 2.42), and 50 mg/L (pH of the solution 2.49); adsorption capacity (c) and adsorption efficiency (d) of PNSPC, Co = 10 mg/L (pH of the solution 2.41), 25 mg/L (pH of the solution 2.46), and 50 mg/L (pH of the solution 2.52).
Applsci 16 07157 g020aApplsci 16 07157 g020b
Figure 21. Adsorption efficiency evolution with subsequent adsorption cycles of ENA with Co = 50 mg/L (a) 5 g/L of OSPC adsorbent (pH of the solution 2.14), (b) 20 g/L of OSPC adsorbent (pH of the solution 2.04).
Applsci 16 07157 g021
Figure 22. Time evolution of experimental values of adsorption capacity of paracetamol and calculated with the adsorption models S = 1 g/L. For OSPC (a) Co = 50 mg/L, (b) Co = 25 mg/L, (c) Co = 10 mg/L. For PSPC (d) Co = 50 mg/L, (e) Co = 25 mg/L, (f) Co = 10 mg/L.
Applsci 16 07157 g022aApplsci 16 07157 g022b
Figure 23. Time evolution of experimental values of adsorption capacity of ibuprofen and calculated with the adsorption models S = 1 g/L. For OSPC (a) Co = 50 mg/L, (b) Co = 25 mg/L, (c) Co = 10 mg/L. For PSPC (d) Co = 50 mg/L, (e) Co = 25 mg/L, (f) Co = 10 mg/L.
Applsci 16 07157 g023aApplsci 16 07157 g023b
Figure 24. Time evolution of experimental values of adsorption capacity of nolotil and calculated with the adsorption models S = 1 g/L. For OSPC (a) Co = 50 mg/L, (b) Co = 25 mg/L, (c) Co = 10 mg/L. For PSPC (d) Co = 50 mg/L, (e) Co = 25 mg/L, (f) Co = 10 mg/L.
Applsci 16 07157 g024aApplsci 16 07157 g024b
Figure 25. Time evolution of experimental values of adsorption capacity of Enantyum and calculated with the adsorption models S = 1 g/L. For OSPC (a) Co = 50 mg/L, (b) Co = 25 mg/L, (c) Co = 10 mg/L. For PSPC (d) Co = 50 mg/L, (e) Co = 25 mg/L, (f) Co = 10 mg/L.
Applsci 16 07157 g025aApplsci 16 07157 g025b
Figure 26. Time evolution of experimental values of adsorption capacity of termalgin and calculated with the adsorption models S = 1 g/L. For OSPC (a) Co = 50 mg/L, (b) Co = 25 mg/L, (c) Co = 10 mg/L. For PSPC (d) Co = 50 mg/L, (e) Co = 25 mg/L, (f) Co = 10 mg/L.
Applsci 16 07157 g026aApplsci 16 07157 g026b
Figure 27. Time evolution of experimental values of adsorption capacity of aspirin and calculated with the adsorption models S = 1 g/L. For OSPC (a) Co = 50 mg/L, (b) Co = 25 mg/L, (c) Co = 10 mg/L. For PSPC (d) Co = 50 mg/L, (e) Co = 25 mg/L, (f) Co = 10 mg/L.
Applsci 16 07157 g027aApplsci 16 07157 g027b
Figure 28. Experimental isotherm values (points) and values calculated by the isotherm models of PAR (Co = 50 mg/L, S = 1, 2, 3, 4, and 5 g/L) on (a) OSPC, (b) PNSPC.
Applsci 16 07157 g028
Table 1. Drug formulation (commercial formats): active principles, properties and excipients.
Pharmaceutical (Format)Active PrincipleStructureMolecular Weight
(g/mol)
Density
(kg/m3)
Solubility
(mg/mL)
pKaExcipients
Paracetamol (tablets)Paracetamol
C8H9NO2
(650 mg; 49.9%)
Applsci 16 07157 i001151.165129312.789.5Pregelatinized maize starch, microcrystalline cellulose, sodium starch glycolate, povidone.
Ibuprofen (tablets)Ibuprofen
C13H18O2
(600 mg; 77.4%)
Applsci 16 07157 i002206.28510300.021 4.45Core: croscarmellose sodium, hypromellose, lactose monohydrate, alline cellulose, pregelatinized corn starch, colloidal silica, magnesium stearate.
Coating: hypromellose, titanium dioxide, talc.
Nolotil (capsules)Nolotil
(Metamizole Magnesium)
C26H32MgN6O8S2
(575 mg; 95.8%)
Applsci 16 07157 i003645.00168010−1.4/−0.54Magnesium stearate, indigotine, erythrosine, titanium dioxide, gelatin.
Enantyum (tablets)Enantyum
(Dexketoprofen)
C16H14O3
(25 mg; 9.4%)
Applsci 16 07157 i004254.2812500.0214.5Core: corn starch, microcrystalline cellulose, sodium starch glycolate, glycerol distearate.
Coating: hypromellose, titanium dioxide, macrogol.
Termalgin (tablets)Termalgin
(Paracetamol, Phenylephrine bitartrate, Chlorphenamine maleate)
C8H9NO2
(500 mg; 81.4%) C13H19NO8 C20H23ClN2O4
Applsci 16 07157 i005Applsci 16 07157 i006Applsci 16 07157 i007Applsci 16 07157 i008151.165
317.29
90.86
1293
1122
1198
12.78
161
250
9.5
9.07
9.47
Core: pregelatinized corn starch, calcium carbonate, alginic acid, crospovidone, povidone, magnesium stearate, colloidal silica.
Coating: opadry white, carnauba wax.
Aspirin (effervescent granules)Aspirin
(Acetylsalicylic acid)
C9H8O4
(500 mg; 14.6%)
Phenylephrine C9H13NO2
(8.21 mg; 0.24%), Chlorphenamine
C16H19N2Cl (1.41 mg; 0.04%)
Applsci 16 07157 i009Applsci 16 07157 i010Applsci 16 07157 i011180.16
167.21
274.79
1400
1200
1108
3.49
100
550
3.5
9.07
3.64
Citric acid, sodium bicarbonate, lemon flavor, quinoline yellow dye.
Table 2. Raman spectroscopic analysis of fresh and drug-loaded activated carbons.
AdsorbentD-Band (cm−1)G-Band (cm−1)ID/IG RatioLa (nm)
OSPC135115980.84722.7
OSPC/PAR135115900.86122.3
OSPC/IBU134915870.85322.5
OSPC/NOL134915900.88921.6
OSPC/ENA134715870.85722.4
OSPC/TER134715870.87222.0
OSPC/ASP134215860.87122.1
PNSPC134915970.82723.2
PNSPC/PAR134615870.86722.2
PNSPC/IBU134115900.87522.0
PNSPC/NOL134715870.89721.4
PNSPC/ENA134215870.83523.0
PNSPC/TER134215890.87122.1
PNSPC/ASP134715870.87921.9
Table 3. Textural properties of activated adsorbents obtained from N2 adsorption–desorption isotherms.
AdsorbentSBET (m2 g−1)dp (nm)VT (cm3 g−1)
OSPC15352.2264 0.854342
PNSPC10761.61260.433962
CAC9212.94180.6775
Table 4. Previous studies on drugs adsorption.
AdsorbentActivating MethodOperating ConditionsAdsorption Capacity (mg/g)Adsorption Efficiency (%)ModelsReferences
PAR
Olive stonesWashingCo = 200 mg/L, S = 2.5 g/L, pH = 7, T = 25 °C, t = 3 h3.3390 [42]

Olive stonesHexane + thermal treatmentCo = 20–100 μm, S = 10 mg, V = 25 mL, pH = 6, T = 20 °C, t = 3 h37.1298.19PSO
Langmuir
[43]
Olive stonesH3PO4+ thermal treatmentCo = 0.3–10 mg/L, S = 100 mg/L, T = 15–35 °C, t = 10 h40–45-Langmuir[38]
Pine nut shellsCarbonization/H2SO4/co-precipitationCo = 20 mg/L, S = 0.4–2 g/L, pH = 6, T = 25 °C, t = 2 h41.7 PSO
Langmuir
[40]
IBU
Olive stonesThermal treatmentCo = 4.7 g/L, S = 0.05 g, T = 20 °C6 10−343PSO
Freundlich
[35]
NOL
Yeast/cork/coffee wastesThermal treatmentCo = 20–340 mg/L, S = 4 g/L, pH 6, t = 30 min30.9/52.1/47.0831/52/47PFO, PSO
Langmuir
[24]
Eucalyptus wood chips ashBurningCo = 20 mg/L, S = 0.4–40 g/L, V = 25 mL, T = 25, 35, 45 °C, pH 2–12, t = 24 h4286PFO
Langmuir
[25]
ASP
Walnut shellPyrolysisCo = 25 mg/L, S = 1 g/L, T = room, pH 2–9, t = 1 h15.2896.1–99.8PSO
Freundlich
[44]
Table 5. Cumulative adsorption capacity and removal with subsequent adsorption cycles of ENA with Co = 50 mg/L on OSPC biocarbon.
OSPC
S = 5 g/LS = 20 g/L
Cycle Numberη (%)Removal (mg)η (%)Removal (mg)
198.244.9198.374.92
291.294.5698.144.91
389.154.4697.814.89
487.374.3796.144.81
5 95.624.78
6 93.164.66
7 92.044.60
8 89.714.49
9 88.364.42
10 87.824.39
11 86.934.35
12 86.484.32
13 86.134.31
14 85.934.30
15 85.484.27
18.30 68.41
qexp (mg/g) =36.61qexp (mg/g) =34.20
Table 6. Percentage of pharmaceutical formulations removal in binary mixtures.
MIXTURENOL
Removal (%)
IBU
Removal (%)
ASP
Removal (%)
PAR
Removal (%)
ENA
Removal (%)
TER
Removal (%)
NOL+ASP41 55
NOL+IBU4251
NOL+ENA23 97
PAR+IBU 46 66
PAR+TER * 78 * 78 *
* combined value.
Table 7. Kinetic models equations.
ModelModel EquationEquation
Pseudo-first orderqt = qe (1 − e−k1·t)(3)
Pseudo-second order q t = t 1 k 2 q e max 2 + t q e max (4)
Intra-particle diffusionqt = ki·t0.5 + I (5)
Elovichqt = a + b lnt (6)
Table 8. Adsorption isotherm models.
ModelModel EquationEquation
Langmuir q e q m = K L C e 1 + K L C e (7)
Freundlich q e = K F C e 1 / n (8)
Sips q e q m = ( K S C e ) ) 1 / n 1 + ( K S C e ) ) 1 / n (9)
Dubinin–Radushkevichqe = qm exp(−KD–R ε2)(10)
ε = RT ln (1 + 1/Ce)(11)
E = 1 2 K D R (12)
Table 9. Parameters and statistical indicators of the non-linear regression of the isotherm models for adsorption of the six drugs on OSPC and PNSPC adsorbents.
OSPC PARIBUNOLENATERASP
ParametersLangmuir
qm (mg/g)48.333.11196.08108.6948.3133.44
KL (L/mg)0.360.200.00980.1020.290.46
R20.9480.9760.9980.9700.9510.911
RMSE2.5612.2510.4002.1562.4042.965
RSS32.78725.3440.79923.23428.89343.942
AIC13.40312.116−5.17111.68112.77114.867
ParametersFreundlich
KF (mg1−1/n g−1L1/n)13.598.302.1210.5912.1912.81
n2.332.591.091.312.223.50
R20.9820.9920.9960.9820.9880.966
RMSE1.5230.6610.5921.7491.2661.821
RSS11.6032.1821.75415.2898.00816.582
AIC8.209−0.146−1.2389.5886.3559.994
ParametersSips
KS (L/mg)0.540.610.160.360.510.77
n2.603.031.341.412.463.79
R20.9070.9550.9840.7700.9120.910
RMSE6.8005.4085.2638.4256.5336.157
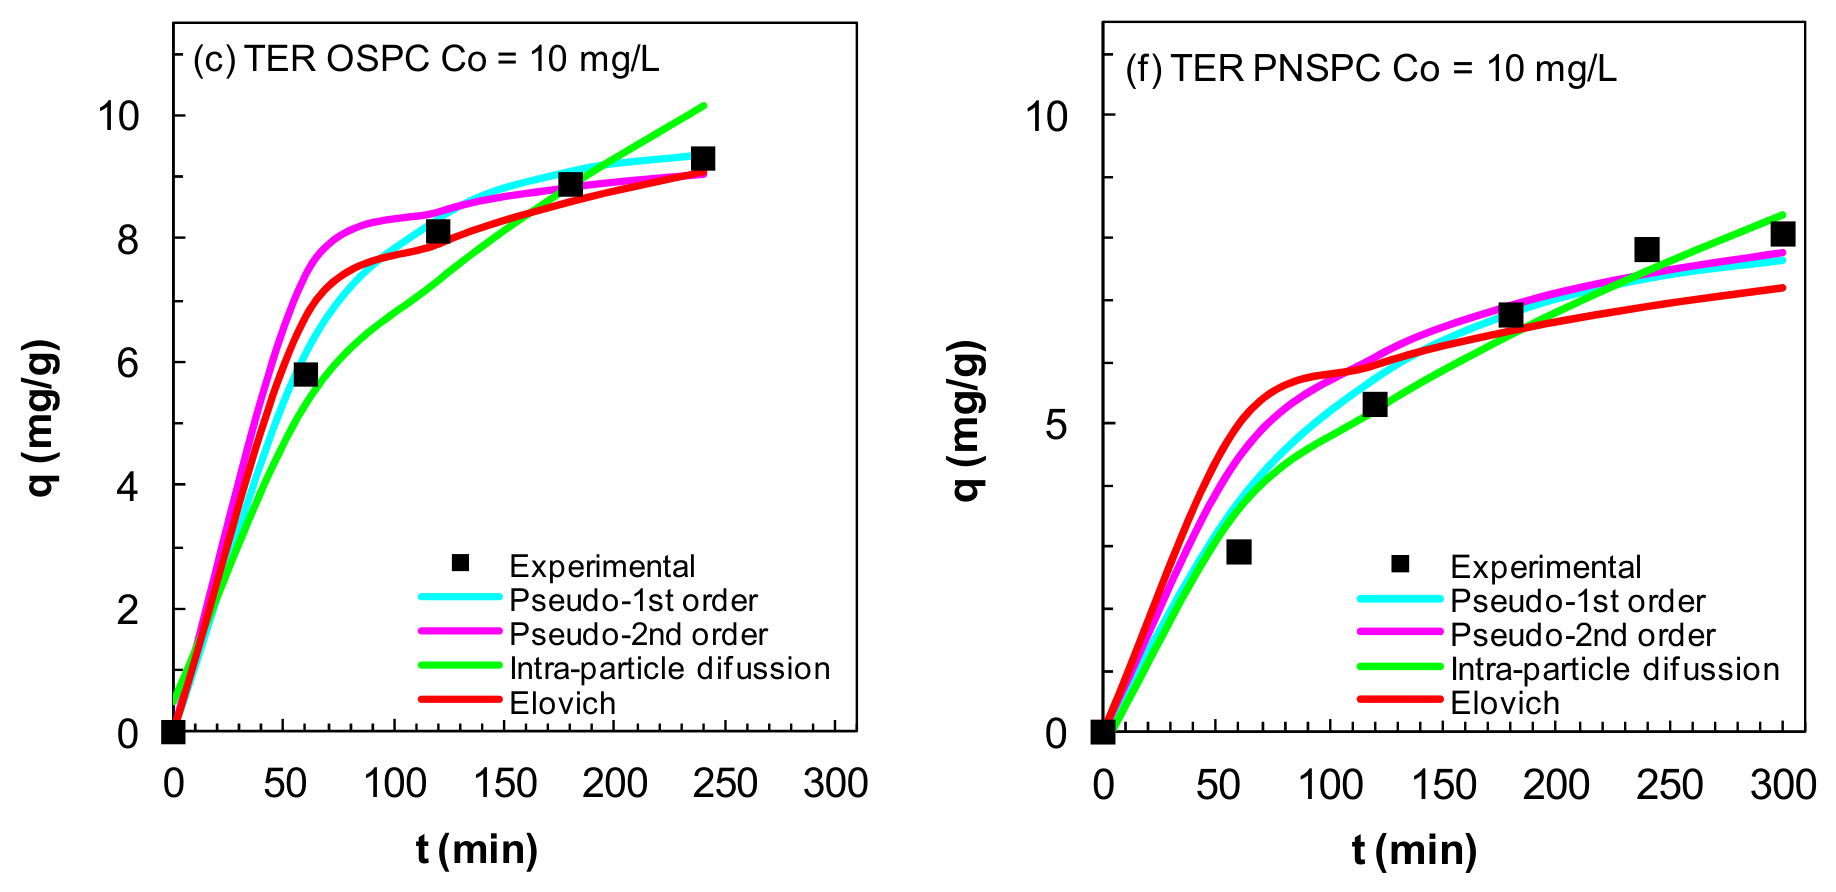
RSS231.22146.228138.516354.928213.390189.519
AIC23.18020.87920.60832.00722.76822.175
ParametersDubinin–Radushkevich
qm (mg/g)31.9824.9147.2752.5731.9724.12
KD-R (mol2 kJ−2)0.00040.00080.00380.0010.00050.0003
E (kJ mol−1)35.3525.0011.4722.3631.6240.82
R20.8110.8550.9880.9180.8250.749
RMSE5.2542.6310.9284.0714.8364.050
RSS138.04334.5984.30382.851116.93017.987
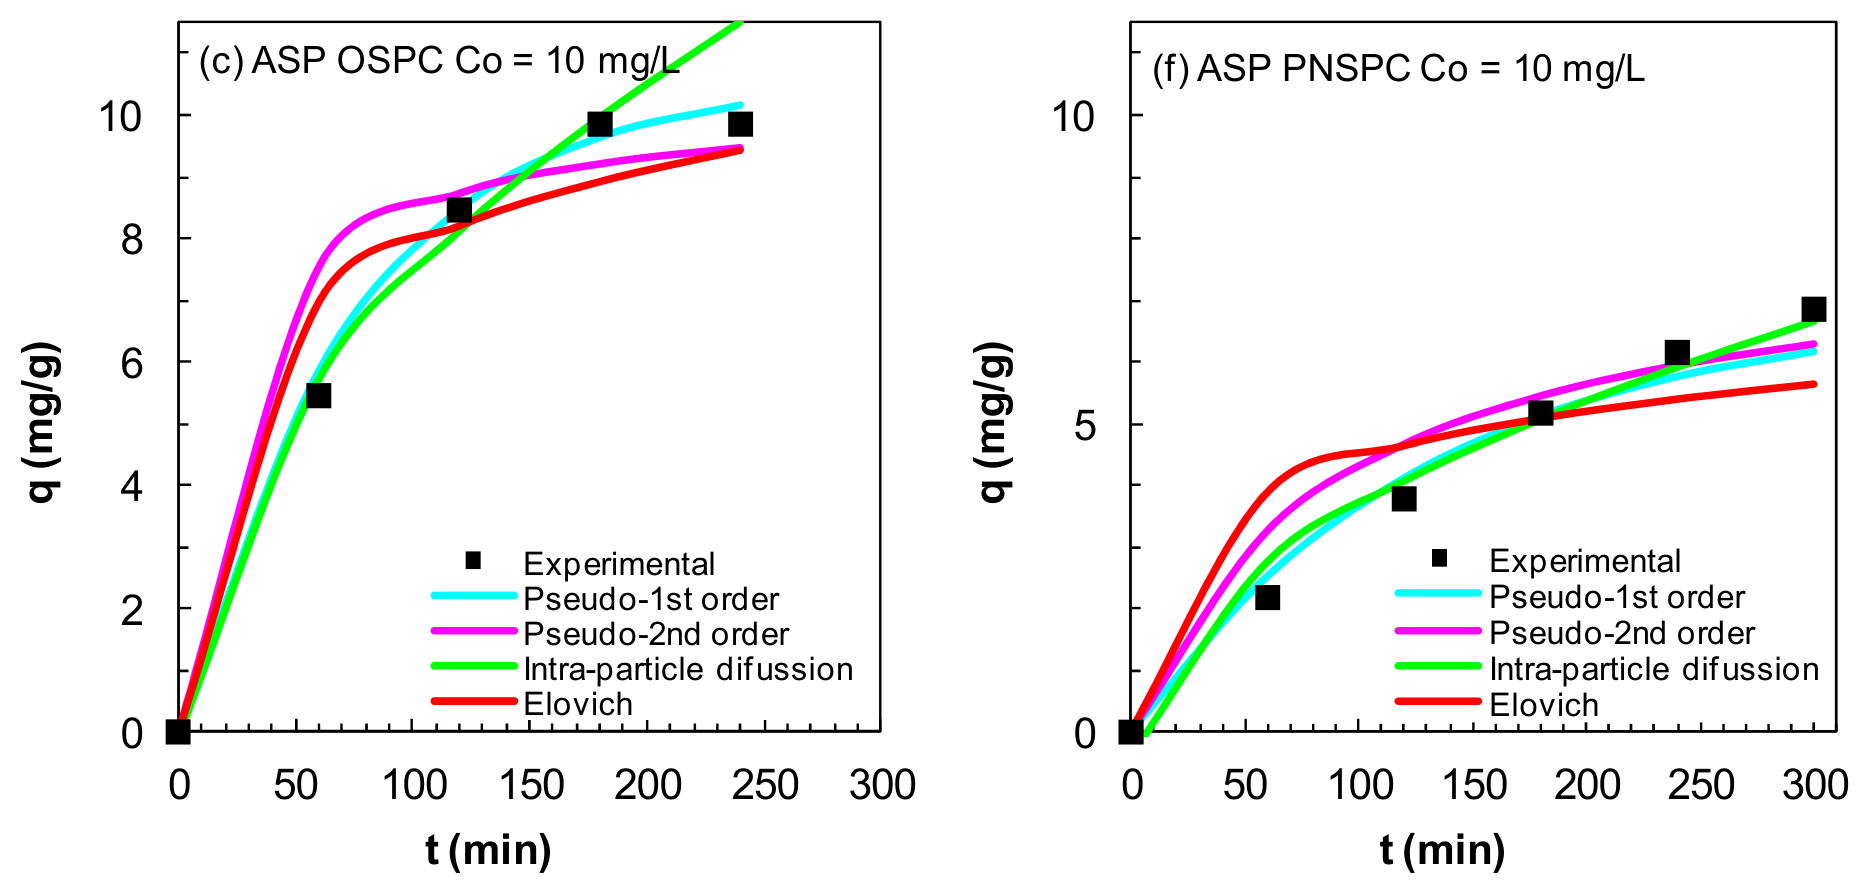
AIC20.59113.6723.24918.03819.7610.749
PNSPC PARIBUNOLENATERASP
ParametersLangmuir
qm (mg/g)22.4721.3642.3754.6420.3220.49
KL (L/mg)0.180.340.020.0250.951.05
R20.9760.9410.9930.9930.9210.855
RMSE0.5891.1610.3310.4212.1032.394
RSS1.7366.7370.5470.88722.11528.646
AIC−1.2895.491−7.065−4.64811.43412.728
ParametersFreundlich
KF (mg1−1/n g−1L1/n)6.408.601.892.0811.8711.87
n3.024.001.471.386.246.14
R20.9910.9810.9960.9910.9820.950
RMSE0.3290.5180.2380.4760.5420.859
RSS0.5411.3420.2821.1331.4703.689
AIC−7.117−2.578−10.368−3.421−2.1222.480
ParametersSips
KS (L/mg)1.001.210.0010.281.483.22
n3.7038.210.361.8492.592.17
R20.9880.9790.9620.9990.9840.994
RMSE3.3845.6767.8514.4943.5213.628
RSS34.361161.094308.205100.99361.98665.821
AIC13.31521.36324.60719.02816.58716.888
ParametersDubinin–Radushkevich
qm (mg/g)20.3618.3825.4129.7618.9018.01
KD-R (mol2 kJ−2)0.00140.00060.00430.0040.00020.0002
E (kJ mol−1)18.9028.8710.7811.1850.0050.00
R20.9560.9000.9550.9650.8690.798
RMSE0.7531.2317.9811.0151.4931.772
RSS2.8357.573318.5205.14711.14815.700
AIC1.1646.07624.7714.1458.0099.721
Disclaimer/Publisher’s Note: The statements, opinions and data contained in all publications are solely those of the individual author(s) and contributor(s) and not of MDPI and/or the editor(s). MDPI and/or the editor(s) disclaim responsibility for any injury to people or property resulting from any ideas, methods, instructions or products referred to in the content.