1. Introduction
Access to graphical representations of mathematical functions remains a major challenge for blind and visually impaired learners. In recent years, significant progress has been made in the development of technologies supporting accessible mathematics education, particularly through the use of sonification—the transformation of data into sound. Sonification has emerged as a promising approach for representing mathematical graphs, offering an alternative to traditional methods such as tactile graphics or textual descriptions, which often have limitations in accurately conveying complex mathematical structures.
Graphical information constitutes a dominant form of communication in science education, including mathematics, physics, chemistry, and engineering. However, it is not equally accessible to all users. Individuals with visual impairments often have limited access to graphical content or may experience difficulties in interpreting its overall meaning. While graphical user interfaces (GUIs) provide an efficient means of interaction for sighted users, they remain partially or entirely inaccessible to blind or visually impaired individuals. According to the World Health Organization (WHO), approximately 2.2 billion people worldwide experience some form of vision impairment [
1]. This highlights the scale of the challenge and the need for alternative methods of accessing graphical data.
Education of individuals who are blind commonly relies on screen readers and speech synthesizers to provide access to textual materials. However, this approach becomes insufficient when information is conveyed in graphical form. Only relatively simple images can be effectively translated into text and presented via speech synthesis. More complex graphical content is typically accessed through verbal descriptions delivered by screen readers; however, this approach is often insufficient, as it may involve large amounts of sequential information that can overload working memory.
In response to these limitations, sonification has been proposed as an alternative means of communicating the shape of a function graph. By mapping properties such as function value, rate of change, or variability onto auditory parameters (e.g., pitch, loudness, or temporal progression), it becomes possible to represent the behavior of a function in a continuous auditory form. Compared to purely verbal descriptions, sonification provides a more direct and dynamic representation, facilitating the perception of trends, extrema, and irregularities without requiring extensive linguistic processing. As a result, it can complement speech-based methods and enhance the accessibility and intuitive understanding of mathematical graphs.
Nevertheless, further research is needed to evaluate the quality and effectiveness of sonification-based representations of mathematical function graphs. In particular, it remains unclear how densely auditory information should be distributed in the explored space in order to effectively support graph exploration without causing excessive auditory saturation. Insufficient auditory coverage may make locating the graph difficult, whereas excessive sound density may reduce perceptual clarity and hinder interpretation.
Designing such auditory representations requires balancing several competing factors, including pointing precision during touchscreen exploration, continuous auditory guidance, perceptual clarity, and the risk of excessive auditory saturation. Although psychoacoustic phenomena, such as frequency-dependent loudness perception and spatial hearing, also influence the overall listening experience, the present work focuses on the spatial distribution of auditory information independently of psychoacoustic loudness compensation. This interaction-oriented perspective enables the proposed model to quantify and optimize sonification parameters while providing a mathematical framework suitable for systematic analysis and adaptive parameter selection.
This issue is particularly relevant in the context of educational tools, such as touchscreen mobile applications designed for visually impaired students. The main objective of this paper is therefore to propose and experimentally evaluate a method for adaptive sonification of mathematical function graphs, with particular emphasis on balancing auditory guidance and auditory saturation. To address this problem, the paper introduces and experimentally evaluates a mathematical model of auditory information density formalized through the proposed Sonification Index (SI) and the Auditory Saturation (AS) measures. Our approach additionally enables adaptive selection of sonification parameters based on graph complexity, device characteristics, and the preferred level of auditory saturation.
This paper makes the following contributions:
a method for touchscreen-based sonification of mathematical function graphs combining continuous auditory feedback with voice interaction;
a mathematical model describing auditory information density applying the SI and the AS measures;
experimental evaluation of key sonification parameters, including auditory plateau width and slope characteristics;
an adaptive framework enabling estimation of sonification parameters based on graph complexity, device characteristics, and preferred auditory saturation.
The remainder of this paper is organized as follows.
Section 2 reviews related work and existing approaches.
Section 3 presents the method for audio-based representation of mathematical functions, including both a bidirectional voice interface and sonification mechanisms.
Section 4 describes the research methodology.
Section 5 introduces the mathematical model of the sonification process, including the SI and AS measures. Experimental results and statistical analysis are presented in
Section 6.
Section 7 discusses the obtained results and their implications for the design of sonified mathematical graphs. Finally,
Section 8 concludes the paper.
2. Related Work
2.1. Accessibility of Graphical Information
Graphical information plays a fundamental role in science and engineering education; however, it remains largely inaccessible to blind and visually impaired individuals. Several approaches have been proposed to address this limitation, including tactile graphics [
2], verbal descriptions [
3], and accessible graphical user interfaces. Tactile representations enable users to explore shapes through touch, but they are often limited in resolution, scalability, and production efficiency [
4,
5].
Verbal descriptions, typically delivered via screen readers, provide sequential access to graphical content and are supported by accessibility standards such as the Web Content Accessibility Guidelines (WCAG) [
6]. While this approach enables non-visual access to information, it may be insufficient for conveying complex structures and spatial relationships, particularly when extensive descriptions are required [
7,
8].
Despite the potential of auditory interfaces, designing effective sonification-based access to graphical information remains difficult. One important issue is that the perceived loudness of pure tones is not linearly related to their physical amplitude across different frequencies. Loudness is a subjective perceptual attribute commonly described by equal-loudness contours [
9]. Consequently, tones with identical physical amplitudes but different frequencies may be perceived as unequally loud by users. In addition, auditory perception may vary considerably between individuals due to factors such as age-related changes in hearing abilities [
10]. These perceptual characteristics influence how auditory cues are interpreted and may affect the usability of sonified graphical representations, particularly in tasks involving continuous exploration of spatial structures.
2.2. Data Sonification
Sonification has emerged as a promising approach for representing data through sound, enabling users to perceive information via the auditory modality. It is commonly defined as the transformation of data relations into perceived relations in an acoustic signal [
11,
12,
13]. By mapping data features onto auditory parameters such as pitch, loudness, timbre, or temporal structure, sonification enables the identification of patterns, trends, and anomalies that may be difficult to access through non-visual representations.
From a psychoacoustic perspective, the perception of sonified information depends not only on the physical properties of sound but also on the characteristics of the human auditory system. In particular, perceived loudness varies with frequency according to equal-loudness contours [
9,
14], while individual differences in hearing sensitivity may further influence the interpretation of auditory cues [
10]. Therefore, a distinction should be made between the physical generation of sound and its perceptual interpretation. The model proposed in this work focuses on the spatial distribution of sound amplitude as an interaction mechanism rather than on modelling perceived loudness. This abstraction makes it possible to investigate the influence of geometric sonification parameters on graph exploration independently of psychoacoustic loudness compensation, which is considered an important direction for future work.
Several auditory data representation techniques have been proposed in the literature. One of the most widely used approaches is parameter mapping sonification, in which data dimensions are directly associated with sound properties. Other techniques include audiofication, where data are directly rendered as audio signals, as well as the use of auditory icons to represent discrete events or categories [
15,
16]. The choice of technique depends on the characteristics of the data and the intended analytical task.
Previous studies have demonstrated that sonification can effectively support data exploration and interpretation, particularly in scenarios where visual representations are limited or unavailable [
17,
18]. Auditory perception is especially well suited for detecting temporal variations and dynamic changes, which makes sonification particularly useful for representing continuous data and processes.
Evaluating the effectiveness of sonification remains an important research problem, requiring carefully designed studies that assess how users interpret and interact with auditory representations. Task-based experiments are commonly used to evaluate how accurately users can interpret sonified data under different mapping conditions [
19]. More recent studies have investigated sonification in realistic analytical scenarios, demonstrating how auditory mappings influence detection accuracy, usability, and decision-making processes [
20,
21]. However, there is still no consensus on standardized evaluation methodologies, particularly with respect to balancing informational richness and perceptual clarity in auditory displays.
Despite its potential, designing effective sonification systems remains a complex problem. One of the main difficulties involves selecting suitable mappings between data and auditory parameters, since overly complex or unintuitive mappings may increase cognitive load and reduce interpretability. Another issue is the absence of widely accepted design guidelines, which leads to substantial variability among existing solutions and complicates direct comparison of their effectiveness. These limitations demonstrate the need for more systematic methods for designing and evaluating sonification techniques, particularly in educational applications.
2.3. Sonification of Mathematical Functions
The application of sonification to mathematical functions has been explored as a means of enabling non-visual access to graphical representations. In this context, the primary goal is to convey the shape and key properties of a function through sound, allowing users to perceive its behavior without relying on visual cues. Early work in this area demonstrated that auditory graphs can effectively represent simple mathematical relationships by mapping the domain of a function to time and its values to pitch [
22,
23]. Subsequent research has extended these approaches by incorporating additional auditory parameters to represent more complex features of functions. For example, variations in loudness, timbre, or spatialization have been used to encode derivatives, uncertainty, or multiple data dimensions [
17,
24]. These enhancements enable a richer representation of mathematical structures, supporting the identification of characteristics such as extrema, inflection points, and discontinuities.
Interactive systems for auditory graph exploration have also been proposed, allowing users to actively navigate and query function representations. Such systems often combine sonification with user input mechanisms, enabling exploration at different levels of detail and supporting both global and local analysis of function behavior [
25,
26]. This interactive paradigm has been shown to improve user understanding compared to passive listening approaches.
Several challenges, nevertheless remain. Existing solutions differ significantly in terms of mapping strategies, level of detail, and interaction design, making direct comparison of their effectiveness difficult. Moreover, there is still a lack of standardized approaches for representing mathematical functions through sound, particularly in educational contexts. Existing studies also rarely provide quantitative models describing the density or saturation of auditory information distributed within the explored graph area. As a consequence, sonification parameters are typically selected empirically rather than adapted systematically to the geometric complexity of the displayed function or the characteristics of the target device. This highlights the need for adaptive methods enabling dynamic selection of sonification parameters while maintaining an appropriate balance between perceptual clarity and auditory saturation.
2.4. Educational Tools for Visually Impaired Learners
A variety of tools and technologies have been developed to support access to graphical information for blind and visually impaired learners, including systems specifically designed for exploring mathematical functions. These solutions typically rely on auditory, tactile, or multimodal representations to convey information that is otherwise presented visually.
One group of approaches focuses on the sonification of mathematical graphs. Systems such as SonicFunction [
27] and Singing Function [
28] enable users to explore mathematical functions by mapping their properties onto auditory parameters such as pitch, loudness, and timbre. These approaches demonstrate that appropriately designed auditory mappings can support the perception of functional relationships and characteristic features including extrema, trends, and local changes in function behavior.
More recent solutions extend these ideas through interactive and multimodal exploration techniques. The AudioFunctions.web environment combines sonification with speech output and interactive navigation, enabling users to switch between global and local exploration strategies while accessing both qualitative and quantitative information [
29]. Studies of the AudioFunctions environment further demonstrate how blind users interpret and navigate function graphs using combined auditory and interactive representations [
30]. These studies highlight the importance of sequential exploration and narrative interaction strategies in understanding graphical information.
Another important direction involves multimodal systems combining auditory and tactile feedback. Such approaches aim to exploit complementary sensory channels to improve comprehension and spatial orientation. For example, audio–tactile interfaces allow users to explore graphical structures through touch while simultaneously receiving contextual auditory feedback [
31,
32]. Similarly, recent work published in IEEE Access demonstrates that combining tactile and auditory representations can significantly improve the exploration and interpretation of mathematical functions [
33].
Some systems additionally integrate sonification with speech-based interaction mechanisms. Text-to-speech (TTS) techniques are commonly used to provide precise verbal descriptions of graph elements, such as coordinates, extrema, or function values at selected points [
34]. An example of this approach is the AccessibleGraph application [
35], which combines continuous sonification with both TTS and speech-to-text (STT) interaction. The use of STT enables users to issue voice commands while reserving touch interaction exclusively during touchscreen exploration on a mobile touchscreen. This separation of interaction modalities may reduce cognitive load and improve the efficiency of the exploration.
Although existing solutions demonstrate considerable potential, they differ substantially in terms of mapping strategies, interaction techniques, and the amount of conveyed information. In particular, balancing continuous sonification with discrete verbal and tactile feedback remains difficult. Consequently, achieving an appropriate balance between informational richness, usability, and perceptual clarity remains an open research problem in the design of auditory interfaces while exploring the mathematical graph.
3. Methodology
The study begins with the identification of key elements of a function graph that should be conveyed through non-visual modalities, including global shape, monotonicity, extrema, and characteristic points. Based on this analysis, a distinction is made between information best represented through continuous sonification of graphs and that conveyed based on discrete verbal descriptions via TTS.
The next step involves the design of the sonification of graphs. A sound-based representation of the function curve, referred to as the auditory path, is introduced. Since a mathematical graph is typically represented as a thin line, its auditory counterpart must have a certain effective width to ensure perceptual accessibility. The methodology therefore includes an analysis of the appropriate width of the auditory path, as well as the definition of a function describing how sound amplitude changes depending on the distance between the exploration pointer and the function graph. Particular attention is given to the slope of the amplitude transition, which determines how sharply the auditory signal increases near the function.
The experimental implementation is based on a previously developed AccessibleGraph system for auditory graph exploration, adapted to support controlled manipulation of key sonification parameters, including the width of the auditory path and the characteristics of the amplitude function. In the study, participants explore function graphs without visual access to the plotted curve, which remains hidden during interaction. Participants evaluate different configurations of the sonification of graphs, focusing on the perceived effectiveness and usability of various parameter settings related to the sonification.
A central aspect of the methodology involves controlling the density of auditory information distributed during exploration. Increasing the width of the auditory path and the extent of the amplitude transition may facilitate locating the graph; however, excessive auditory coverage may also reduce perceptual clarity and lead to auditory saturation. To investigate this trade-off, the study evaluates different sonification parameter configurations and introduces quantitative measures describing the amount and spatial density of auditory information. These measures, formalized as the SI and the AS, are intended to support both the evaluation and adaptive design of sonified mathematical graphs.
4. Analysis of Graph Sonification Parameters
4.1. Auditory Path Width
In classical visual representations of function graphs, the curve is typically rendered as a line of minimal thickness (e.g., one pixel) to ensure high precision. However, such a representation is not suitable for blind or visually impaired users exploring the screen through touch. Locating a thin line can be difficult and may hinder effective interaction with the graph.
To address this limitation, the auditory representation introduces an extended region around the function curve, referred to as the auditory path. This region has a finite width that enables the user to perceive proximity to the graph through sound. In the model, this region is represented as a constant-amplitude plateau described by the parameter P, which defines the width of the area in which the sound reaches its maximum amplitude.
The value of P may be defined in several ways:
as a fixed value proportional to the dimensions of the touchscreen,
as a calibrated value reflecting the user’s pointing accuracy,
as a variable value adapted to the density and geometric complexity of the graph in order to maintain an appropriate level of the AS.
The parameter
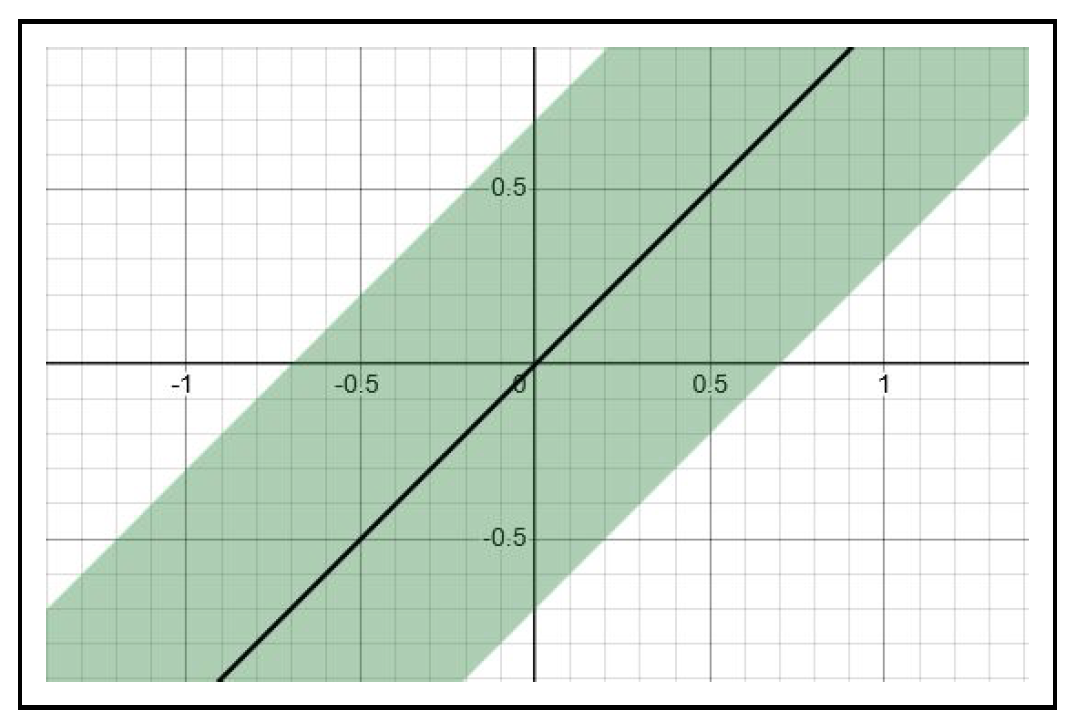
P therefore determines the effective spatial extent of the auditory guidance provided by the graph sonification. An example of the auditory path for the function
y =
x is shown in
Figure 1, together with its visualization (green area) in the plane
XY.
The value
P/2 defines the radius around the function curve within which the sound reaches its maximum amplitude. Assuming normalized amplitude, the amplitude function
, where
d denotes the distance from the function graph, can be expressed as:
4.2. Distance-Based Amplitude Model
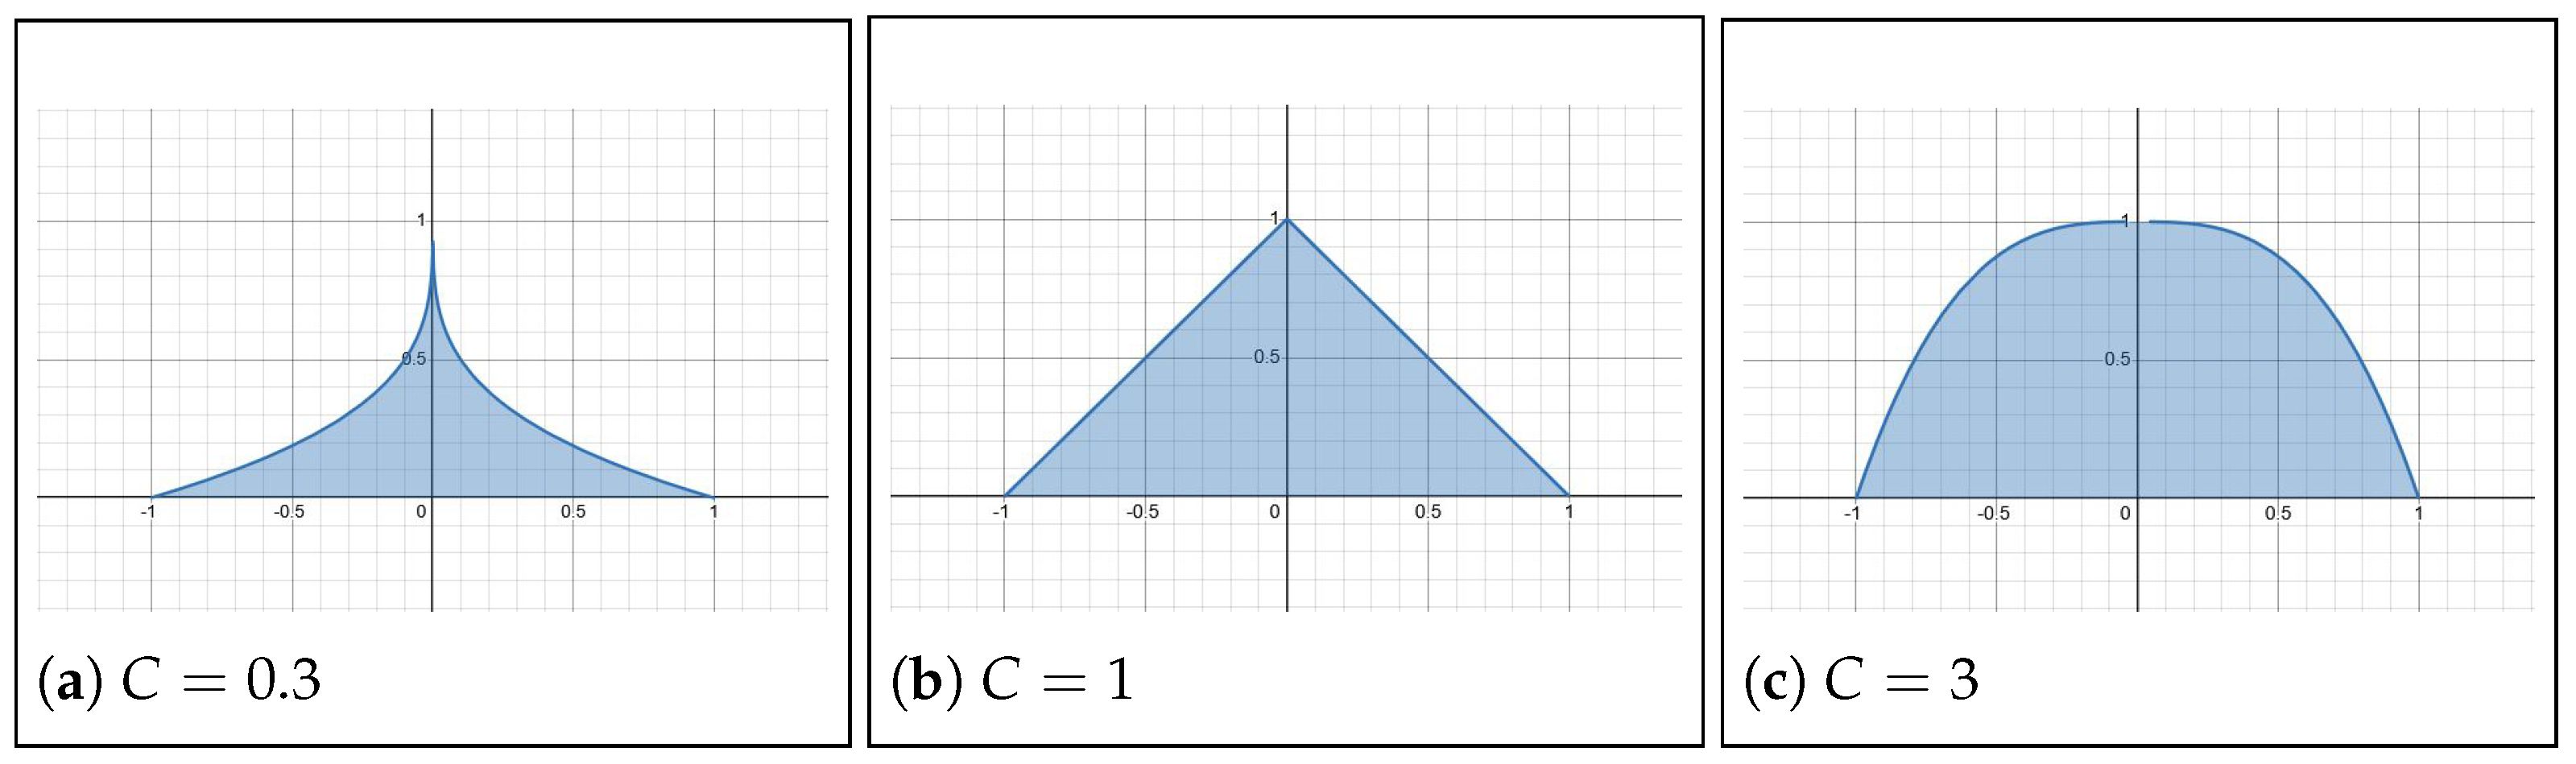
When exploring a two-dimensional space in search of a function graph, the user may experience difficulty if no auditory feedback is provided over extended periods. To address this issue, our approach introduces a guiding mechanism based on sound, which directs the exploration pointer toward the function curve. This is achieved by gradually increasing the sound amplitude as the distance to the graph decreases, until it reaches its maximum value within the auditory path plateau. The increase in amplitude is modeled as a continuous transition toward the plateau value. This behavior is described by a transition region characterized by two parameters: S, representing the slope length, and C, representing its curvature.
The amplitude function was selected to satisfy several interaction-oriented and mathematical requirements. From the interaction perspective, the function should provide continuous and monotonic auditory guidance while allowing users to perceive gradual changes in proximity to the graph. From the mathematical perspective, the function should remain analytically integrable and controlled by a small number of interpretable parameters. The parameter S determines the spatial extent of auditory guidance, whereas the parameter C adjusts the rate of amplitude change without modifying the overall structure of the model.
The sound amplitude as a function of distance
d from the graph is initially defined as:
where:
Depending on the value of C, the guiding signal may exhibit different transition characteristics:
linear (C = 1),
exponential (C > 1),
root-based (0 < C < 1).
Examples of different slope curvature profiles are illustrated in
Figure 2.
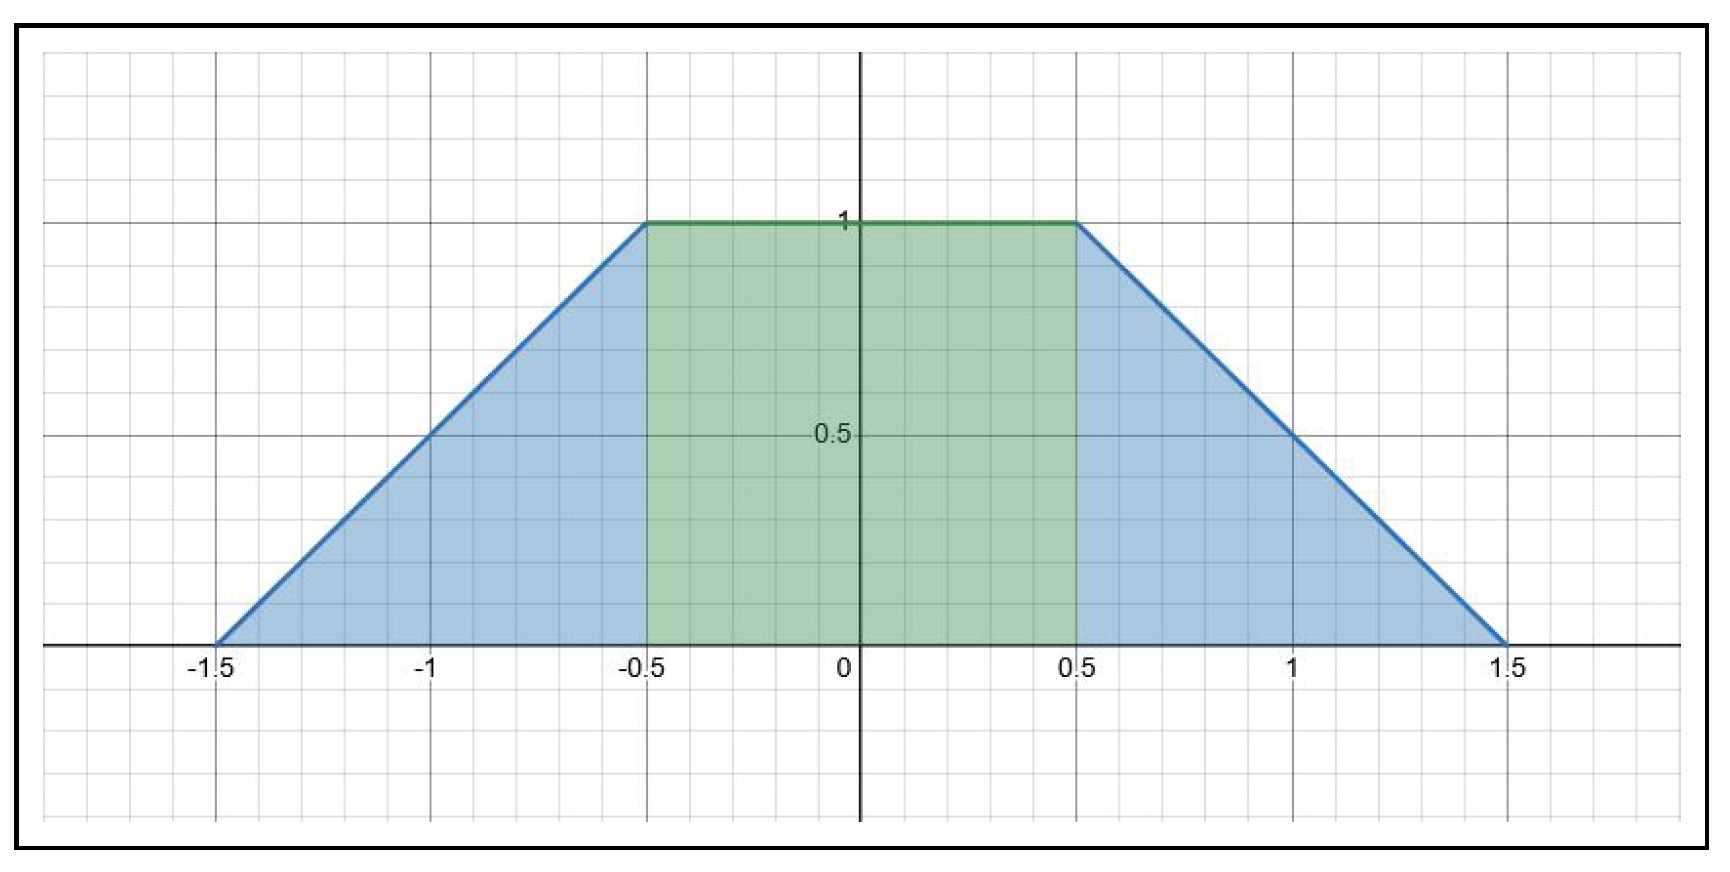
In practice, the auditory plateau and the surrounding transition region together determine the overall spatial distribution of auditory information around the graph. Taking the plateau width parameter
P into account, the amplitude model can be expressed as:
The sound amplitude as a function of distance from the graph is illustrated in
Figure 3.
4.3. Sonification Index
The sonification model can be interpreted as extending a two-dimensional function graph into a third dimension corresponding to sound amplitude. In this interpretation, the additional dimension represents normalized sound amplitude ranging from 0 (silence) to 1 (maximum amplitude). This results in a three-dimensional representation in which the function graph is extended into the amplitude domain, as illustrated in
Figure 4.
The auditory representation consists of a central region, referred to as the plateau, with width P, corresponding to maximum amplitude. On both sides of the plateau, the amplitude decreases according to a predefined function , where d denotes the perpendicular distance from the function graph. The transition region extends over a distance S from the plateau boundary. Let L denote the length of the explored graph curve. The total amount of auditory information conveyed by the sonification may be interpreted as the integrated auditory amplitude field surrounding the graph.
Instead of describing the physical energy of the acoustic signal, the SI quantifies the cumulative amount of auditory information available during exploration. Since the auditory signal is represented as a continuous amplitude field surrounding the graph, the total amount of auditory information can be naturally expressed by integrating the normalized sound amplitude over the area occupied by the sonified region. Hence, the SI corresponds to the effective volume under the amplitude surface and provides a quantitative measure of the spatial density of auditory information associated with a given graph and sonification configuration. Higher SI values therefore indicate denser auditory guidance during touchscreen exploration rather than increased perceptual information in the psychoacoustic sense. This leads to the definition of the SI:
where
dl represents an infinitesimal element of the graph length and
d is the perpendicular distance from the curve.
The integral can be decomposed into two components corresponding to the plateau and transition regions. For the plateau, where the amplitude is constant and equal to 1, the contribution is:
The contribution of the transition regions on both sides of the graph is given by:
Thus, the total SI can be expressed as:
Assuming the slope function:
where
C controls the curvature of the transition region, the integral can be evaluated analytically, yielding:
Substituting this result into the expression for the SI leads to the compact form:
The length of the graph curve can be computed with the standard arc-length formula. For a function
defined over the interval
, the length
L is given by:
Substituting this expression into the SI yields:
This formulation explicitly shows that the SI depends both on the geometric properties of the function graph and on the parameters of the auditory representation. The parameter
L reflects the geometric complexity of the graph, while
P and
S determine the spatial extent of the auditory signal, and
C controls how rapidly the sound amplitude changes near the graph.
Since the amplitude is normalized to the range [0, 1], the SI has the physical interpretation of an effective area surrounding the graph curve and may therefore be expressed in units such as mm2 or cm2. Hence, the SI quantifies the spatial extent of auditory information available while exploring the graph.
4.4. Auditory Saturation
To complement the definition of the SI, we introduce a normalized measure describing the proportion of the explored space occupied by auditory information. This measure, referred to the AS, represents the ratio between the effective sonified area and the total graph exploration area.
Assuming that the function graph is displayed within a rectangular domain defined by
and
, and that the amplitude is normalized to the range [0, 1], the total exploration area is given by:
The AS is then defined as:
The AS is intended as an interaction-oriented measure rather than a psychoacoustic quantity. It expresses the proportion of the available exploration space occupied by auditory information and therefore characterizes the spatial density of auditory guidance provided to the user. Normalizing the SI by the graph workspace makes the measure independent of the display size, enabling direct comparison of different graph geometries and device configurations. Higher values of the AS indicate denser auditory guidance, which may facilitate graph localization but can also increase the risk of auditory clutter during exploration.
Substituting the expression for the SI yields:
Since both the SI and the exploration area are expressed in the same effective area units, the AS is dimensionless and normalized to the range [0, 1].
This measure provides a normalized indication of how densely auditory information is distributed within the graph area. It may therefore be used to evaluate whether a given sonification configuration provides sufficient auditory guidance while avoiding excessive auditory saturation and perceptual overload.
5. Experimental Evaluation
5.1. Experimental System
The experimental study was conducted based on the AccessibleGraph mobile application, which was extended to enable controlled manipulation of key sonification parameters, including the auditory path width and the characteristics of the amplitude transition function.
The application provides the following core functionalities:
generation of graphs of polynomial functions with integer coefficients and degrees;
voice-based interaction supported by an STT mechanism, enabling independent operation without external assistance;
touch-based exploration of function graphs with continuous auditory feedback;
delivery of discrete information (e.g., coordinates of selected points) with a TTS mechanism;
continuous auditory feedback generated applying digital sound synthesis.
The system additionally allows configuration of parameters related to graph exploration and sonification, including graph scaling, point density, pointer distance tolerances, and auditory feedback settings. The application was designed to support users with different levels of visual impairment and allows both visual customization and fully auditory interaction.
For the purposes of this study, the system was extended with the following experimental features:
adjustment of the auditory path width (plateau parameter P);
configuration of slope parameters, including length S and curvature C;
introduction of an additional tremolo cue when the sound amplitude reached its maximum value in order to facilitate precise alignment with the graph curve.
All experiments were conducted on Samsung Galaxy Tab S2 9.7 tablets with a 9.7-inch display and a 4:3 aspect ratio (197.1 × 147.8 mm). The function graphs were displayed within the ranges and , ensuring equal physical scaling along both axes of the Cartesian coordinate system.
5.2. Participants
Participants representing different levels of visual impairment were recruited in order to evaluate the proposed sonification approach across diverse visual accessibility needs. The following inclusion criteria were applied:
very good proficiency in the Polish language, as it is used by the TTS mechanism in the mobile application;
basic knowledge of mathematical functions, including polynomial and trigonometric functions;
absence of motor impairments preventing independent interaction with the application;
absence of speech impairments due to the voice-based interaction supported by the STT mechanism.
The study involved 21 students aged between 18 and 23. Among them, 6 participants had mild visual impairment, 10 had moderate visual impairment, and 5 had severe visual impairment. None of the participants had previous experience with graph sonification systems prior to the study.
The experiments involving participants with severe visual impairment were conducted at a Special Educational Center for Blind and Visually Impaired Students. The experimental procedure and the selection of mathematical functions were additionally consulted with teachers from the center.
5.3. Experimental Design
5.3.1. Preparation Phase
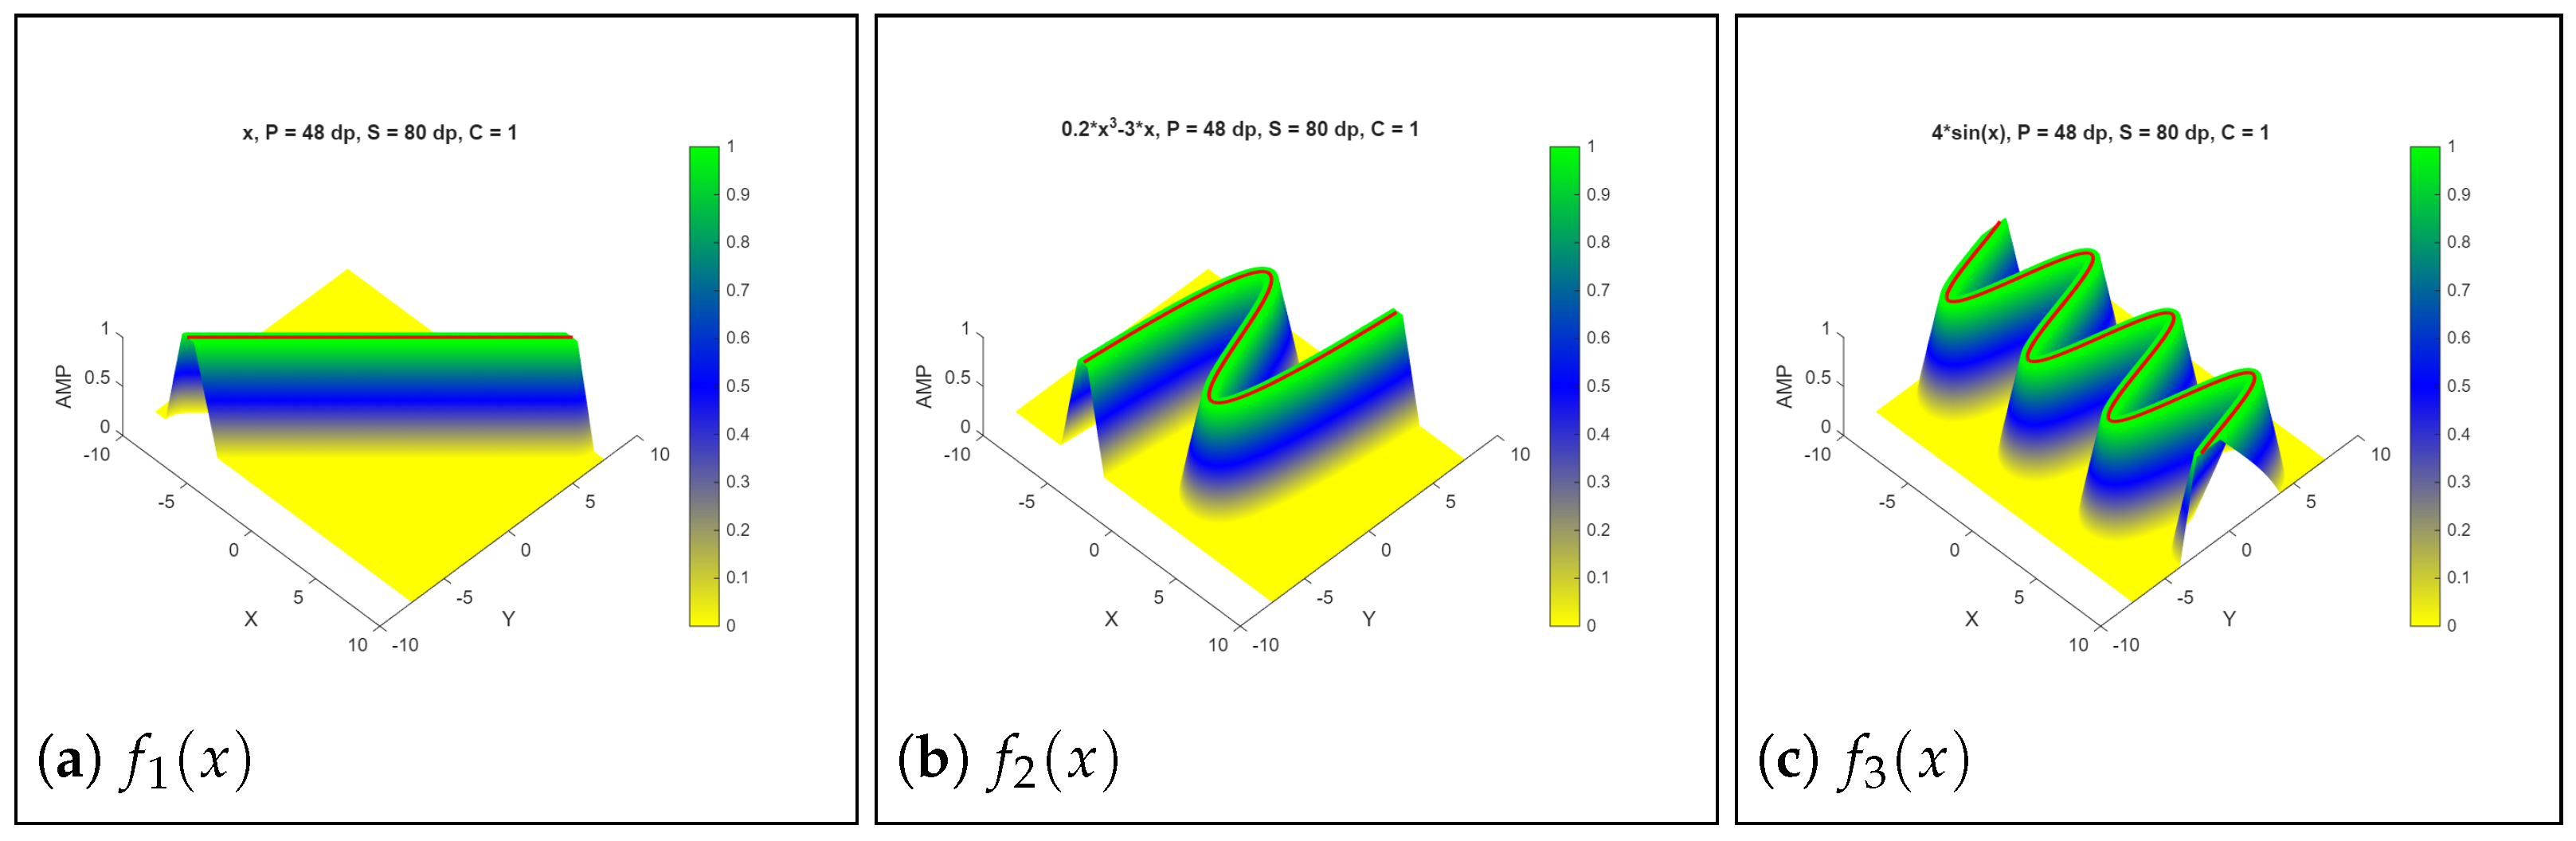
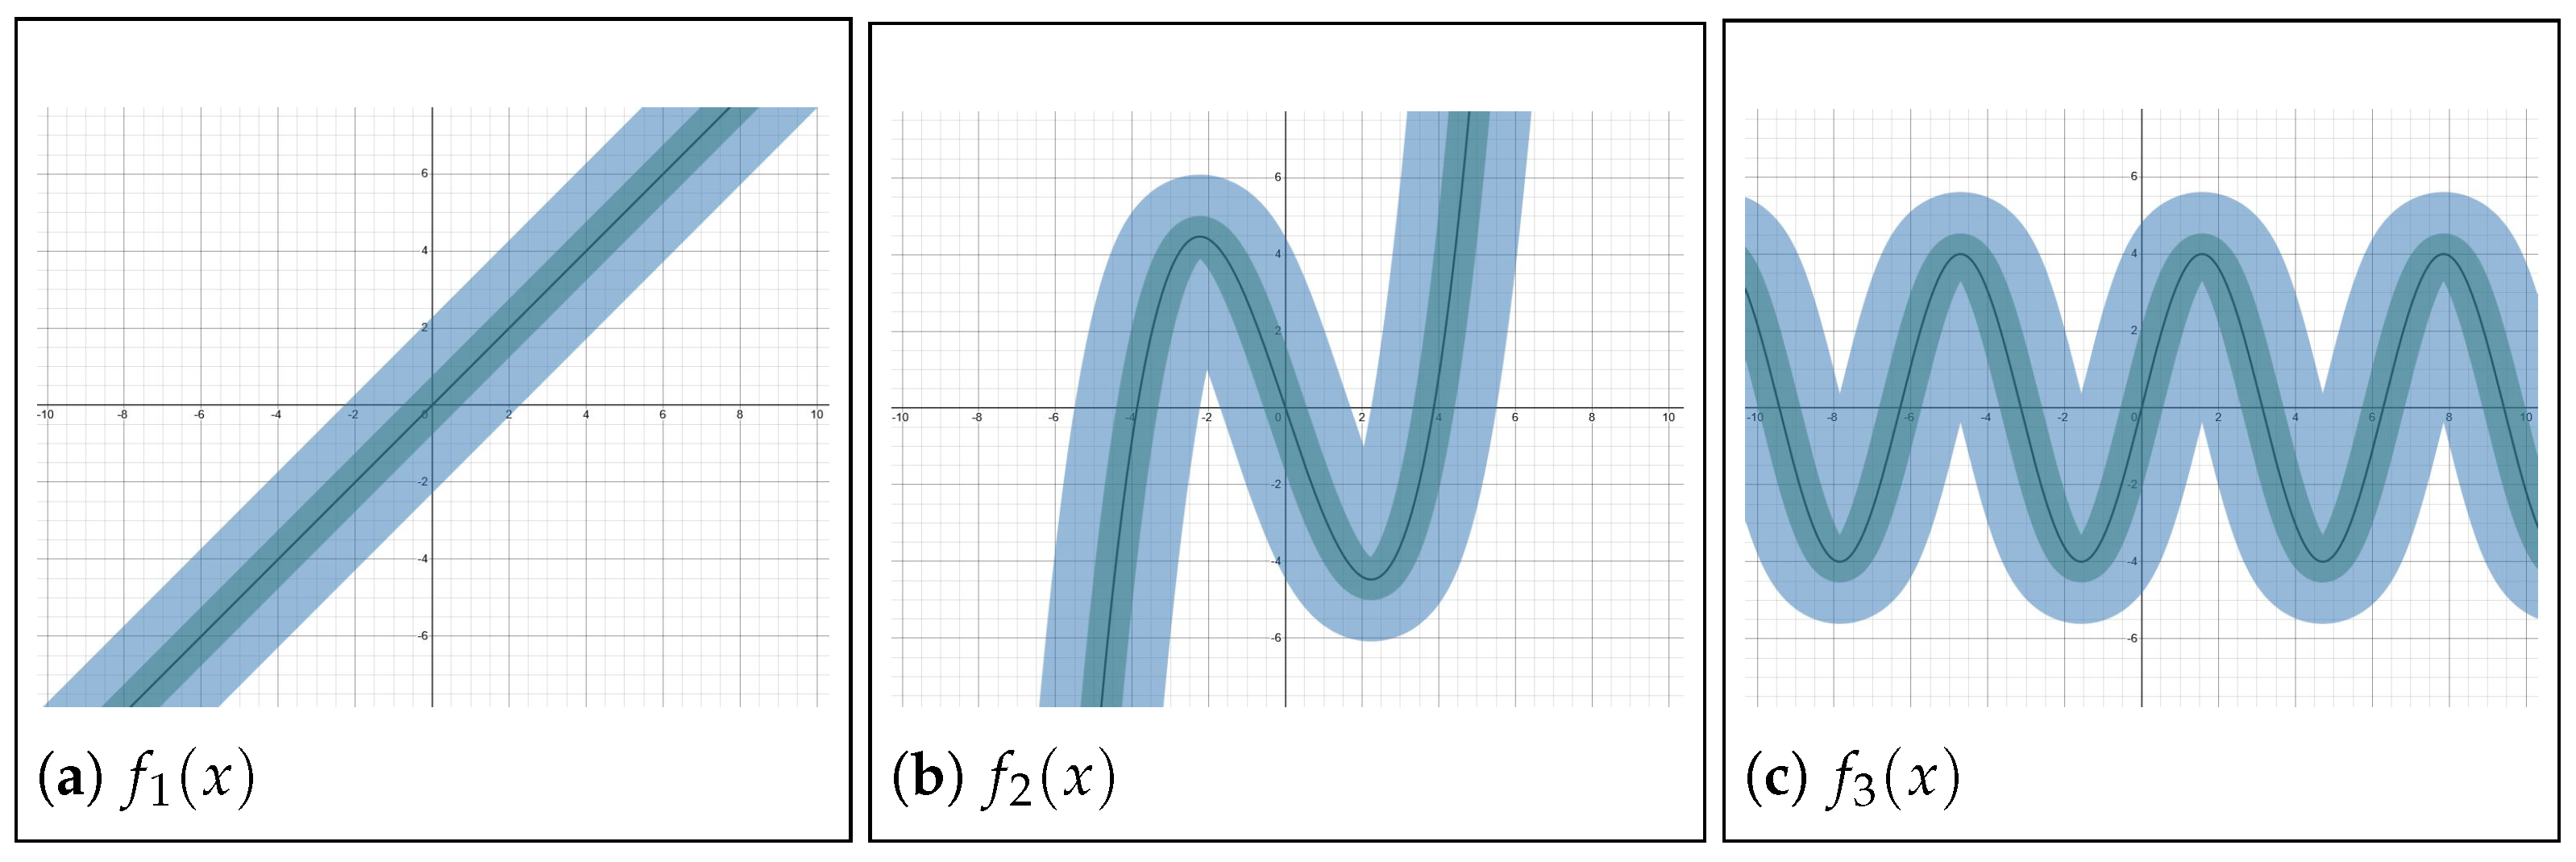
The primary objective of the experiments was to evaluate an appropriate level of AS for the exploration of mathematical function graphs. Three representative mathematical functions, denoted as
,
, and
, were used in the experiments, as shown in
Figure 5.
To ensure that participants focused exclusively on auditory feedback, the visual representation of the graph was hidden by rendering the graph line transparent. As a result, the function curve was not visible during the experiment, ensuring consistent experimental conditions across all participants. Thus, the evaluation primarily reflected auditory perception and touch-based exploration instead of differences in residual visual abilities.
Participants received instructions describing the voice commands required to independently initiate the experimental sessions. In each experiment, participants were asked to locate the function graph based on auditory cues and then trace its course by moving their finger along the curve. The objective of the experiments was not to evaluate graph recognition performance or task completion time, but rather to assess the perceptual quality and usability of different sonification parameter configurations during tactile exploration. Therefore, participants were informed in advance whether the graph represented a linear, cubic, or sinusoidal function and were encouraged to repeatedly leave and re-enter the sonified path in order to evaluate how effectively each parameter configuration supported orientation and graph re-localization.
5.3.2. Experiment 1—Auditory Path Plateau
The aim of the first experiment was to evaluate the influence of auditory path width on the usability of graph sonification. The study considered five different plateau widths and three mathematical functions characterized by different levels of structural complexity.
Participants were asked to explore each function graph with touch interaction and to assess which plateau width provided the most effective and comfortable exploration. The evaluation focused on subjective aspects during touchscreen exploration, including the ease of locating the graph, the clarity of the perceived function shape, and the overall comfort of interaction. Since these perceptual characteristics cannot be quantified directly based on objective physical measures, participants rated each configuration on a five-point Likert scale (1—very poor, 5—very good), a widely adopted approach for collecting subjective usability and perceptual assessments in human–computer interaction research [
36].
To reflect realistic usage conditions, participants interacted with the touchscreen with their fingers instead of a stylus, which is less commonly used in practice. Five plateau widths were tested with density-independent pixels (dp):
P1 = 8 dp—very narrow plateau, requiring high precision;
P2 = 16 dp—narrow plateau;
P3 = 32 dp—medium plateau;
P4 = 48 dp—recommended minimum touch target size (approximately 9 mm at 160 dpi, according to W3C and Apple guidelines);
P5 = 64 dp—wide plateau.
To account for the influence of graph complexity on auditory perception, three functions with different numbers of monotonicity changes were selected:
—linear function with no local extrema;
—cubic function with two local extrema;
—periodic function with multiple extrema within the considered interval.
It was expected that functions with more frequent changes in monotonicity would produce a higher density of auditory information, potentially increasing the AS when larger plateau widths are used. To minimize learning effects, the sign of each function was randomly inverted between trials, introducing symmetry with respect to the X-axis. This prevented participants from anticipating the graph position during repeated explorations. Each participant evaluated all combinations of plateau width and function type, and the order of presented conditions was randomized to reduce potential ordering effects.
5.3.3. Experiment 2—Slope Parameters
The aim of the second experiment was to evaluate how slope parameters influence the usability and perceptual clarity of graph sonification. In particular, the study focused on two parameters defining the amplitude function outside the plateau region: the slope length S and the slope curvature C.
The parameter S determines the spatial extent of the auditory guidance, i.e., the distance from the graph within which the sound gradually increases toward the maximum amplitude. The parameter C controls the shape of this increase, affecting how rapidly the sound amplitude changes as the user approaches the function graph.
Participants were asked to explore a linear function graph with different combinations of slope parameters and to evaluate the effectiveness of auditory guidance. The evaluation focused on ease of locating the graph, clarity of the perceived function shape, and overall interaction comfort. Participants provided their ratings on a Likert scale ranging from 1 (very poor) to 5 (very good).
To isolate the effect of slope parameters, a single linear function was used in all trials. This ensured that the results were not influenced by changes in graph complexity.
Five different slope lengths were tested, expressed in density-independent pixels (dp):
In addition, three characteristic types of slope curvature were analyzed:
C1 = 1—linear increase of amplitude;
C2 = 3—exponential profile, resulting in a gradual increase of amplitude;
C3 = 1/3—root-based profile, resulting in a rapid increase of amplitude near the graph.
All combinations of slope length and curvature were tested with the plateau width fixed at P = 0, allowing the influence of slope parameters to be evaluated independently.
It was expected that very short slopes would reduce the effectiveness of auditory guidance, whereas excessively long slopes could decrease spatial precision. Different curvature profiles were also expected to influence the intuitiveness during tactile exploration.
6. Results and Statistical Analysis
6.1. Analysis Method
Due to the ordinal nature of the data collected on a Likert scale and the repeated-measures design of the study, non-parametric statistical methods were applied. For each experimental condition, descriptive statistics were computed, including the median and interquartile range (IQR). Mean values and standard deviations were also calculated to support interpretation. Differences between parameter configurations were analyzed with the Friedman test. When statistically significant differences were detected, post-hoc pairwise comparisons were conducted with the Wilcoxon signed-rank test with Bonferroni correction.
6.2. Results of Experiment 1—Auditory Path Plateau
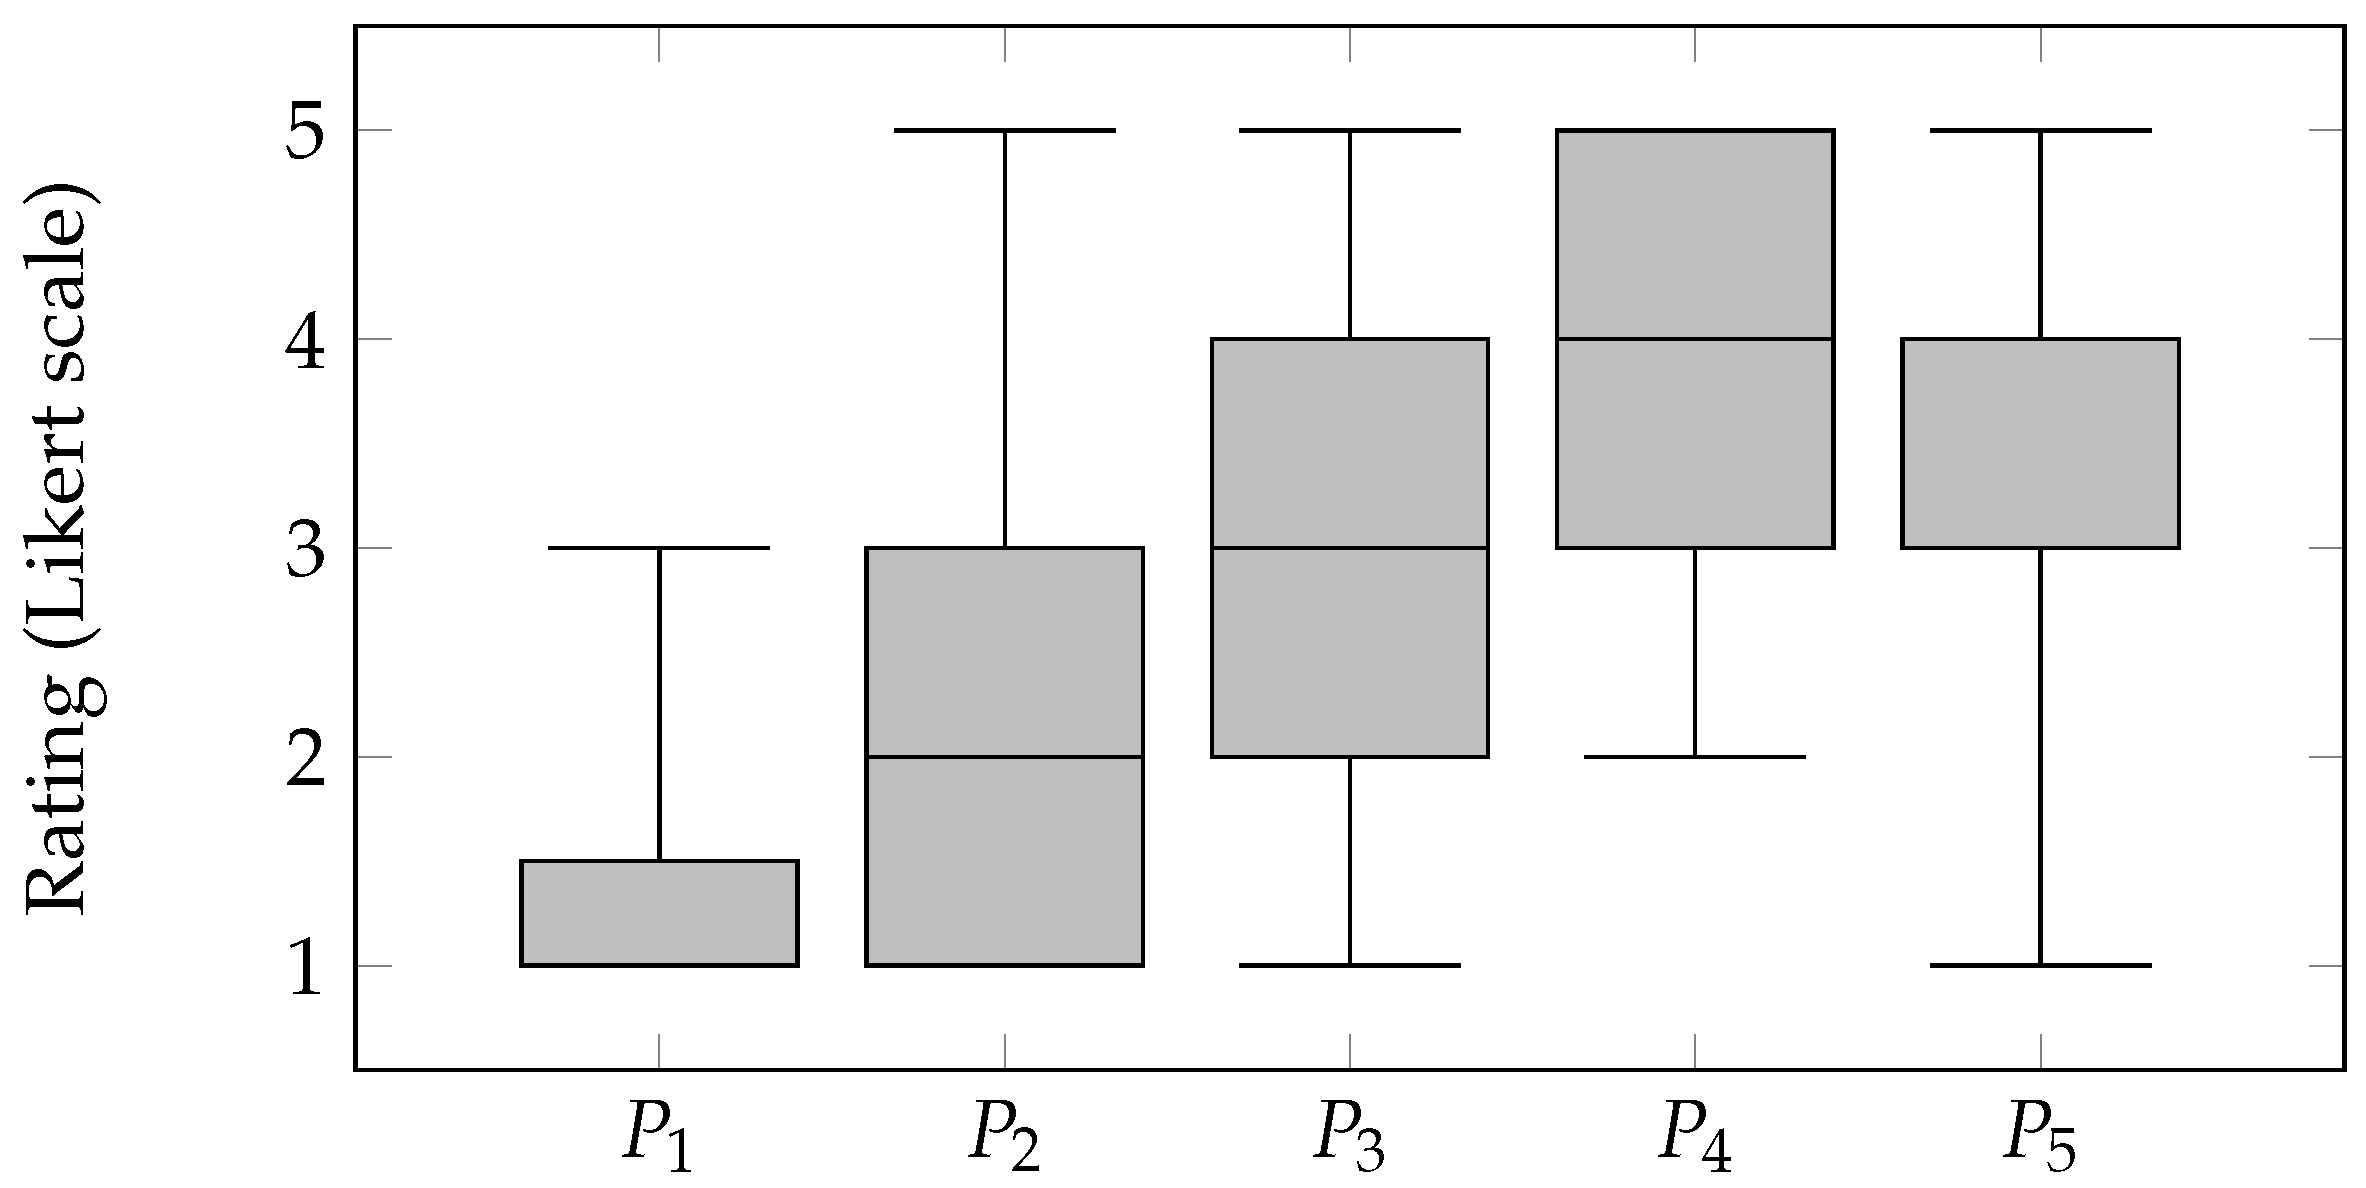
Table 1 presents descriptive statistics for each plateau width. Participant ratings increased systematically with increasing plateau width up to
P4. The lowest ratings were observed for
P1 (median = 1), while the highest ratings and lowest variability were obtained for
P4 (median = 4, mean = 3.94). Although
P5 also achieved a high median value, its lower mean and higher variability indicate less consistent evaluations.
Figure 6 illustrates the distribution of ratings for each plateau width. The boxplots confirm the increase in ratings with increasing plateau width up to
P4, with no further improvement observed for
P5.
The Friedman test revealed statistically significant differences between plateau width conditions (, p < 0.0001, Kendall’s W = 0.79), indicating a strong effect of plateau width on the perceived usability of graph sonification.
Post-hoc analysis based on the Wilcoxon signed-rank test showed that P1 differed significantly from all remaining conditions. Similarly, P2 received significantly lower ratings than wider plateaus. A statistically significant improvement was also observed between P3 and P4. In contrast, no statistically significant difference was found between P4 and P5.
6.3. Results of Experiment 2—Slope Parameters
To evaluate the influence of slope characteristics on graph sonification, the results were analyzed separately for slope curvature and slope length.
6.3.1. Effect of Slope Curvature
To assess the effect of slope curvature, ratings were averaged across all slope lengths for each participant. This resulted in three aggregated values corresponding to the tested curvature profiles: linear (
C1), exponential (
C2), and root-based (
C3).
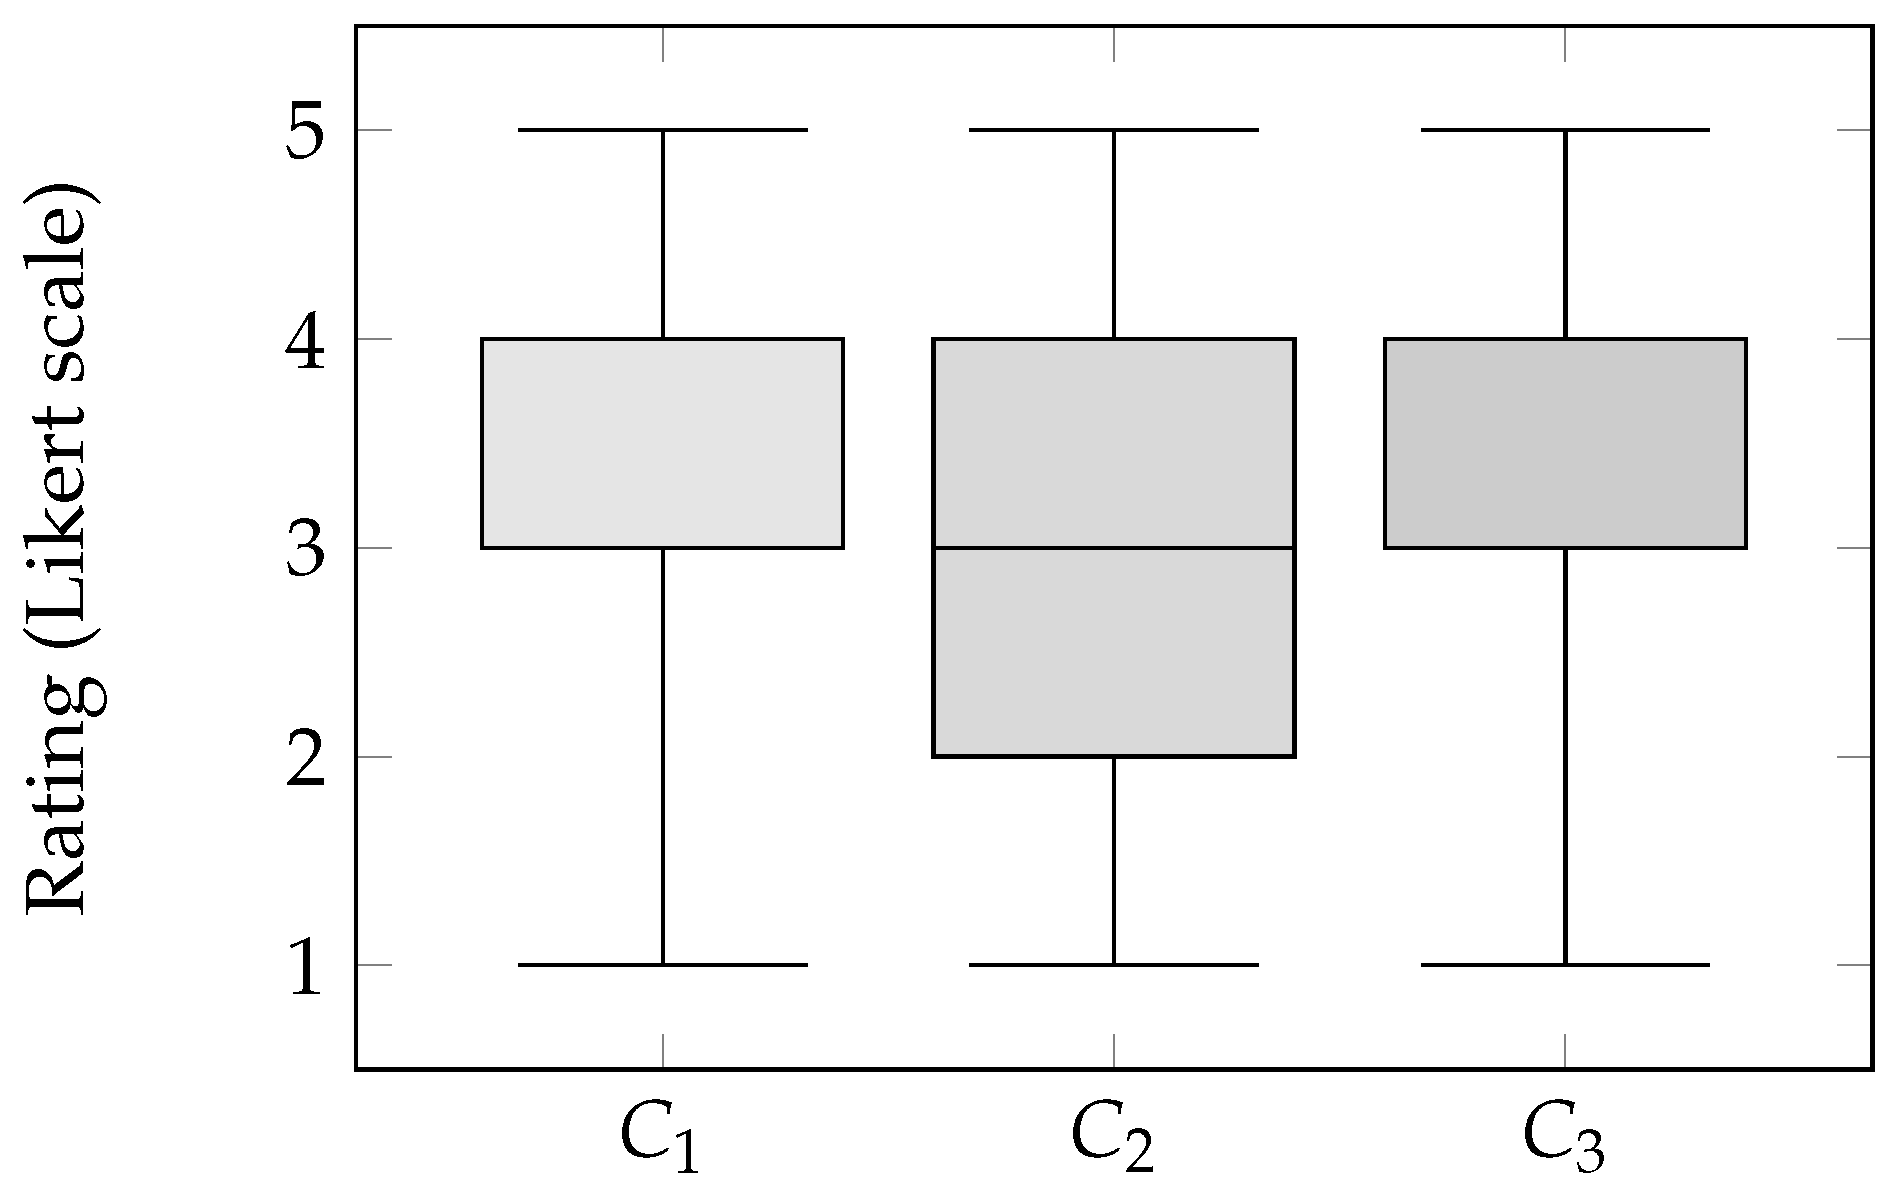
Table 2 presents descriptive statistics for each curvature type.
The descriptive statistics show very similar central tendencies and variability across all tested curvature profiles.
Figure 7 illustrates the distribution of ratings for different curvature types. The boxplots show substantial overlap between all tested profiles, indicating no clear preference for a specific type of amplitude growth.
The Friedman test showed no statistically significant differences between curvature types (, p = 0.0970, Kendall’s W = 0.11), indicating only a weak effect of slope curvature on perceived usability.
6.3.2. Effect of Slope Length
To evaluate the effect of slope length, participant ratings were averaged over all tested curvature profiles. This resulted in five aggregated values corresponding to the tested slope lengths (S1–S5).
The descriptive statistics presented in
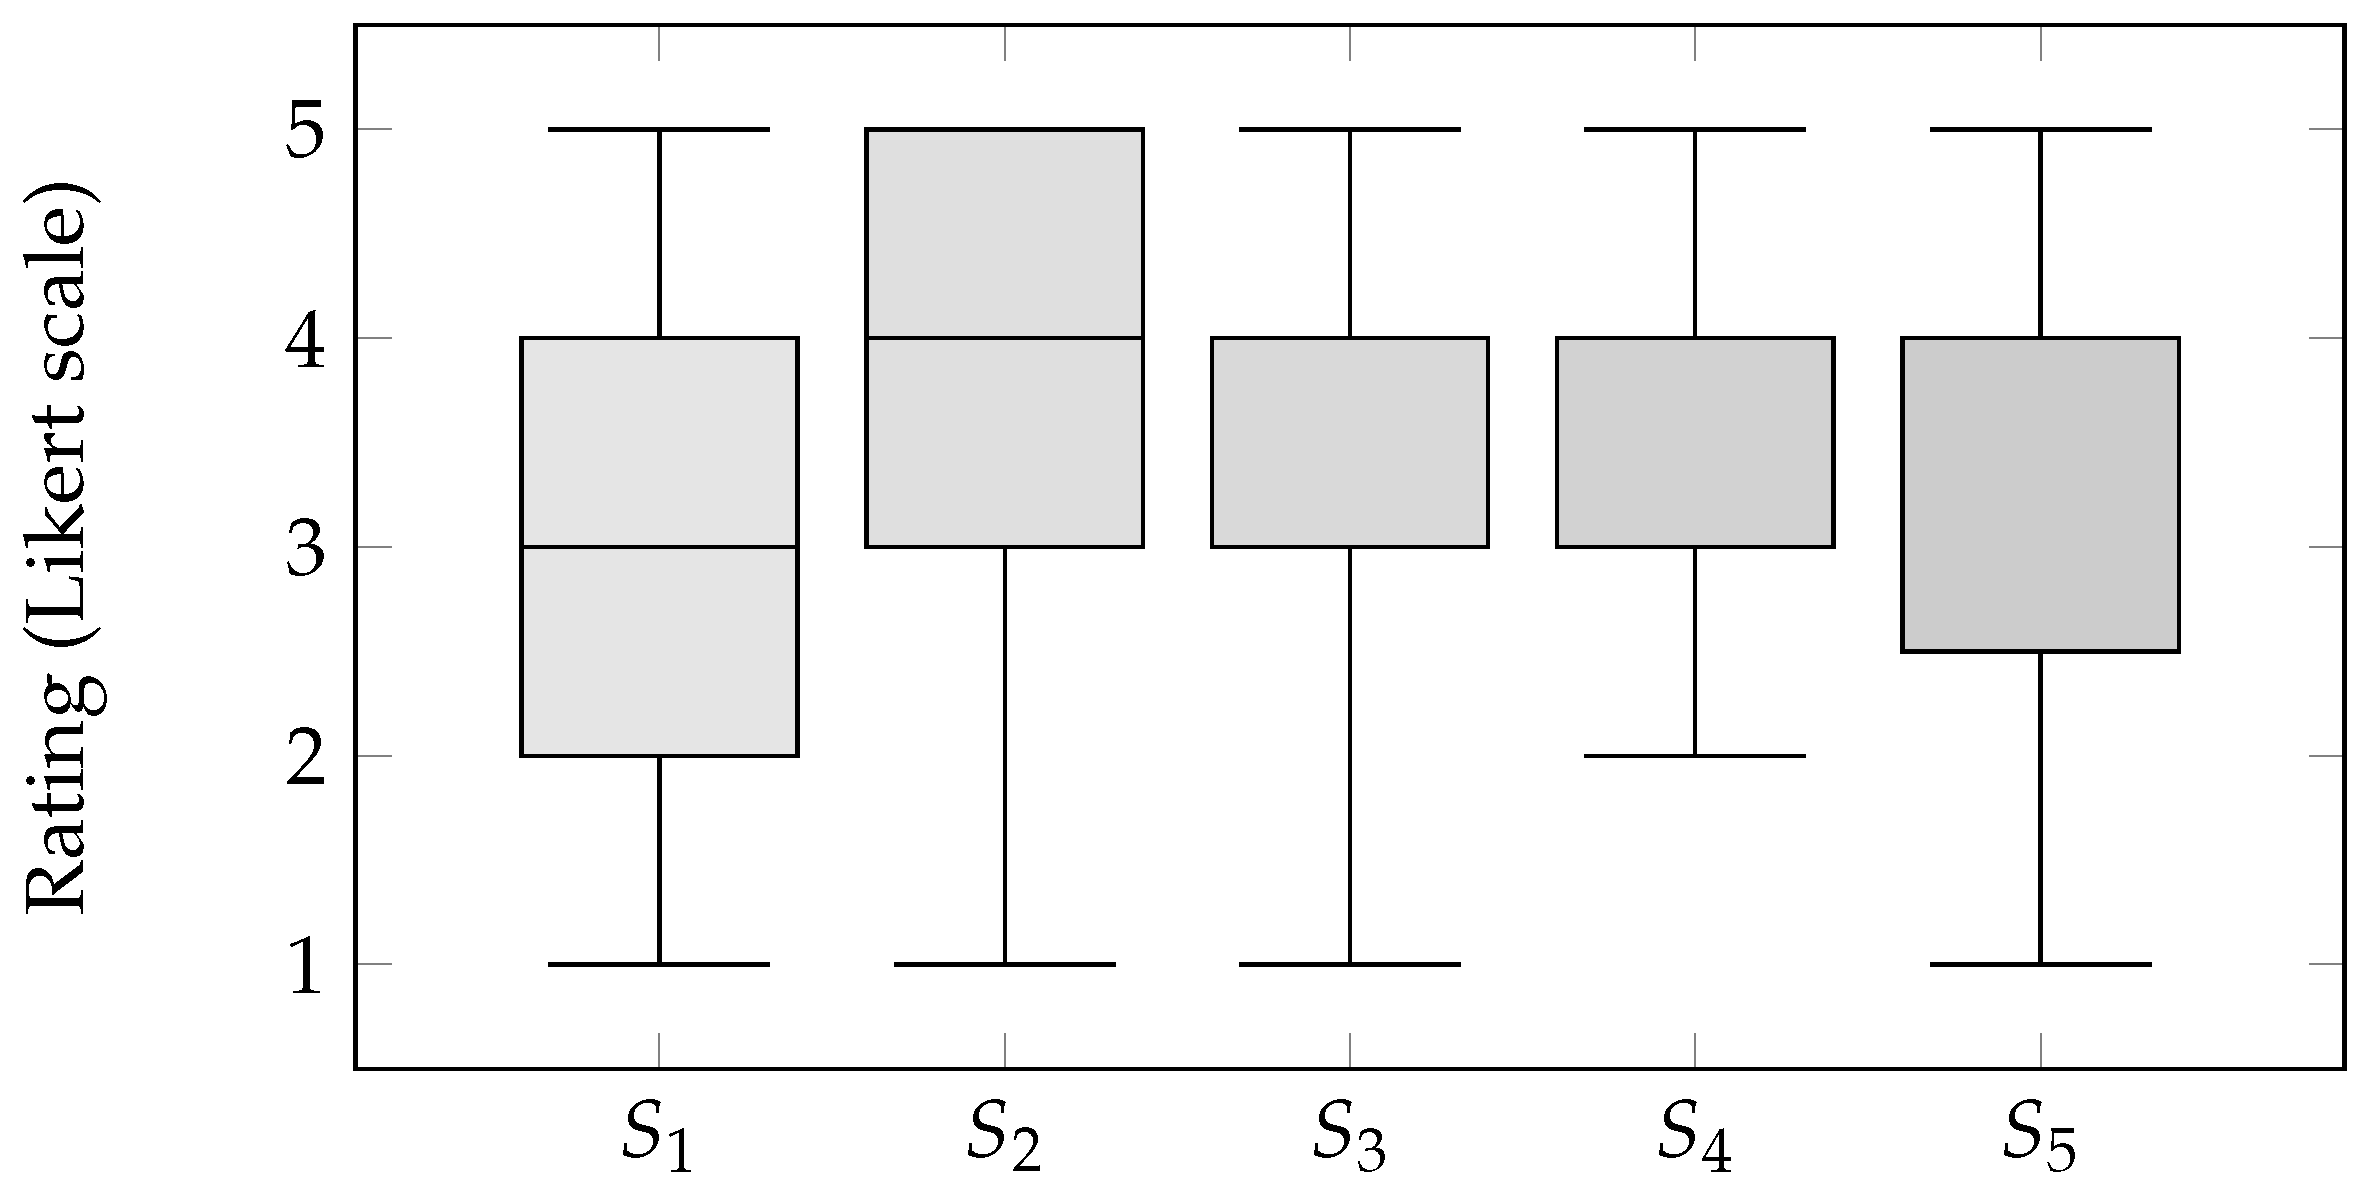
Table 3 show a gradual increase in participant ratings as the slope length increases up to
S4, which achieved the highest median and the lowest variability. A slight decrease in ratings for
S5 suggests that extending the slope beyond this point does not provide additional perceptual benefit.
Figure 8 presents the distribution of ratings for different slope lengths. The boxplots illustrate a gradual improvement in participant ratings from
S1 to
S4, whereas no further improvement is observed for
S5, supporting the presence of a saturation effect.
The Friedman test revealed statistically significant differences between slope lengths (, p = 0.0018, Kendall’s W = 0.21), indicating a small-to-moderate effect of slope length on the perceived usability of graph sonification.
6.4. Summary of Findings
The results of Experiment 1 indicate that usability improves with increasing plateau width up to approximately 52 dp (about 9.8 mm). Wider plateaus did not produce further improvement.
The results of Experiment 2 indicate that slope curvature has little influence on user perception, whereas slope length plays a substantially more important role in the effectiveness of auditory guidance. Intermediate-to-long slope lengths, with an estimated optimum of approximately 84 dp (about 15.8 mm), received the highest ratings.
6.5. Observations from Participant Interaction
During the experiments, several observations were made regarding participant interaction strategies and perceptual effects:
After leaving the auditory plateau during exploration, participants often experienced difficulty relocating the graph without the guidance provided by the increasing amplitude of the slope signal.
Prior knowledge of the mathematical formula of the sonified function facilitated both graph localization and understanding of its shape.
Participants who explored the graph more slowly tended to prefer narrower plateaus and slopes, whereas participants making faster finger movements required wider auditory paths for effective interaction.
Higher function values, represented by higher-frequency sounds, were sometimes perceived as louder despite identical physical amplitudes.
These observations suggest that individual exploration strategies and perceptual factors may substantially influence the interaction with sonified graphs.
7. Discussion
7.1. Analysis of Sonification Index and Auditory Saturation
Applying the Formulas (
12) and (
15), the SI and the AS were computed for the analyzed functions with the sonification parameters estimated from the results of Experiment 1.
A quadratic regression fitted to the mean participant ratings reported in
Table 1 indicates that the maximum perceived usability is achieved for a plateau width of approximately
P ≈ 52 dp, corresponding to about 9.8 mm. Similarly, a quadratic regression fitted to the slope-length ratings indicates an optimum at approximately
S ≈ 84 dp, corresponding to about 15.8 mm.
With these parameter values, the SI and the AS were computed for the analyzed functions and different slope curvature parameters
C (
Table 4). The calculations were performed for the tablet workspace used during the experiments, with physical dimensions of 197.1 × 147.8 mm and a Cartesian graph area defined over
and
.
Since the SI represents an effective auditory area instead of a physical volume, its values are expressed in cm2 for improved readability. Applying mm2 would lead to unnecessarily large numerical values, while dp2 was intentionally avoided because density-independent pixels are interface-related units dependent on the rendering model of the operating system but not on the physical dimensions of the explored space.
The obtained values indicate that both the SI and the AS increase with the geometric complexity of the function graph and with increasing values of the slope curvature parameter C. Functions with longer graph trajectories naturally produce larger effective auditory areas, leading to higher levels of the AS. In particular, the sinusoidal function combined with C = 3 yields an AS of approximately 62%, indicating a relatively dense auditory representation that may increase the risk of auditory clutter during touchscreen exploration.
The perceptual threshold beyond which increasing the AS no longer improves graph exploration depends on human auditory processing and therefore cannot be derived solely from the mathematical model. Instead, it was estimated experimentally in the present study. Hence, the mathematical model should be regarded as a tool for quantifying and comparing the spatial distribution of auditory information, whereas the selection of optimal sonification parameters requires empirical validation involving end users.
The experimental results further indicate that user evaluations follow the trends predicted by the SI and AS measures. Configurations associated with intermediate levels of the AS consistently received the highest usability ratings, whereas both lower and higher saturation levels resulted in reduced user preference. Although the present study was not designed to establish a formal predictive relationship between SI/AS and subjective usability, these findings provide empirical support for the practical relevance of the measures.
7.2. Adaptive Selection of Sonification Parameters
The results suggest that different mathematical functions may require different sonification settings in order to maintain a comparable level of the AS. Even for fixed sonification parameters, functions characterized by longer graph trajectories naturally produce higher values of the SI and, as a result, higher auditory saturation.
Assuming that users interacting with sonified graphs may prefer a certain level of the AS, the model can also be used to estimate suitable sonification parameters for a given graph and device configuration. In particular, the model enables adaptive adjustment of the plateau width and slope length based on the geometric complexity of the function graph.
Applying the previously defined expressions:
where
denotes the physical area of the graph workspace, and assuming the experimentally observed relationship
, the AS can be expressed as:
Solving with respect to the plateau width yields:
and consequently:
These expressions allow the sonification parameters to be adapted dynamically to the displayed function, the dimensions of the device, and the preferred level of the AS. More geometrically complex graphs, characterized by larger values of L, require narrower auditory paths in order to avoid excessive auditory saturation, whereas simpler graphs may benefit from wider auditory guidance to facilitate exploration.
For example, assuming the preferred AS level of approximately 25%, our model estimates that for the function and C = 1, the optimal parameters are approximately P ≈ 4.3 mm and S ≈ 8.6 mm. This example demonstrates that more geometrically complex graphs require narrower auditory paths in order to maintain comparable saturation levels.
Although the adaptive framework demonstrates the practical applicability of the SI and the AS, several limitations should be acknowledged. The experiments were intentionally designed to evaluate the influence of individual sonification parameters separately without analysing the interactions between all parameter combinations. Moreover, the evaluation was conducted with three representative mathematical functions selected to provide different levels of geometric complexity while maintaining a feasible experimental protocol.
Furthermore, the method was evaluated independently rather than through a direct comparison with existing graph sonification systems. Such systems differ substantially in their interaction paradigms, sonification strategies, and intended application scenarios, making a fair and reproducible comparison under identical experimental conditions difficult. Thus, the present study focused on evaluating the adaptive framework in isolation, while comparative studies involving alternative graph sonification approaches constitute an important direction for future research.
8. Conclusions
This paper addressed the problem of effective sonification of mathematical function graphs for visually impaired users, with particular emphasis on balancing perceptual accessibility and auditory saturation. The proposed approach combines continuous sonification with voice interaction, enabling users to explore mathematical function graphs through dynamically generated auditory cues during touchscreen interaction.
Two experiments evaluated the influence of plateau width, slope length, and slope curvature on the usability of graph sonification. The results demonstrated that usability improves with increasing auditory coverage only up to a certain threshold, beyond which excessive auditory density may reduce perceptual clarity.
The experimental results suggest that the optimal plateau width is approximately 52 dp (about 9.8 mm), while the preferred slope length is approximately 84 dp (about 15.8 mm). In contrast, slope curvature was found to have relatively little influence on subjective usability compared to the spatial extent of the auditory signal. These values were obtained for a tablet device with the screen dimensions used in the experiments. For devices with different screen sizes or aspect ratios, the proposed mathematical model can be used to estimate suitable values of P and S that achieve the desired level of the AS.
An important contribution of this work is the introduction of the Sonification Index (SI) and Auditory Saturation (AS), which provide quantitative measures of the amount and density of auditory information distributed across the graph area. The proposed model enables the estimation of how graph geometry and sonification parameters influence the explored auditory space. Furthermore, it supports the adaptive selection of sonification parameters based on graph complexity, device dimensions, and the preferred AS.
The results additionally highlight the importance of perceptual and human-related factors in the design of auditory interfaces. The experiments also revealed individual differences in preferred exploration strategies, while perceptual interactions between loudness and frequency influenced the interpretation of auditory cues. These observations suggest that future sonification systems should support greater personalization and adaptivity.
Future work should extend the experimental validation of the proposed framework by involving larger groups of blind and visually impaired participants, investigating parameter interactions using multifactor experimental designs, and evaluating a broader range of mathematical functions, including discontinuous and piecewise-defined functions. It should also incorporate psychoacoustic models, including loudness perception, equal-loudness compensation, and stereo and spatial audio techniques, to improve perceptual consistency while preserving the adaptive structure of the mathematical framework. Such extensions would complement the present interaction-oriented model by accounting for perceptual characteristics of the human auditory system without altering its underlying mathematical formulation.
Author Contributions
Conceptualization, K.D., D.H. and P.K.; methodology, K.D. and D.H.; software, D.H.; validation, K.D., D.H. and P.K.; formal analysis, K.D. and D.H.; investigation, K.D., D.H. and P.K.; resources, P.K.; data curation, K.D.; writing—original draft preparation, K.D. and D.H.; writing—review and editing, D.H. and P.K.; visualization, K.D. and D.H.; supervision, K.D.; project administration, K.D.; funding acquisition, K.D., D.H. and P.K. All authors have read and agreed to the published version of the manuscript.
Funding
This publication was supported by Silesian University of Technology and University of Silesia.
Institutional Review Board Statement
This study included performing gestures on tablet screens based on auditory cues. It was conducted using hardware and software that had been tested prior to data collection. The study was carried out under controlled conditions, without any behavior interventions, and therefore no manipulation was introduced. No data on user behavior was recorded during the study. Performing the gestures did not require excessive physical or mental effort. The study complies with the conditions set out in Regulation No. 179/2025 of the Rector of the Silesian University of Technology dated 27 October 2025, entitled ‘Regulation on the establishment and operating principles of the Ethics Committee for Research Involving Human Subjects’.
Informed Consent Statement
Informed consent was obtained from all subjects involved in the study.
Data Availability Statement
The original contributions presented in this study are included in the article. Further inquiries can be directed to the corresponding author.
Conflicts of Interest
The authors declare no conflicts of interest.
References
- World Health Organization. Blindness and Vision Impairment. 2026. Available online: https://www.who.int/news-room/fact-sheets/blindness-and-visual-impairment (accessed on 29 March 2026).
- Miller, I.; Pather, A.; Milbury, J.; Hasty, L.; O’Day, A.; Spence, D.; Osterhaus, S. Guidelines and Standards for Tactile Graphics; The Braille Authority of North America: Arlington, VA, USA, 2010. [Google Scholar]
- Metatla, O.; Oldfield, A.; Ahmed, T.; Vafeas, A.; Miglani, S. Voice user interfaces in schools: Co-designing for inclusion with visually-impaired and sighted pupils. In Proceedings of the 2019 CHI Conference on Human Factors in Computing Systems, Glasgow, UK, 4–9 May 2019; pp. 1–15. [Google Scholar] [CrossRef]
- Kalia, A.; Hopkins, R.; Jin, D.; Yazzolino, L.; Verma, S.; Merabet, L.; Phillips, F.; Sinha, P. Perception of tactile graphics: Embossings versus cutouts. Multisens. Res. 2014, 27, 111–125. [Google Scholar] [CrossRef] [PubMed]
- Dzhurynskyi, Y.; Mayik, V.; Mayik, L. Enhancing accessibility: Automated tactile graphics generation for individuals with visual impairments. Computation 2024, 12, 251. [Google Scholar] [CrossRef]
- World Wide Web Consortium (W3C). Web Content Accessibility Guidelines (WCAG) 2.1. 2018. Available online: https://www.w3.org/TR/WCAG21/ (accessed on 29 March 2026).
- Gorlewicz, J.L.; Tennison, J.L.; Palani, H.P.; Giudice, N.A. The Graphical Access Challenge for People with Visual Impairments: Positions and Pathways Forward; IntechOpen: London, UK, 2018. [Google Scholar] [CrossRef]
- He, T.; McCracken, M.; Hajas, D.; Creem-Regehr, S.; Lex, A. Using Tactile Charts to Support Comprehension and Learning of Complex Visualizations for Blind and Low-Vision Individuals. IEEE Trans. Vis. Comput. Graph. 2026, 32, 199–209. [Google Scholar] [CrossRef] [PubMed]
- Suzuki, Y.; Takeshima, H. Equal-loudness-level contours for pure tones. J. Acoust. Soc. Am. 2004, 116, 918–933. [Google Scholar] [CrossRef] [PubMed]
- Brotto, D.; Benvegnù, F.; Colombo, A.; De Filippis, C.; Martini, A.; Favaretto, N. Age-related changes in auditory perception. Hearing loss in the elderly: Aging ear or aging brain? Aging Clin. Exp. Res. 2023, 35, 2349–2354. [Google Scholar] [CrossRef] [PubMed]
- Kramer, G.; Walker, B.; Bonebright, T.; Cook, P.; Flowers, J.H.; Miner, N.; Neuhoff, J. Sonification Report: Status of the Field and Research Agenda; University of Nebraska: Lincoln, NE, USA, 2010. [Google Scholar]
- Hermann, T. Taxonomy and definitions for sonification and auditory display. In Proceedings of the 14th International Conference on Auditory Display (ICAD 2008), Paris, France, 24–27 June 2008. [Google Scholar]
- ISO 9241-210; Human-Centred Design for Interactive Systems (Sonification-Related Definitions). International Organization for Standardization: Geneva, Switzerland, 2019.
- ISO 226:2003; Acoustics—Normal Equal-Loudness-Level Contours. International Organization for Standardization: Geneva, Switzerland, 2003.
- Hermann, T.; Hunt, A.; Neuhoff, J.G. The Sonification Handbook; Logos Verlag: Berlin, Germany, 2011; Volume 1. [Google Scholar]
- Scaletti, C. Sound synthesis algorithms for auditory data representations. In Proceedings of the Santa Fe Institute Studies in the Sciences of Complexity; Proceedings Volume; Addison-Wesley Publishing Co.: Carrollton, TX, USA, 1994; Volume 18, p. 223. [Google Scholar]
- Walker, B.N.; Nees, M.A. Theory of sonification. In Sonification Handbook; Logos Publishing House: Berlin, Germany, 2011; Volume 1, pp. 9–39. [Google Scholar]
- Nees, M.A.; Walker, B.N. Auditory Interfaces and Sonification. In The Universal Access Handbook; CRC Press: Boca Raton, FL, USA, 2009; pp. 507–521. [Google Scholar]
- Pauletto, S.; Hunt, A. Interactive sonification of complex data. Int. J. Hum.-Comput. Stud. 2009, 67, 923–933. [Google Scholar] [CrossRef]
- Guiotto Nai Fovino, L.; Zanella, A.; Grassi, M. Evaluation of the effectiveness of sonification for time-series data exploration. Astron. J. 2024, 167, 150. [Google Scholar] [CrossRef]
- Frauenberger, C.; Stockman, T. Auditory display design—An investigation of a design pattern approach. Int. J. Hum.-Comput. Stud. 2009, 67, 907–922. [Google Scholar] [CrossRef]
- Mansur, D.L.; Blattner, M.M.; Joy, K.I. Sound graphs: A numerical data analysis method for the blind. J. Med. Syst. 1985, 9, 163–174. [Google Scholar] [CrossRef] [PubMed]
- Flowers, J.H. Thirteen Years of Reflection on Auditory Graphing: Promises, Pitfalls, and Potential New Directions; University of Nebraska: Lincoln, NE, USA, 2005. [Google Scholar]
- Brown, L.M.; Brewster, S.A.; Ramloll, S.; Burton, R.; Riedel, B. Design guidelines for audio presentation of graphs and tables. In Proceedings of the 9th International Conference on Auditory Display (ICAD), Boston, MA, USA, 6–9 July 2003. [Google Scholar]
- Kane, S.K.; Bigham, J.P.; Wobbrock, J.O. Slide rule: Making mobile touch screens accessible to blind people using multi-touch interaction techniques. In Proceedings of the 10th International ACM SIGACCESS Conference on Computers and Accessibility, Halifax, NS, Canada, 13–15 October 2008; pp. 73–80. [Google Scholar] [CrossRef]
- Brock, A.; Jouffrais, C. Interactive Audio-Tactile Maps for Visually Impaired People; Association for Computing Machinery: New York, NY, USA, 2015. [Google Scholar] [CrossRef]
- Grond, F.; Drossard, T.; Hermann, T. SonicFunction: Experiments with a Function Browser for the Visually Impaired. In Proceedings of the 16th International Conference on Auditory Display (ICAD-2010), Washington, DC, USA, 9–15 June 2010. [Google Scholar]
- Grond, F.; Hermann, T. Singing Function: Exploring Auditory Graphs with Vowel-Based Sonification. J. Multimodal User Interfaces 2012, 5, 87–95. [Google Scholar] [CrossRef]
- Ahmetovic, D.; Bernareggi, C.; Guerreiro, J.; Mascetti, S.; Capietto, A. AudioFunctions.web: Multimodal Exploration of Mathematical Function Graphs. In Proceedings of the 16th International Web for All Conference (W4A); ACM: New York, NY, USA, 2019. [Google Scholar] [CrossRef]
- Manolino, C.; Funghi, S.; Ducci, M.; Brunetto, E.; Bernareggi, C. Navigating Function Graphs with Audio: An Investigation into the Narratives of a Blind Expert Using AudioFunctions. In Proceedings of the Fourteenth Congress of the European Society for Research in Mathematics Education (CERME14), Bozen-Bolzano, Italy, 3–8 February 2025. [Google Scholar]
- Maćkowski, M.; Brzoza, P.; Kawulok, M.; Meisel, R.; Spinczyk, D. Multimodal presentation of interactive audio-tactile graphics supporting the perception of visual information by blind people. ACM Trans. Multimed. Comput. Commun. Appl. 2023, 19, 1–22. [Google Scholar] [CrossRef]
- Vanderbilt University. App Turns Tablet into Math Aid for Visually Impaired Students. 2012. Available online: https://news.vanderbilt.edu/2012/03/05/haptic-tablet/ (accessed on 29 March 2026).
- Gatto, S.; Gaggi, O.; Grosset, L.; Fovino, L.G.N. Accessible Mathematics: Representation of Functions Through Sound and Touch. IEEE Access 2024, 12, 121552–121569. [Google Scholar] [CrossRef]
- Kim, J.; Lee, Y.; Seo, I. Math Graphs for the Visually Impaired: Audio Presentation of Elements of Mathematical Graphs. In Proceedings of the Extended Abstracts of the 2019 CHI Conference on Human Factors in Computing Systems; ACM: New York, NY, USA, 2019; pp. 1–6. [Google Scholar] [CrossRef]
- Dobosz, K.; Hanak, D. Audible Charts of Mathematical Functions. In Proceedings of the International Conference on Computers Helping People with Special Needs; Springer: Cham, Switzerland, 2024; pp. 211–216. [Google Scholar] [CrossRef]
- Jamieson, S. Likert scales: How to (ab) use them? Med. Educ. 2004, 38, 1217–1218. [Google Scholar] [CrossRef] [PubMed]
| Disclaimer/Publisher’s Note: The statements, opinions and data contained in all publications are solely those of the individual author(s) and contributor(s) and not of MDPI and/or the editor(s). MDPI and/or the editor(s) disclaim responsibility for any injury to people or property resulting from any ideas, methods, instructions or products referred to in the content. |