Article

Optimization of Maceration, Ultrasound-, Bead-Beating-, and Turbo-Assisted Extraction of Bioactive Compounds from Phytolacca americana Fruits

by
Lucia-Florina Popovici
and
Simona Oancea
*
Department of Agricultural Sciences and Food Engineering, Lucian Blaga University of Sibiu, 7–9 Ion Ratiu Street, 550012 Sibiu, Romania
*
Author to whom correspondence should be addressed.
Appl. Sci. 2026, 16(14), 6909; https://doi.org/10.3390/app16146909
Submission received: 8 June 2026 / Revised: 30 June 2026 / Accepted: 4 July 2026 / Published: 9 July 2026
(This article belongs to the Special Issue New Challenges into Pharmacology)

Abstract

Phytolacca americana L. fruits represent a promising invasive plant matrix for obtaining antioxidant-rich extracts and natural pigments, but extraction efficiency depends strongly on processing conditions. This study reports a comparative assessment and optimization of four extraction methods: maceration (ME), ultrasound-assisted extraction (UAE), bead-beating extraction (BBE), and turbo-extraction (TE), for the recovery of total phenolic content (TPC), total flavonoid content (TFC), total condensed tannins (TTC), betalains, and antioxidant activity assessed by FRAP, DPPH, and ABTS assays from P. americana fruits. A 23 full factorial design was applied for each method, evaluating the effects of solvent/solid ratio, extraction time, and method-specific parameters. The results of optimization using response surface methodology showed that no single extraction condition maximized all responses simultaneously. Phenolic-related responses and FRAP/ABTS activity were generally favored by a longer extraction time, higher solvent/solid ratio, and accelerated mechanical or acoustic input. In contrast, betalain recovery was consistently improved at a lower solvent/solid ratio, indicating a different optimization pattern for pigment-rich extracts. UAE provided a favorable balance between TFC yield and reproducibility, while TE and BBE were effective for TPC and TTC-related profiles. Overall, the study demonstrates that optimal extraction conditions for P. americana fruits vary according to the target application, such as maximizing pigment recovery, enhancing phenolic content, or improving antioxidant activity.

1. Introduction

The growing interest in natural sources of bioactive compounds has intensified research into plant-based antioxidants, particularly phenolic compounds due to their potential health benefits and roles in preventing oxidative stress-related diseases [1,2]. The efficient recovery of plant-derived bioactive compounds has become an important topic in applied phytochemistry, food science, and bioprocess optimization, particularly in the context of developing extraction strategies that are reproducible, scalable, and compatible with reduced solvent and energy consumption [2,3,4]. Phenolic compounds, flavonoids, condensed tannins, and natural pigments are of particular interest because they contribute to the antioxidant potential and technological applicability of plant extracts, including their use as natural antioxidants, colorants, stabilizing agents, and bioactive ingredients in food, nutraceutical, cosmetic, and pharmaceutical formulations [5,6,7,8]. However, their recovery from complex vegetal matrices is strongly dependent on the extraction conditions, including the solvent/solid ratio, processing time and temperature, and extraction technique [2,3,4]. Therefore, beyond the simple identification of bioactive compounds, current research increasingly focuses on optimizing extraction workflows in order to obtain high-yield extracts under controlled and practically applicable conditions.
Phytolacca americana L. (P. americana), commonly known as American pokeweed, is a wild plant species native to North America and now distributed in several regions worldwide. The species has attracted attention due to its chemically diverse profile, which includes phenolic compounds, flavonoids, saponins, and betalain-type pigments [9,10,11]. Traditionally used in folk medicine, recent studies have pointed to its promising antioxidant, anti-inflammatory, and antimicrobial activities [10]. From an applied perspective, the fruits, specifically berries of P. americana, are particularly relevant because they combine intense pigmentation with antioxidant-related phytochemicals, supporting their potential use as a source of natural colorants and bioactive extracts [11]. Recent work has emphasized the broader interest in berry-producing invasive plants and the shift from being only ecological threats to being rich alternative sources of pharmacologically active, but sometimes toxic, compounds, with the mentioned study being an important starting point for safer exploitation of these fruits in medicine, food and industry, while potentially contributing to invasive plant species management [9]. In addition, our previous experimental research on P. americana fruits has shown cognitive and anti-anxiety-related effects in a zebrafish model of scopolamine-induced memory impairment, further supporting the biological relevance of this plant matrix [10]. However, despite its recognized bioactive potential, comprehensive studies optimizing the extraction parameters to maximize recovery of phenolic compounds and related bioactivities from P. americana fruits remain limited.
Extraction performance is not determined only by the plant matrix, but also by the mechanism through which the solvent interacts with the tissue. Conventional maceration (ME) remains attractive because of its simplicity and low technical requirements, but it is often limited by slower mass transfer [4,12,13]. In contrast, intensified methods such as ultrasound-assisted extraction (UAE), bead-beating extraction (BBE), and turbo-extraction (TE) can enhance tissue disruption, solvent penetration, and diffusion of target compounds into the extraction medium [3,4,14]. These techniques may improve the recovery of phenolics and pigments, but their efficiency may vary depending on the selected operating conditions. Excessive mechanical or acoustic intensity may also increase variability or promote degradation of sensitive compounds, indicating the need for method-specific optimization rather than a single generalized extraction protocol.
In this context, factorial experimental designs provide a useful applied framework for evaluating extraction conditions. A 23 full factorial design allows for the simultaneous assessment of three independent variables at two levels and provides information on both main effects and interactions between factors [15,16]. This approach is particularly suitable for preliminary optimization studies because it identifies the direction and relative importance of experimental factors while maintaining a practical experimental workload. For plant matrices such as P. americana fruits, where systematic extraction data remain limited, this strategy can clarify whether extraction yield and antioxidant responses are mainly driven by solvent availability, extraction duration, or the specific intensity parameter of each technique.
Therefore, this study aimed to investigate, compare, and optimize four extraction approaches—ME, UAE, BBE and TE—for the recovery of bioactive compounds from P. americana fruits. Using a 23 factorial design, the study evaluated the influence of solvent/solid ratio, extraction time, and method-specific parameters on TPC, TFC, TTC, betalain pigments, and antioxidant activity assessed by complementary assays. By integrating phytochemical responses with statistical optimization, this study provides an applied comparative framework for extraction strategies and identifies practical operating conditions that may support the standardized recovery of antioxidant-rich and pigment-containing extracts from P. americana fruits. These findings may also provide a methodological basis for future work addressing extract stability, detailed phytochemical profiling, safety-related validation, and process scale-up, thereby contributing to the controlled and sustainable valorization of P. americana fruits in applications where natural pigments and antioxidant-rich plant extracts are of technological interest.

2. Materials and Methods

2.1. Botanical Sample and Chemical Reagents

Fully ripened fruits of Phytolacca americana L. (family Phytolaccaceae) were collected in November 2023 from spontaneous vegetation of the “Anastasie Fătu” Botanical Garden of Iași, Romania (47°11′12.5″ N, 27°33′14.3″ E). A voucher specimen (HFS-231005) has been deposited in the Herbarium of the Faculty of Sciences, “Lucian Blaga” University of Sibiu, Romania. The berries were blended using the GRINDOMIX GM 200 device (Retsch, Haan, Germany) to obtain a uniform berry pulp being immediately stored at −20 °C to preserve their biochemical integrity until further processing. The moisture content of the homogenized material measured using the moisture analyzer MAC 210/NP (Radwag, Radom, Poland) was 57.10%. All experiments were performed at laboratory scale using 70% aqueous ethanol as solvent at fixed solvent volume of 20 mL. The 10/1 v/w solvent/solid ratio corresponded to 20 mL solvent and 2 g plant material, while the 20/1 v/w ratio corresponded to 20 mL solvent and 1 g plant material. ME, UAE, and TE were performed in glass beakers, whereas BBE was performed in 50 mL centrifuge tubes compatible with the bead-beating device. All chemicals used throughout the study were of analytical grade and sourced from certified suppliers.

2.2. Design of Experiments (DOE) for Extraction Procedures Applied to Phytolacca americana Fruits

Conventional extraction (ME) and several accelerated modern methods (UAE, TE, BBE) were investigated to assess their impact on bioactive compound content and antioxidant activity. ME was selected as a widely used technique (reference method), while the other methods were chosen because of their potential to enhance extraction efficiency. The chosen methods were performed using common experimental parameters (solvent/solid ratio, time), while method-specific parameters were varied for each method (temperature, ultrasound amplitude, rotor speed, strokes rate). A 23 full factorial design was used, resulting in a set of 8 experimental runs per each method, with 3 variables at 2 levels (low and high), as shown in Table 1.
ME was performed under controlled temperature conditions, at 30 °C and 60 °C, according to the factorial design. The samples were kept under low magnetic shaking (300 rpm) in the dark to avoid degradation of light-sensitive compounds, such as betalains that may decompose under several environmental conditions, including light [17]. Two solvent/solid ratios (10/1 and 20/1 v/w) and two extraction times (15 and 30 min) were used. After extraction, all samples were centrifuged at 8000 rpm and 4 °C for 10 min using the refrigerated centrifuge (Universal 320, Hettich, Tuttlingen, Germany).
UAE was conducted in pulse-mode using the ultrasonic device Sonifier SLPe-150 (Branson, MI, USA), at amplitudes of 40% and 70%, 150 W power, and 40 kHz frequency. Two solvent/solid ratios (10/1 and 20/1 v/w) and two extraction times (15 and 30 min) were used. The temperatures of the samples were monitored during the UAE experiments, because ultrasound-assisted extraction can induce heating of the extraction medium. To minimize temperature increase, the extraction vials were externally cooled during sonication by using a cold-water bath, which was refreshed when necessary. The process was not thermostatically controlled. Therefore, the final temperature was recorded at the end of each extraction run and reported. The recorded values are presented in Table 2. After extraction, all samples were centrifuged at 8000 rpm and 4 °C for 10 min using the refrigerated centrifuge (Universal 320, Hettich, Tuttlingen, Germany).
TE was conducted using a high-speed Ultra-Turrax T25 digital homogenizer (IKA®, Staufen, Germany), equipped with a stainless-steel dispersion probe, at two speed levels (6000 rpm and 12,000 rpm), with 60-s duty cycles followed by 60-s breaks to prevent excessive heating of the sample. Two solvent/solid ratios (10/1 and 20/1 v/w) and two extraction times (15 and 30 min) were used. After extraction, all samples were centrifuged at 8000 rpm and 4 °C for 10 min using the refrigerated centrifuge (Universal 320, Hettich, Tuttlingen, Germany).
BBE was carried out at 2400 and 4800 strokes per minute (SPM), using a Bead Genie SI-B100 bead beater (Scientific Industries, Inc., New York, NY, USA). Two solvent/solid ratios (10/1 and 20/1 v/w) and two extraction times (15 and 30 min) were used. After extraction, all samples were centrifuged at 8000 rpm and 4 °C for 10 min using the refrigerated centrifuge (Universal 320, Hettich, Tuttlingen, Germany).

2.3. Total Phenolic Content (TPC)

TPC was determined spectrophotometrically by the Folin–Ciocalteu method [18]. Mixtures were incubated at room temperature in the dark, and absorbance was read at 765 nm using a Specord 200 Plus UV–Vis spectrophotometer (Analytik Jena, Jena, Germany). A gallic acid calibration curve was used, and results were expressed as mg gallic acid equivalents (GAE)/100 g DM.

2.4. Total Flavonoid Content (TFC)

TFC was determined by the aluminum chloride colorimetric assay [19]. After 90 min incubation at room temperature in the dark, absorbance was read at 415 nm. A quercetin calibration curve was used, and results were expressed as mg quercetin equivalents (QE)/100 g DM.

2.5. Total Condensed Tannin Content (TTC)

TTC was determined by the vanillin–HCl colorimetric assay [20]. A catechin calibration curve was used, and results were expressed as mg catechin equivalents (CE)/100 g DM.

2.6. Betalain Content

Betalain content was determined spectrophotometrically following the Pérez-Loredo et al. method [21]. Absorbance was read at 538 nm for betacyanins (Bc) and 476 nm for betaxanthins (Bx). The total betalain (B) content was calculated as the sum of betacyanins and betaxanthins (B = Bc + Bx) and results were expressed as mg/L total betalains. Amounts of Bc and Bx were calculated with the equation below:
B   ( m g / L ) =   A   ×   D F   ×     M W   ×     1000   ε   ×     L  
where:
B = Bc or Bx, expressed as mg betanin equivalents/L or indicaxanthin equivalents/L;
A = absorbance at 538 nm for Bc and at 476 nm for Bx;
DF = dilution factor;
MW = molecular weight (550 g/mol for Bc and 308 g/mol for Bx);
ε = the molar extinction coefficient for Bc = 60,000 L/mol∙cm, and Bx = 48,000 L/mol∙cm;
L = the length of the cuvette (1 cm).

2.7. Antioxidant Activity by FRAP Assay

FRAP (Ferric Reducing Antioxidant Power) was determined spectrophotometrically by the method described by Benzie and Strain [22]. A calibration curve with ascorbic acid (AA) standards was used, and results were expressed as mg ascorbic acid equivalents (AAE)/100 g DM.

2.8. Antioxidant Activity by DPPH (2,2-Diphenyl-1-Picrylhydrazyl) Assay

DPPH (2,2-diphenyl-1-picrylhydrazyl) radical-scavenging assay was performed according to the method described by Brand-Williams et al. [23]. Radical-scavenging activity (RSA, %) was calculated using the following equation:
R S A   % = 100   ×     A 0       A   A 0    
where:
A0 = absorbance at 515 nm of the DPPH solution.
A = absorbance at 515 nm of the sample in the presence of DPPH solution.

2.9. Antioxidant Activity Against ABTS Radical Cations

The ABTS (2,2′-azino-bis-(3-ethylbenzothiazoline-6-sulfonic acid)) decolorization assay is based on the radical cation decolorization principle described by Re et al. [24], with the experimental procedure adapted from Rumpf et al. [25]. The ABTS•+ radical was generated by mixing 7 mM ABTS with 2.45 mM potassium persulfate and incubating the mixture in the dark at room temperature for 8–12 h, then diluting to A734 = 0.700 ± 0.020 with 50% ethanol. The ABTS working solution was combined with 0.25 mL of sample/extract. After 20 min at room temperature, absorbance at 734 nm was measured. A calibration curve was obtained from known concentrations of the Trolox standard. Results were expressed as mg Trolox equivalents (Trolox Eq.)/100 g DM.

2.10. Statistical Analysis

All experiments were performed in duplicate. The values of the experimental data are expressed as mean ± SD.
The extraction workflow for P. americana fruits followed a 23 full factorial design run separately for each technique—ME, UAE, TE, BBE—comprising 8 combinations per method from three two-level factors (low and high): time (15 vs. 30 min), solvent/solid ratio (10/1 vs. 20/1, v/w), and a method-specific intensity factor (ME: 30 °C vs. 60 °C; UAE: 40% vs. 70% amplitude; TE: 6000 vs. 12,000 rpm; BBE: 2400 vs. 4800 spm). The selected low and high levels were chosen to provide a sufficiently broad experimental domain for evaluating the influence of the main extraction parameters and their interactions, while avoiding conditions that could promote excessive degradation of thermolabile and light-sensitive compounds, particularly betalain pigments. For each response (TPC, TFC, TTC, FRAP, DPPH, ABTS, and betalains), we fitted the full model and tested main and interaction effects with fixed-effects ANOVA on linear models. The primary analysis targeted differences between means, using one-way ANOVA (assumptions checked) performed separately for each factor, after verifying assumptions: residual normality (Shapiro–Wilk) and homogeneity of variances (Levene) [26,27]. Pairwise comparisons used Tukey’s post hoc [28]. As a robustness check analysis aligned with the box-plot display (median/IQR), we repeated the comparisons using the Kruskal–Wallis test with Dunn’s post-hoc (Holm correction) to evaluate the consistency of the findings using a complementary rank-based method [29,30,31]. All tests were two-sided with α = 0.05, and 95% confidence intervals were provided where available.

2.11. Extraction Optimization Using RSM for Statistical Design and Modeling

Temperature, time, and other factors for sample pre-treatment were optimized with the help of response surface methodology (RSM) using a 23 full factorial design, while 8 runs were reported in this design. In RSM, first-order models (such as those obtained by 23 factorial) are used for screening and orientation towards the optimal region [15,32]. Each of these key factors was inspected at 2 different statistical levels (low and high). The experimental data were analyzed using Design-Expert software (Version 13.0.5.0) to develop a first-order response surface model and three-dimensional response surface plots were constructed to illustrate the influence of the main effect and the interactions of the studied factors. The factorial/RSM models were interpreted as first-order screening models within the tested experimental domain. For each extraction method and response variable, model adequacy and the significance of the main effects and two-factor interaction terms were assessed by ANOVA in Design-Expert at p < 0.05. The statistical interpretation showed that model and factor significance were response- and method-dependent; therefore, not all models and not all investigated factors were statistically significant. Because not all fitted models were statistically significant, the optimization was interpreted primarily on the basis of the experimental response values, while the response surface plots were used only as graphical support for visualizing fitted first-order trends within the tested domain. The seven measured responses (TPC, TFC, TTC, Betalains, FRAP, DPPH, ABTS) were fitted to a first-order polynomial equation comprising linear and interaction terms. Model adequacy was assessed using analysis of variance (ANOVA) at the 95% confidence level to determine the statistical significance of main effects and two-factor interactions. The coefficient of determination (R2) was calculated to evaluate the proportion of response variability explained by the first-order model. Adjusted R2 was used, where applicable, to account for the number of predictors relative to the experimental runs. Predicted values were generated using Design-Expert 13 software from the fitted factorial regression model established for each extraction method and response variable. For each response, the model-estimated value was calculated using coded independent variables according to the general equation:
Y = β 0 + β 1 A + β 2 B + β 3 C + β 12 A B + β 13 A C + β 23 B C
where Y represents the predicted response; A, B, and C are the coded independent variables corresponding to solvent/solid ratio, extraction time, and the method-specific factor, respectively: temperature for ME, amplitude for UAE, rotor speed for TE, and stroke rate for BBE; β0 is the intercept; β1–β3 are the coefficients of the main effects; and β12–β23 are the coefficients of the two-factor interaction terms. The predicted values reported represent internal model-fitted estimates for the tested experimental runs and are not independent experimental measurements. These statistical parameters ensured that the fitted models adequately described the experimental data obtained from the 23 full factorial design. Although curvature could not be assessed due to the absence of center or axial points, the design provides useful insight into factor influences and allowed the construction of three-dimensional response surface plots to visualize the trends across the studied domain.

2.12. Descriptive z-Score Standardization for Intra-Method Comparison

The z-score transformation was used as a descriptive standardization procedure, to compare responses expressed in different units and to visualize the relative performance of experimental runs within each extraction method. We examined within-extraction method effects of extraction conditions (time, solvent/solid ratio, operational conditions/temperature) on the content of bioactive compounds, natural pigments and antioxidant activity. For each extraction method and each response variable, z-scores were calculated separately from the eight experimental runs corresponding to that method. Using the mean (μ) and standard deviation (σ) calculated at the level of each extraction method, the raw values of each parameter were transformed into z-scores for standardization, using the formula:
z = (x − μ)/σ
These references (μ, σ) remain constant within the intra-method analysis, and the only value that varies was the observation x for each sample (P1–P8). Positive scores indicate performances above the method average, and negative scores below the average. Standardization by z-score allows comparability between determinations with different scales (phenolics, antioxidant activity, pigments). The z-score plots were used as supportive graphical tools for ranking and visualizing response patterns.

3. Results

3.1. Intra-Method Analysis of P. americana Fruit Extracts: Content of Bioactive Compounds and Antioxidant Activity

The intra-method comparison was performed based on the descriptive z-score standardization. This approach was used to visualize and rank extraction conditions within each extraction technique. Experimental and predicted values of phytochemical responses in P. americana fruit extracts obtained under different ME, UAE, TE and BBE conditions are presented in Tables S1–S4 of the Supplementary Materials.

3.1.1. Effects of ME on Content of Bioactive Compounds and Antioxidant Activity

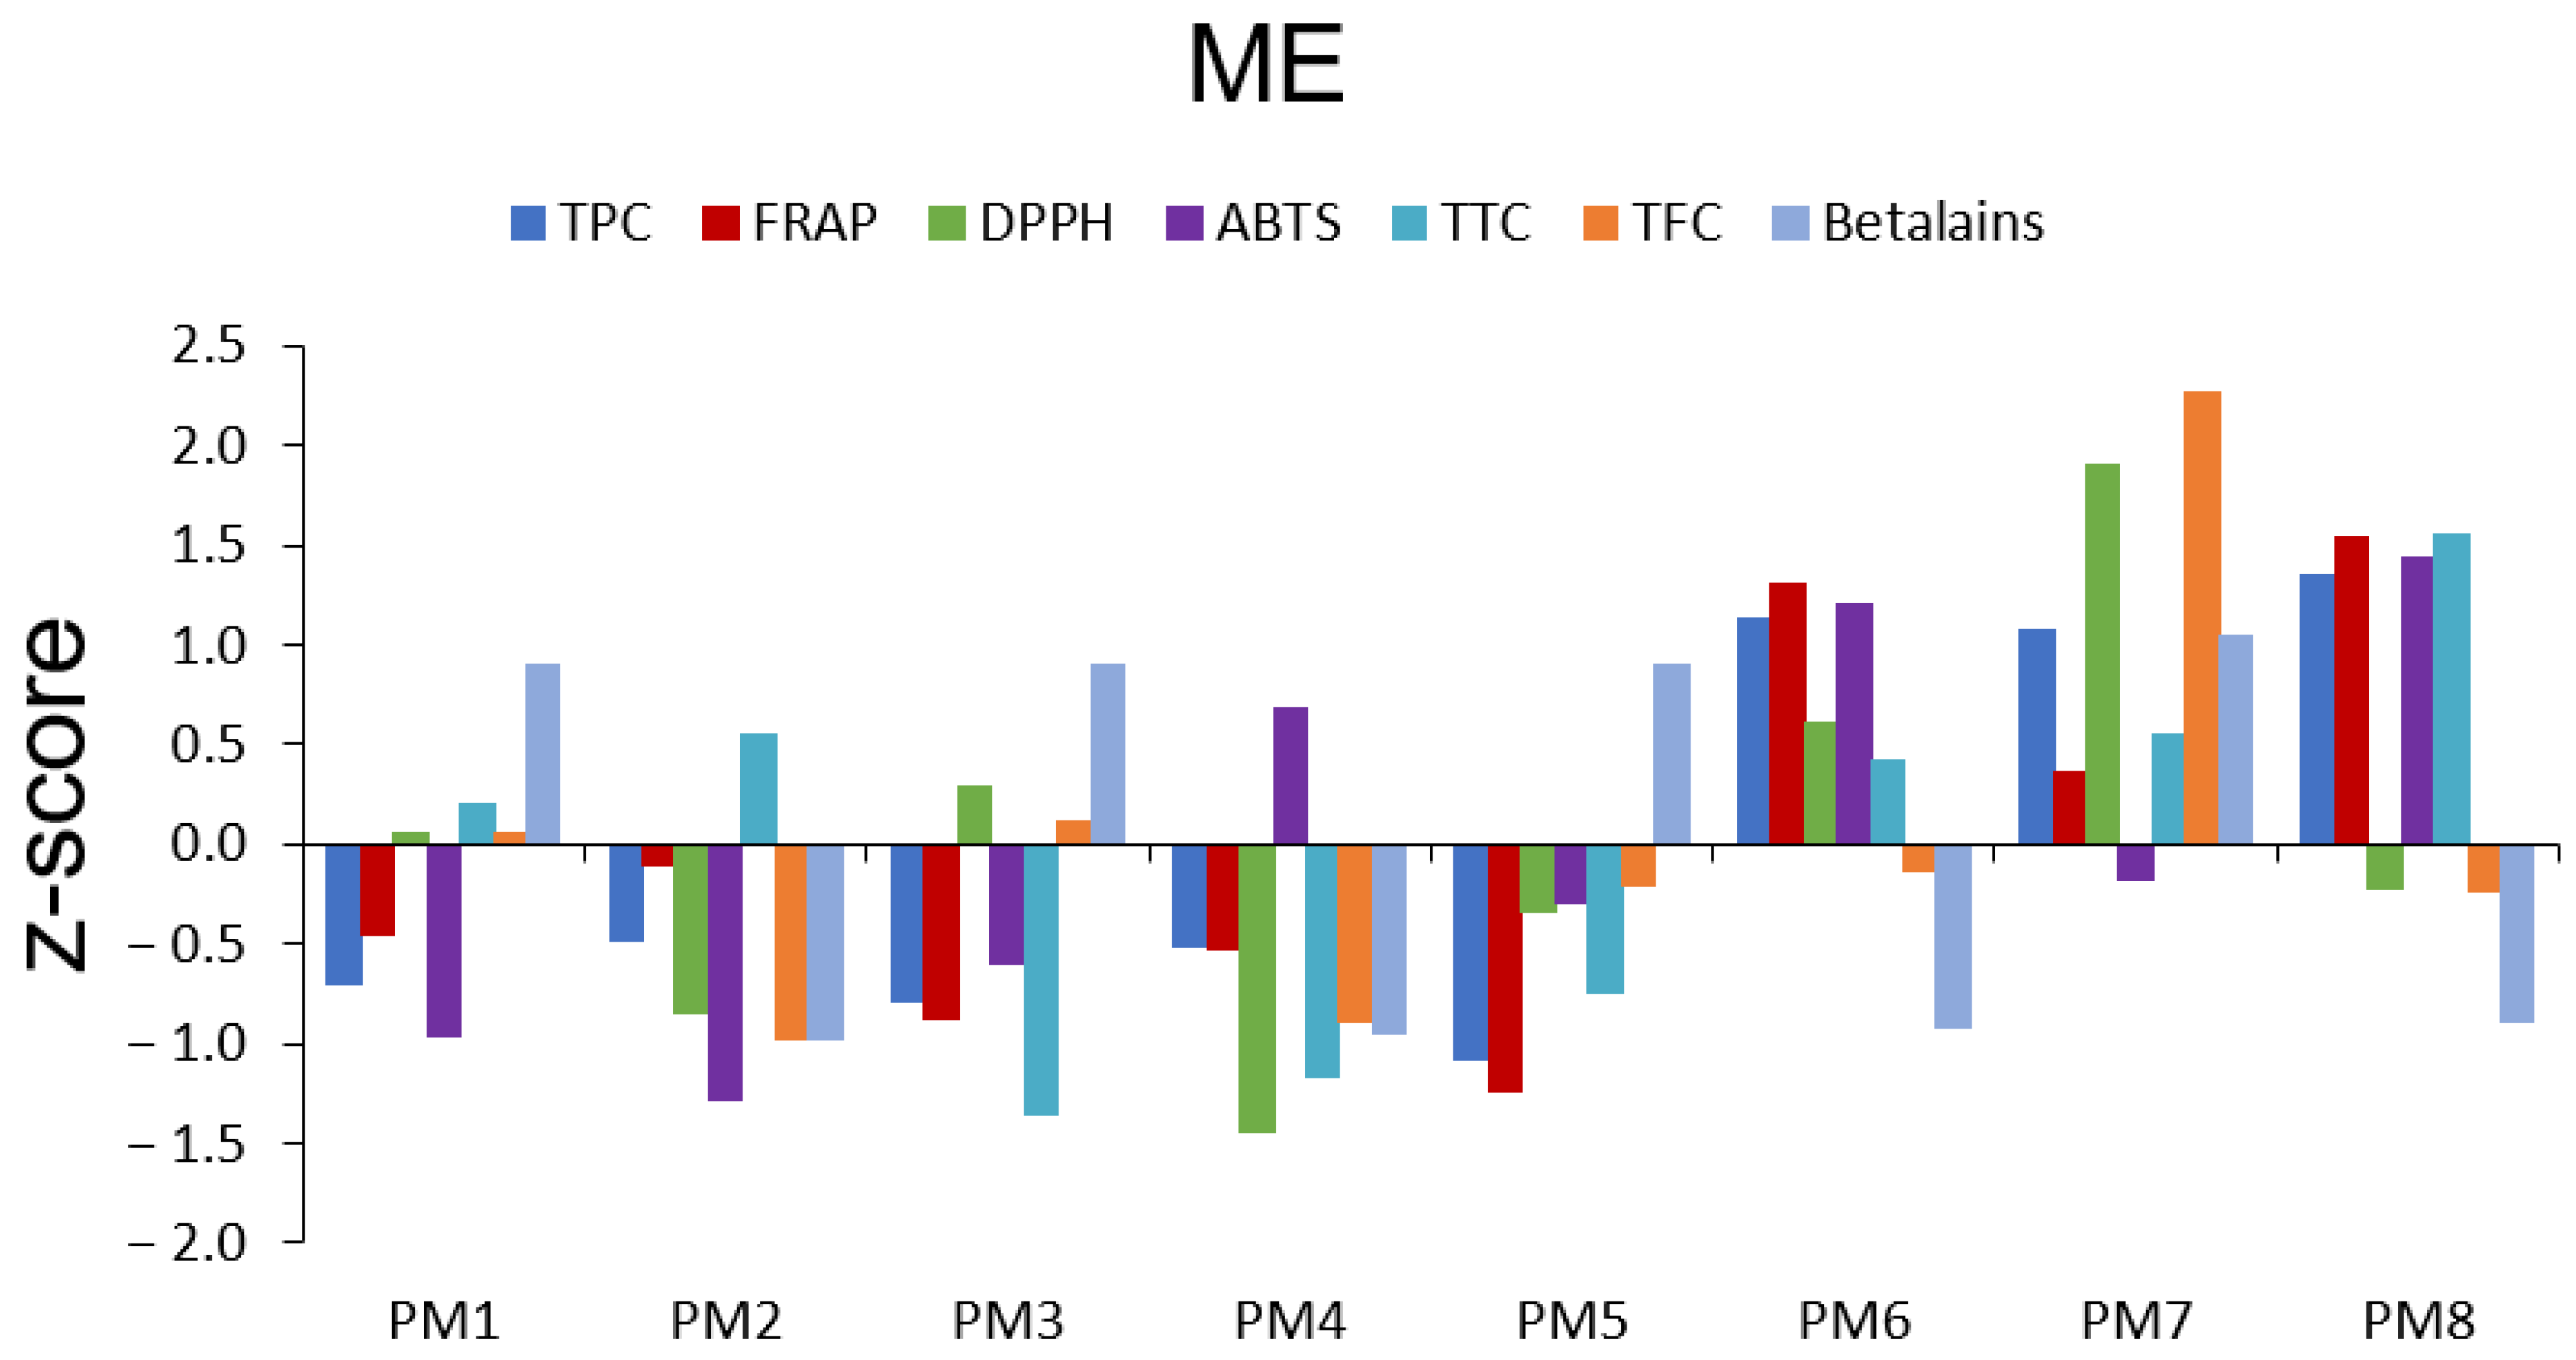
Based on phytochemical responses after ME, the calculated z-score profile indicated that extraction performance was strongly influenced by temperature, extraction time, and solvent/solid ratio. The results are presented in Figure 1. The most favorable condition for TPC, FRAP, ABTS, and TTC was found for sample PM8, corresponding to a solvent/solid ratio of 20/1 and extraction conditions of 30 min at 60 °C. These findings suggest that, within the investigated experimental range, this combination of extraction parameters (longer extraction time, higher temperature, and greater solvent availability) was associated with the recovery of TPC and enhanced electron-transfer antioxidant capacity.
However, not all responses followed the same pattern. PM7, corresponding to 30 min extraction at 60 °C for a 10/1 solvent/solid ratio, produced the highest values for DPPH, TFC, and betalains. This indicates that flavonoid- and pigment-associated radical-scavenging responses may be favored by a more concentrated extraction medium rather than by the highest solvent volume. Therefore, ME conditions for PM8 can be considered the most suitable for obtaining TPC-rich extracts and FRAP/ABTS-associated antioxidant capacity, whereas those for PM7 were more favorable for DPPH activity, TFC, and betalain pigments. Overall, the ME data demonstrate that the optimal extraction condition depends on the targeted response.

3.1.2. Effects of UAE on Content of Bioactive Compounds and Antioxidant Activity

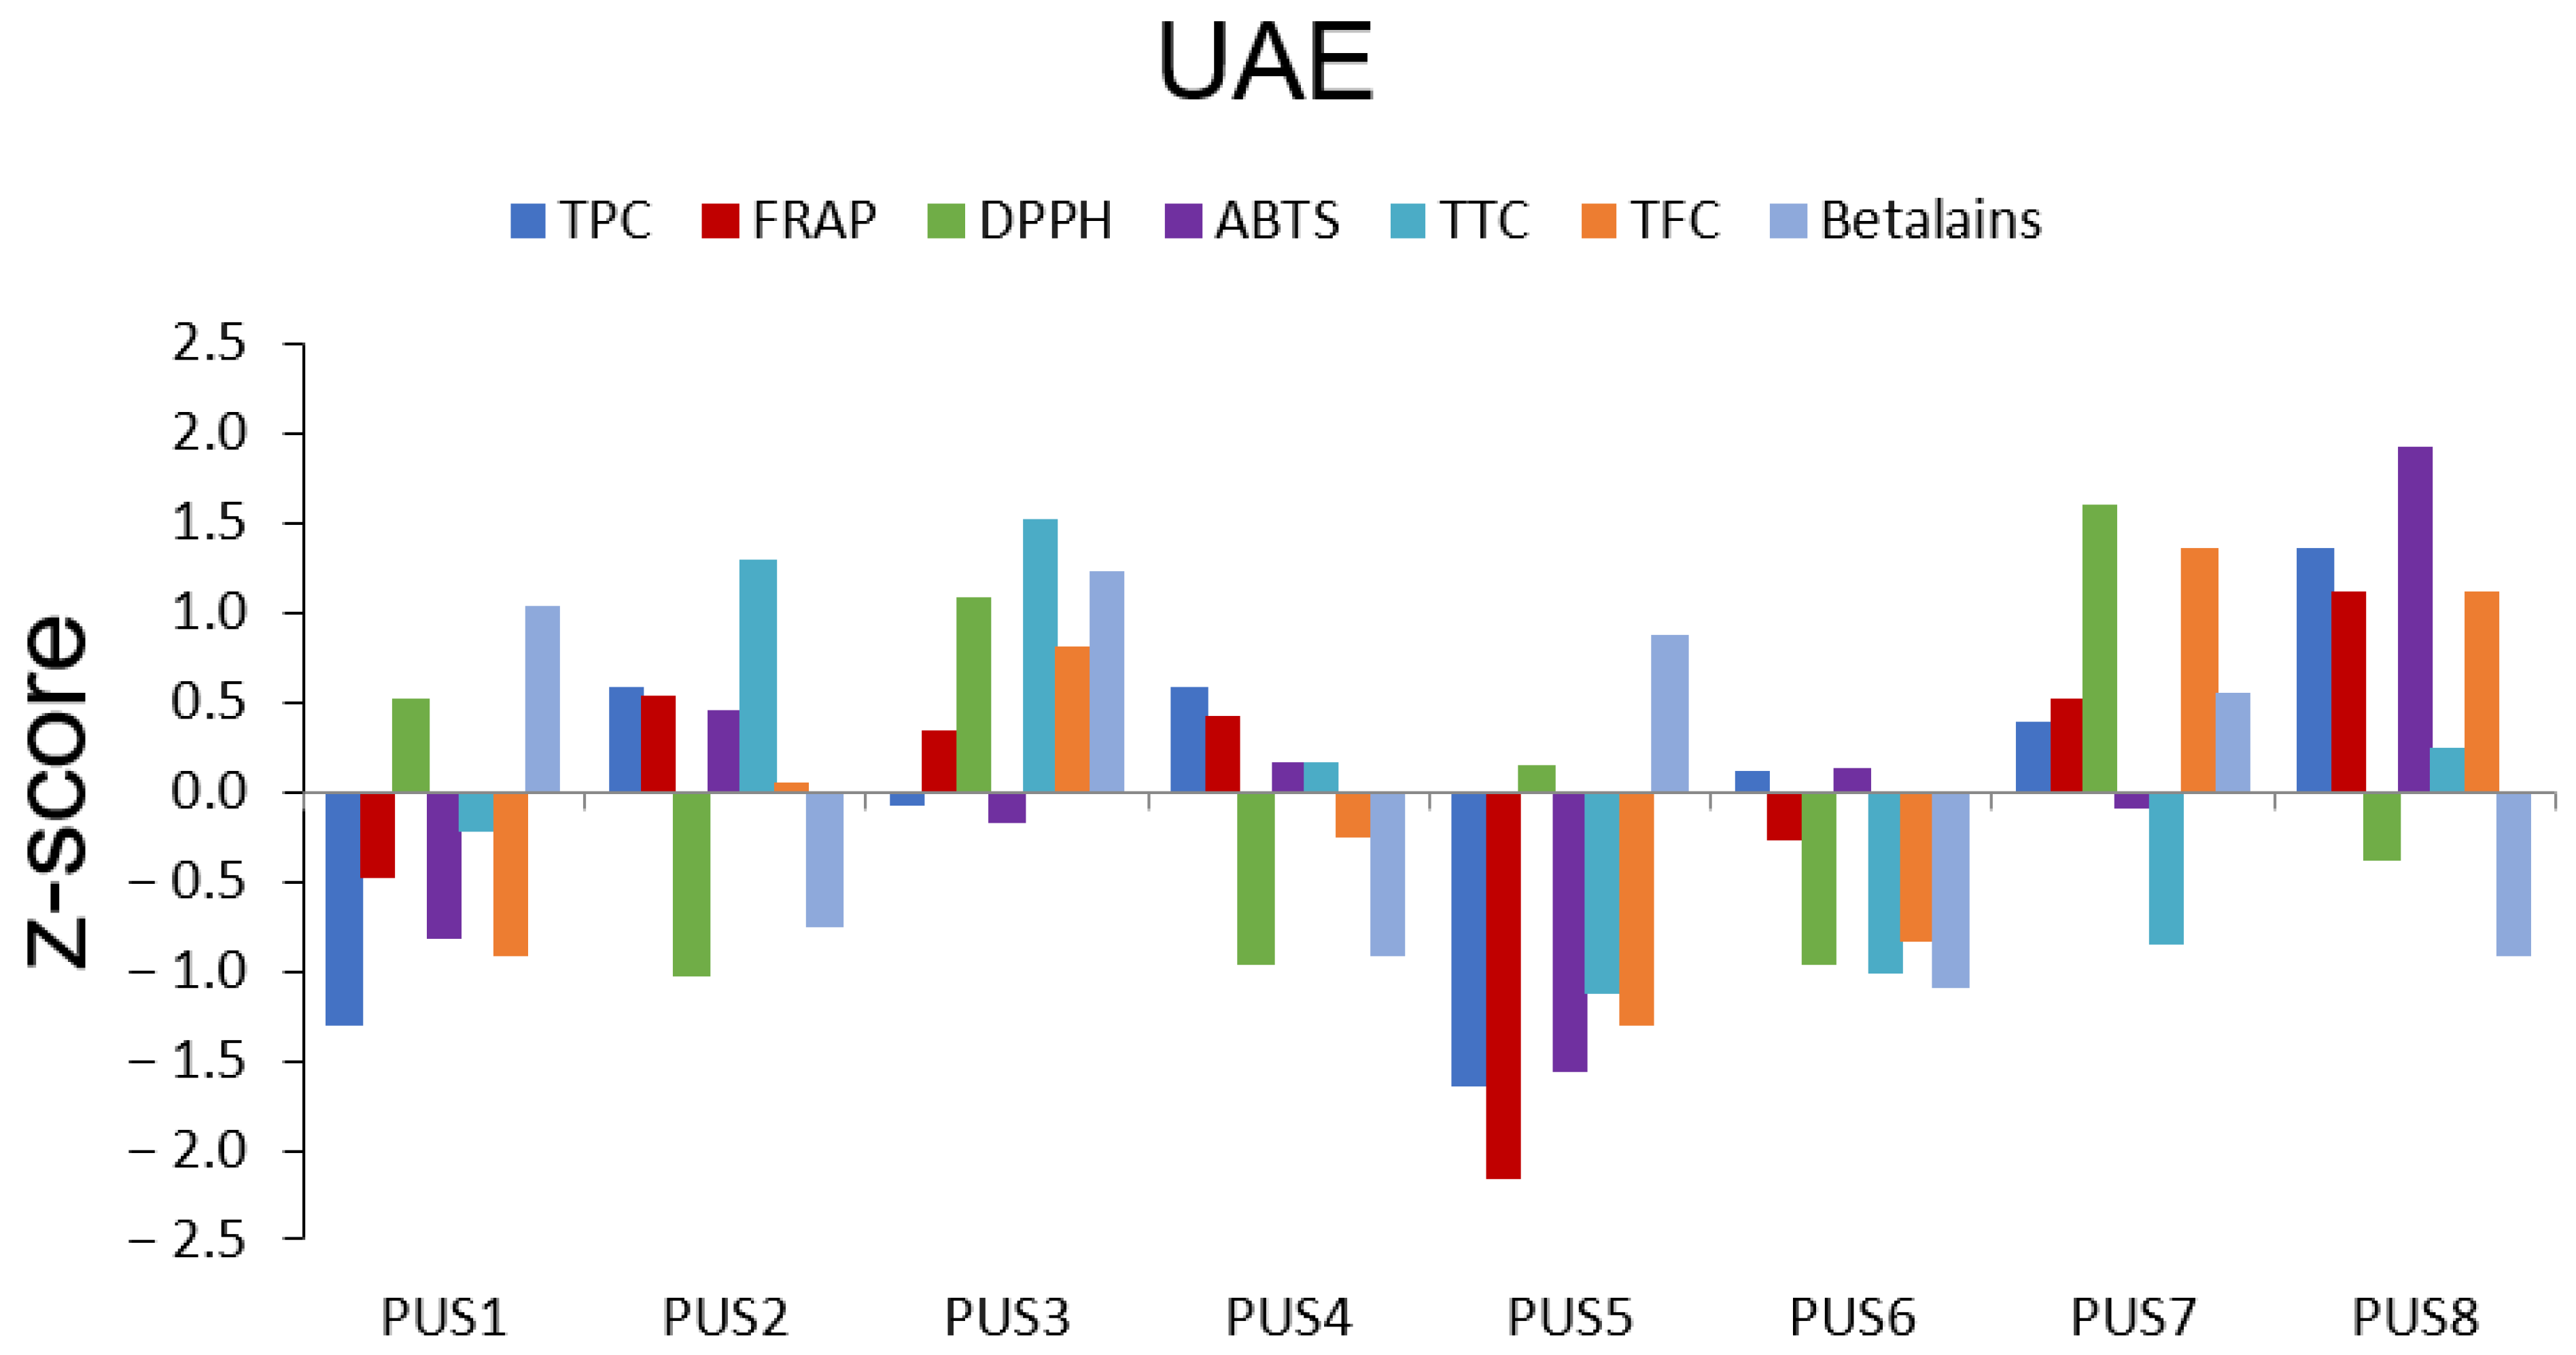
Under UAE, sample PUS8 (20/1 solvent/solid ratio, 30 min, 70% amplitude) showed the highest TPC, FRAP, and ABTS activities, based on the z-score (Figure 2). This indicates that longer sonication, higher amplitude, and greater solvent availability improved the extraction of TPC and supported electron-transfer antioxidant responses. In contrast, DPPH and TFC reached their highest values in sample PUS7 (10/1 solvent/solid ratio, 30 min, 70% amplitude).
This suggests that, under UAE conditions, radical-scavenging activity and flavonoid extraction may benefit from high amplitude and longer extraction time, but not necessarily from the highest solvent dilution. Betalain content showed different behavior, with the highest value observed in sample PUS3 (10/1 solvent/solid ratio, 30 min, 40% amplitude). This suggests that moderate UAE amplitude may be more favorable for betalain recovery, possibly because these pigments are more sensitive to more intensive sonication conditions.

3.1.3. Effects of TE on Content of Bioactive Compounds and Antioxidant Activity

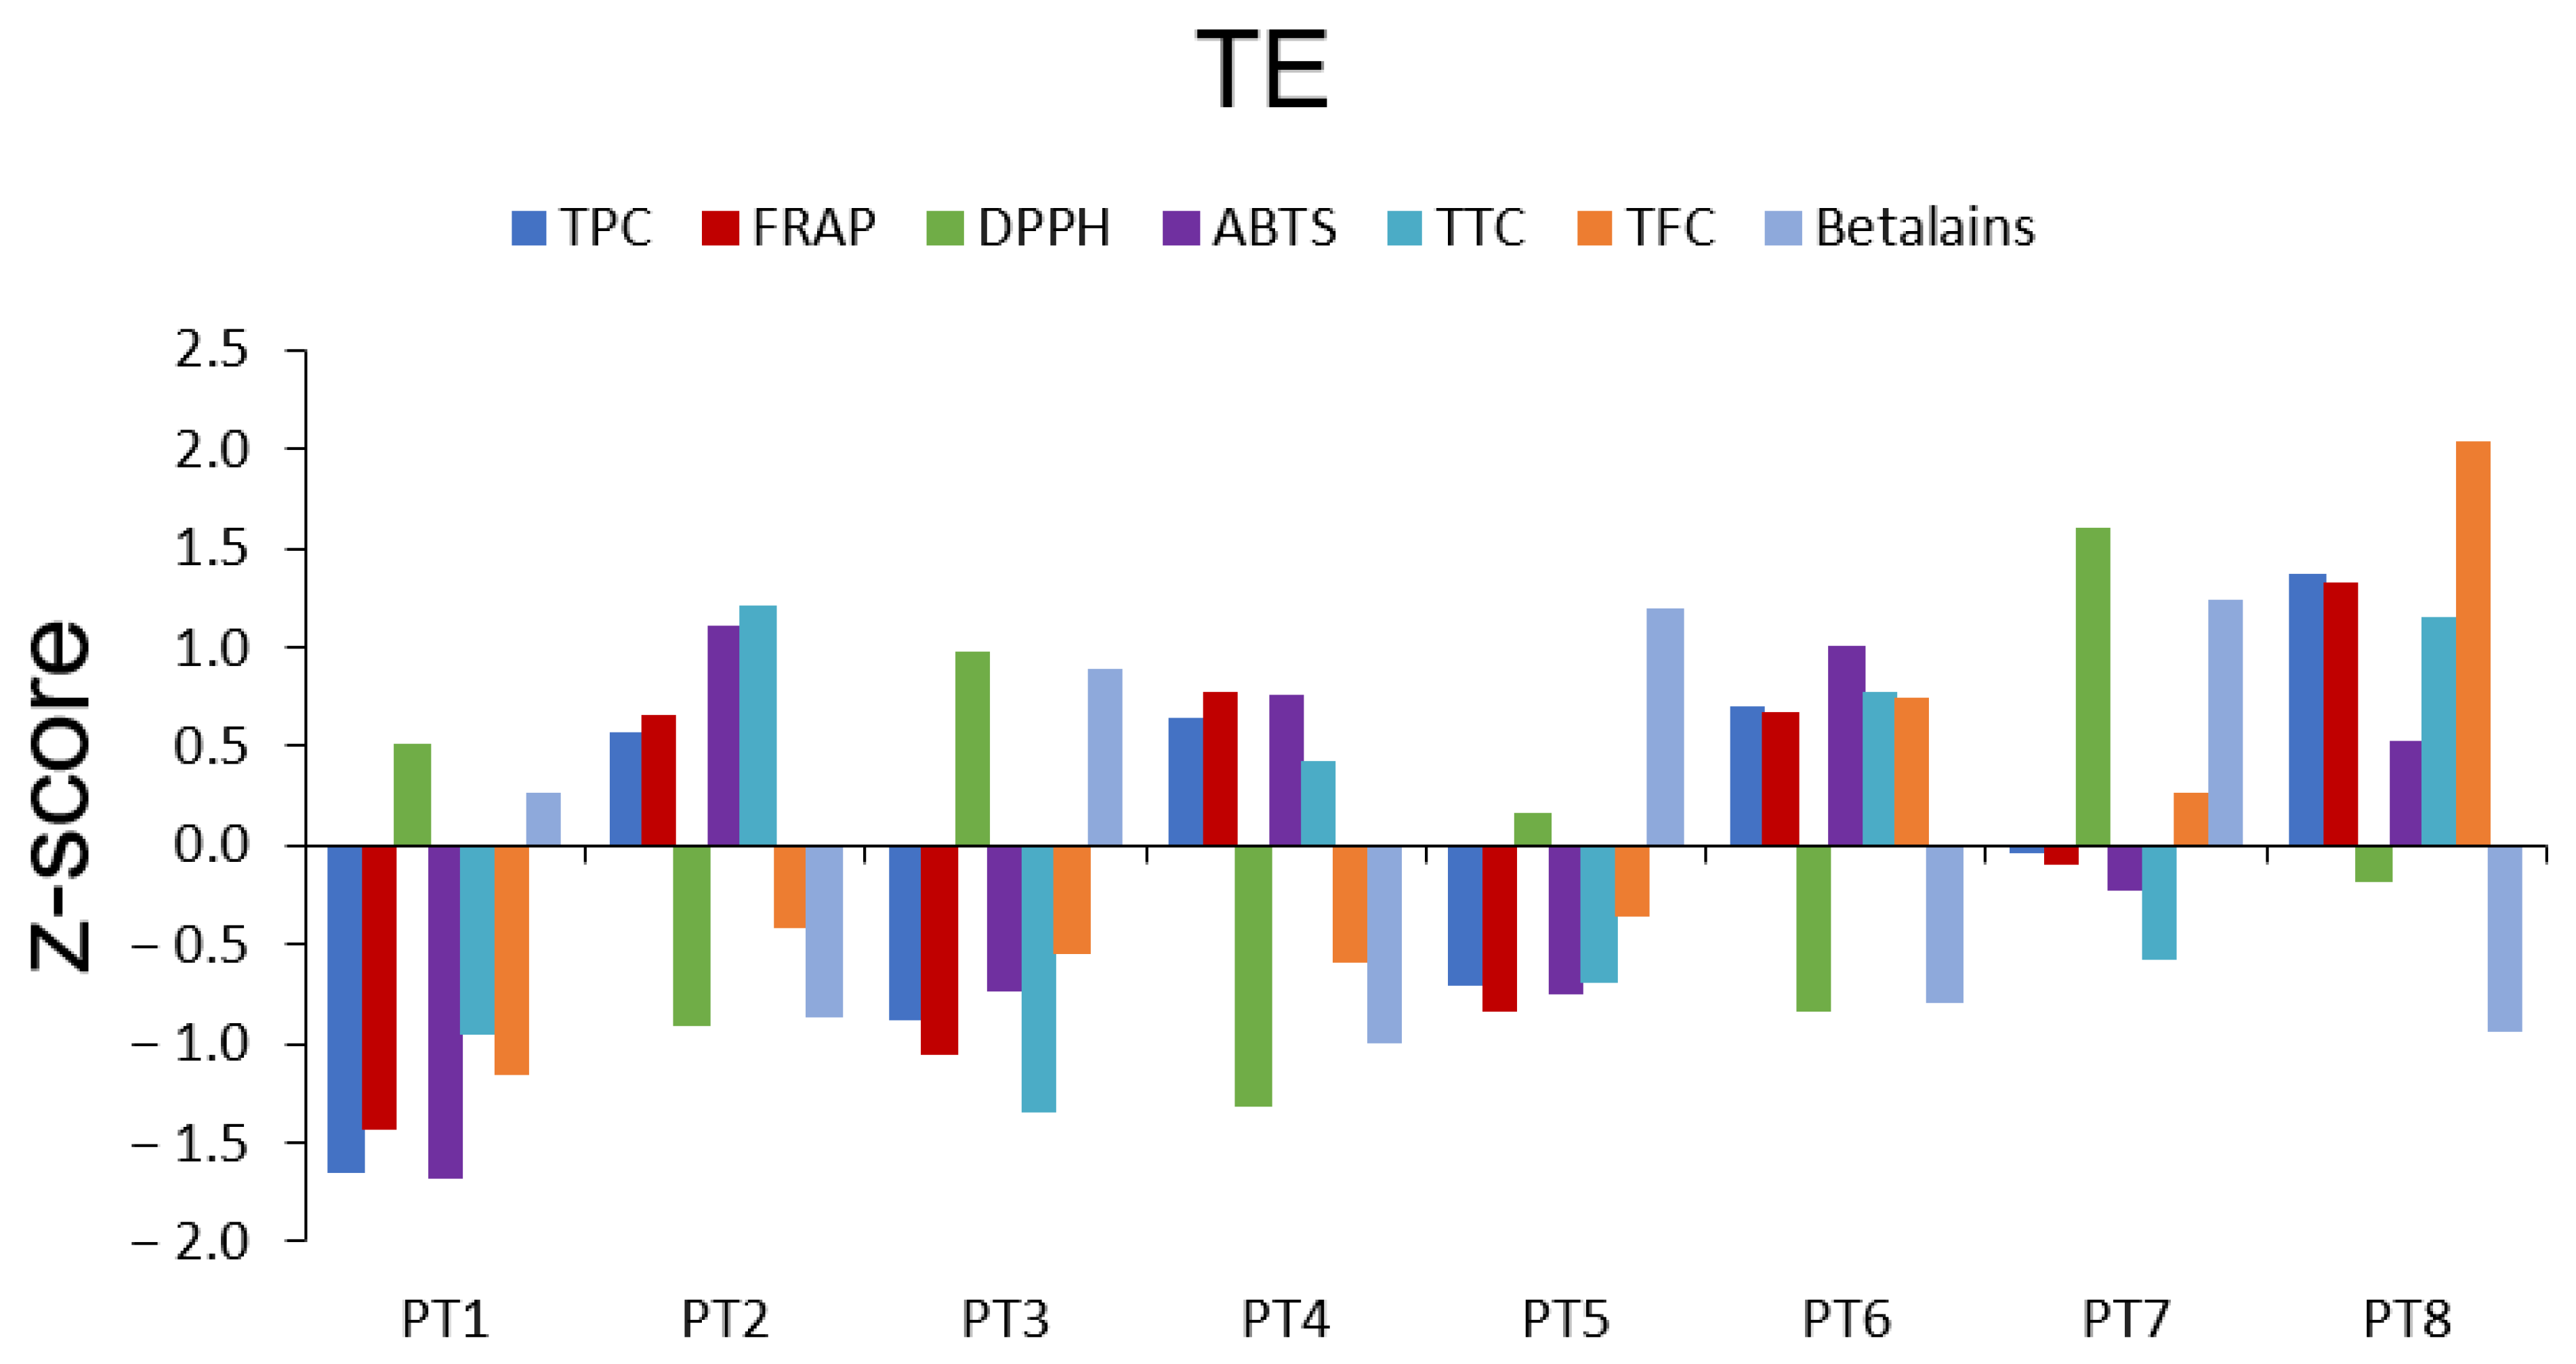
The z-score profile indicated a clear response-dependent extraction pattern in extracts obtained by TE. The most favorable conditions for TPC related responses were found in sample PT8 (30 min, 20/1 solvent/solid ratio, 12,000 rpm), which showed the highest positive profile for TPC and TFC, together with strong FRAP antioxidant activity, TTC, and a positive ABTS antioxidant response (Figure 3).
This suggests that prolonged extraction, increased solvent availability, and high rotor speed jointly enhanced matrix disruption and promoted the release of phenolic-rich fractions. However, not all responses followed the same trend. At both rotor speeds, the 20/1 solvent/solid ratio generally favored TPC, FRAP, ABTS, and TTC, whereas the 10/1 ratio was more advantageous for DPPH and betalain content. This divergence was particularly evident at 12,000 rpm: PT8 provided the best profile for TPC recovery, while PT7 (30 min, 10/1, 12,000 rpm) produced the highest z-scores for DPPH and betalain content. Therefore, the compounds contributing to pigment-associated radical-scavenging activity appear to be favored by high mechanical intensity combined with a more concentrated extraction medium.
PT8 yielded the most favorable results for TPC, TFC, and FRAP, confirming its suitability for phenolic-rich extracts. In contrast, PT7 was more suitable for DPPH and betalain recovery, while PT2 (15 min, 20/1, 6000 rpm) favored ABTS and TTC, indicating that these responses did not necessarily require the highest mechanical intensity.
Overall, TE was most efficient under PT8 conditions when the objective was to maximize phenolic recovery. Nevertheless, PT7 was more appropriate for betalain-associated and DPPH-active extracts, while PT2 provided the strongest profile for ABTS and TTC-related responses. These findings confirm that the optimal TE conditions depend on the targeted phytochemical class and antioxidant endpoint.

3.1.4. Effects of BBE on Content of Bioactive Compounds and Antioxidant Activity

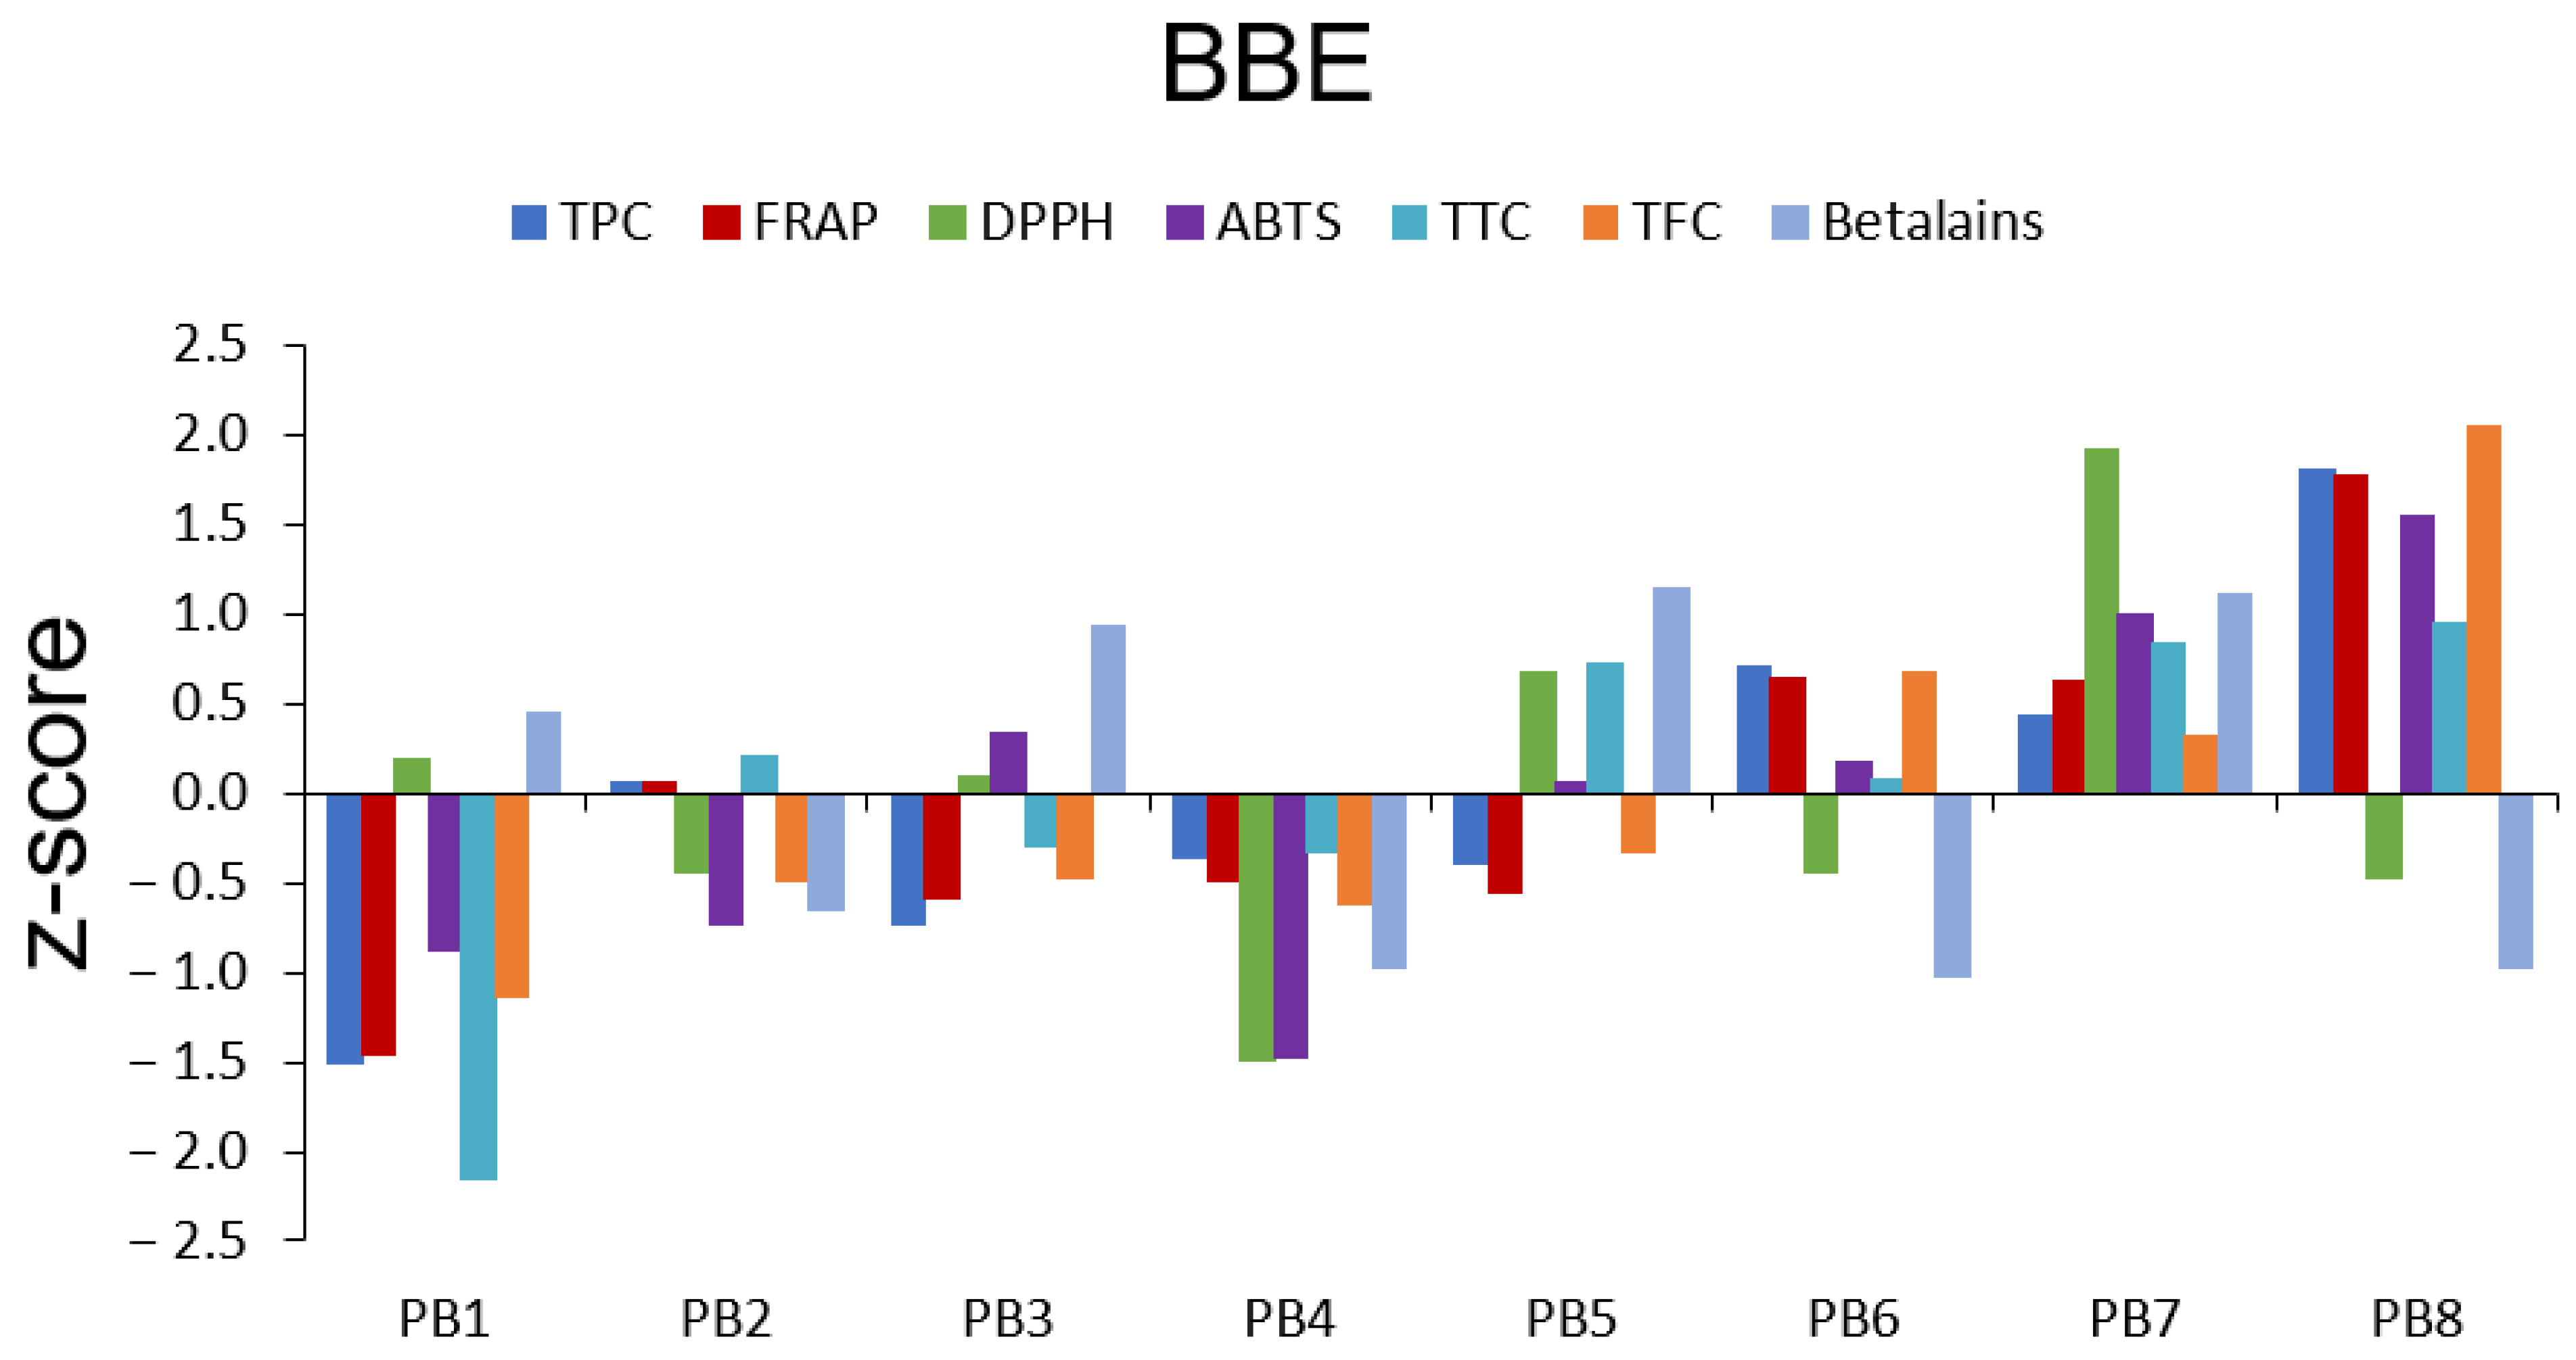
Regarding the BBE extraction of bioactives from P. americana fruits, the conditions based on lower-intensity (2400 spm) and shorter time (15 min), particularly in samples PB1–PB4, underperformed across most determinations, suggesting insufficient cell disruption and incomplete extraction (Figure 4). PB8 (30 min, 20/1 solvent/solid ratio, 4800 SPM) produced the highest values for TPC, TFC, TTC, FRAP, and ABTS activities. This indicates that the combination of longer extraction time, higher solvent availability, and increased mechanical disruption favored the recovery of phenolic-rich fractions and enhanced electron-transfer antioxidant capacity.
However, DPPH and betalain recovery followed different patterns. The highest DPPH value was observed in sample PB7 (30 min, 10/1 solvent/solid ratio, 4800 SPM), whereas the highest betalain content was obtained in PB5 (15 min, 10/1 solvent/solid ratio, 4800 SPM). These findings suggest that betalain pigments may be better preserved or more efficiently recovered under shorter, more concentrated, high-intensity BBE conditions, while DPPH scavenging activity benefits from longer extraction at the same concentrated ratio. Therefore, PB8 can be considered optimal for phenolic-rich and FRAP/ABTS-active extracts, whereas PB5 and PB7 are more relevant for pigment-associated responses.
Overall, these results suggest the presence of two partially distinct functional axes in BBE extracts: a phenolic/flavonoid-associated axis linked primarily with FRAP and ABTS antioxidant activity, and a betalain-associated axis linked with DPPH radical-scavenging activity. This pattern implies a potential trade-off in extraction optimization, depending on whether the target is phenolic-driven reducing capacity or pigment-associated radical-scavenging activity.

3.2. Inter-Method Analysis of P. americana Fruit Extracts: Content of Bioactive Compounds and Antioxidant Activity

An inter-extraction method evaluation of P. americana fruit extracts was performed in relation to the content of investigated bioactive compounds and pigments, and antioxidant activity. To compare the efficiency of extraction in a reproducible manner, the outcomes were visualized using two complementary approaches: a time-based comparison between 15 and 30 min, and a ratio-based comparison between solvent/solid ratios of 10/1 and 20/1. Box-and-whisker plots were used to summarize central tendency and dispersion across replicates, allowing a direct assessment of both extraction efficiency and parameter sensitivity. For small samples, reporting the median (IQR) is often preferred over mean ± SD, precisely for robustness [33,34]. Boxplots display the median and IQR (Q1–Q3) computed with the exclusive-median method. Whiskers extend to the last point within 1.5 × IQR (Tukey’s rule) [35]. Points beyond are plotted as outliers. This dual scheme was applied consistently to each evaluated criterion, thus separating the effects of extraction time from those of solvent loading and revealing which techniques are robust across settings and which benefit from longer processing or greater dilution. The following sections provide the quantitative comparisons and statistical analysis (across assays and compound classes) and synthesize inter-assay concordance to guide the choice of optimal extraction conditions.

3.2.1. The Influence of Extraction Methods on TPC, TFC, and TTC of P. americana Fruit Extracts

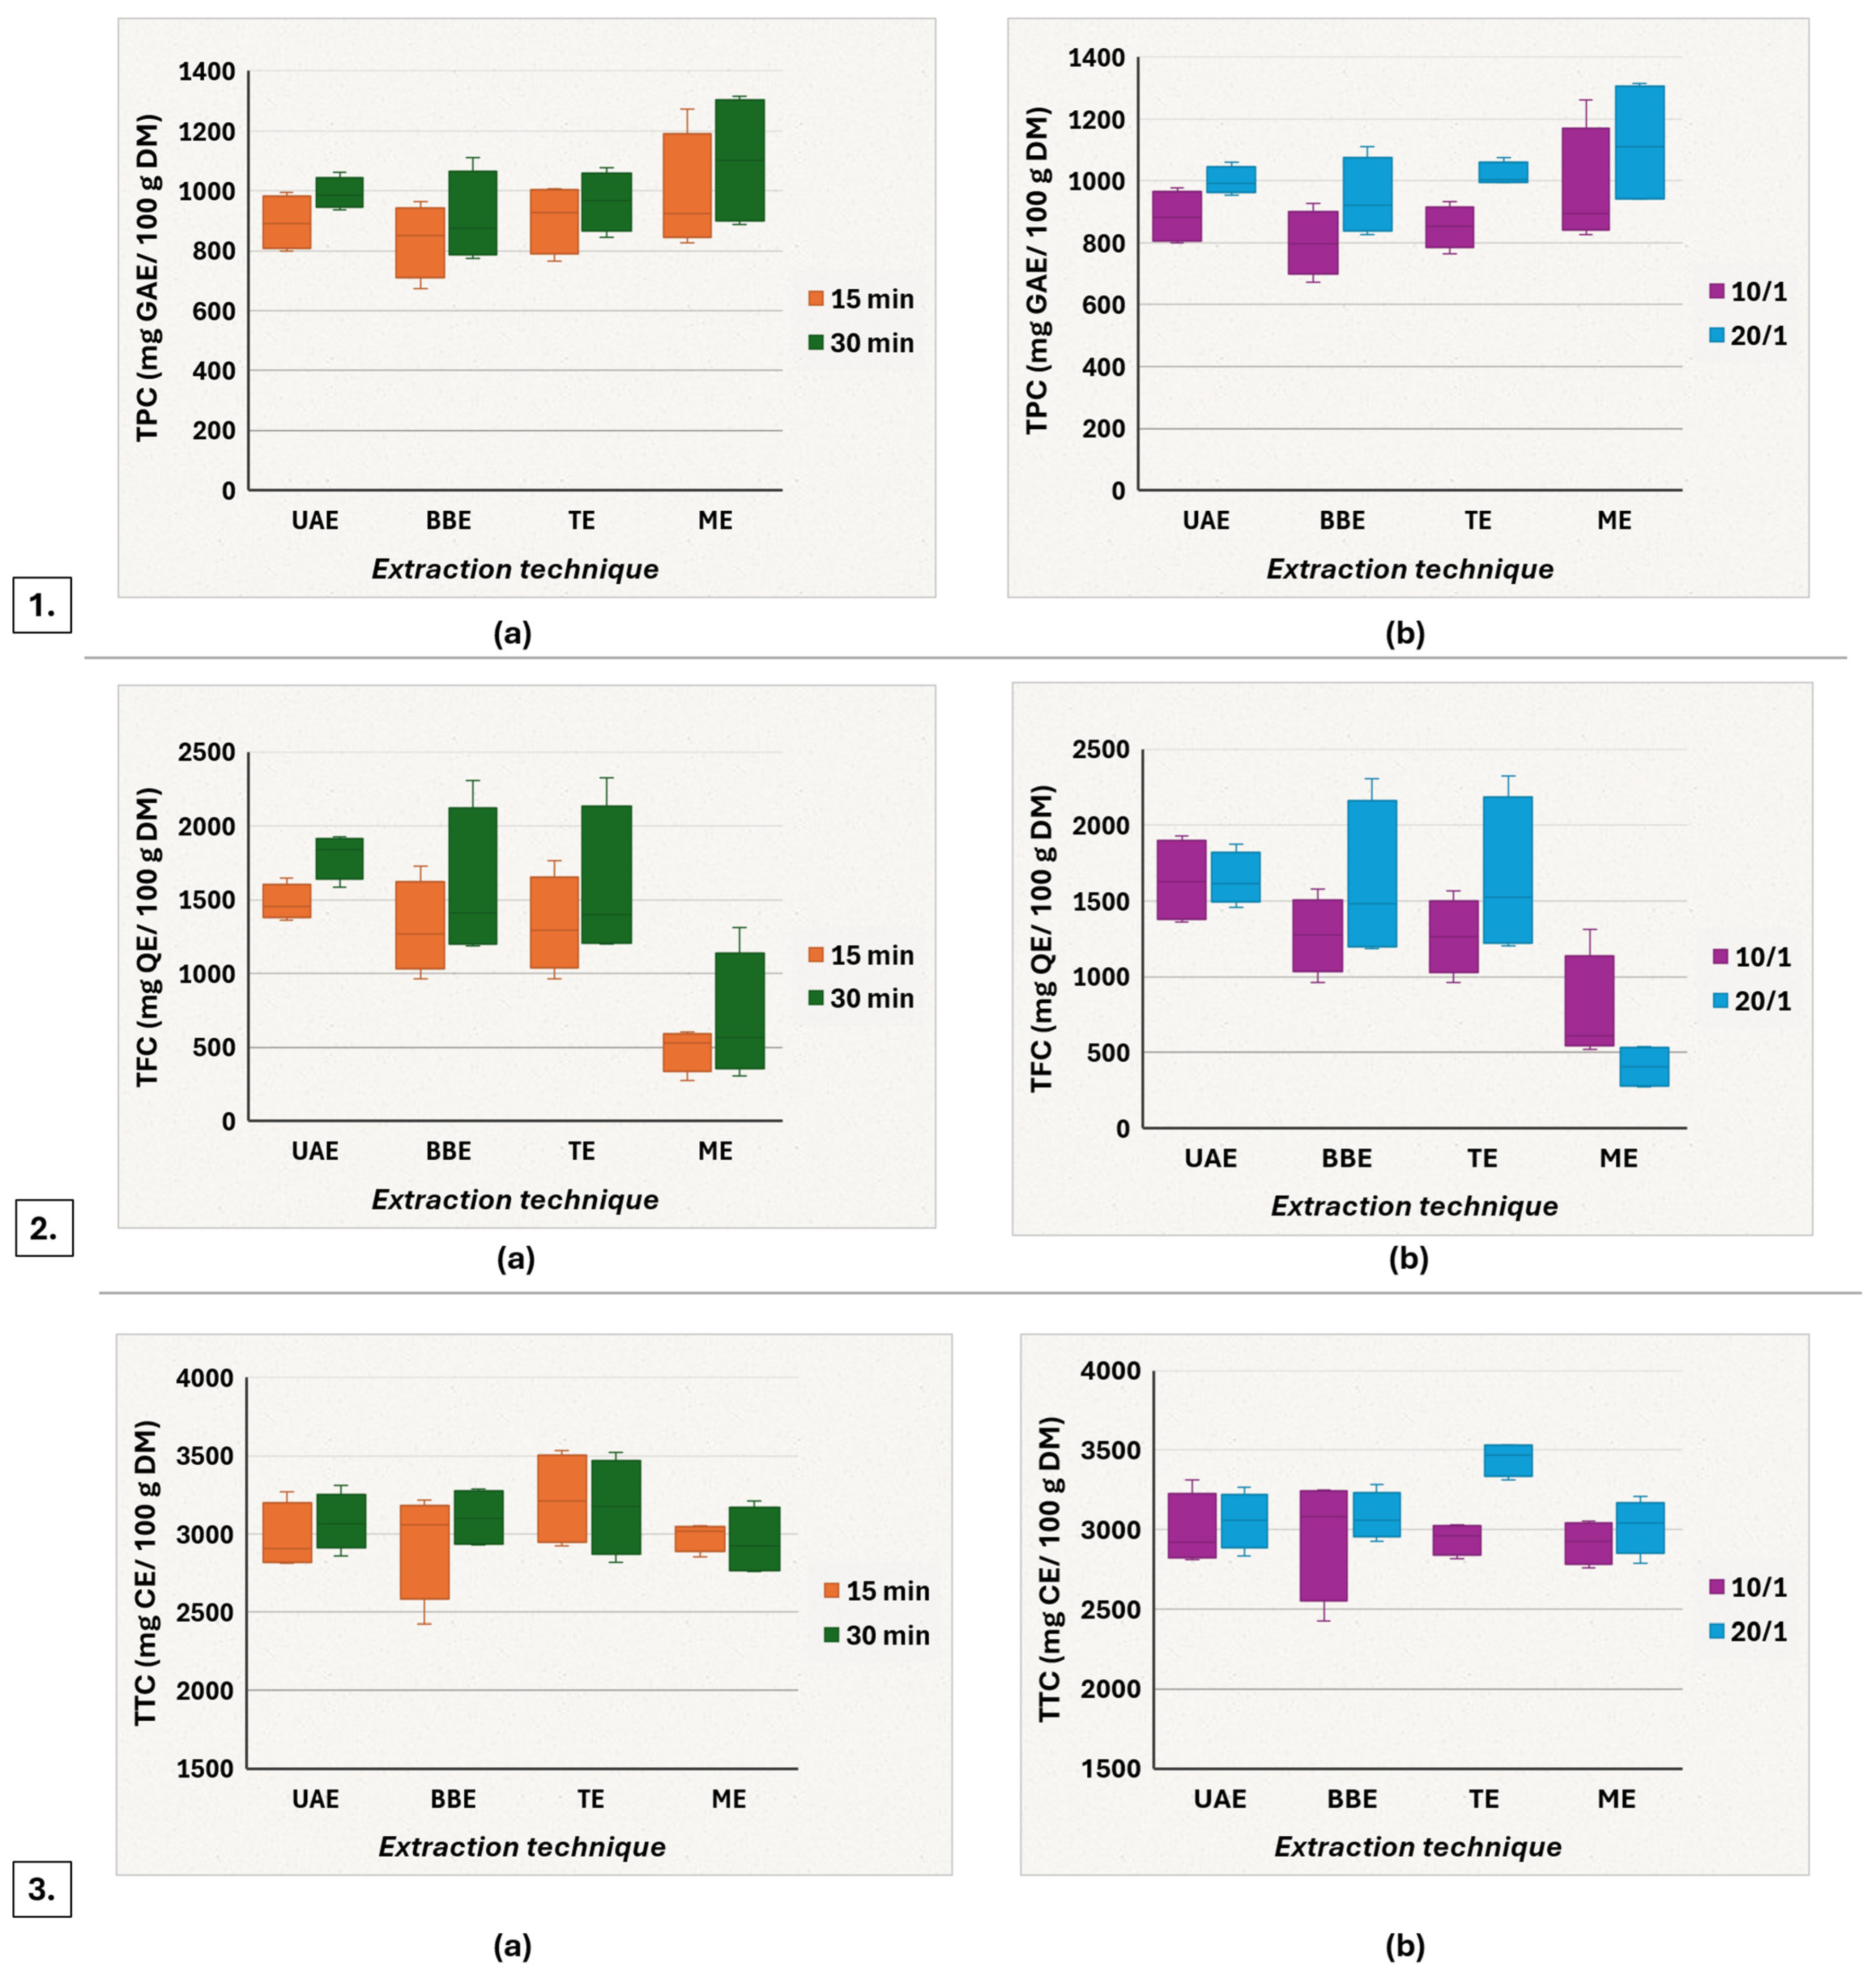
Box-and-whisker representation of TPC showed an upward shift of the medians as extraction time increases from 15 to 30 min across all extraction methods (Figure 5(1.a)), indicating a consistent time-related improvement in polyphenol extraction. The median (and IQR) TPC values at 15 min were: BBE = 849.5 mg GAE/100 g DM (IQR = 233.0), UAE = 891.5 mg GAE/100 g DM (IQR = 176.0), TE = 928.2 mg GAE/100 g DM (IQR = 214.4), and ME = 924.2 mg GAE/100 g DM (IQR = 345.9). At 30 min, medians increased to: BBE = 876.3 mg GAE/100 g DM (IQR = 277.1), UAE = 957.9 mg GAE/100 g DM (IQR = 103.1), TE = 966.9 mg GAE/100 g DM (IQR = 190.7), and ME = 1101.3 mg GAE/100 g DM (IQR = 401.9). No outliers were flagged in any group by Tukey’s 1.5 × IQR rule.
At 30 min, the median ranking was BBE < UAE < TE < ME, with ME yielding the highest central tendency but also the largest dispersion (IQR 401.9), suggesting a larger heterogeneity under these conditions. In contrast, UAE at 30 min exhibited the tightest dispersion (IQR 103.1), with higher consistency. For the 15 min data, model assumptions held (Shapiro–Wilk on residuals p = 0.376; Levene p = 0.559). The one-way ANOVA did not detect differences among methods and Tukey post hoc yielded no significant pairwise contrasts. For data obtained at 30 min extraction, residuals were approximately normal (Shapiro–Wilk p = 0.887), but ANOVA remained non-significant. In practical terms, the data suggest that extending the time is a useful strategy for all techniques, but the choice of method may depend on the desired trade-offs between yield and reproducibility. For maximum yield, 30 min ME is promising but requires strict standardization (constant solvent/solid ratio, controlled mixing) to reduce variability. In terms of precision and repeatability, 30 min UAE offers minimal dispersion, which would facilitate comparability between batches.
The ratio-based comparison confirmed that all extraction methods show higher yields at a 20/1 solvent/solid ratio than at 10/1. At a 20/1 ratio, the ranking of medians is ME > TE > UAE > BBE, and at 10/1, a similar ordering is maintained, with ME slightly superior. But dispersion (IQR and whiskers) is largest for ME, especially at 20/1, indicating a heterogeneity across replicates, whereas UAE and TE have narrow boxes (high homogeneity), consistent with near-symmetric distributions and favorizing a good reproducibility (Figure 5(1.b)). The one-way ANOVA followed by Tukey post hoc applied across methods (F = 1.32, p = 0.314) at 10/1 and 20/1 ratios showed no significant differences. Overall, the graph and statistics converge on the conclusion that the 20/1 ratio favors TPC extraction (median increases across all techniques), with ME at 20/1 ratio reaching the highest absolute values but at the cost of higher dispersion. If reproducibility is prioritized, TE at a 20/1 ratio and UAE at a 20/1 ratio provide high median yields, and TE in particular shows the clearest statistical improvement between a 20/1 and 10/1 ratio.
Extending extraction time from 15 to 30 min shifted the medians upward for all methods, with UAE maintaining high medians and narrow IQRs (good reproducibility) for TFC. BBE and TE occasionally reached higher maxima (long upper whiskers) but with wider dispersion, while ME remained clearly inferior (Figure 5(2.a)). For each time point, one-way ANOVA indicated a significant method effect (15 min: p = 0.00042; 30 min: p = 0.0156). Tukey post hoc showed that ME yielded significantly lower TFC than the intensified methods at 15 min, and lower than in UAE at 30 min (other pairwise comparisons, n.s.). Aligned with the median-based display, Kruskal–Wallis was significant at 15 min (p = 0.0228) and borderline at 30 min (p = 0.062). However, Dunn tests with Holm correction did not retain pairwise significance at α = 0.05, which is expected with the small sample size. Overall, UAE provides the best balance of high typical yield of TFC and low variability, whereas ME is consistently inferior.
In the TFC boxplots, the solvent/solid ratio drives clear, method-dependent shifts (Figure 5(2.b)). At 10/1 ratio, UAE shows the highest central tendency (median = 1625), while ME is significantly lower (median = 613) and highlights a long upper whisker, suggesting asymmetry. At 20/1 ratio, yields rise for BE (+26.8% in the mean) and TE (+29.7%), remaining high for UAE (+0.5%), but drop sharply for ME (−46.9%). Dispersion patterns also changed, with UAE exhibiting the tightest spread with a narrow box (IQR = 327), whereas BBE and TE were more variable (IQRs = 962), suggesting UAE delivers the most reproducible output at the higher dilution. The ANOVA analysis confirmed significant differences among extraction methods at both solvent ratios: 10/1, p = 0.009, and 20/1, p = 0.0013. Tukey post-hoc testing identified UAE as significantly higher than ME at 10/1 (p = 0.0054), while the other methods did not differ significantly from each other. At 20/1, ME was significantly lower than the other methods, whereas UAE, BBE, and TE did not differ significantly among themselves. Aligned with the box-plot presentation (median/IQR), we performed a robustness check analysis using Kruskal–Wallis followed by Dunn tests with Holm correction. Group differences remained significant overall (10/1: p = 0.045, and 20/1: p = 0.035). Pairwise Dunn–Holm largely reinforced the parametric findings: at 10/1, UAE versus ME stayed significant after adjustment (p_adj ≃ 0.029). At 20/1, all contrasts versus ME were strong before adjustment (p ≃ 0.012–0.031) and trended to borderline after Holm correction (p_adj ≃ 0.11–0.14), consistent along with the ANOVA and Tukey pattern and the visibly separated boxplots. Overall, increasing dilution to 20/1 enhances TFC recovery for the mechanically assisted methods like BBE and TE, while UAE combines high yield with the most stable dispersion profile. ME underperformed under both time- and ratio-based comparisons. Therefore, for applications prioritizing both TFC yield and reproducibility, UAE, particularly under the higher solvent ratio condition, appears to be the most reliable extraction option.
In Figure 5(3.a), the central tendency is broadly similar across extraction methods, with a mild tendency for TE to sit highest, for TTC. In the time-based comparison, the 15 min extracts showed partially overlapping distributions across all methods, with TE and BBE occupying the upper range of the median values, while UAE and ME were slightly lower. At 30 min, TE and BBE again remained in the upper range, followed by UAE, whereas ME showed the lowest central tendency. Dispersion patterns in the boxplots reinforce this impression of comparability. At 15 min, ME shows the tightest spread (IQR = 157.5), UAE is moderate (IQR = 381.75), TE is wide (IQR = 559.75), and BBE is the widest (IQR = 603.0). At 30 min, UAE becomes the most consistent (IQR = 340.75), BBE remains relatively contained (IQR = 344.0), ME broadens (IQR = 401.75), while TE is the widest (IQR = 597.0). No obvious outliers were observed. Consistent with the graphical overlap, one-way ANOVA analysis did not detect significant between-method differences at either extraction time. Kruskal–Wallis testing, used as a robustness check aligned with the median/IQR-based representation, also indicated no significant differences. Overall, within the 15–30 min interval, extraction time did not clearly separate the four techniques in terms of TTC recovery. Overall, the boxplots and statistics converge towards the idea that, in the 15–30 min interval, the four extraction methods provide similar TTC levels, with only small, non-significant shifts that are unlikely to be biologically or practically meaningful. The method choice may be guided by considerations such as processing rate, cost, and compatibility with later stages.
A different pattern emerged when the data on TTC were stratified by solvent/solid ratio (Figure 5(3.b)). At 10/1, all methods cluster tightly, with similar medians: UAE = 2922 mg catechin/100 g DM, TE = 2963 mg catechin/100 g DM, ME = 2926 mg catechin/100 g DM, and BBE slightly higher (=3080 mg catechin/100 g DM) but with the large dispersion (IQR = 689). At 20/1 ratio, the boxes are uniformly, and a clear separation emerges: TE shows the highest central tendency (median = 3466), while UAE, BBE and ME remain near ≃ 3000–3100.
To match the box-plot emphasis on medians/IQR, we stratified by ratio. At 10/1, one-way ANOVA found no differences among methods. At 20/1, method differences were significant by ANOVA (p = 0.0069). Tukey post hoc showed that: TE > BBE (p ≃ 0.027), TE > ME (p ≃ 0.0097), and TE > UAE (p ≃ 0.017). The other pairwise contrasts were not significant. Kruskal–Wallis at 20/1 was also significant (p = 0.031). Dunn tests with Holm correction confirmed only a robust TE > ME contrast (adj. p ≃ 0.036). Combined with the low dispersion of the values at 20/1, these results support TE at 20/1 as the optimal option for maximizing TTC, with stable conclusions in both analysis frameworks.

3.2.2. The Influence of Extraction Methods on Betalain Content of P. americana Fruit Extracts

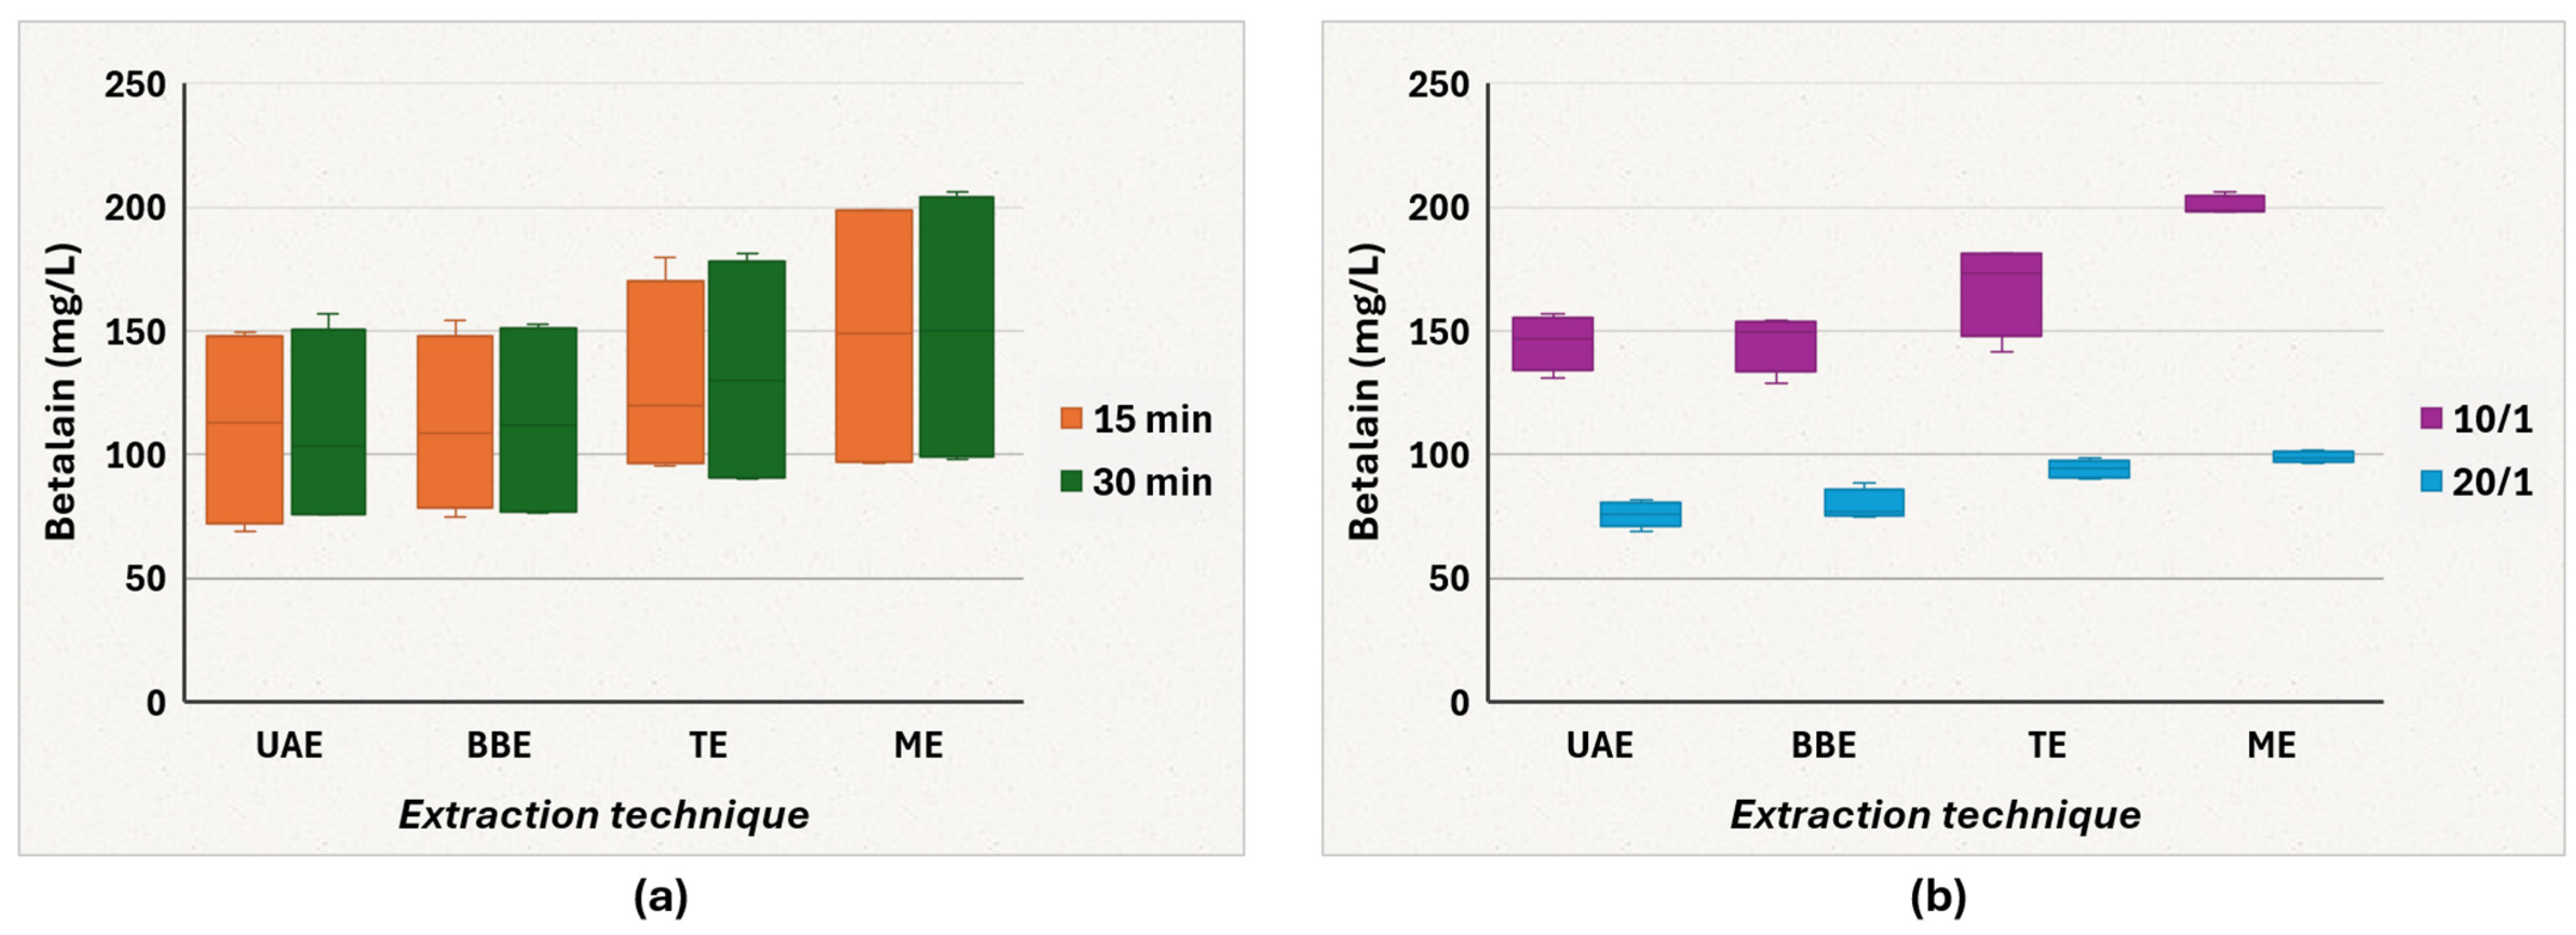
Across the investigated extraction methods, betalain content did not change markedly when extraction time was increased from 15 to 30 min (Figure 6a). The paired comparison of matched 15- and 30-min conditions confirmed the absence of a significant time effect, both by paired t-test (p = 0.480) and Wilcoxon test (p = 0.495). At 30 min, the median values followed the order ME 149.9 mg/L > TE 129.9 mg/L > BBE 111.7 mg/L > UAE 103.6 mg/L. However, the differences between methods were not statistically significant when the data were grouped by extraction time. At 15 min, ANOVA and Kruskal–Wallis tests resulted in values of p = 0.617 and p = 0.509, respectively, while at 30 min the corresponding values were p = 0.609 and p = 0.353. Accordingly, no pairwise contrast remained significant after post-hoc correction.
From an analytical perspective, extraction time appears to have had only a secondary influence on betalain recovery. UAE and BBE remained similarly at 15 and 30 min, while TE and ME showed slightly higher central values of betalain content after 30 min. Nevertheless, the wide spread visible in the time-grouped plots suggests that part of this variation was not driven by time itself, but rather by the solvent/solid ratio included within each time group.
The solvent/solid ratio had a much clearer effect (Figure 6b). The 10/1 ratio consistently yielded higher betalain contents than those at 20/1 for all extraction techniques, and this difference was highly significant in the paired analysis of matched experimental conditions (paired t-test, p < 0.0001; Wilcoxon test, p < 0.0001). At 10/1, the medians ranked ME 198.7 mg/L > TE 173.4 mg/L > BBE 149.6 mg/L > UAE 146.6 mg/L. At 20/1, the same general pattern was preserved, but all values were shifted downward: ME 98.8 mg/L > TE 94.2 mg/L > BBE 76.7 mg/L > UAE 75.9 mg/L.
Within the 10/1 ratio, the extraction method had a significant effect on betalain content (ANOVA, p = 0.0001; Kruskal–Wallis, p = 0.0175). After Dunn–Holm correction, the most robust differences remained those between ME and the two methods, UAE and BBE. A similar pattern was observed at 20/1, where the method effect was again significant (ANOVA, p < 0.0001; Kruskal–Wallis, p = 0.0065). Tukey testing indicated higher betalain content for TE and ME compared with that for UAE and BBE.
Dispersion was lower at 20/1, with narrow IQRs for all methods, but this occurred at the cost of substantially lower betalain content. At 10/1, ME combined the highest central value with the tightest distribution, indicating both efficiency and good reproducibility under the tested conditions. TE also performed well at 10/1, although with a broader spread. Overall, the most favorable profile for obtaining betalain-rich P. americana fruit extracts was obtained by ME at the 10/1 solvent/solid ratio.

3.2.3. The Influence of Extraction Methods on Antioxidant Activity of P. americana Fruit Extracts

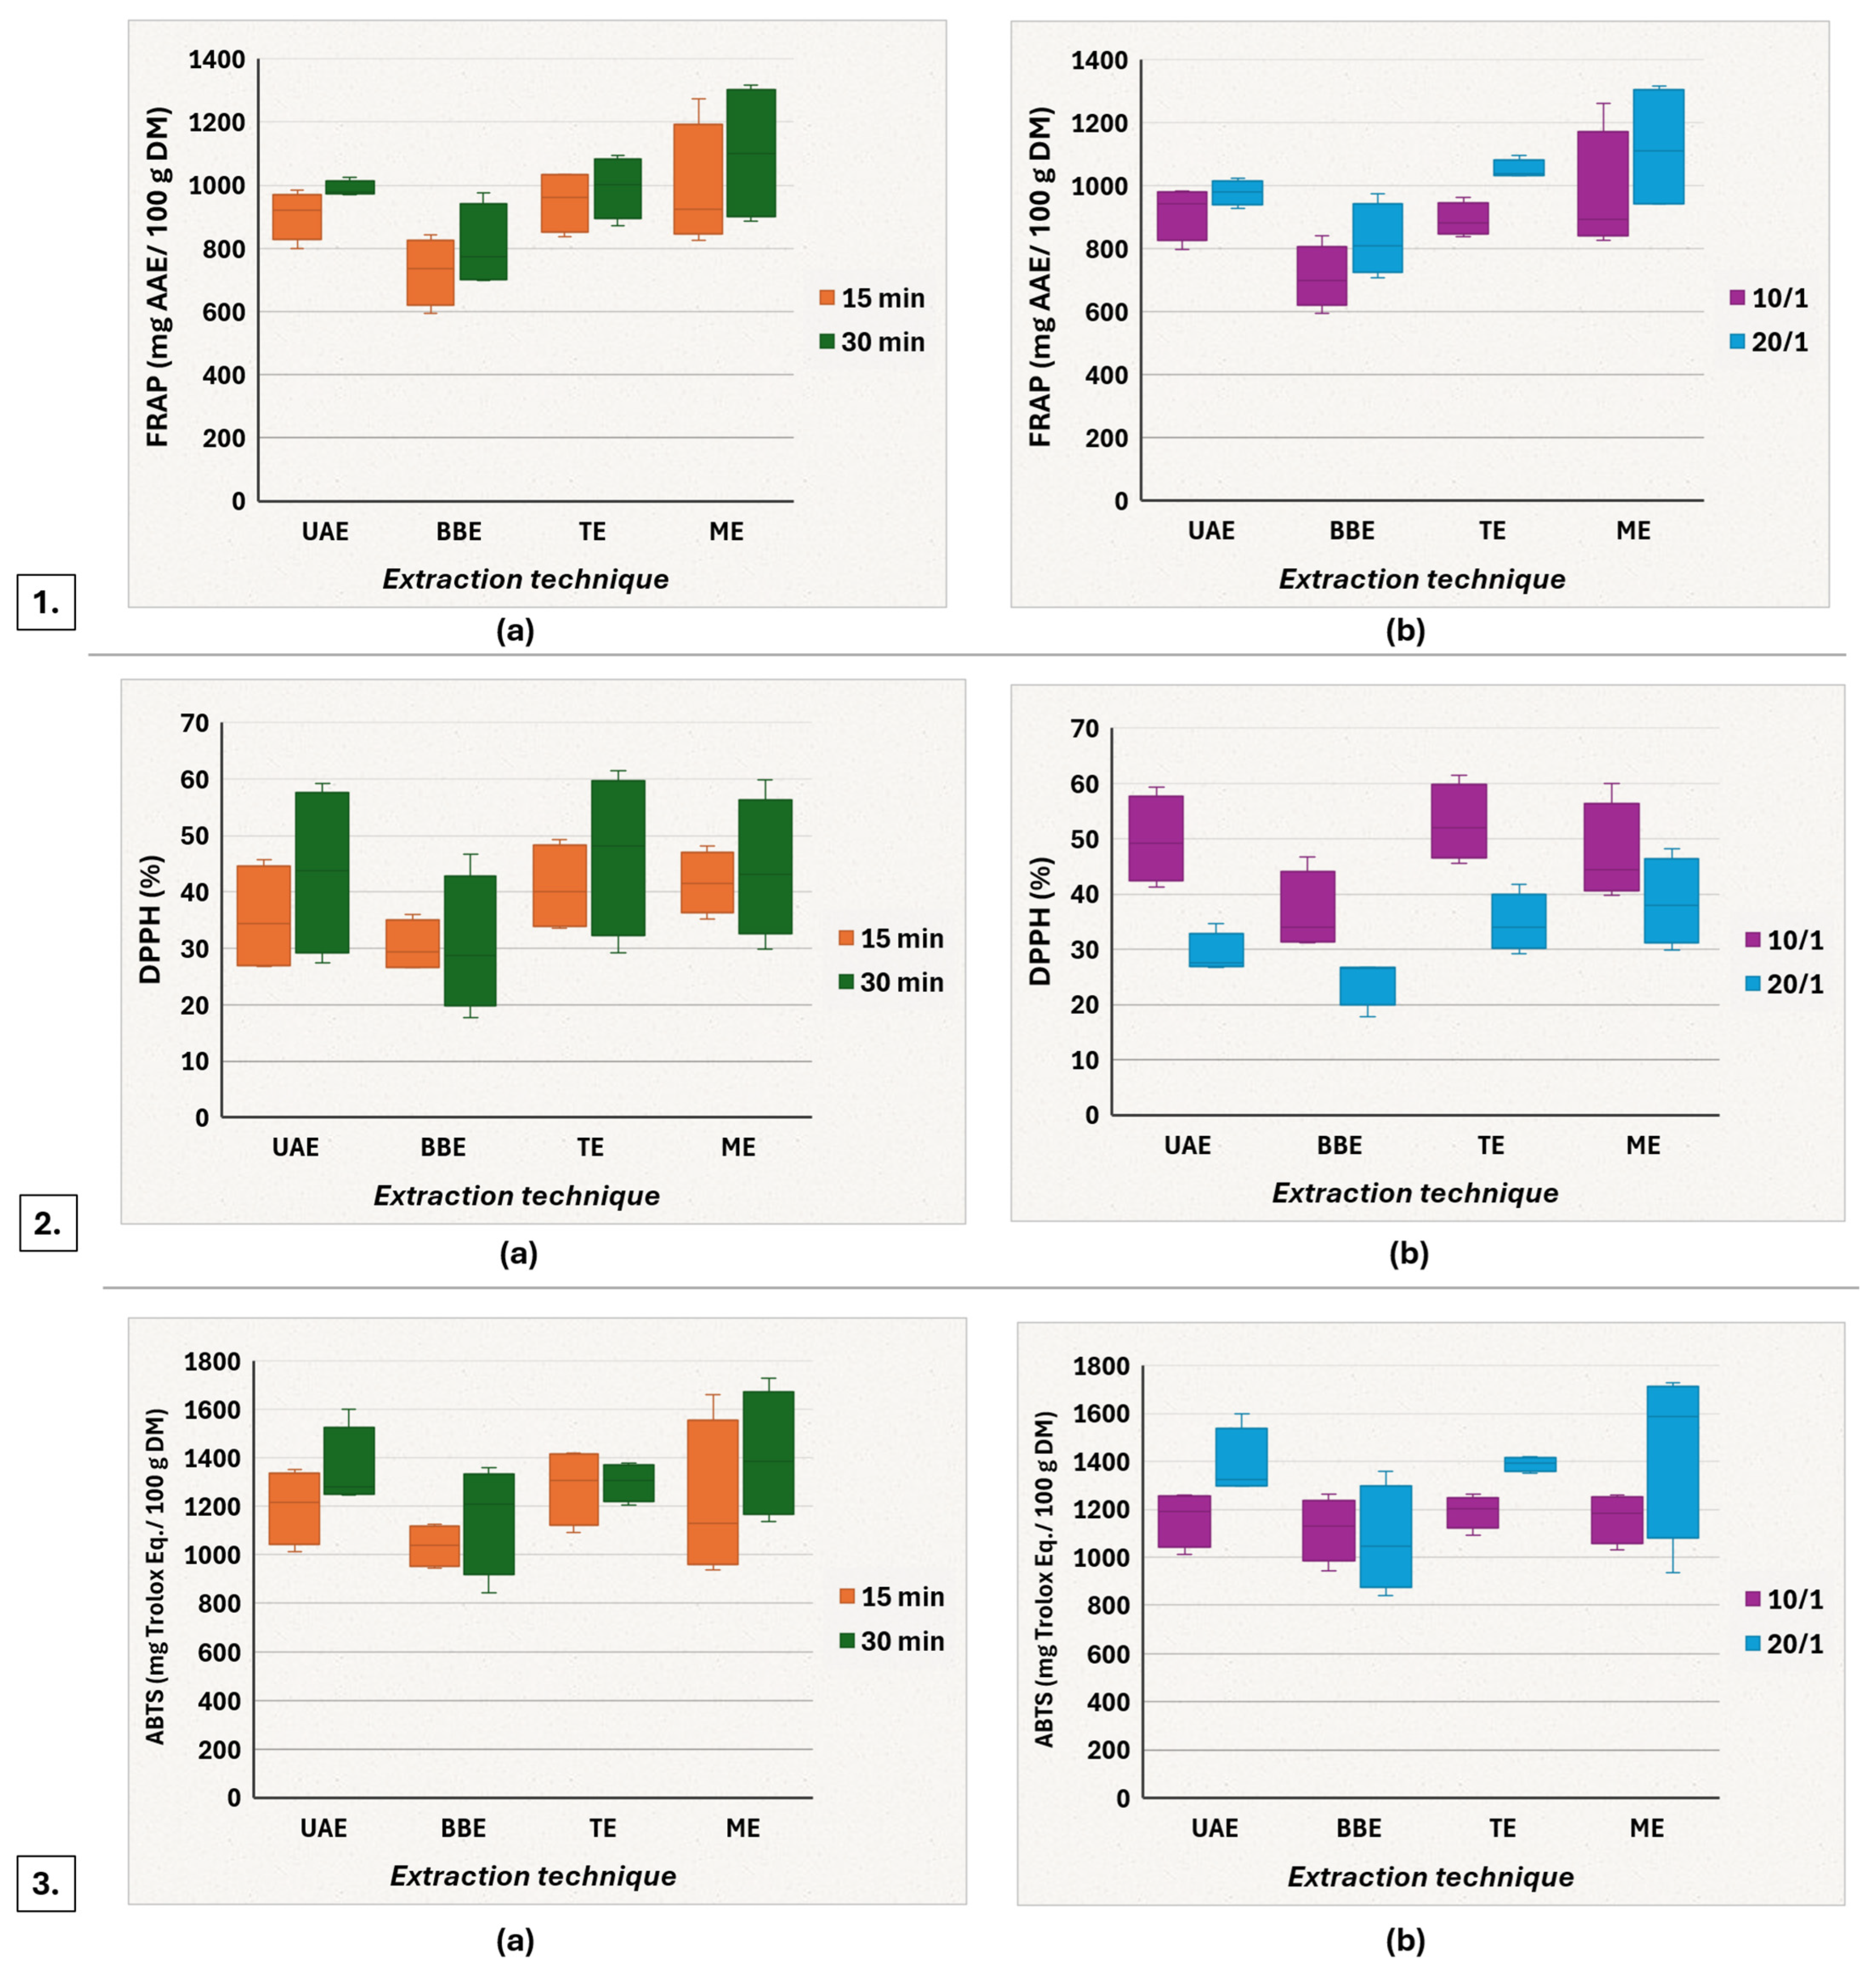
Regarding the antioxidant activity of extracts as measured by FRAP, the boxplots show higher central tendency at 30 min compared with that at 15 min across all extraction methods (Figure 7(1.a)). At 15 min, the order of medians is: TE = 962 mg AAE/100 g DM > ME = 924 mg AAE/100 g DM > UAE = 922 mg AAE/100 g DM > BBE = 737 mg AAE/100 g DM. At 30 min, the hierarchy shifted slightly, with ME showing the highest median value: ME = 1101 mg AAE/100 g DM > TE = 1003 mg AAE/100 g DM > UAE = 979 mg AAE/100 g DM > BBE = 775 mg AAE/100 g DM. Dispersion differs markedly: at 30 min, UAE exhibits very tight spread (IQR = 41.5), whereas ME shows the largest variability (IQR = 401). Tukey post hoc flagged only ME > BBE at 30 min as significant (p = 0.043). The Kruskal–Wallis test did not show a significant effect among extraction methods. Overall, the data support that extending extraction time tends to increase FRAP activity regardless of the method, with the highest central level under ME at 30 min, but at the cost of substantial variability between replicates. UAE offers a good compromise between level and consistency (lowest IQR), and also TE remains intermediate and stable.
On the FRAP boxplots, the 20/1 solvent/solid ratio consistently outperforms 10/1 ratio across all techniques (Figure 7(1.b)). The median ranking is at 20/1: ME 1109.77 mg AAE/100 g DM > TE 1038.69 mg AAE/100 g DM > UAE 979.99 mg AAE/100 g DM > BBE 808.20 mg AAE/100 g DM. The dispersion profile mirrors the boxes: best reproducibility for TE at 20/1 (IQR = 49.29) and UAE at 20/1 (IQR = 73.27), moderate for BBE at 20/1 (IQR = 217.63), and the largest heterogeneity for ME at 20/1 (IQR = 362.33). Tukey post hoc confirmed the strongest contrasts: BBE 10/1 < ME 20/1 (p = 0.0014) and BBE 10/1 < TE 20/1 (p = 0.0098). Within the 20/1 panel, only the ME > BBE (p = 0.0361) showed significance. Dunn pairwise tests with Holm correction preserved significance for BBE 10/1 vs. TE 20/1 (p = 0.0096) and BBE 10/1 vs. ME 20/1 (p = 0.0475). Among the 20/1 groups, none remained significant after adjustment (BBE 20/1 vs. ME 20/1 p = 0.663). Both the boxplots and the statistical analysis converge on the same conclusion: the 20/1 ratio maximizes FRAP activity across all the methods, and among the processes, ME at 20/1 offers the highest potential (at the cost of increased variability), while TE at 20/1 offers high performance with the best consistency between replicates.
Across extraction methods, the DPPH scavenging activity shows a consistent upward shift from 15 to 30 min for UAE, TE and ME, whereas BBE remains almost the same (Figure 7(2.a)). At 30 min the medians rank TE 47.9% > UAE 43.7% > ME 43.1% > BBE 28.8%. In the parametric analysis by ANOVA, no effect reached conventional significance. Kruskal–Wallis corroborated a method effect approaching statistical significance (p ≃ 0.06). Dunn pairwise tests with Holm correction did not preserve significance (closest contrast BBE < TE, pHolm ≃ 0.09). Overall, BBE yielded the lowest DPPH response, whereas TE and UAE provided the highest central values, particularly after 30 min of extraction. Viewed together with the spreads, the most practically balanced profiles are ME at 15 min (good DPPH level, tight IQR) and, secondarily, TE at 15 min (slightly higher center than UAE at 15 min, with moderate IQR). The gains at 30 min for UAE and TE are offset by the broader spread, which reduces confidence in reproducibility, but was preferable when maximizing the median DPPH response was the main objective.
When the samples were grouped according to the solvent/solid ratio, the 10/1 ratio consistently produced higher DPPH values than those at the 20/1 ratio across all extraction methods (Figure 7(2.b)). Dispersion was generally tighter at 20/1 for UAE (IQR = 5.98) and BBE (IQR = 6.82), moderate for TE (IQR = 9.77) and broadest for ME (IQR = 15.15). At 10/1, the IQRs were modest and comparable across methods (≃12.6–15.6), indicating acceptable between-replicate consistency. Tukey post-hoc tests performed within each ratio indicated that, at 10/1, BBE was significantly lower than TE (adjusted p = 0.049), while other pairwise contrasts were not significant. At 20/1, BBE was significantly lower than ME (adjusted p = 0.016). All other pairs were non-significant after Tukey correction. Kruskal–Wallis by ratio showed a significant effect at 20/1 (p = 0.0107). Dunn post-hoc tests with Holm correction at 20/1 confirmed BBE < ME (p_adj = 0.0109) and suggested a borderline BBE < TE difference (p_adj ≃ 0.058). Practically, if maximizing DPPH is the priority, a 10/1 ratio with TE or UAE provides the highest central tendency with acceptable variability. In Figure 7(3.a), representing the ABTS response, the central values generally increased from 15 to 30 min when the methods were compared by extraction time, although the magnitude of this shift differed among techniques. At 15 min, the medians rank TE (1305 mg Trolox Eq./100 g DM) > UAE (1216.5 mg Trolox Eq./100 g DM) > ME (1128.5 mg Trolox Eq./100 g DM) > BBE (1037 mg Trolox Eq./100 g DM). At 30 min, ME reaches the highest central tendency (1384.5 mg Trolox Eq./100 g DM), followed by TE (1307.5 mg Trolox Eq./100 g DM), and UAE (1280 mg Trolox Eq./100 g DM), with BBE (1208 mg Trolox Eq./100 g DM) remaining the lowest-performing technique. No outliers were flagged by Tukey’s 1.5 × IQR rule. Dispersion patterns emphasize method-dependent reproducibility. At 30 min, variability contracts for TE (IQR = 153) and remains moderate for UAE (IQR = 276) but is broad for BBE (IQR = 416) and ME (IQR = 507). Statistically, ANOVA run separately by time did not detect a significant method effect. Kruskal–Wallis tests also were not significant. Overall, a time-related improvement in ABTS activity for all techniques is observed, with ME delivering the highest central values at 30 min but with wide dispersion, and TE providing the most reproducible outputs at 30 min. Practically, if maximizing central antioxidant signal is prioritized, ME for 30 min is favorable. If reproducibility is critical, TE at 30 min is preferable.
When the data were grouped according to the solvent/solid ratio, most techniques showed higher ABTS values at the higher solvent ratio, although this effect was not uniform across methods (Figure 7(3.b)). The median ranking at 20/1 is: ME = 1586.5 mg Trolox Eq./100 g DM (IQR = 632.3) > TE = 1393.0 mg Trolox Eq./100 g DM (IQR = 58.0) > UAE = 1325.5 mg Trolox Eq./100 g DM (IQR ≃ 238.8) > BBE ≃ 1046.0 mg Trolox Eq./100 g DM (IQR = 425.5). At 10/1, medians cluster closely, which explains the visual maintenance at approximately the same level for all methods. TE combined a high median ABTS value with the narrowest IQR (IQR = 58), suggesting a more balanced profile, combining relatively high antioxidant activity with better repeatability, particularly at 30 min and at the 20/1 ratio. In contrast, at the 20/1 ratio, ME reaches the highest median value but also the largest dispersion (IQR = 632), indicating that ME may maximize the antioxidant response under extended extraction and higher solvent availability, but with reduced reproducibility.

3.3. Optimization of ME

Model adequacy statistics for the fitted first-order factorial/RSM models is presented in Table S5 of the Supplementary Materials.

3.3.1. Multi-Response Optimization of TPC, TFC, and TTC by ME

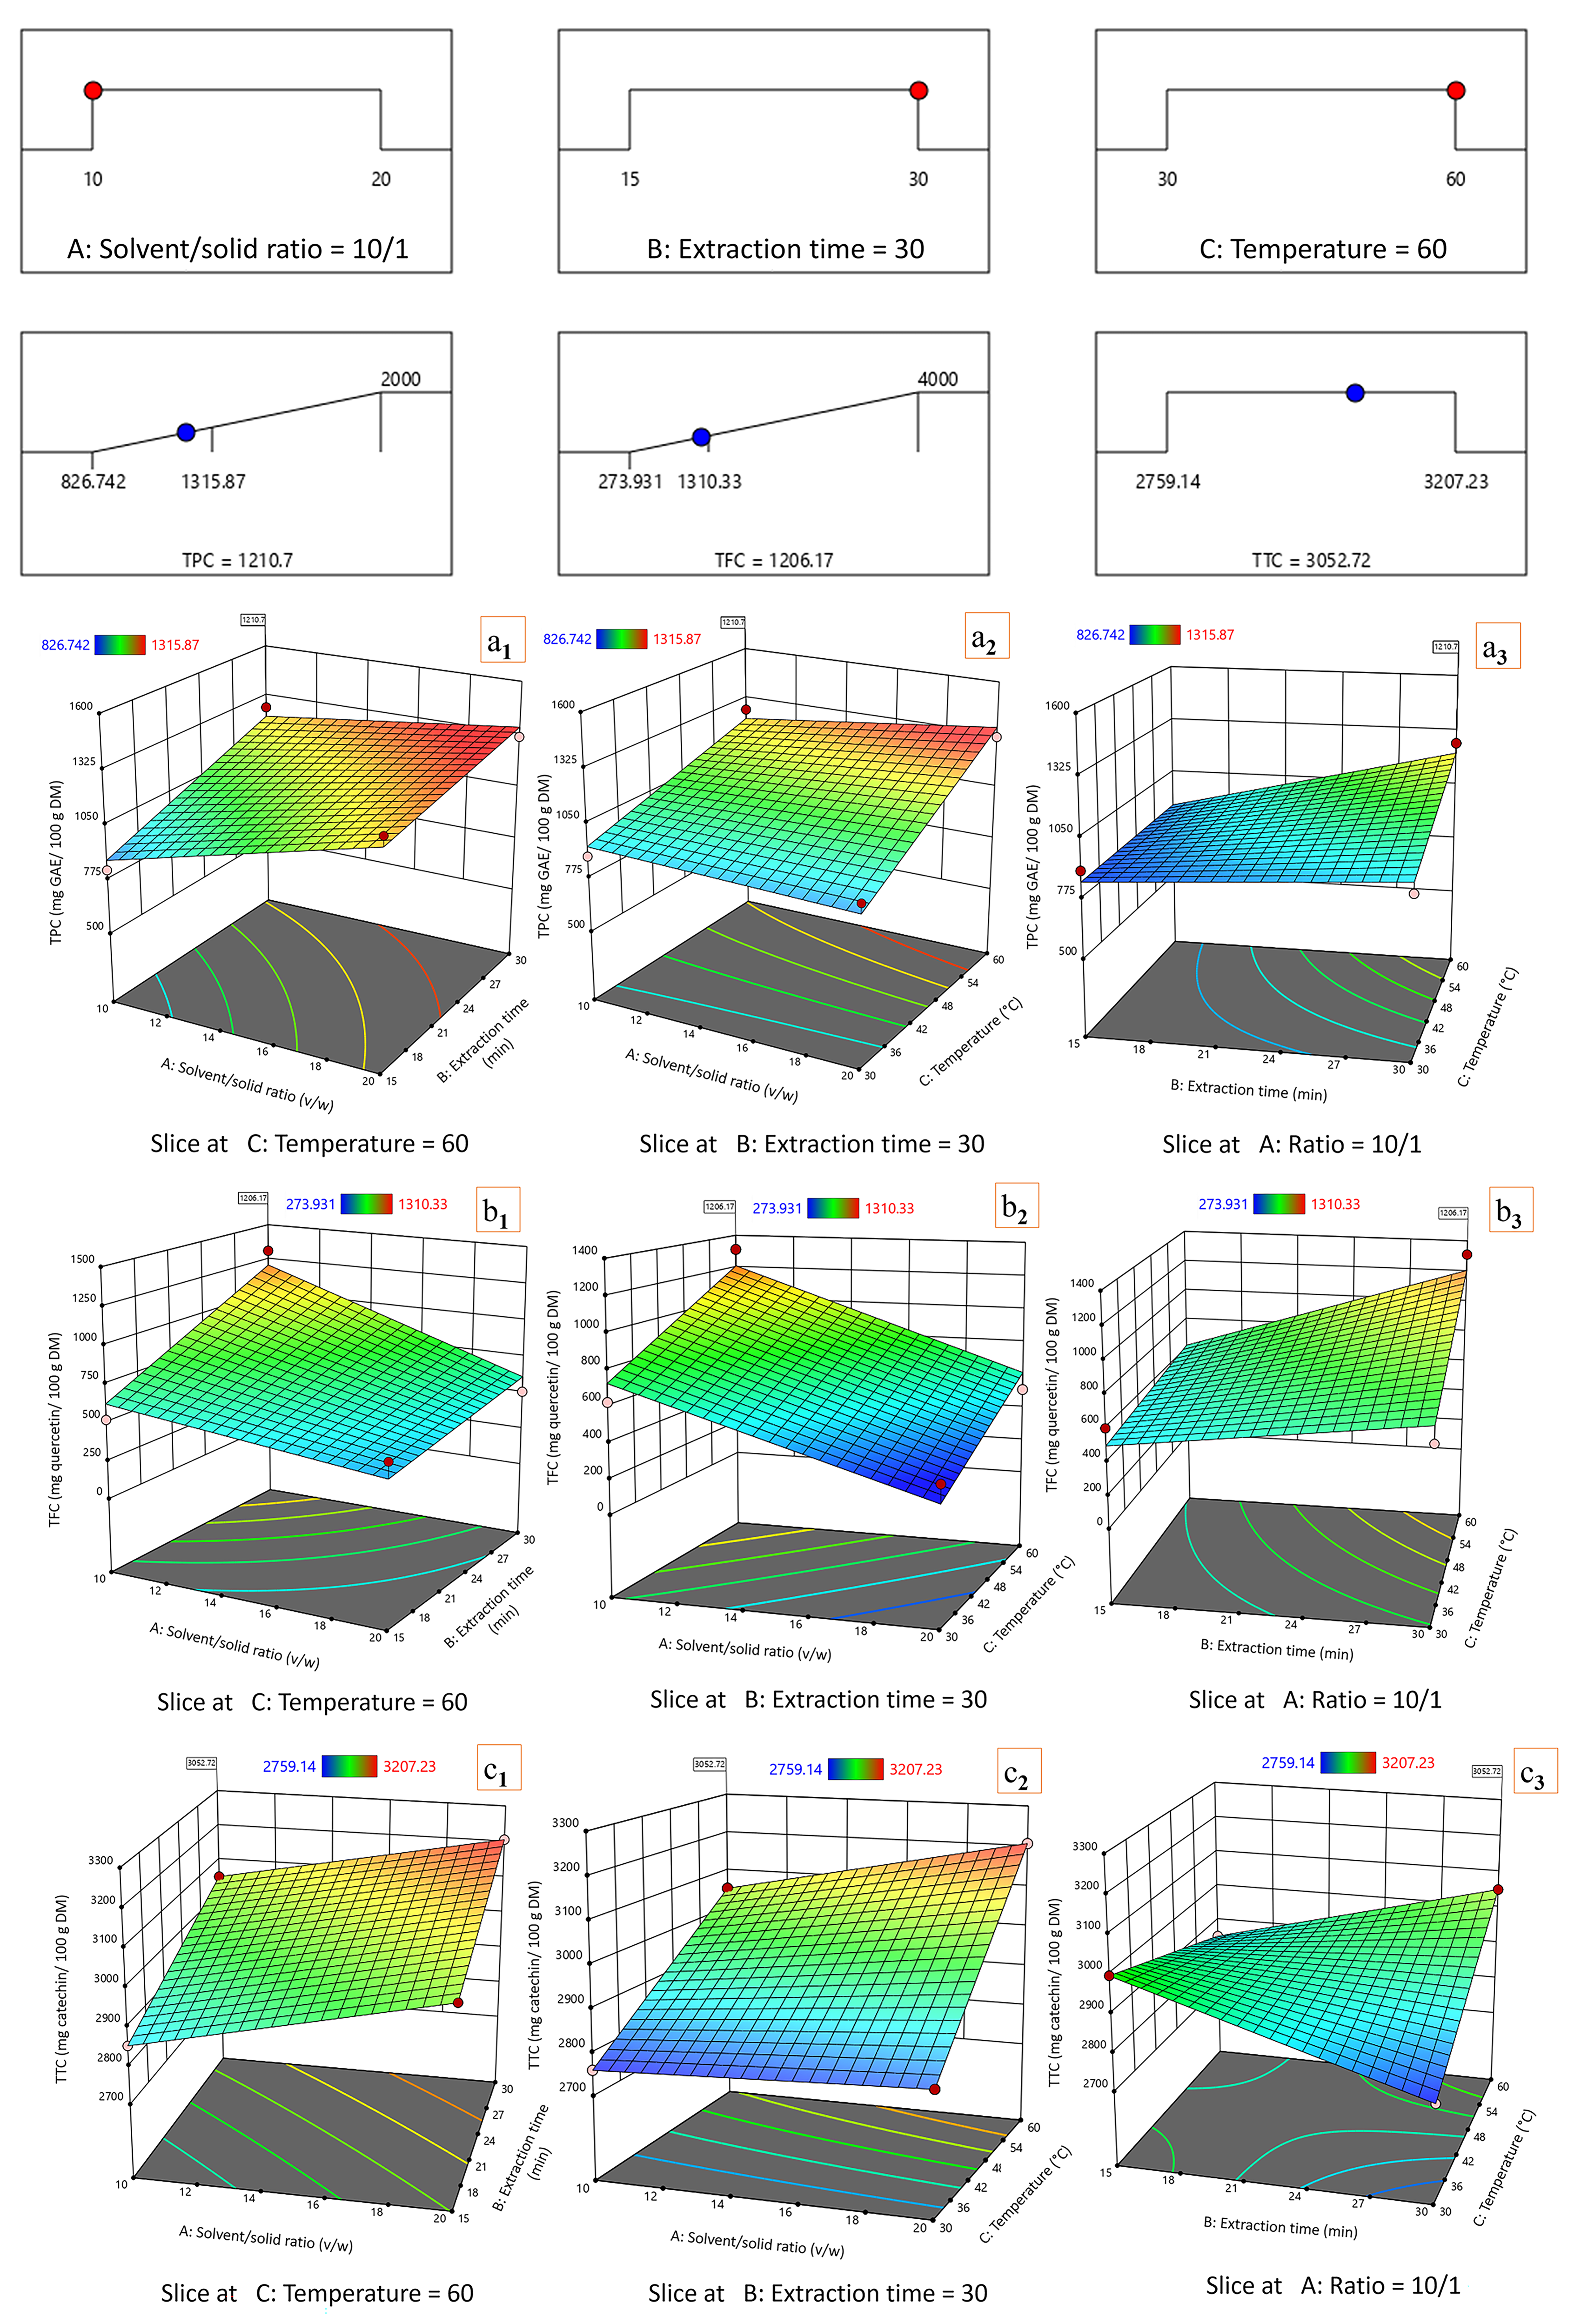
For the combined recovery of TPC, TFC, and TTC, ME was optimized at 10/1 solvent/solid ratio, 30 min and 60 °C (Figure 8). At this point, the model predicted 1210.7 mg GAE/100 g DM for TPC, 1206.17 mg QE/100 g DM for TFC and 3052.72 mg CE/100 g DM for TTC.
The response surfaces did not describe uniform behavior for all three phytochemical classes. TPC was mainly improved by a longer extraction and higher temperature, which is consistent with the role of extended matrix-solvent contact and thermally facilitated diffusion during conventional ME. The solvent/solid ratio had a secondary influence on this response compared with time and temperature.
TFC showed a sharper dependence on the balance between solvent concentration and temperature. Higher TFC recovery was achieved at the lower solvent-to-solid ratio, particularly when heating and the maximum extraction time were combined. This suggests that, in this matrix, TFC release was supported by matrix softening and improved solvent penetration, whereas excessive dilution offered no clear advantage.
TTC was less responsive to the experimental factors than TPC and TFC. The TTC surface covered a narrower response interval and displayed a broader favorable region, indicating that the selected multi-response optimum was driven mainly by the stronger variation in TPC and TFC while maintaining an acceptable TTC yield.
Thus, ME provided the best global phytochemical balance under a low solvent/solid ratio, prolonged extraction, and moderate heating. This setting is practically relevant because it improves the recovery of phenolic-related fractions without increasing solvent consumption, while remaining within the experimental limits evaluated in the factorial design.

3.3.2. Optimization of Betalain Recovery by ME

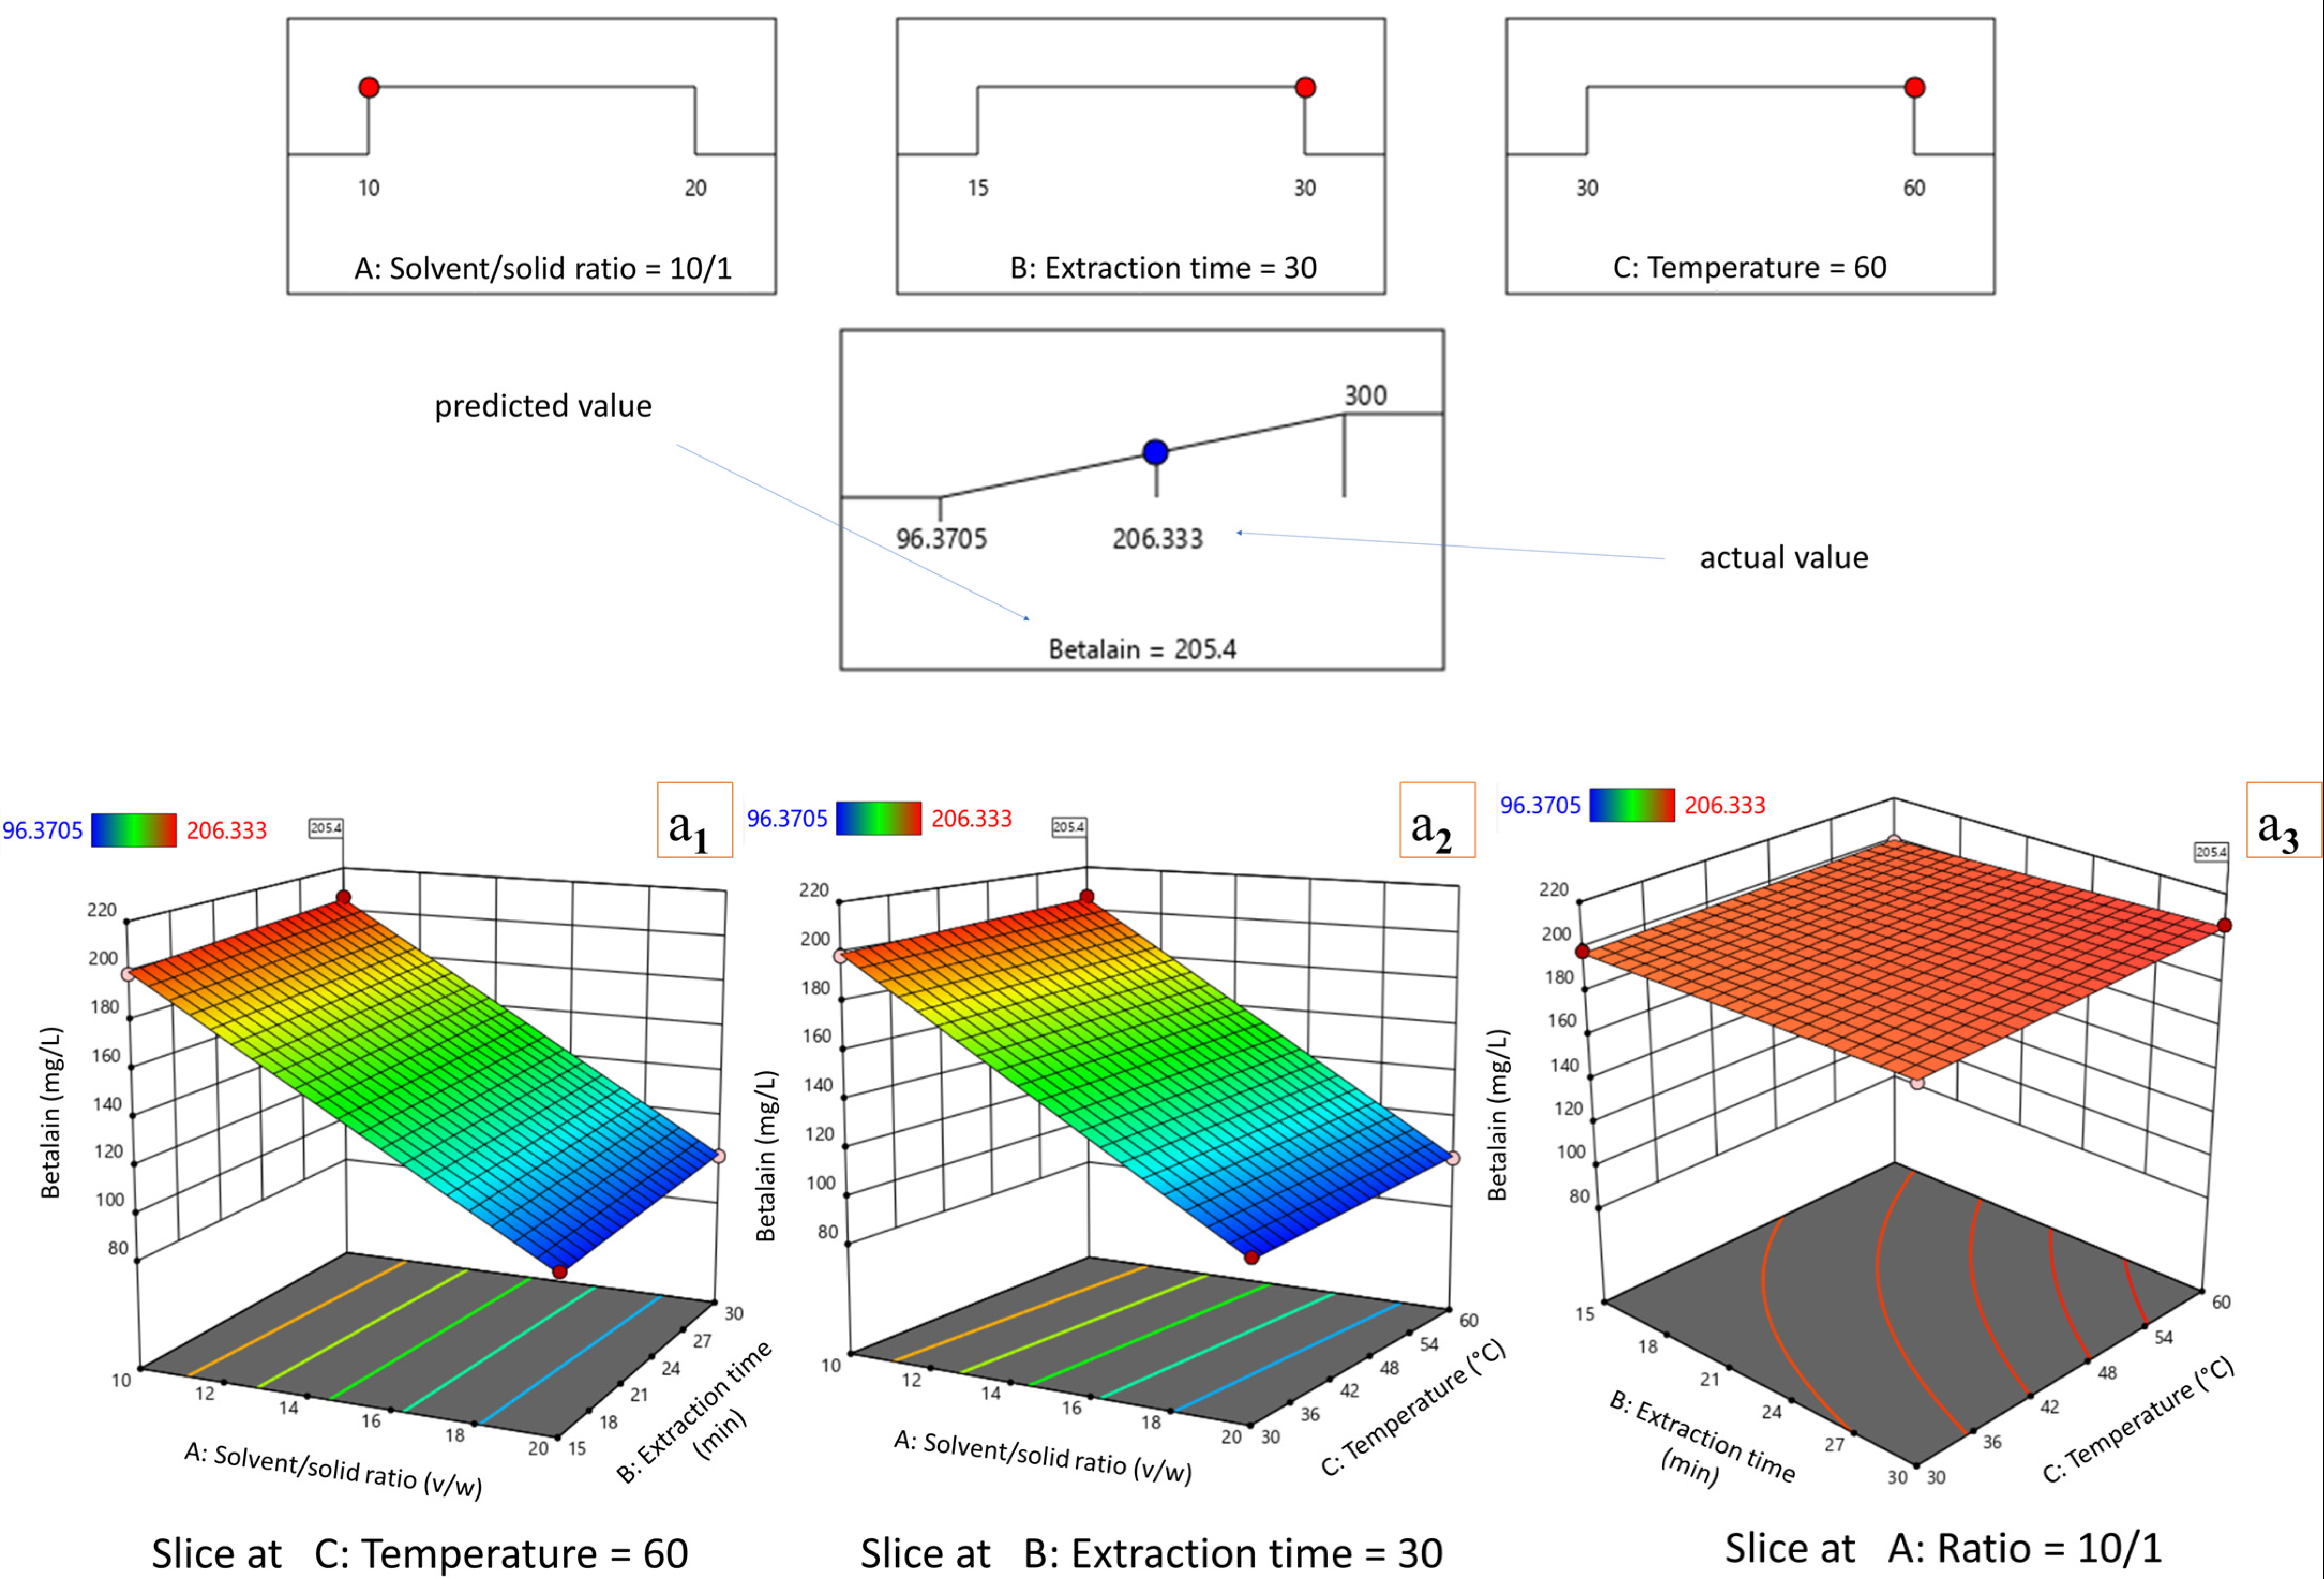
Regarding the betalain content in fruit extracts, the ME model converged toward a compact and thermally assisted extraction setting: 10/1 solvent/solid ratio, 30 min and 60 °C (Figure 9).
The predicted concentration was 205.4 mg/L, whereas the experimental value reached 206.333 mg/L; the difference between the two values was therefore minimal (approximately 0.45%). This close correspondence supports the adequacy of the fitted model for describing the response within the tested design space.
The dominant gradient in Figure 9 was associated with the solvent/solid ratio. Betalain content declined as the ratio increased from 10/1 to 20/1, indicating that the additional solvent volume did not generate a proportional gain in pigment release. Instead, the lower ratio preserved a more concentrated extract and was consistently associated with the highest modeled response.
Extraction time and temperature acted in the same direction, although their effects were less abrupt than that of solvent dilution. At 60 °C, extending ME from 15 to 30 min increased betalain recovery, and at 30 min the response further improved toward 60 °C.
Our results indicate that betalain extraction by ME benefited from concentrated solvent use, longer contact time, and moderate heating. Because the optimum was located at the edge of the investigated interval, it should be interpreted as the best-performing condition within the experimental domain, not as evidence for behavior beyond the tested factor levels.

3.3.3. Multi-Response Optimization of Antioxidant Activity (FRAP, DPPH, and ABTS) by ME

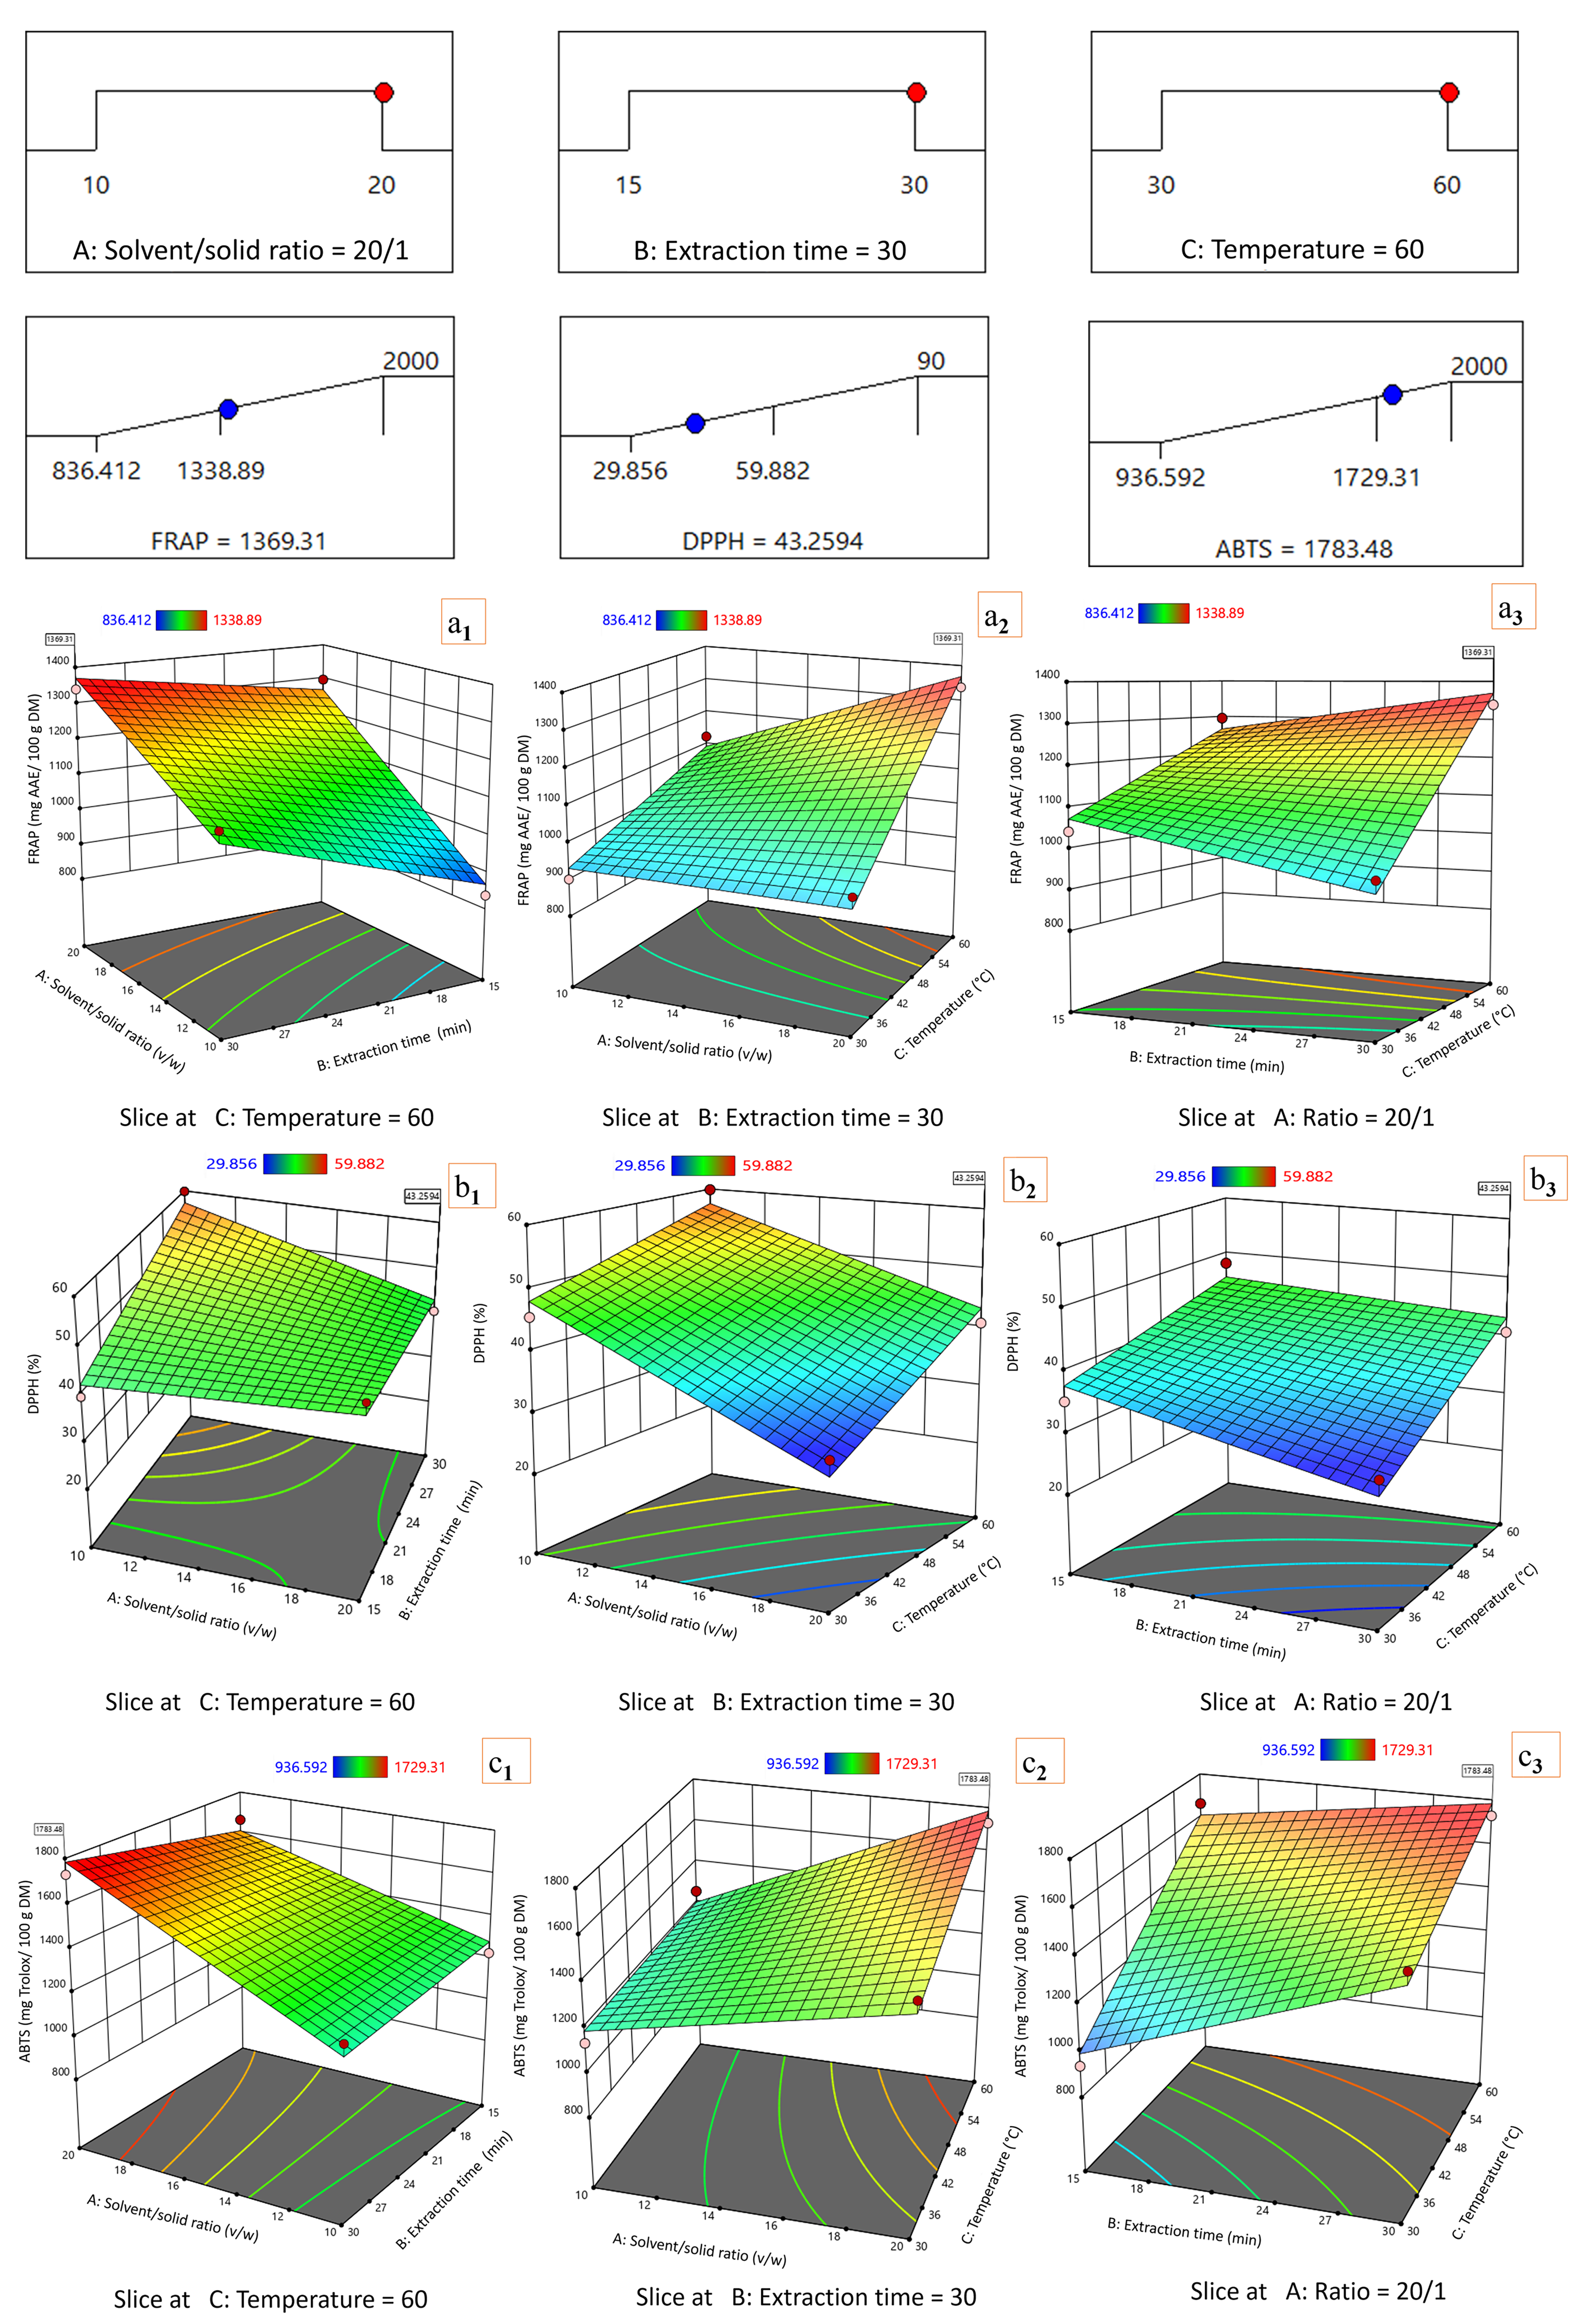
The optimization of antioxidant activity in extracts obtained by ME produced a different solvent requirement from that observed for the investigated bioactive compounds. The best overall antioxidant activity was predicted at 20/1 solvent/solid ratio, 30 min and 60 °C, with values of FRAP = 1369.31 mg AAE/100 g DM, DPPH = 43.26% and ABTS = 1783.48 mg Trolox Eq./100 g DM (Figure 10).
FRAP and ABTS activities were the main responses pulling the optimum toward more intensive ME conditions. Both assays increased toward the high-time/high-temperature region, and ABTS activity also benefited from the higher solvent-to-solid ratio. This behavior suggests that warm extraction for 30 min promotes the release of compounds with electron-transfer capacity and ABTS-reactive antioxidant activity [36,37].
DPPH did not follow the same pattern as closely. Its surface was flatter and its predicted value at the global optimum was not positioned at the absolute maximum of the DPPH response. Consequently, the selected condition should be read as a multi-assay compromise: it prioritizes the strong FRAP and ABTS gains while preserving a satisfactory DPPH radical-scavenging level.

3.4. Optimization of UAE

3.4.1. Multi-Response Optimization of TPC, TFC, and TTC by UAE

Regarding the TPC, TFC, and TTC in fruit extracts, UAE shifted the optimum toward intensified extraction: 20/1 solvent/solid ratio, 30 min and 70% amplitude. The predicted values were 1056.83 mg GAE/100 g DM for TPC, 1841.12 mg QE/100 g DM for TFC, and 2976.32 mg CE/100 g DM for TTC (Figure 11).
TPC increased clearly with extraction time and amplitude, especially when the higher solvent/solid ratio was used. The optimized value was close to the modeled upper limit (799.49–1061.51 mg GAE/100 g DM), indicating that the selected UAE settings promoted phenolic release without an apparent decline in TPC within the investigated range.
TFC displayed a wider response interval (1359.46–1928.19 mg QE/100 g DM) and was also enhanced by longer UAE and higher amplitude. However, the individual high-response zone for TFC did not perfectly overlap with all other responses, meaning that the selected condition represents a multi-response balance rather than a single-response maximum.
TTC was comparatively less variable, with modeled values between 2810.36 and 3310.88 mg CE/100 g DM. Its flatter surface suggests that TTC recovery was relatively stable across the UAE domain once adequate cavitation was achieved. The optimized condition therefore appears to be driven more by TPC and TFC improvement than by a major TTC increase.
Overall, intensified UAE was favorable for TPC and TFC recovery, while maintaining satisfactory TTC extraction. This behavior contrasts with the betalain response and underlines the need to optimize extraction conditions according to the target compound class rather than applying a single universal UAE setting.

3.4.2. Optimization of Betalain Recovery by UAE

The solvent/solid ratio exerted a strong negative effect on pigment concentration. Moving from 10/1 to 20/1 reduced the modeled response across the interaction surfaces, suggesting that higher solvent volume mainly diluted the extract rather than increasing betalain release proportionally. The predicted optimum was 10/1 solvent/solid ratio, 15 min, and 40% amplitude, with a betalain content of 153.586 mg/L, close to the modeled upper range of the response (Figure 12).
Both UAE time and amplitude showed unfavorable trends for betalains. Extending extraction to 30 min did not improve recovery, and raising amplitude from 40% to 70% further lowered the predicted response, especially when combined with higher solvent volume. This pattern is consistent with the sensitivity of betalain pigments to excessive acoustic energy and possible localized heating during sonication, although the UAE process was externally cooled and the final temperature of each run was recorded, meaning that the observed response should be interpreted as reflecting the applied UAE conditions rather than sonication intensity alone.
The UAE betalain model therefore supports a short, low-amplitude protocol. From an applied perspective, this is advantageous because it reduces processing time and energy input while maintaining a high pigment concentration.

3.4.3. Multi-Response Optimization of Antioxidant Activity (FRAP, DPPH and ABTS) by UAE

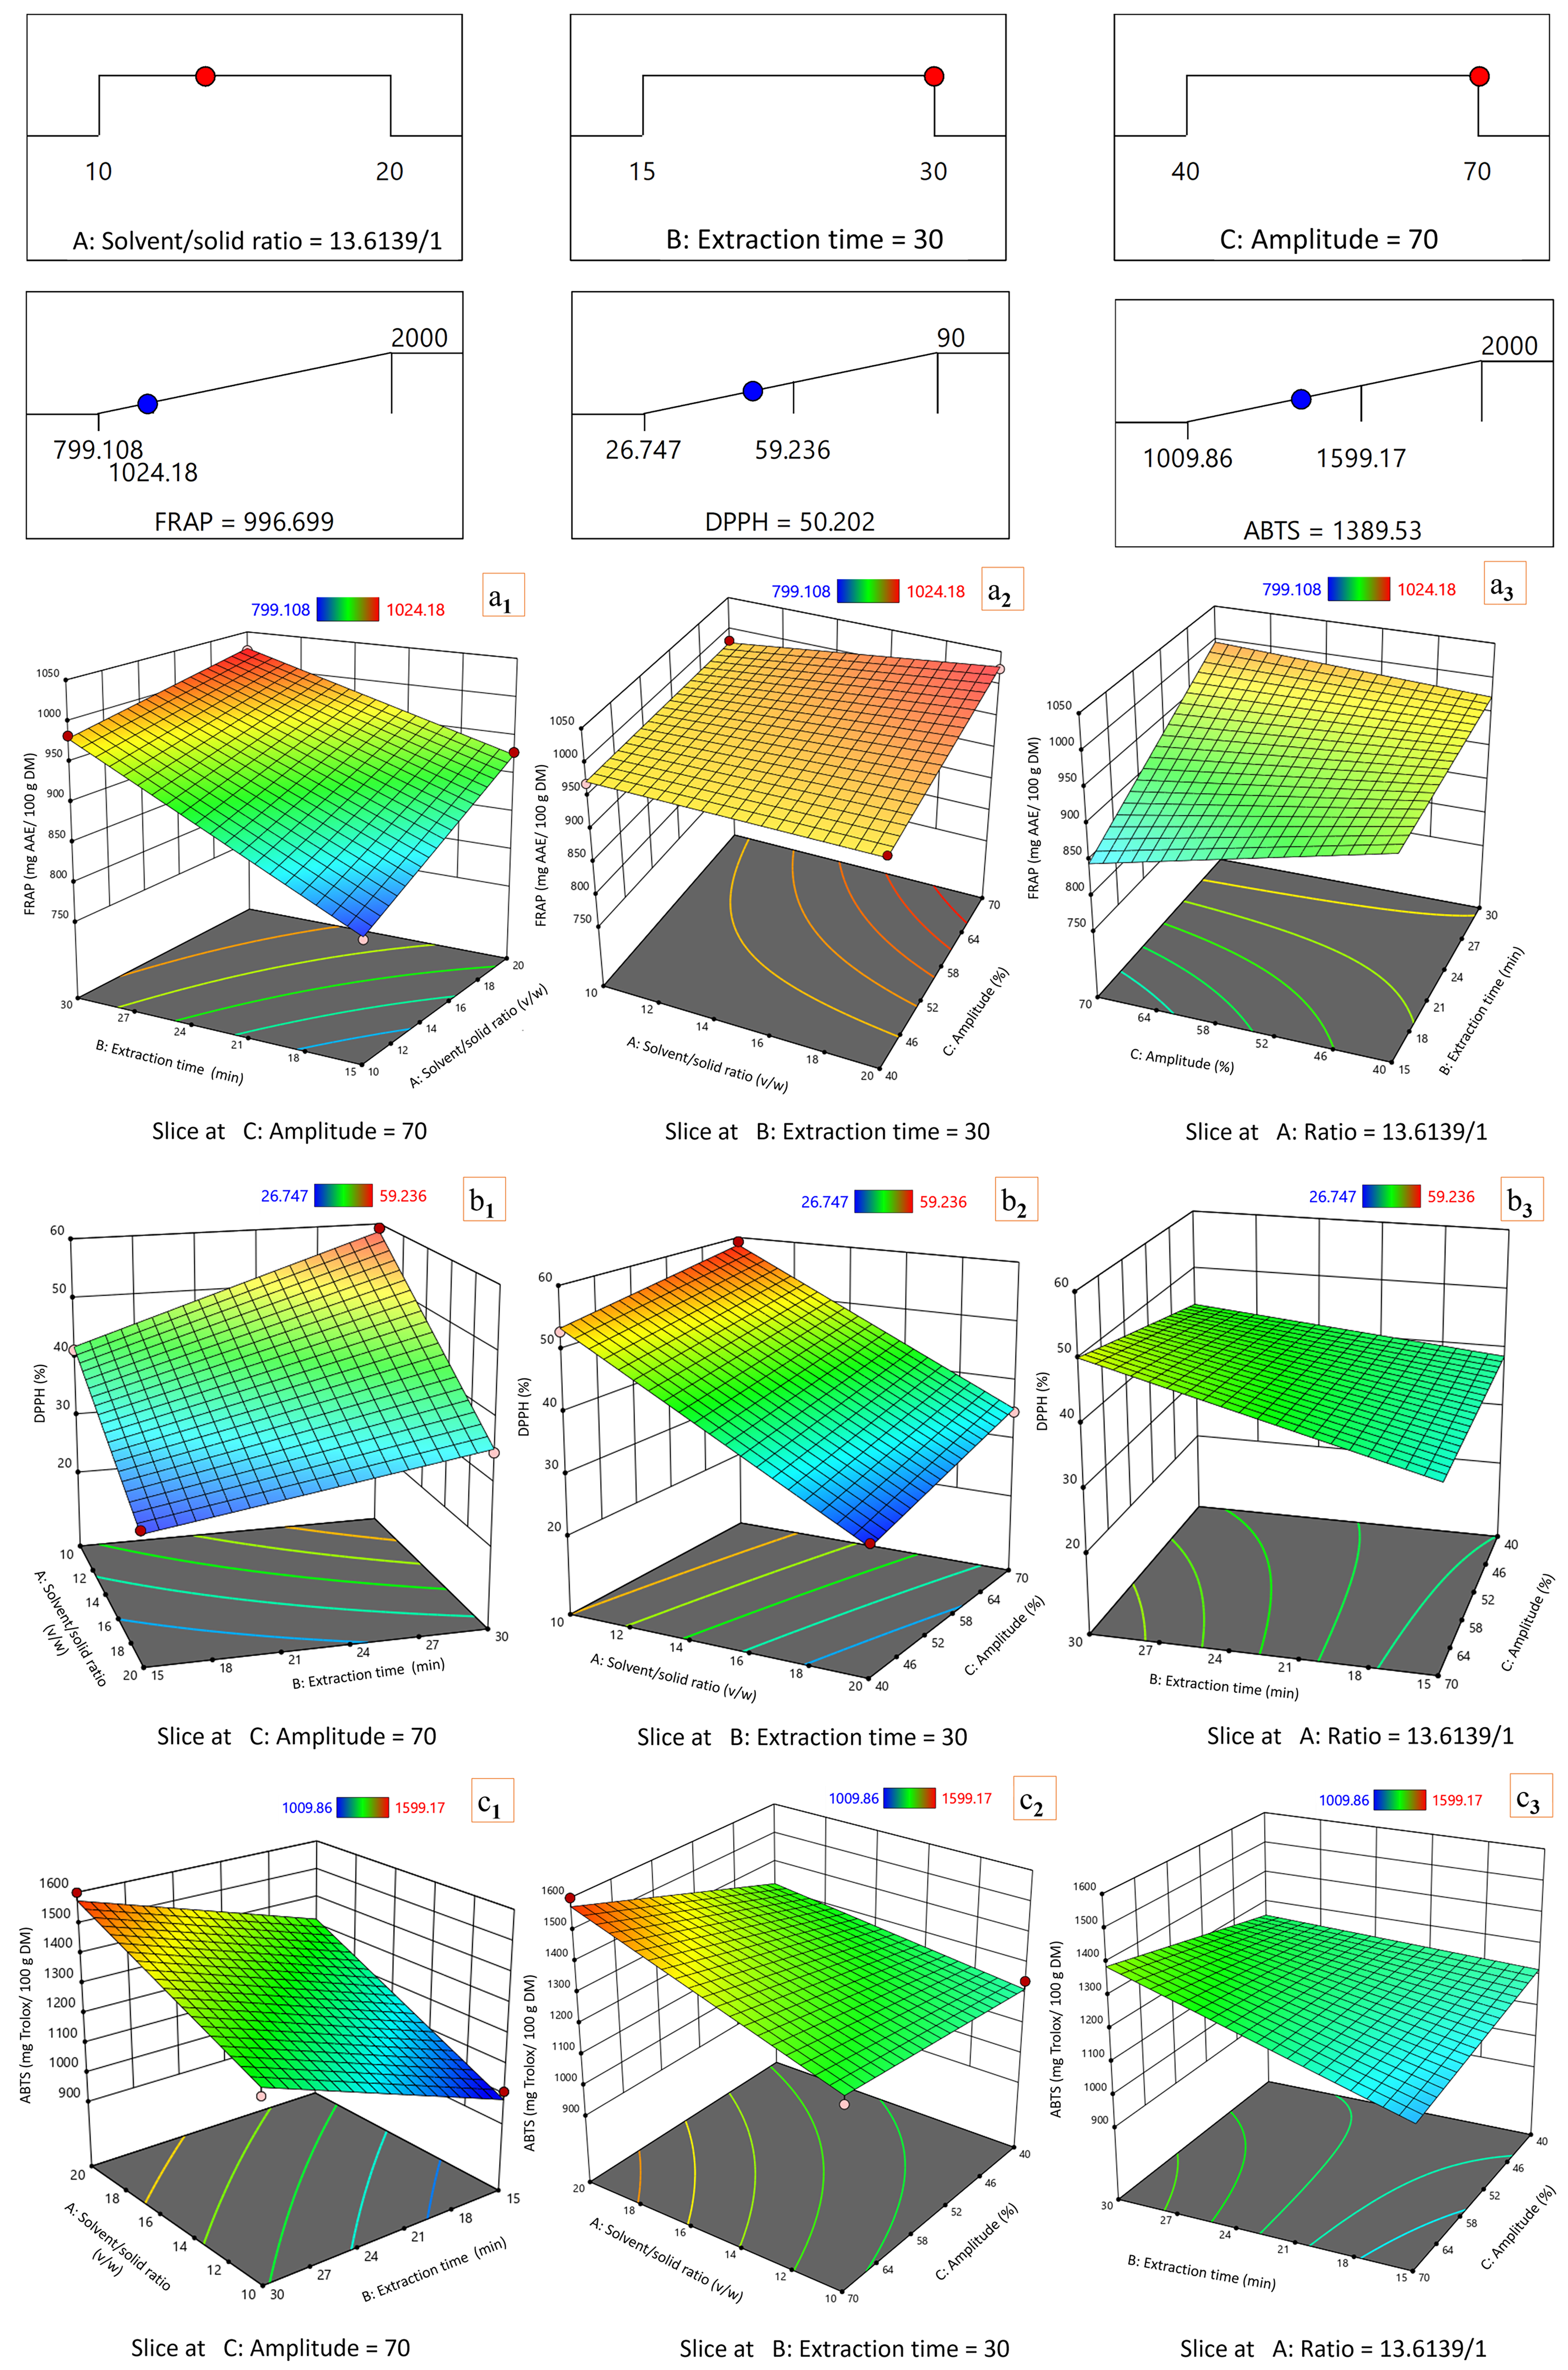
The antioxidant response obtained by UAE was optimized at an intermediate solvent/solid ratio and maximum UAE exposure: solvent/solid ratio 13.6139/1 v/w, 30 min and 70% amplitude. The predicted values were FRAP = 996.70 mg AAE/100 g DM, DPPH = 50.20%, and ABTS = 1389.53 mg Trolox Eq./100 g DM (Figure 13).
FRAP increased with extraction time and amplitude, while the solvent/solid ratio showed a non-linear contribution. The optimal ratio was positioned below the maximum tested solvent volume, indicating that stronger cavitation and sufficient exposure time were more important for reducing power than simple solvent increase.
DPPH followed a clearer intensification pattern. The weakest response was associated with short extraction and low amplitude, whereas 30 min and 70% amplitude markedly improved radical-scavenging activity. The intermediate solvent/solid ratio suggests that matrix disruption and extract concentration needed to remain balanced for this assay.
ABTS reached the highest absolute antioxidant values and was also favored by the high-amplitude, long-duration region of the model. Similar to FRAP and DPPH, however, ABTS did not require the highest solvent/solid ratio, supporting the idea that excessive solvent volume can reduce the measured antioxidant concentration even when compound release is efficient.
Consequently, UAE antioxidant optimization is best described as an intensity-driven process moderated by solvent concentration. The selected solvent/solid ratio 13.6139/1 v/w, 30 min, 70% amplitude condition provides a practical compromise for extracts with high reducing power and radical-scavenging activity.

3.5. Optimization of TE

3.5.1. Multi-Response Optimization of TPC, TFC, and TTC by TE

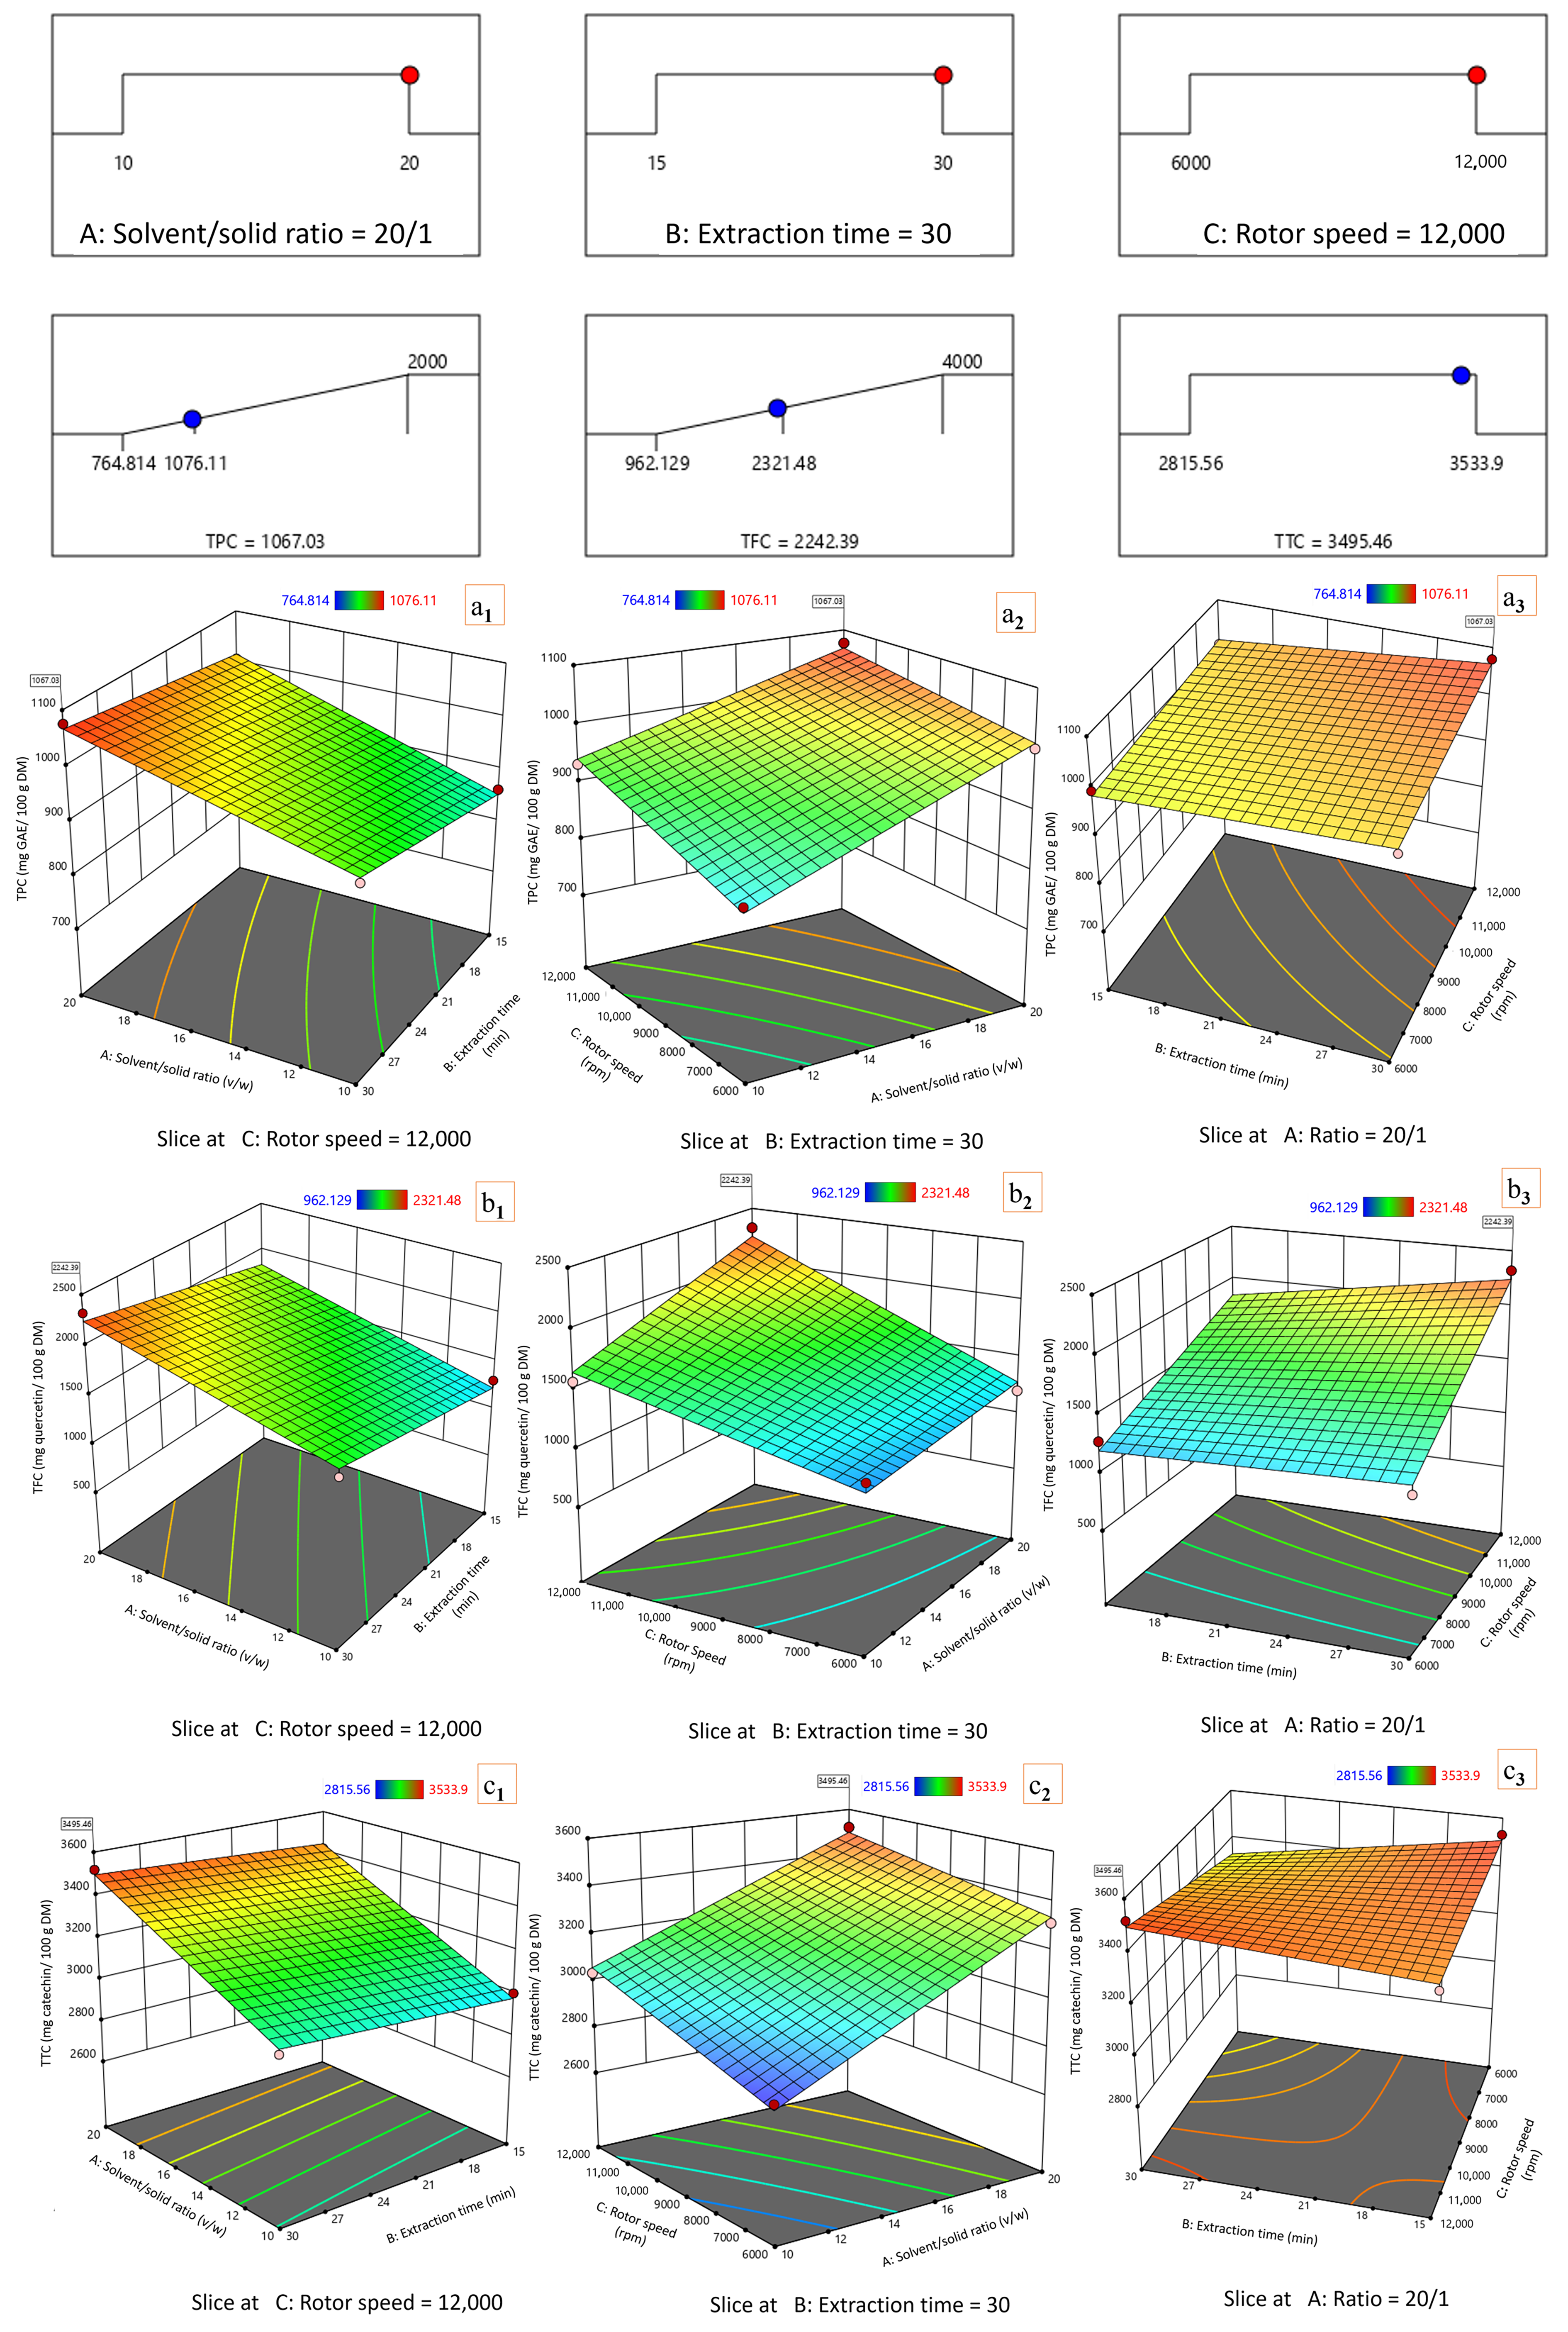
The joint optimization of TPC, TFC, and TTC in extracts obtained by TE selected the upper level of each operational factor: 20/1 solvent/solid ratio, 30 min, and 12,000 rpm (Figure 14). The corresponding predicted values were 1067.03 mg GAE/100 g DM, 2242.39 mg QE/100 g DM, and 3495.46 mg CE/100 g DM, respectively.
TPC increased steadily with solvent availability and extraction time, while rotor speed provided an additional gain when the solvent/solid ratio was high. The smoothness of the surface indicates a gradual improvement in phenolic release rather than a narrow optimum, which is compatible with enhanced solvent access and matrix disruption produced by rotor–stator homogenization.
TFC was the response most visibly amplified by mechanical intensity. The steepest surface gradient appeared when speed increased from 6000 to 12,000 rpm, especially at 20/1, showing that TFC recovery was strongly linked to an apparent tissue fragmentation of the plant matrix and improved mass transfer under high-shear conditions. Extraction time reinforced this effect but was not the only driver of the response.
TTC followed the same general direction, although with a less pronounced slope than TFC. Higher stroke-equivalent mechanical input and increased solvent availability improved TTC recovery, suggesting that the TTC-rich fraction was released more efficiently when mechanical disruption and solvent volume acted together.
Overall, TE required the most intensive tested conditions to maximize the phenolic-related responses. This differs from the betalain model, where low solvent dilution was decisive, and indicates that the optimal operating window depends on the targeted chemical class.

3.5.2. Optimization of Betalain Recovery by TE

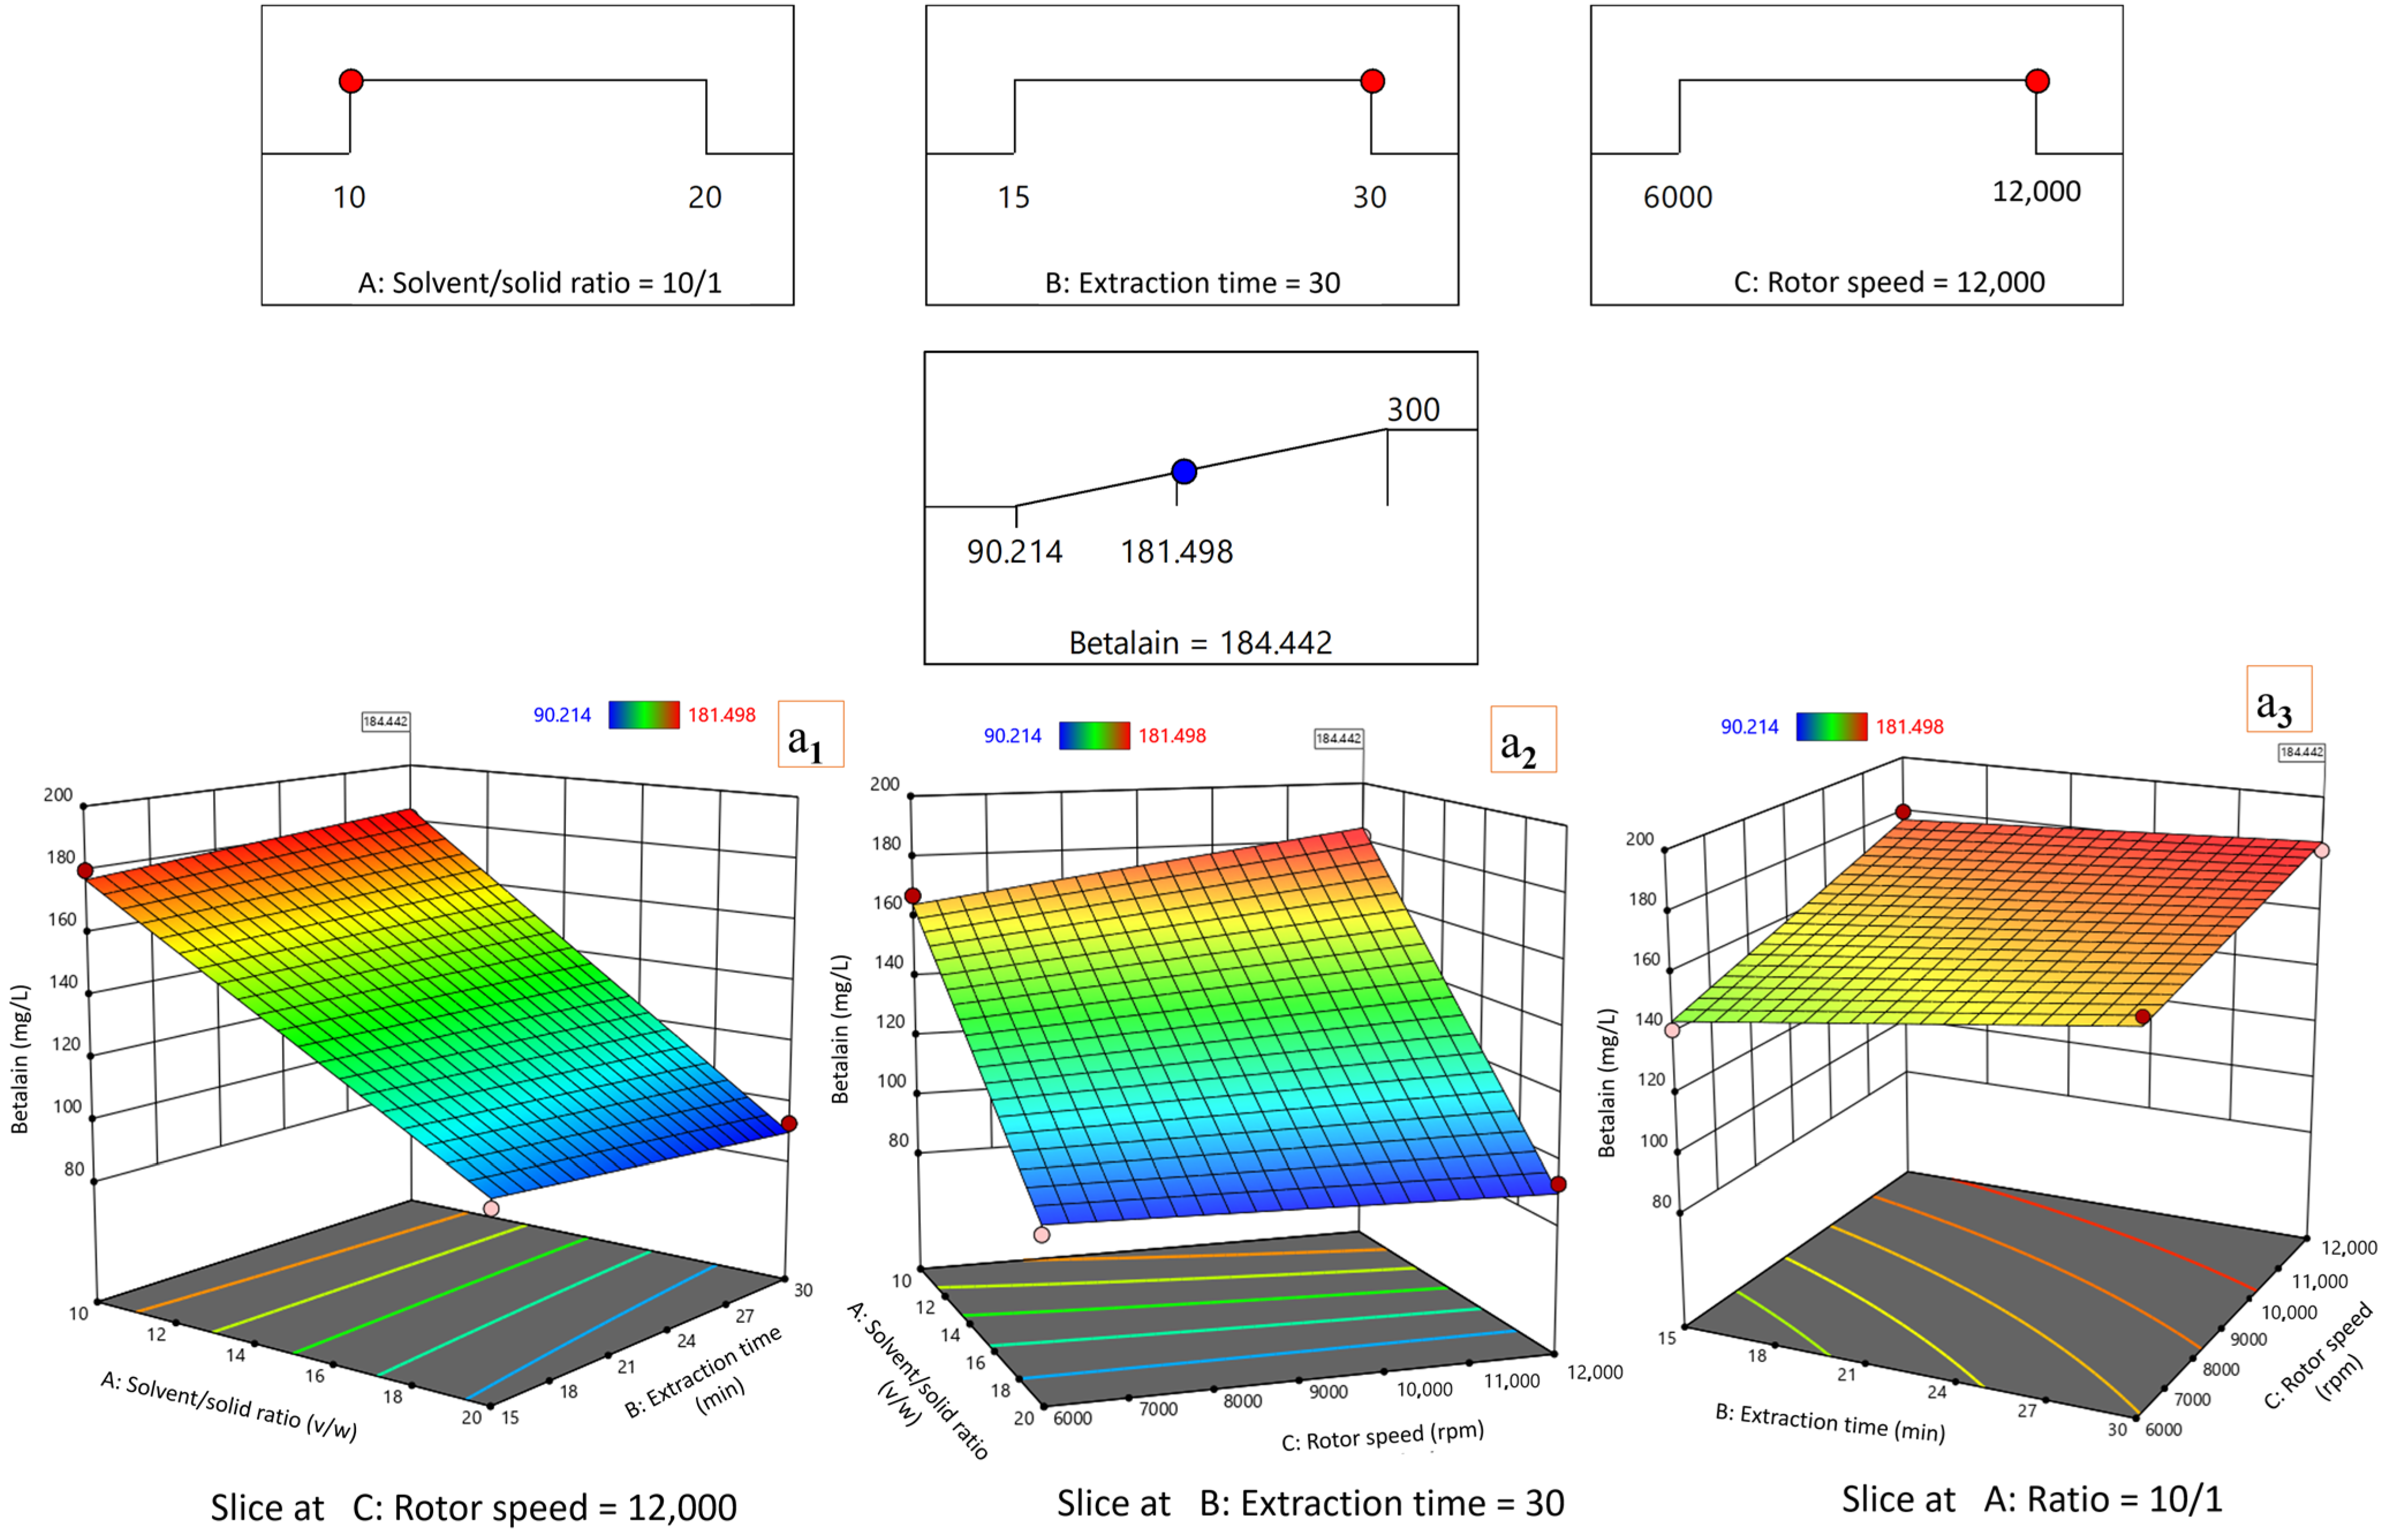
Regarding the TE applied to P. americana fruits in relation to betalains, their recovery was favored by a 10/1 solvent/solid ratio combined with maximum process intensity. The predicted optimum value was obtained at 10/1 solvent/solid ratio, 30 min, and 12,000 rpm, corresponding to 184.442 mg/L betalains (Figure 15).
Among the three factors, the solvent/solid ratio created the clearest separation between response regions. Increasing the ratio to 20/1 consistently decreased the predicted betalain content, whereas the 10/1 condition remained associated with the upper response zone across the paired surfaces. This indicates that rotor–stator disruption did not compensate for the lower analyte concentration caused by higher solvent volume.
Time and rotor speed contributed positively but more gradually. Extending extraction to 30 min improved the response, particularly at 10/1, and the increase from 6000 to 12,000 rpm further shifted the surface upward. The absence of sharp curvature suggests that the effect was progressive, reflecting cumulative mechanical disintegration rather than a sudden release threshold.
Therefore, the most favorable TE setting for betalains combined low dilution with sustained high-shear processing. Since the optimum occurs at the boundary of the design, these conditions should be treated as the best option tested rather than as a confirmed maximum outside the selected factor range.

3.5.3. Multi-Response Optimization of Antioxidant Activity (FRAP, DPPH, and ABTS) by TE

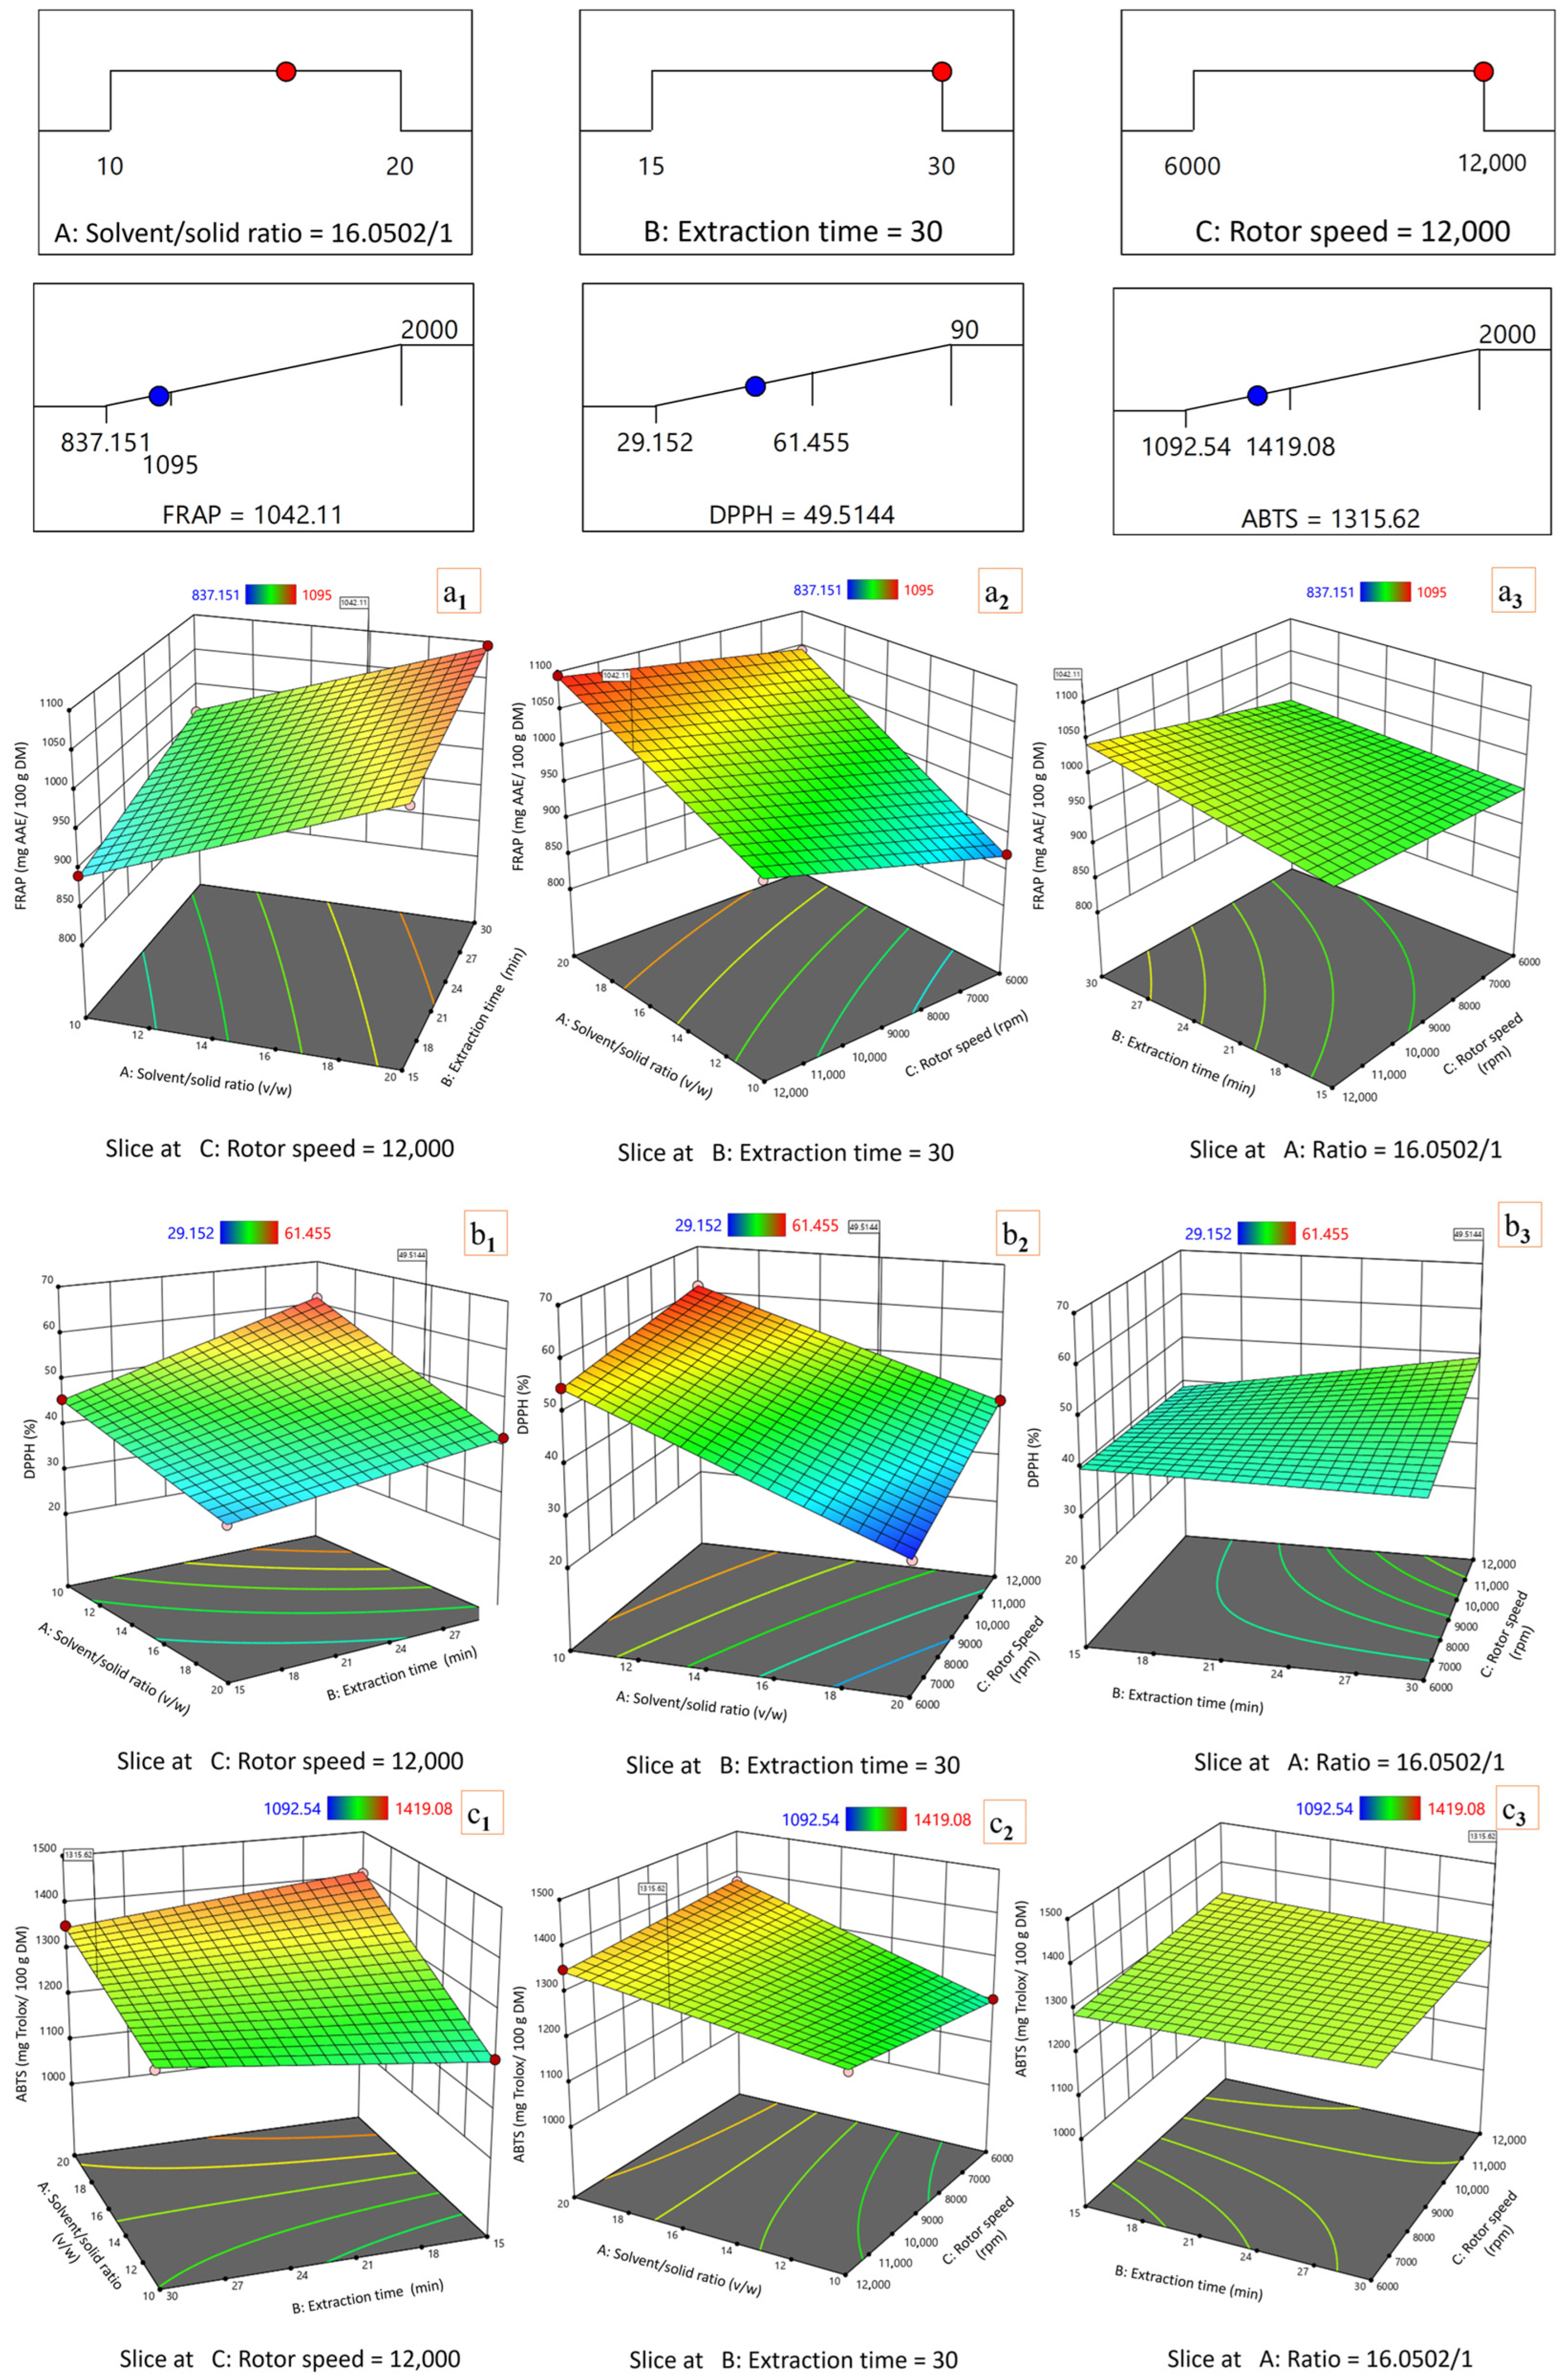
Regarding the antioxidant activity in extracts obtained by TE, the results showed that it did not require the maximum solvent/solid ratio. The multi-response optimization identified an intermediate solvent/solid ratio of 16/1 v/w, combined with 30 min and 12,000 rpm (Figure 16). At this point, the predicted responses were FRAP = 1042.11 mg AAE/100 g DM, DPPH = 49.51%, and ABTS = 1315.62 mg Trolox Eq./100 g DM. This intermediate optimum reflects the non-overlapping behavior of the three antioxidant assays. FRAP increased mainly with time and solvent availability, while high rotor speed contributed positively but did not dominate the response once sufficient extraction time was provided. Thus, reducing power benefited from a balanced combination of solvent access and mechanical disruption. DPPH activity showed stronger dependence on interaction effects. Longer extraction and high rotor speed improved radical-scavenging activity, but increasing solvent volume beyond the intermediate region did not further enhance the response. This suggests that the compounds responsible for DPPH inhibition were favored by intensive disruption, while excessive dilution reduced the practical gain in measured activity. ABTS activity was comparatively stable across a wider part of the design, with a flatter surface than DPPH. The response still improved under longer and faster extraction, but the model did not indicate a need for the highest solvent volume. This supports the use of the solvent/solid ratio of 16/1 v/w as a balanced condition for antioxidant-active constituents rather than a simple maximum of all individual assays.
Accordingly, TE appears most suitable for antioxidant recovery when high shear and the longest tested extraction time are maintained, while solvent volume is kept at an intermediate level. This operating point is best interpreted as a practical compromise among complementary antioxidant mechanisms.

3.6. Optimization of BBE

3.6.1. Multi-Response Optimization of TPC, TFC, and TTC by BBE

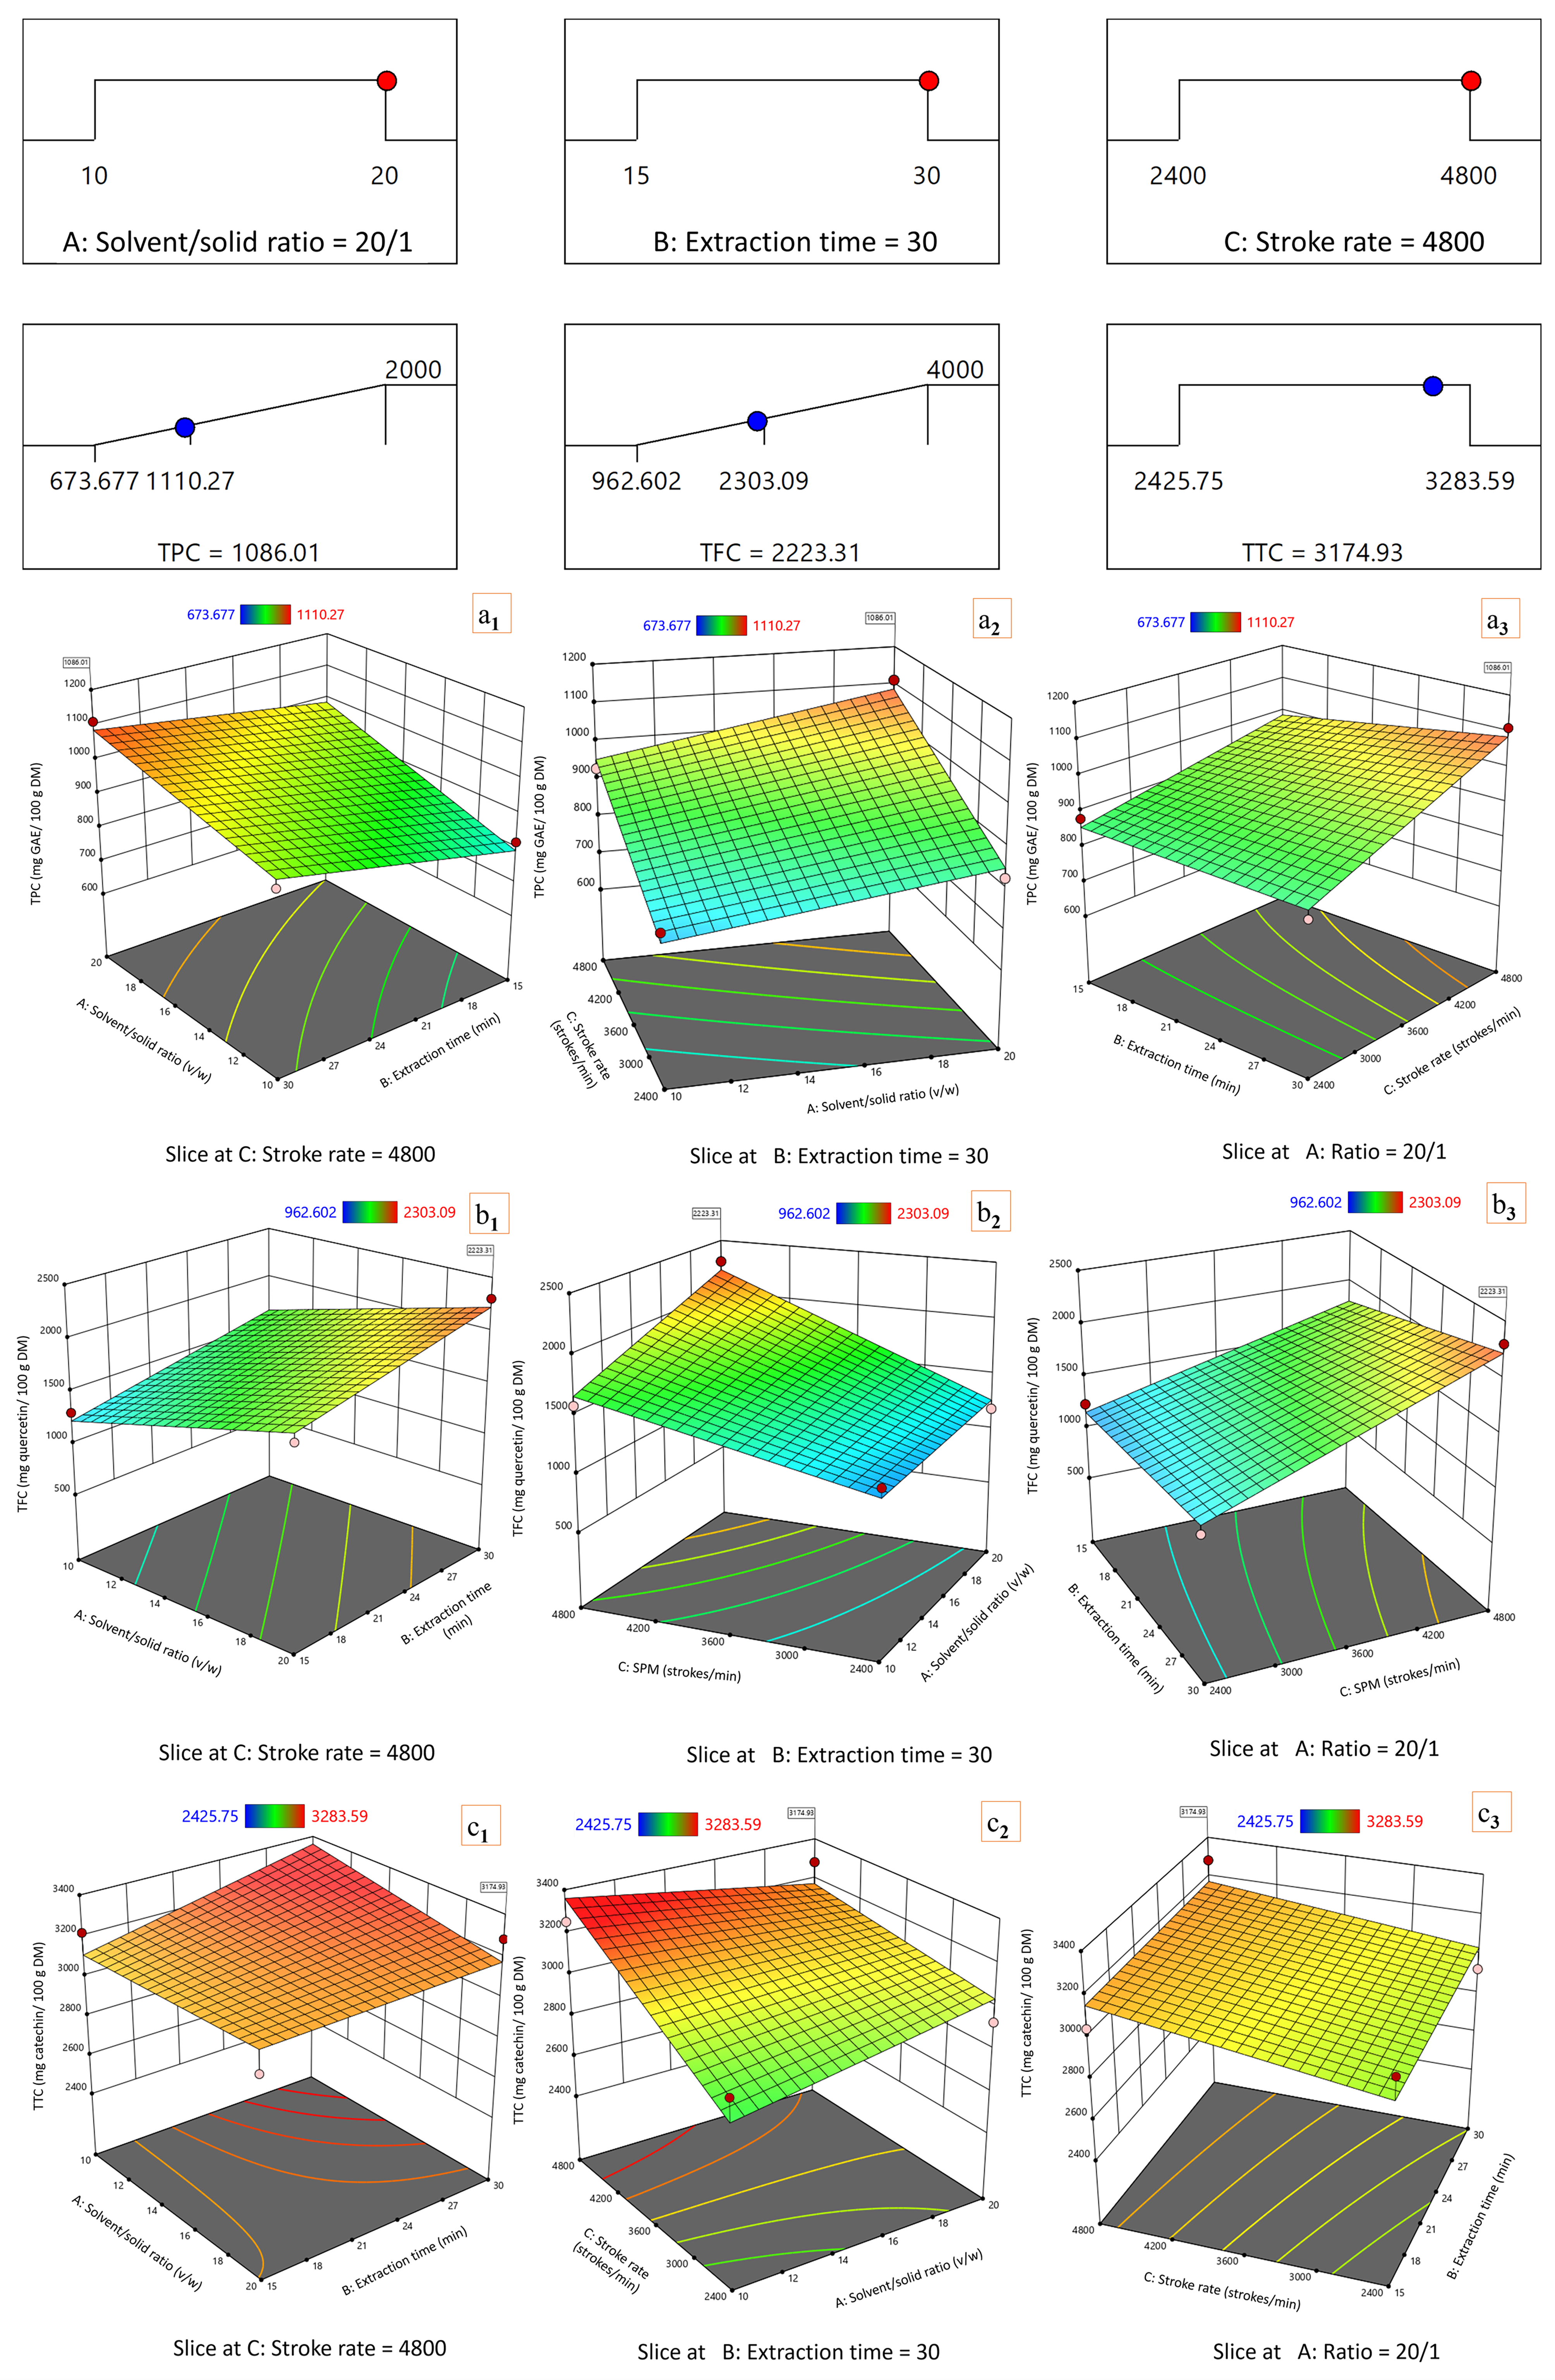
For the phenolic-related responses, BBE favored the upper level of all three variables. The optimized conditions were 20/1 solvent/solid ratio, 30 min, and 4800 strokes/min, with predicted values of 1086.01 mg GAE/100 g DM for TPC, 2223.31 mg QE/100 g DM for TFC, and 3174.93 mg CE/100 g DM for TTC (Figure 17).
TPC increased gradually toward higher solvent availability, longer extraction, and maximum stroke rate. The strongest gain appeared when high solvent volume was combined with intensified bead movement, suggesting that TPC release required both efficient matrix disruption and sufficient solvent capacity.
TFC responded more sharply to process intensification. The highest response region was concentrated near the maximum values of the three factors, and the steep surface gradients indicate that TFC extraction was particularly sensitive to BBE energy when supported by adequate solvent volume and extraction time.
TTC displayed a broader high-response plateau than TFC. Although TTC recovery also improved toward higher stroke rate and solvent/solid ratio, the surface was less steep, suggesting that once a sufficient degree of mechanical disruption was reached, small changes in operating conditions had a weaker effect on TTC. These results show that BBE is most efficient for phenolic-rich fractions when solvent availability and mechanical intensity are maximized together.

3.6.2. Optimization of Betalain Recovery by BBE

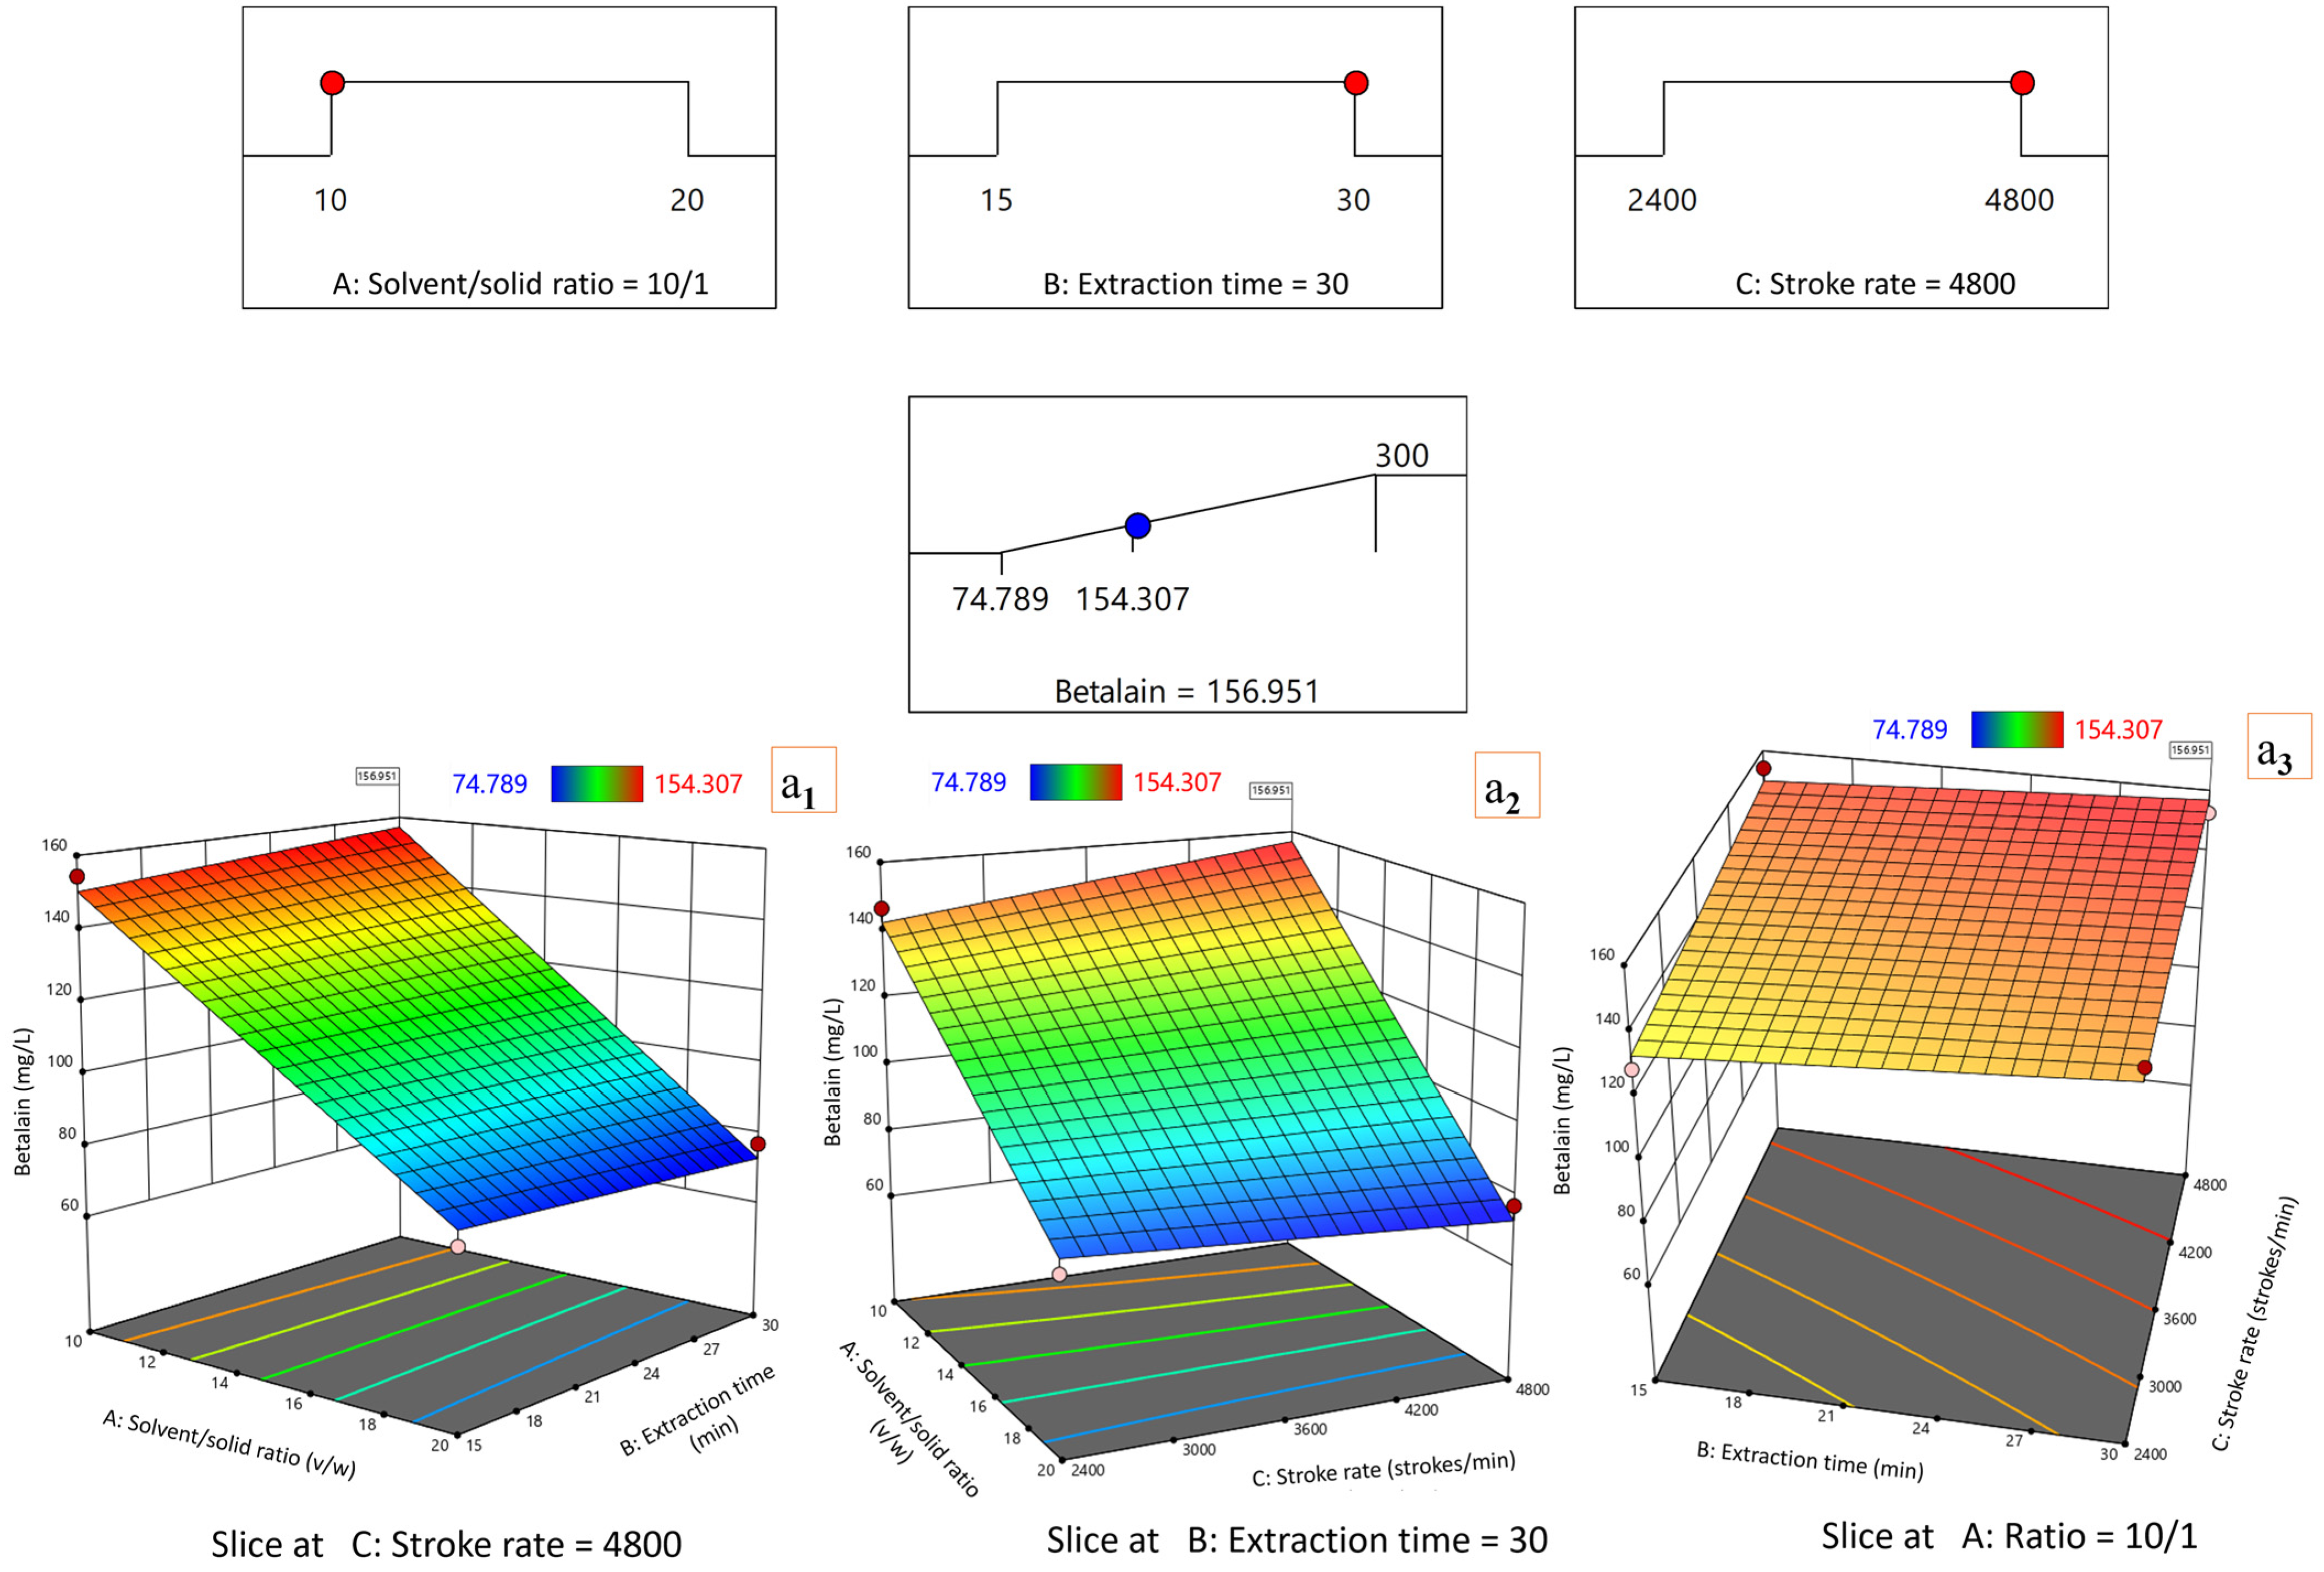
In BBE experimental runs, betalain recovery depended primarily on maintaining a low solvent-to-solid ratio while applying strong bead-mediated disruption. The predicted optimum was 10/1 solvent/solid ratio, 30 min, and 4800 strokes/min, with a modeled betalain concentration of 156.951 mg/L (Figure 18).
The response decreased when the solvent/solid ratio increased from 10/1 to 20/1, a trend that appeared consistently in the paired surfaces. In practical terms, this suggests that additional solvent did not extract enough extra pigment to offset dilution. By contrast, increasing the stroke rate clearly improved the response, especially at 10/1, confirming the contribution of bead impact to pigment release.
Extraction time had a supportive but secondary role. The highest predicted values were located close to 30 min, particularly when maximum stroke rate was applied, but the time-related slope was milder than that produced by solvent/solid ratio or mechanical intensity. This indicates that matrix concentration and mechanical disruption intensity shaped the response more strongly than duration alone. The optimized BBE protocol for betalain efficient extraction can therefore be summarized as low dilution, long exposure, and maximum stroke rate.

3.6.3. Multi-Response Optimization of Antioxidant Activity (FRAP, DPPH, and ABTS) by BBE

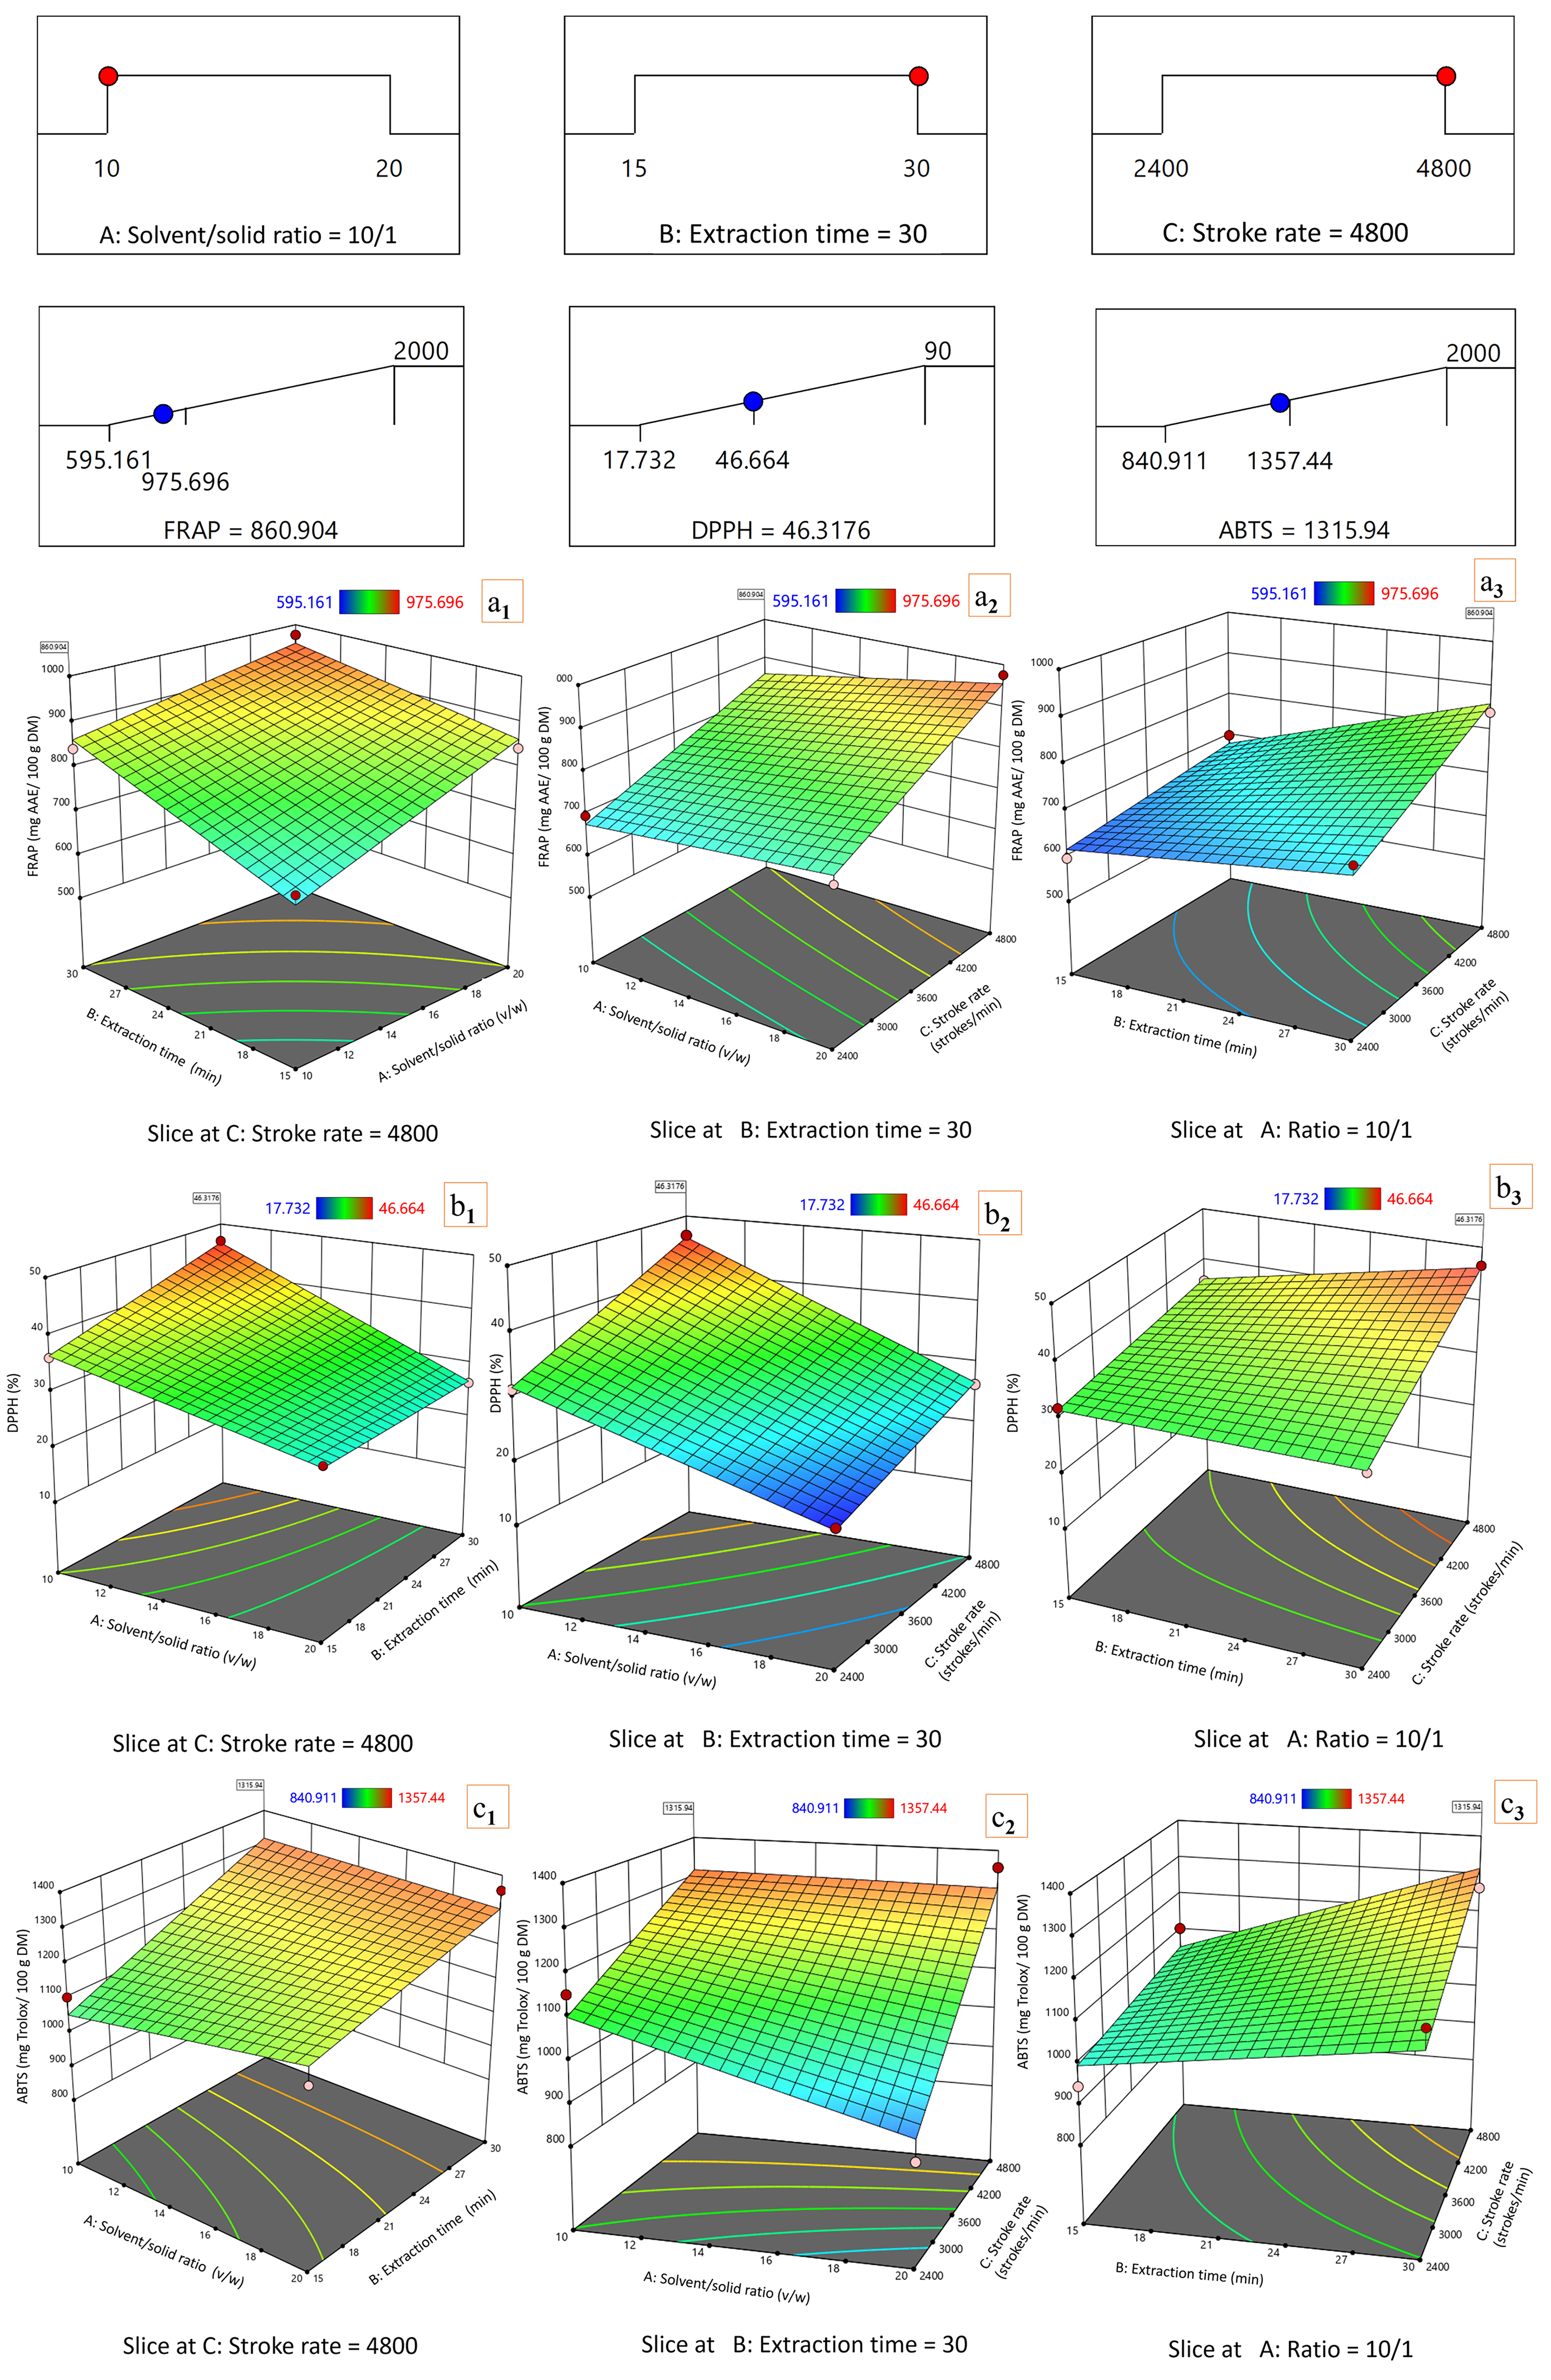
The antioxidant profile obtained by BBE was optimized at 10/1 solvent/solid ratio, 30 min, and 4800 strokes/min (Figure 19). The model predicted values of FRAP = 860.904 mg AAE/100 g DM, DPPH = 46.3176% and ABTS = 1315.94 mg Trolox Eq./100 g DM under these conditions.
FRAP activity showed the most complex behavior of the three assays. Although its modeled interval was broad (595.161–975.696 mg AAE/100 g DM), the multi-response optimum did not coincide with the absolute FRAP maximum. The surfaces indicate that time and stroke rate generally improved reducing power, while the solvent/solid ratio influenced the response differently depending on the paired factor.
DPPH radical-scavenging activity provided the clearest argument for the selected BBE setting. Predicted inhibition ranged from 17.732 to 46.664%, and the optimized value was very close to the upper limit of this interval. The strongest increase occurred when extraction time and stroke rate were raised, especially at the lower solvent/solid ratio, highlighting the role of BBE mediated tissue disruption in releasing radical-scavenging constituents.
ABTS activity behaved similarly to the DPPH one, with the optimized value lying close to the modeled maximum (840.911–1357.44 mg Trolox Eq./100 g DM). The favorable region was again associated with 30 min and 4800 strokes/min, particularly under low dilution, indicating efficient recovery of compounds active in electron-transfer and radical-quenching reactions.
Thus, antioxidant optimization by BBE was mainly shaped by DPPH and ABTS values, whereas FRAP activity introduced a partial compromise. The 10/1 ratio, 30 min, 4800 strokes/min are therefore appropriate when the aim is to obtain a concentrated extract with strong overall antioxidant performance under the tested BBE conditions.

4. Discussion

This study provides an integrated comparative assessment of antioxidant content and activity of P. americana fruit extracts considering four different extraction strategies—ME, UAE, TE and BBE—for recovering TPC, TFC, TTC, betalain pigments, and antioxidant activity. This plant matrix is relevant because previous studies have reported the presence of biologically active phenolic compounds, flavonoids, and betalain pigments in its fruits, together with antioxidant and other biological activities that support its controlled valorization as a source of natural extracts of potential pharmacological interest [9,10,11]. This study was based on frequently applied assays, which are useful for a comparative screening, such as Folin–Ciocalteu, aluminum chloride, vanillin–HCl, FRAP, DPPH, and ABTS. These methods provide the total content of polyphenolic-related compounds, flavonoids, condensed tannins, and antioxidant activity, respectively, and may be influenced by matrix effects or by other reducing/reactive compounds present in plant extracts. The polyphenolic profile by HPLC of the hydroethanolic extract of P. americana fruits has already been reported in our previous research [10], which confirmed the presence of several phenolic acids and flavonoids in this plant matrix.
The results obtained here show that extraction efficiency was not governed by a single universal operating condition, but rather by a response-specific balance between solvent/solid ratio, extraction time, and method-dependent intensity parameters, which is consistent with the general principle that recovery of plant phenolics and pigments depends strongly on both matrix properties and process conditions [2,3,4,14].
A first important observation is that phenolic-related responses, especially TPC, TFC, TTC, and antioxidant activity as measured by FRAP and ABTS, generally benefited from longer extraction time and improved solvent availability. This pattern was particularly evident for ME, BBE, and TE, where the 30 min conditions and, in several cases, the 20/1 solvent/solid ratio increased the recovery of phenolic-rich fractions. Such behavior is compatible with the diffusion-controlled nature of solid–liquid extraction, where longer contact time and a higher solvent volume may improve mass transfer and solubilization of phenolic constituents from plant tissues [2,3,4]. However, the magnitude of this effect differed among techniques, indicating that solvent availability alone did not fully determine the extraction efficiency. Instead, mechanical or acoustic disruption acted together with solvent loading, supporting the need for method-specific optimization rather than direct transfer of a single extraction protocol from one technique to another [3,4,14].
Among the investigated modern techniques, UAE showed a particularly favorable balance between high TFC recovery and reproducibility. UAE is known to promote extraction through acoustic cavitation, which can increase tissue disruption, solvent penetration, and release of intracellular metabolites [14]. In this study, UAE performed especially well for TFC and also provided relatively consistent FRAP and ABTS responses under optimized or high-intensity conditions. This suggests that UAE was efficient in releasing flavonoid- and phenolic-associated compounds from P. americana fruit, while maintaining comparatively stable extraction profiles. Nevertheless, the same UAE conditions were not optimal for recovering high amounts of betalains, confirming that acoustic intensification can be advantageous for some phytochemical classes but less suitable for more labile pigment fractions [7,14,38,39,40].
TE also produced strong phenolic and antioxidant responses, especially when high rotor speed was combined with longer extraction time and higher solvent availability. The optimized conditions for TPC, TFC, and TTC under TE were found to be 20/1 solvent/solid ratio, 30 min and 12,000 rpm, indicating that rotor–stator homogenization improved extraction when mechanical disruption and solvent capacity acted together. This is consistent with the expected role of high-shear homogenization in reducing particle size, increasing contact surface and accelerating the transfer of soluble metabolites into the extraction solvent [3,4]. However, the optimal antioxidant activity for TE was located at an intermediate solvent/solid ratio, rather than at the maximum tested ratio. This indicates that antioxidant activity reflected not only compound release, but also the concentration of antioxidant-active compounds in the final extract and the different chemical sensitivities of the assays used [22,23,24,25,36,37].
BBE showed similarly response-dependent behavior. For phenolic-related responses, the best profile was obtained when solvent availability, extraction time, and stroke rate were maximized, indicating that bead-mediated disruption facilitated the release of TPC, TFC, and TTC. In contrast, the optimal antioxidant activity was shifted toward a lower solvent/solid ratio, 30 min, and maximum stroke rate, mainly because DPPH and ABTS activities benefited from a more concentrated extract under high mechanical input. This divergence suggests that BBE may be useful when concentrated radical-scavenging extracts are desired, but that the operational target should be defined before selecting the final protocol. Such response-dependent behavior is expected in plant extraction studies because different phytochemical classes may differ in cell localization, polarity, solubility, and sensitivity to mechanical stress [3,4,22,23,24,25].
ME showed apparently simple but important behavior. Although it is a conventional technique with slower mass transfer, it produced high values for several responses when moderate heating and longer extraction time were applied. The highest betalain recovery by ME was obtained at 10/1 solvent/solid ratio, 30 min, and 60 °C, while antioxidant responses, especially FRAP and ABTS activities, were favored by 20/1 solvent/solid ratio, 30 min, and 60 °C. This confirms that ME can remain effective for P. americana fruits when extraction temperature, time, and solvent loading are properly controlled. At the same time, several ME responses showed wider dispersion, suggesting that conventional extraction may require closer standardization of mixing, temperature, and solvent/solid ratio to ensure batch-to-batch reproducibility [3,4].
The behavior of betalains was clearly distinct from that of the phenolic-related responses. Across methods, betalain-rich profiles were favored mainly by lower solvent/solid ratios, and in some cases by less aggressive or shorter processing conditions. This result is chemically plausible because betalains are water-soluble nitrogen-containing pigments with high antioxidant relevance, but they are also sensitive to processing variables such as temperature, pH, oxygen, light, and metal ions [7,38,39,40]. The lower betalain concentrations observed at a 20/1 solvent/solid ratio indicate that increasing solvent volume did not generate a proportional increase in pigment release and may have mainly diluted the measured pigment concentration. This is particularly relevant from an applied perspective, because pigment-rich extracts are often evaluated not only by total recovered mass, but also by color intensity and concentration in the final extract [7,11,38,39,40].
The antioxidant responses should be interpreted as complementary rather than interchangeable, because DPPH, ABTS, and FRAP methods reflect partially different reaction mechanisms. FRAP mainly estimates reducing power through electron-transfer reactions, whereas ABTS can respond to a broader spectrum of antioxidant compounds, and DPPH is influenced by radical-scavenging efficiency, solvent environment, and compound accessibility [22,23,24,25,36,37]. Therefore, differences among the optimized responses should not be considered inconsistent, but rather indicative of the chemically diverse antioxidant profile of P. americana fruit extracts. Phenolic compounds may contribute substantially to reducing-power responses through electron-donating mechanisms, while betalain pigments, including betanin-related structures, may also participate in radical-scavenging activity owing to their conjugated molecular systems [7,40,41,42,43,44]. From a process-optimization perspective, this suggests that extraction conditions optimized for antioxidant activity may not fully overlap with those optimized for betalain recovery or individual phytochemical groups.
From a process-optimization perspective, the 23 factorial design provided a useful screening framework for identifying dominant effects and practical operating conditions for an efficient recovery of valuable compounds and optimal antioxidant activity. Two-level factorial designs are appropriate for evaluating main effects and interactions with a limited number of experimental runs, especially in preliminary optimization studies where the main objective is to point the process toward a favorable experimental domain [15,16,32]. However, because the design did not include center points or axial points, curvature could not be directly estimated, and the response surfaces should be interpreted as first-order trend models within the tested experimental limits [15,32]. Consequently, the best-performing conditions located at the boundaries of the design space should not be treated as definitive optimal parameters beyond the investigated factor ranges [15,16,32].
The scientific and practical relevance of the study lies in the possibility of selecting extraction conditions according to the intended use of the final bioextract. For betalain-rich extracts, ME at a 10/1 solvent/solid ratio provided the most favorable overall profile, combining high pigment concentration with good reproducibility. For phenolic- and flavonoid-rich extracts, intensified techniques, particularly UAE, BBE, and TE, were more advantageous under longer extraction and higher-intensity conditions: a solvent/solid ratio of 20/1 (v/w), an extraction time of 30 min, and technique-specific intensity parameters of 70% amplitude for UAE, 4800 strokes/min for BBE, and 12,000 rpm rotor speed for TE. For antioxidant-active extracts, the optimal protocol depended on the applied assay, with FRAP and ABTS antioxidant activity assays generally tracking phenolic-rich fractions, while DPPH radical-scavenging activity was more closely linked to concentrated pigment- or flavonoid-associated responses. This indicates that future applications should define the target function before extraction: natural colorant production, phenolic enrichment, antioxidant activity, or a compromise among these endpoints [7,9,37,38,39,40,41,42,43,44].
Also, P. americana fruits may contain potentially toxic constituents, including saponins; therefore, their valorization should be considered with caution. This study focused on extraction and did not include saponin quantification, cytotoxicity, hemolysis, or in vivo safety testing. Consequently, the obtained extracts should not be regarded as directly suitable for food or pharmaceutical use without further toxicological validation. Future studies should include targeted profiling of toxic constituents and appropriate safety assessment before practical applications.
Overall, this study confirms that P. americana fruits represent a chemically valuable but method-sensitive plant matrix. Moreover, as this plant is an invasive one, and its berries are highly accessible, the plant could be converted from an ecological threat into an economically valuable source of useful compounds, as described in detail for the other 35 invasive plant species producing berry-like fruits in the review paper of Oancea [9]. The extraction strategy must be adapted to the target response, because the conditions that maximize betalain concentration are not necessarily the same as those that maximize phenolic recovery or overall antioxidant activity. By integrating factorial design, z-score profiling, inter-method and intra-method comparisons, and multi-response optimization, this study provides a practical foundation for the standardized recovery of antioxidant-rich and pigment-containing extracts from P. americana fruits.

5. Conclusions

This study demonstrated that the extraction of bioactive compounds from Phytolacca americana fruits is strongly dependent on the interaction between extraction method, solvent/solid ratio, extraction time/temperature, and method-specific operational parameters. The results showed that no single extraction condition maximized all responses simultaneously, confirming that optimization must be performed according to the targeted phytochemical or functional endpoint.
For betalain recovery, lower solvent/solid ratios were consistently more favorable, with ME at a 10/1 solvent/solid ratio for 30 min at 60 °C providing the best overall pigment profile. This condition is relevant for applications where P. americana fruits are considered as a potential source of natural colorants, although pigment stability and safety-related validation remain necessary before applied use [7,11,38,39,40].
For phenolic-related responses, modern extraction methods generally performed better when longer extraction time, higher solvent availability, and stronger mechanical or acoustic input were combined. UAE was particularly efficient and reproducible for TFC recovery, while TE and BBE were advantageous for TPC-rich and TTC-associated profiles under high-intensity conditions. These findings support the use of controlled intensified extraction when the main objective is to obtain phenolic- and flavonoid-enriched extracts [3,4,14]. The results regarding the antioxidant activity confirmed that DPPH, FRAP, and ABTS methods should be interpreted as complementary rather than interchangeable assays. FRAP and ABTS antioxidant activity were mainly associated with phenolic-rich fractions, whereas DPPH scavenging activity showed closer alignment with pigment- or flavonoid-associated responses depending on the extraction method. This indicates that antioxidant activity optimization should be based on a multi-assay approach rather than on a single antioxidant endpoint [22,23,24,25,36,37].
The factorial design used in this study provided a useful screening model for identifying practical extraction conditions, but the absence of center and axial points limits the interpretation of the response surfaces to first-order trends within the tested experimental domain [15,16,32]. Future work should include second-order response surface designs, chromatographic profiling of individual compounds, pigment stability testing, and safety assessment of the optimized extracts [3,4,7,15,16,32,38,39,40].
In conclusion, P. americana fruits can be regarded as a promising source of antioxidant-active and pigment-containing extracts, provided that extraction conditions are selected according to the intended application. These results offer a methodological basis for the controlled valorization of this plant matrix and support further studies aimed at extract standardization, formulation stability and scale-up.


Supplementary Materials

The following supporting information can be downloaded at: https://www.mdpi.com/article/10.3390/app16146909/s1, Table S1: Experimental and predicted values of phytochemical responses in P. americana fruit extracts obtained by different ME conditions; Table S2: Experimental and predicted values of phytochemical responses in P. americana fruit extracts obtained by different UAE conditions; Table S3: Experimental and predicted values of phytochemical responses in P. americana fruit extracts obtained by different TE conditions; Table S4: Experimental and predicted values of phytochemical responses in P. americana fruit extracts obtained by different BBE conditions; Table S5: Model adequacy statistics for the fitted first-order factorial/RSM models.

Author Contributions

Conceptualization, S.O. and L.-F.P.; methodology, S.O. and L.-F.P.; validation, S.O.; investigation, L.-F.P. and S.O.; data curation, L.-F.P. and S.O.; writing—original draft preparation, L.-F.P.; writing—review and editing, S.O.; supervision, S.O.; project administration, S.O. All authors have read and agreed to the published version of the manuscript.

Funding

This research received no external funding.

Institutional Review Board Statement

Not applicable.

Informed Consent Statement

Not applicable.

Data Availability Statement

All the data are contained within the article. Further inquiries can be directed to the corresponding author.

Conflicts of Interest

The authors declare no conflicts of interest.

References

  1. Dai, J.; Mumper, R.J. Plant Phenolics: Extraction, Analysis and Their Antioxidant and Anticancer Properties. Molecules 2010, 15, 7313–7352. [Google Scholar] [CrossRef] [PubMed]
  2. Alara, O.R.; Abdurahman, N.H.; Ukaegbu, C.I. Extraction of Phenolic Compounds: A Review. Curr. Res. Food Sci. 2021, 4, 200–214. [Google Scholar] [CrossRef] [PubMed]
  3. Azmir, J.; Zaidul, I.S.M.; Rahman, M.M.; Sharif, K.M.; Mohamed, A.; Sahena, F.; Jahurul, M.H.A.; Ghafoor, K.; Norulaini, N.A.N.; Omar, A.K.M. Techniques for Extraction of Bioactive Compounds from Plant Materials: A Review. J. Food Eng. 2013, 117, 426–436. [Google Scholar] [CrossRef]
  4. Zhang, Q.-W.; Lin, L.-G.; Ye, W.-C. Techniques for Extraction and Isolation of Natural Products: A Comprehensive Review. Chin. Med. 2018, 13, 20. [Google Scholar] [CrossRef] [PubMed]
  5. Fraga-Corral, M.; García-Oliveira, P.; Pereira, A.G.; Lourenço-Lopes, C.; Jimenez-Lopez, C.; Prieto, M.A.; Simal-Gandara, J. Technological Application of Tannin-Based Extracts. Molecules 2020, 25, 614. [Google Scholar] [CrossRef] [PubMed]
  6. Rodríguez-Mena, A.; Ochoa-Martínez, L.A.; González-Herrera, S.M.; Rutiaga-Quiñones, O.M.; González-Laredo, R.F.; Olmedilla-Alonso, B. Natural Pigments of Plant Origin: Classification, Extraction and Application in Foods. Food Chem. 2023, 398, 133908. [Google Scholar] [CrossRef] [PubMed]
  7. Sadowska-Bartosz, I.; Bartosz, G. Biological Properties and Applications of Betalains. Molecules 2021, 26, 2520. [Google Scholar] [CrossRef] [PubMed]
  8. Zeb, A. Concept, Mechanism, and Applications of Phenolic Antioxidants in Foods. J. Food Biochem. 2020, 44, e13394. [Google Scholar] [CrossRef] [PubMed]
  9. Oancea, S. Occurrence, Pharmacological Properties, Toxic Effects, and Possibilities of Using Berries from Selected Invasive Plants. Antioxidants 2025, 14, 399. [Google Scholar] [CrossRef] [PubMed]
  10. Popovici, L.-F.; Brinza, I.; Gatea, F.; Badea, G.I.; Vamanu, E.; Oancea, S.; Hritcu, L. Enhancement of Cognitive Benefits and Anti-Anxiety Effects of Phytolacca americana Fruits in a Zebrafish (Danio rerio) Model of Scopolamine-Induced Memory Impairment. Antioxidants 2025, 14, 97. [Google Scholar] [CrossRef] [PubMed]
  11. Veleșcu, I.D.; Crivei, I.C.; Balint, A.B.; Arsenoaia, V.N.; Robu, A.D.; Stoica, F.; Rațu, R.N. Valorization of Betalain Pigments Extracted from Phytolacca americana L. Berries as Natural Colorant in Cheese Formulation. Agriculture 2025, 15, 86. [Google Scholar] [CrossRef]
  12. Luksta, I.; Spalvins, K. Methods for Extraction of Bioactive Compounds from Products: A Review. Environ. Clim. Technol. 2023, 27, 422–437. [Google Scholar] [CrossRef]
  13. Naviglio, D.; Scarano, P.; Ciaravolo, M.; Gallo, M. Rapid Solid-Liquid Dynamic Extraction (RSLDE): A Powerful and Greener Alternative to the Latest Solid-Liquid Extraction Techniques. Foods 2019, 8, 245. [Google Scholar] [CrossRef] [PubMed]
  14. Chemat, F.; Rombaut, N.; Sicaire, A.G.; Meullemiestre, A.; Fabiano-Tixier, A.S.; Abert-Vian, M. Ultrasound-Assisted Extraction of Food and Natural Products: Mechanisms, Techniques, Combinations, Protocols and Applications. Ultrason. Sonochem. 2017, 34, 540–560. [Google Scholar] [CrossRef] [PubMed]
  15. Myers, R.H.; Montgomery, D.C.; Anderson-Cook, C.M. Response Surface Methodology: Process and Product Optimization Using Designed Experiments, 4th ed.; John Wiley & Sons: Hoboken, NJ, USA, 2016; Available online: https://www.wiley.com/en-hk/Response%2BSurface%2BMethodology%3A%2BProcess%2Band%2BProduct%2BOptimization%2BUsing%2BDesigned%2BExperiments%2C%2B4th%2BEdition-p-9781118916018 (accessed on 6 June 2026).
  16. Montgomery, D.C. Design and Analysis of Experiments, 8th ed.; John Wiley & Sons: Hoboken, NJ, USA, 2012; Available online: https://books.google.com/books/about/Design_and_Analysis_of_Experiments_8th_E.html?id=XQAcAAAAQBAJ (accessed on 6 June 2026).
  17. Martinez, R.M.; Melo, C.P.B.; Pinto, I.C.; Mendes-Pierotti, S.; Vignoli, J.A.; Verri, W.A.; Casagrande, R. Betalains: A Narrative Review on Pharmacological Mechanisms Supporting the Nutraceutical Potential Towards Health Benefits. Foods 2024, 13, 3909. [Google Scholar] [CrossRef] [PubMed]
  18. Singleton, V.L.; Rossi, J.A. Colorimetry of Total Phenolics with Phosphomolybdic-Phosphotungstic Acid Reagents. Am. J. Enol. Vitic. 1965, 16, 144–158. [Google Scholar] [CrossRef]
  19. Kumar, S.; Kumar, D.; Manjusha; Saroha, K.; Singh, N.; Vashishta, B. Antioxidant and Free Radical Scavenging Potential of Citrullus colocynthis (L.) Schrad. Methanolic Fruit Extract. Acta Pharm. 2008, 58, 215–221. [Google Scholar] [CrossRef] [PubMed]
  20. Price, M.L.; Van Scoyoc, S.; Butler, L.G. A Critical Evaluation of the Vanillin Reaction as an Assay for Tannin in Sorghum Grain. J. Agric. Food Chem. 1978, 26, 1214–1218. [Google Scholar] [CrossRef]
  21. Pérez-Loredo, M.G.; García-Ochoa, F.; Barragán-Huerta, B.E. Comparative Analysis of Betalain Content in Stenocereus stellatus Fruits and Other Cactus Fruits Using Principal Component Analysis. Int. J. Food Prop. 2016, 19, 326–338. [Google Scholar] [CrossRef]
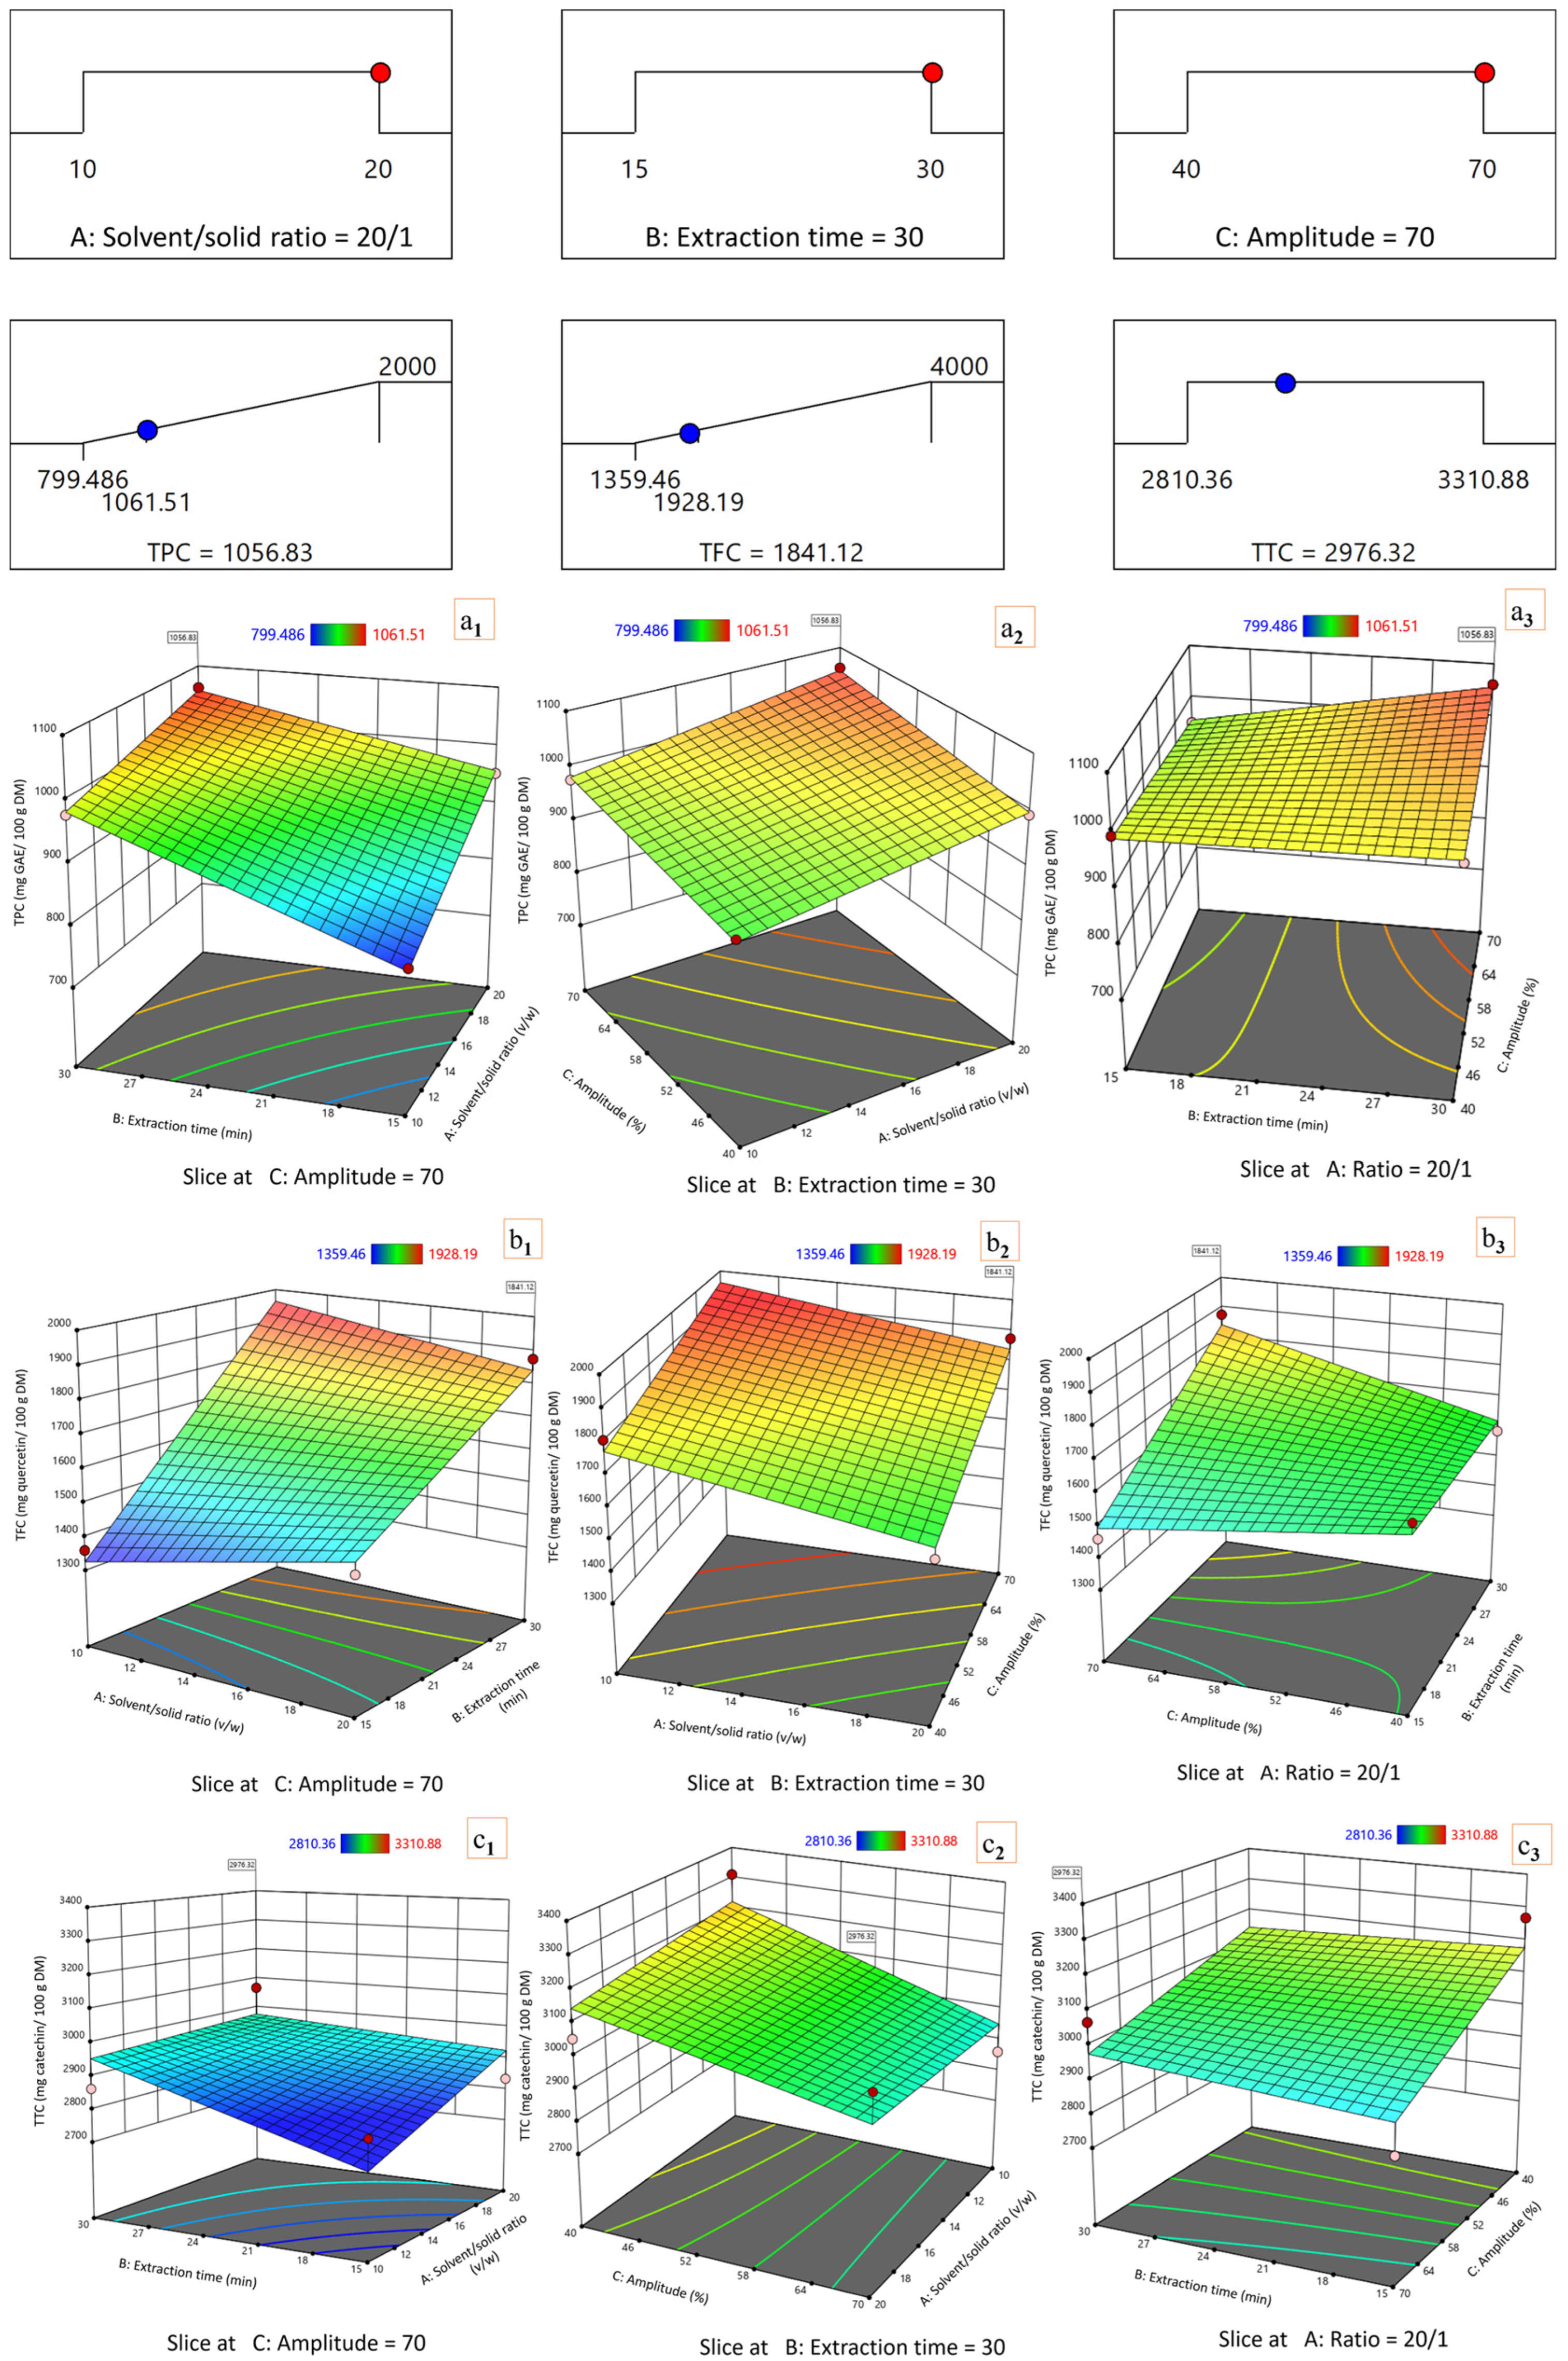
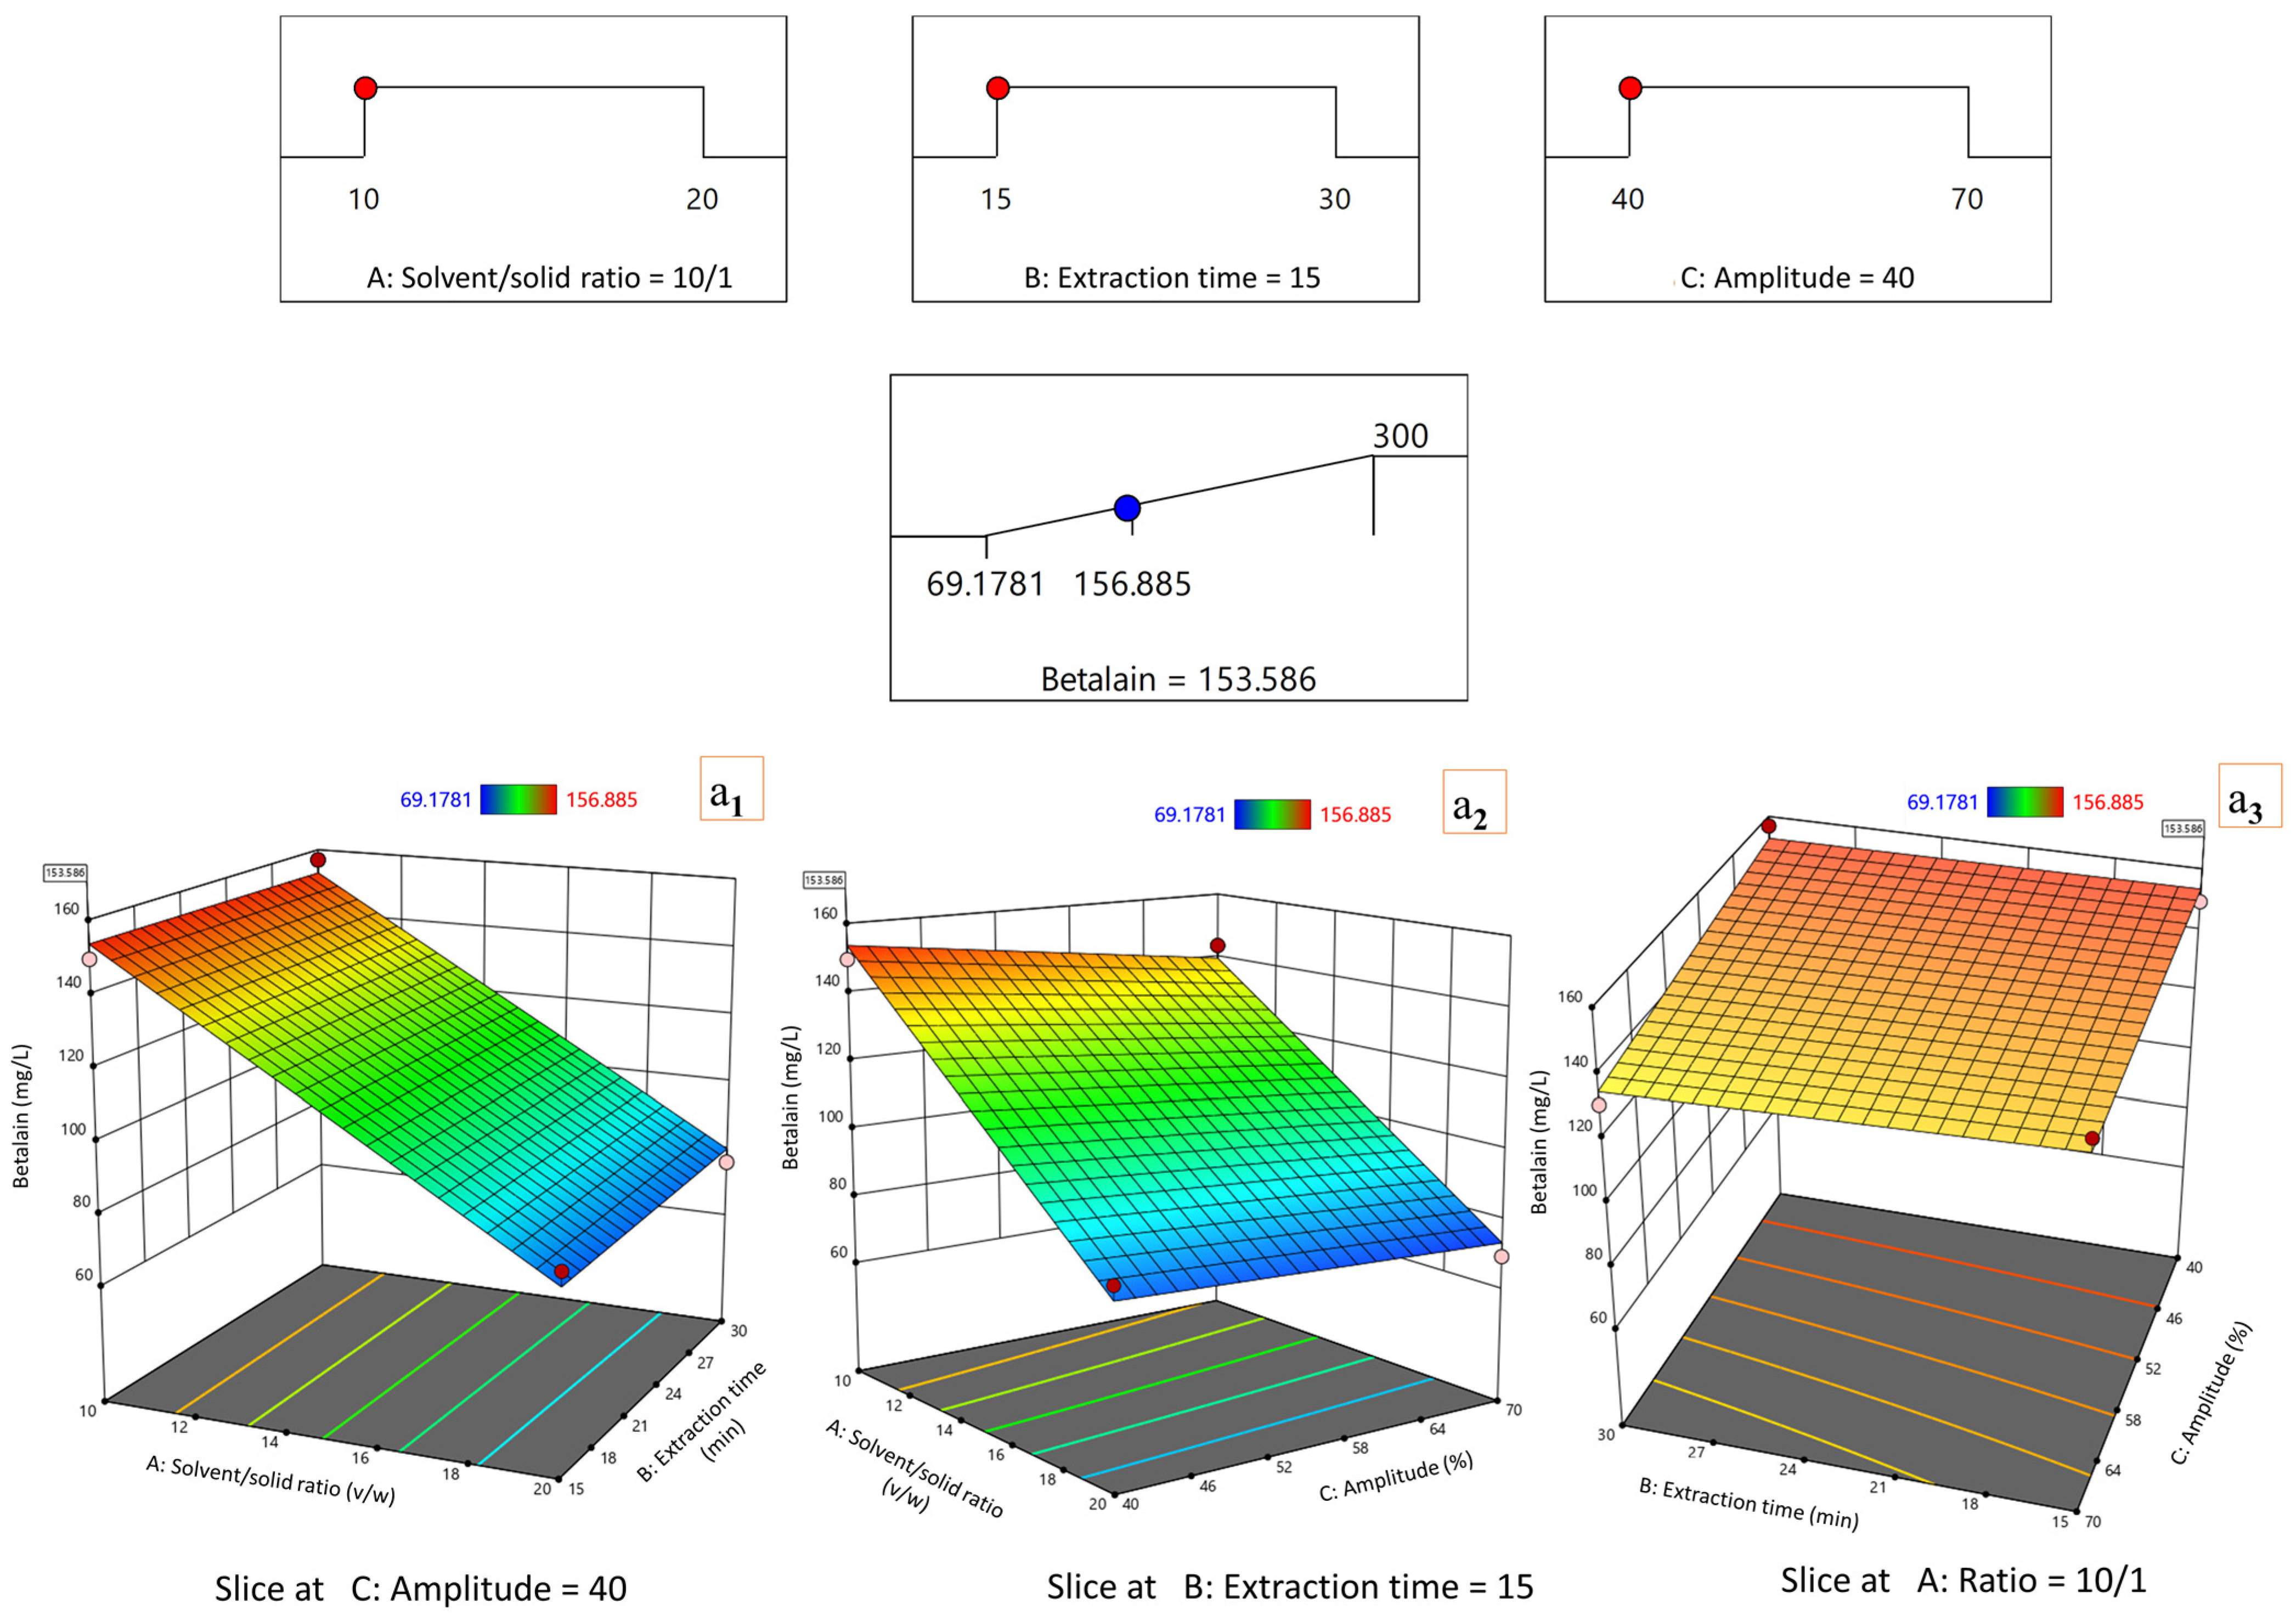
  22. Benzie, I.F.F.; Strain, J.J. The Ferric Reducing Ability of Plasma as a Measure of “Antioxidant Power”: The FRAP Assay. Anal. Biochem. 1996, 239, 70–76. [Google Scholar] [CrossRef] [PubMed]
  23. Brand-Williams, W.; Cuvelier, M.E.; Berset, C. Use of a Free Radical Method to Evaluate Antioxidant Activity. LWT Food Sci. Technol. 1995, 28, 25–30. [Google Scholar] [CrossRef]
  24. Re, R.; Pellegrini, N.; Proteggente, A.; Pannala, A.; Yang, M.; Rice-Evans, C. Antioxidant Activity Applying an Improved ABTS Radical Cation Decolorization Assay. Free Radic. Biol. Med. 1999, 26, 1231–1237. [Google Scholar] [CrossRef] [PubMed]
  25. Rumpf, J.; Burger, R.; Schulze, M. Statistical Evaluation of DPPH, ABTS, FRAP, and Folin-Ciocalteu Assays to Assess the Antioxidant Capacity of Lignins. Int. J. Biol. Macromol. 2023, 233, 123470. [Google Scholar] [CrossRef] [PubMed]
  26. Shapiro, S.S.; Wilk, M.B. An Analysis of Variance Test for Normality (Complete Samples). Biometrika 1965, 52, 591–611. [Google Scholar] [CrossRef]
  27. Levene, H. Robust Tests for Equality of Variances. In Contributions to Probability and Statistics: Essays in Honor of Harold Hotelling; Olkin, I., Ed.; Stanford University Press: Stanford, CA, USA, 1960; pp. 278–292. Available online: https://www.scirp.org/reference/ReferencesPapers?ReferenceID=2363177 (accessed on 6 June 2026).
  28. Tukey, J.W. Comparing Individual Means in the Analysis of Variance. Biometrics 1949, 5, 99–114. [Google Scholar] [CrossRef]
  29. Kruskal, W.H.; Wallis, W.A. Use of Ranks in One-Criterion Variance Analysis. J. Am. Stat. Assoc. 1952, 47, 583–621. [Google Scholar] [CrossRef]
  30. Dunn, O.J. Multiple Comparisons Using Rank Sums. Technometrics 1964, 6, 241–252. [Google Scholar] [CrossRef]
  31. Holm, S. A Simple Sequentially Rejective Multiple Test Procedure. Scand. J. Stat. 1979, 6, 65–70. [Google Scholar]
  32. Anderson-Cook, C.M.; Borror, C.M.; Montgomery, D.C. Response Surface Design Evaluation and Comparison. J. Stat. Plan. Inference 2009, 139, 629–641. [Google Scholar] [CrossRef]
  33. Green, D.J.; Campbell, M.J.; Koutoumanou, E. When Means and Standard Deviations Are an Incomplete Summary of a Continuous Variable: Problems, Solutions, and Utilising the Reference Ranges to Check Normality. BMJ Med. 2026, 5, e001796. [Google Scholar] [CrossRef] [PubMed]
  34. Mansournia, M.A.; Collins, G.S.; Nielsen, R.O.; Nazemipour, M.; Jewell, N.P.; Altman, D.G.; Campbell, M.J. A CHecklist for Statistical Assessment of Medical Papers (the CHAMP Statement): Explanation and Elaboration. Br. J. Sports Med. 2021, 55, 1009–1017. [Google Scholar] [CrossRef] [PubMed]
  35. Tukey, J.W. Exploratory Data Analysis; Addison-Wesley: Reading, MA, USA, 1977; Available online: https://archive.org/details/exploratorydataa0000tuke_7616 (accessed on 6 June 2026).
  36. Apak, R.; Özyürek, M.; Güçlü, K.; Çapanoğlu, E. Antioxidant Activity/Capacity Measurement. 1. Classification, Physicochemical Principles, Mechanisms, and Electron Transfer Based Assays. J. Agric. Food Chem. 2016, 64, 997–1027. [Google Scholar] [CrossRef] [PubMed]
  37. Apak, R.; Özyürek, M.; Güçlü, K.; Çapanoğlu, E. Antioxidant Activity/Capacity Measurement. 2. Hydrogen Atom Transfer-Based, Mixed-Mode Electron Transfer/Hydrogen Atom Transfer, and Lipid Peroxidation Assays. J. Agric. Food Chem. 2016, 64, 1028–1045. [Google Scholar] [CrossRef] [PubMed]
  38. Herbach, K.M.; Stintzing, F.C.; Carle, R. Betalain Stability and Degradation: Structural and Chromatic Aspects. J. Food Sci. 2006, 71, R41–R50. [Google Scholar] [CrossRef]
  39. Khan, M.I. Stabilization of Betalains: A Review. Food Chem. 2016, 197, 1280–1285. [Google Scholar] [CrossRef] [PubMed]
  40. Belhadj Slimen, I.; Najar, T.; Abderrabba, M. Chemical and Antioxidant Properties of Betalains. J. Agric. Food Chem. 2017, 65, 675–689. [Google Scholar] [CrossRef] [PubMed]
  41. Rice-Evans, C.A.; Miller, N.J.; Paganga, G. Structure-Antioxidant Activity Relationships of Flavonoids and Phenolic Acids. Free Radic. Biol. Med. 1996, 20, 933–956. [Google Scholar] [CrossRef] [PubMed]
  42. Heim, K.E.; Tagliaferro, A.R.; Bobilya, D.J. Flavonoid Antioxidants: Chemistry, Metabolism and Structure-Activity Relationships. J. Nutr. Biochem. 2002, 13, 572–584. [Google Scholar] [CrossRef] [PubMed]
  43. Esatbeyoglu, T.; Wagner, A.E.; Motafakkerazad, R.; Nakajima, Y.; Matsugo, S.; Rimbach, G. Free Radical Scavenging and Antioxidant Activity of Betanin: Electron Spin Resonance Spectroscopy Studies and Studies in Cultured Cells. Food Chem. Toxicol. 2014, 73, 119–126. [Google Scholar] [CrossRef] [PubMed]
  44. Gandía-Herrero, F.; Escribano, J.; García-Carmona, F. Biological Activities of Plant Pigments Betalains. Crit. Rev. Food Sci. Nutr. 2016, 56, 937–945. [Google Scholar] [CrossRef] [PubMed]
Figure 1. Z-score–based comparative profile of phytochemical responses obtained in P. americana fruit extracts by ME.
Applsci 16 06909 g001
Figure 2. Z-score–based comparative profile of phytochemical responses obtained in P. americana fruit extracts by UAE.
Applsci 16 06909 g002
Figure 3. Z-score–based comparative profile of phytochemical responses obtained in P. americana fruit extracts by TE.
Applsci 16 06909 g003
Figure 4. Z-score–based comparative profile of phytochemical responses obtained in P. americana fruit extracts by BBE.
Applsci 16 06909 g004
Figure 5. The box-and-whisker plots for the influence of extraction methods classified (a) by time (min) and (b) by solvent/solid ratio, using pooled data from the full 23 factorial design, including all tested levels of the remaining method-specific operating factor, on [1.] (TPC); [2.] (TFC) and [3.] (TTC) of P. americana fruit extracts.
Applsci 16 06909 g005
Figure 6. The box-and-whisker plots for the influence of extraction methods classified (a) by time (min) and (b) by solvent/solid ratio, using pooled data from the full 23 factorial design, including all tested levels of the remaining method-specific operating factor, on betalains of P. americana fruit extracts.
Applsci 16 06909 g006
Figure 7. The box-and-whisker plots for the influence of extraction methods classified (a) by time (min) and (b) by solvent/solid ratio, using pooled data from the full 23 factorial design, including all tested levels of the remaining method-specific operating factor, on [1.] FRAP antioxidant activity; [2.] DPPH scavenging activity and [3.] ABTS antioxidant activity of P. americana fruit extracts.
Applsci 16 06909 g007
Figure 8. Three-dimensional response surface plots for TPC, TFC, and TTC of P. americana fruit extracts obtained by ME as a function of solvent/solid ratio, extraction time and temperature. (a1) Effect of solvent/solid ratio and extraction time on TPC at 60 °C; (a2) effect of solvent/solid ratio and temperature on TPC at 30 min; (a3) effect of extraction time and temperature on TPC at solvent/solid ratio of 10/1. (b1) Effect of solvent/solid ratio and extraction time on TFC at 60 °C; (b2) effect of solvent/solid ratio and temperature on TFC at 30 min; (b3) effect of extraction time and temperature on TFC at solvent/solid ratio of 10/1. (c1) Effect of solvent/solid ratio and extraction time on TTC at 60 °C; (c2) effect of solvent/solid ratio and temperature on TTC at 30 min; (c3) effect of extraction time and temperature on TTC at solvent/solid ratio of 10/1. The (upper) panels show the optimization ramp, where red markers indicate the selected optimal levels of the independent variables and blue markers indicate the predicted response values.
Applsci 16 06909 g008
Figure 9. Three-dimensional response surface plots for betalain content of P. americana fruit extracts obtained by ME, as function of solvent/solid ratio, extraction time and temperature. (a1) Effect of solvent/solid ratio and extraction time on betalain content at 60 °C; (a2) effect of solvent/solid ratio and temperature on betalain content at 30 min; (a3) effect of extraction time and temperature on betalain content at solvent/solid ratio of 10/1. The (upper) panels show the optimization ramp, where red markers indicate the selected optimal levels of the independent variables and blue markers indicate the predicted response values.
Applsci 16 06909 g009
Figure 10. Three-dimensional response surface plots for antioxidant activity, expressed by FRAP, DPPH, and ABTS, of P. americana fruit extracts obtained by ME as a function of solvent/solid ratio, extraction time and temperature. (a1) Effect of solvent/solid ratio and extraction time on FRAP at 60 °C; (a2) effect of solvent/solid ratio and temperature on FRAP at 30 min; (a3) effect of extraction time and temperature on FRAP at solvent/solid ratio of 20/1. (b1) Effect of solvent/solid ratio and extraction time on DPPH at 60 °C; (b2) effect of solvent/solid ratio and temperature on DPPH at 30 min; (b3) effect of extraction time and temperature on DPPH at solvent/solid ratio of 20/1. (c1) Effect of solvent/solid ratio and extraction time on ABTS at 60 °C; (c2) effect of solvent/solid ratio and temperature on ABTS at 30 min; (c3) effect of extraction time and temperature on ABTS at solvent/solid ratio of 20/1. The (upper) panels show the optimization ramp, where red markers indicate the selected optimal levels of the independent variables and blue markers indicate the predicted response values.
Applsci 16 06909 g010
Figure 11. Three-dimensional response surface plots for TPC, TFC, and TTC of P. americana fruit extracts obtained by UAE as a function of solvent/solid ratio, extraction time and amplitude. (a1) Effect of solvent/solid ratio and extraction time on TPC at amplitude of 70%; (a2) effect of solvent/solid ratio and amplitude on TPC at 30 min; (a3) effect of extraction time and amplitude on TPC at solvent/solid ratio of 20/1. (b1) Effect of solvent/solid ratio and extraction time on TFC at amplitude of 70%; (b2) effect of solvent/solid ratio and amplitude on TFC at 30 min; (b3) effect of extraction time and amplitude on TFC at solvent/solid ratio of 20/1. (c1) Effect of solvent/solid ratio and extraction time on TTC at amplitude of 70%; (c2) effect of solvent/solid ratio and amplitude on TTC at 30 min; (c3) effect of extraction time and amplitude on TTC at solvent/solid ratio of 20/1. The (upper) panels show the optimization ramp, where red markers indicate the selected optimal levels of the independent variables and blue markers indicate the predicted response values.
Applsci 16 06909 g011
Figure 12. Three-dimensional response surface plots for betalain content of P. americana fruit extracts obtained by UAE as a function of solvent/solid ratio, extraction time and amplitude. (a1) Effect of solvent/solid ratio and extraction time on betalain content at amplitude of 40%; (a2) effect of solvent/solid ratio and amplitude on betalain content at 15 min; (a3) effect of extraction time and amplitude on betalain content at solvent/solid ratio of 10/1. The (upper) panels show the optimization ramp, where red markers indicate the selected optimal levels of the independent variables and blue markers indicate the predicted response values.
Applsci 16 06909 g012
Figure 13. Three-dimensional response surface plots for FRAP, DPPH, and ABTS of P. americana fruit extracts obtained by UAE as a function of solvent/solid ratio, extraction time, and amplitude. (a1) Effect of solvent/solid ratio and extraction time on FRAP at amplitude of 70%; (a2) effect of solvent/solid ratio and amplitude on FRAP at 30 min; (a3) effect of extraction time and amplitude on FRAP at solvent/solid ratio of 13.6139/1. (b1) Effect of solvent/solid ratio and extraction time on DPPH at amplitude of 70%; (b2) effect of solvent/solid ratio and amplitude on DPPH at 30 min; (b3) effect of extraction time and amplitude on DPPH at solvent/solid ratio of 13.6139/1. (c1) Effect of solvent/solid ratio and extraction time on ABTS at amplitude of 70%; (c2) effect of solvent/solid ratio and amplitude on ABTS at 30 min; (c3) effect of extraction time and amplitude on ABTS at solvent/solid ratio of 13.6139/1. The (upper) panels show the optimization ramp, where red markers indicate the selected optimal levels of the independent variables and blue markers indicate the predicted response values.
Applsci 16 06909 g013
Figure 14. Three-dimensional response surface plots for TPC, TFC, and TTC of P. americana fruit extracts obtained by TE as a function of solvent/solid ratio, extraction time, and rotor speed. (a1) Effect of solvent/solid ratio and extraction time on TPC at rotor speed of 12,000 rpm; (a2) effect of solvent/solid ratio and rotor speed on TPC at 30 min; (a3) effect of extraction time and rotor speed on TPC at solvent/solid ratio of 20/1. (b1) Effect of solvent/solid ratio and extraction time on TFC at rotor speed of 12,000 rpm; (b2) effect of solvent/solid ratio and rotor speed on TFC at 30 min; (b3) effect of extraction time and rotor speed on TFC at solvent/solid ratio of 20/1. (c1) Effect of solvent/solid ratio and extraction time on TTC at rotor speed of 12,000 rpm; (c2) effect of solvent/solid ratio and rotor speed on TTC at 30 min; (c3) effect of extraction time and rotor speed on TTC at solvent/solid ratio of 20/1. The (upper) panels show the optimization ramp, where red markers indicate the selected optimal levels of the independent variables and blue markers indicate the predicted response values.
Applsci 16 06909 g014
Figure 15. Three-dimensional response surface plots for betalain content of P. americana fruit extracts obtained by TE as a function of solvent/solid ratio, extraction time, and rotor speed. (a1) Effect of solvent/solid ratio and extraction time on betalain content at rotor speed of 12,000 rpm; (a2) effect of solvent/solid ratio and rotor speed on betalain content at 30 min; (a3) effect of extraction time and rotor speed on betalain content at solvent/solid ratio of 10/1. The (upper) panels show the optimization ramp, where red markers indicate the selected optimal levels of the independent variables and blue markers indicate the predicted response values.
Applsci 16 06909 g015
Figure 16. Three-dimensional response surface plots for FRAP, DPPH, and ABTS of P. americana fruit extracts obtained by TE as a function of solvent/solid ratio, extraction time, and rotor speed. (a1) Effect of solvent/solid ratio and extraction time on FRAP at rotor speed of 12,000 rpm; (a2) effect of solvent/solid ratio and rotor speed on FRAP at 30 min; (a3) effect of extraction time and rotor speed on FRAP at solvent/solid ratio of 16.0502/1. (b1) Effect of solvent/solid ratio and extraction time on DPPH at rotor speed of 12,000 rpm; (b2) effect of solvent/solid ratio and rotor speed on DPPH at 30 min; (b3) effect of extraction time and rotor speed on DPPH at solvent/solid ratio of 16.0502/1. (c1) Effect of solvent/solid ratio and extraction time on ABTS at rotor speed of 12,000 rpm; (c2) effect of solvent/solid ratio and rotor speed on ABTS at 30 min; (c3) effect of extraction time and rotor speed on ABTS at solvent/solid ratio of 16.0502/1. The (upper) panels show the optimization ramp, where red markers indicate the selected optimal levels of the independent variables and blue markers indicate the predicted response values.
Applsci 16 06909 g016
Figure 17. Three-dimensional response surface plots for TPC, TFC, and TTC of P. americana fruit extracts obtained by BBE as a function of solvent/solid ratio, extraction time, and stroke rate. (a1) Effect of solvent/solid ratio and extraction time on TPC at stroke rate of 4800 strokes/min; (a2) effect of solvent/solid ratio and stroke rate on TPC at 30 min; (a3) effect of extraction time and stroke rate on TPC at solvent/solid ratio of 20/1. (b1) Effect of solvent/solid ratio and extraction time on TFC at stroke rate of 4800 strokes/min; (b2) effect of solvent/solid ratio and stroke rate on TFC at 30 min; (b3) effect of extraction time and stroke rate on TFC at solvent/solid ratio of 20/1. (c1) Effect of solvent/solid ratio and extraction time on TTC at stroke rate of 4800 strokes/min; (c2) effect of solvent/solid ratio and stroke rate on TTC at 30 min; (c3) effect of extraction time and stroke rate on TTC at solvent/solid ratio of 20/1. The (upper) panels show the optimization ramp, where red markers indicate the selected optimal levels of the independent variables and blue markers indicate the predicted response values.
Applsci 16 06909 g017
Figure 18. Three-dimensional response surface plots for betalain content of P. americana fruit extracts obtained by BBE as a function of solvent/solid ratio, extraction time and stroke rate. (a1) Effect of solvent/solid ratio and extraction time on betalain content at stroke rate of 4800 strokes/min; (a2) effect of solvent/solid ratio and stroke rate on betalain content at 30 min; (a3) effect of extraction time and stroke rate on betalain content at solvent/solid ratio of 10/1. The (upper) panels show the optimization ramp, where red markers indicate the selected optimal levels of the independent variables and blue markers indicate the predicted response values.
Applsci 16 06909 g018
Figure 19. Three-dimensional response surface plots for FRAP, DPPH, and ABTS of P. americana fruit extracts obtained by BBE as a function of solvent/solid ratio, extraction time and stroke rate. (a1) Effect of solvent/solid ratio and extraction time on FRAP at stroke rate of 4800 strokes/min; (a2) effect of solvent/solid ratio and stroke rate on FRAP at 30 min; (a3) effect of extraction time and stroke rate on FRAP at solvent/solid ratio of 10/1. (b1) Effect of solvent/solid ratio and extraction time on DPPH at stroke rate of 4800 strokes/min; (b2) effect of solvent/solid ratio and stroke rate on DPPH at 30 min; (b3) effect of extraction time and stroke rate on DPPH at solvent/solid ratio of 10/1. (c1) Effect of solvent/solid ratio and extraction time on ABTS at stroke rate of 4800 strokes/min; (c2) effect of solvent/solid ratio and stroke rate on ABTS at 30 min; (c3) effect of extraction time and stroke rate on ABTS at solvent/solid ratio of 10/1. The (upper) panels show the optimization ramp, where red markers indicate the selected optimal levels of the independent variables and blue markers indicate the predicted response values.
Applsci 16 06909 g019
Table 1. Experimental conditions for each extraction method applied to P. americana fruits; sample codes for all 32 experimental runs are given.
Exp.Common ParametersMethod-Specific Parameters
MEUAETEBBE
Solvent/Solid Ratio (v/w)Extraction Time
(min)
Temp. (°C)CodeAmplitude (%)CodeRotor Speed (RPM)CodeStroke Rate (SPM)Code
110/11530PM140PUS16000PT12400PB1
220/11530PM240PUS26000PT22400PB2
310/13030PM340PUS36000PT32400PB3
420/13030PM440PUS46000PT42400PB4
510/11560PM570PUS512,000PT54800PB5
620/11560PM670PUS612,000PT64800PB6
710/13060PM770PUS712,000PT74800PB7
820/13060PM870PUS812,000PT84800PB8
Table 2. Final temperatures (°C) of P. americana fruit extracts obtained by UAE, according to parameters of the 23 factorial design.
SamplePUS1PUS2PUS3PUS4PUS5PUS6PUS7PUS8
Final temperature (°C)4046454346394941
Disclaimer/Publisher’s Note: The statements, opinions and data contained in all publications are solely those of the individual author(s) and contributor(s) and not of MDPI and/or the editor(s). MDPI and/or the editor(s) disclaim responsibility for any injury to people or property resulting from any ideas, methods, instructions or products referred to in the content.