1. Introduction
The growing interest in renewable energy sources in recent decades has drawn significant attention to the use of kinetic energy of flowing water. In this context, hydrokinetic water turbines represent a promising technology for generating electrical energy from natural flows in rivers, canals and tidal zones without the need to build large-scale hydraulic structures and create significant head [
1,
2]. Such systems are considered a suitable solution for utilizing local water resources with relatively low hydraulic head.
The efficiency and performance of kinetic turbines rely directly on the hydrodynamic characteristics of the flow they operate in. One key parameter is the spatial distribution of velocity in the interaction zone between the turbine and the flow. The velocity field’s structure determines both the available kinetic energy of the flow and the dynamic loads on the turbine’s working components, which in turn influence its efficiency, reliability, and service life [
3,
4].
In open flow analysis, it has been found that the structure of the velocity field results from the complex interaction between the inertial forces of the flow, turbulence, and the boundary conditions imposed by the channel walls and bottom. Classic studies in open flow hydraulics demonstrate that the velocity profile along the flow depth of the flow is significantly influenced by the characteristics of the bottom surface, with roughness playing a crucial role in the development of the turbulent boundary layer [
5,
6,
7].
Bed roughness, caused by natural elements such as rocks, sediments or morphological irregularities of the riverbed, leads to a change in the velocity field by increasing turbulence, changing the momentum distribution and forming local vortex structures. Depending on the geometry and spatial distribution of these irregularities, significant changes in local flow velocities can occur, including accelerations, recirculation zones and intense velocity pulsations [
8,
9]. Such phenomena have a significant impact on the hydrodynamic conditions under which hydrokinetic turbines operate.
In recent years, numerous studies have focused on studying the interaction between turbines and turbulent flow characteristics in open streams. It has been found that irregularities in the velocity field can lead to significant variations in the generated power, as well as increased dynamic loads on the turbine blades [
10,
11]. In addition, the presence of bottom roughness can cause local changes in the energy spectrum of turbulence and lead to a redistribution of momentum in the flow cross-section [
12].
Recent studies indicate that turbulent inflow conditions and flow non-uniformities can greatly affect hydrokinetic turbine performance. Higher turbulence intensity may generate fluctuating blade loads, unsteady torque, and cyclic mechanical stresses that impact both turbine efficiency and structural integrity. Additionally, local velocity increases and deficits within the flow can change the distribution of available kinetic energy and influence the overall energy extraction process. Therefore, understanding the connection between bed roughness, turbulence generation, and turbine operating conditions is crucial for both laboratory studies and real-world hydrokinetic turbine deployment [
8,
9].
Due to the complex nature of these processes, laboratory experimental studies are an important tool for analyzing the hydrodynamic characteristics of the flow under controlled conditions. The use of laboratory channels allows for detailed measurement of the velocity field and analysis of the influence of various parameters, including channel geometry, bottom characteristics, and flow regime [
13,
14,
15,
16,
17,
18].
In this regard, the present study aims to analyze how bottom roughness affects the velocity field structure in a laboratory channel designed for testing kinetic water turbines. By performing experiments with different bottom conditions, it examines changes in the velocity field and assesses how bottom roughness influences flow dynamics. The findings can help improve understanding of the hydrodynamic conditions for kinetic turbines and optimize their laboratory testing methods.
The study shows a clear connection between turbulence intensity, fluctuating velocities over time, and potential operating conditions for hydrokinetic turbines, such as variable blade loading, flow inconsistency, unstable torque production, and local kinetic energy levels. The findings enhance understanding of turbulent flow behavior in laboratory tests of hydrokinetic turbines and can help optimize future experimental procedures and turbine testing setups.
2. Methodology
2.1. Theoretical Approach
The hydrodynamic behavior of open-channel flows is governed by the interaction between inertial forces, gravitational forces, boundary friction, and turbulence generation. One of the most important factors affecting the velocity distribution within the flow is the bed roughness, which modifies the structure of the turbulent boundary layer and influences the momentum exchange between different flow regions. Classical open-channel flow theory indicates that the velocity profile develops as a result of shear stresses acting between the flowing water and the channel bed, leading to a characteristic vertical velocity distribution. The presence of roughness elements increases turbulence production; enhances momentum transfer; and may generate local acceleration zones, flow separation, recirculation regions, and vortex structures.
In turbulent open-channel flows, the velocity distribution near the bed is commonly described by the logarithmic law of the wall, which relates the local velocity to the distance from the boundary and the effective roughness characteristics of the bed. An increase in bed roughness alters the near-bed flow structure, resulting in stronger velocity fluctuations and increased turbulence intensity. These effects are particularly important for hydrokinetic turbine applications, where both the mean velocity and the temporal characteristics of the flow directly influence the available kinetic energy, turbine efficiency, and dynamic loading of the rotor blades.
Therefore, understanding the relationship between bed roughness, velocity distribution, and turbulence development is essential for interpreting experimental measurements and for evaluating the operating conditions of hydrokinetic turbines in both laboratory channels and natural river environments.
Logarithmic velocity profile can be defined by:
where
—local velocity,
—friction velocity;
—constant of Karman,
—roughness length.
Friction velocity can be defined by:
Hydrokinetic power can be defined by:
2.2. Experimental Methodology
When conducting research related to the operation and determination of the energy parameters of hydrokinetic turbines, it is necessary to conduct laboratory and operational studies of the designed models under given conditions [
19,
20]. Among the parameters characterizing the operation of the machines, knowledge of the velocity field in the turbine operating zone is first. Another important factor is the submergence of the turbine, or its position relative to the free water surface. Finally, the main conditions include knowledge of the characteristic features of the riverbed and the presence of irregularities, such as those caused by a rocky bottom. The paper presents a study of the velocity field in a laboratory horizontal open channel for hydrokinetic turbines at two different velocities of 0.3 and 0.4 m/s, with a flow depth of 180 mm. Experiments were carried out to evaluate how channel bed shape affects the velocity profile, using two hydraulic regimes, and each flow velocity (0.3 m/s and 0.4 m/s) was tested under two hydraulic regimes: a smooth bed condition and a rough bed condition with artificially introduced irregularities, that simulate a natural rocky riverbed. This approach allows examination of changes in flow turbulence and the redistribution of momentum across the channel cross-section.
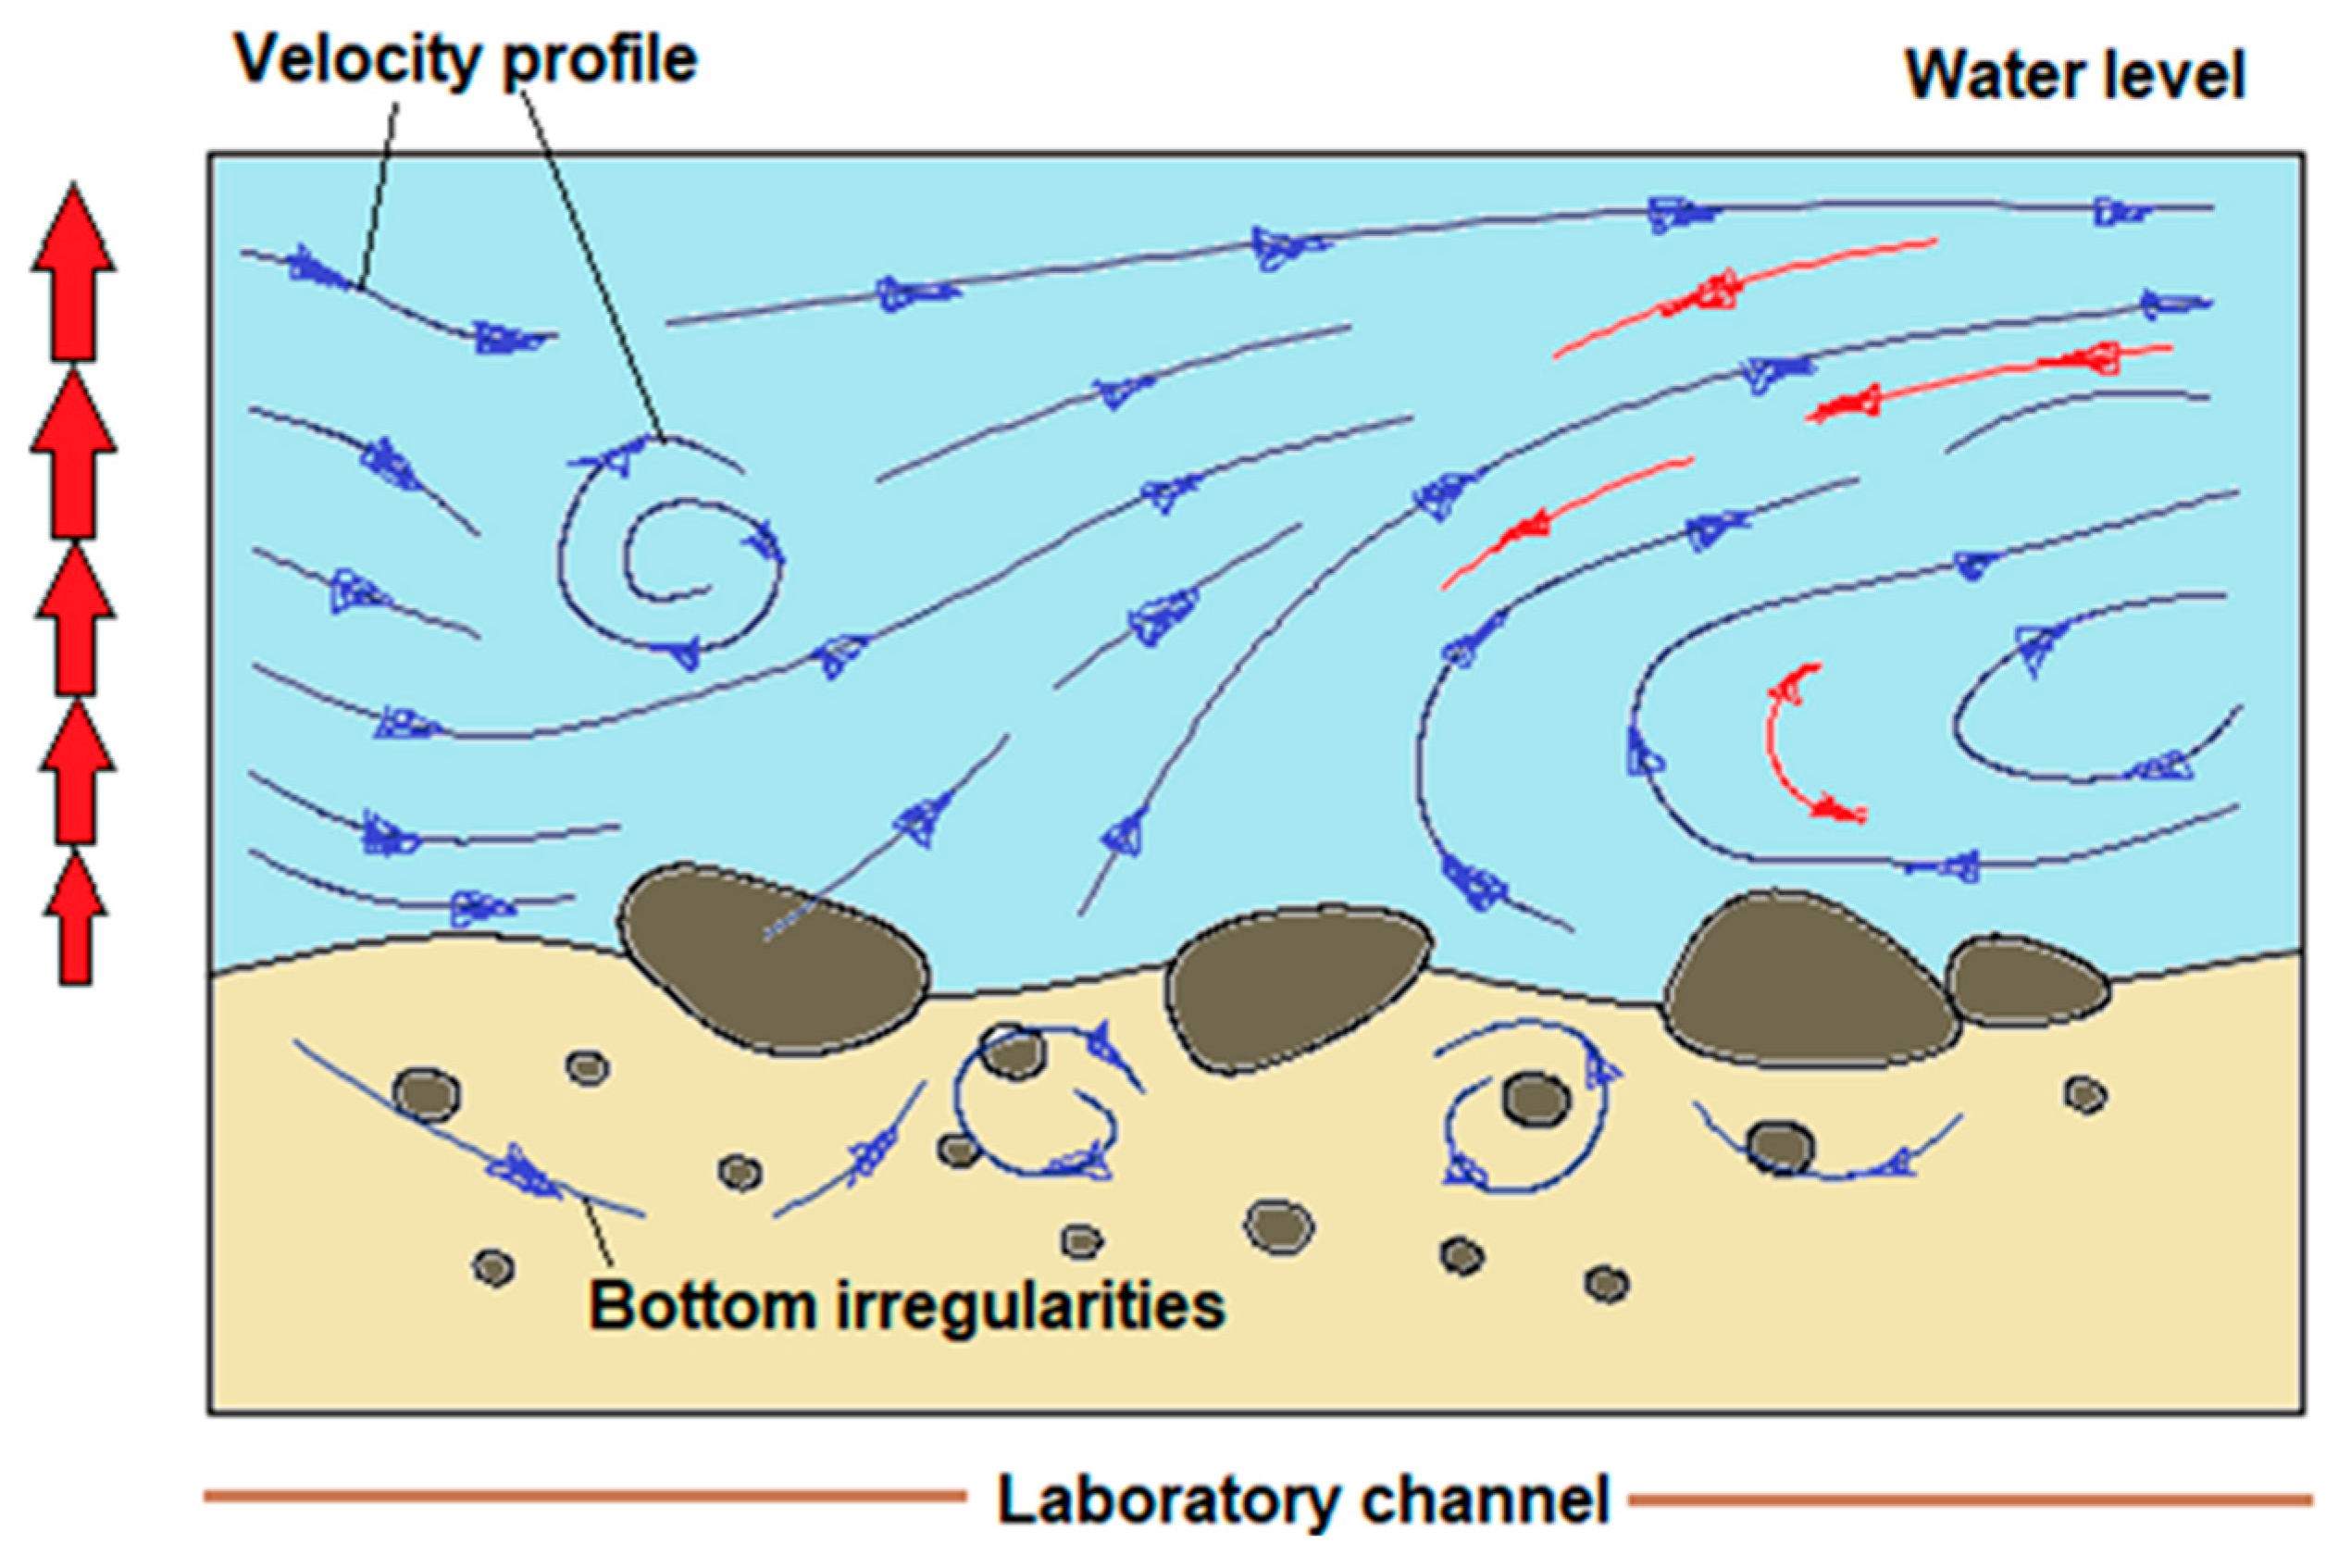
Figure 1 presents the water flow structure when channel bed roughness is present. Near the channel bed, a turbulent boundary layer forms, leading to the development of vortices and local recirculation zones caused by the interaction between the flow and the bed irregularities. Between the individual irregularities, flow acceleration zones are observed as a result of the momentum redistribution of the flow. Moving upward, the flow velocity increases and the typical vertical velocity profile develops. The figure illustrates the main hydrodynamic processes that determine the velocity field and affect the operating conditions of the hydrokinetic turbines.
Results for the velocity variation at fixed preliminary discussed points along the water channel are presented. The graphical representation of the results includes the velocity variation at a certain point in time, the average velocity over the entire measurement range, and a comparison between experiments with and without channel bed roughness.
3. Experimental Setup
The experimental stand used for the laboratory experiments is presented in
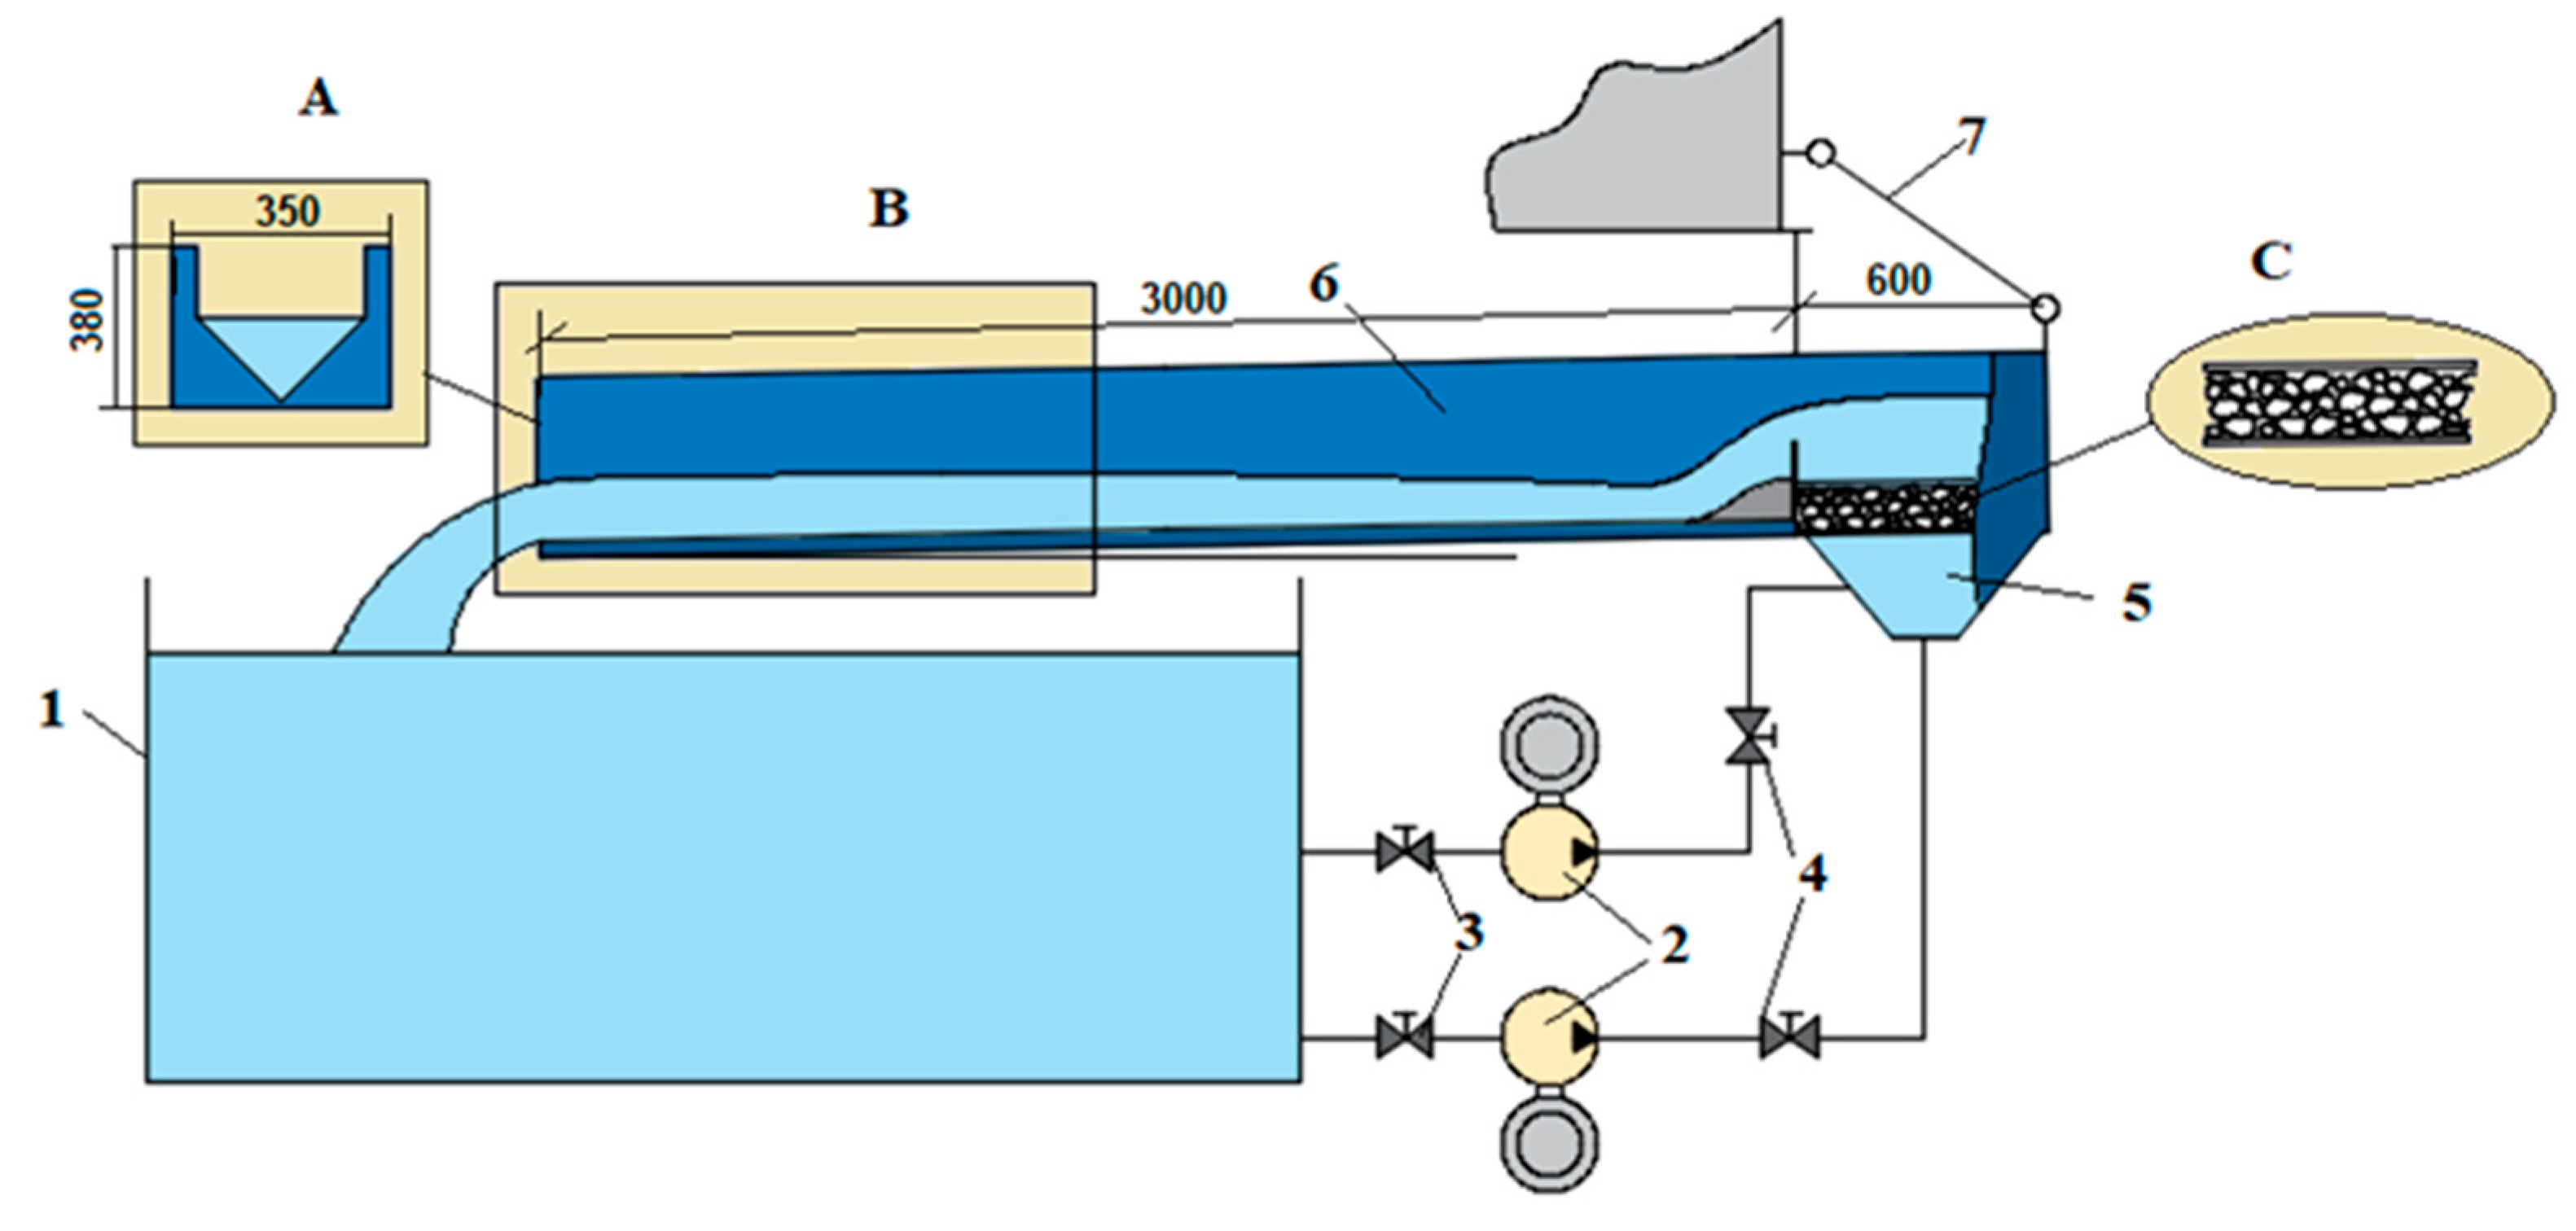
Figure 2. The test rig consists of a main tank (1), pumping units (2), shut-off valves (3), control valves (4), a receiving tank (5), a test channel (6), and a tensioning system (7). During the design and implementation of the test rig, special attention is paid to the following features. The main tank is equipped with a level gauge to measure the water level in the stand. Monitoring the level provides information about the suction head of the pumps in the system and therefore contributes to the consistency of the experiments. The two pumping units provide the required water level and flow velocity in the measuring section. The units and the system itself are designed to obtain the desired flow velocity at maximum opening of the control valves 4. If necessary, the pump units are also equipped with frequency converters for precise adjustment of the operating parameters. After the pumps, the water does not enter the test section directly; it passes through a filtering system shown in
Figure 2 as zone C. The filtering system consists of two metal grids with stones placed between them. The filter installed aims to reduce the potential energy of the water exiting the pumps. After the filtering system, the water enters the receiving tank (5) and through an overflow the water enters the test channel section (6). By realizing free surface water flow, the setup approximates real operating conditions in a natural riverbed. To regulate the outflow, a tensioning system (7) is installed, which allows for changing the slope of the channel and more possibilities for approaching real conditions. From the test channel section (6), the location for the velocity measurement equipment installation is designated in region B, shown in
Figure 2. In this zone, the flow had sufficient distance to stabilize and develop after entering from the receiving tank (5). At the end of the channel test section, a barrier with a triangular cross-section is placed, shown as region A in
Figure 2 This triangular geometry allows for the formation of a plane with maximum velocity in the middle of the channel along the test section. Additionally, this outlet geometry increases the water level in the channel test section. All dimensions in the following figures of the experimental test rig are shown in mm.
The second part of the methodology focuses on the experimental procedure of the velocity field measurements. The selection of a measuring device is based on the following requirements: measurement accuracy (low measurement error) as the first, and the capability for time-resolved data recordings. The measurements presented in this study were carried out using an electromagnetic flowmeter, AquaProbe 2. This flowmeter operates based on Faraday’s law of electromagnetic induction and does not rely on acoustic signal transmission. The electromagnetic probe records velocity values averaged over a 15 s interval, with each recorded point representing the average of 15 instantaneous measurements. The selected acquisition period ensured statistically representative velocity time series for subsequent analysis of flow fluctuations and turbulence intensity. Therefore, the recorded data provide information about the streamwise velocity component but do not allow direct reconstruction of the complete three-dimensional velocity field. To ensure measurement reliability, the probe was always positioned such that the sensing head was fully submerged, in accordance with the manufacturer’s recommendations. Measurements close to the free surface were either avoided or carefully validated to exclude unstable readings. The electromagnetic probe has an external calibration certificate and within a velocity range of 0.3 to 0.4 m/s, it operates with an error of +0.5%. It is capable of time-resolved data acquisition and functions as a logging device (logger). The electromagnetic probe records velocity values averaged over a 15 s interval, with each recorded point representing an average of 15 instantaneous measurements. To verify the results at the respective measurement points, a turbine-type velocity probe is also deployed during the experiments. Readings from this additional probe are rerecorded simultaneously with the primary measuring device. The data from the turbine velocity probe are not included in this paper, as it is used as a secondary verification device.
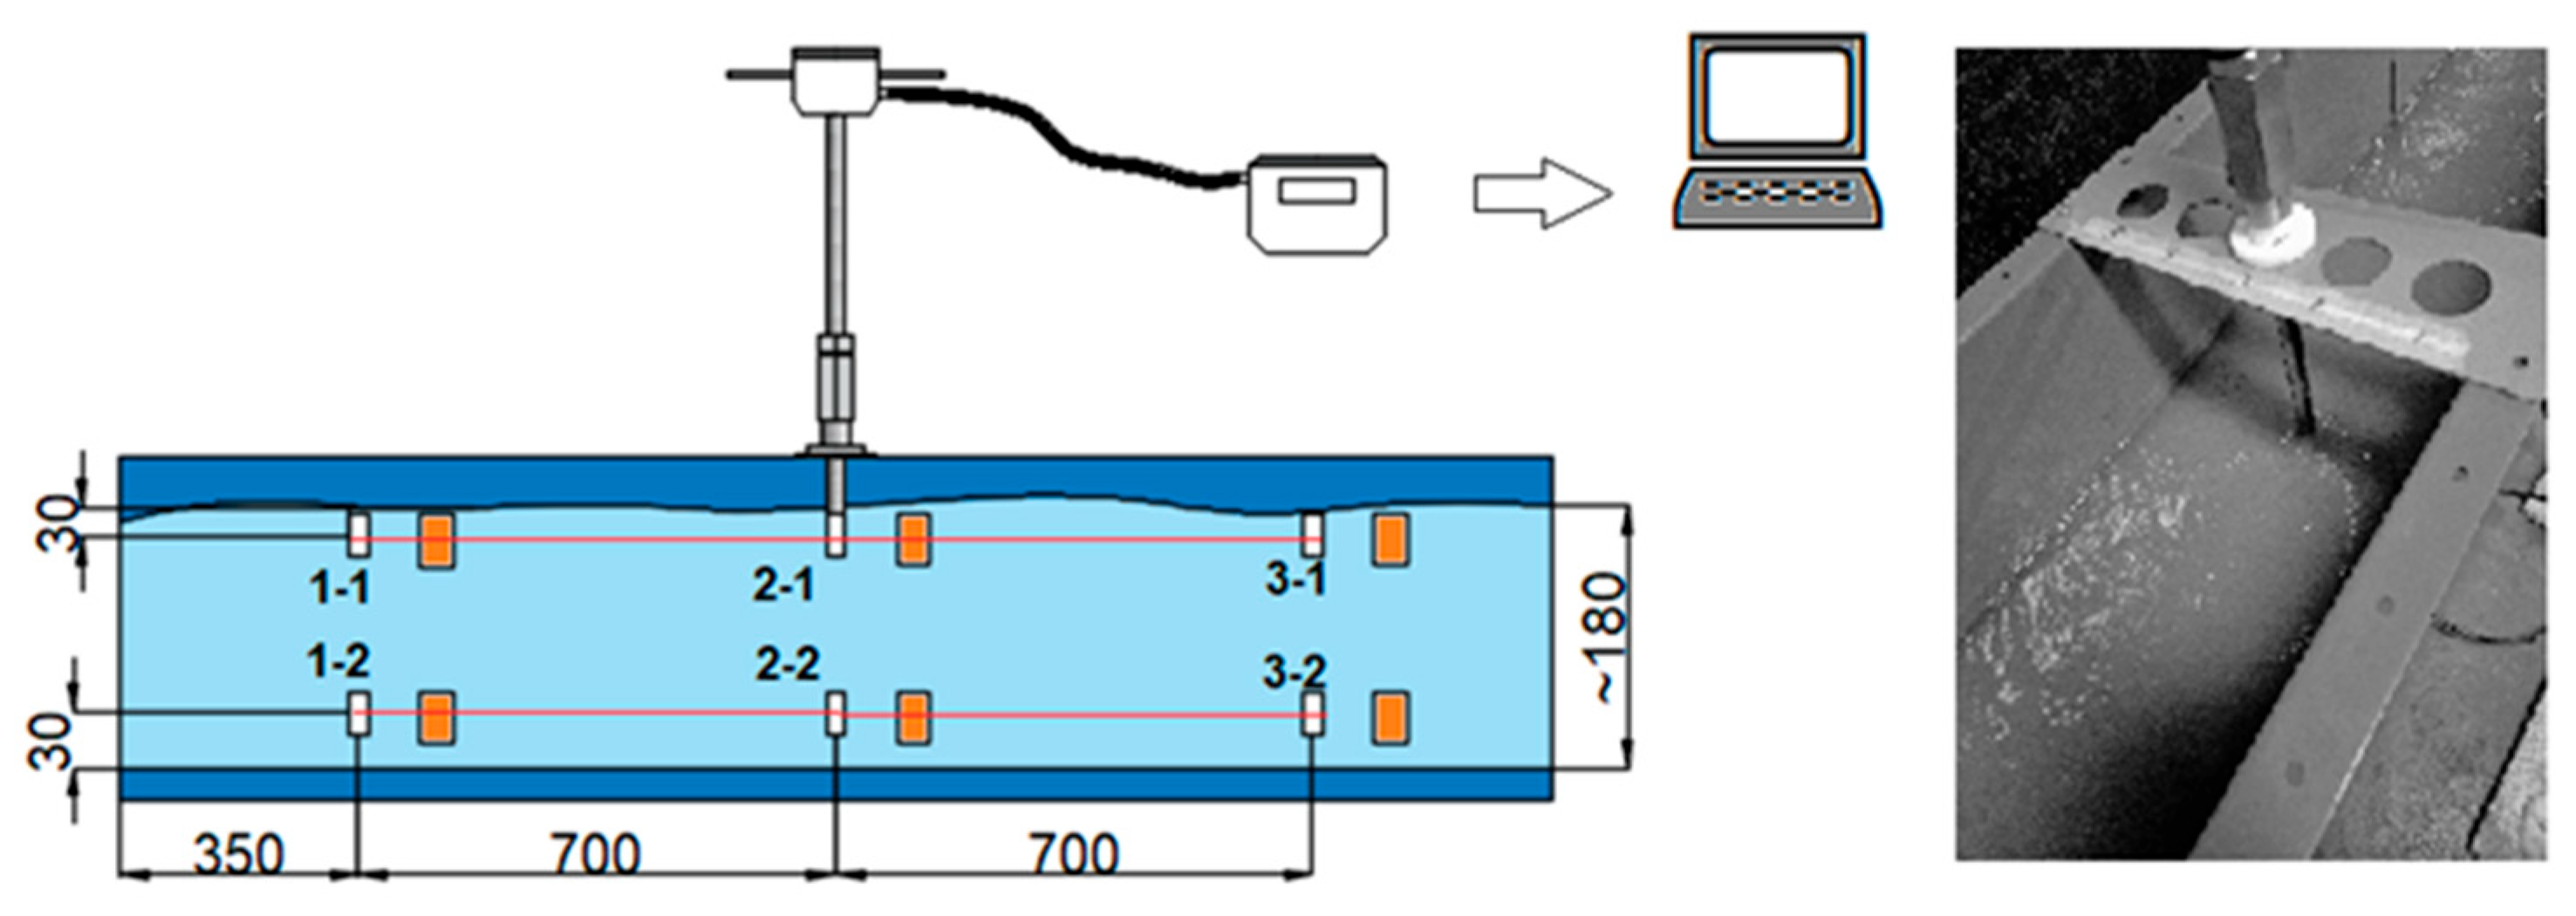
Figure 3 shows the positions of the electromagnetic probe as well as the corresponding locations upstream where the verification velocity probe is placed.
At each measurement location, velocity data were recorded continuously for a total of 1200 s. The AquaProbe 2 flowmeter stored one average velocity value every 15 s, with each recorded value representing the mean of 15 instantaneous measurements. As a result, each velocity time series comprised 80 averaged values, which were used to calculate the mean velocity, standard deviation, and turbulence intensity. The relatively long acquisition period ensured a statistically representative characterization of the investigated flow conditions. These parameters are also presented in
Table 1.
The calculated mean values are reported together with their corresponding standard deviations.
The statistical parameters presented in this study were calculated from the complete 1200 s time series for each measurement location, ensuring a consistent basis for comparison between the smooth-bed and rough-bed configurations.
The measurement points and the probe position are shown in
Figure 3. The points are selected according to the following methodology: Points 1-1 and 1-2 are located at a distance from the channel outlet equal to the channel width. The distances of points 2-1 and 2-2 relative to the corresponding points in sections 1 and 3 are equal twice the width of the channel. Referred to the channel width, all points are aligned along the channel’s central plane. The velocity is measured at a distance of 30 mm from the surface and the bottom, towards the inside of the flow. The depth of the expected open flow is approximately 180 mm; therefore, two measurement points in a vertical plane are quite sufficient to determine the velocities acting on the model turbine wheels. The test rig is designed for experimental studies on model turbine runners with an outer diameter of D = 100 mm.
The measurement locations were selected to represent the central operating zone of the laboratory channel, where hydrokinetic turbine models are positioned during performance investigations. The objective was to characterize the velocity conditions acting on the turbine rotor rather than to reconstruct the complete cross-sectional velocity field. Therefore, measurements were concentrated along the channel centreline and at two characteristic elevations corresponding to the upper and lower regions of the turbine operating zone.
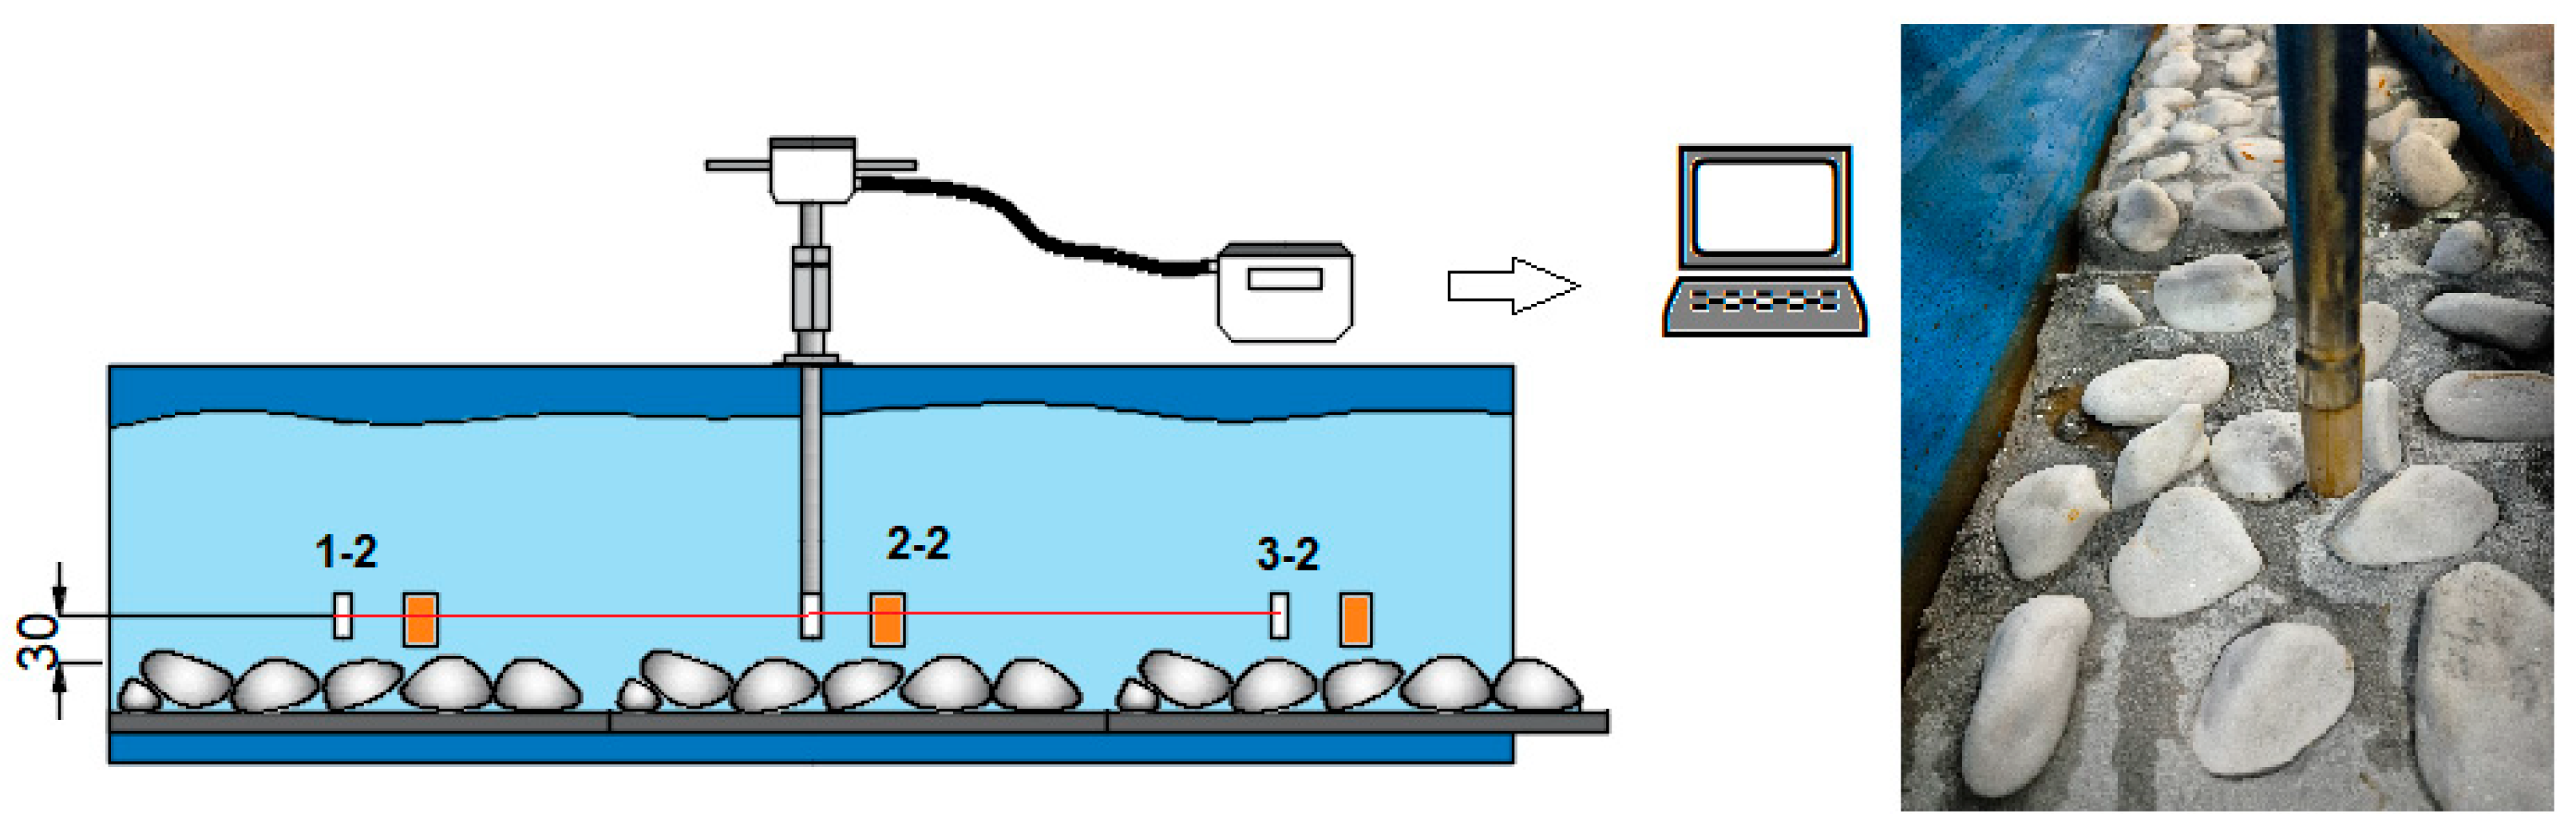
In the present study, an experimental investigation involving bed irregularities in the test section is also carried out. For this purpose, concrete plates with embedded river stones were made. The plates can be rearranged for each test to simulate different flow conditions. They are numbered and marked to ensure they can be placed in a consistent sequence when needed. The natural stones used are irregular in shape, with rounded edges and a relatively smooth surface, typical of fluvial environments. The stones have a roughly ellipsoidal to sub-oval geometry, with characteristic dimensions of approximately 5–15 cm along the long axis (
Table 2). They are unevenly distributed on the bottom, forming a rough surface with pronounced roughness and local variations in height. The space between the individual elements is partially filled with finer sediment (sand), which contributes to the stabilization of the configuration and creates conditions close to a natural riverbed.
The investigation of flow non-uniformity caused by these plates is limited to measurements near the stones, with the probe positioned at a distance of 30 mm from the modified bed surface, as illustrated in
Figure 4.
The rough-bed setup was built with naturally rounded river stones set in modular concrete slabs. The typical stone size was about 100 mm in diameter, with a channel width of 350 mm and a flow depth of 180 mm. The estimated relative roughness was approximately 0.56 (ks/h), which suggests a hydraulically rough flow regime. The roughness elements took up a significant part of the flow depth and locally reduced the effective flow area for water passage.
The calculated Reynolds number ranged from approximately 5.4 × 10⁴ to 9.0 × 10⁴, confirming fully turbulent flow conditions throughout the experiments. The corresponding Froude number ranged from 0.23 to 0.38, indicating subcritical flow conditions. Consequently, the observed local velocity acceleration cannot be attributed to a hydraulic regime transition but rather to local confinement effects and momentum redistribution caused by the roughness elements.
Measurement Uncertainty—The electromagnetic flowmeter AquaProbe 2 has a manufacturer-specified accuracy of ±0.5% within the investigated velocity range (0.3–0.4 m/s). The uncertainty of the mean velocity measurements was estimated using the instrument accuracy:
where
is the relative measurement uncertainty and
is the measured mean velocity. The resulting uncertainty remained below ±0.003 m/s for all investigated conditions and therefore does not affect the main conclusions of the study.
For each measurement point, velocity was recorded over a total duration of 1200 s. The AquaProbe 2 electromagnetic flowmeter stored one averaged velocity value every 15 s, with each recorded value representing the average of 15 instantaneous samples. Therefore, each velocity time series consisted of 80 recorded averaged values, corresponding to approximately 1200 instantaneous samples per measurement point. The mean velocity, standard deviation, and turbulence intensity were calculated from these time series.
4. Experimental Results
The velocity field in a test water channel was studied based on the methodology described in
Section 3. The results are presented as instantaneous velocity variations and corresponding mean values for each measurement section.
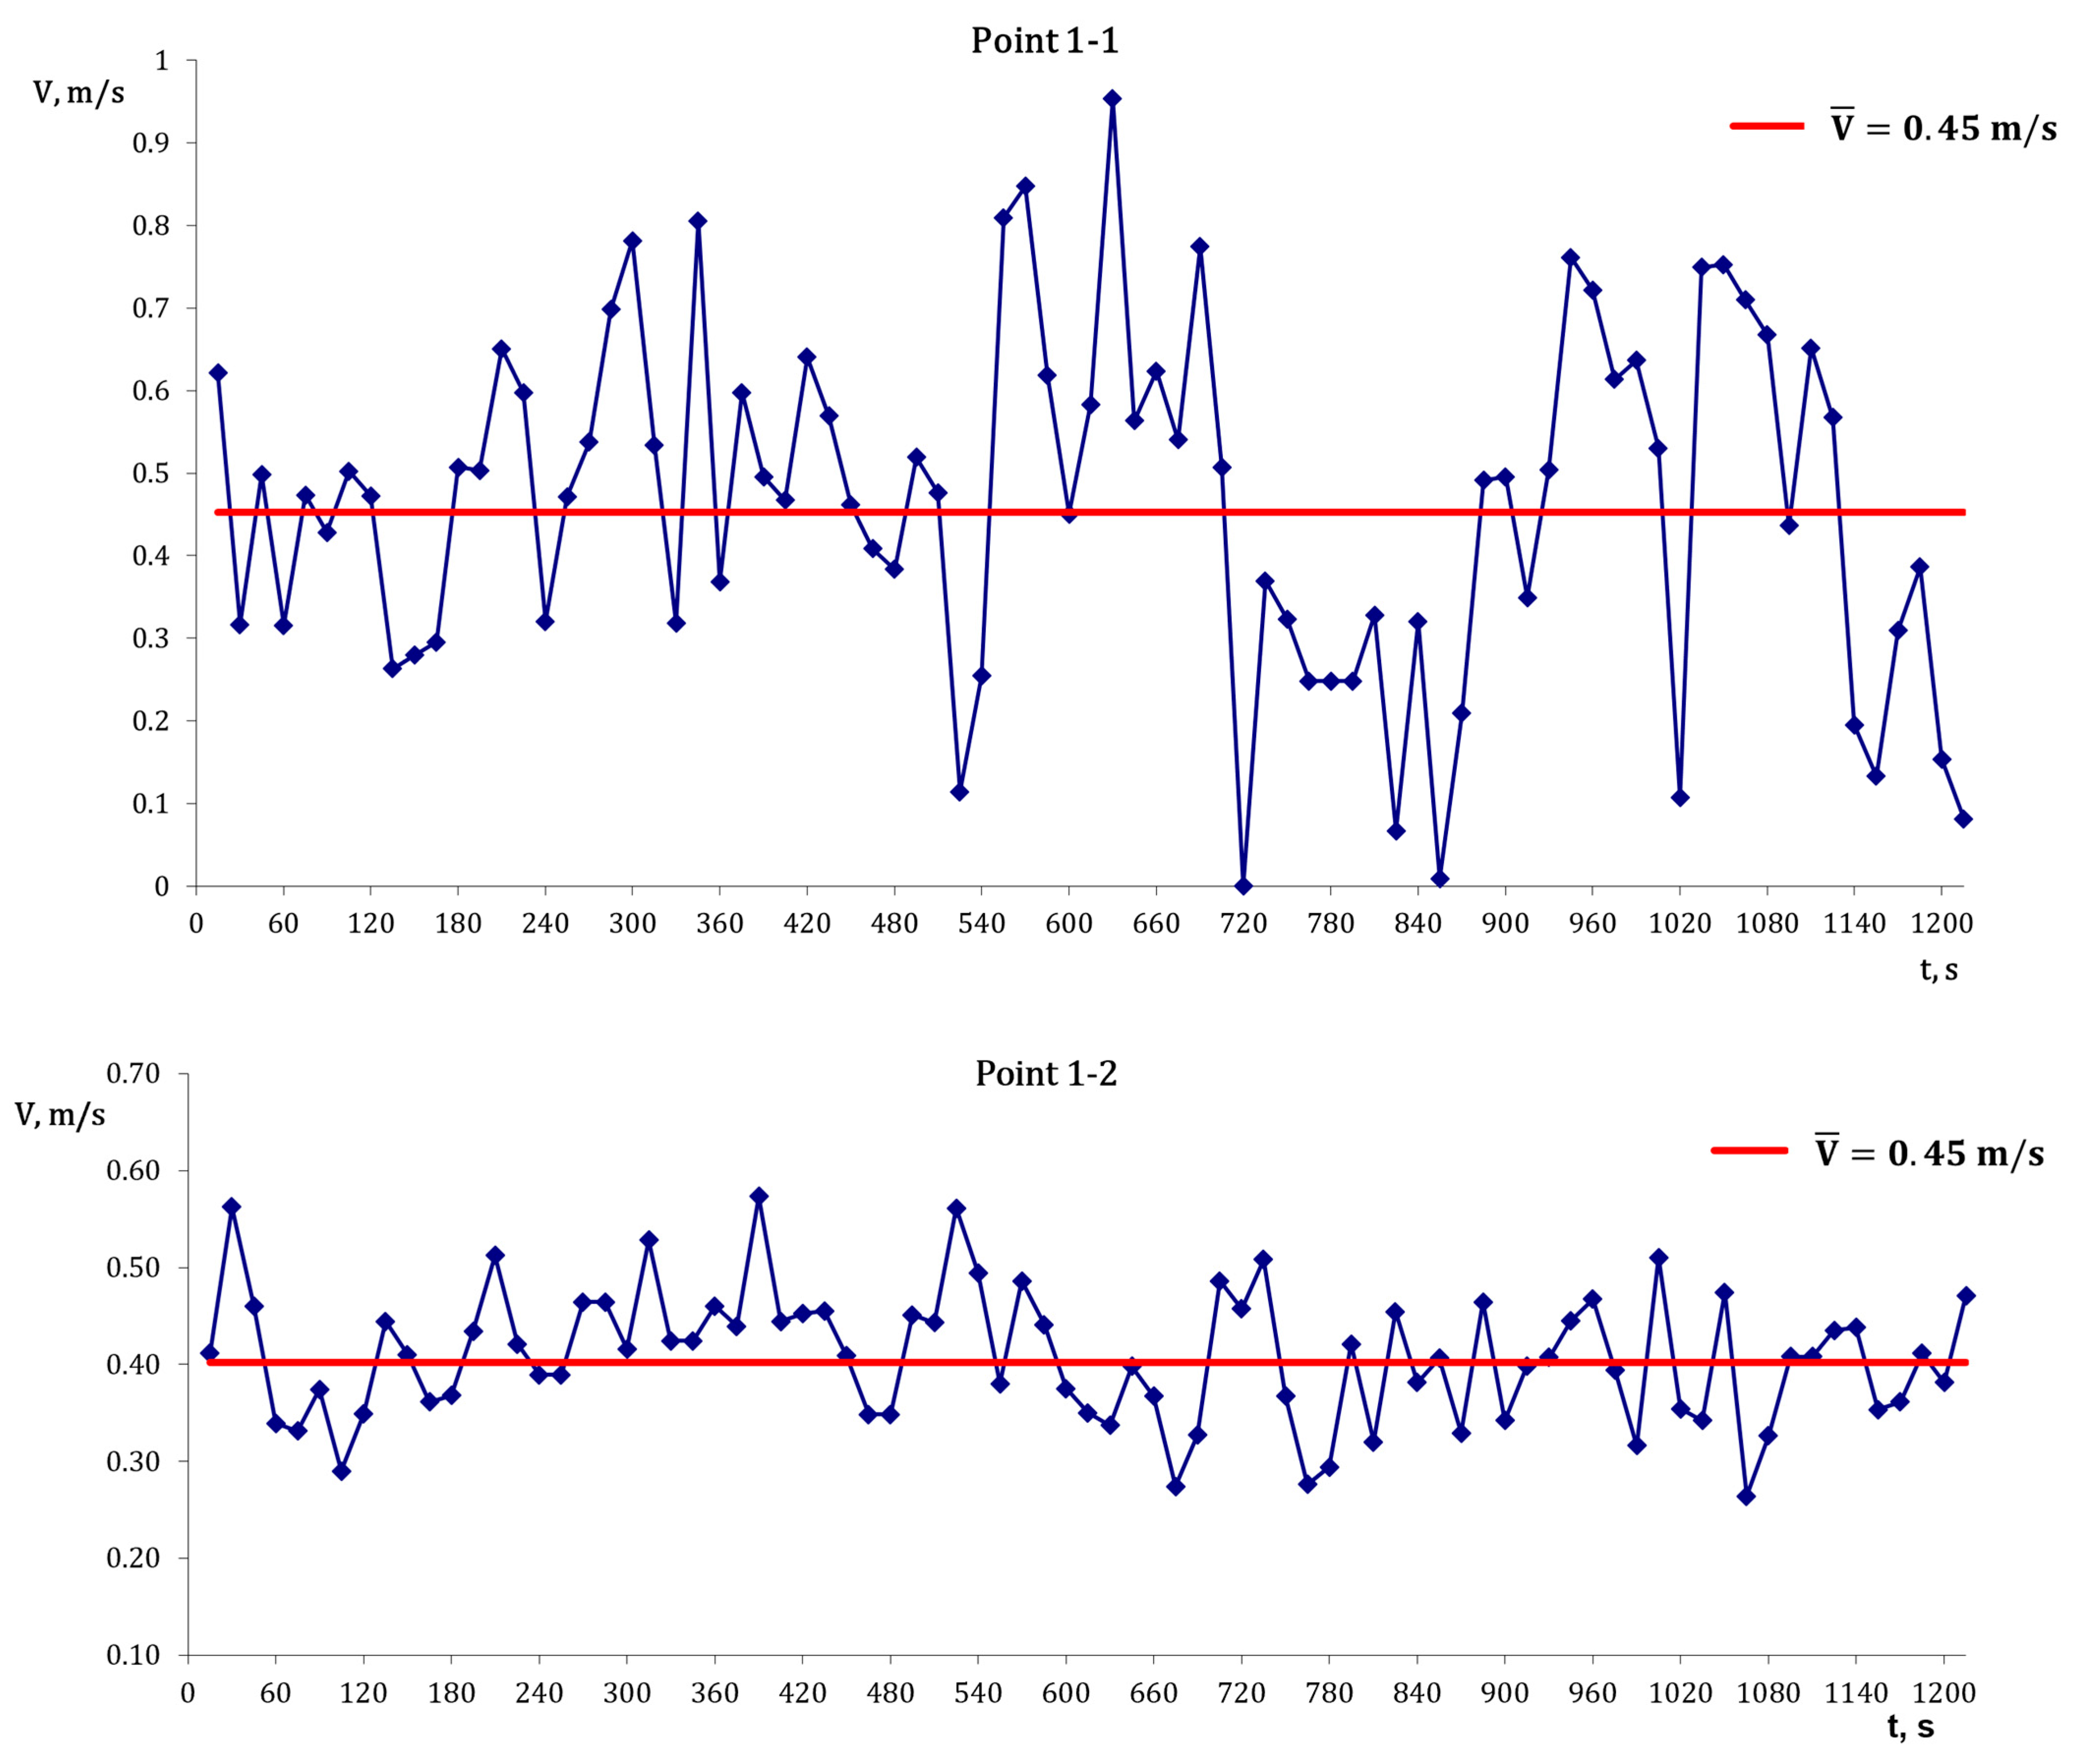
Figure 5,
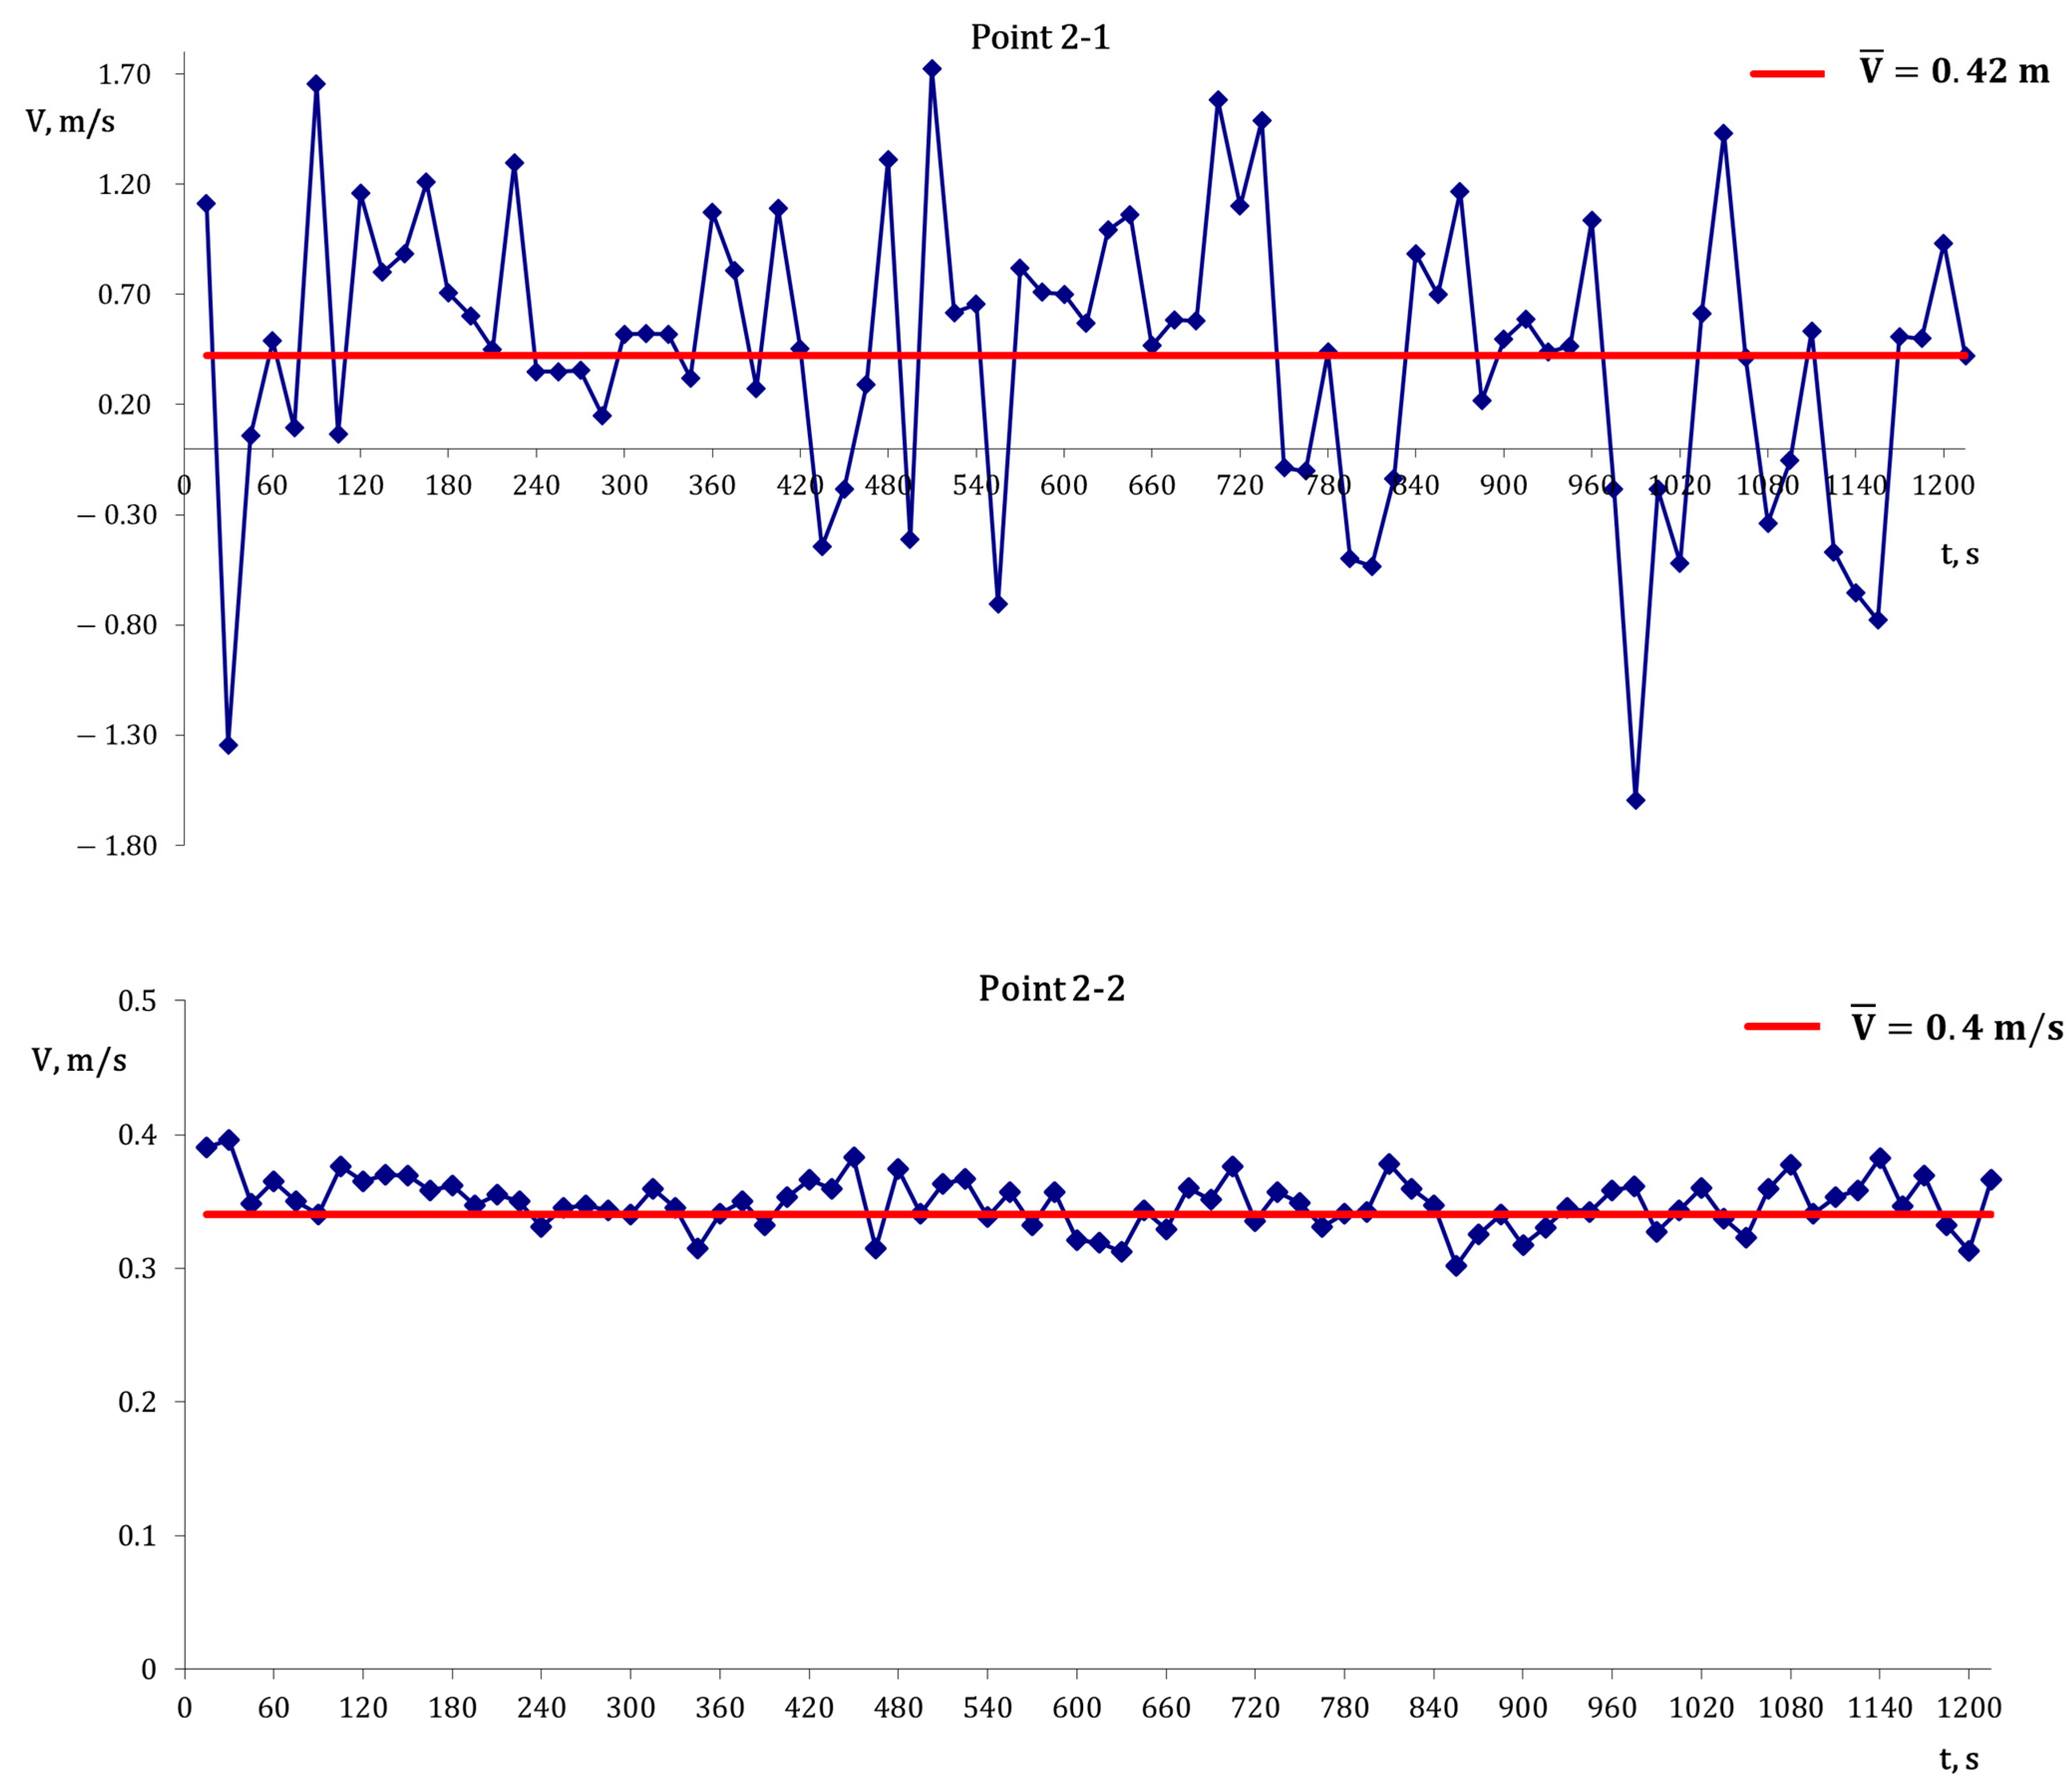
Figure 6 and
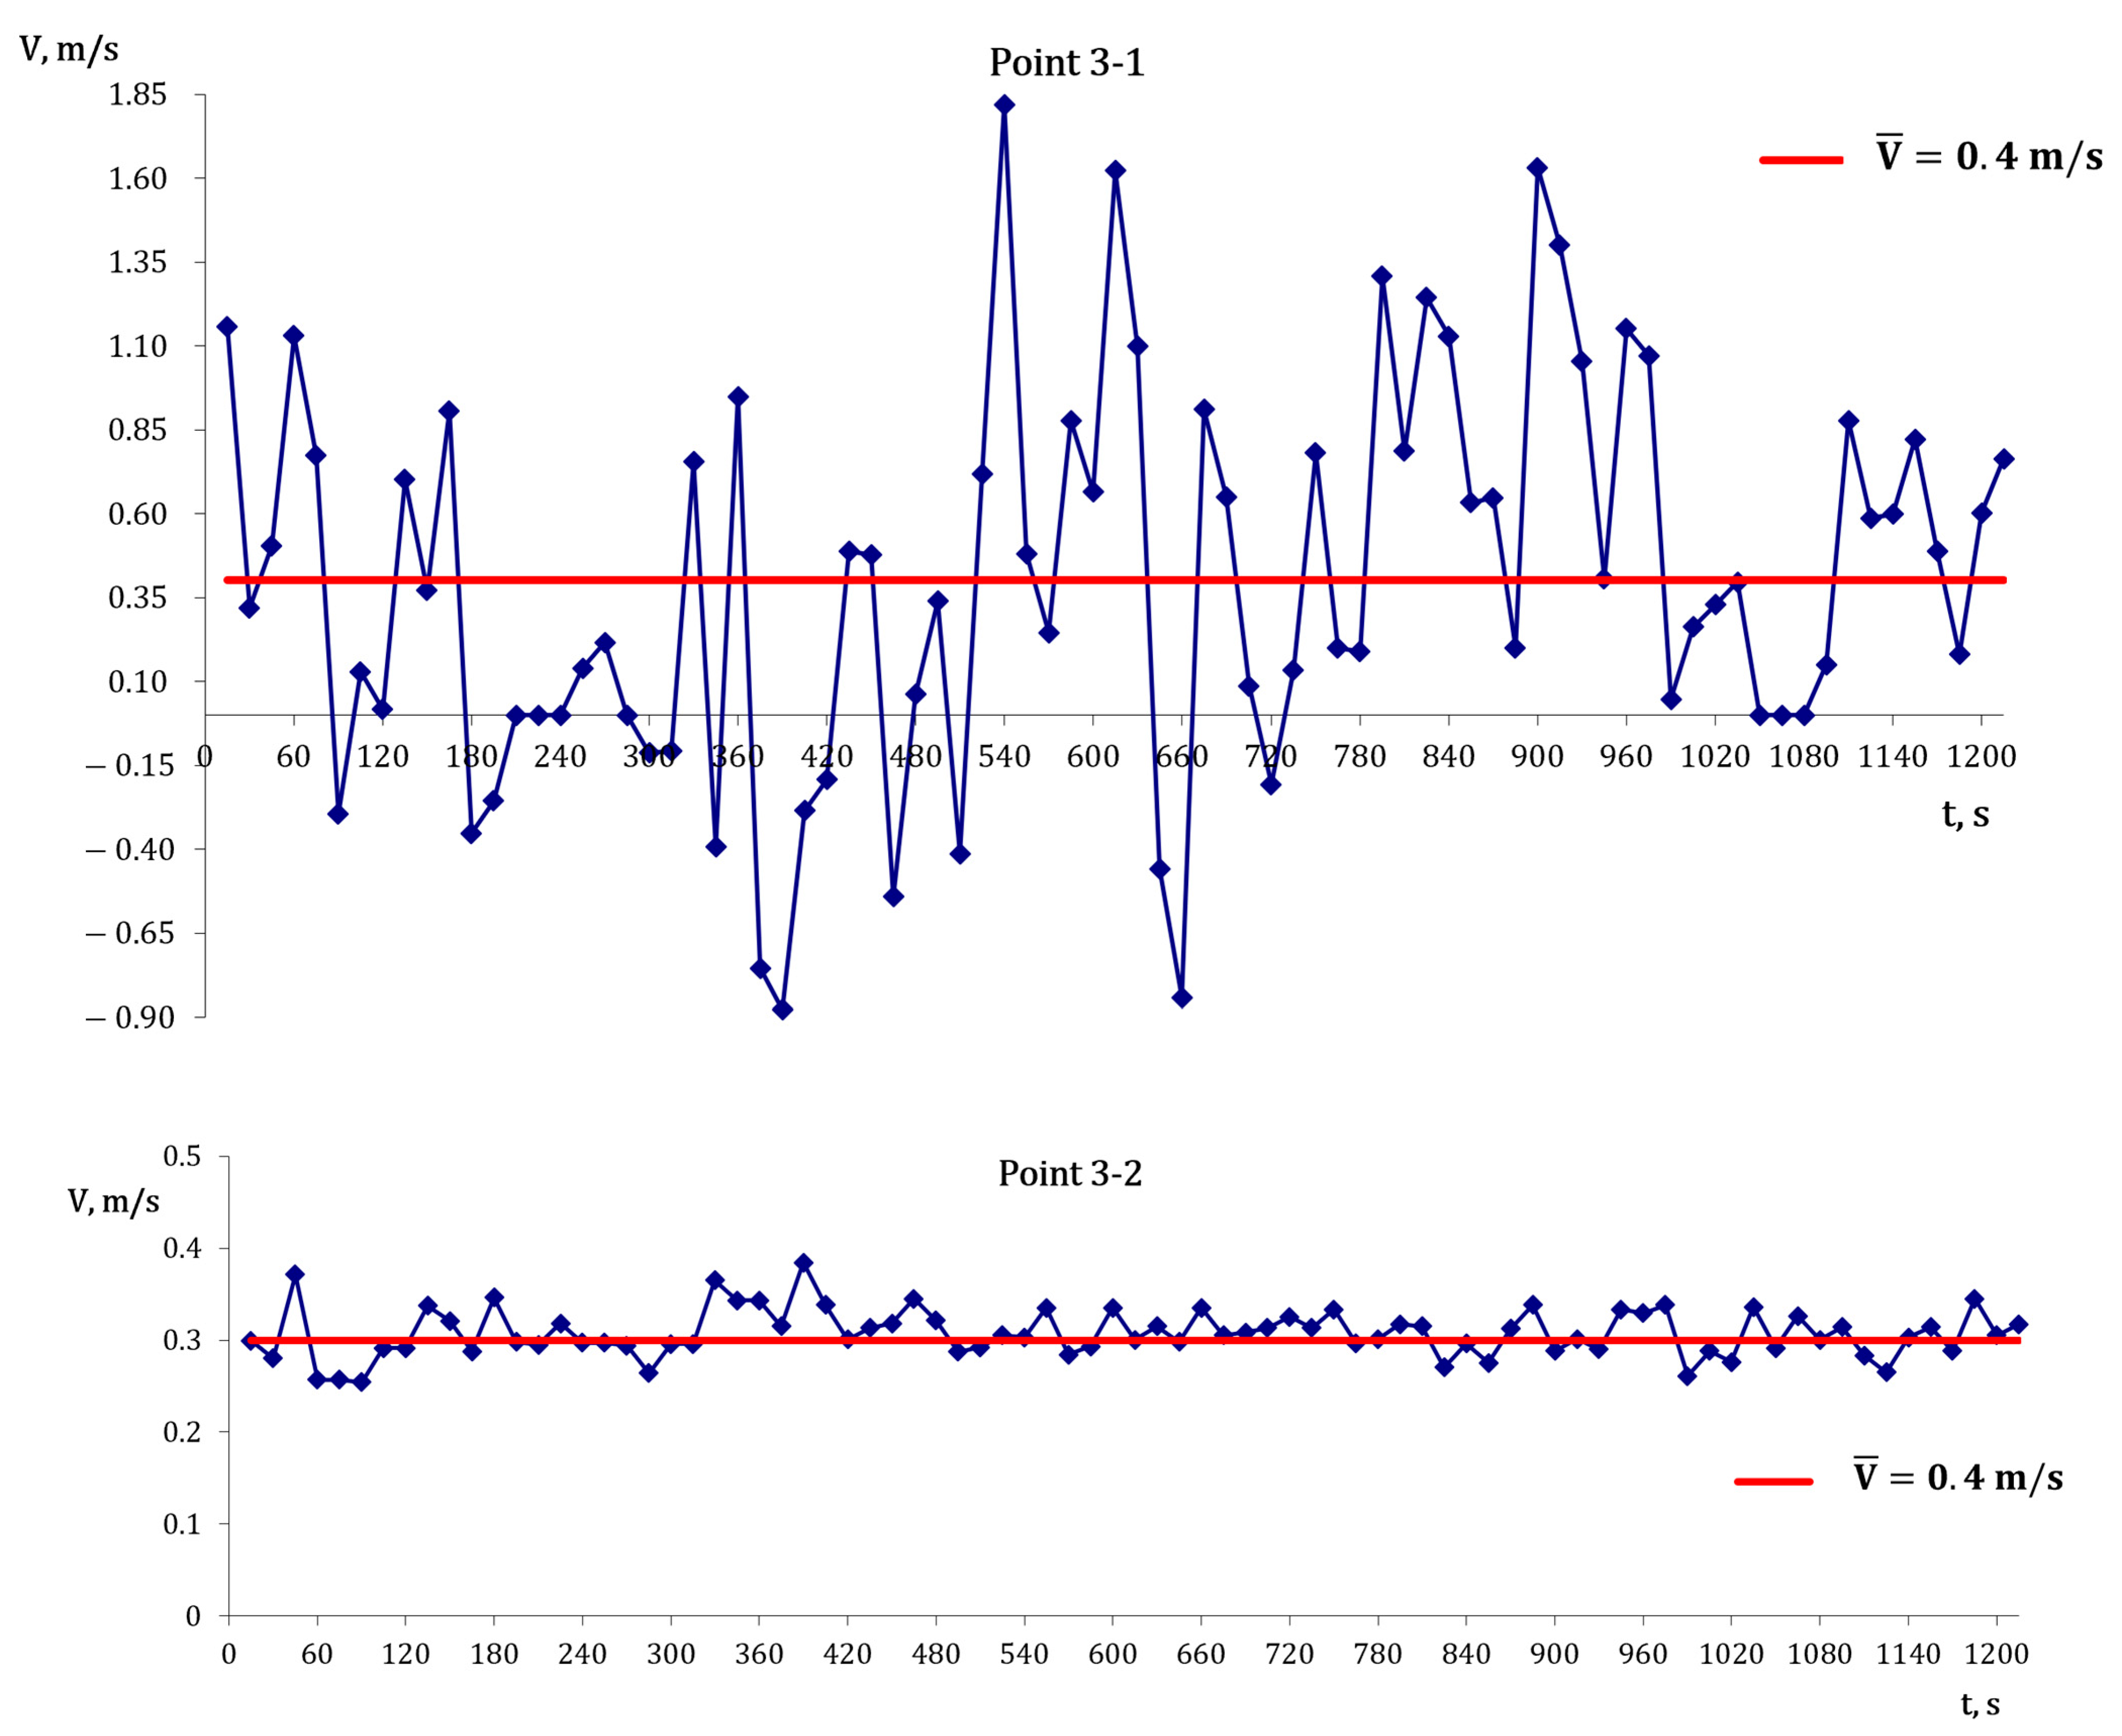
Figure 7 give the temporal variation of the velocity for the points corresponding to the free water surface and to the channel bed, respectively. In addition to instantaneous velocity values, the graphs also show the mean velocity
for each of the studied sections.
The flow shows significant fluctuations at measurement points near the free surface, with negative velocity readings at points 2-1 and 3-1. These negative velocities indicate that the flow has not completely stabilized after leaving the receiving chamber. Point 1-1 does not indicate negative velocities associated with vortex formation, but it does record instantaneous peaks reaching up to 1 m/s. These peaks mainly result from the discharge zone being close to the main reservoir. Although there are irregularities in the surface layer, the primary focus is on how hydrokinetic turbines perform under similar velocity fluctuations. For sections 2-2 and 3-2, the flow is significantly more stable in depth, and the velocities in these sections vary within the range of 0.05 to 0.1 m/s. Section 1-2 shows greater non-uniformity, caused by the proximity to the outlet of the test section. Regarding the mean velocity achieved, they fully meet the requirements specified by the characteristics of the hydrokinetic water turbines’ test models. An acceleration of the flow is observed both at the surface layer and near the channel bed. Of particular interest is how existing velocity fluctuations will impact the efficiency of the turbine runners and to what extent these variations will influence the operation of the turbine units.
Additional comparative analyses between the investigated measurement sections were introduced, demonstrating substantial spatial variations in turbulence intensity and flow stability. The turbulence intensity is obtained by:
where
—standard deviation, m/s and
—mean velocity, m/s.
At measurement point 1-1, the mean velocity was approximately 0.464 m/s, while the calculated turbulence intensity reached approximately 44.9%, indicating a strongly disturbed and highly unsteady flow regime. Large temporal velocity fluctuations were observed, suggesting the presence of intensive vortex activity and significant momentum redistribution within the flow.
In contrast, measurement point 1-2 demonstrated a lower turbulence intensity of approximately 16.5% at a mean velocity of approximately 0.408 m/s. Although turbulent pulsations were still present, the flow structure in this region was considerably more stable and exhibited reduced temporal velocity fluctuations.
At measurement point 2-1, the mean velocity was approximately 0.434 m/s, while the calculated turbulence intensity reached nearly 150%, indicating highly unstable hydrodynamic behavior driven by strong velocity fluctuations, vortex structures, and intermittent reverse flow regions. The occurrence of negative instantaneous velocities confirms the presence of local recirculation zones and intense momentum redistribution within the flow cross-section.
In contrast, measurement point 2-2 demonstrated substantially more stable flow conditions. The mean velocity was approximately 0.349 m/s, while the turbulence intensity was only about 5.5%, indicating a relatively uniform velocity field with limited turbulent pulsations and weaker vortex activity.
The comparison between the two measurement locations clearly demonstrates the highly non-uniform character of the flow structure within the laboratory channel. Local bed-induced disturbances and flow interaction with the channel geometry generate strong spatial variations in turbulence intensity and flow stability, even within the same hydraulic regime. At measurement point 3-1, the mean velocity was approximately 0.403 m/s, while the calculated turbulence intensity reached approximately 142%, indicating highly unstable hydrodynamic conditions with strong temporal velocity fluctuations. The presence of negative instantaneous velocity values confirms the formation of local vortex structures and intermittent reverse flow regions caused by momentum redistribution and turbulent flow interaction with the channel bed irregularities.
In contrast, measurement point 3-2 showed much more stable flow behavior. The mean velocity was around 0.308 m/s, and the turbulence intensity was roughly 8.5%, indicating a more uniform velocity field with weaker turbulent pulsations and reduced vortex activity.
The comparison between points 3-1 and 3-2 shows that even within the same experimental hydraulic regime, local flow conditions can vary significantly because of the interaction between the flow, the channel shape, and the rough-bed setup. Areas with higher turbulence intensity are linked to greater hydrodynamic instability, increased vortex formation, and more momentum exchange across the flow cross-section.
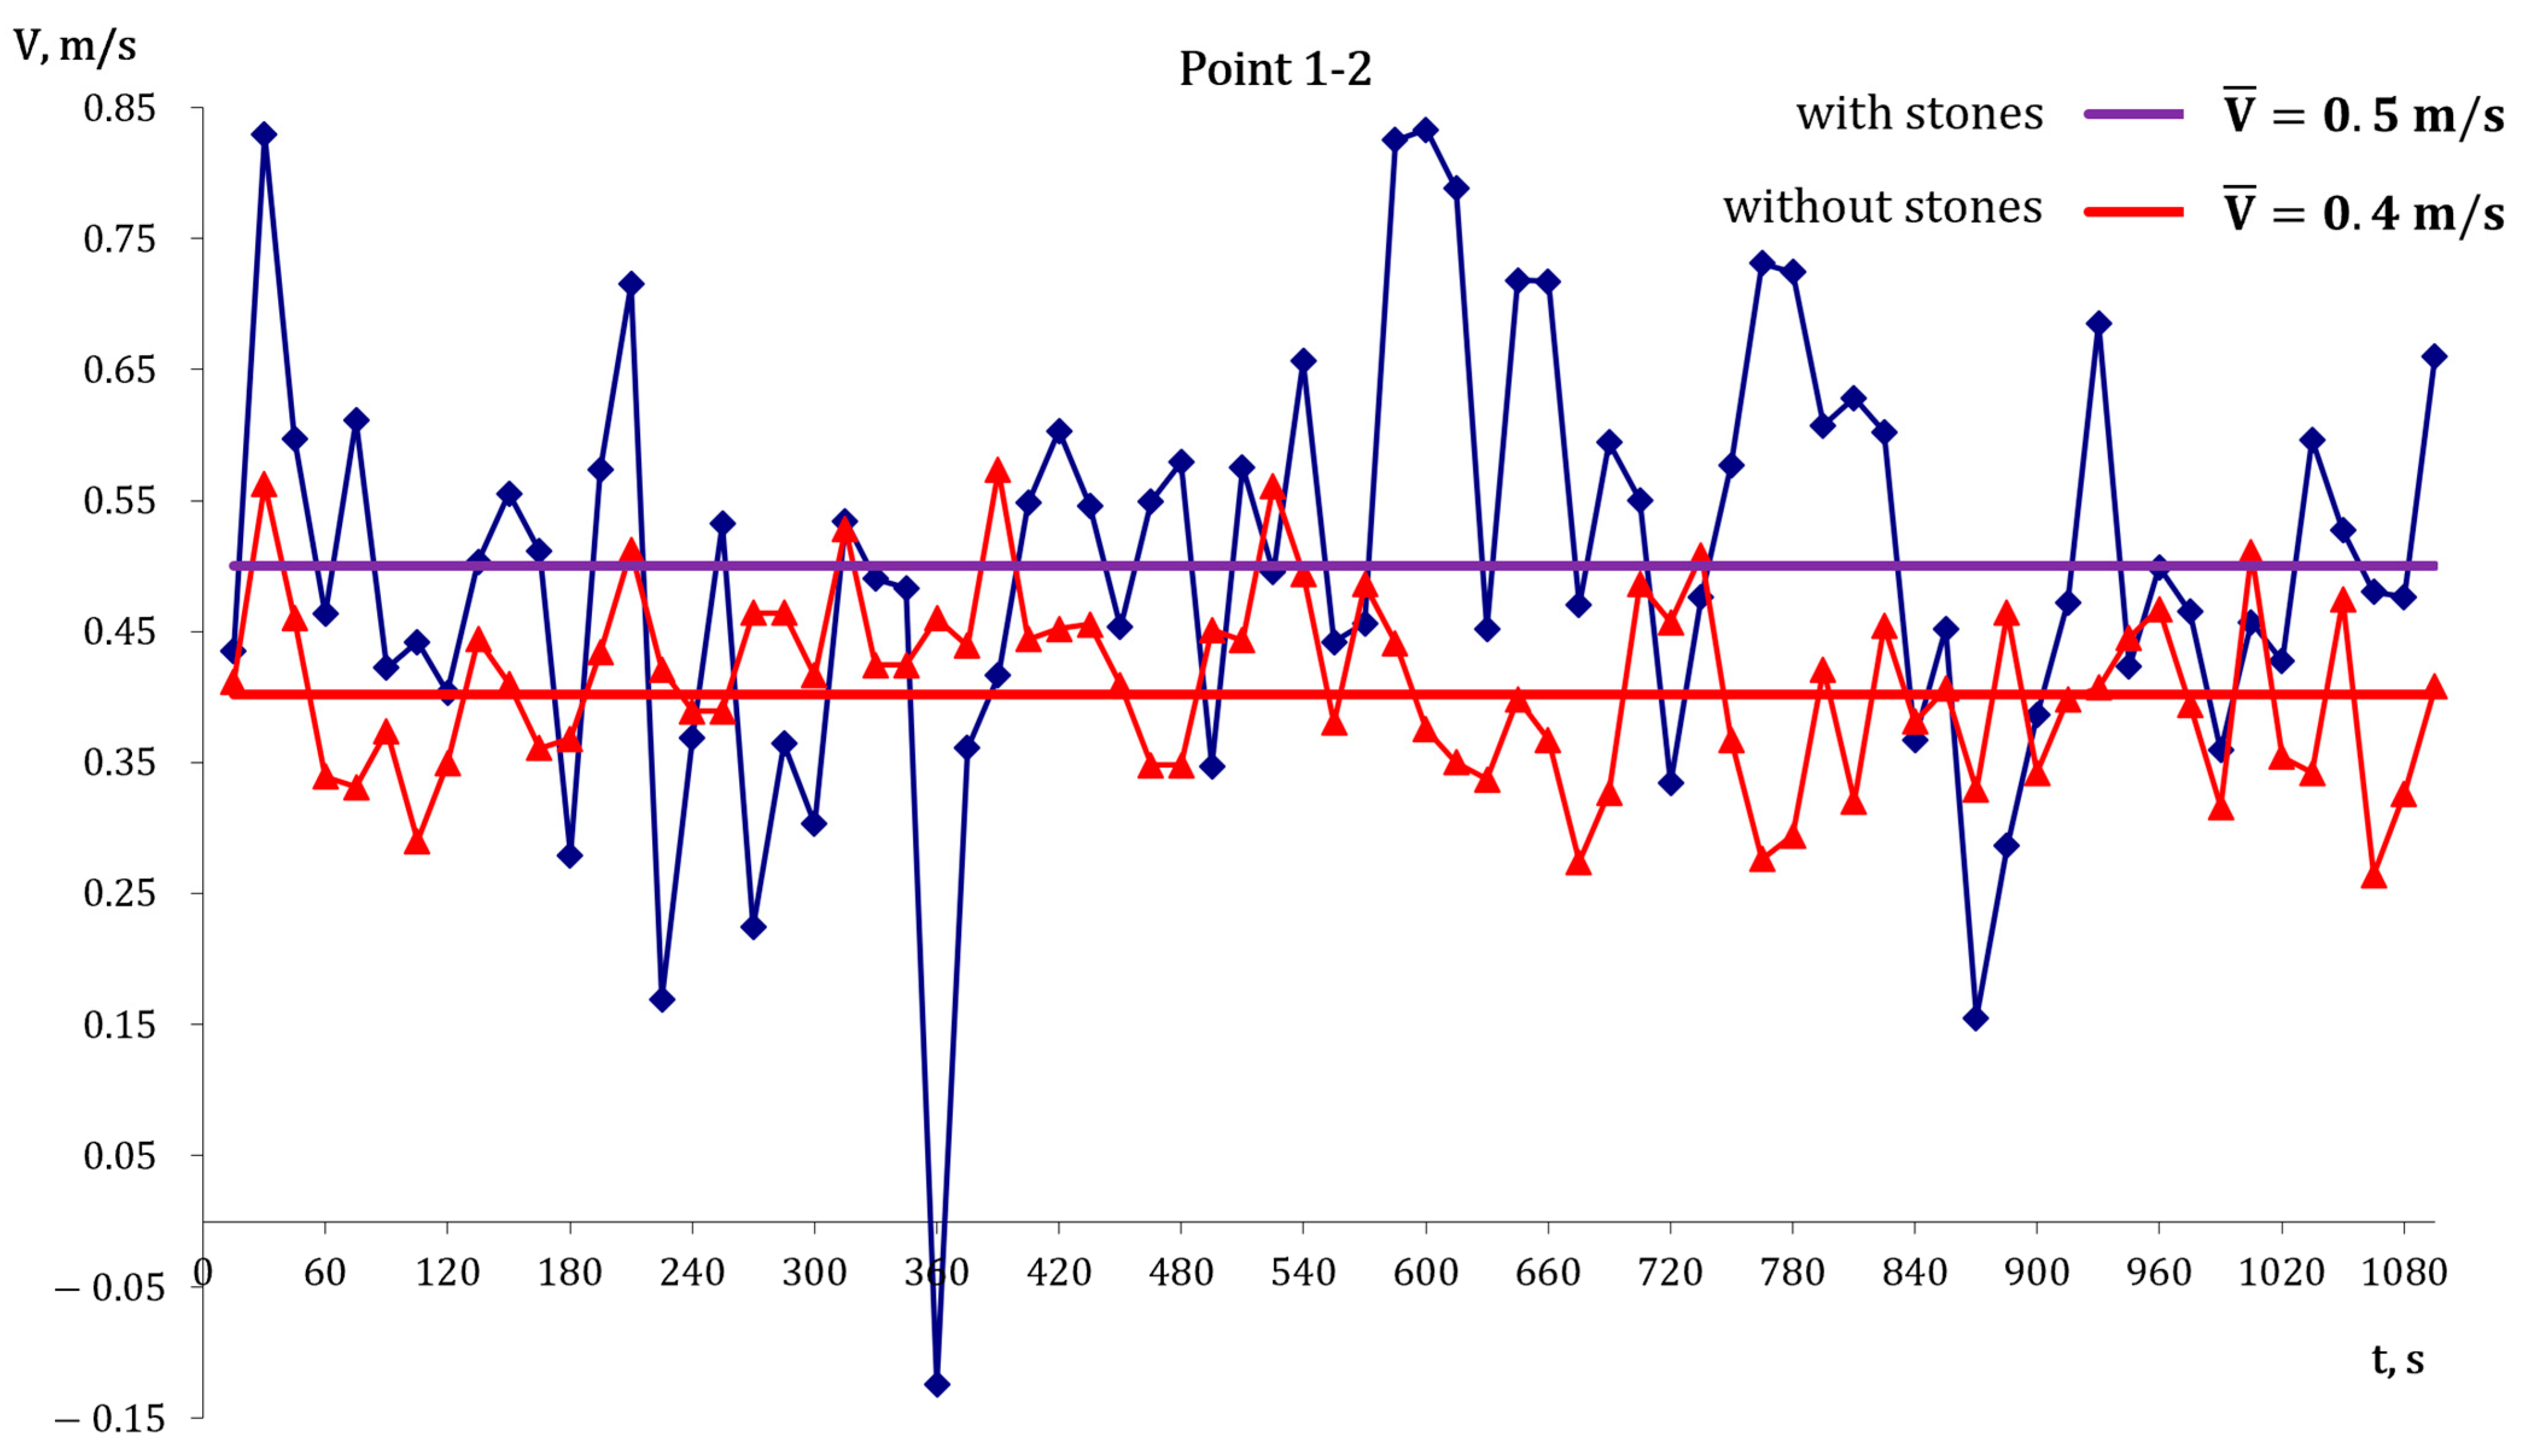
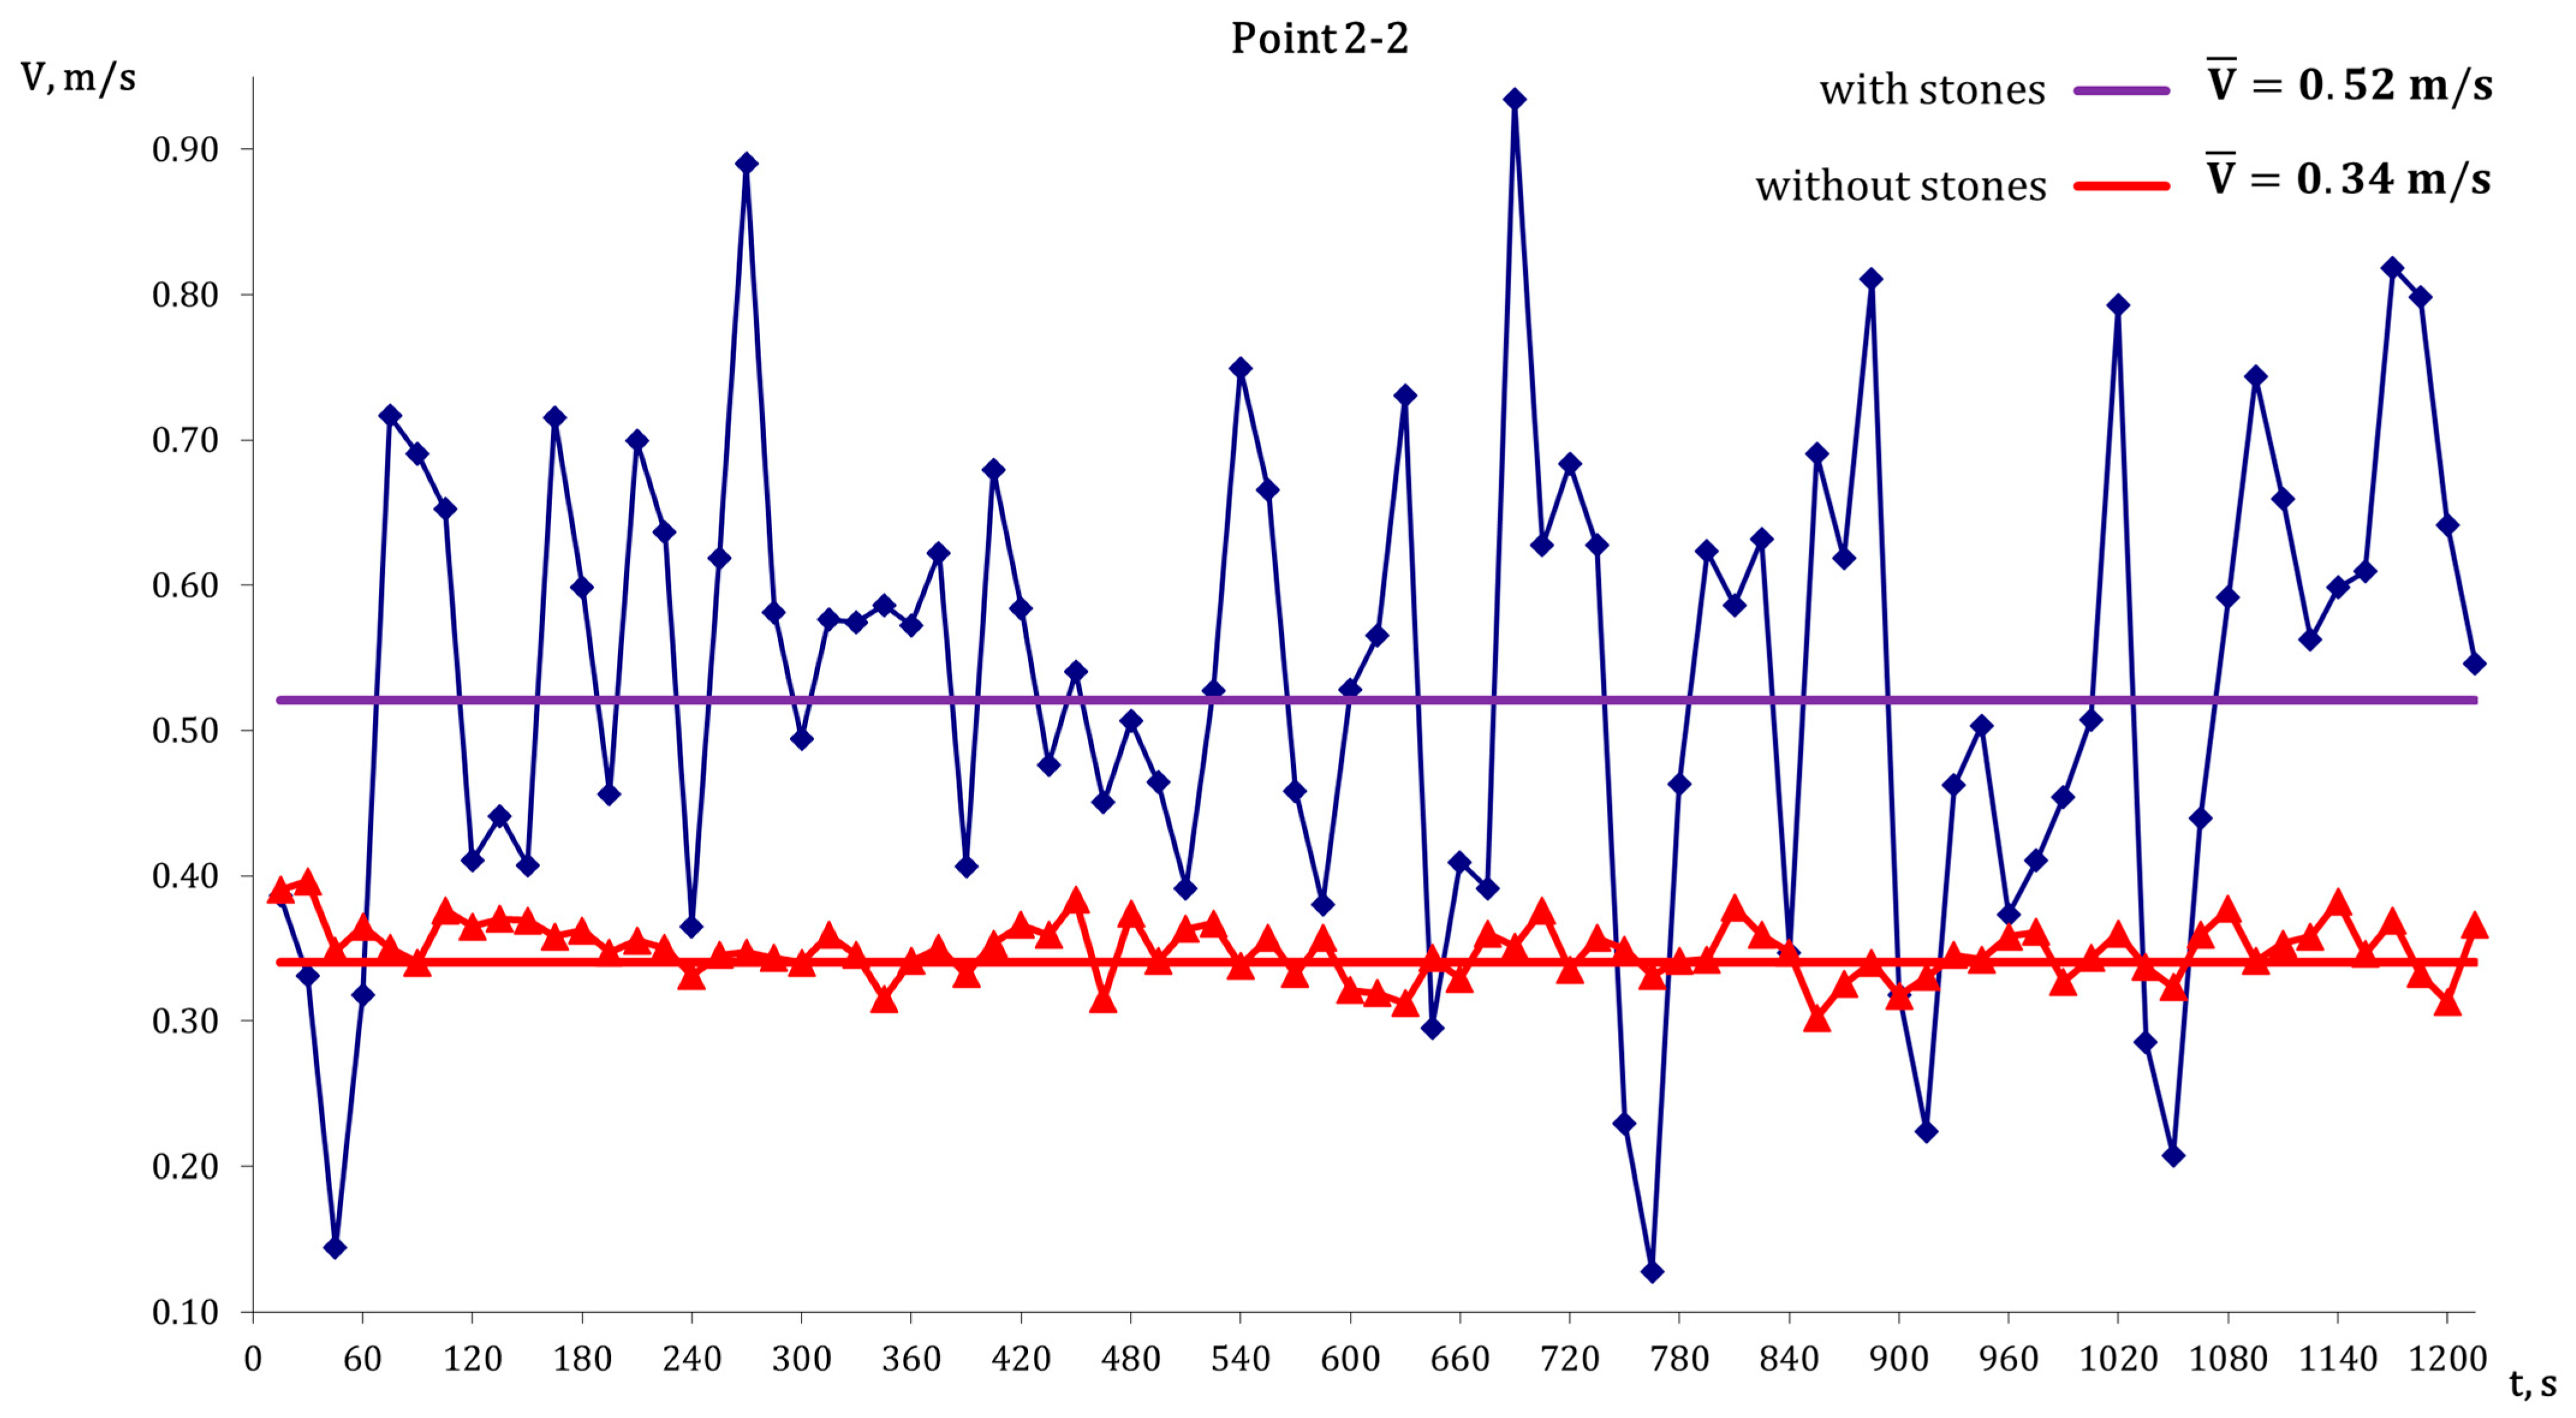
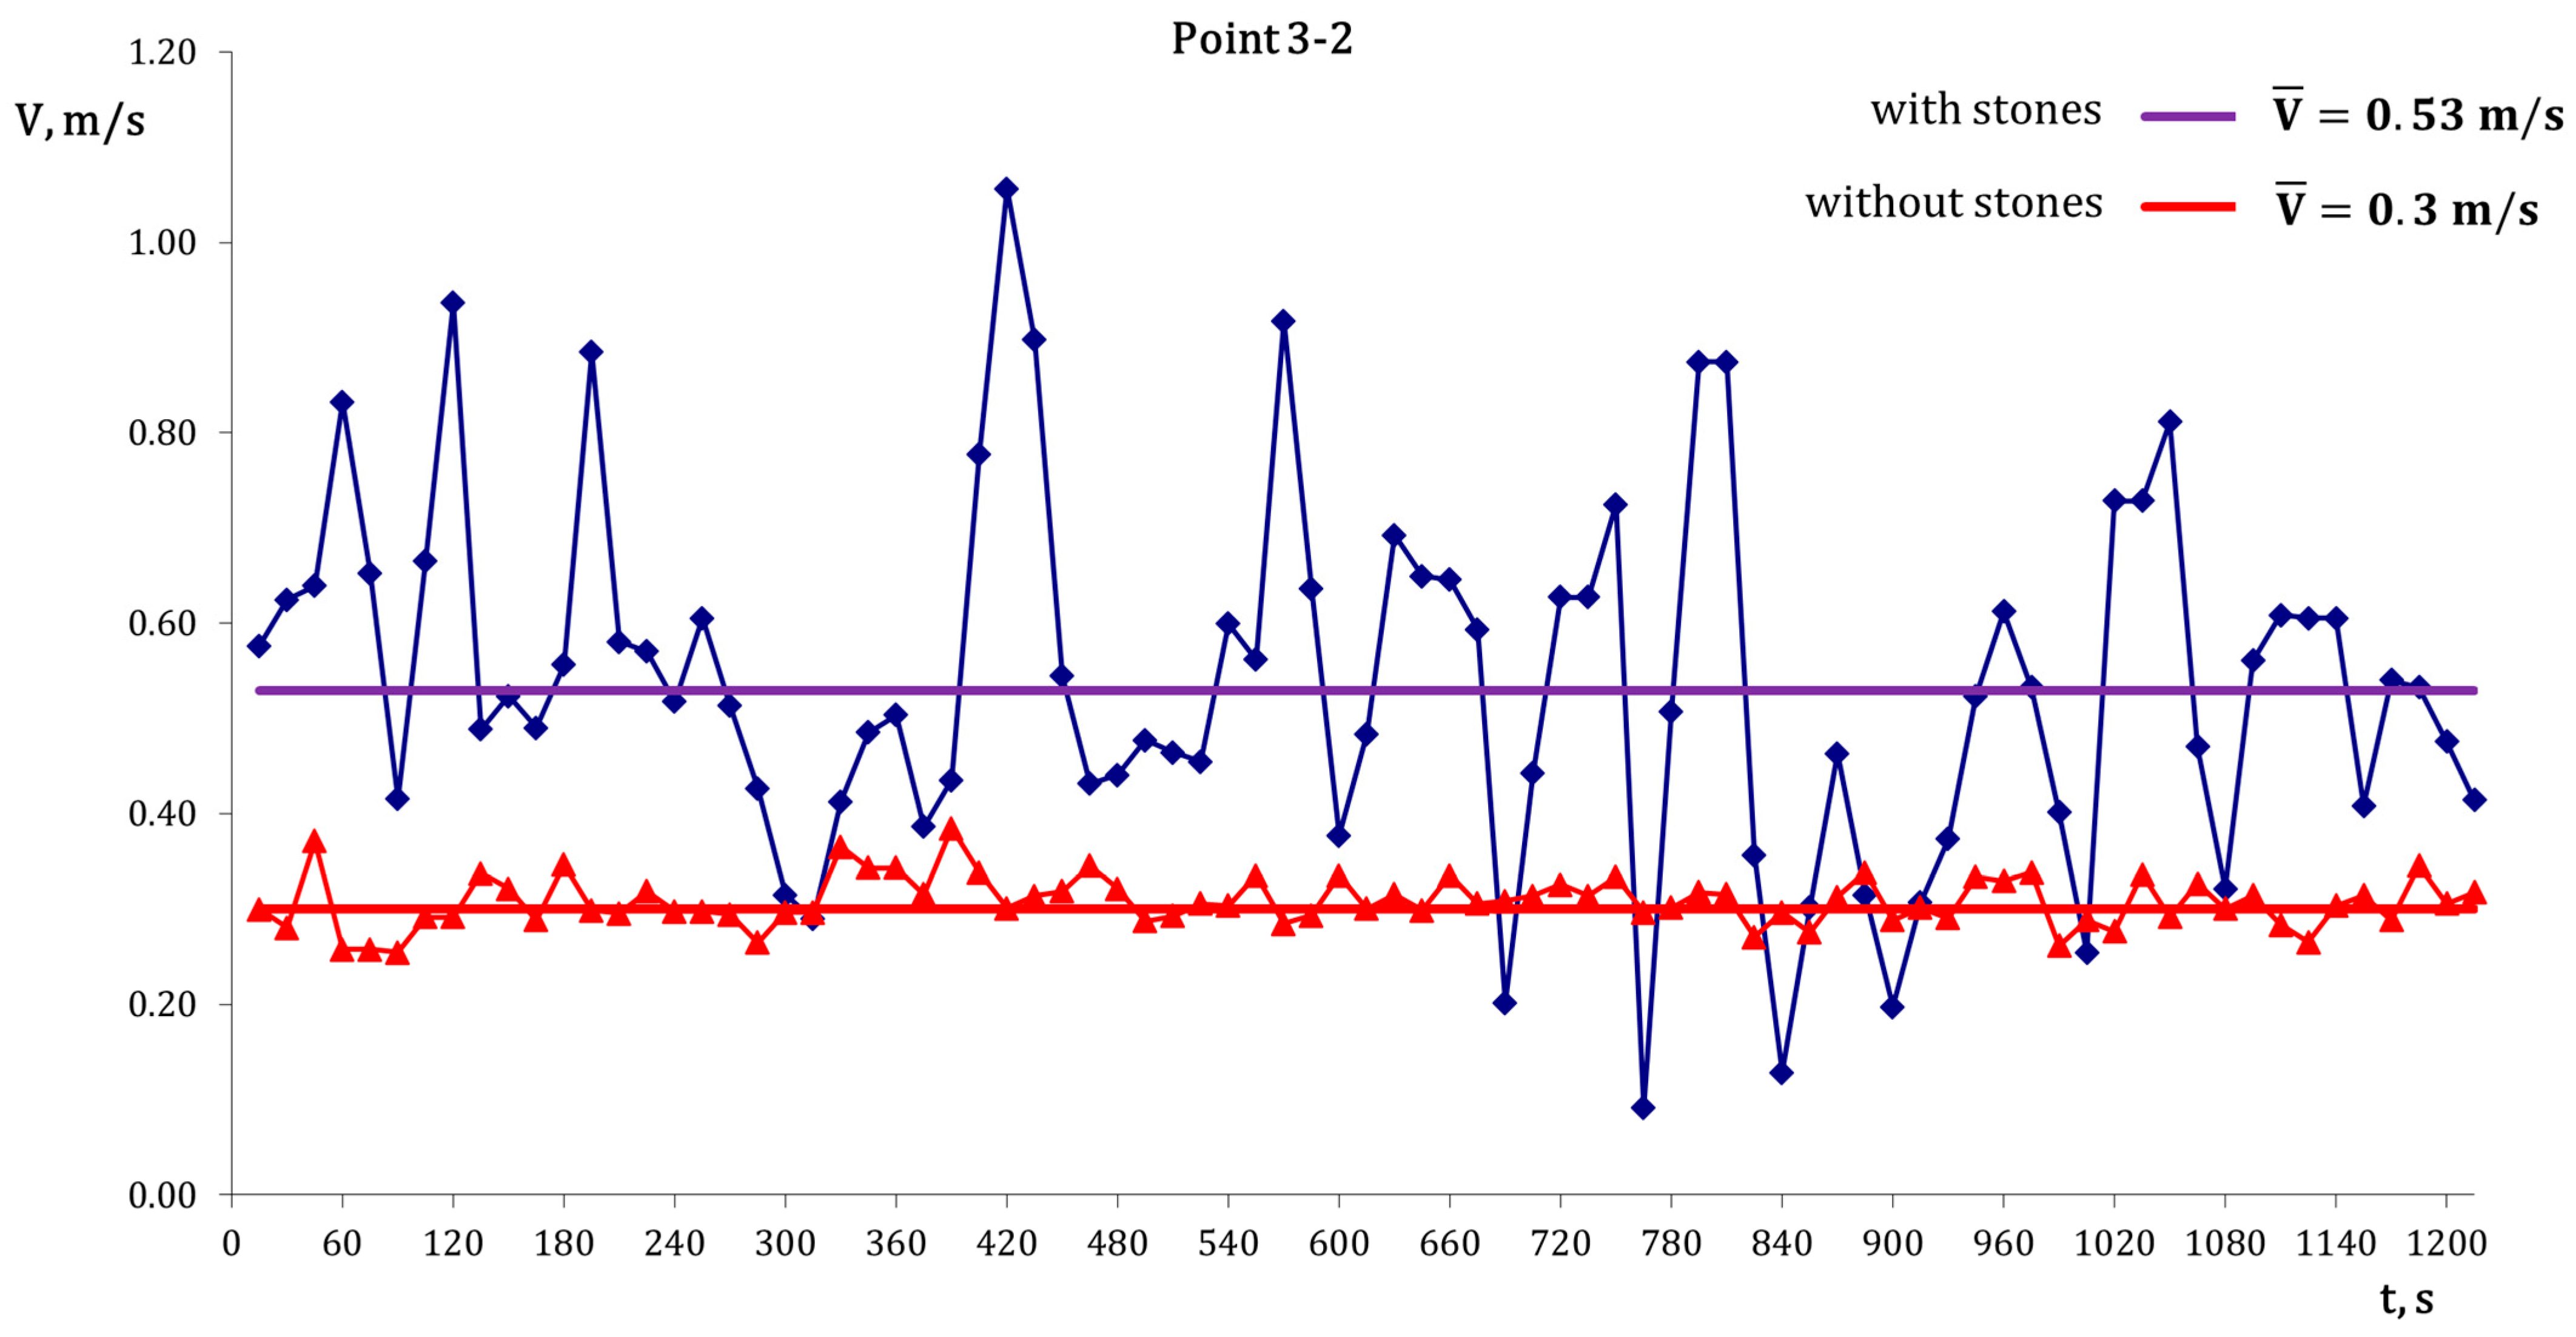
Figure 8,
Figure 9 and
Figure 10 present the velocity variation in each of the investigated sections for both test channel conditions—with and without bed roughness. The characteristics include both instantaneous velocity values and the corresponding mean values for each flow regime.
Table 3 shows the average velocity measurements under consistent hydraulic conditions for both smooth-bed and rough-bed setups. The results indicate a clear increase in velocity when bed roughness is added. The velocity increase ranges from 24.4% in section 1 to 74.7% in section 3, with an overall average increase of about 48.6% across all sections studied.
The observed behavior results from local flow acceleration caused by roughness elements and the redistribution of momentum within the confined laboratory channel. The effect becomes more evident downstream, where the interaction between the flow and bed irregularities produces stronger velocity gradients and increased turbulence.
Under smooth-bed conditions, the flow shows relatively stable behavior, with limited fluctuations around the mean velocity. The mean velocities decrease gradually along the channel, from approximately 0.40 m/s to 0.30 m/s.
When bed irregularities are introduced, a clear increase in both mean velocity and velocity fluctuations is observed across all measurement sections. The mean velocity increases to approximately 0.50–0.53 m/s, while instantaneous values reach peaks of up to 0.8–0.9 m/s.
The presence of roughness elements results in a more non-uniform velocity field, characterized by increased temporal variability and localized zones of higher.
5. Discussion
The experimental results demonstrate that bed roughness greatly impacts the structure of the velocity field in the test channel.
The increased amplitude of velocity fluctuations under rough-bed conditions indicates enhanced turbulence intensity. This is consistent with the development of a more complex turbulent boundary layer, driven by the interaction between the flow and the roughness elements.
At the measurement points near the channel bed, the velocity field appears more stable, with instantaneous velocities fluctuating within a narrower range around the mean. This behavior is explained by the influence of bed friction and the development of a turbulent boundary layer, which reduces large velocity variations. The mean velocities at the lower points gradually decrease along the channel, indicating progressive dissipation of flow energy due to hydraulic losses.
The comparison between the measurement points near the water surface and those near the channel bed shows a clear vertical velocity profile typical of open-channel flows. The flow velocity increases with height above the bed due to the reduced frictional drag from the bed.
Special attention should be given to the turbulence intensity values exceeding 100% at points 2-1 and 3-1. These high values occur when the standard deviation of velocity fluctuations exceeds the mean velocity. In this study, such elevated values are linked to intermittent negative velocities and brief flow reversals, indicating local recirculation zones and vortex-dominated flow structures. Consequently, the turbulence intensity observed reflects the highly disturbed nature of the flow rather than a measurement technique limitation.
The results obtained are directly relevant to the analysis of hydrokinetic water turbine performance. Hydrokinetic turbines extract energy from the flow’s kinetic energy, with available power proportional to the cube of the flow velocity. Therefore, velocity fluctuations and non-uniformities in the velocity field can significantly impact the turbine’s operating regime.
The presence of strong velocity fluctuations can lead to non-uniform torque, which in turn generates dynamic loads on the blades and mechanical components of the turbine. On the other hand, short-term flow accelerations may increase the turbine’s immediate power output. Particularly harmful effects may arise from local flow reversals, which can reduce turbine efficiency and cause temporary energy losses.
Therefore, the velocity–time relationships obtained not only allow assessing the mean flow velocity but also characterizing velocity fluctuations, which are crucial for accurately evaluating hydrokinetic turbine operating conditions. This analysis is especially important in laboratory studies, as it provides a basis for assessing how closely the conditions in the test channel approximate those in natural river flows.
Under the smooth-bed regime, the flow features a relatively stable velocity profile, with instantaneous velocities fluctuating within a limited range around the mean. The small observed fluctuations suggest a moderately developed turbulent flow. The average velocities in the three measurement sections are approximately 0.40 m/s, 0.35 m/s, and 0.30 m/s, respectively, showing a gradual decrease along the channel length.
After the placement of bed irregularities, a significant change in the hydrodynamic characteristics of the flow is observed. At all measurement points, a substantial increase in the mean velocity is recorded, reaching values in the range of approximately 0.50–0.53 m/s. This increase is accompanied by a significant rise in the amplitude of instantaneous velocity fluctuations, with peak values in some cases reaching approximately 0.8–0.9 m/s. The observed behavior can be explained by the interaction between the flow and bed roughness. The presence of rocky elements in the bed increases the effective hydraulic roughness of the channel and leads to the development of a highly turbulent boundary layer. As a result, vortical structures and zones of local momentum redistribution form, which contribute to both the intensification of turbulent fluctuations and the local acceleration of the flow between irregularities. An additional influence comes from the geometry of the laboratory channel, which causes a phenomenon known as the local flow acceleration due to flow constriction and momentum redistribution. Unlike natural riverbeds, where bed irregularities typically increase hydraulic resistance and reduce flow velocity, in the confined cross-section of the channel, they can cause a partial narrowing of the flow area, leading to local acceleration of the flow. These processes lead to notable changes in both the mean velocities and the turbulent structure of the flow. The results show that bed roughness enhances turbulent pulsations, increases velocity gradients, and redistributes momentum throughout the flow cross-section.
Although parameters such as turbulent kinetic energy and detailed vortex structures are not directly measured, the time-resolved velocity data provide indirect information about turbulence through velocity fluctuations and flow reversals.
The physical origin of the observed flow behavior is related to the interaction between the flowing water and the rough-bed elements. As the flow encounters irregularities, local flow separation occurs behind individual roughness elements, creating recirculation zones and vortex structures. These vortices take momentum from the mean flow and promote turbulent mixing between the near-bed region and the outer flow layer. Simultaneously, the narrowing of the effective flow passages between adjacent roughness elements causes local acceleration of the water, leading to increased instantaneous velocity values. The continuous generation, interaction, and dissipation of vortical structures result in enhanced turbulence intensity and larger fluctuations in velocity over time.
The measured negative velocity values observed at several locations can be explained by temporary flow reversals associated with local recirculation zones. These phenomena are typical in turbulent flows over rough boundaries, where momentum exchange and vortex shedding create highly uneven velocity patterns. The combined effect of flow acceleration, vortex formation, and momentum redistribution accounts for the significant differences seen between the smooth-bed and rough-bed setups.
From the perspective of hydrokinetic water turbine operation, these effects are crucial. The increase in the mean flow velocity leads to a significant rise in the available kinetic energy, as the power of the flow is proportional to the cubed velocity. On the other hand, intensified turbulent pulsations may result in higher dynamic loads on turbine components and lead to non-uniform torque generation.
Therefore, the results of the conducted experimental studies demonstrate that bed morphology is an important factor that must be taken into account both in laboratory testing and the analysis of hydrokinetic turbine performance under real river conditions.
As it is described in the previous sections, the experimental investigations were carried out under laboratory conditions, where the geometry of the water channel and the flow boundary conditions differ from those in natural river systems. The confined cross-section of the test channel and the controlled hydraulic parameters may cause a phenomenon known as the local flow acceleration due to flow constriction and momentum redistribution, in which the interaction among the walls, the bed, and the flow influences the development of turbulent structures and the distribution of the velocity field. Additionally, measurements were taken at a limited number of points, offering a representative, though not fully spatially continuous, description of the velocity field. Despite these limitations, the results provide a reliable qualitative assessment of flow dynamics and the impact of velocity fluctuations on the operational conditions of hydrokinetic water turbines.
As described in previous sections, the experimental investigations were conducted under laboratory conditions, where the geometry of the water channel and flow boundary conditions differ from those encountered in natural river systems. Additionally, the test facility was designed for studying model hydrokinetic turbines with a characteristic diameter of 100 mm operating at a flow depth of about 180 mm. While the controlled laboratory environment enables detailed analysis of flow phenomena and repeatable measurements, scaling effects may impact the quantitative relevance of the results to full-scale systems. Specifically, Reynolds number effects, channel confinement, and differences in bed morphology can influence turbulence structures and velocity distributions. Therefore, the results should be viewed primarily as a laboratory-scale evaluation of how bed roughness affects the velocity field. Future research is planned to incorporate experiments in larger scales and validation in real river conditions to assess the scalability of the observed phenomena and their implications for full-scale hydrokinetic turbine deployment.
The comparison between all investigated sections demonstrates that the turbulence intensity does not depend solely on the average flow velocity but is strongly influenced by the interaction between the flow and the rough-bed geometry. In the highly disturbed regions, the interaction between the flow and the bed irregularities generates local acceleration zones, vortex structures, and strong momentum redistribution, leading to substantial temporal velocity fluctuations and unstable hydrodynamic behavior.
An important observation is that the increase in average velocity under rough-bed conditions does not contradict classical open-channel hydraulics. The roughness elements partially occupy the flow cross-section and reduce the effective flow area available for the passage of water. Consequently, local continuity effects produce velocity acceleration between adjacent roughness elements. This mechanism differs from the classical bulk-flow behavior observed in natural rivers, where increased roughness generally results in increased hydraulic resistance and reduced average flow velocity. In natural rivers, increased roughness generally leads to increased hydraulic resistance and reduced bulk flow velocity. However, in the present laboratory configuration, the confined geometry of the channel and the partial obstruction caused by the roughness elements generate local flow constriction and acceleration between the irregularities. As a result, localized velocity peaks and intensified turbulent pulsations are formed.
The obtained results are highly relevant for hydrokinetic turbine applications. Since the available hydraulic power is proportional to the cube of the flow velocity, local velocity accelerations may significantly increase the instantaneous energy potential available to the turbine. At the same time, elevated turbulence intensity and strong velocity fluctuations may generate non-uniform blade loading, fluctuating torque, and increased mechanical stresses acting on turbine components. Therefore, turbulence intensity and temporal flow instability should be considered critical parameters in laboratory investigations of hydrokinetic turbine performance.
The performed turbulence analysis significantly improves the hydrodynamic interpretation of the investigated flow regimes and demonstrates that bed morphology plays a crucial role in the development of turbulent structures within laboratory water channels intended for hydrokinetic turbine investigations.
The results obtained show that the bottom roughness has a significant impact on the velocity field and the turbulent structure of the flow, leading to local accelerations and increased velocity pulsations. This has direct relevance for the operation of hydrokinetic turbines, as it affects both the available kinetic energy and the dynamic loads on the working elements. The results can be used to optimize the location of the turbines, for a more accurate assessment of the energy potential and for improving laboratory methods for their testing under conditions close to real ones.
Although parameters such as turbulent kinetic energy and detailed vortex structures are not directly measured, the time-resolved velocity data provide indirect information about turbulence through velocity fluctuations and flow reversals.
The occurrence of strong temporal velocity fluctuations, elevated turbulence intensity values, and intermittent negative velocity measurements at points 2-1 and 3-1 suggests the presence of complex turbulent flow structures within the channel. Although the current experimental methodology does not allow direct reconstruction of coherent vortical structures, these observations indicate the possible existence of local recirculation zones and nonlinear flow interactions generated by the bed irregularities. The temporary flow reversals observed in the velocity records may be associated with vortex formation and momentum redistribution processes occurring in the vicinity of the roughness elements. A detailed investigation of coherent flow structures and potential transitions between different nonlinear flow regimes would require spatially resolved measurement techniques such as Particle Image Velocimetry (PIV), Acoustic Doppler Velocimetry (ADV), or high-resolution CFD simulations and is considered a subject for future research.
Practical engineering implications can be drawn from the obtained results. The study shows that bed morphology significantly affects both the mean flow velocity and turbulence intensity within the turbine operating zone. Therefore, selecting sites for hydrokinetic turbine installation should consider not only the average flow velocity but also the local turbulence characteristics. Areas with excessive turbulence may cause fluctuating blade loads, increased mechanical stresses, and reduced operational stability. Simultaneously, localized velocity accelerations caused by bed irregularities might boost available kinetic energy and enhance energy extraction potential. For laboratory studies, the results suggest that realistic bed roughness should be included in test facilities to better simulate actual river conditions and provide more accurate turbine performance assessments.
The current study was carried out in a laboratory setting using a flow depth of 180 mm and a model hydrokinetic turbine with a 100 mm diameter. Although the calculated Reynolds numbers (5.4 × 10⁴–9.0 × 10⁴) show fully turbulent flow, the small scale of the model may cause effects related to channel confinement, wall proximity, and viscous interactions that are less significant in real rivers. Therefore, the velocity distributions and turbulence measurements should be viewed as representative of the experimental setup rather than exact predictions for full-scale river environments. However, the main physical processes, such as local flow acceleration, momentum transfer, and turbulence caused by bed roughness, are expected to stay qualitatively the same. Future studies in larger laboratory tanks and in real field conditions are required to evaluate scaling effects and to verify if the current results apply to actual hydrokinetic turbine deployments.
6. Conclusions
The present study demonstrates the significant impact of bed irregularities on the hydrodynamic flow structure in a laboratory water channel used to test hydrokinetic turbines. The results show that bed roughness greatly increases turbulent fluctuations, promotes vortex formation, and causes a notable redistribution of momentum across the flow cross-section.
It was found that the introduction of bed irregularities generated localized flow acceleration and increased the measured mean velocity within the investigated laboratory channel. This effect is attributed to partial flow constriction and momentum redistribution caused by the roughness elements and should not be interpreted as a universal consequence of bed roughness in natural open-channel flows.
The introduction of bed roughness generated localized velocity acceleration within the investigated measurement region. This effect is attributed to local flow constriction and momentum redistribution associated with the roughness elements and should not be interpreted as a general increase in the bulk flow velocity of rough-bed open-channel flows.
The relatively large roughness-to-depth ratio () indicates that the roughness elements occupied a significant fraction of the flow depth and were capable of generating substantial local confinement effects.
The calculated turbulence intensity values show that rough-bed conditions significantly enhance momentum redistribution, vortex formation, and flow instability within the laboratory channel. These effects are especially important for hydrokinetic turbine applications because higher turbulence intensity can both increase local kinetic energy and cause fluctuating hydrodynamic loads and unstable operating conditions for turbines. Therefore, turbulence intensity should be a key factor in the experimental study and optimization of hydrokinetic turbine performance under realistic flow conditions.
The findings highlight the importance of considering bed morphology in laboratory tests, as well as in the design and operation of hydrokinetic water turbines. Although the laboratory model has some limitations, the study provides a solid foundation for better understanding how turbines interact with real river conditions and for improving testing methods that will be used in future experiments.
Future work will focus on the identification of coherent flow structures, vortex dynamics, and possible transitions between different nonlinear flow regimes using advanced flow visualization techniques and numerical simulations.