Article

Sensitivity Improvement of DC and AC Magnetic Field Measurement Using NV Center via Frequency Modulation and Parameter Optimization

1
Metrology Center of Guangdong Power Grid Co., Ltd., Qingyuan 511547, China
2
School of Instrumentation and Optoelectronic Engineering, Beihang University, Beijing 100191, China
3
Beihang School, Beihang University, Beijing 100191, China
*
Author to whom correspondence should be addressed.
Appl. Sci. 2026, 16(14), 6844; https://doi.org/10.3390/app16146844 (registering DOI)
Submission received: 25 May 2026 / Revised: 30 June 2026 / Accepted: 5 July 2026 / Published: 8 July 2026
(This article belongs to the Section Applied Physics General)

Abstract

This article presents an experimental measurement scheme for direct current (DC) and alternating current (AC) magnetic fields based on optically detected magnetic resonance (ODMR) of nitrogen-vacancy (NV) centers in diamond. The work focuses on experimentally optimizing two established readout approaches on a custom platform rather than introducing a new ODMR mechanism. For DC magnetic field measurement, microwave frequency modulation combined with lock-in phase-sensitive demodulation is used to extract weak ODMR frequency shifts under magnetic-field perturbations. For AC magnetic field measurement, a Hahn echo quantum-control sequence is implemented, and the response of the NV centers to a 200 kHz AC signal is optimized by adjusting the free-evolution time. The results show that the platform can separately detect DC and AC magnetic fields with improved signal discrimination and robust responses under the tested conditions, providing experimental guidance for parameter selection in NV-center magnetometry.

1. Introduction

Nitrogen-vacancy (NV) centers in diamond have attracted substantial interest in quantum sensing because their spin states can be initialized and read out optically at room temperature [1,2]. A negatively charged NV center consists of a substitutional nitrogen atom adjacent to a vacancy and has a triplet ground-state electron spin (S = 1) with a zero-field splitting of approximately 2.87 GHz [3]. Optically detected magnetic resonance (ODMR) enables optical readout of these spin states through laser excitation and microwave driving [4,5]. NV centers, therefore, provide solid-state quantum sensors with high spatial resolution [6,7] and sensitivity to magnetic fields [8,9,10,11], temperature [12,13,14], and electric fields [15,16,17]. For weak magnetic field detection, high precision is required in applications ranging from biomedical magnetic sensing to micro- and nanoscale current mapping [18,19,20]. Practical measurements are often affected by background fluorescence, laser-power drift, microwave instability, and low-frequency noise; improving the signal-to-noise ratio (SNR) and the robustness of the readout remains an important engineering problem [21].
Recent advances in NV-center magnetometry have improved detection protocols [8,9,22,23], hardware integration [10,24,25,26,27], and hybrid sensing architectures [28,29,30]. For direct current (DC) magnetic field measurements, frequency modulation (FM), phase-sensitive lock-in detection, and magnetic resonance frequency locking are widely used to reduce the influence of background fluorescence, temperature drift, and electronic 1/f noise [8,9,10,31]. For example, differential or dual-frequency-locking approaches can separate magnetic and temperature responses and improve the usable dynamic range [8,10]. These studies provide the methodological basis for the present work. We evaluate how FM/lock-in readout and Hahn echo AC sensing can be configured and optimized within the same experimental platform, and we report the parameter choices and response characteristics obtained under our specific operating conditions.
For DC magnetic field detection, the continuous-wave (CW) ODMR configuration is frequently adopted due to its streamlined optical architecture and detection mechanism [24]. Magnetic-field strength is typically inferred from shifts in the Zeeman-split CW-ODMR spectrum. However, because traditional CW methodologies depend on absolute fluorescence intensity, they are highly susceptible to background fluorescence noise, laser power fluctuations, and low-frequency noise, fundamentally restricting sensitivity and stability during prolonged measurements [18]. To circumvent these limitations, modulation and demodulation techniques offer a robust alternative. Microwave FM integrated with phase-sensitive lock-in detection effectively transposes the magnetic field response to a high-frequency modulation sideband [32]. This frequency shift suppresses low-frequency background noise, markedly enhancing the SNR. Nevertheless, maximizing the discriminator slope and linear response range for specific experimental setups requires systematic optimization of the modulation depth and frequency [9].
Conversely, for alternating current (AC) magnetic field detection, direct time-domain measurements relying on ODMR frequency shifts generally prove suboptimal due to inherent response speed and bandwidth constraints. Consequently, spin-coherence control protocols provide an effective approach. Representative techniques, including the Hahn echo sequence, apply π-pulses to invert spin evolution, thereby negating quasi-static environmental magnetic noise and extending the NV center’s coherence time [15,33,34,35,36]. This mechanism directly facilitates resonance-enhanced sensing of alternating magnetic fields. Crucially, the sensitivity of this approach depends intrinsically on aligning the free evolution time with the external field’s frequency. When the timing is mismatched, phase accumulation is partly canceled, reducing the measured response; longer evolution times are additionally affected by decoherence. Therefore, realizing high-sensitivity AC magnetic field measurements strictly requires systematically evaluating the free evolution time’s influence on detection efficiency and optimizing these parameters for specific signal frequencies.
Addressing these inherent challenges, this study optimizes DC and AC magnetic field measurements by developing an experimental framework predicated on lock-in amplifier-enhanced ODMR readout. For DC magnetic fields, we integrate microwave frequency modulation with phase-sensitive detection to isolate weak frequency shift signals from dominant background noise, yielding highly robust measurements. For AC magnetic fields, we implement a Hahn echo pulse sequence, systematically scanning the free evolution time to identify optimal detection parameters for specific frequency targets.

2. Materials and Methods

To facilitate the high-sensitivity measurement of diverse magnetic fields, we constructed an ODMR platform based on diamond NV centers. This architecture systematically integrates microwave frequency modulation, targeted quantum manipulation sequences, and lock-in amplification to realize differential signal extraction and optimized readout modalities.

2.1. Experimental System

The sensing substrate employs a CVD diamond from Element Six featuring a 4.5 ppm NV concentration and a polished (100)-oriented surface. The optical excitation pathway originates with a 532 nm laser (MSL-R-532-1W, Changchun New Industries Optoelectronics Technology Co., Ltd., Changchun, China), whose output is directed through an acousto-optic modulator (MT110-B50A1-VIS, AA Opto-Electronic, Orsay, France). Subsequently, the first-order diffracted beam, chosen for its peak efficiency, is routed via a dichroic mirror into a 40× objective lens (UPLFLN40X, Olympus, Tokyo, Japan, NA = 0.75) to focus on the sample. Fluorescence collection is continuously monitored by an avalanche photodiode detector (APD430, Thorlabs, NJ, USA). Concurrently, a custom-built three-axis Helmholtz coil assembly generated controllable magnetic fields, complemented by permanent magnets establishing the requisite bias field. The microwave driving framework links a signal generator (SG386, Stanford Research Systems, CA, USA) and a power amplifier (ZHL-16W-43-S+, Mini-Circuits, NY, USA) to a proprietary antenna situated above the sample, exclusively driving the NV center’s electron spin resonance transitions. For AC measurements, temporal synchronization across all hardware modules is strictly governed by a pulse timing controller (Pulse Streamer 8/2, Swabian Instruments GmbH, Stuttgart, Germany).

2.2. Energy Level Structure of Diamond NV Centers

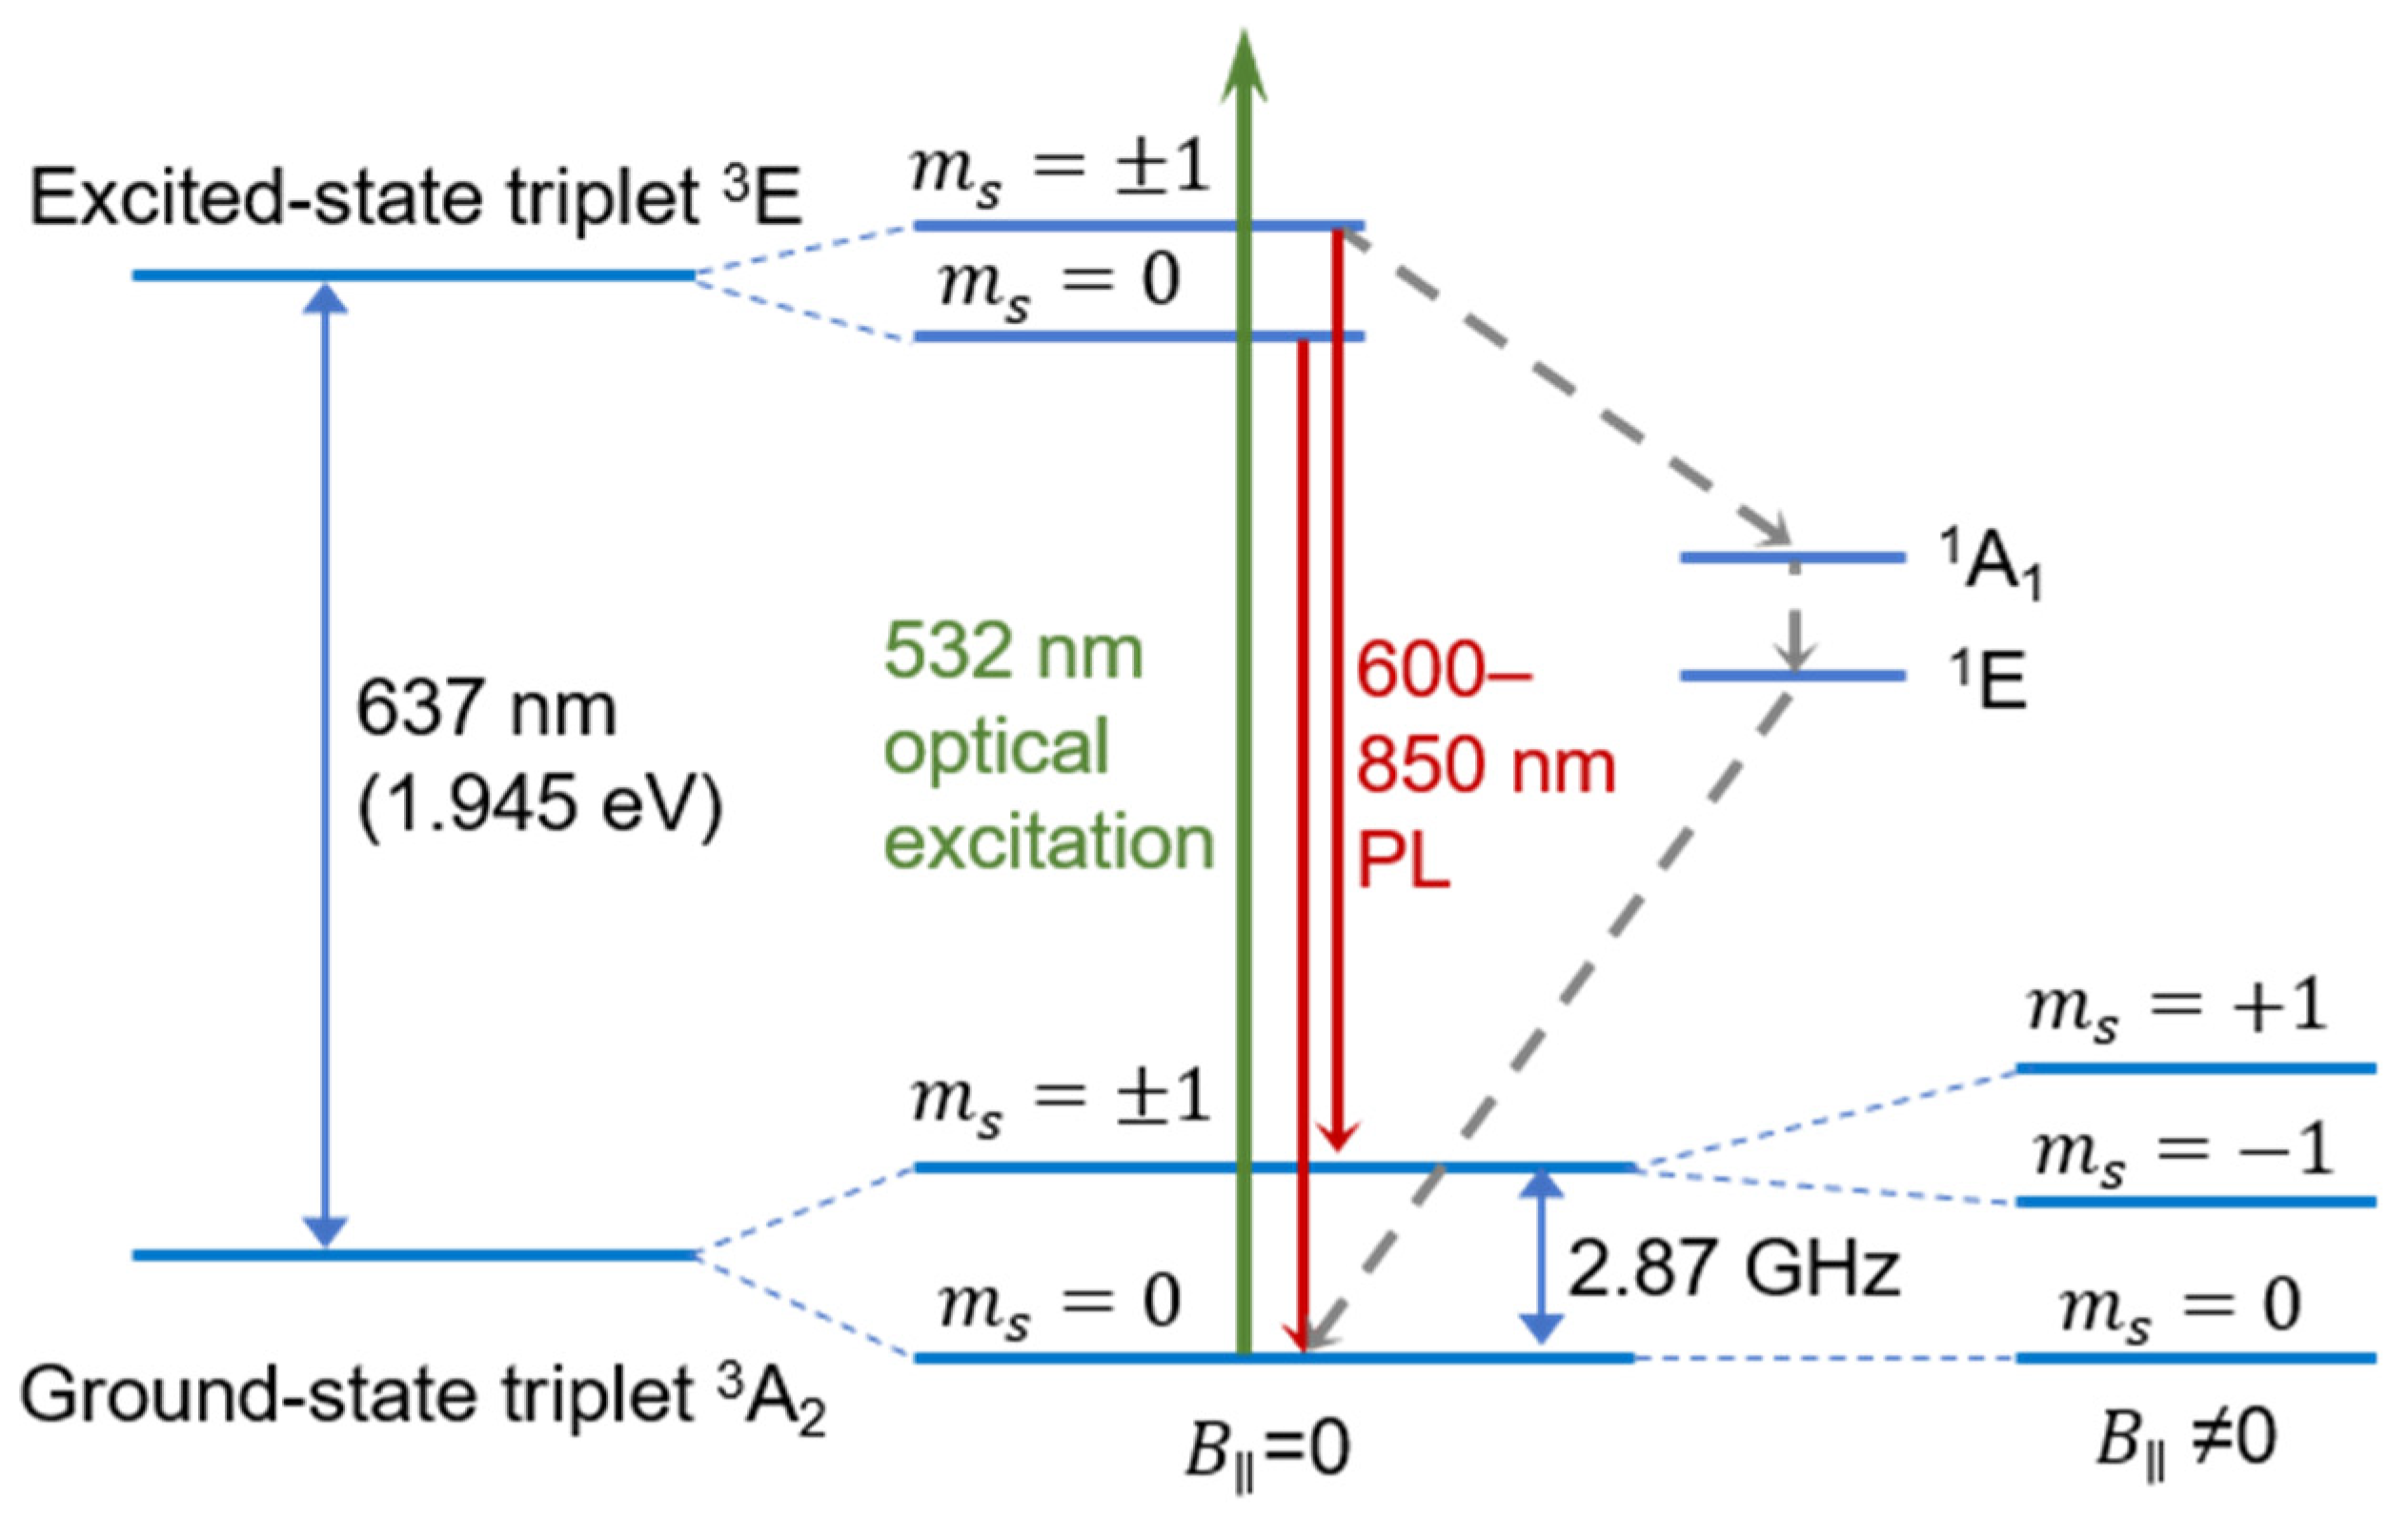
The zero phonon line wavelength corresponding to the transition from the ground state 3A2 to the excited state 3E within the NV center lies at 637 nm (see Figure 1). Room-temperature optical excitation typically proceeds non-resonantly due to phonon interactions. Consequently, irradiating the defect with wavelengths shorter than 637 nm non-resonantly excites ground-state electrons into the excited state while largely preserving the electron-spin projection throughout the process.
After excitation to 3E, the NV center relaxes through either radiative decay to 3A2, which produces photoluminescence, or a non-radiative intersystem-crossing pathway through the singlet states. The intersystem-crossing probability is spin dependent: population in the m s = ± 1 is more likely to enter the singlet pathway, whereas population in the m s = 0 is more likely to return radiatively. Continuous 532 nm illumination, therefore, preferentially polarizes the ground-state population into the brighter m s = 0 sublevel. Microwave driving transfers population between m s = 0 and m s = ± 1 , and the resulting fluorescence contrast forms the basis for ODMR spin-state readout.

2.3. DC Magnetic Field Measurement Method: Microwave Frequency Modulation and Demodulation

To extract the characteristic frequency shifts induced by Zeeman splitting, the system continuously sweeps the microwave frequency while recording the corresponding variations in ODMR fluorescence intensity. Because the magnetic field originates from fixed Helmholtz coils, identifying the sample’s optimal orientation is paramount. Following bias field calibration, a 500 mA probing current is sequentially applied along the three orthogonal coil axes, allowing researchers to monitor ODMR peak displacements and identify the coil axis producing the largest resonance-frequency shift.
To substantially elevate sensitivity to minute field perturbations, the protocol incorporates microwave FM alongside lock-in amplifier demodulation.
The microwave source output frequency was sinusoidally modulated at a fixed modulation frequency, expressed as follows:
f M W = f 0 + f d e v c o s 2 π f m o d t
where f 0 is the center frequency, f d e v is the modulation depth, and f m o d is the modulation frequency.
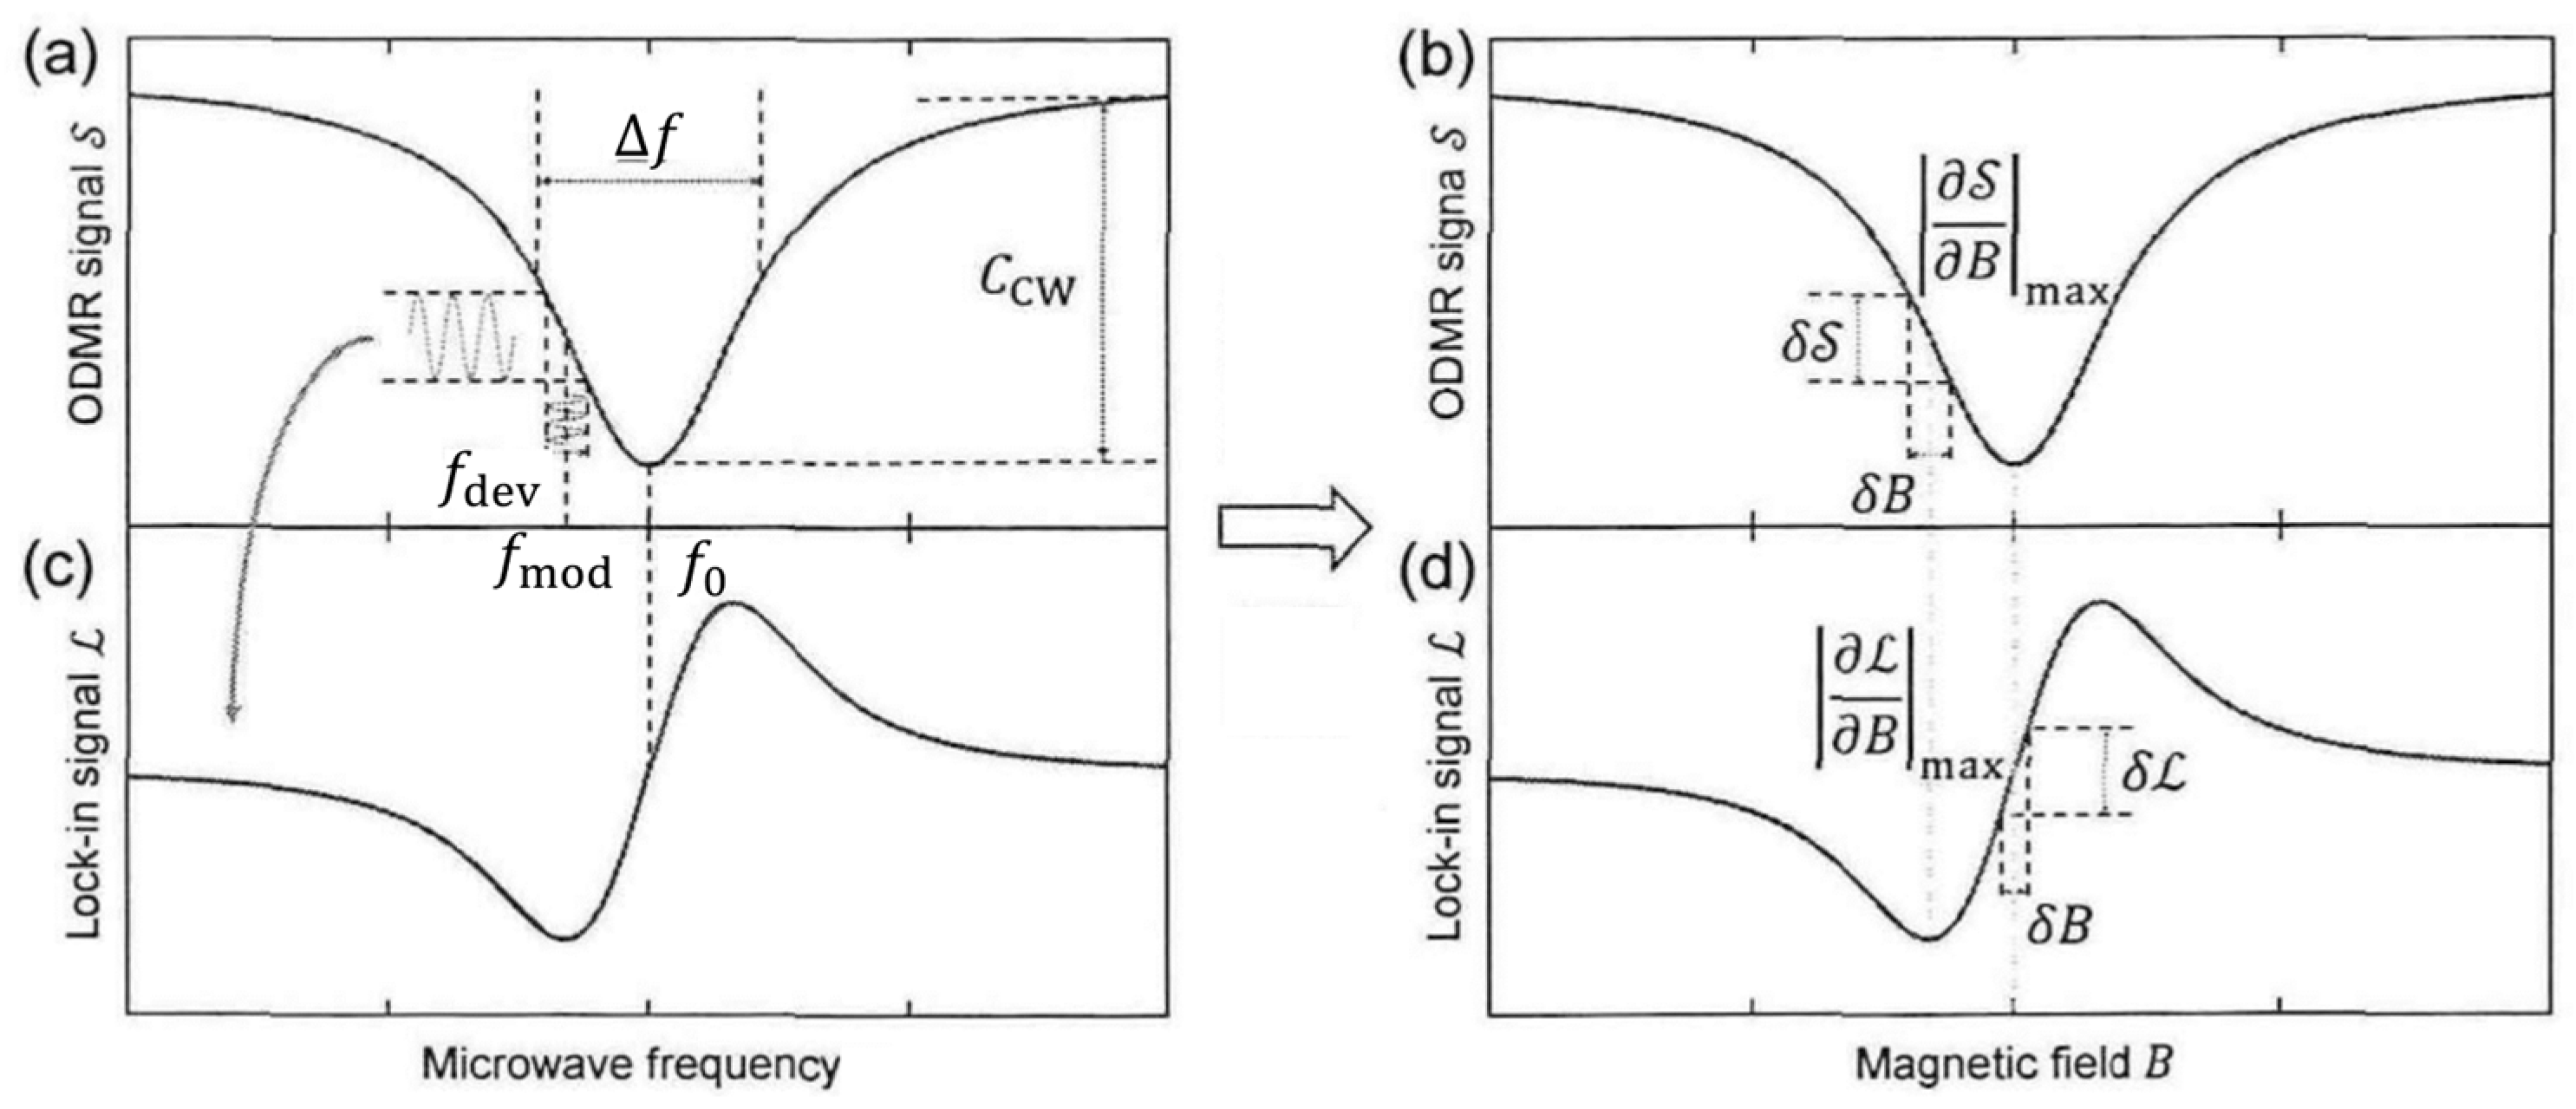
This active frequency modulation imposes periodic variations upon the ODMR fluorescence signal. Employing the modulation frequency as a reference, the lock-in amplifier demodulates this signal, yielding the first derivative of fluorescence intensity with respect to microwave frequency. This resultant derivative spectrum demonstrates heightened sensitivity to subtle frequency displacements (see Figure 2).
Subjected to weak external DC magnetic fields, the NV center’s resonant frequency exhibits minute drifts, which the lock-in amplifier’s output subsequently correlates into quantitative magnetic field variations. This specific architecture improves magnetic-field resolution without sacrificing measurement speed.

2.4. AC Magnetic Field Measurement Method: Hahn Echo Quantum Sequence and Sensitivity Optimization

Because direct time-domain tracking of ODMR frequency shifts is inefficient for AC magnetic-field detection, the protocol exploits coherent spin evolution to establish a frequency-selective response. The Hahn echo is generated by the standard π/2–τ/2–π–τ/2 sequence. In the fluorescence-readout implementation used here, an additional π/2 analysis pulse is applied before optical readout to map the accumulated phase onto a population difference.
During the free evolution interval designated as τ, the external AC magnetic field continuously couples with the NV center’s spin. When the applied AC frequency synchronizes with the inverse of this evolution time (1/τ), the induced phase reversal across the two τ/2 periods circumvents full cancelation by the echo sequence. This dynamic yields a net spin phase accumulation that translates directly into observable fluorescence intensity modulation. The governing relationship explicitly links signal intensity to these accumulated phase variations.
To isolate peak sensitivity, the system systematically modulates τ, comprehensively recording signal amplitude fluctuations across distinct parameter values. Subsequent fitting analysis identifies the specific τ value yielding the maximal response, establishing it as the definitive measurement parameter.

3. Results

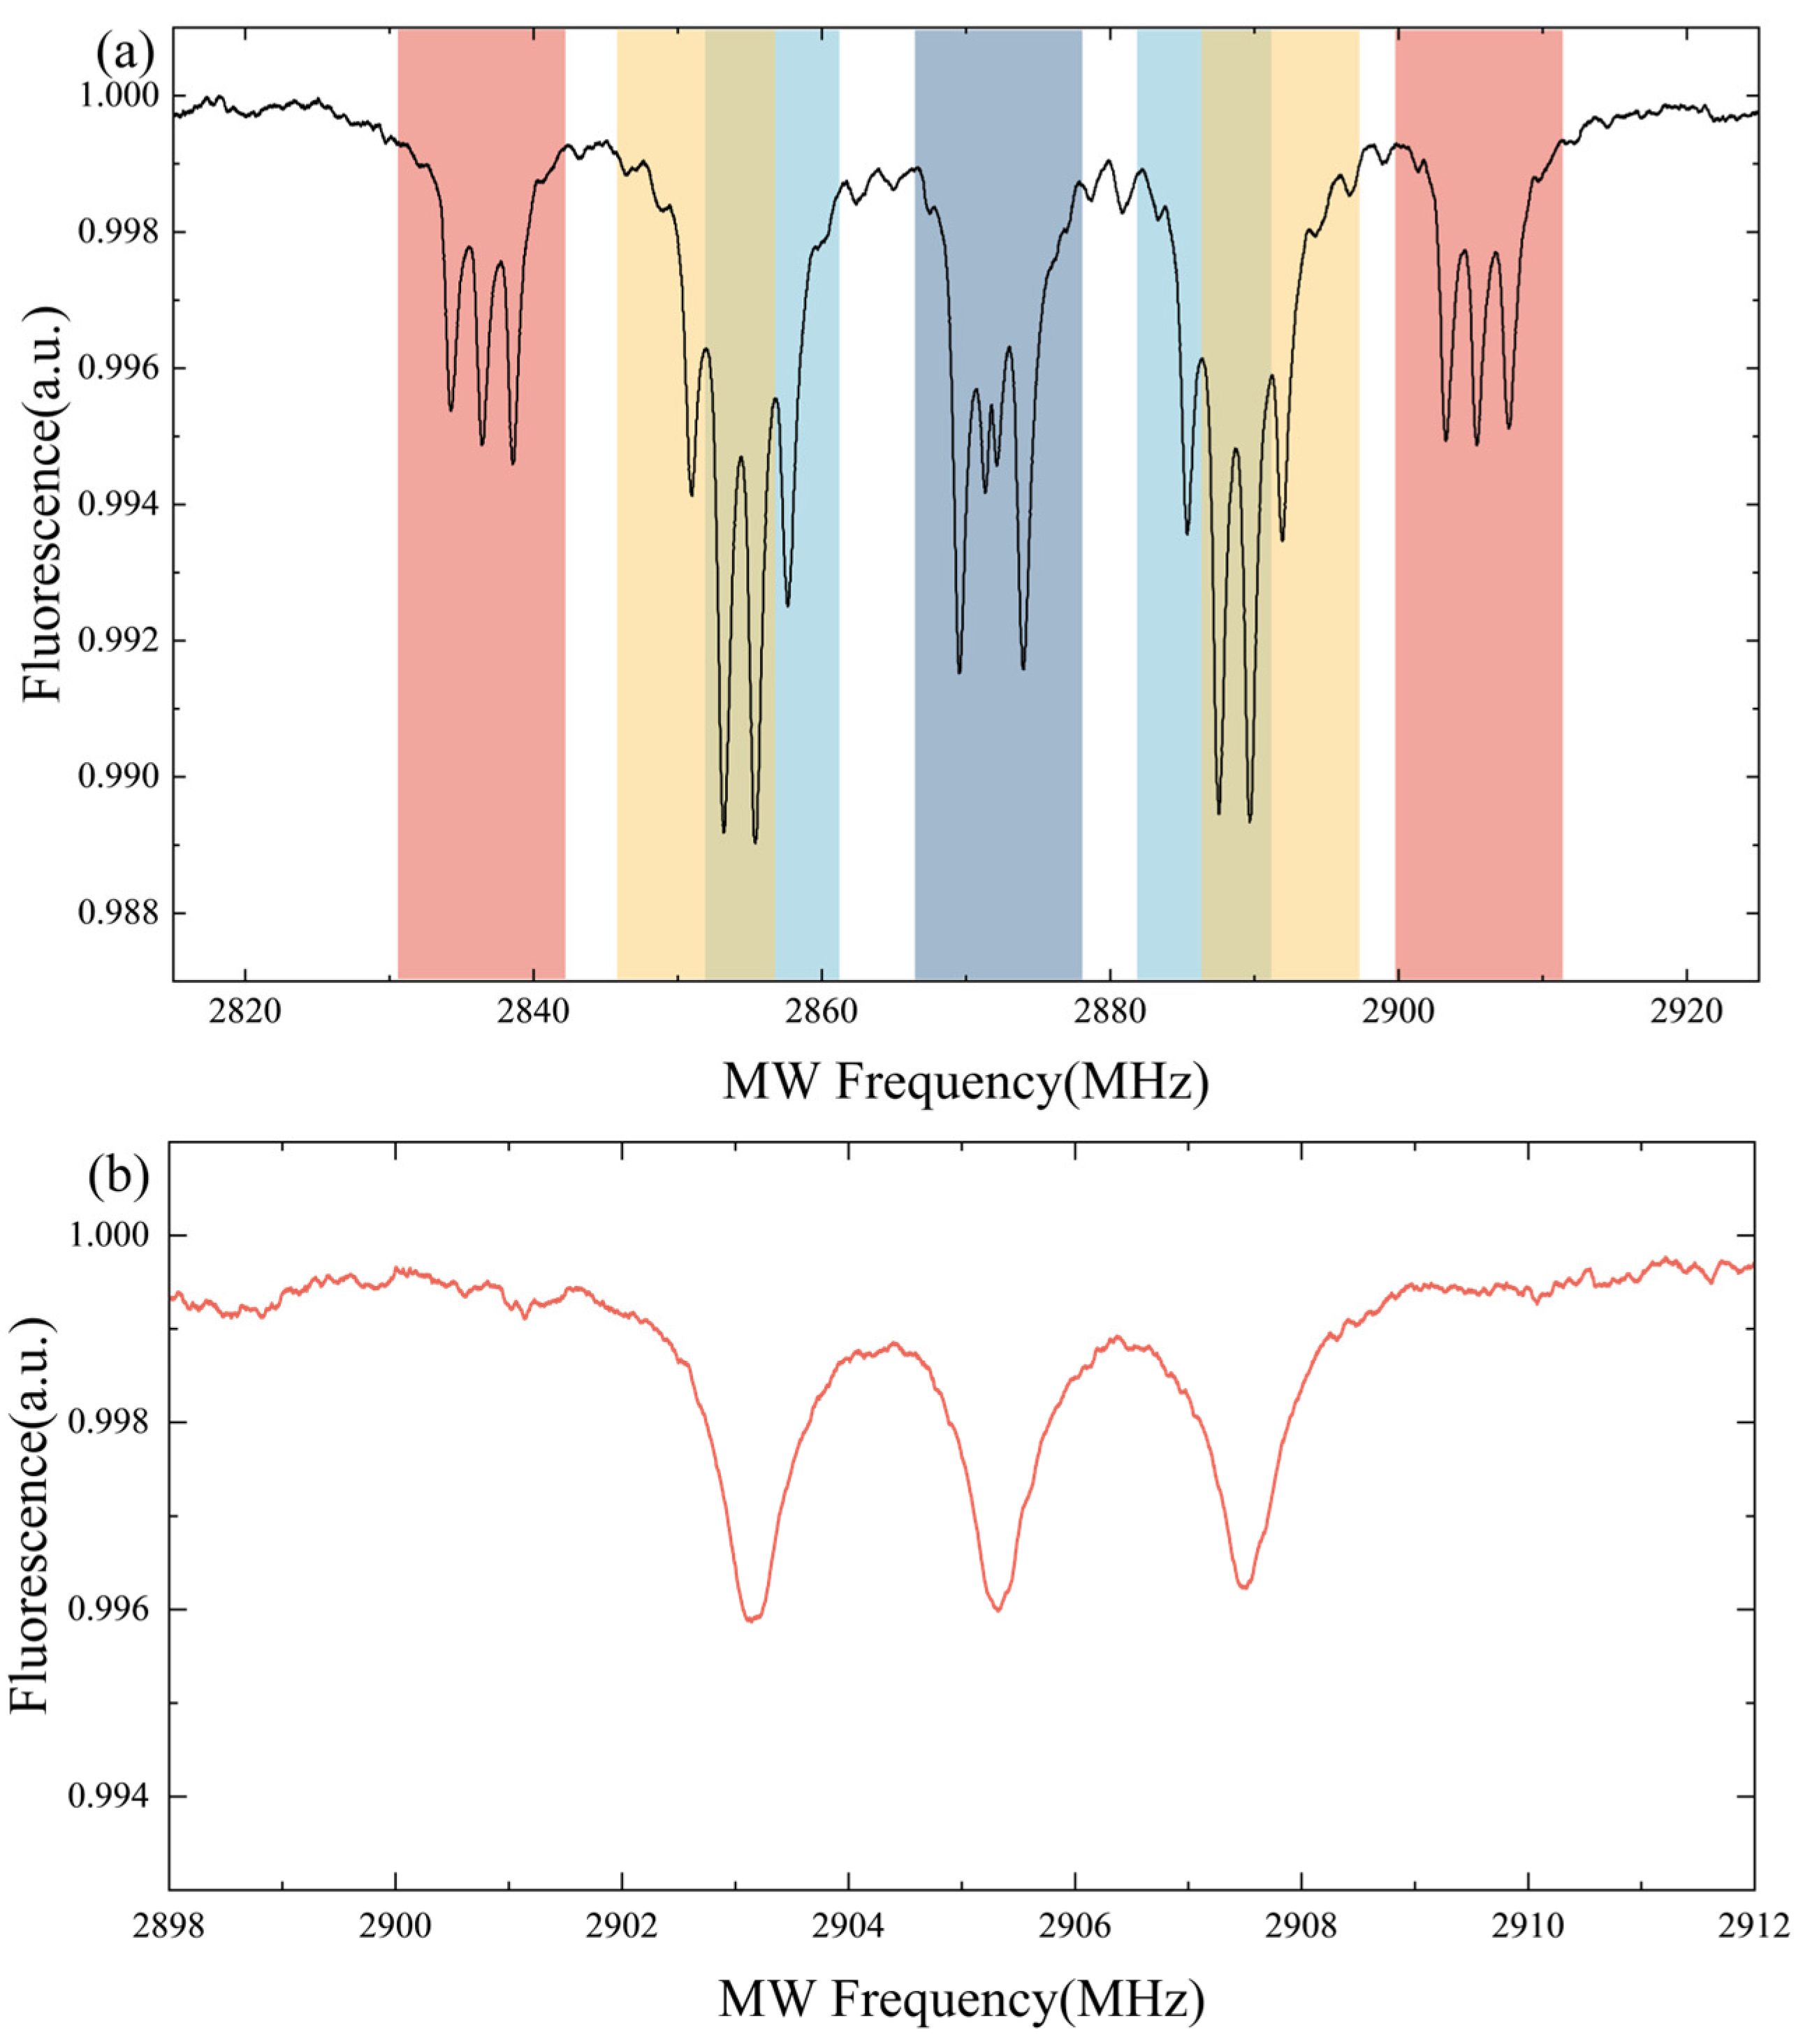
Subsequent to bias magnetic field application, adjustments to field strength and orientation facilitated the spectral resolution of resonance peaks corresponding to all four NV crystallographic orientations. Continuous microwave frequency sweeping, paired with simultaneous fluorescence recording, generated the comprehensive ODMR spectrum delineated in Figure 3a, where distinct colors differentiate the resonance peaks of the respective orientations.
Imposing an external DC magnetic field induces further Zeeman splitting across the spectral lines. The respective resonance frequencies bifurcate toward higher and lower domains, with the magnitude of these shifts maintaining an approximately linear relationship with the applied field strength. The system selected the outermost resonance peak for all subsequent precise measurements, detailing its spectral profile in Figure 3b. Characterized by a center frequency at 2905.333 MHz and a full width at half maximum of 0.749 MHz, this specific resonance peak served as the primary experimental subject.
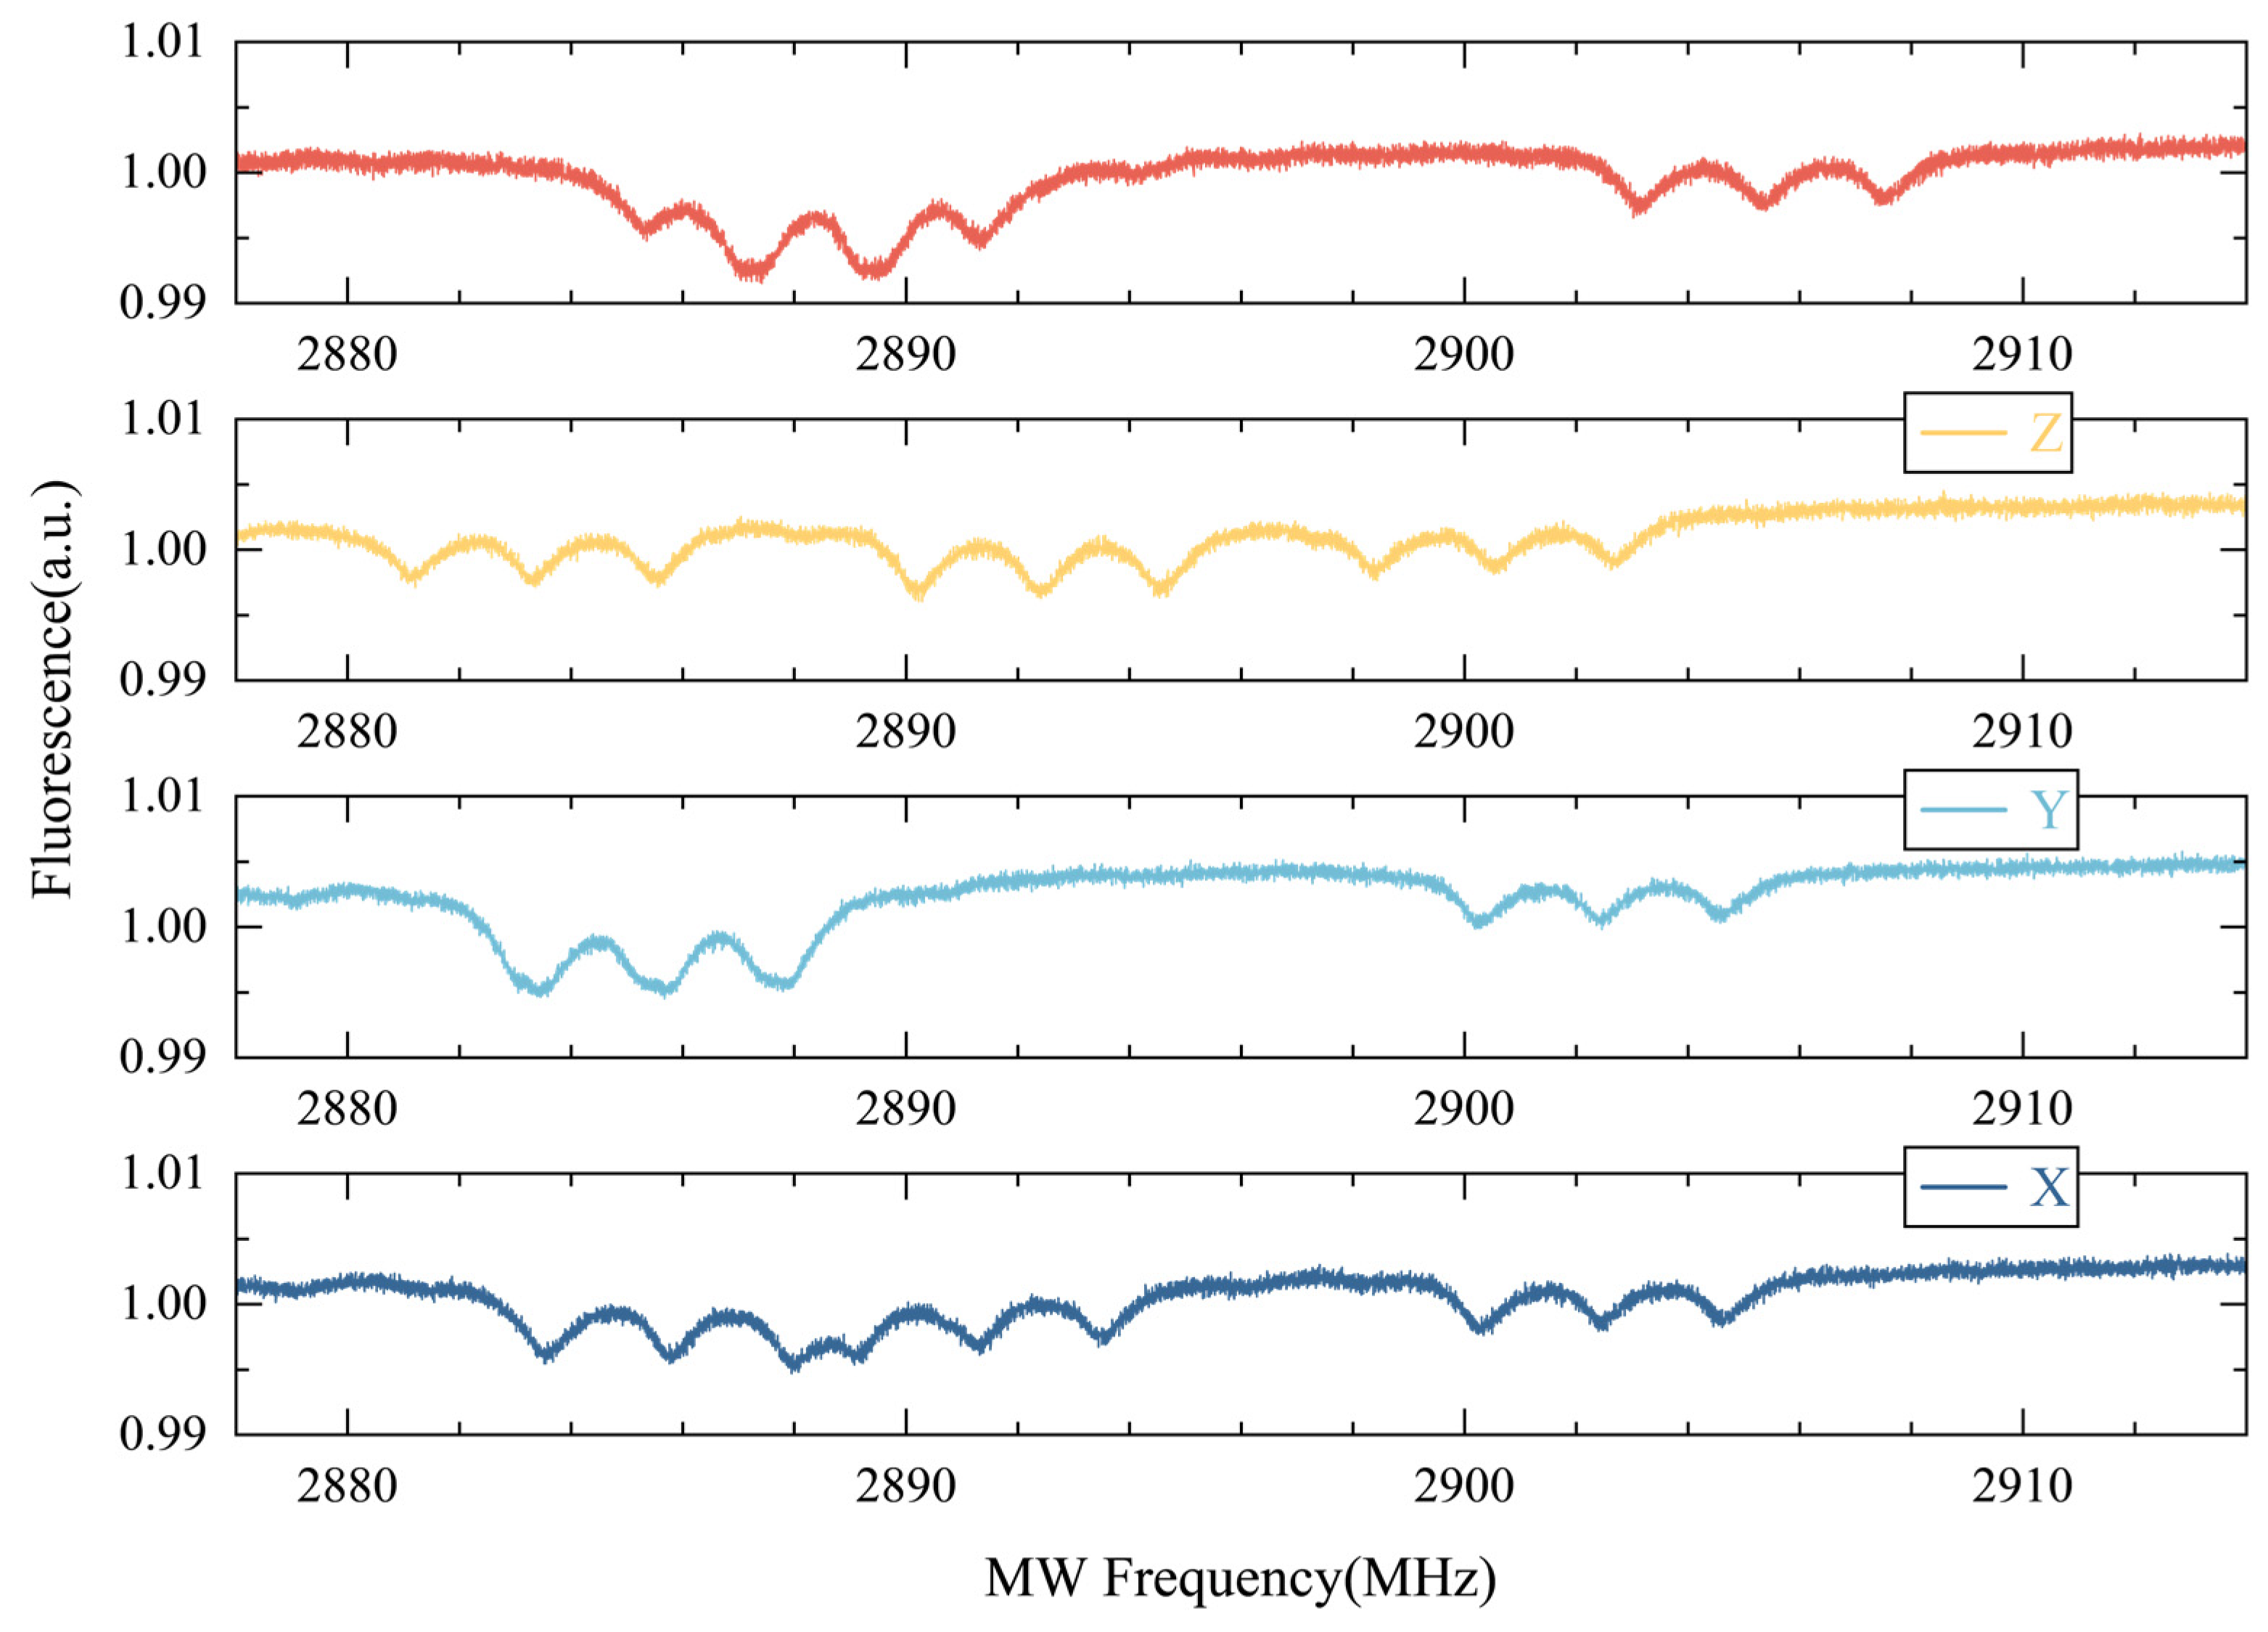
Following bias field stabilization, researchers independently injected a 500 mA current into the X, Y, and Z coordinates of the Helmholtz coil. The resultant Zeeman effect induced variable spectral splitting based on the distinct geometric intersections between the three axes and the specific NV alignment, thereby exposing the most sensitive orientation.
As evidenced in Figure 4, uniform 500 mA current applications along the X, Y, and Z axes generated resonance peak displacements of −2.876 MHz, −2.972 MHz, and −4.811 MHz, respectively. Because the Z-axis exhibited the maximum absolute frequency shift, it was definitively categorized as the most sensitive coil axis for the selected NV center.
Having isolated the optimal axis governing maximum displacement of the targeted NV resonance peak, the experimental framework applies all subsequent shifting magnetic fields via this directional vector during frequency modulation trials.
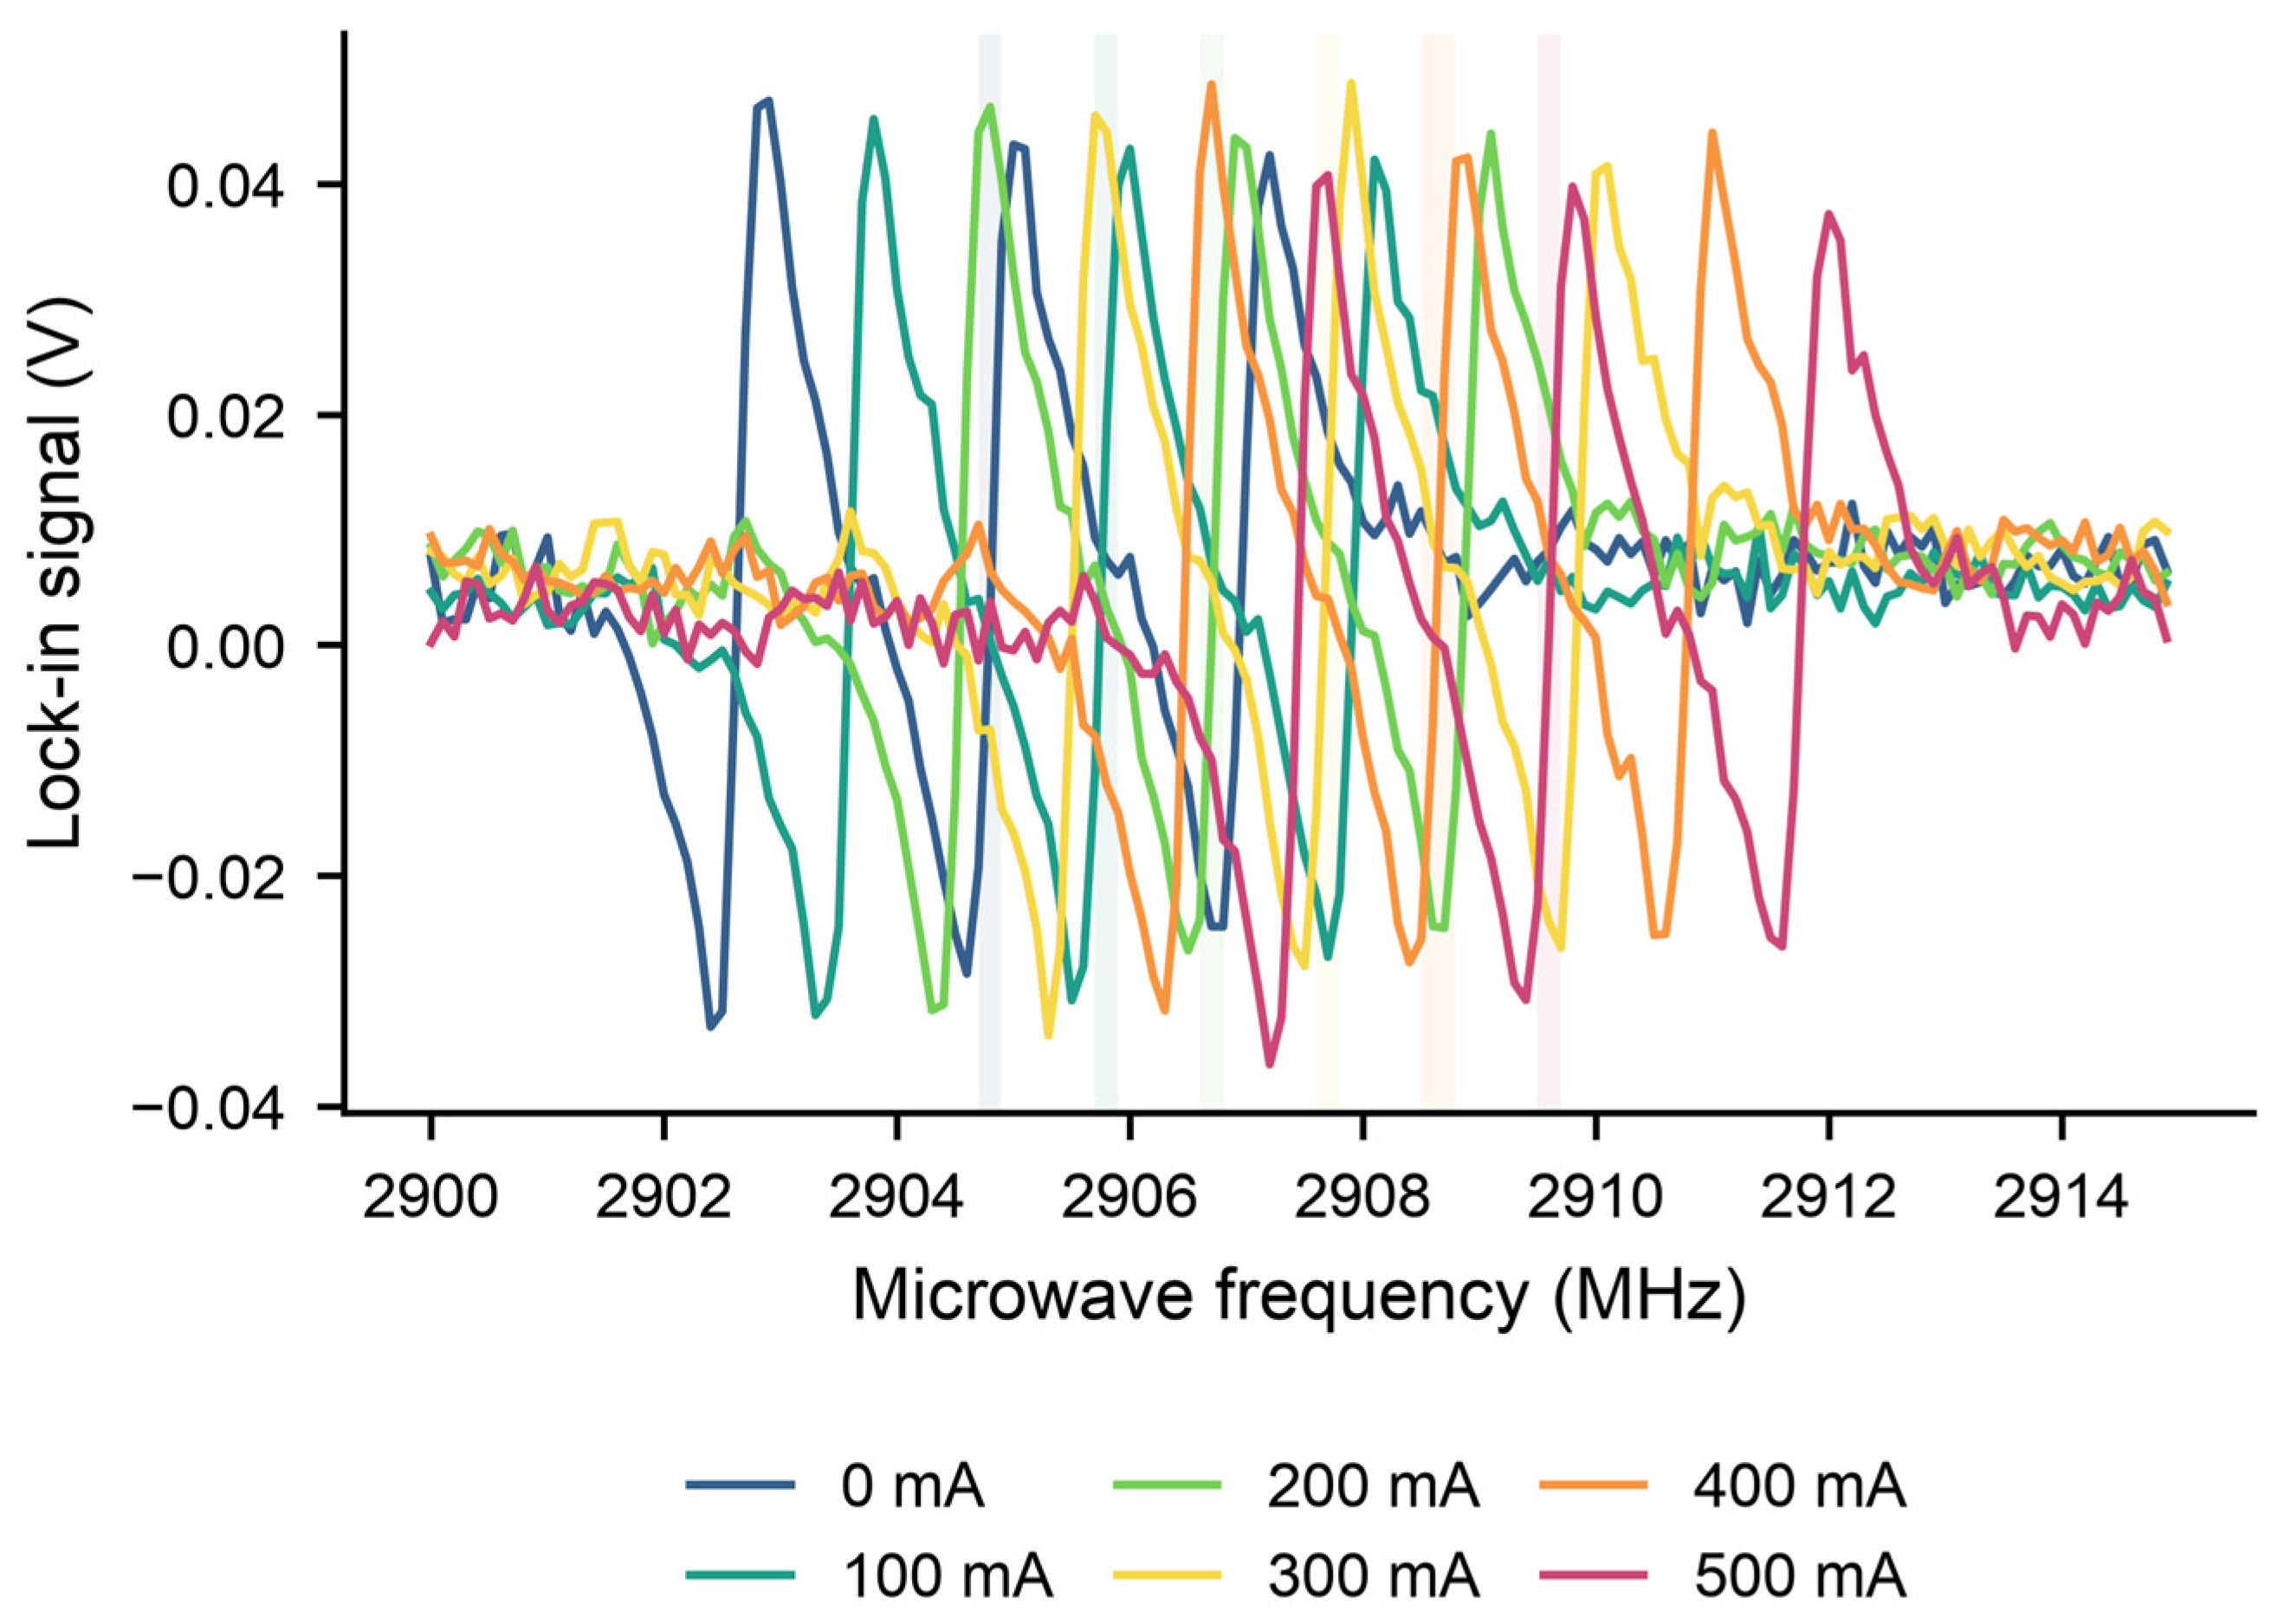
Initially, frequency modulation encompassing specific center frequencies, modulation depths, and modulation frequencies was applied to the microwave source. Utilizing the corresponding modulation frequency as the lock-in amplifier’s reference for fluorescence demodulation, the system extracted a precise first-derivative differential ODMR spectrum, as detailed in Figure 5.
Applying a magnetic field through the Z-axis Helmholtz coil makes the field projection along the selected NV axis approximately proportional to the input current. Consistent with Figure 4, the current-induced magnetic field primarily translates the resonance frequency through the Zeeman effect rather than broadening the ODMR linewidth. The linewidth is instead governed mainly by inhomogeneous broadening, relaxation, microwave power broadening, and optical conditions. In this operating range, the measured resonance-frequency shift varied linearly with current, with a slope of 9.6 MHz/A.
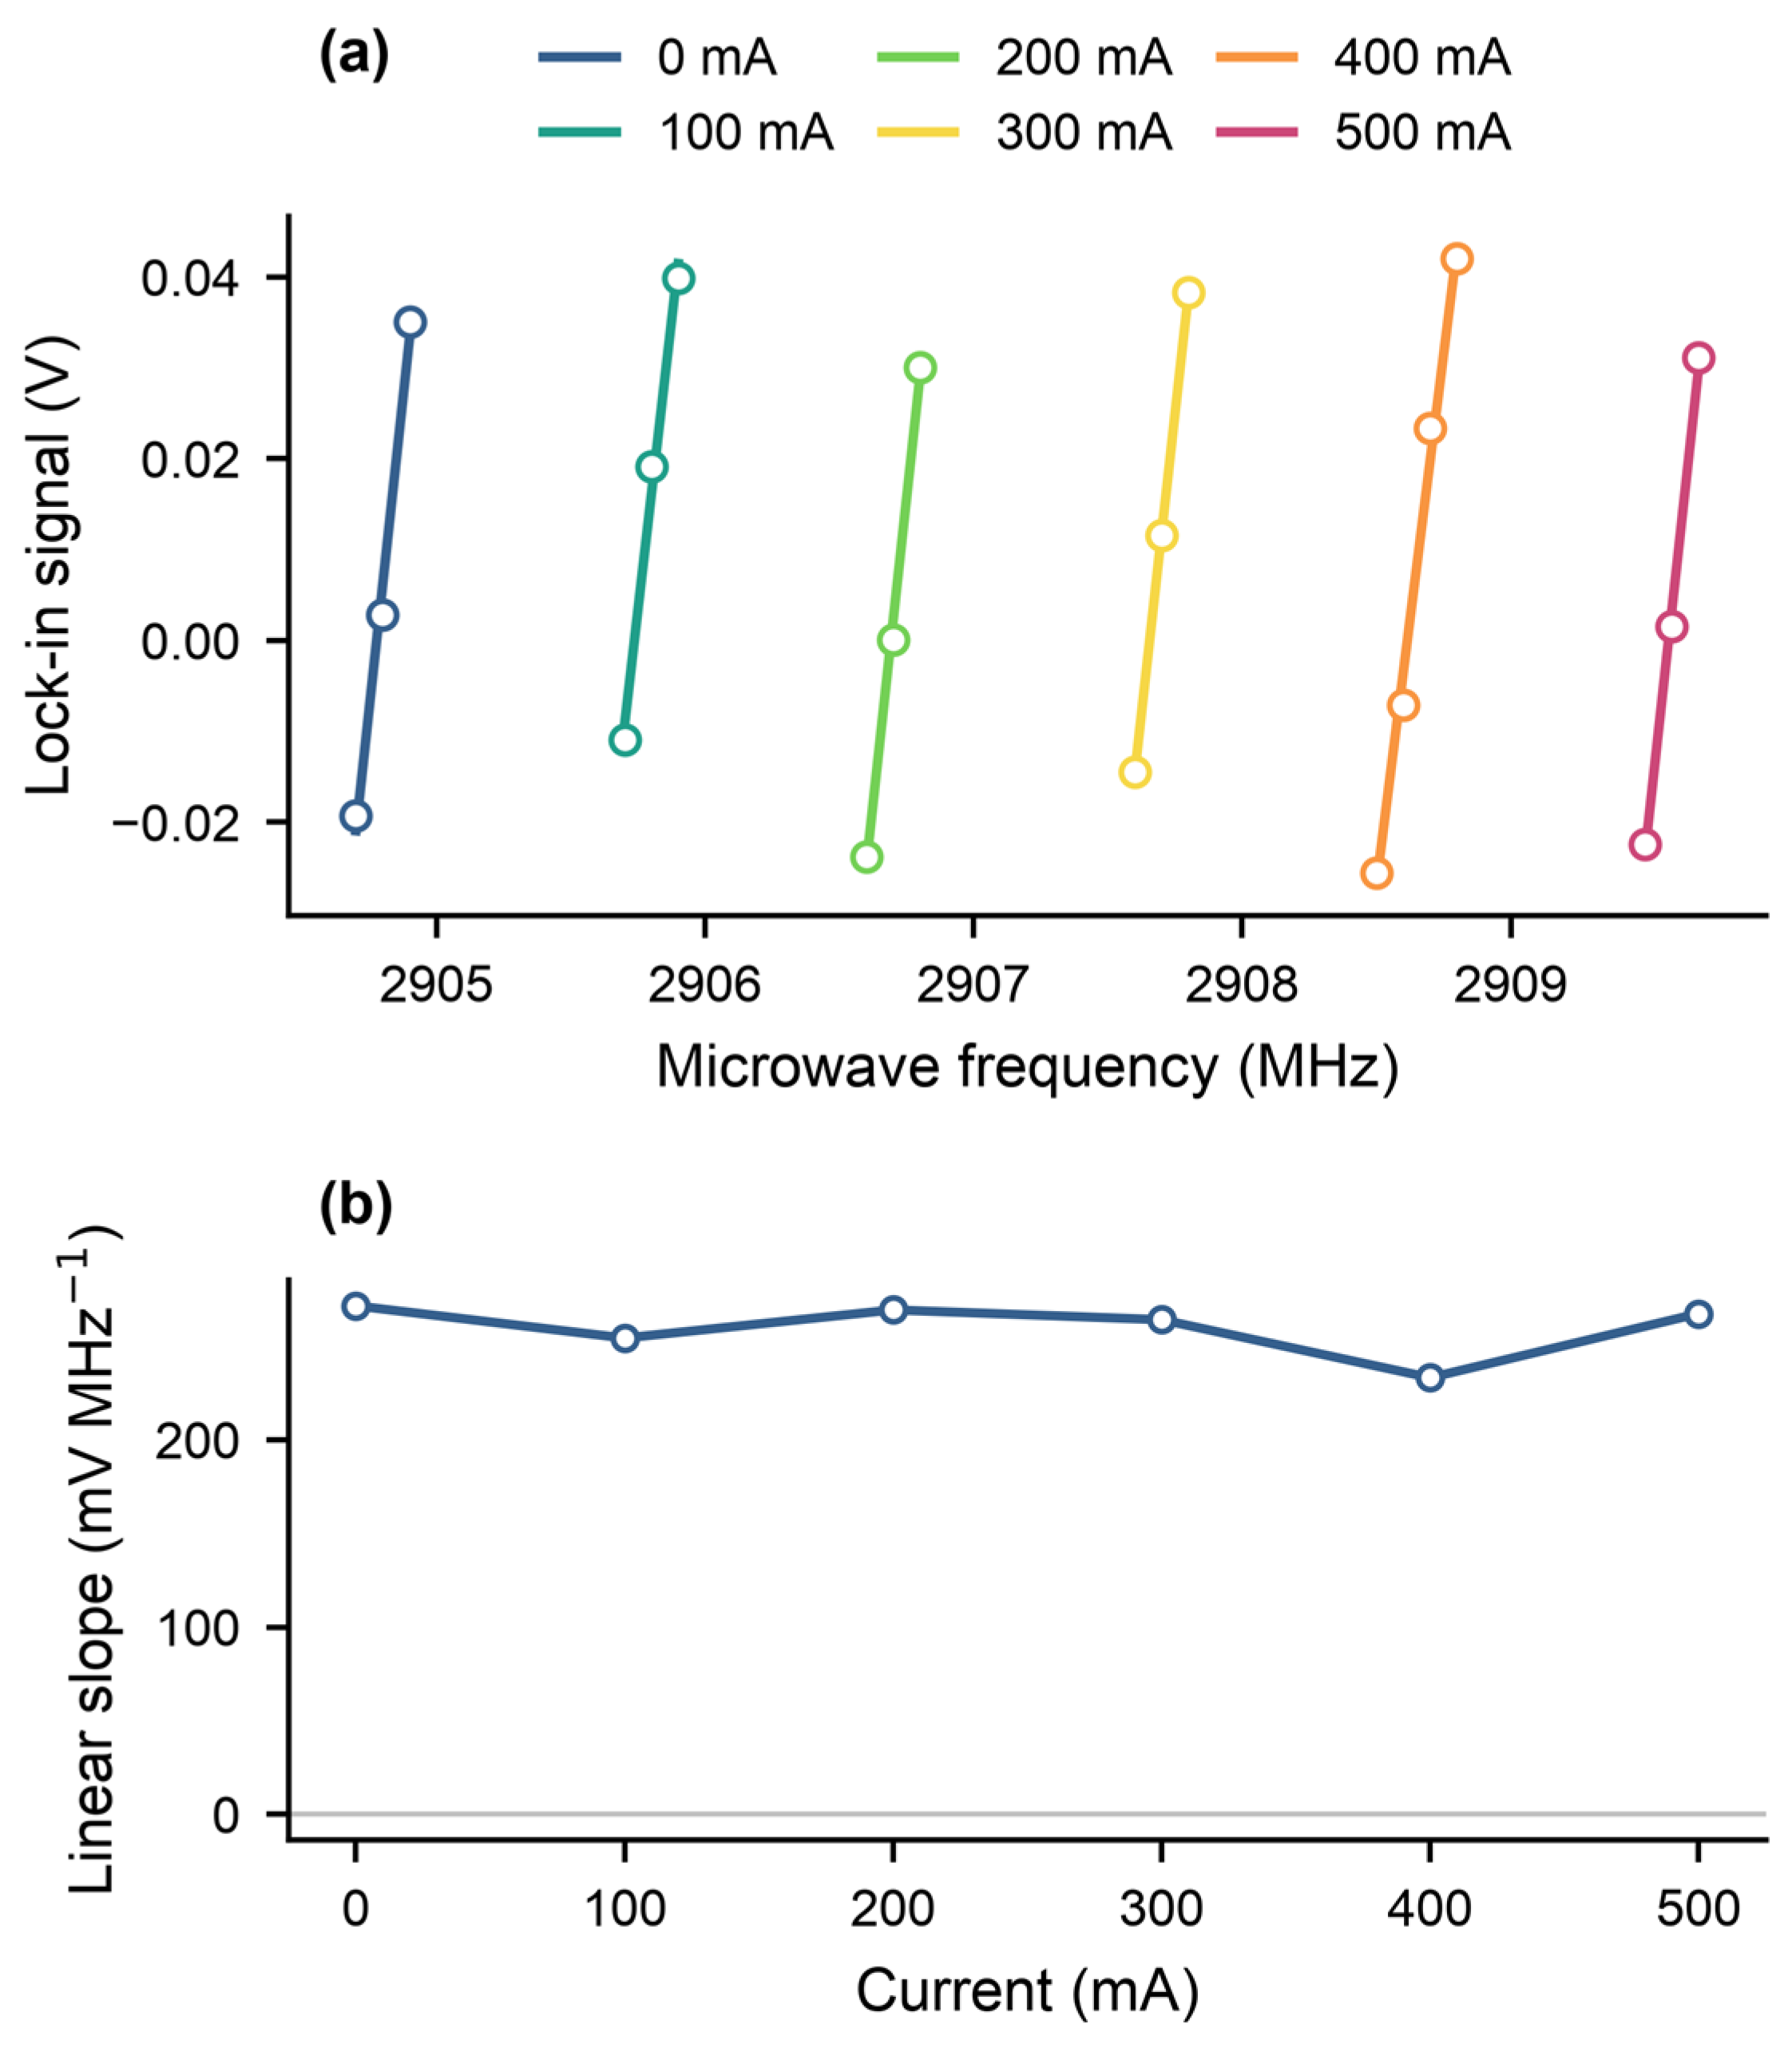
Compared with the conventional ODMR spectrum, the derivative-like spectrum exhibits steeper local slopes alongside expanded linear response intervals, directly converting minor frequency shifts into magnified voltage outputs. The highlighted region within the corresponding figure confirms a robust linear response. Executing linear fitting on this specific segment yields the parameters displayed in Figure 6, demonstrating a maximum derivative curve slope of 271 mV/MHz under the prevailing experimental configuration.
The alternating current assessment precisely targets 200 kHz AC magnetic fields, systematically evaluating NV center response dynamics across varying evolution times (τ) and field amplitudes during Hahn echo execution. Systematic logging and fitting of fluorescence variations definitively isolated the optimal sensitivity parameters tailored to this specific system.
To detect the externally applied 200 kHz AC magnetic field, the platform used a Hahn echo-based pulse sequence with phase-to-population mapping before fluorescence readout. During the free-evolution interval, the alternating magnetic field induces phase accumulation in the NV electron spin. The recorded fluorescence response therefore depends jointly on the evolution time and the applied AC-field amplitude.
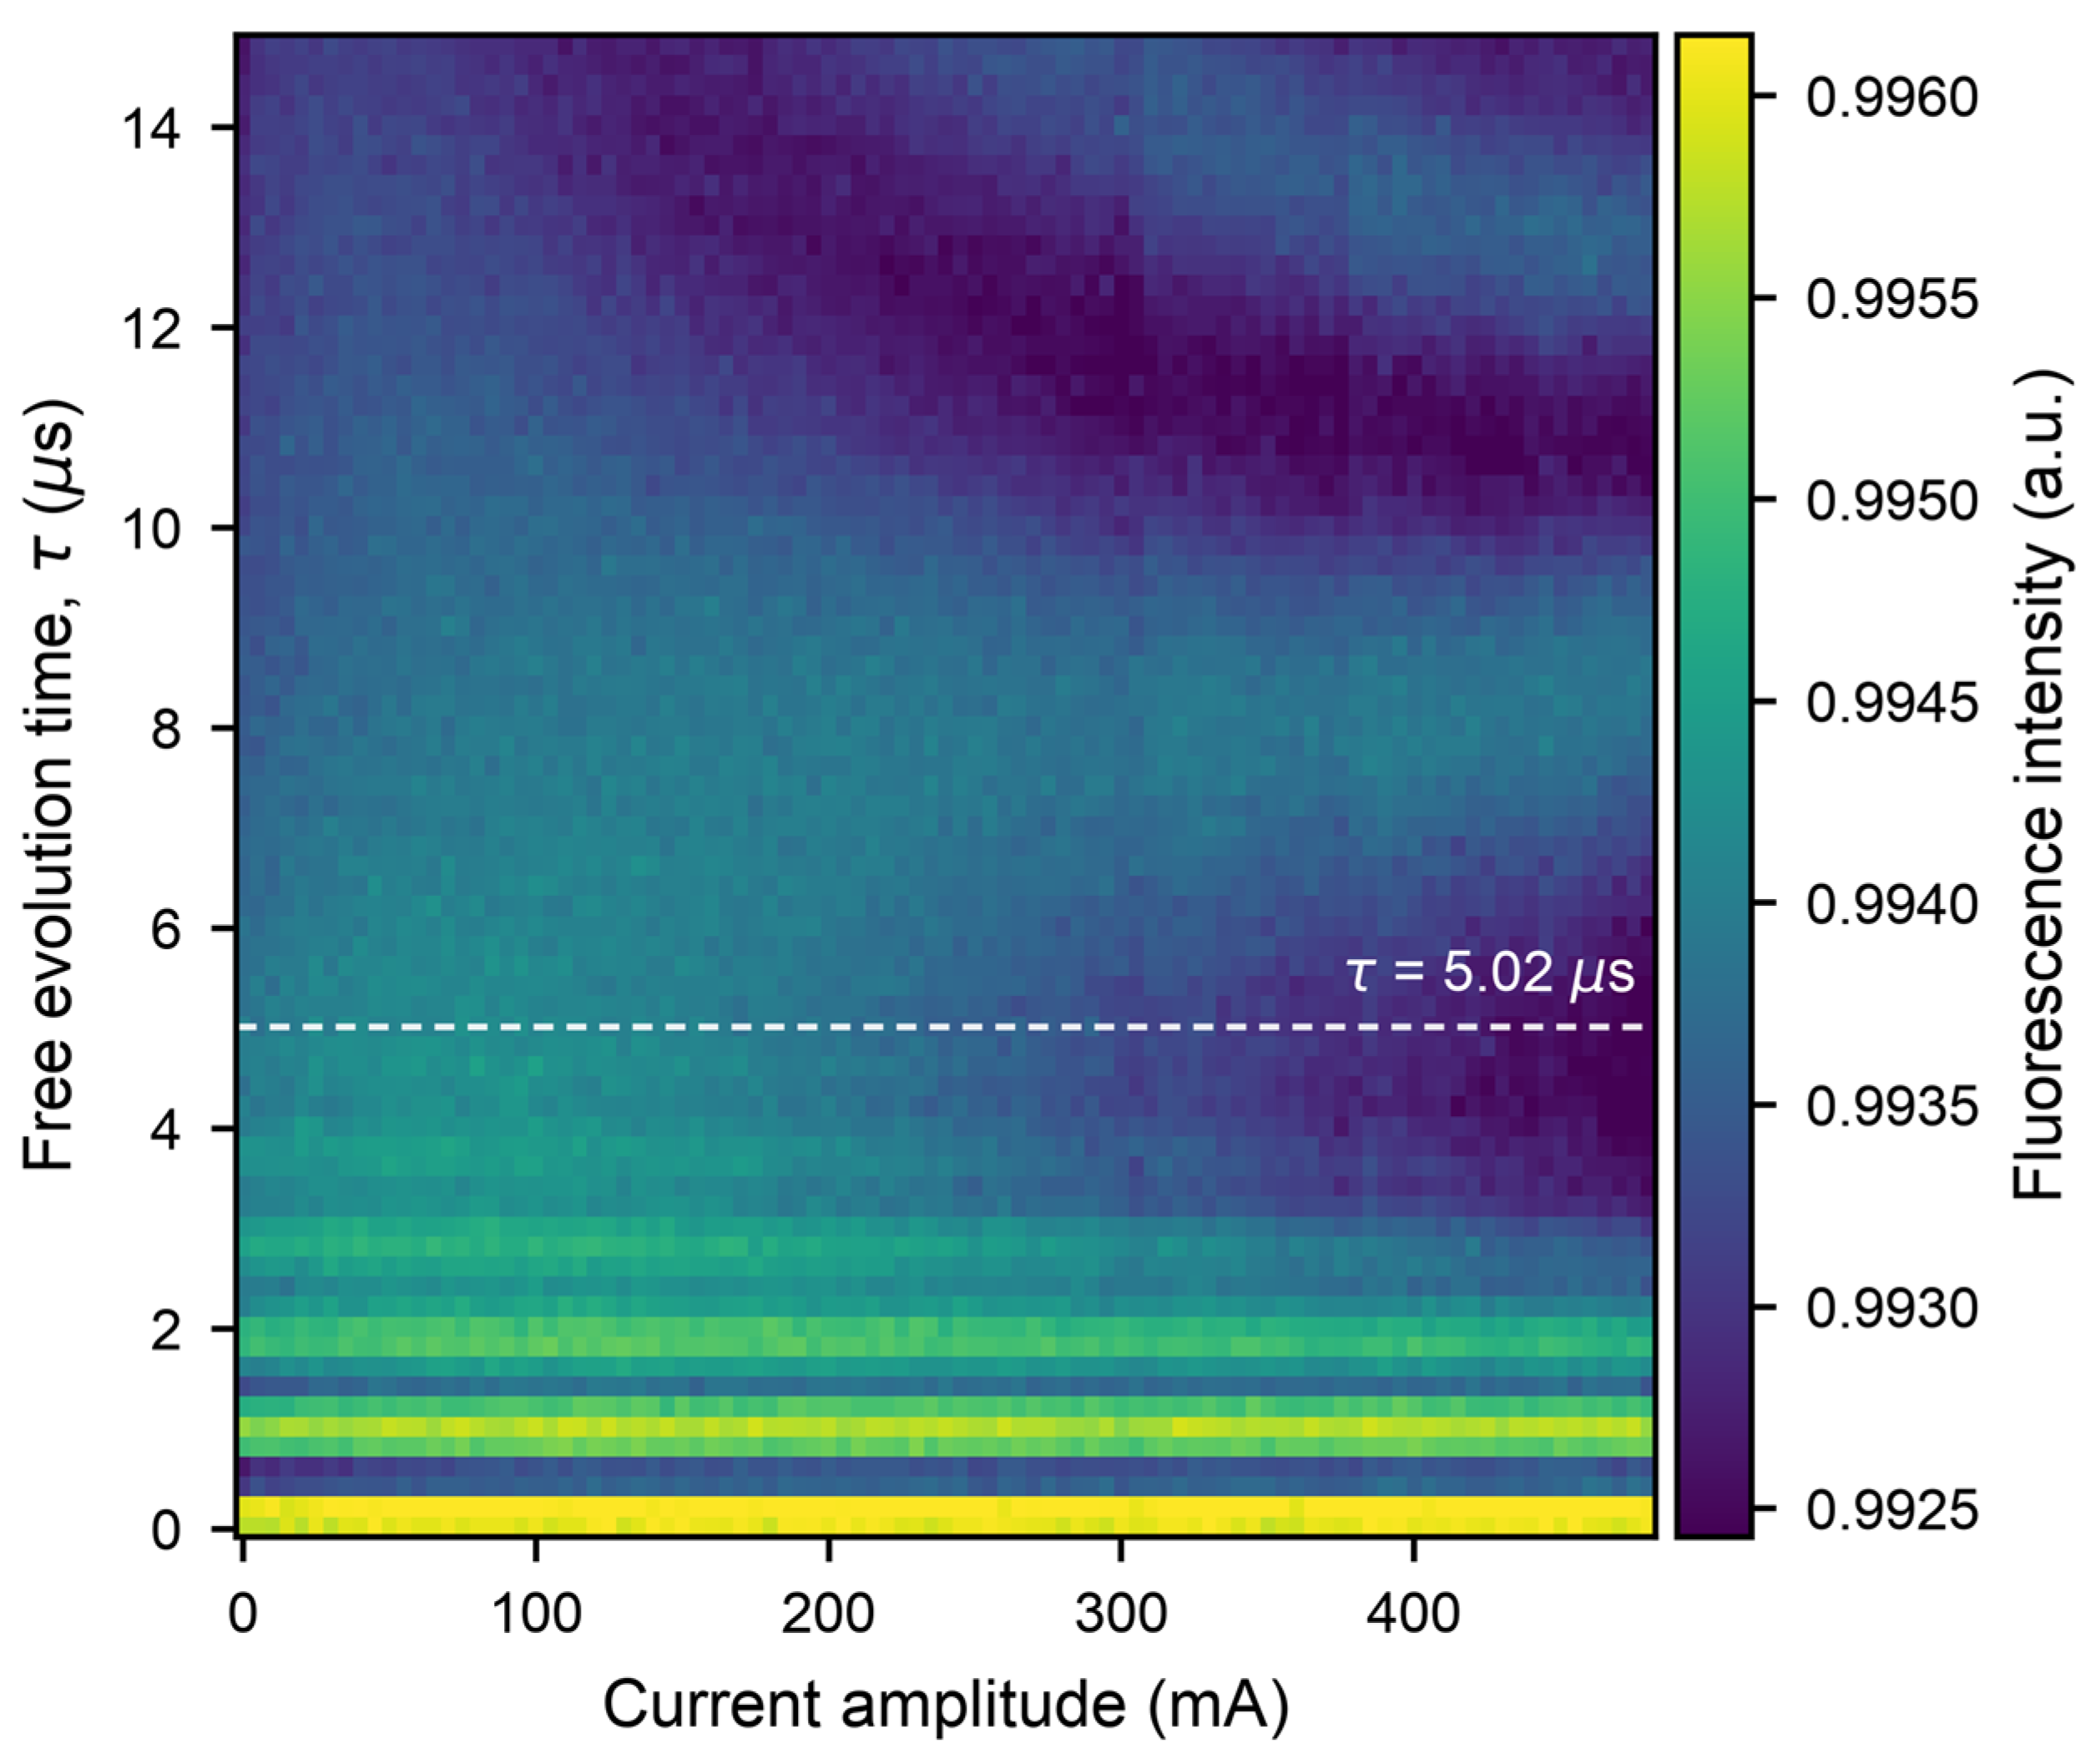
Under the timing convention used here, the largest response is expected when the inverse of the evolution time (1/τ) exactly matches the applied AC magnetic field frequency. Based on this governing principle, the experiment systematically scanned the free evolution time τ alongside the signal amplitude, logging resultant fluorescence variations to construct the comprehensive intensity profile depicted in Figure 7.
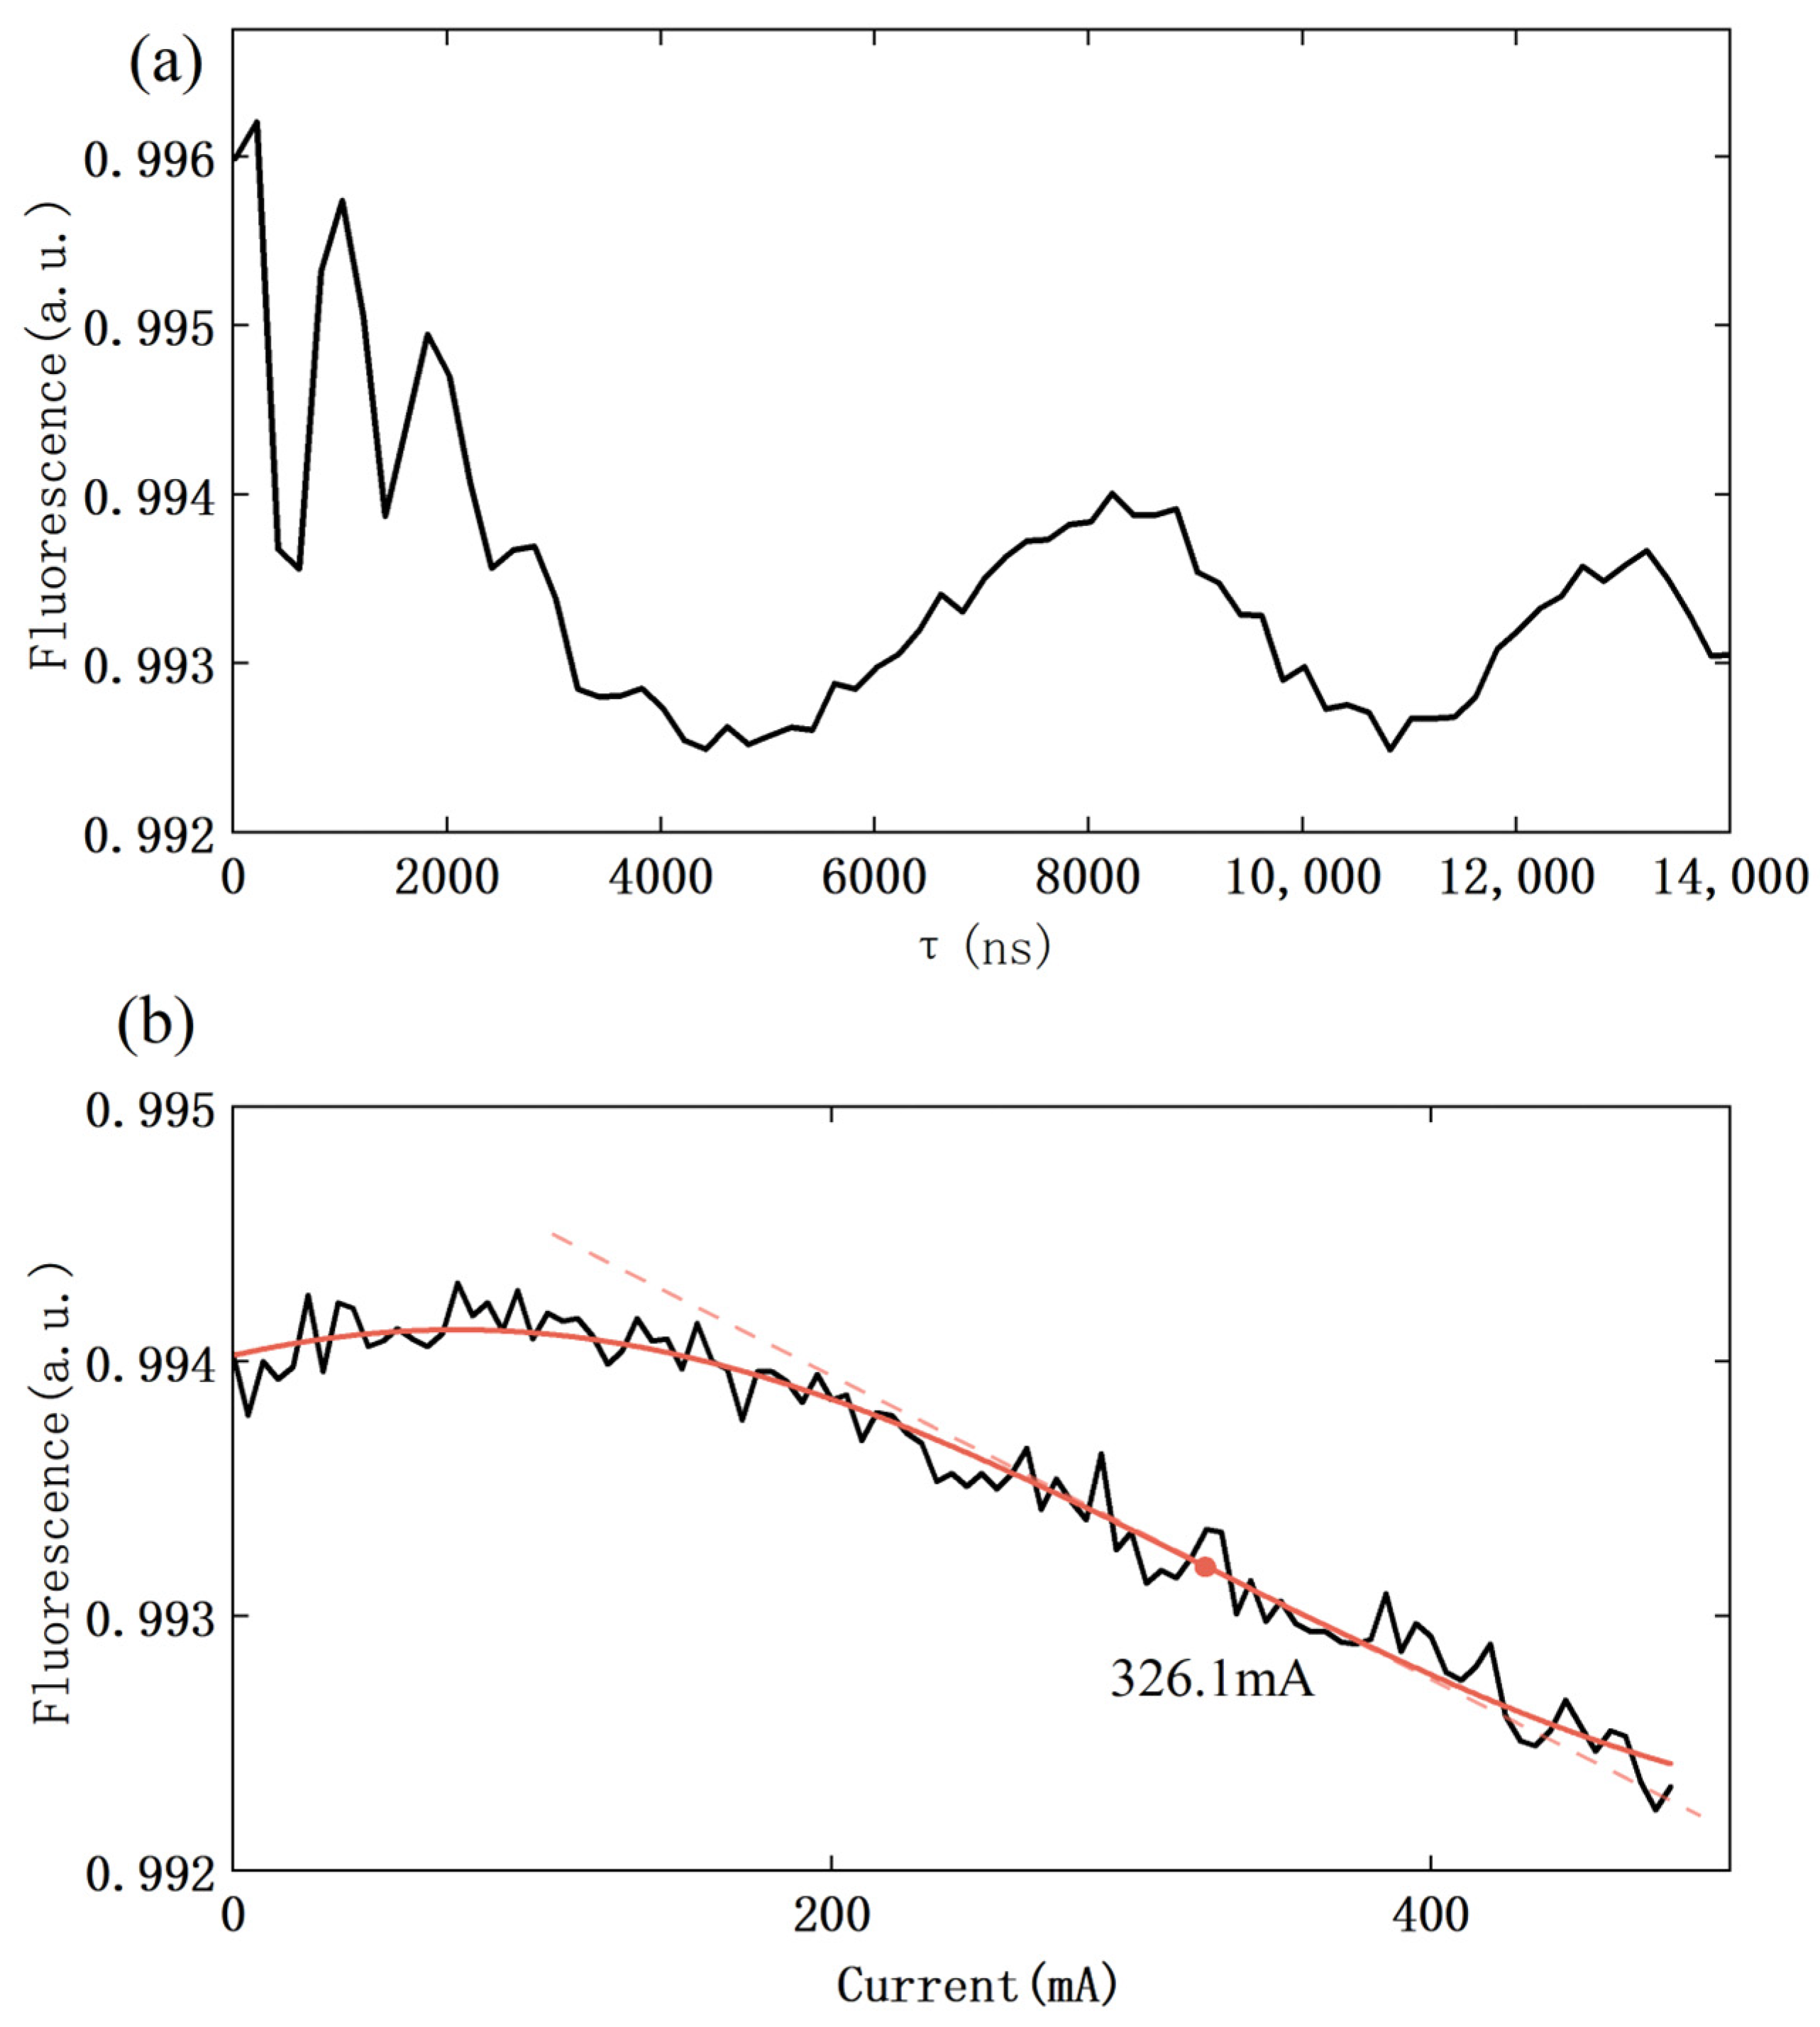
Maintaining a fixed current amplitude of 450 mA generated the Hahn echo response curve illustrated in Figure 8a. These empirical outcomes confirm that phase accumulation scales with the free evolution time τ, peaking precisely at τ = 5 μs to align with the 200 kHz signal frequency. Conversely, insufficient τ intervals constrain phase accumulation, whereas excessive τ durations provoke severe signal decay via intrinsic NV center spin decoherence.
With τ fixed at 5 μs, the AC-coil current was varied to measure the corresponding fluorescence-amplitude response (Figure 8b). Because the data show appreciable point-to-point noise and no saturation at high currents, we interpret currents above approximately 200 mA as a high-slope response region under the present experimental conditions.

4. Discussion

Using the electron spin resonance properties of NV centers, this study demonstrates DC and AC magnetic-field measurements on a single experimental platform by combining microwave frequency modulation, lock-in detection, and Hahn echo spin control.
For DC magnetic-field measurements, microwave frequency modulation combined with lock-in demodulation enables derivative-like ODMR signal extraction and improves discrimination of small resonance-frequency shifts. In the present setup, this approach reduces reliance on absolute fluorescence intensity and provides a practical linear operating region for weak-field readout.
For AC magnetic-field measurements, the Hahn echo response is frequency selective. By scanning the free-evolution time and applied current amplitude for a 200 kHz test field, the experiment identified a response maximum near τ = 5 μs and a high-slope current-response region above approximately 200 mA.
Although the optimized parameters improved the response under the tested conditions, the present system has several limitations:
  • Measurement frequency range limitation: The inherent bandpass response of the Hahn echo sequence restricts AC magnetic field detection, with the center frequency strictly dictated by the evolution parameters, complicating wideband applications. Subsequent implementation of Carr–Purcell–Meiboom–Gill (CPMG) or dynamical decoupling sequences could systematically expand this frequency response bandwidth.
  • Signal averaging and integration time: Because the existing architecture relies heavily on iterative averaging to secure viable signal-to-noise ratios, total measurement durations remain constrained by laser power stability and intrinsic NV decoherence rates. Integrating parallel NV color center arrays presents a viable future pathway to accelerate data acquisition.
  • Environmental noise suppression strategy: Ambient residual magnetic noise, laser intensity fluctuations, and microwave source frequency drifts persistently threaten signal integrity and diagnostic accuracy. Deploying active magnetic shielding alongside rigorous laser power and microwave source phase locking could reduce the system noise floor.
  • Ability to distinguish three-dimensional magnetic field components: The present configuration predominantly captures magnetic fields oriented parallel to the specific NV axis. Incorporating multi-directional excitation pathways coupled with parallel detection across multiple NV axes could enable vector magnetic-field measurements, enabling complex physical scene reconstruction.

5. Conclusions

Overall, this study presents an experimental optimization for detecting DC and AC magnetic fields with an NV-center platform. By combining lock-in demodulation for DC readout with Hahn echo-based AC sensing, the platform shows practical signal discrimination under the tested conditions. The results provide parameter-selection guidance for NV-center magnetometry, while further work is needed to quantify full ODMR-contrast optimization, frequency resolution under specified bandwidths, and performance in application-specific environments.

Author Contributions

Conceptualization, F.P., Y.J., L.Z., S.D. and Y.W.; Methodology, F.P., Y.J., L.Z., S.D. and Y.W.; Validation, Y.W.; Investigation, Y.W.; Data curation, Y.W.; Writing—original draft, Y.W.; Writing—review and editing, Y.J., Y.W., Z.Q. and L.W.; Supervision, F.P., Y.J., L.Z., S.D., Z.Q. and L.W.; Project administration, F.P., Y.J., L.Z., S.D., Z.Q. and L.W.; Funding acquisition, Z.Q. All authors have read and agreed to the published version of the manuscript.

Funding

This work was supported by the Science and Technology Project of China Southern Power Grid Company under Grant No. GDKJXM20230981.

Institutional Review Board Statement

Not applicable.

Informed Consent Statement

Not applicable.

Data Availability Statement

The data that support the findings of this study are available from the corresponding author upon reasonable request.

Conflicts of Interest

Authors Feng Pan, Yilin Ji, Lihua Zhong and Sanlei Dang were employed by the company Metrology Center of Guangdong Power Grid Co., Ltd. The remaining authors declare that the research was conducted in the absence of any commercial or financial relationships that could be construed as a potential conflict of interest.

Abbreviations

The following abbreviations are used in this manuscript:
NVNitrogen-vacancy
ODMROptically detected magnetic resonance
SNRSignal-to-noise ratio
FMFrequency modulation
DCDirect current
CWContinuous-wave
ACAlternating current
PLPhotoluminescence
ISCIntersystem crossing

References

  1. Stiegekötter, D.; Pogorzelski, J.; Horsthemke, L.; Hoffmann, F.; Gregor, M.; Glösekötter, P. Microcontroller-Optimized Measurement Electronics for Coherent Control Applications of NV Centers. Sensors 2024, 24, 3138. [Google Scholar] [CrossRef] [PubMed]
  2. Xu, Y.; Zhang, W.; Tian, C. Recent Advances on Applications of NV Magnetometry in Condensed Matter Physics. Photon. Res. PRJ 2023, 11, 393–412. [Google Scholar] [CrossRef]
  3. Makarov, D.; Eseev, M.; Gusarevich, E.; Matveev, V.; Makarova, K.; Borisov, M. Scattering of Ultrashort X-Ray Pulses from Oriented NV Centers in the Diamond Structure. Crystals 2024, 14, 193. [Google Scholar] [CrossRef]
  4. Guo, Y.; Li, X.; Shi, F.; Wang, W.; Li, B. Study on Diamond NV Centers Excited by Green Light Emission from OLEDs. Photonics 2025, 12, 833. [Google Scholar] [CrossRef]
  5. Feng, Y.-Y.; Li, Z.-H.; Zhang, Y.; Cui, L.-X.; Guo, Q.; Guo, H.; Wen, H.-F.; Liu, W.-Y.; Tang, J.; Liu, J. Optimization of Optical Control of Nitrogen Vacancy Centers in Solid Diamond. Acta Phys. Sin. 2020, 69, 147601. [Google Scholar] [CrossRef]
  6. Wang, C.-J.; Shi, F.-Z.; Wang, P.-F.; Duan, C.-K.; Du, J.-F. Nanoscale Magnetic Field Sensing and Imaging Based on Nitrogen-Vacancy Center in Diamond. Acta Phys. Sin. 2018, 67, 130701. [Google Scholar] [CrossRef]
  7. Taylor, J.M.; Cappellaro, P.; Childress, L.; Jiang, L.; Budker, D.; Hemmer, P.R.; Yacoby, A.; Walsworth, R.; Lukin, M.D. High-Sensitivity Diamond Magnetometer with Nanoscale Resolution. Nat. Phys. 2008, 4, 810–816. [Google Scholar] [CrossRef]
  8. Zheng, D.; Gao, J.; Li, Y.; Wang, H.; Yang, Y.; Guo, H.; Wen, H.; Li, Z.; Tang, J.; Ma, Z.; et al. Sensitivity Improvement via Differential Detection for Frequency-Locking Diamond Magnetometers. Micromachines 2025, 16, 1095. [Google Scholar] [CrossRef] [PubMed]
  9. Wang, T.; Liu, Z.; Liu, Y.; Wang, B.; Shen, Y.; Qin, L. High-Dynamic-Range Integrated NV Magnetometers. Micromachines 2024, 15, 662. [Google Scholar] [CrossRef] [PubMed]
  10. Kumar, H.; Dasika, S.; Mangat, M.; Tallur, S.; Saha, K. High Dynamic-Range and Portable Magnetometer Using Ensemble Nitrogen-Vacancy Centers in Diamond. Rev. Sci. Instrum. 2024, 95, 075002. [Google Scholar] [CrossRef] [PubMed]
  11. Maze, J.R.; Stanwix, P.L.; Hodges, J.S.; Hong, S.; Taylor, J.M.; Cappellaro, P.; Jiang, L.; Dutt, M.V.G.; Togan, E.; Zibrov, A.S.; et al. Nanoscale Magnetic Sensing with an Individual Electronic Spin in Diamond. Nature 2008, 455, 644–647. [Google Scholar] [CrossRef] [PubMed]
  12. Zhao, Y.; Ding, S.; Wang, S.; Hu, Y.; Liu, H.; Shang, Z.; Gu, Y. Integrated NV Center-Based Temperature Sensor for Internal Thermal Monitoring in Optical Waveguides. Sensors 2025, 25, 4123. [Google Scholar] [CrossRef] [PubMed]
  13. Ge, S.; An, S.; Li, H.; Li, N.; Chen, G.; Lu, W.; Zhang, Z.; Wang, Y.; Wang, C.; Yang, X.; et al. Optimized Diamond NV Sensor for Simultaneous Sensing of Magnetic Field and Temperature. Sens. Actuators A Phys. 2025, 389, 116543. [Google Scholar] [CrossRef]
  14. Lin, S.; Wang, Q.; Guo, H.; Wen, H.; Li, Z.; Tang, J.; Ma, Z.; Liu, J. Research on the Common Mode Suppression Method of Temperature Noise in an NV Color Center Spin Magnetometer. Laser Phys. Lett. 2021, 18, 115201. [Google Scholar] [CrossRef]
  15. Barson, M.S.J.; Oberg, L.M.; McGuinness, L.P.; Denisenko, A.; Manson, N.B.; Wrachtrup, J.; Doherty, M.W. Nanoscale Vector Electric Field Imaging Using a Single Electron Spin. Nano Lett. 2021, 21, 2962–2967. [Google Scholar] [CrossRef] [PubMed]
  16. Michl, J.; Steiner, J.; Denisenko, A.; Bülau, A.; Zimmermann, A.; Nakamura, K.; Sumiya, H.; Onoda, S.; Neumann, P.; Isoya, J.; et al. Robust and Accurate Electric Field Sensing with Solid State Spin Ensembles. Nano Lett. 2019, 19, 4904–4910. [Google Scholar] [CrossRef] [PubMed]
  17. Chen, E.H.; Clevenson, H.A.; Johnson, K.A.; Pham, L.M.; Englund, D.R.; Hemmer, P.R.; Braje, D.A. High-Sensitivity Spin-Based Electrometry with an Ensemble of Nitrogen-Vacancy Centers in Diamond. Phys. Rev. A 2017, 95, 053417. [Google Scholar] [CrossRef]
  18. Zhang, C.; Zhang, J.; Widmann, M.; Benke, M.; Kübler, M.; Dasari, D.; Klotz, T.; Gizzi, L.; Röhrle, O.; Brenner, P.; et al. Optimizing NV Magnetometry for Magnetoneurography and Magnetomyography Applications. Front. Neurosci. 2023, 16, 1034391. [Google Scholar] [CrossRef] [PubMed]
  19. Schirhagl, R.; Chang, K.; Loretz, M.; Degen, C.L. Nitrogen-Vacancy Centers in Diamond: Nanoscale Sensors for Physics and Biology. Annu. Rev. Phys. Chem. 2014, 65, 83–105. [Google Scholar] [CrossRef] [PubMed]
  20. Hong, S.; Grinolds, M.S.; Pham, L.M.; Le Sage, D.; Luan, L.; Walsworth, R.L.; Yacoby, A. Nanoscale Magnetometry with NV Centers in Diamond. MRS Bull. 2013, 38, 155–161. [Google Scholar] [CrossRef]
  21. Ye, A.; Fu, D.; Wu, M.; Guo, J.; Sheng, T.; Li, X.; Gong, S.; Niu, Y. SNR Enhancement of Magnetic Fields Measurement with the Diamond NV Center Using a Compound Filter System. Chin. Opt. Lett. 2023, 21, 111201. [Google Scholar] [CrossRef]
  22. Fang, K.; Acosta, V.M.; Santori, C.; Huang, Z.; Itoh, K.M.; Watanabe, H.; Shikata, S.; Beausoleil, R.G. High-Sensitivity Magnetometry Based on Quantum Beats in Diamond Nitrogen-Vacancy Centers. Phys. Rev. Lett. 2013, 110, 130802. [Google Scholar] [CrossRef] [PubMed]
  23. Wang, Z.; Kong, F.; Zhao, P.; Huang, Z.; Yu, P.; Wang, Y.; Shi, F.; Du, J. Picotesla Magnetometry of Microwave Fields with Diamond Sensors. Sci. Adv. 2022, 8, eabq8158. [Google Scholar] [CrossRef] [PubMed]
  24. Li, Y.; Hu, H.; Zhu, Z.; Zhou, F.; Lei, Y.; Huang, J.; Nie, Q.; Xia, L. Fiber Diamond-Based Quantum Sensor for High-Precision Current Sensing. Opt. Laser Technol. 2025, 192, 113356. [Google Scholar] [CrossRef]
  25. Peng, X.; Xie, F.; Zhu, Y.; Luo, X.; Liu, Q.; Wang, D.; Hu, Y.; Han, J.; Li, L.; Liu, J.; et al. A Highly Integrated Three-Axis Vector Diamond Quantum Magnetometer with a Compact Electrical Package. Appl. Phys. Lett. 2025, 126, 081101. [Google Scholar] [CrossRef]
  26. Wang, N.; Liu, Y.; Su, Y.; Peng, X.; Hu, Y.; Liu, Q.; Xie, F.; Zhu, Y.; Chen, X.; Luo, X.; et al. Microfabricated Active Laser Noise Suppression Device for a High-Sensitivity Diamond Quantum Magnetometer. ACS Photonics 2025, 12, 828–838. [Google Scholar] [CrossRef]
  27. Liu, Q.; Nie, S.; Peng, X.; Zhu, Y.; Wang, N.; Hu, Y.; Luo, X.; Li, C.; Jing, M.; Zhang, C.; et al. Fiber-Integrated Diamond Quantum Sensor for High-Voltage Current Measurements. Adv. Sens. Res. 2025, 4, 2400106. [Google Scholar] [CrossRef]
  28. Cai, J.; Jelezko, F.; Plenio, M.B. Hybrid Sensors Based on Colour Centres in Diamond and Piezoactive Layers. Nat. Commun. 2014, 5, 4065. [Google Scholar] [CrossRef] [PubMed]
  29. Carmiggelt, J.J.; Bertelli, I.; Mulder, R.W.; Teepe, A.; Elyasi, M.; Simon, B.G.; Bauer, G.E.W.; Blanter, Y.M.; Van Der Sar, T. Broadband Microwave Detection Using Electron Spins in a Hybrid Diamond-Magnet Sensor Chip. Nat. Commun. 2023, 14, 490. [Google Scholar] [CrossRef] [PubMed]
  30. Kavatamane, V.K.; Duan, D.; Zadeh-Haghighi, H.; Phan, M.-H.; Balasubramanian, G. Single-Spin Nitrogen-Vacancy Magnetometer with Enhanced Static Field Sensitivity. arXiv 2025, arXiv:2510.03462. [Google Scholar]
  31. Sarkar, S.; Agrawal, N.; Shishir, D.; Saha, K. Real-Time Simultaneous Dual Sensing of Temperature and Magnetic Field Using NV-Based Nano-Diamonds. arXiv 2024, arXiv:2408.17418. [Google Scholar]
  32. Zhang, S.-C.; Zhao, L.; Qiu, R.-J.; Geng, J.-Q.; Tian, T.; Zhao, B.-W.; Liu, Y.; Shan, L.-K.; Chen, X.-D.; Guo, G.-C.; et al. High-Voltage Current Sensing with Nitrogen-Vacancy Color Centers in Diamond. APL Photonics 2025, 10, 036117. [Google Scholar] [CrossRef]
  33. Barry, J.F.; Steinecker, M.H.; Alsid, S.T.; Majumder, J.; Pham, L.M.; O’Keeffe, M.F.; Braje, D.A. Sensitive Ac and Dc Magnetometry with Nitrogen-Vacancy-Center Ensembles in Diamond. Phys. Rev. Appl. 2024, 22, 044069. [Google Scholar] [CrossRef]
  34. Barry, J.F.; Schloss, J.M.; Bauch, E.; Turner, M.J.; Hart, C.A.; Pham, L.M.; Walsworth, R.L. Sensitivity Optimization for NV-Diamond Magnetometry. Rev. Mod. Phys. 2020, 92, 015004. [Google Scholar] [CrossRef]
  35. Wolf, T.; Neumann, P.; Nakamura, K.; Sumiya, H.; Isoya, J.; Wrachtrup, J. A Subpicotesla Diamond Magnetometer. Phys. Rev. X 2015, 5, 041001. [Google Scholar] [CrossRef]
  36. Doherty, M.W.; Michl, J.; Dolde, F.; Jakobi, I.; Neumann, P.; Manson, N.B.; Wrachtrup, J. Measuring the Defect Structure Orientation of a Single NV Centre in Diamond. New J. Phys. 2014, 16, 063067. [Google Scholar] [CrossRef]
Figure 1. Energy level structure of NV center, showing the ground triplet state (3A2), excited triplet state (3E), metastable singlet states (1A1 and 1E), optical excitation, photoluminescence (PL), intersystem crossing (ISC), and the spin sublevels used for ODMR readout.
Applsci 16 06844 g001
Figure 2. Principle of DC magnetic-field measurement using microwave frequency modulation and lock-in demodulation. (a) Continuous spectral curve and its parameters obtained by frequency scanning. (b) Schematic diagram of the continuous spectral curve obtained by scanning the field. (c) Schematic diagram of the first-order differential spectrum curve obtained by frequency scanning. (d) Schematic diagram of the first-order differential spectrum curve obtained by scanning the field.
Applsci 16 06844 g002
Figure 3. ODMR spectrum of NV center. (a) The complete spectrum of CW-ODMR obtained by microwave scanning of NV color centers, with a bias magnetic field size of approximately 12.5 Gauss. The four colors correspond to the NV centers in four different orientations. (b) The detailed spectrum of the outermost resonance peak under biased magnetic field conditions.
Applsci 16 06844 g003
Figure 4. Comparison of CW-ODMR spectra when magnetic fields of the same nominal magnitude are applied along different Helmholtz-coil axes. The red reference trace corresponds to the baseline spectrum without the directional test field. Because each coil axis has a different projection onto the selected NV axis, the defined Z direction produces the largest shift in the outermost resonance peak.
Applsci 16 06844 g004
Figure 5. First-derivative ODMR spectra measured at coil currents from 0 to 500 mA in 100 mA increments. The shaded bands indicate the local frequency intervals used for linear fitting.
Applsci 16 06844 g005
Figure 6. Current-dependent linear fits of the first-order differential ODMR signal. (a) Local raw measurements (open circles) and their linear fits at six coil currents. (b) Fitted discriminator slopes across the tested current range (233–271 mV/MHz).
Applsci 16 06844 g006
Figure 7. Fluorescence response as a function of AC-coil current amplitude and free-evolution time τ.
Applsci 16 06844 g007
Figure 8. Selection of the AC-measurement parameters. (a) Fluorescence response as a function of free-evolution time τ at an AC-coil current of 450 mA and a field frequency of 200 kHz. (b) Fluorescence response as a function of AC-coil current at f = 200 kHz and τ = 5 μs.
Applsci 16 06844 g008
Disclaimer/Publisher’s Note: The statements, opinions and data contained in all publications are solely those of the individual author(s) and contributor(s) and not of MDPI and/or the editor(s). MDPI and/or the editor(s) disclaim responsibility for any injury to people or property resulting from any ideas, methods, instructions or products referred to in the content.