1. Introduction
With the deep integration of the digital economy and electronic commerce, credit cards have become a core component of the global payment system, yet fraud risks have become increasingly diversified and concealed, inflicting substantial economic losses on financial institutions and cardholders [
1,
2,
3,
4]. Industry statistics show that global credit card fraud losses reached 28.58 billion US dollars in 2020, an increase of 6.74 billion US dollars compared with 2015, and cumulative global fraud losses are projected to exceed 408 billion US dollars over the next decade [
5]. In the United States, official data indicate that the country recorded 2.4 million credit card-related fraud reports in 2022, with consumers suffering direct losses of nearly 880 million US dollars, among which losses from imposter scams rose by 12.5% compared with 2021 [
6]. In the European region, although the fraud ratio per credit card transaction is extremely low, the large transaction volume still leads to considerable annual economic losses. For example, the European credit card dataset on the Kaggle platform contains 284,807 transactions, with only 492 identified as fraudulent, corresponding to a fraud ratio of approximately 0.17% [
7,
8,
9]. This context underscores three core challenges in credit card fraud detection: extreme class imbalance, dynamic evolution of fraud patterns, and high-dimensional transaction features. These factors make fraud detection a rare-event classification problem in which fraud-class recall, false-alarm control, precision, and generalization must be evaluated simultaneously rather than relying mainly on overall accuracy [
6,
10].
Existing research on credit card fraud detection has conducted extensive explorations centered on machine learning, deep learning, ensemble learning, and data preprocessing techniques, yet several methodological bottlenecks remain. In terms of data processing, single sampling techniques, such as traditional Synthetic Minority Oversampling Technique (SMOTE) and Random Undersampling (RUS), may exhibit insufficient robustness in low-proportion scenarios where fraud accounts for less than 0.2% of total transactions. Although traditional SMOTE can alleviate class imbalance by generating synthetic minority-class samples, it may also introduce boundary noise, while undersampling may discard useful majority-class information [
11,
12,
13]. Moreover, feature engineering and data balancing are often treated as independent steps, which may leave redundant or weakly informative variables in the modeling process. Such redundancy can interfere with model learning and reduce detection performance, especially when anonymized high-dimensional transaction variables are used. In terms of model construction, traditional machine learning algorithms can perform well on structured transaction data, but their effectiveness may depend strongly on feature quality, threshold selection, and hyperparameter settings [
6]. Deep learning techniques, while capable of automatically extracting nonlinear representations, usually require large amounts of labeled data; their generalization ability may decrease when fraudulent samples are extremely scarce. In addition, high model complexity can lead to long inference latency, making these methods difficult to adapt to real-time transaction interception requirements [
7]. Ensemble learning can integrate the advantages of multiple models, but many existing studies focus on homogeneous model combinations or single-component optimization, making it difficult to fully examine the interaction among feature selection, class imbalance handling, and hyperparameter optimization [
7]. In terms of parameter optimization, traditional hyperparameter tuning methods such as Grid Search and Random Search require traversal of many candidate parameter combinations. Their computational costs increase rapidly with the dimension of the search space, making them less suitable for multi-hyperparameter scenarios [
14]. Evolutionary optimization algorithms, such as Particle Swarm Optimization (PSO) and Genetic Algorithm (GA), provide flexible alternatives for hyperparameter search, but their effectiveness should be verified using leakage-safe validation and benchmark comparisons rather than assumed a priori [
15,
16]. Additionally, many studies focus on datasets or evaluation settings that do not fully reflect low-proportion fraud data in actual financial scenarios. If final evaluation is performed on resampled or balanced test sets, the reported performance may be overly optimistic and may not represent practical fraud detection performance under the original class distribution [
17].
To address the aforementioned issues, this study takes the public European Credit Card Fraud Dataset on the Kaggle platform as the research object. The dataset contains 284,807 transactions and 31 feature variables, among which 492 are fraudulent transactions, accounting for only approximately 0.17% [
13]. This study proposes and evaluates a leakage-safe credit card fraud detection framework that integrates Random Forest (RF) Gini impurity-based feature selection, resampling strategies, and GA-based hyperparameter optimization. First, RF-Gini importance is used to screen 15 core features from the original variables, thereby reducing redundant information and improving model training efficiency. Second, resampling strategies are evaluated as experimental components rather than assumed to be universally optimal. In particular, the Synthetic Minority Oversampling Technique-Edited Nearest Neighbor (SMOTE-ENN) hybrid strategy combines SMOTE, which generates synthetic minority-class samples through interpolation, and ENN, which removes noisy or ambiguous samples near class boundaries [
18,
19,
20]. However, to prevent data leakage, feature selection, scaling, and resampling are fitted only on the training data or training folds, while validation folds and the final test set preserve the original class distribution. Third, GA is used to optimize the key hyperparameters of three representative classifiers: Multilayer Perceptron (MLP), RF, and Extreme Gradient Boosting (XGBoost). During GA optimization, candidate hyperparameter combinations are evaluated using imbalance-aware validation metrics, with particular attention to PR-AUC, fraud-class F1-score, MCC, false positives, and false negatives.
The core value of this study lies in constructing a leakage-safe and ablation-based evaluation framework for low-proportion fraud data in real-world scenarios. Instead of claiming that a fixed preprocessing strategy is universally optimal, this study examines how feature selection, resampling, and GA-based hyperparameter optimization interact under an extreme class imbalance setting. Final model evaluation is performed on an untouched original-distribution test set, and model performance is reported using imbalance-aware metrics, including PR-AUC, MCC, balanced accuracy, fraud-class precision, fraud-class recall, fraud-class F1-score, false positives, false negatives, and false positives per fixed number of transactions. This design provides a more reliable basis for assessing the practical value of machine learning-based credit card fraud detection models in financial risk control systems.
2. Related Work
The core challenges in credit card fraud detection are mainly reflected in three aspects: adaptation to extremely imbalanced data, identification of complex and evolving fraud patterns, and the balance between model generalization and operational efficiency. Existing studies have explored machine learning, deep learning, ensemble learning, feature engineering, and data preprocessing techniques. However, because fraudulent transactions usually account for only a very small proportion of all transactions, model evaluation based mainly on overall accuracy may be misleading. Therefore, this section reviews existing studies from four perspectives: machine learning and deep learning methods, ensemble learning techniques, feature engineering and data preprocessing strategies, and remaining methodological gaps.
2.1. The Application of Machine Learning and Deep Learning in Fraud Detection
Early research on credit card fraud detection mainly focused on traditional machine learning algorithms. Alarfaj et al. (2022) [
21] systematically evaluated basic algorithms such as Support Vector Machine (SVM) and K-Nearest Neighbors (KNN). These models can achieve relatively high accuracy when feature separability is strong, but they are prone to minority-class misdetection when facing high-dimensional and imbalanced data [
21]. Taha and Malebary (2020) proposed an optimized Light Gradient Boosting Machine (LightGBM)-based fraud detection scheme, which suppressed overfitting through regularization and reported good performance on financial datasets. However, the model still relied on manually specified parameter settings, which limited its adaptability across different data distributions [
22].
Deep learning techniques have also received increasing attention because of their nonlinear representation ability. Alharbi et al. (2022) designed a deep learning-based text2IMG mechanism that converted transaction features into image-like representations for fraud identification [
23]. Although deep learning can automatically learn nonlinear feature interactions, it usually requires a large amount of labeled data. In credit card fraud detection, fraudulent samples are extremely scarce, which may weaken the generalization ability of deep models. In addition, the high complexity and long inference latency of some deep learning architectures may restrict their deployment in real-time transaction monitoring. Therefore, both traditional machine learning and deep learning methods require careful evaluation under original class distributions, especially using fraud-class-oriented metrics rather than relying only on overall accuracy.
2.2. Research Progress of Ensemble Learning Technology
Ensemble learning has become an important approach in fraud detection because it can improve robustness by combining multiple learners or decision rules. Bagga et al. (2020) proposed a stacking ensemble framework based on TensorFlow, integrating decision trees and logistic regression for real-time fraud detection [
24]. Baker et al. (2022) optimized Random Forest (RF) using the Bagging strategy, reducing overfitting risk through voting among multiple decision trees and improving model stability in blockchain transaction fraud detection [
25].
Heterogeneous ensemble models can integrate the advantages of different algorithmic structures and often show stronger comprehensive performance. Gupta et al. (2025) [
9] designed a stacking ensemble model combining SVM, KNN, and Particle Swarm Optimization-optimized Extreme Learning Machine (PSO-ELM). Although PSO improved the performance of the ELM component, the optimization mainly focused on one part of the model rather than systematically examining hyperparameter optimization across different model families [
9]. Alatawi (2025) compared ensemble models such as RF and Gradient Boosting Machine (GBM) and reported strong performance in fraud detection in IoT-enabled environments [
10]. However, many ensemble studies still focus on homogeneous model combinations or single-component optimization. Such designs may not fully clarify how feature selection, class imbalance handling, and hyperparameter optimization jointly influence model performance under rare-event fraud detection settings [
26,
27].
2.3. Feature Engineering and Data Preprocessing Strategies
Data preprocessing is a critical step in dealing with class imbalance in fraud detection. To address the scarcity of minority-class samples, SMOTE proposed by Chawla et al. generates synthetic minority-class samples and has become a widely used preprocessing method. However, SMOTE may introduce synthetic boundary noise, especially when minority-class samples are sparse and close to majority-class regions [
28]. Gupta et al. (2025) adopted the SMOTE-ENN hybrid strategy, in which SMOTE generates minority-class samples and ENN removes noisy samples, showing the potential benefit of combining oversampling and noise cleaning [
9]. Nevertheless, resampling methods should be applied only to the training data. If resampled data are used for validation or final testing, the estimated performance may become overly optimistic and may not reflect real-world fraud prevalence.
Feature engineering is another important factor affecting fraud detection performance. Correa Bahnsen et al. (2016) investigated the impact of feature selection on fraud detection and showed that Gini impurity-based feature screening can remove redundant information and improve computational efficiency [
29]. Zhang et al. (2021) proposed a deep learning-driven HOBA feature engineering method to automatically extract high-order features, but its interpretability remains limited, making it difficult to satisfy financial regulatory requirements [
30]. Overall, existing preprocessing strategies still have limitations. Single sampling techniques may be unstable when the fraud ratio is extremely low, and feature engineering, resampling, and model optimization are often conducted as separate steps rather than as a jointly evaluated pipeline [
31,
32].
2.4. Shortcomings and Gaps in Existing Research
Synthesizing the aforementioned research progress, three methodological gaps remain in current credit card fraud detection research.
First, hyperparameter optimization remains limited. Many existing studies adopt Grid Search, Random Search, or single optimization algorithms such as PSO. These methods may struggle to balance search coverage, computational efficiency, and robustness when multiple model hyperparameters need to be optimized simultaneously [
9,
10].
Second, technical synergy remains insufficient. Feature engineering, data preprocessing, and model optimization are often designed independently. This makes it difficult to determine whether performance improvements come from feature selection, resampling, hyperparameter tuning, or their interaction. A more reliable framework should evaluate these components through controlled ablation experiments [
29,
33].
Third, leakage-safe evaluation under the original class distribution is still insufficiently emphasized. In extremely imbalanced fraud detection, evaluating models on resampled or balanced test sets can produce overly optimistic results. For practical financial risk control, the final test set should remain untouched and preserve the original fraud prevalence. Feature selection, scaling, resampling, threshold tuning, and hyperparameter optimization should be restricted to the training data or training folds only. Moreover, model performance should be assessed using imbalance-aware metrics, such as PR-AUC, MCC, balanced accuracy, fraud-class precision, fraud-class recall, fraud-class F1-score, false positives, and false negatives, rather than relying mainly on accuracy.
To address these gaps, this study proposes an integrated and leakage-safe framework combining RF-Gini feature selection, resampling strategy evaluation, and GA-based hyperparameter optimization. The framework further introduces ablation experiments to examine the separate and combined effects of feature selection, resampling, and GA optimization under an extreme class imbalance setting.
3. Materials and Methods
The dataset used in this study is the public European Credit Card Fraud Detection dataset, which contains credit card transactions made by European cardholders in September 2013. The dataset was originally released by the Machine Learning Group of Université Libre de Bruxelles and is publicly available on Kaggle. It contains 284,807 transaction records, including 284,315 legitimate transactions and 492 fraudulent transactions. Fraudulent transactions account for only 0.1727% of all records, indicating an extremely imbalanced binary classification problem.
The dataset contains 31 variables in total, including 30 input variables and one target variable. The input variables consist of Time, Amount, and 28 anonymized numerical features (V1–V28) generated through principal component analysis to protect cardholder privacy. The target variable is Class, where Class = 0 represents a legitimate transaction and Class = 1 represents a fraudulent transaction. The transaction amount ranges from 0 to 25,691.16, while Time records the elapsed seconds between each transaction and the first transaction in the dataset.
Table 1 summarizes the descriptive statistics of several representative original variables, including Time, Amount, and selected PCA-transformed variables.
Because the PCA-transformed variables are anonymized, their original transaction meanings cannot be directly interpreted. Therefore,
Table 2 provides the complete variable structure of the dataset and clarifies which variables were used as input features and which variable was used as the classification target. This variable structure was used as the basis for subsequent feature selection, class imbalance handling, and model construction.
To ensure leakage-safe evaluation, the original dataset was divided into a training set and an untouched test set using stratified 70:30 splitting. The training set contained 199,364 transactions, including 199,020 legitimate transactions and 344 fraudulent transactions. The test set contained 85,443 transactions, including 85,295 legitimate transactions and 148 fraudulent transactions. The test set preserved the original fraud prevalence and was used only once for final model evaluation. No feature selection, standardization, resampling, GA optimization, or threshold tuning was performed on the test set.
3.1. Data Preprocessing
Descriptive statistics were first calculated for representative variables, including Time, Amount, and selected PCA-transformed variables. These statistics were used to characterize the original dataset and to identify potential scale differences among variables. As shown in
Table 1, the transaction amount has a mean value of 88.35 and a standard deviation of 250.12, indicating substantial variability in transaction values. These descriptive statistics were used only to understand the original data distribution and were not used for model fitting.
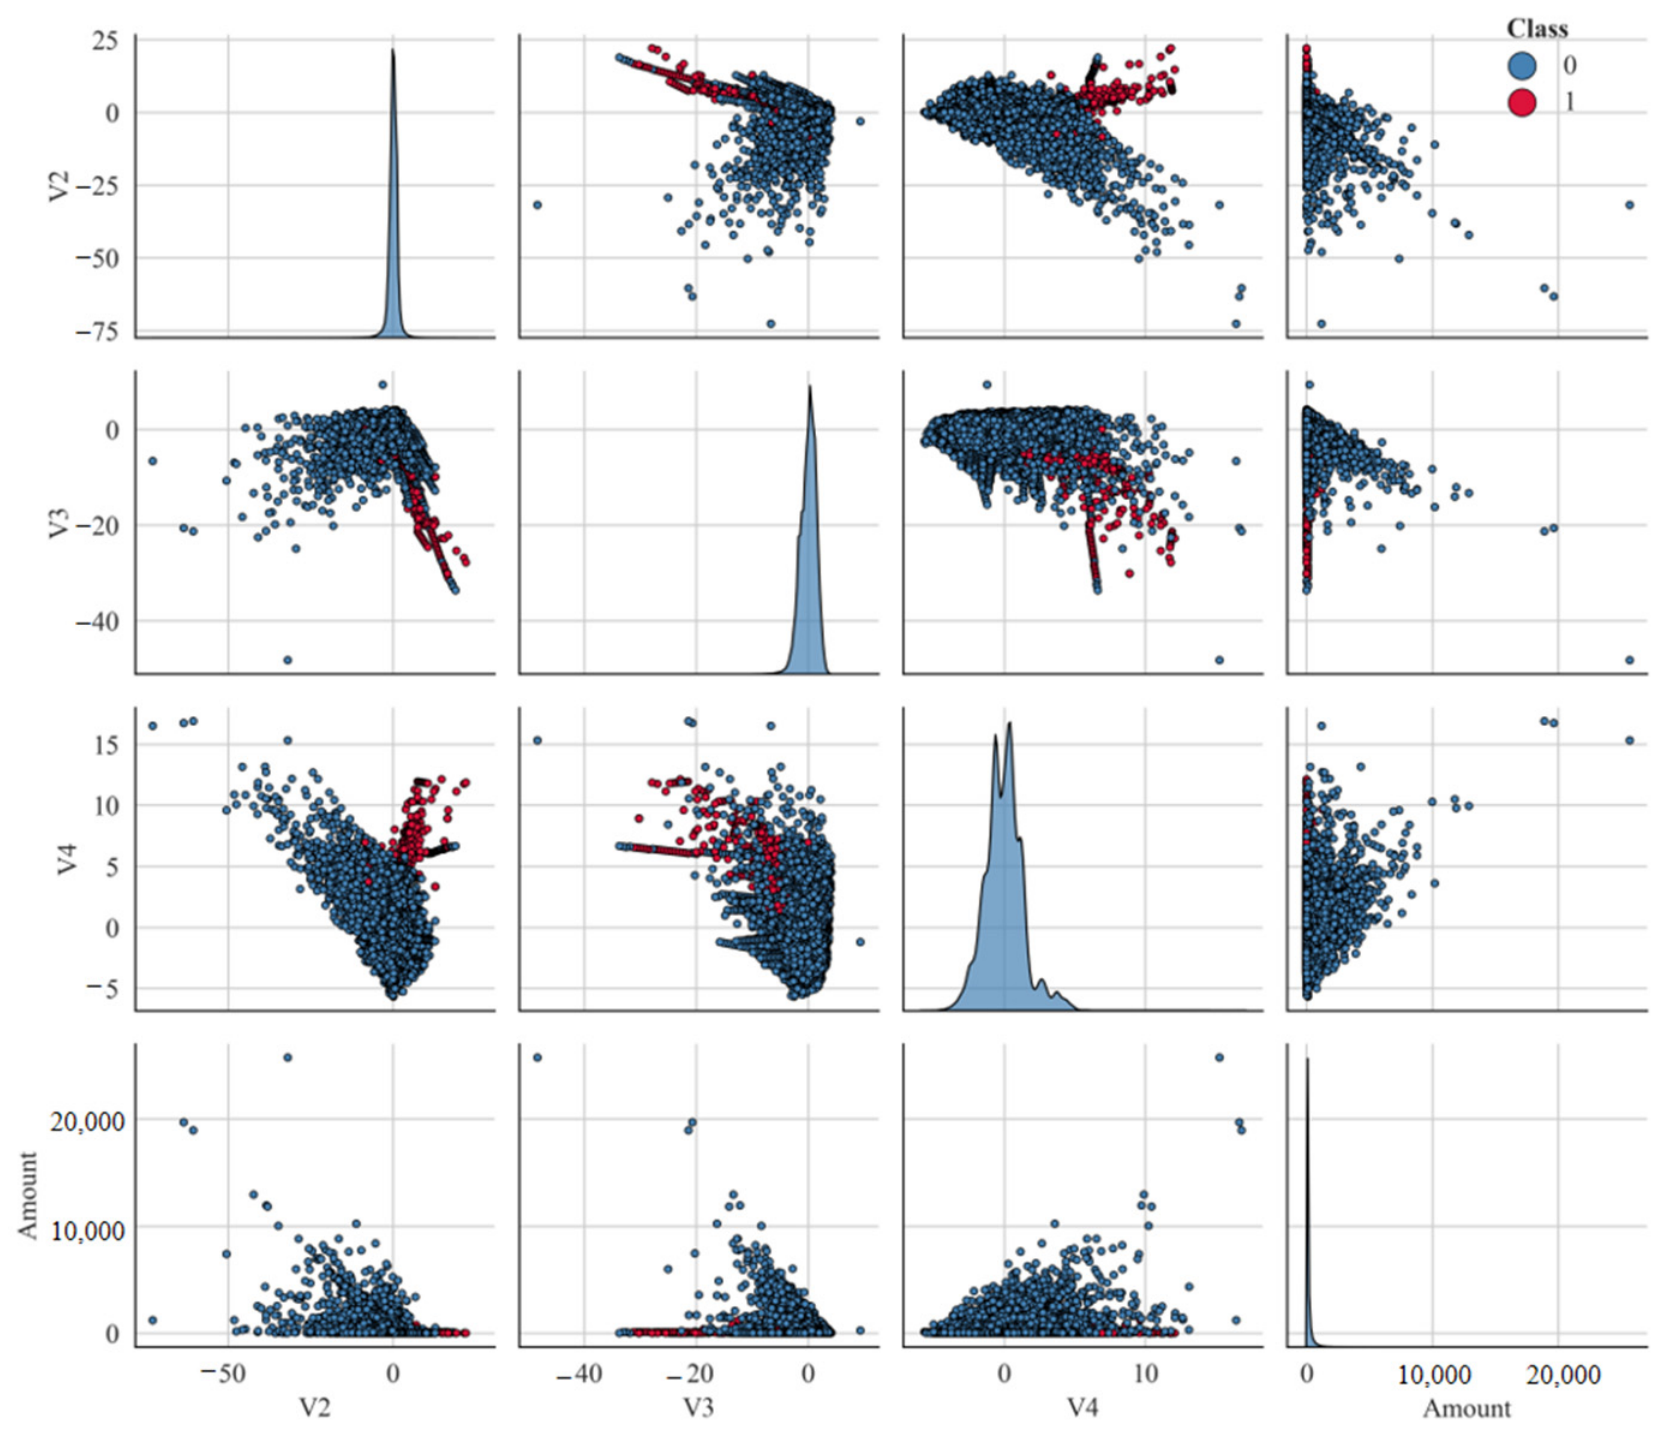
Exploratory Data Analysis (EDA) was then conducted to visualize the distributional differences between legitimate and fraudulent transactions.
Figure 1 presents the pair plot of selected variables, including V2, V3, V4, and Amount. The plot shows that fraudulent and legitimate transactions exhibit partial separation in some variables, while overlap remains evident in others. This overlap indicates the classification difficulty caused by extreme class imbalance and similar transaction patterns between the two classes. The EDA was used only for descriptive understanding of the dataset; formal feature selection was performed using RF-Gini importance within the leakage-safe training procedure.
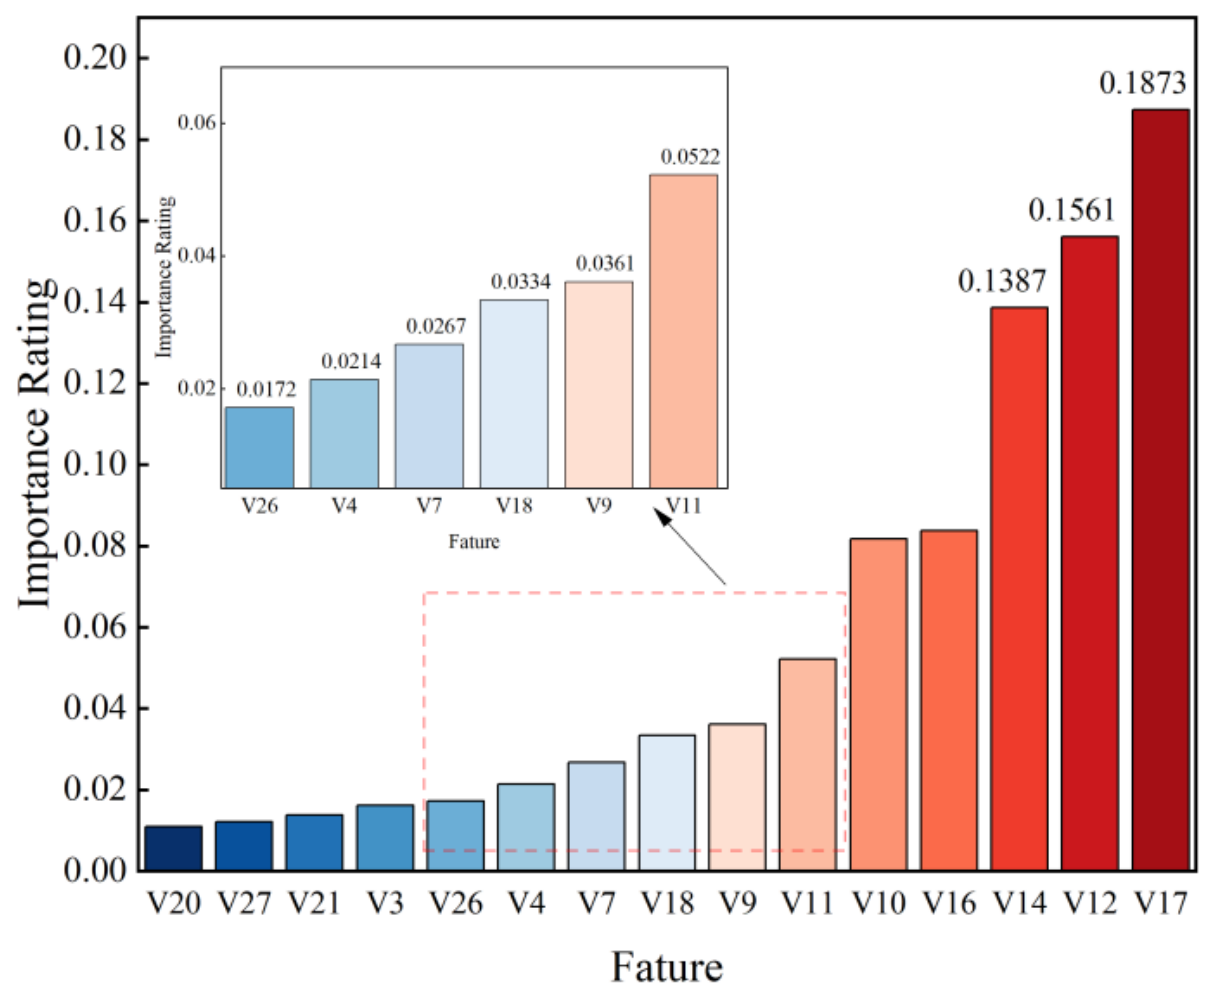
Feature selection was performed using Random Forest Gini importance. The importance of each input variable was calculated according to its contribution to reducing Gini impurity during tree splitting.
Figure 2 shows the ranking of feature importance obtained from the training data. Based on this ranking, the top 15 variables were selected as core features for subsequent model training.
The selected features and their Gini importance scores are listed in
Table 3. To prevent information leakage, RF-Gini feature selection was fitted only on the training data. During cross-validation, the feature selector was fitted only on the training fold, and the validation fold was transformed using the features selected from the corresponding training fold. The final test set was never used during feature selection. Because V1–V28 are PCA-transformed anonymized variables, their original business meanings cannot be directly interpreted. Therefore, the interpretation of these selected features is based on their statistical contribution to classification rather than direct transaction semantics.
To address the severe class imbalance in the dataset, this study evaluated several resampling strategies, including no resampling, SMOTE, ENN, and SMOTE-ENN. SMOTE generates synthetic minority-class samples through interpolation between fraudulent samples and their nearest neighbors [
34]. ENN removes samples whose class labels are inconsistent with those of their nearest neighbors, thereby reducing boundary noise [
35]. SMOTE-ENN combines oversampling and noise cleaning by first generating synthetic minority-class samples and then removing ambiguous samples near class boundaries. Other commonly used imbalance-handling methods, such as Random Undersampling, Random Oversampling, ADASYN, and SMOTE-Tomek Links, were also considered as comparative preprocessing strategies [
36].
In this study, resampling was treated as an experimental component rather than assumed to be universally optimal. To avoid data leakage, resampling was applied only to the training set or to the training fold within cross-validation. Validation folds and the final test set were never resampled and preserved the original class distribution. Standardization was performed using StandardScaler. The scaler was fitted only on the training data or training fold and was then applied to the corresponding validation fold or final test set. The final test set was transformed using parameters learned from the training set and was never used to fit the scaler. Standardization was calculated as follows:
where x is the original feature value, μ is the mean of the corresponding feature in the training data, σ is the standard deviation of the corresponding feature in the training data, and z is the standardized value.
The ablation analysis in the Results section further compares no resampling, SMOTE, ENN, and SMOTE-ENN under the same original-distribution test setting. Therefore, this study does not assume that class balancing is always beneficial; instead, the effect of each resampling strategy is evaluated empirically.
3.2. Model Establishment and Optimization
This section describes the base classifiers and the GA-based hyperparameter optimization strategy used in the proposed framework. The three classifiers were selected as representative model families rather than as newly developed algorithms. The purpose was to evaluate whether RF-Gini feature selection, resampling strategies, and GA-based hyperparameter optimization could improve fraud detection under extreme class imbalance. All model training and hyperparameter optimization procedures were conducted within the leakage-safe training workflow described in
Section 3.1.
3.2.1. Core Machine Learning Models
This study selected three representative and widely used machine learning models as base classifiers: Multilayer Perceptron (MLP), Random Forest (RF), and Extreme Gradient Boosting (XGBoost). These models were chosen because they represent different learning paradigms: neural-network learning, bagging ensemble learning, and boosting ensemble learning. They have also been widely used in fraud detection and imbalanced classification tasks [
37,
38,
39,
40,
41,
42].
MLP is a feedforward neural network capable of learning nonlinear relationships among transaction variables. RF is a bagging-based ensemble of decision trees and is relatively robust to noisy or redundant features. XGBoost is a gradient boosting algorithm with regularization mechanisms and strong performance on structured tabular data. In this study, these models served as controlled base learners for comparing the effects of feature selection, resampling, and hyperparameter optimization.
The initial hyperparameters of the baseline models were set as follows: MLP used two hidden layers with 64 and 32 neurons and ReLU activation; RF used 100 decision trees with a maximum depth of 10; and XGBoost used a learning rate of 0.1, 100 estimators, and a maximum depth of 6. These baseline settings were used before GA-based optimization.
3.2.2. GA-Based Hyperparameter Optimization
Hyperparameter tuning is a critical step in improving model performance. Traditional Grid Search requires exhaustive traversal of candidate parameter combinations, and Random Search may miss promising regions of the search space when the number of hyperparameters increases. Therefore, this study used GA as a flexible stochastic search method for hyperparameter optimization [
43,
44].
GA was implemented using discrete chromosome encoding. Each chromosome represented a complete candidate hyperparameter combination, and each gene corresponded to one hyperparameter value. The GA configuration was as follows: population size = 6, maximum generations = 6, crossover probability = 0.8, mutation probability = 0.15, and elitism size = 1. Tournament selection was used to select parent individuals. Uniform crossover was used to generate offspring by exchanging hyperparameter genes between two parent chromosomes. Random-reset mutation was applied by replacing a gene with another value from its predefined search space. The random seed was fixed at 42 to improve reproducibility.
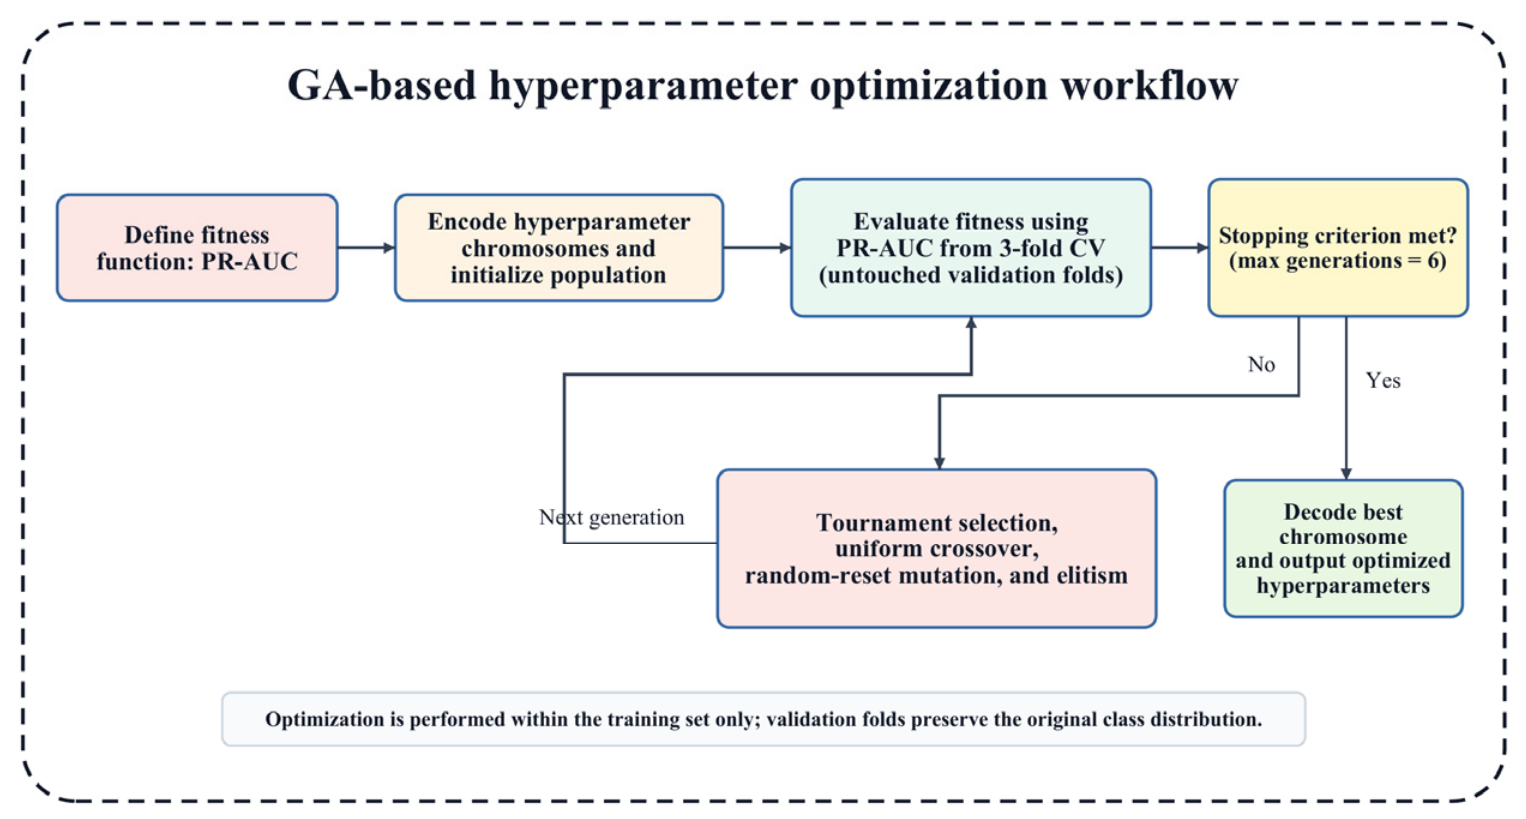
Because the dataset is extremely imbalanced, PR-AUC on untouched validation folds was used as the GA fitness function. During GA optimization, 3-fold stratified cross-validation was performed within the training set. In each fold, feature selection, scaling, and SMOTE-ENN were fitted only on the training fold, whereas the validation fold preserved the original class distribution and was never resampled. This design ensured that the GA optimization process did not use synthetic validation samples or any information from the final test set.
The GA-based hyperparameter optimization workflow is shown in
Figure 3. After initializing the population, each individual was evaluated using PR-AUC obtained from untouched validation folds. Tournament selection, uniform crossover, random-reset mutation, and elitism were then applied to update the population. The optimization process stopped when the maximum number of generations was reached, and the best chromosome was decoded as the optimized hyperparameter combination.
For RF, the search space included n_estimators = {100, 150, 200}, max_depth = {6, 8, 10, 12, 16, None}, min_samples_split = {2, 5, 10}, min_samples_leaf = {1, 2, 4}, and max_features = {sqrt, log2}. For MLP, the search space included hidden_layer_sizes = {(32), (64), (128), (64, 32), (128, 64)}, activation = {relu, tanh}, alpha = {0.0001, 0.001, 0.01}, and learning_rate_init = {0.001, 0.005, 0.01}. For XGBoost, the search space included n_estimators = {100, 150, 200}, max_depth = {3, 4, 5, 6}, learning_rate = {0.03, 0.05, 0.10}, subsample = {0.80, 0.90, 1.00}, colsample_bytree = {0.80, 0.90, 1.00}, and reg_lambda = {1.0, 2.0, 5.0}. These search spaces were used for GA-based hyperparameter optimization under the leakage-safe cross-validation protocol.
3.3. Model Evaluation
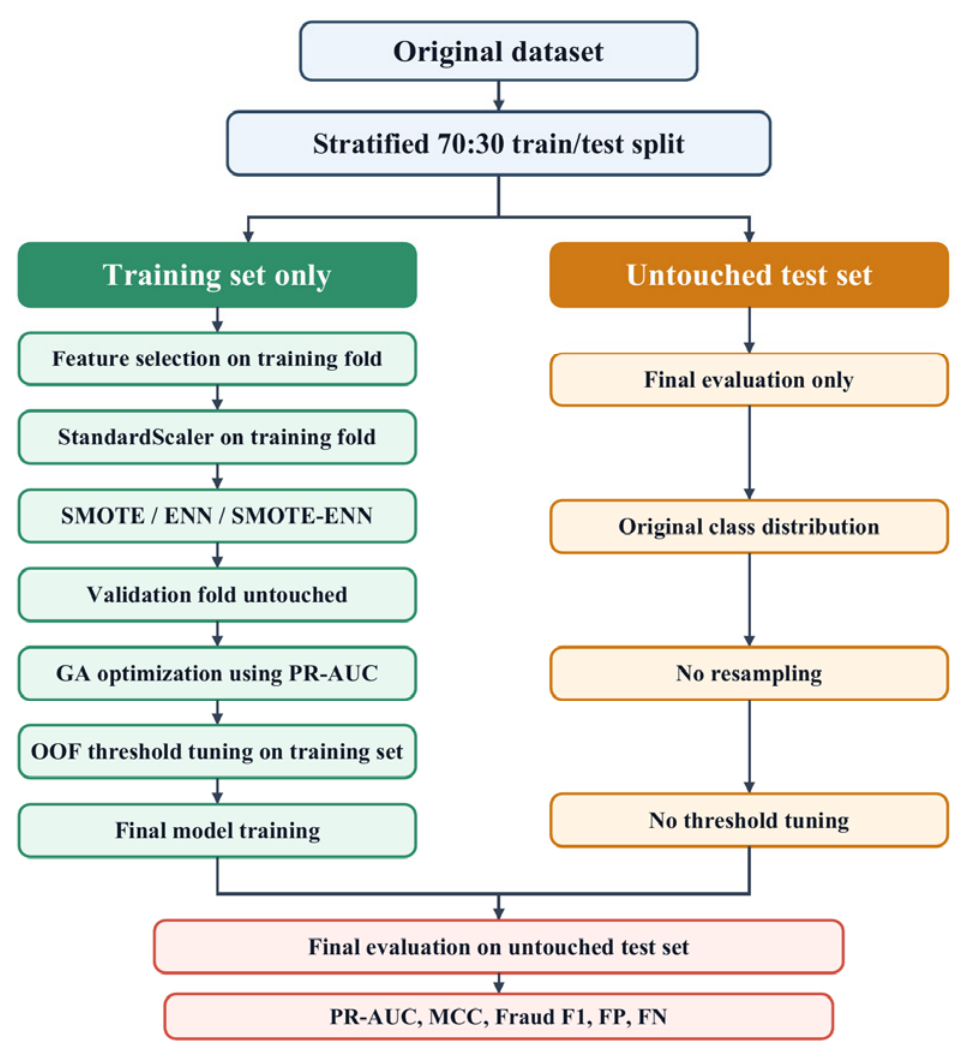
Model evaluation is a core step in verifying the effectiveness and reliability of credit card fraud detection models. In this study, all model evaluation procedures followed a leakage-safe workflow, as shown in
Figure 4. The original dataset was first divided into a stratified training set and an untouched test set. Feature selection, standardization, resampling, GA optimization, and threshold tuning were performed only on the training data or training folds. The final test set preserved the original class distribution and was used only once for final model evaluation.
Because the dataset is extremely imbalanced, overall accuracy was reported only as a secondary reference metric. The primary evaluation metrics included Precision–Recall Area Under the Curve (PR-AUC), Matthews correlation coefficient (MCC), balanced accuracy, fraud-class precision, fraud-class recall, fraud-class F1-score, false positives (FP), false negatives (FN), and false positives per 10,000 transactions. Receiver Operating Characteristic Area Under the Curve (ROC-AUC) was also reported for comparability with previous studies, but it was not used as the only criterion because ROC-AUC may appear overly optimistic under severe class imbalance.
The confusion matrix summarizes the relationship between predicted labels and actual labels. It includes four components: True Positive (TP), referring to fraudulent transactions correctly predicted as fraudulent; True Negative (TN), referring to legitimate transactions correctly predicted as legitimate; False Positive (FP), referring to legitimate transactions incorrectly predicted as fraudulent; and False Negative (FN), referring to fraudulent transactions incorrectly predicted as legitimate. In practical fraud detection, FP reflects the false-alarm burden imposed on legitimate users, whereas FN reflects missed fraud cases that may lead to financial losses.
Fraud-class precision measures the proportion of truly fraudulent transactions among all transactions predicted as fraudulent:
Fraud-class recall, also known as sensitivity, measures the proportion of actual fraudulent transactions correctly detected by the model:
Fraud-class F1-score is the harmonic mean of fraud-class precision and fraud-class recall. It reflects the balance between false alarms and missed fraud cases:
Balanced accuracy was used to reduce the dominance of the majority class and was calculated as the average of sensitivity and specificity:
where specificity is calculated as:
MCC was used as a comprehensive metric for imbalanced binary classification because it considers TP, TN, FP, and FN simultaneously:
PR-AUC measures the area under the precision–recall curve. It is especially informative for rare-event detection because it focuses on the model’s ability to identify the minority fraud class. In contrast, ROC-AUC measures the trade-off between true positive rate and false positive rate under different thresholds. Although ROC-AUC is widely used, it may provide an overly optimistic view when the negative class dominates the dataset. Therefore, PR-AUC and fraud-class metrics were emphasized in this study.
False positives per 10,000 transactions were also reported to reflect the operational false-alarm burden in practical deployment:
where N_test denotes the total number of transactions in the untouched test set.
The decision threshold was not selected using the final test set. Instead, thresholds were tuned using out-of-fold probability predictions generated from the training set only, with fraud-class F1-score used as the threshold-selection criterion. The selected threshold was then fixed and applied once to the untouched original-distribution test set. This ensured that the final test set remained independent throughout model development and evaluation.
4. Results and Discussion
4.1. Baseline Model Performance Before GA Optimization
4.1.1. Overview of Experimental Results
All baseline and GA-optimized models were evaluated using the leakage-safe protocol described in
Section 3. The original dataset was first divided into a stratified training set and an untouched original-distribution test set. Feature selection, standardization, resampling, GA optimization, and threshold tuning were performed only on the training data or training folds. The final test set contained 85,443 transactions, including 85,295 legitimate transactions and 148 fraudulent transactions, and was used only once for final evaluation.
In the final evaluation, SMOTE, ENN, and SMOTE-ENN were not applied to the test set. Therefore, all reported confusion matrices and derived metrics reflect the original fraud prevalence. Because the dataset is extremely imbalanced, accuracy was not used as the primary evaluation criterion. Instead, model performance was assessed mainly using PR-AUC, ROC-AUC, MCC, balanced accuracy, fraud-class precision, fraud-class recall, fraud-class F1-score, false positives, false negatives, and false positives per 10,000 transactions.
For the baseline models, RF, MLP, and XGBoost were trained using the selected 15 RF-Gini features and training-only preprocessing. Decision thresholds were selected using out-of-fold predictions from the training set only and were then fixed before final evaluation on the untouched test set.
4.1.2. Baseline Performance Before GA Optimization
Table 4 shows the baseline performance of RF, MLP, and XGBoost on the untouched original-distribution test set. The three baseline models achieved similar fraud-class F1-scores, ranging from 0.764 to 0.773. Baseline-MLP achieved the highest fraud recall among the baseline models, correctly identifying 109 of 148 fraudulent transactions, with a fraud-class recall of 0.736 and an F1-score of 0.773. Baseline-RF achieved a PR-AUC of 0.746 and an F1-score of 0.767, with 24 false positives and 41 false negatives. Baseline-XGBoost produced the fewest false positives among the baseline models, with 22 false positives, but missed 43 fraudulent transactions.
These results indicate that the baseline models can identify part of the minority fraud class under the original class distribution, but their fraud recall remains limited. In practical fraud detection, false negatives represent missed fraudulent transactions, while false positives represent legitimate transactions incorrectly flagged as fraud. Therefore, further optimization is required to improve the balance between missed fraud cases and false alarms.
4.2. Model Performance After GA Optimization
To improve the baseline models, GA was used to optimize the key hyperparameters of MLP, RF, and XGBoost within the leakage-safe training workflow. During GA optimization, PR-AUC on untouched validation folds was used as the fitness function. The final optimized models were evaluated only once on the untouched original-distribution test set. The performance of the GA-optimized models is shown in
Table 5.
Among the GA-optimized models, GA-XGBoost achieved the best overall balance. It obtained a PR-AUC of 0.798, ROC-AUC of 0.967, MCC of 0.814, balanced accuracy of 0.865, fraud-class precision of 0.908, fraud-class recall of 0.730, and fraud-class F1-score of 0.809. It produced only 11 false positives and 40 false negatives on the untouched test set.
GA-RF achieved the highest PR-AUC among the GA-optimized models, with a PR-AUC of 0.808 and fraud-class recall of 0.743. However, its fraud-class precision and F1-score were slightly lower than those of GA-XGBoost. GA-MLP achieved the highest fraud-class precision of 0.920 and the fewest false positives, with only 8 legitimate transactions incorrectly flagged as fraud. However, this came at the cost of lower fraud recall, as GA-MLP missed 56 fraudulent transactions. Therefore, GA-MLP behaved as a more conservative classifier, reducing false alarms but increasing missed fraud cases.
Overall, GA-XGBoost was selected as the recommended GA-optimized model because it achieved the highest MCC and fraud-class F1-score while maintaining a low number of false positives.
4.3. Performance Comparison and Analysis
Table 4 and
Table 5 compare the baseline and GA-optimized models on the untouched original-distribution test set. The comparison shows that GA optimization did not improve all models uniformly. Instead, its effect depended on the model type and the trade-off between false positives and false negatives.
For RF, GA optimization improved the fraud-class F1-score from 0.767 to 0.789 and increased fraud recall from 0.723 to 0.743. The number of false negatives decreased from 41 to 38, and the number of false positives decreased from 24 to 21. This indicates that GA optimization moderately improved both fraud detection coverage and false-alarm control for RF.
For MLP, GA optimization produced a different effect. Although fraud precision increased from 0.813 to 0.920 and false positives decreased from 25 to 8, fraud recall decreased from 0.736 to 0.622, and false negatives increased from 39 to 56. Therefore, GA-MLP became more conservative after optimization. This result suggests that optimizing for validation PR-AUC does not necessarily maximize fraud-class recall on the final test set, especially for neural-network models under extreme class imbalance.
For XGBoost, GA optimization produced the most favorable overall improvement. Compared with baseline XGBoost, GA-XGBoost increased PR-AUC from 0.741 to 0.798, MCC from 0.766 to 0.814, and fraud-class F1-score from 0.764 to 0.809. It also reduced false positives from 22 to 11 and false negatives from 43 to 40. These results indicate that GA optimization improved both ranking quality and threshold-dependent classification performance for XGBoost under the leakage-safe evaluation protocol.
In summary, evaluation on the original-distribution test set provides a more conservative and realistic interpretation of model performance. GA optimization improved RF and XGBoost, but it did not uniformly improve MLP. Among the optimized models, GA-XGBoost achieved the best balance between fraud detection ability and false-alarm control. Therefore, subsequent confusion matrix analysis and ablation experiments focus mainly on XGBoost.
4.4. Confusion Matrix and Curve-Based Evaluation on the Untouched Test Set
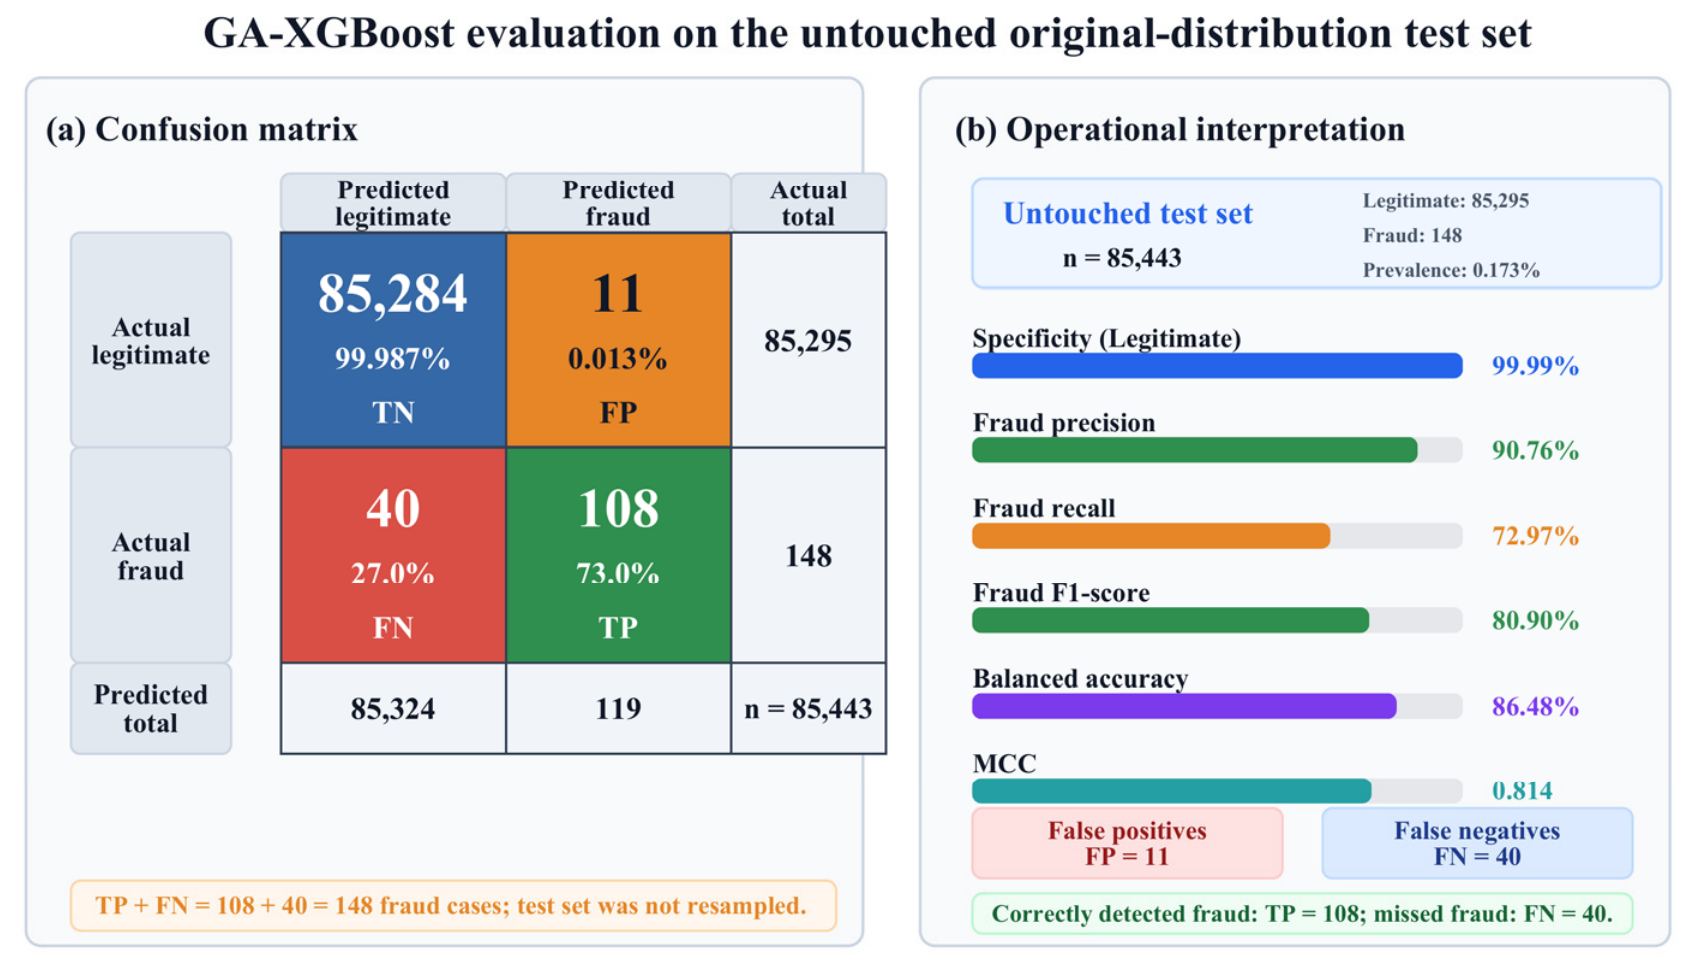
To further examine the classification behavior of the recommended model, the confusion matrix of GA-XGBoost was analyzed on the untouched original-distribution test set. The final test set was not resampled and contained 85,295 legitimate transactions and 148 fraudulent transactions. Therefore, the confusion matrix directly reflects model performance under the original fraud prevalence.
As shown in
Figure 5, GA-XGBoost correctly classified 85,284 legitimate transactions and incorrectly flagged 11 legitimate transactions as fraudulent. For the fraud class, the model correctly detected 108 fraudulent transactions and missed 40 fraudulent transactions. Thus, TP + FN equals 148, which is consistent with the original number of fraudulent transactions in the test set. From an operational perspective, the 11 false positives indicate a relatively low false-alarm burden, whereas the 40 false negatives show that some fraudulent transactions were still missed. This result indicates that GA-XGBoost achieved strong but not perfect fraud detection performance under the original class distribution.
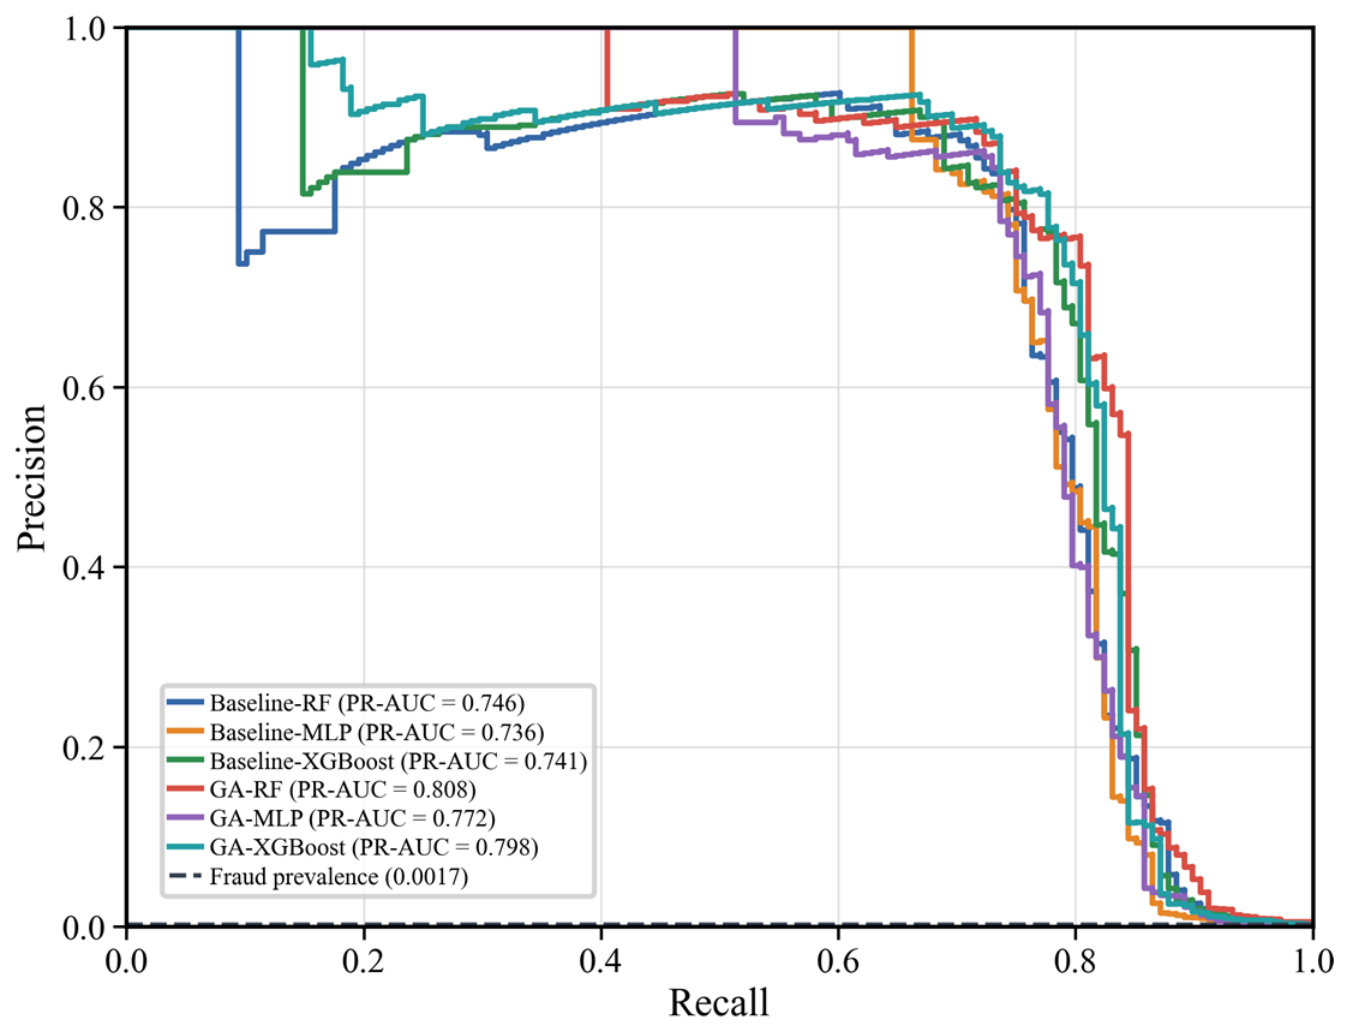
Curve-based metrics were further used to evaluate model discrimination ability. Because the dataset is extremely imbalanced, PR-AUC was emphasized as the primary curve-based metric. The precision–recall curve focuses on the model’s ability to retrieve the minority fraud class and is therefore more informative for rare-event fraud detection than ROC-AUC alone. As shown in
Figure 6, GA-XGBoost achieved a PR-AUC of 0.798, improving over baseline XGBoost, which achieved a PR-AUC of 0.741. GA-RF achieved the highest PR-AUC of 0.808, indicating strong ranking ability for the fraud class. However, GA-XGBoost achieved the best overall balance in terms of MCC, fraud-class F1-score, and false-positive control.
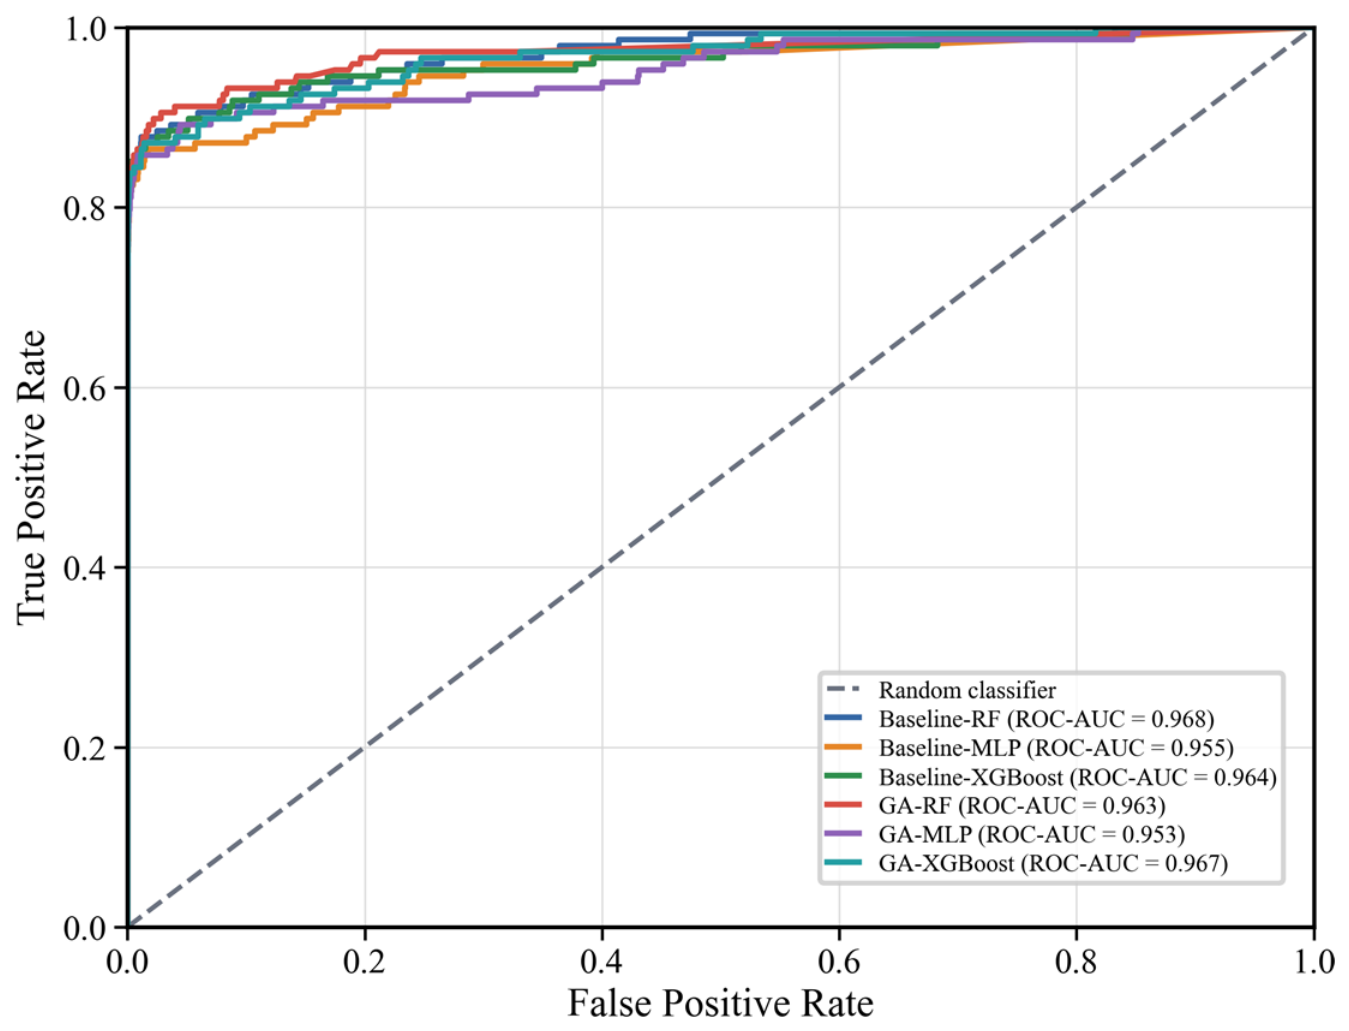
ROC curves were also retained for comparability with previous studies, as shown in
Figure 7. The ROC-AUC values of all models remained high, ranging from 0.953 to 0.968. GA-XGBoost achieved a ROC-AUC of 0.967, which was comparable to the strongest baseline ROC-AUC. However, ROC-AUC was not used as the sole criterion because it can appear overly optimistic when the negative class dominates the dataset. Therefore, final model selection emphasized PR-AUC, MCC, fraud-class F1-score, false positives, and false negatives.
Overall, the confusion matrix and curve-based results show that GA-XGBoost provided the most balanced performance among the optimized models. Although some fraudulent transactions were still missed, the model reduced false positives while improving fraud-class F1-score compared with baseline XGBoost. These results provide a conservative but more realistic assessment of credit card fraud detection performance under the original class distribution.
4.5. XGBoost-Based Ablation and Benchmark Analysis
To further evaluate the contribution of each component, an XGBoost-based ablation study was conducted on the untouched original-distribution test set. XGBoost was selected because it achieved the best overall balance among the optimized models. The ablation experiments compared all features versus the selected 15 features, different resampling strategies, GA optimization, and Random Search optimization under the same leakage-safe evaluation protocol.
As shown in
Table 6, the selected-feature XGBoost model without resampling achieved the highest overall performance, with a PR-AUC of 0.809, MCC of 0.822, and fraud-class F1-score of 0.819. This indicates that resampling was not universally beneficial for XGBoost under the original test distribution. Under the SMOTE-ENN setting, GA optimization improved PR-AUC from 0.741 to 0.798, MCC from 0.766 to 0.814, and fraud-class F1-score from 0.764 to 0.809 compared with the non-optimized model. Compared with Random Search, GA achieved slightly higher PR-AUC, MCC, recall, and F1-score, whereas Random Search produced fewer false positives. These results suggest that GA provides a competitive optimization strategy, but the effectiveness of each component depends on the interaction among feature selection, resampling, and model structure.
4.6. Discussion and Future Prospects
4.6.1. Discussion of Current Findings
This study proposes a credit card fraud detection framework that integrates RF-Gini feature selection, class-imbalance handling, and GA-based hyperparameter optimization. The framework was evaluated on the public European credit card fraud dataset, which contains 284,807 transactions and only 492 fraudulent cases. Such an extremely low fraud prevalence makes the task a typical rare-event classification problem, where overall accuracy alone cannot adequately reflect model performance. The results show that feature selection and hyperparameter optimization can improve fraud detection performance, but their effects vary across model types. Among the baseline models, RF, MLP, and XGBoost achieved comparable fraud-class F1-scores on the original-distribution test set, indicating that all three models were able to identify part of the minority fraud class, although missed fraud cases remained non-negligible.
After GA-based hyperparameter optimization, RF and XGBoost showed improved fraud detection performance, whereas MLP became more conservative. GA-MLP achieved higher fraud-class precision and fewer false positives, but this was accompanied by lower fraud recall and more missed fraudulent transactions. Among the optimized models, GA-XGBoost achieved the most balanced performance, with a PR-AUC of 0.798, ROC-AUC of 0.967, MCC of 0.814, balanced accuracy of 0.865, fraud-class precision of 0.908, fraud-class recall of 0.730, and fraud-class F1-score of 0.809. Compared with baseline XGBoost, GA-XGBoost improved PR-AUC, MCC, and fraud-class F1-score, while reducing false positives from 22 to 11 and false negatives from 43 to 40. These results indicate that GA-based hyperparameter optimization enhanced the ability of XGBoost to balance fraud detection and false-alarm control.
The confusion matrix further illustrates the practical meaning of these results. On the untouched test set, GA-XGBoost correctly detected 108 fraudulent transactions and missed 40 fraudulent transactions, while only 11 legitimate transactions were incorrectly flagged as fraud. From a financial risk-control perspective, false positives may increase manual review costs and affect user experience, whereas false negatives may lead to direct financial losses. Therefore, model selection should consider both types of errors rather than focusing only on accuracy or ROC-AUC. In addition, the ablation results suggest that resampling strategies should be evaluated empirically rather than assumed to be universally beneficial. Although SMOTE-ENN can improve minority-class representation during training, its effect depends on the model structure and evaluation setting. Overall, the proposed framework provides a practical modeling strategy for rare-event fraud detection by combining feature selection, imbalance handling, hyperparameter optimization, and fraud-class-oriented evaluation metrics.
4.6.2. Limitations and Future Prospects
Despite the effectiveness of the proposed framework, several limitations remain. First, the dataset used in this study is a public benchmark dataset with anonymized PCA-transformed variables. Although this design protects cardholder privacy, it also limits the business interpretation of individual features. As a result, the selected variables can only be explained in terms of their statistical contribution to classification, rather than their direct financial or behavioral meanings. Second, the current study is based on a static dataset, while fraud patterns in real financial scenarios may evolve over time because of changes in user behavior, transaction channels, and fraud strategies. Therefore, future research should consider temporal validation, concept-drift detection, and periodic model updating to improve the adaptability of fraud detection models in dynamic environments.
In addition, GA-based hyperparameter optimization requires repeated model training and cross-validation, which increases computational cost. Future studies can compare GA with Bayesian optimization, random search, and other optimization methods under the same evaluation setting, or explore hybrid optimization strategies to improve search efficiency. Model interpretability should also be strengthened by introducing local explanation methods such as SHAP or LIME, although explanations based on anonymized PCA features should be interpreted cautiously. Finally, future work can extend the proposed framework to broader payment scenarios, such as mobile payments, cross-border transactions, and merchant-level risk monitoring. Graph-based learning methods may also be explored to capture relational fraud patterns, such as coordinated fraud groups or abnormal transaction networks. In practical deployment, combining machine learning models with rule-based risk-control systems may help balance detection accuracy, interpretability, and response efficiency.
5. Conclusions
This study proposed a leakage-safe credit card fraud detection framework combining RF-Gini feature selection, resampling strategy evaluation, and GA-based hyperparameter optimization. All preprocessing, resampling, optimization, and threshold tuning were restricted to the training data or training folds, while the final test set preserved the original class distribution.
Among the optimized models, GA-XGBoost achieved the best overall balance. On the untouched test set, it obtained a PR-AUC of 0.798, ROC-AUC of 0.967, MCC of 0.814, and fraud-class F1-score of 0.809. It correctly detected 108 fraudulent transactions, missed 40 fraudulent transactions, and produced only 11 false positives.
These results indicate that rare-event fraud detection should be evaluated using PR-AUC, MCC, fraud-class F1-score, FP, and FN rather than relying mainly on accuracy. Future work will focus on improving interpretability, reducing optimization cost, and extending the framework to dynamic and multi-scenario payment data.