1. Introduction
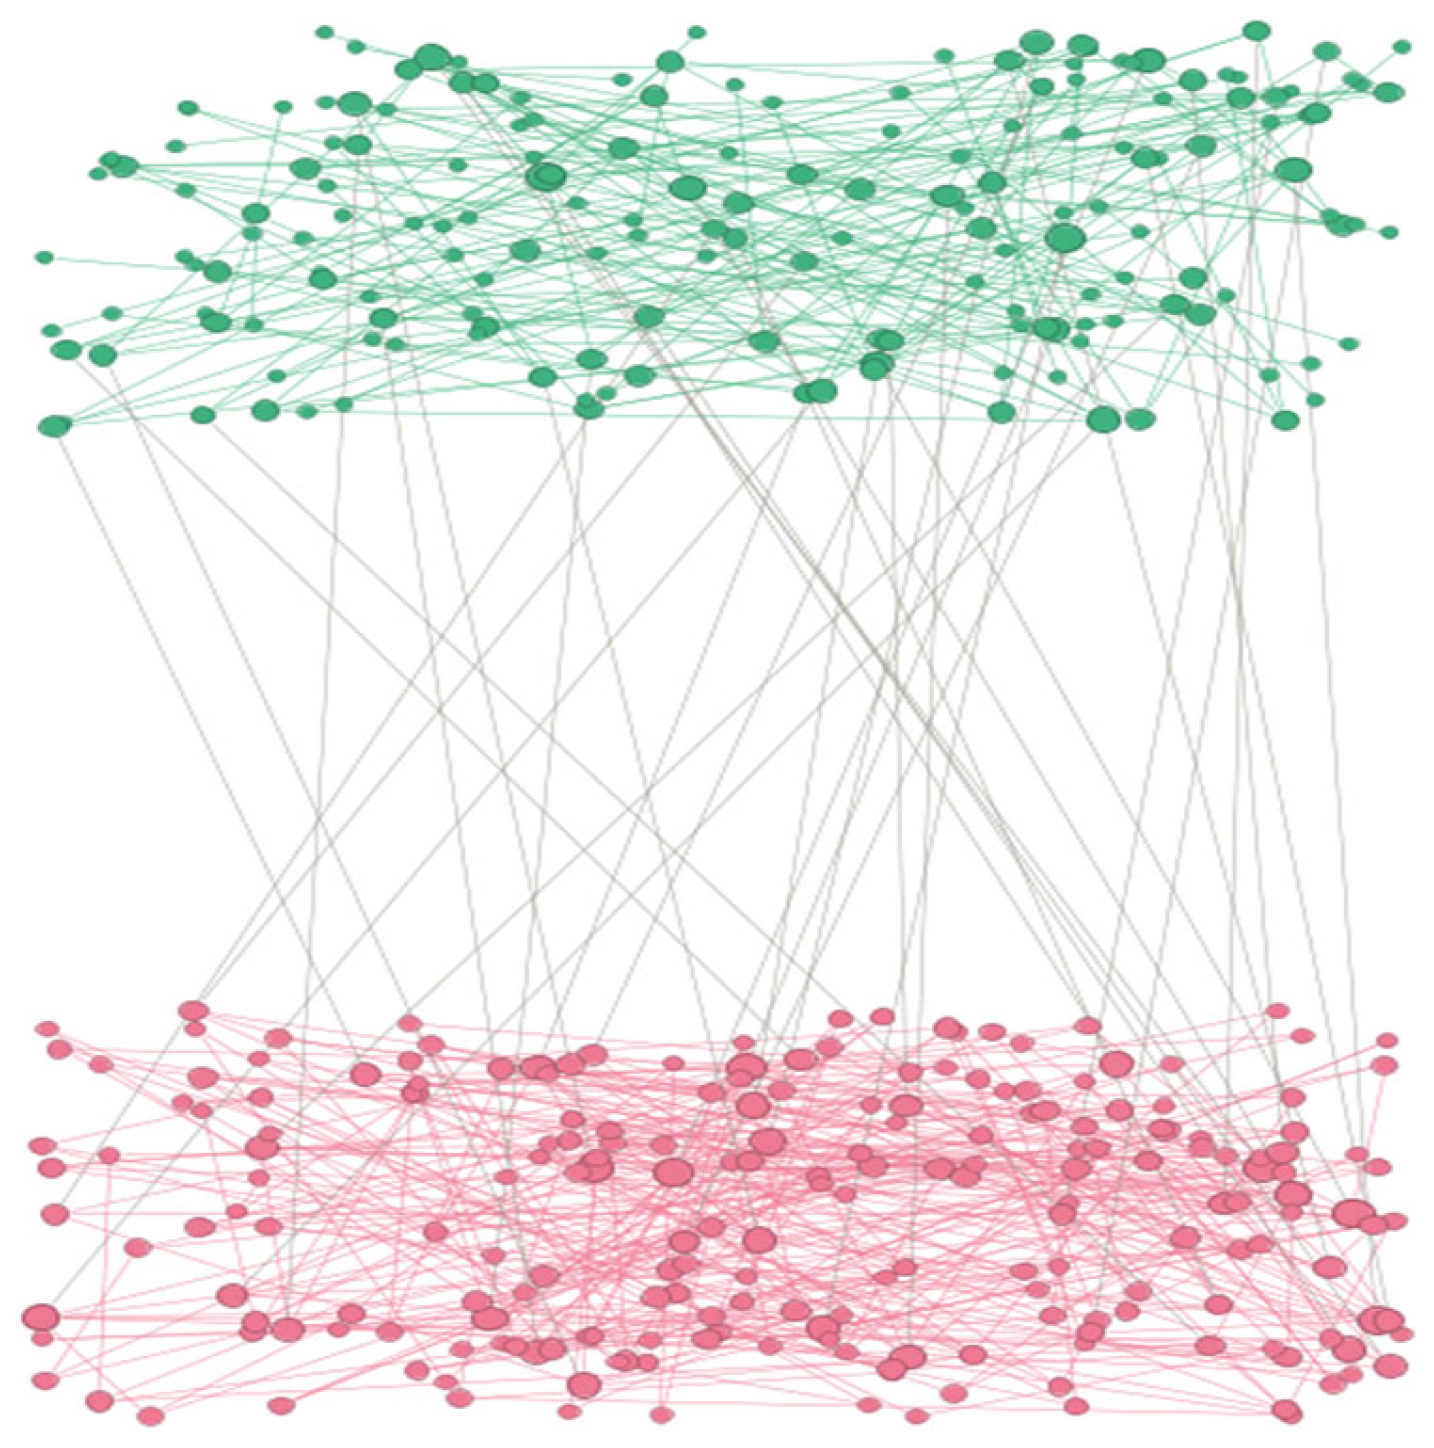
As archetypal large-scale critical infrastructure, metro systems are paramount for ensuring urban public safety and enhancing the quality of life for residents. Their reliable and secure operation is therefore of utmost importance. In recent years, these networks have been increasingly beleaguered by a spectrum of safety incidents, including equipment malfunctions, flooding, and surges in passenger flow. Compounding these challenges are the rapid expansion of network scale, increasing topological complexity, and the inherently challenging operational environment characterized by confined spaces, high population densities, and difficult emergency evacuation. Consequently, metro networks exhibit the characteristics of multi-layer coupling [
1] and mutual interdependence [
2]. The core of urban metro network vulnerability analysis resides in two principal dimensions: first, node importance evaluation, which aims to precisely identify the critical nodes underpinning network functionality; and second, cascading failure analysis, which seeks to elucidate the dynamic process by which local disruptions propagate through network couplings, potentially culminating in system-wide collapse. Thus, a deep investigation into the structural properties of urban metro networks is imperative. This entails developing methods for quantifying node importance in multi-layer networks, simulating the evolutionary dynamics of cascading failures, and analyzing the key factors influencing the dynamic shifts in vulnerability. Such endeavors provide an indispensable foundation for safeguarding the normal operation of metro networks.
Current research on node importance evaluation, a cornerstone of vulnerability analysis, exhibits two predominant methodological trends. The first trend focuses on network topology. Early studies primarily concentrated on the direct connection characteristics of nodes, but the field has since evolved towards hierarchical decomposition and global structural analysis. Opsahl et al. [
3] integrated edge weights into degree centrality, introducing the concept of node strength and laying the groundwork for analyzing directed, weighted networks. Yang et al. [
4] proposed an improved gravity centrality method based on the k-shell algorithm, designated KSGC, for identifying influential nodes in complex networks. This method incorporates node position information, rendering it more reasonable compared to the original gravity centrality approach. Zhao et al. [
5] developed a centrality measure that simultaneously considers node degree and local clustering coefficients, thereby enabling a more comprehensive assessment of local node centrality. Kai et al. [
6] proposed the MKS algorithm, which integrates node self-characteristics, positional features, and local attributes, effectively addressing the coarse granularity issue inherent in the k-shell algorithm. Zhu et al. [
7] incorporated topological information and node typology into an improved PageRank algorithm, fully accounting for the distinctions among generators, loads, and tie nodes, thereby substantially enhancing critical node identification accuracy in power grids. Liu et al. [
8] employed the k-shell decomposition method to stratify the network into a hierarchical structure ranging from core to periphery, subsequently applying the H-index to screen nodes within each hierarchical layer. Curado et al. [
9] proposed the C-RRWG method, which simultaneously integrates local, global, and dynamic node interaction information, effectively balancing intra-community importance with global network connectivity, thereby providing a more comprehensive measurement paradigm for influential node detection in complex networks. Yang et al. [
10] proposed a novel node ranking method based on neighbor lines and local network structure, simultaneously considering both attribute information of neighbor lines and local structural information. Zhao et al. [
11] developed the Multi-attribute CRITIC-TOPSIS Network Decision Index, MCTNDI, which integrates multiple centrality indicators and synthesizes local neighborhood importance with network topological position, thereby addressing the perspective bias inherent in single-indicator approaches. Hu et al. [
12] proposed a node importance identification algorithm based on multi-order and multi-attributes of neighborhoods in complex networks, utilizing spatial position attributes and special topological structure attributes to comprehensively analyze node importance through integrated consideration of direct and indirect influences.
The second trend encompasses research conducted from the dimension of node attribute characteristics, with such studies integrating topological position and intrinsic node attributes. Liu et al. [
13] combined traffic flow characteristics to propose a weighted betweenness centrality algorithm, constructing a weighted traffic network in L-space while reducing computational complexity. Lilin et al. [
14] proposed a multi-attribute weighted fusion algorithm that assigns indicator weights using both the entropy weight method and analytic hierarchy process. Hajarathaiah et al. [
15] introduced an innovative framework incorporating multiple node attribute characteristics, including degree and clustering coefficient, to create feature vectors for each node. Yang et al. [
16] proposed a multi-attribute node importance ranking algorithm based on entropy weight method and analytic hierarchy process, integrating degree centrality, position-based k-shell values, and PageRank values from random walks, effectively addressing the overlap problem. Li et al. [
17] introduced an advanced centrality model, DKBC, based on gravitational principles. The DKBC model integrates centrality attributes including node degree, spatial positioning, and betweenness centrality, thereby enhancing the accuracy of critical node identification in complex networks. Morejon et al. [
18] proposed the semi-local centrality with weighted lexicographic extension of neighborhoods (SL-WLEN), a novel centrality metric designed to overcome existing limitations by incorporating topological structure and node attributes through local components.
Cascading failure research, as the core of vulnerability analysis, is essential for elucidating the failure propagation mechanisms within metro networks. In the domain of urban metro complex networks, scholars have conducted multi-dimensional explorations. Zhang et al. [
19] developed a unified framework for quantitatively assessing metro network resilience, originating from the perspective of network efficiency and performance loss triangles. Using the Shanghai metro as a case study, they revealed its robustness to random failures yet vulnerability to deliberate attacks, and proposed optimal recovery strategies. Xu et al. [
20] constructed a multi-stage resilience framework integrated with passenger flow data, conducting a comparative analysis of five major global metro networks. This work elucidated the critical influences of topological structure, passenger flow distribution, and passenger behavior on system resilience. Yang et al. [
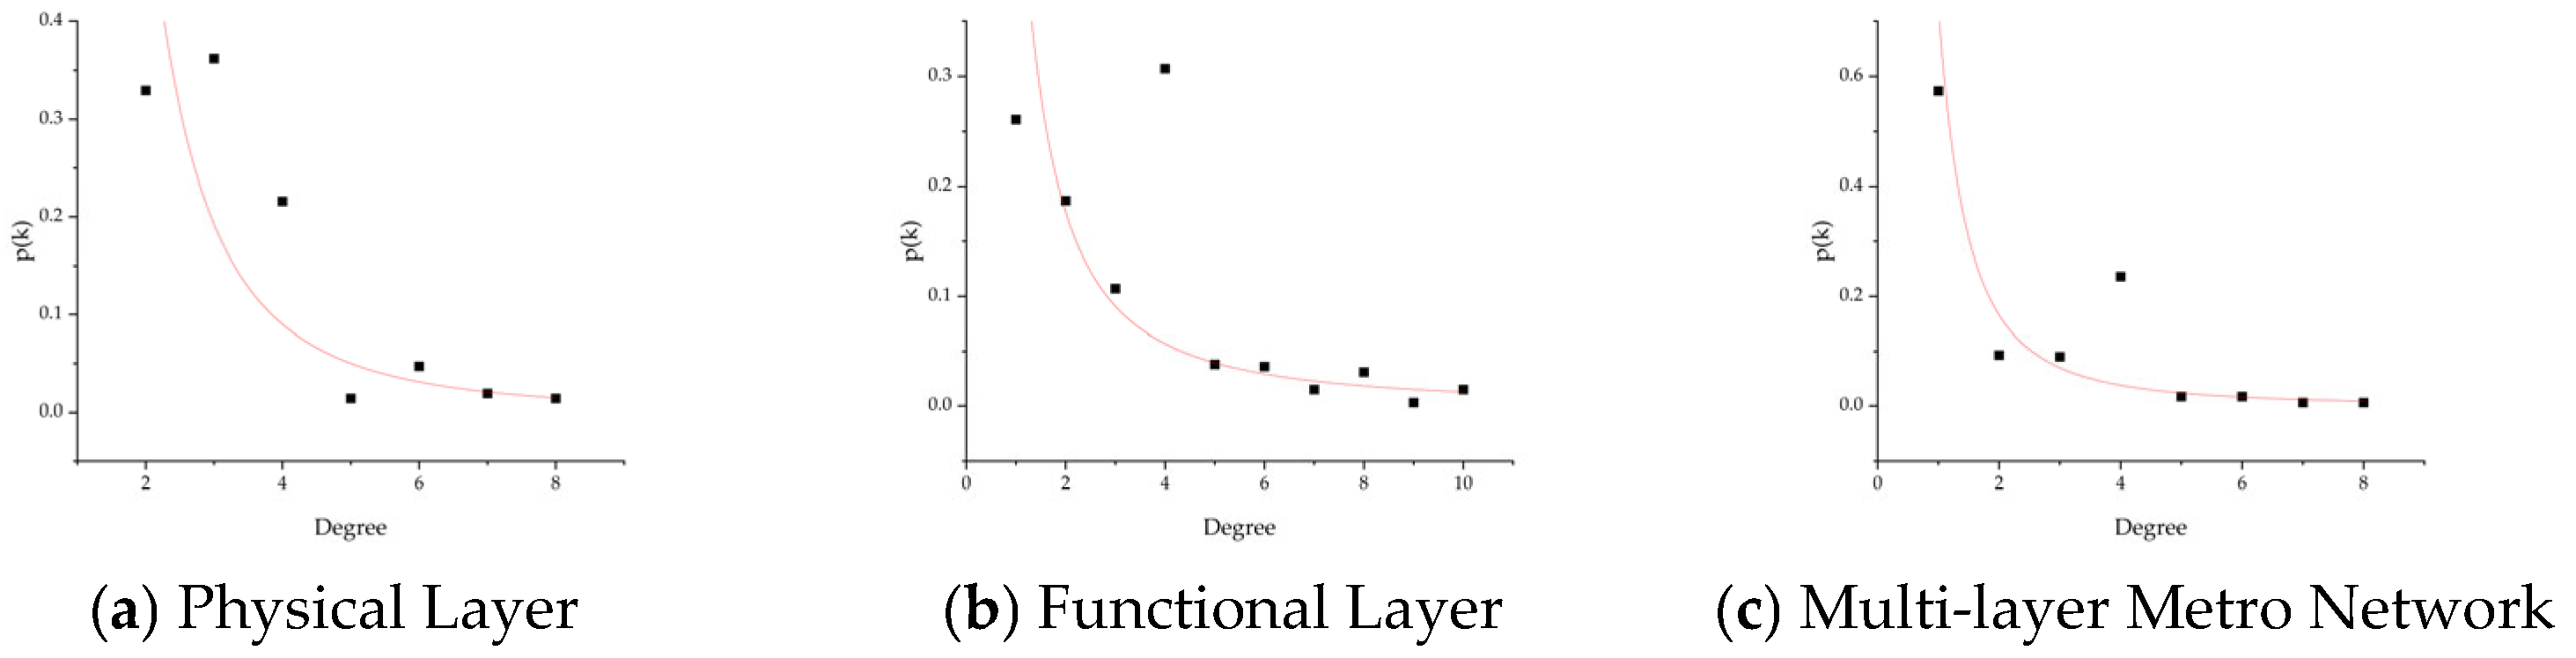
21] analyzed metro network topological characteristics based on complex network theory and proposed a weighted composite indicator, revealing scale-free features characterized by robustness to random failures and vulnerability to hub-directed attacks. Zhang et al. [
22] investigated cascading failure patterns in the Nanjing metro under deliberate attacks by integrating coupled map lattice models with passenger load redistribution mechanisms, identifying critical attack modes and corresponding vulnerability thresholds. Furthermore, advancements in cascading failure models, such as the sandpile model and percolation theory, have provided robust support for metro vulnerability research through their application in simulating failure propagation. However, cascading failure models that specifically target the unique physical–functional bilayer coupling characteristics of metro systems still require significant development.
However, a critical examination of the above research progress reveals three interrelated and progressively deepening bottlenecks that together constitute a theoretical gap constraining the understanding of metro system vulnerability.
First, at the level of network modeling, existing models exhibit fundamental simplifications in characterizing the internal coupling mechanisms of the system. The vast majority of studies abstract metro networks as single-layer topologies; even those that incorporate multilayer modeling confine their analytical granularity to the macroscopic connectivity of lines and stations. Although pioneering work by Shen et al. has extended the modeling perspective to in-station facility networks, their framework remains essentially a single-layer description of the relationship between physical facilities and passenger flow, with the cross-layer coupling logic between physical entities and functional systems entirely set aside. This omission is not a mere lack of detail; rather, it deprives the model of the capacity to capture the cross-layer causal chain of facility damage leading to functional interruption and ultimately service loss, thereby detaching the physical foundation of vulnerability assessment from engineering reality.
Second, at the level of critical node identification, existing methods suffer from dual limitations in applicability and global scope when applied to bilayer coupled networks, limitations that are directly rooted in the aforementioned modeling simplifications. On the one hand, mainstream algorithms rely heavily on local neighborhood attributes or static global metrics and lack the capacity to deeply mine the sequential decision value of nodes under dynamic topological evolution. This leads to the systematic omission of bridge-type critical nodes—nodes that are structurally important yet do not stand out in terms of degree. On the other hand, and more fundamentally, these algorithms are almost exclusively grounded in the theoretical framework of single-layer networks. When confronted with asymmetric coupling edges and heterogeneous failure propagation paths between the physical and functional layers, traditional metrics become largely ineffective in measuring cross-layer influence. A node with an unremarkable degree in the physical layer may exert decisive influence over the entire network by virtue of the core functional system it supports, yet this information remains entirely invisible under a single-layer evaluation paradigm.
Third, at the level of cascading failure simulation, a significant mismatch exists between classical failure propagation rules and the core structural characteristics of the metro bilayer network revealed in this study. We find that the actual physical–functional bilayer metro network exhibits a pronounced clustered structure, wherein nodes aggregate into functional groups characterized by high internal cohesion and low external coupling. In contrast, the failure diffusion logic of conventional sandpile models and load–capacity models rests on the implicit assumption of homogeneous mixing among nodes and cannot capture the differential dynamics of failure saturation within clusters and selective propagation across clusters. This rule-level deficiency leads to qualitative discrepancies in the phase-transition patterns produced by simulations compared with real-world observations, thereby weakening the model’s capacity to explain the evolution of system robustness.
In light of the above, this study constructs and validates a systematically integrated analytical framework. First, deep reinforcement learning algorithms are introduced to leverage their sequential decision-making capability on dynamic topologies for identifying critical nodes in bilayer coupled networks, thereby overcoming the inherent insensitivity of traditional methods to cross-layer influence. Second, an improved sandpile model incorporating cluster characteristics is employed to simulate the selective cross-layer propagation of cascading failures, compensating for the inadequacy of classical rules in capturing clustered structures. The core contribution of this work lies not in proposing isolated novel algorithms, but in the first systematic and organic integration of bilayer coupled network modeling, deep reinforcement learning, and cluster-augmented sandpile dynamics into a complete methodological chain for assessing physical–functional cross-layer coupling failures in metro systems. Empirical analysis of the Zhengzhou Metro network validates the effectiveness and applicability of this integrated framework in vulnerability assessment, thereby providing a solid theoretical foundation and actionable practical reference for analyzing the structural properties of multilayer coupled networks and enhancing the resilience of urban metro systems.
3. Identification of Critical Nodes in Urban Multi-Layer Metro Networks Using an Improved DQN Algorithm
The validity of node importance ranking directly determines the quality of vulnerability analysis. Existing methods fall into two categories: classical centrality metrics and heuristic search strategies. Both, however, suffer from fundamental limitations when applied to critical node identification in bilayer coupled networks.
Classical centrality metrics are typically computed once on a given static topology and used for node ranking under the implicit assumption that the ranking remains valid throughout the analysis. Under sequential node removal, however, the network topology evolves continuously, and critical paths along with connectivity structures are progressively reshaped, causing nonlinear reordering of node importance in response to prior removals. This dynamic dependence on perturbation history cannot be adequately captured by a static initial centrality ranking alone. Heuristic methods that recalculate centrality after each removal partially mitigate this issue but face two critical bottlenecks: first, the computational cost of recomputing global metrics grows prohibitively with network size, particularly in bilayer networks; second, greedy optimization of one-step rewards lacks foresight regarding cumulative disruption effects and is prone to local optima.
Deep reinforcement learning overcomes these limitations at a fundamental level. First, DQN aims to maximize long-term cumulative reward, directly learning a mapping from network states to removal actions—an approach inherently suited to the combinatorial optimization nature of sequential dismantling. Second, deep networks can implicitly encode topological evolution, obviating the need for explicit recomputation of global metrics and thereby balancing computational efficiency with decision optimality. Third, in bilayer coupled networks where cross-layer dependencies cause dynamic shifts in node value as failures propagate, the interactive learning mechanism of DQN is uniquely capable of adaptively capturing this reassessment process.
Given these advantages, this study introduces the DQN algorithm with multidimensional improvements to systematically evaluate its effectiveness in identifying critical nodes within bilayer coupled networks.
3.1. The Deep Q-Network (DQN) Algorithm
The Deep Q-Network algorithm represents a significant breakthrough in the field of deep reinforcement learning. By integrating deep learning with traditional reinforcement learning, DQN effectively overcomes the challenges associated with the curse of dimensionality that arises when Q-learning is applied to high-dimensional state spaces. The core innovation of this method lies in its use of deep neural networks to approximate the optimal action-value function, thereby enabling an agent to select actions through strategic interaction with the environment, with the goal of maximizing cumulative long-term rewards. The DQN network architecture comprises five fundamental components: the environment, the agent, states, actions, and rewards.
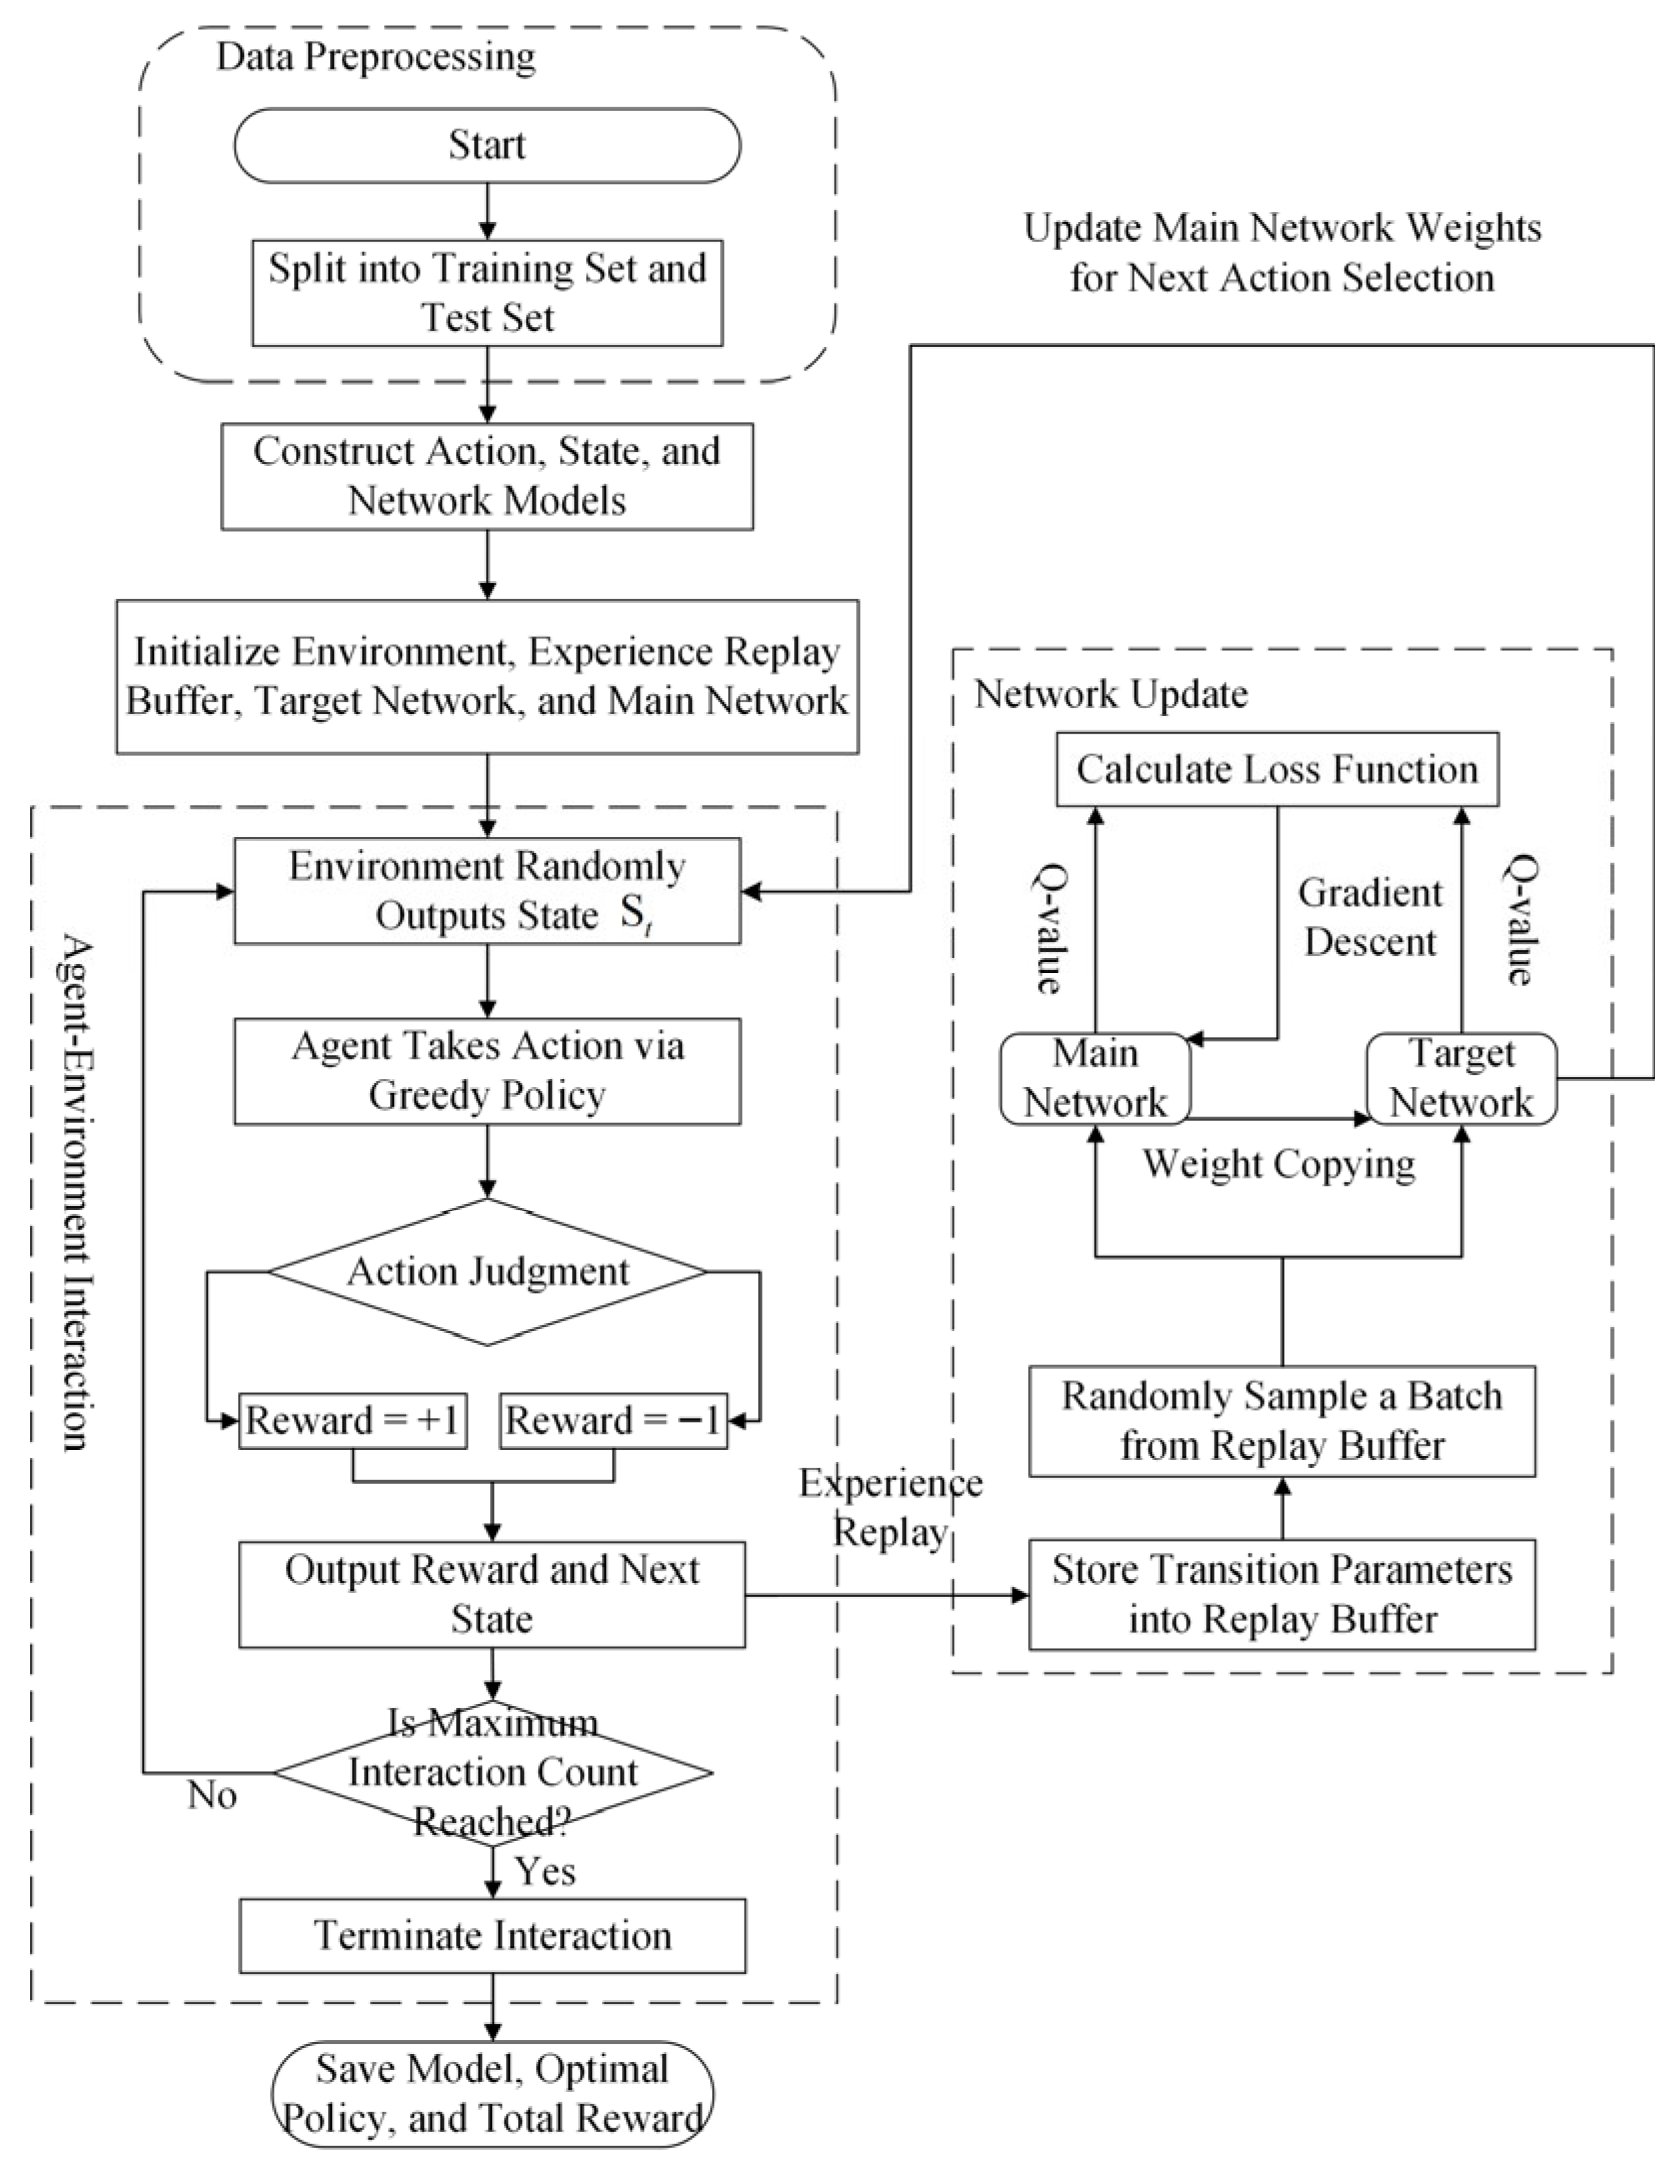
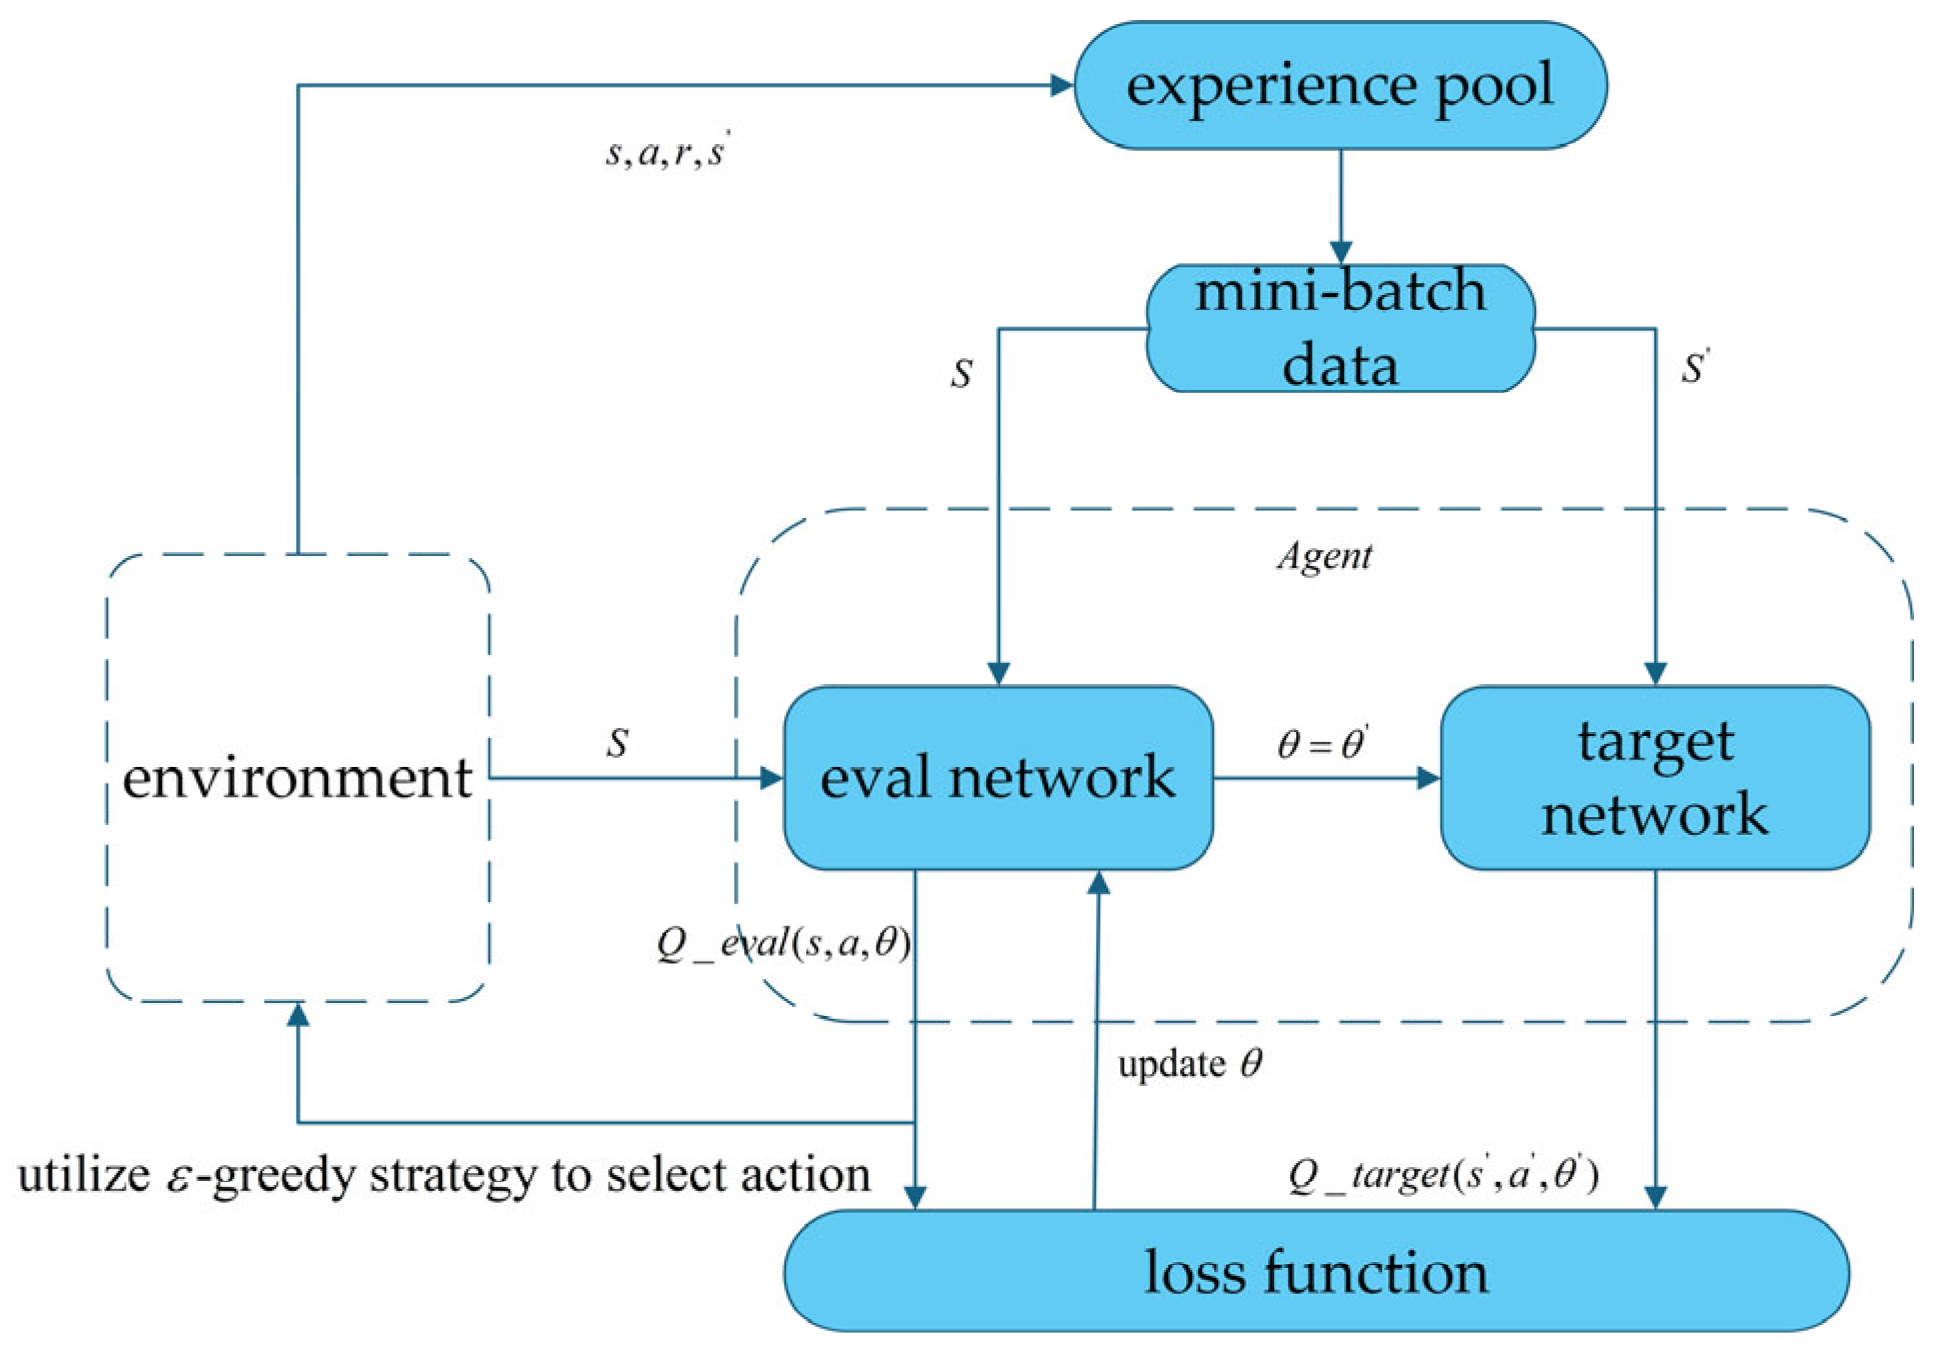
The agent learns to select optimal actions through interaction with the environment, aiming to maximize cumulative long-term rewards. Through continuous trial-and-error and feedback mechanisms within the environment, the agent learns and optimizes its policy, enabling autonomous adaptation and optimal decision-making in complex and dynamic settings. The core technologies underlying the DQN architecture are illustrated in
Figure 4 and described as follows:
The loss function in DQN is designed based on the Q-value update mechanism inherent to Q-learning algorithms. It is defined by calculating the mean squared error between the current estimated Q-value and the target Q-value. The specific mathematical expression is provided in Equation (1):
where
represents the parameters of the main network,
represents the parameters of the target network,
is the immediate reward received after taking action a in state
,
is the discount factor, and
is the subsequent state.
- (2)
Experience Replay
Prior to the introduction of Experience Replay (ER), training data typically exhibited strong temporal correlations. These correlations predisposed models to overfitting during training and exacerbated the non-stationarity of the data distribution. To mitigate these issues, the ER mechanism was proposed to break the temporal dependencies between samples and improve data utilization efficiency. Specifically, each interaction experience is stored in a replay buffer as a tuple , representing the current state, action taken, reward received, and subsequent state. These tuples are not independent of one another. If samples were drawn sequentially for batch learning during training according to their temporal order, the model would be prone to converging to local optima. Therefore, historical data are randomly sampled from the replay buffer for parameter updates, thereby enhancing training stability and accelerating convergence.
- (3)
Target Network
The Deep Q-Network guides the agent’s decision-making process by estimating the state-action value function. However, in environments with high-dimensional state and action spaces, estimated Q-values are susceptible to substantial fluctuations caused by environmental dynamics or policy changes, leading to training instability. To address this challenge, DQN introduces a target network architecture. As indicated in Equation (2), the target network computes the target Q-value using a delayed update mechanism. This network operates independently from the main network, with its parameters periodically copied from the main network. This design effectively smoothes the training targets, reduces the optimization difficulty of the regression task, and consequently enhances the stability of the learning process.
3.2. Improved DQN Algorithm Workflow
Building upon the findings reported in [
24], the DQN algorithm has demonstrated superior performance in identifying critical nodes in complex networks compared to other baseline methods. However, the conventional approach exhibits limitations in feature extraction for large-scale complex networks. To address this shortcoming, we implemented multi-dimensional improvements to the algorithm. The training workflow of the improved DQN network is illustrated in
Figure 5, with the fundamental process comprising the following six steps:
Step 1: Data Preprocessing and Environment Initialization. The Zhengzhou metro network data were first preprocessed by reading edge lists and constructing the bilayer complex network graph structure. Each node was assigned a layer-type identifier. During environment initialization, a multi-dimensional feature vector was constructed as the state representation for each node, incorporating degree centrality, layer-type information encoded using one-hot encoding, and a status flag indicating whether the node had been removed. The action space for the agent was defined as the sequential selection of nodes for removal. The reward function was designed based on the ratio of the size of the largest connected component to the number of remaining nodes following node removal. A smaller ratio indicated a greater degree of network disruption, corresponding to higher criticality of the removed node.
The choice of the largest connected component ratio as the reward function is grounded in standard practice within complex network vulnerability research. The size of the largest connected component serves as a fundamental indicator of structural integrity, directly reflecting a network’s capacity to maintain basic connectivity under attack. For metro systems, connectivity is a prerequisite for passenger transport—loss of the largest component implies widespread service disruption. Guiding the DQN agent with this metric therefore enables effective identification of nodes whose removal maximally compromises global connectivity. It should be acknowledged that this metric emphasizes topological connectivity and does not directly capture finer-grained operational consequences such as passenger delays or safety impacts. Incorporating multi-dimensional performance indicators into a composite reward function represents a promising direction for future work.
Step 2: Neural Network Architecture and Hyperparameter Configuration. A deep Q-network model was constructed comprising two fully connected hidden layers, each containing 128 neurons. The output layer dimension matched the total number of network nodes, ensuring that each node corresponded to a distinct actionable choice. An experience replay buffer was initialized with a capacity of 2000. Key reinforcement learning hyperparameters were configured as follows: discount factor (γ) of 0.95, initial exploration rate (ε) of 1.0, exploration decay rate of 0.995, minimum exploration rate of 0.01, and learning rate of 0.001. The model employed mean squared error as the loss function and utilized the Adam optimizer for parameter updates.
The hyperparameter values follow standard practices in deep reinforcement learning for combinatorial optimization [
25,
26] and were fine-tuned via preliminary grid search on a validation set. A discount factor of
balances immediate and long-term rewards; a learning rate of 0.001 with the Adam optimizer ensures stable convergence; the exploration rate decay schedule facilitates sufficient exploration in early training and progressive exploitation thereafter. The key findings—namely, the relative effectiveness of node ranking—remain robust across reasonable hyperparameter ranges (
, learning rate
).
Step 3: Training Episode Execution. At the beginning of each training episode, the environment was reset to its original network state. The agent selected nodes for removal based on the current feature vector states of all nodes, employing an ε-greedy policy for action selection. Upon execution of an action, the environment returned a new state vector, an immediate reward, and a termination flag. The termination condition was satisfied when all nodes had been removed. The reward was defined as the negative value of the ratio of the largest connected component size to the number of remaining nodes following node removal. The reward was consistently negative; a higher reward value indicated a greater degree of network disruption, signifying that the removed node was more critical. Experience tuples generated at each interaction step—comprising state, action, reward, next state, and termination flag—were stored in the experience replay buffer.
Step 4: Experience Sampling and Network Update. Once the number of samples stored in the experience replay buffer exceeded the predefined batch size of 32, a mini-batch of experiences was randomly sampled for training. For each sampled experience, the target Q-value was computed as follows: if the experience corresponded to a terminal state, the target Q-value was set equal to the immediate reward; otherwise, the target Q-value was calculated as the immediate reward plus the product of the discount factor and the maximum Q-value for the subsequent state. This target value was subsequently used to update the Q-value estimate for the corresponding action within the main network, with network parameters optimized via gradient descent. Concurrently, the exploration rate was decayed after each training step according to the predefined decay rate, thereby facilitating a gradual transition from exploration to exploitation.
Step 5: Model Persistence and Performance Monitoring. A comprehensive model persistence mechanism was implemented, enabling the direct saving of model parameters and training states through the agent object upon completion of training. Throughout the training process, the system automatically recorded multiple key performance indicators, including cumulative rewards, exploration rate dynamics, Q-value convergence behavior, and loss function evolution. Comprehensive visualization of training curves was generated, providing a systematic basis for model evaluation and hyperparameter optimization.
Step 6: Critical Node Identification and Output. Based on the fully trained DQN model, forward propagation was performed to compute the Q-values for each node under different states, which served as the criterion for node importance assessment. Nodes were ranked according to their Q-values in descending order, yielding the critical node identification results. Node importance distribution charts were subsequently generated to visually represent the differential criticality of nodes within the network, thereby providing theoretical support for subsequent network analysis and strategic decision-making.
Through this improved DQN-based critical node identification algorithm for complex networks, a ranking of critical nodes was obtained. This ranking laid the foundation for the subsequent intentional attack simulations based on node importance. The complete pseudocode of the three algorithms is provided in
Appendix A.
4. Cascading Failure Mechanism Based on a Sandpile Model Incorporating Cluster Characteristics
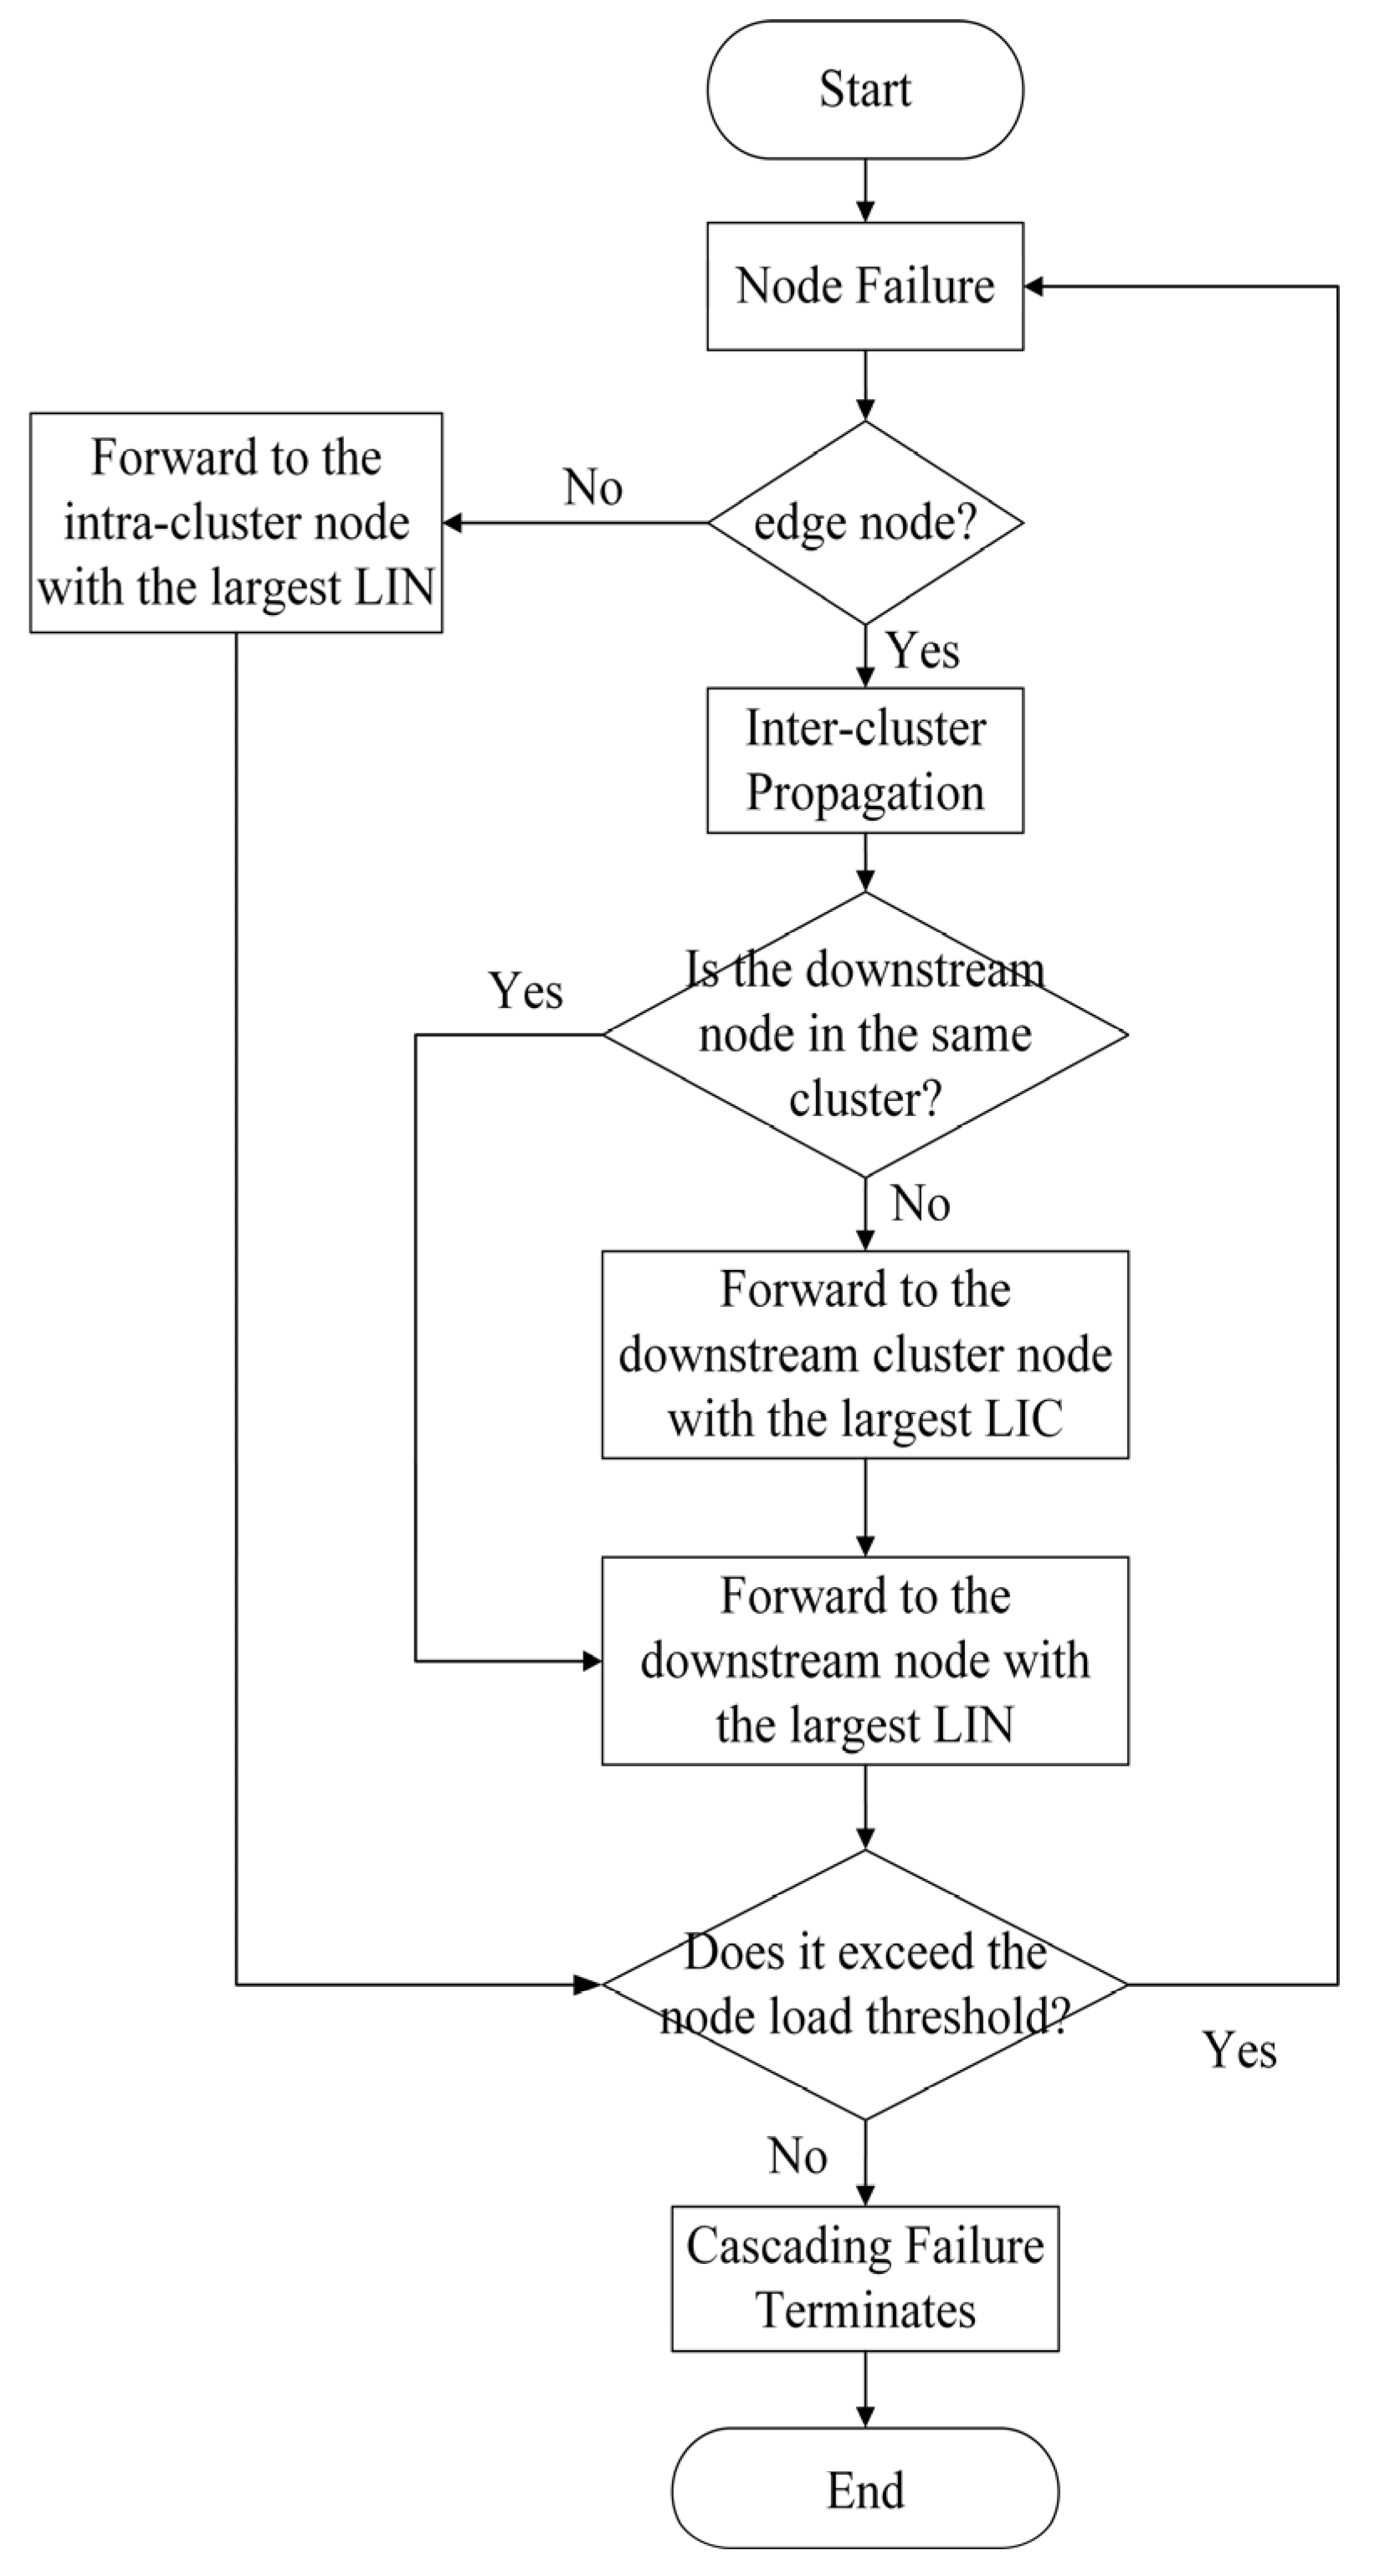
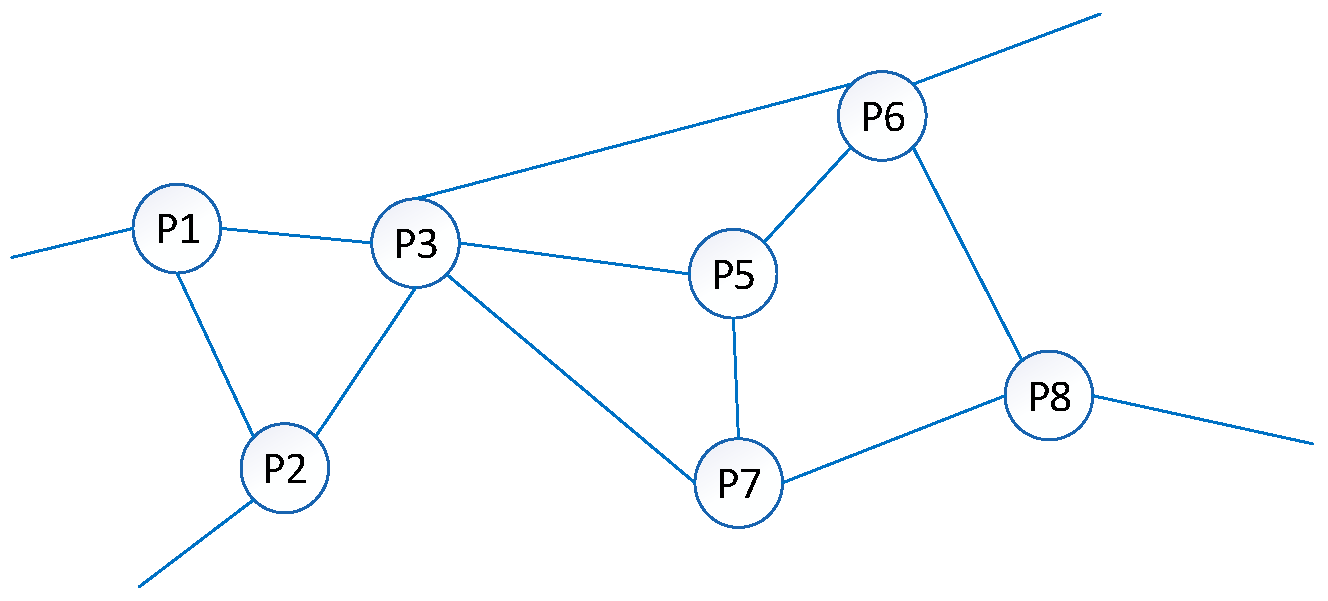
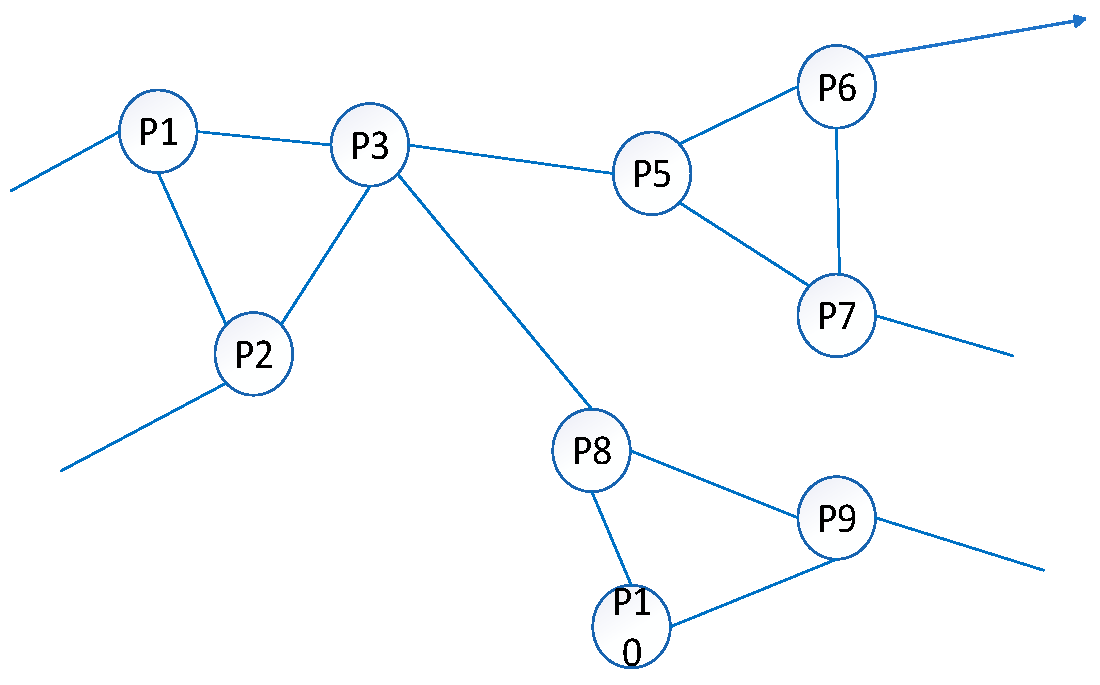
In complex networks, a cluster refers to a densely connected subgroup or community of nodes within the network. The constructed urban bilayer metro complex network exhibits pronounced cluster characteristics. To account for this property, a sandpile model incorporating cluster characteristics was developed to simulate the failure propagation process in complex networks, as illustrated in
Figure 6.
The sandpile model falls within the domain of self-organized criticality theory, and its evolutionary process can be delineated into three primary stages. The first stage is the accumulation phase, during which sand grains continuously fall onto a flat surface, gradually accumulating to form a conical pile. The second stage is the critical state formation phase. As the slope of the pile increases to a specific threshold, the system begins to exhibit local collapses of varying scales. At this juncture, a dynamic equilibrium is established between newly added and sliding sand grains. The final stage is the global instability phase, which occurs when the input of sand grains exceeds the system’s carrying capacity, triggering a global collapse of the entire sandpile.
Based on the literature [
27], transportation networks exhibit enhanced stability and improved flow efficiency following aggregation transformations, thereby validating the effectiveness of cascading failure propagation rules based on the sandpile model for transportation networks. Building upon this foundation and accounting for the pronounced clustering characteristics of the constructed Zhengzhou metro network, we introduced an improved sandpile model incorporating cluster characteristics to govern cascading failure propagation. In this improved sandpile model, two metrics are employed to characterize the state of a given physical node: the load and the threshold. The load represents the real-time “height” of physical node, corresponding to the magnitude of the load it currently bears. The threshold denotes the critical load at which node failure occurs, representing the maximum load that node can withstand. Initially, the load of each physical node was set to 0, indicating that the physical infrastructure has not been subjected to attack and is operating under normal conditions. The failure propagation process of the sandpile model is illustrated schematically in
Figure 6 and can be delineated into the following six stages.
Stage 1: Node is subjected to an attack. When , node continues to operate normally. When , node fails and releases load to its neighboring nodes, at which point the process proceeds to Stage 2.
Stage 2: An evaluation is performed to determine whether the failed node
is an edge node. If so, the process proceeds to Stage 3; otherwise, it proceeds to Stage 6. The distribution of edge nodes within clusters is illustrated in
Figure 7, where nodes connecting two clusters are identified as edge nodes.
Stage 3: Nodes that fail at this stage are exclusively edge nodes. A failed edge node must release load to its downstream neighboring nodes. The magnitude of load released from edge node to its downstream nodes depends on the type classification of these downstream neighboring nodes. Consequently, a further subdivision of edge node categories is required at this juncture. When edge node fails, if all downstream nodes connected to it belong to the same cluster, the process proceeds to Stage 4; otherwise, it proceeds to Stage 5.
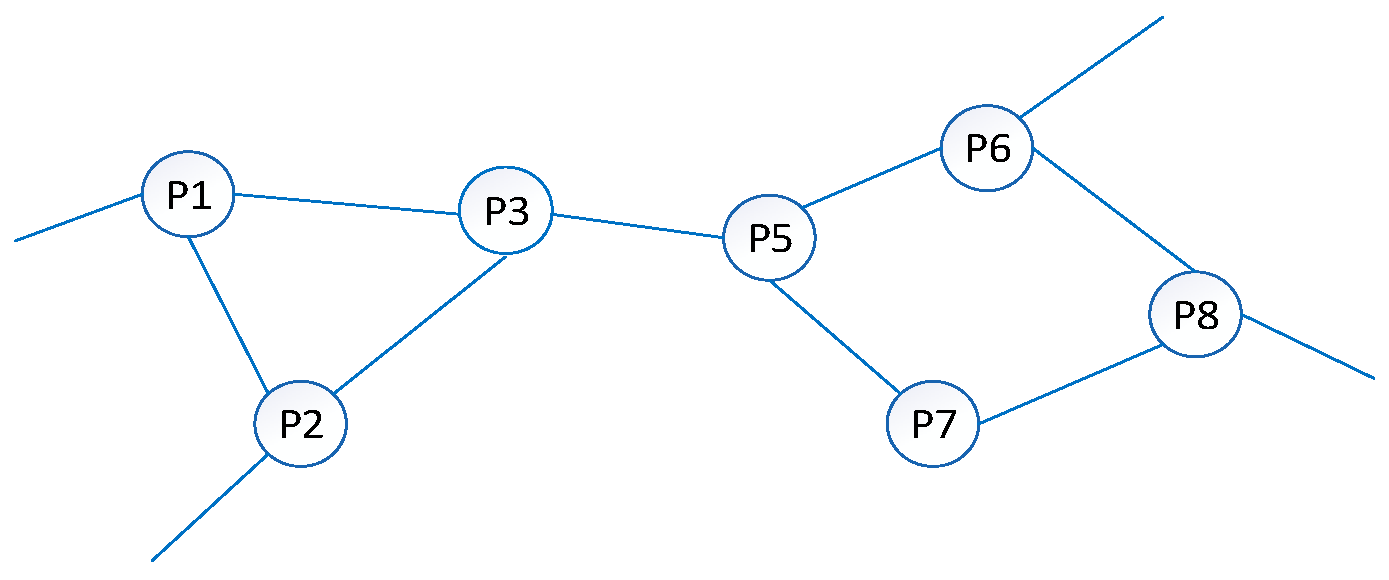
Stage 4: In this stage, all downstream nodes connected to the failed edge node belong to the same cluster, as illustrated in
Figure 8. The upstream edge node transfers its entire load
to the downstream node
, i.e.,
. When all downstream nodes connected to the upstream edge node belong to the same cluster, load distribution within the cluster is determined based on node load capacity. The calculation formulas for node load capacity
, relative link circulation
, and cluster load capacity
are introduced below [
27,
28,
29]:
where
represents the tolerance coefficient, reflecting the network’s redundant design capacity for overload conditions;
denotes the initial load of node
and
represents the state value of node
, indicating its current remaining load capacity.
denotes the set of neighboring nodes of node
, and
represents the residual load capacity of node
. The parameter
serves as a tuning parameter that controls the degree of nonlinearity in the redistribution process.
represents the real-time load of node
. Node capacity (LIN) measures the ability of a node to accommodate external unstable load while maintaining its own functionality without failure. Relative link circulation (RLC) essentially reflects the capacity of an edge, which can be understood as the maximum load allowed to pass through the corresponding node per unit time. Cluster capacity (LIC) characterizes the ability of a group of nodes, considered as a whole, to withstand external unstable load. The load distribution scheme is presented as follows:
Here, represents the load distribution strategy, denotes the node load capacity, and indicates the relative link circulation of the edge connecting nodes. The term signifies that when the node load capacities of all downstream nodes are equal, the relative link circulation of the edges between the edge node and each downstream node are sorted in descending order, and load is allocated sequentially according to this ranking. The term signifies that when disparities exist among the node load capacities of downstream nodes, the downstream nodes are first sorted in descending order of their node load capacities, followed by sorting the relative link circulation of the edges between the edge node and each downstream node in descending order. The load distribution strategy is then determined by integrating these two rankings.
Stage 5: In this stage, the downstream nodes belong to different clusters, as illustrated in
Figure 9. The load distribution scheme is governed by Equation (9), where
denotes the load distribution strategy,
represents the cluster load capacity.
Since the downstream nodes connected to the failed edge node belong to different clusters, the load distribution process at this stage follows a two-step approach: first, determining the priority order among the downstream clusters, and second, establishing the priority order among nodes within each selected cluster.
The term signifies that when the cluster load capacities of all downstream cluster sets are equal, the priority order for load distribution is determined by sorting all connecting edges in descending order of their relative link circulation. The term signifies that when disparities exist among the cluster load capacities of the downstream cluster sets, the clusters are first sorted in descending order of their cluster load capacities, thereby establishing the order in which load is transmitted to downstream clusters. Subsequently, the edges connecting nodes to adjacent clusters are sorted in descending order of their relative link circulation, and load is allocated according to this sequence. The edge node preferentially transfers its load to the cluster with the highest cluster load capacity; load is not transmitted to the cluster with the next highest cluster load capacity until the prioritized cluster can no longer absorb additional load.
Stage 6: This stage governs load transfer processes within a cluster, where the failed node is not an edge node and shares cluster membership with all its neighboring nodes. The load transfer strategy in this stage prioritizes nodes with higher node load capacity for load reception. If the node load capacities of neighboring nodes are equal, load distribution priority is determined by sorting the connecting edges in descending order of their relative link circulation. If the node load capacities differ, neighboring nodes are first sorted in descending order of their node load capacities, followed by sorting the connecting edges in descending order of their relative link circulation. The load distribution sequence is then established by integrating these two rankings.
It should be acknowledged that the load redistribution rules and failure threshold definitions in the improved sandpile model remain abstractions of real-world complexity. In actual metro operations, passenger flow redistribution is influenced by individual decision-making, station-level guidance, and real-time dispatching interventions, while facility failure thresholds vary with equipment type, aging conditions, and maintenance levels. The present model focuses on capturing the macroscopic modulation of cascading failure pathways by cluster structures. The adopted simplifications, while ensuring model tractability, are sufficient to reveal the core dynamics of cross-layer coupled failure propagation. If the research objective shifts toward fine-grained prediction under specific scenarios, more sophisticated heterogeneous parameters and behavioral models would be required. This extension is left for future investigation.
5. Simulation and Validation of Urban Bilayer Metro Network Vulnerability
5.1. Visualization of Node Importance Ranking Results Based on the Improved DQN Algorithm
To enhance the effectiveness of critical node identification in complex networks, this study introduced the Deep Q-Network method for identification research. Given that the traditional DQN exhibits suboptimal performance in feature extraction for large-scale complex networks [
25], we implemented multi-dimensional improvements to the algorithm and rigorously validated the effectiveness of these various improvement strategies through vulnerability analysis experiments.
The first improvement involved replacing the convolutional layers in DQN with fully connected layers to enhance the network’s recognition accuracy of input information. Since convolutional layers are prone to losing critical information when extracting network structural features, the substitution with fully connected layers effectively mitigates this issue. The second improvement introduced the Double DQN architecture, which employs a dual-network structure (with the Eval network responsible for action selection and the Target network responsible for Q-value computation) combined with a dynamic exploration strategy to address the Q-value overestimation problem inherent in traditional DQN. The third improvement incorporated the Dueling DQN architecture, which decomposes the Q-value into a state value function and an advantage function.
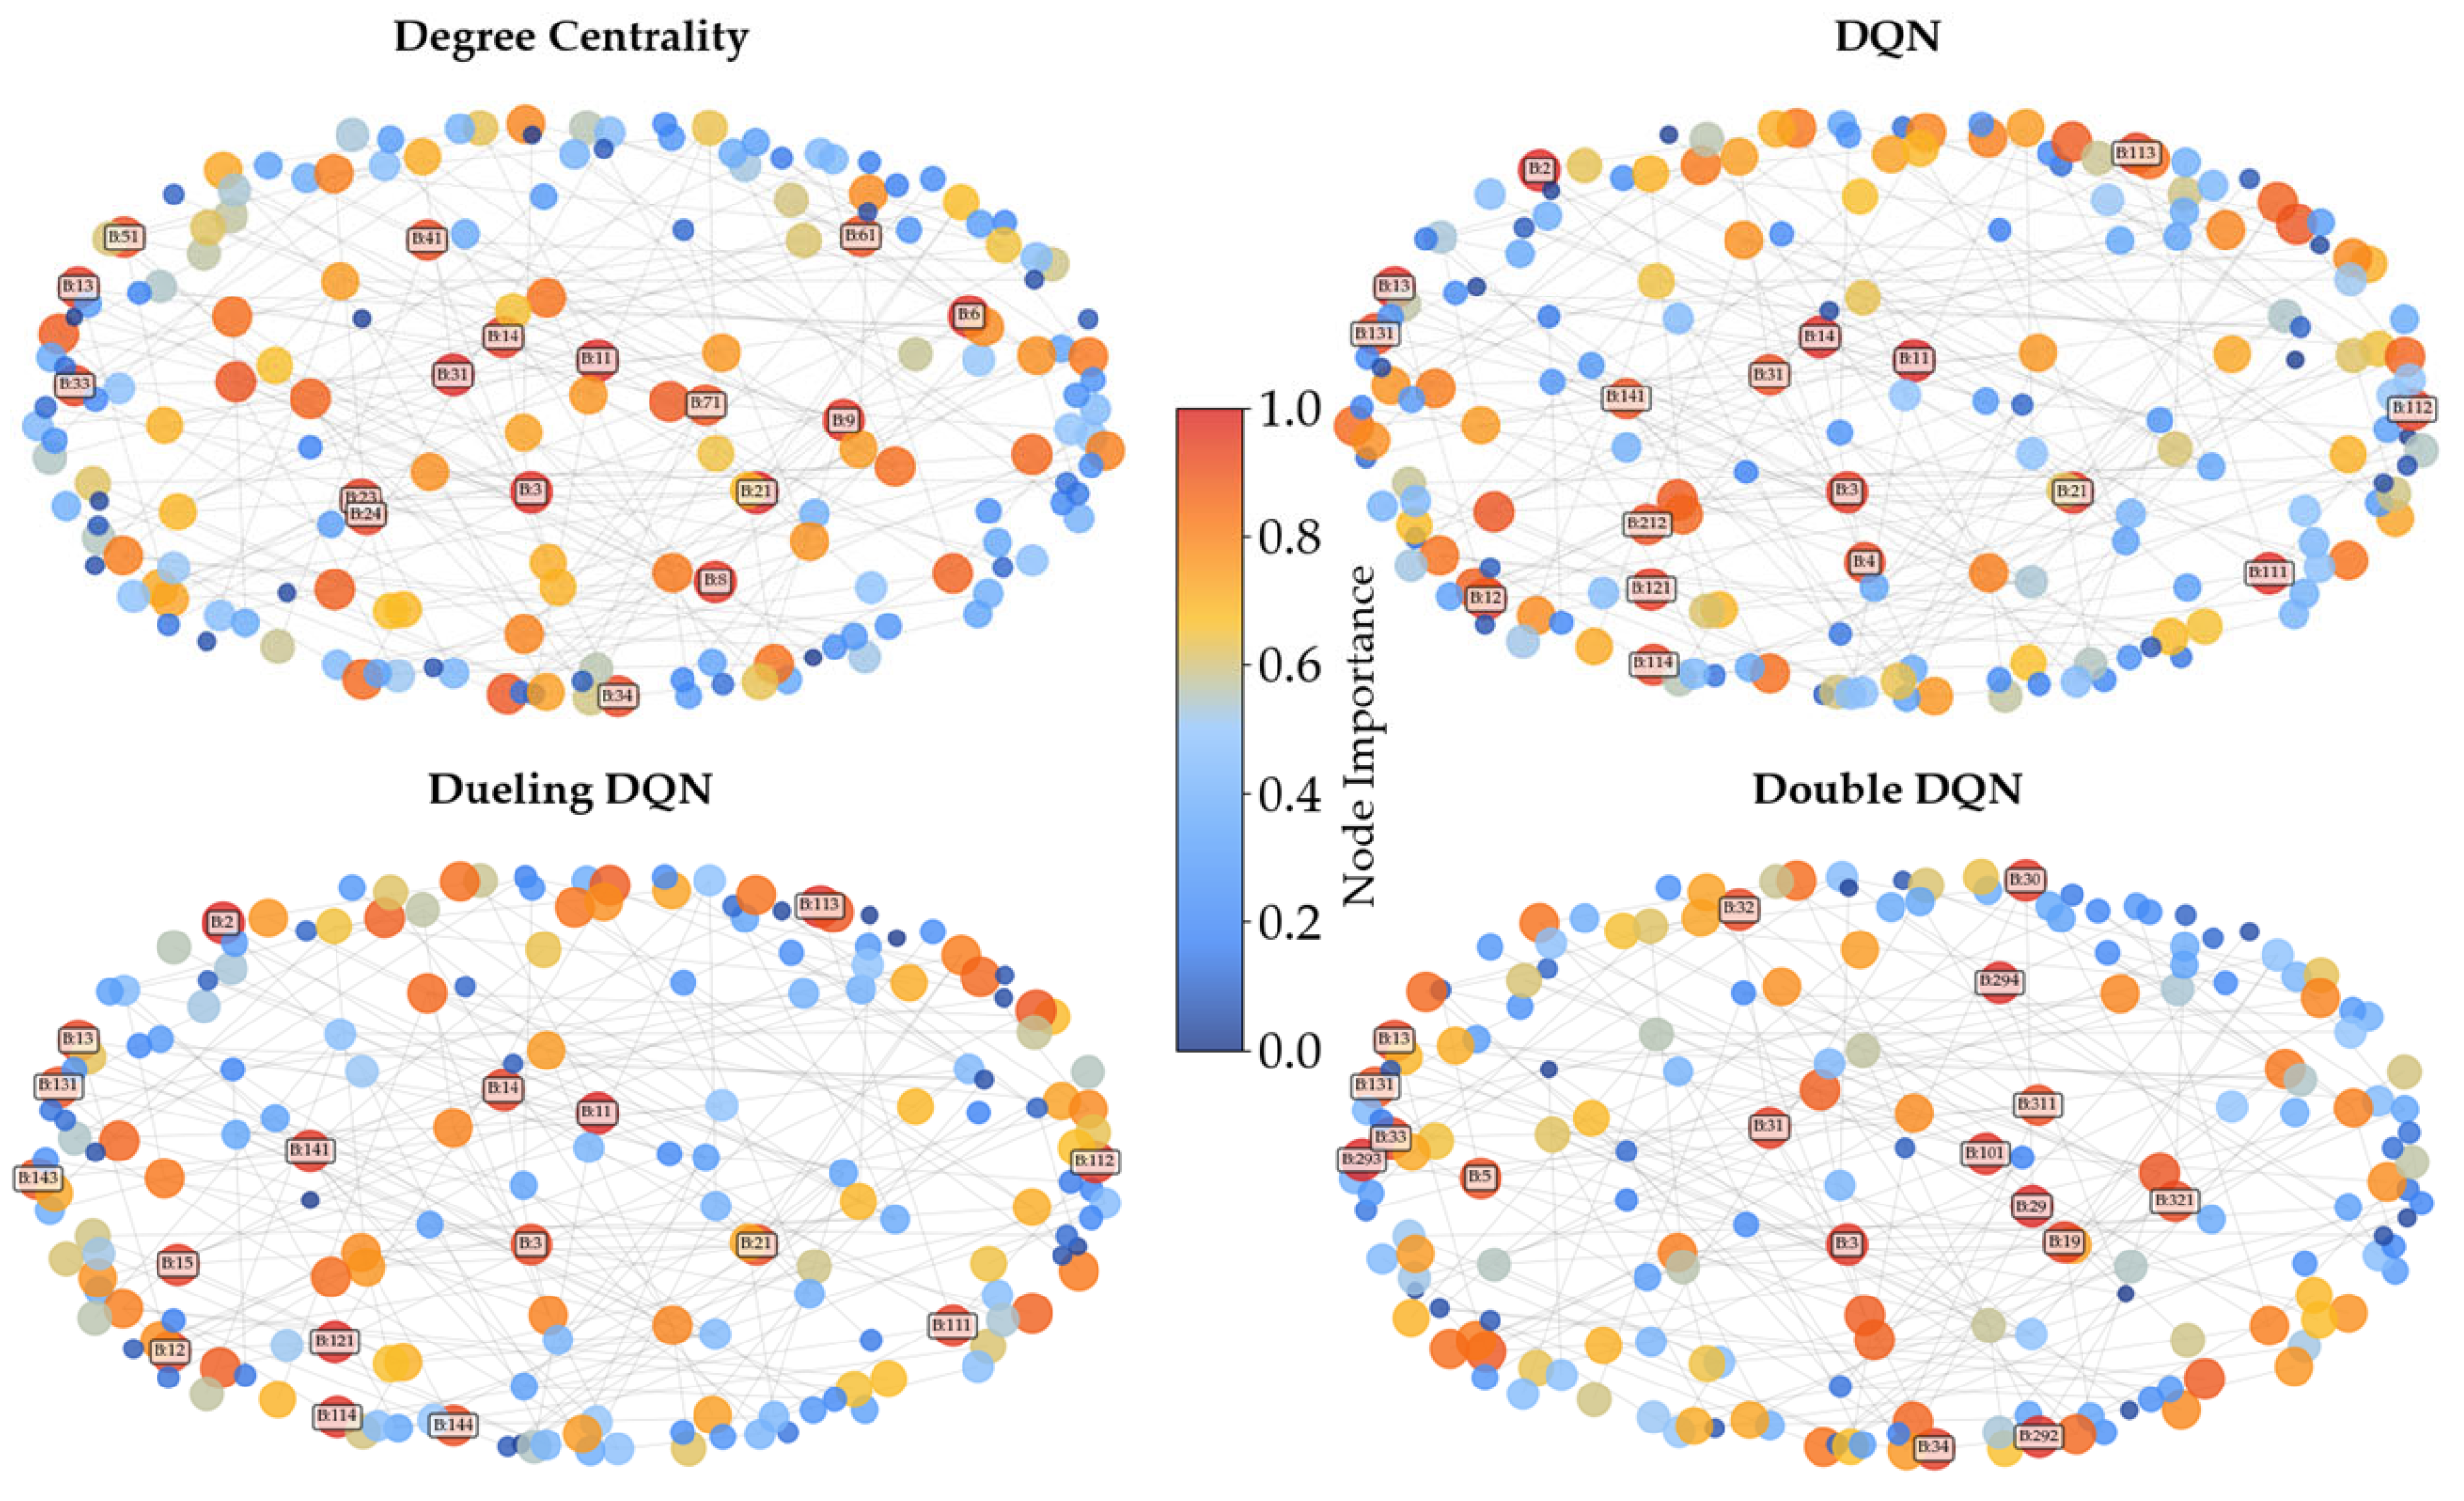
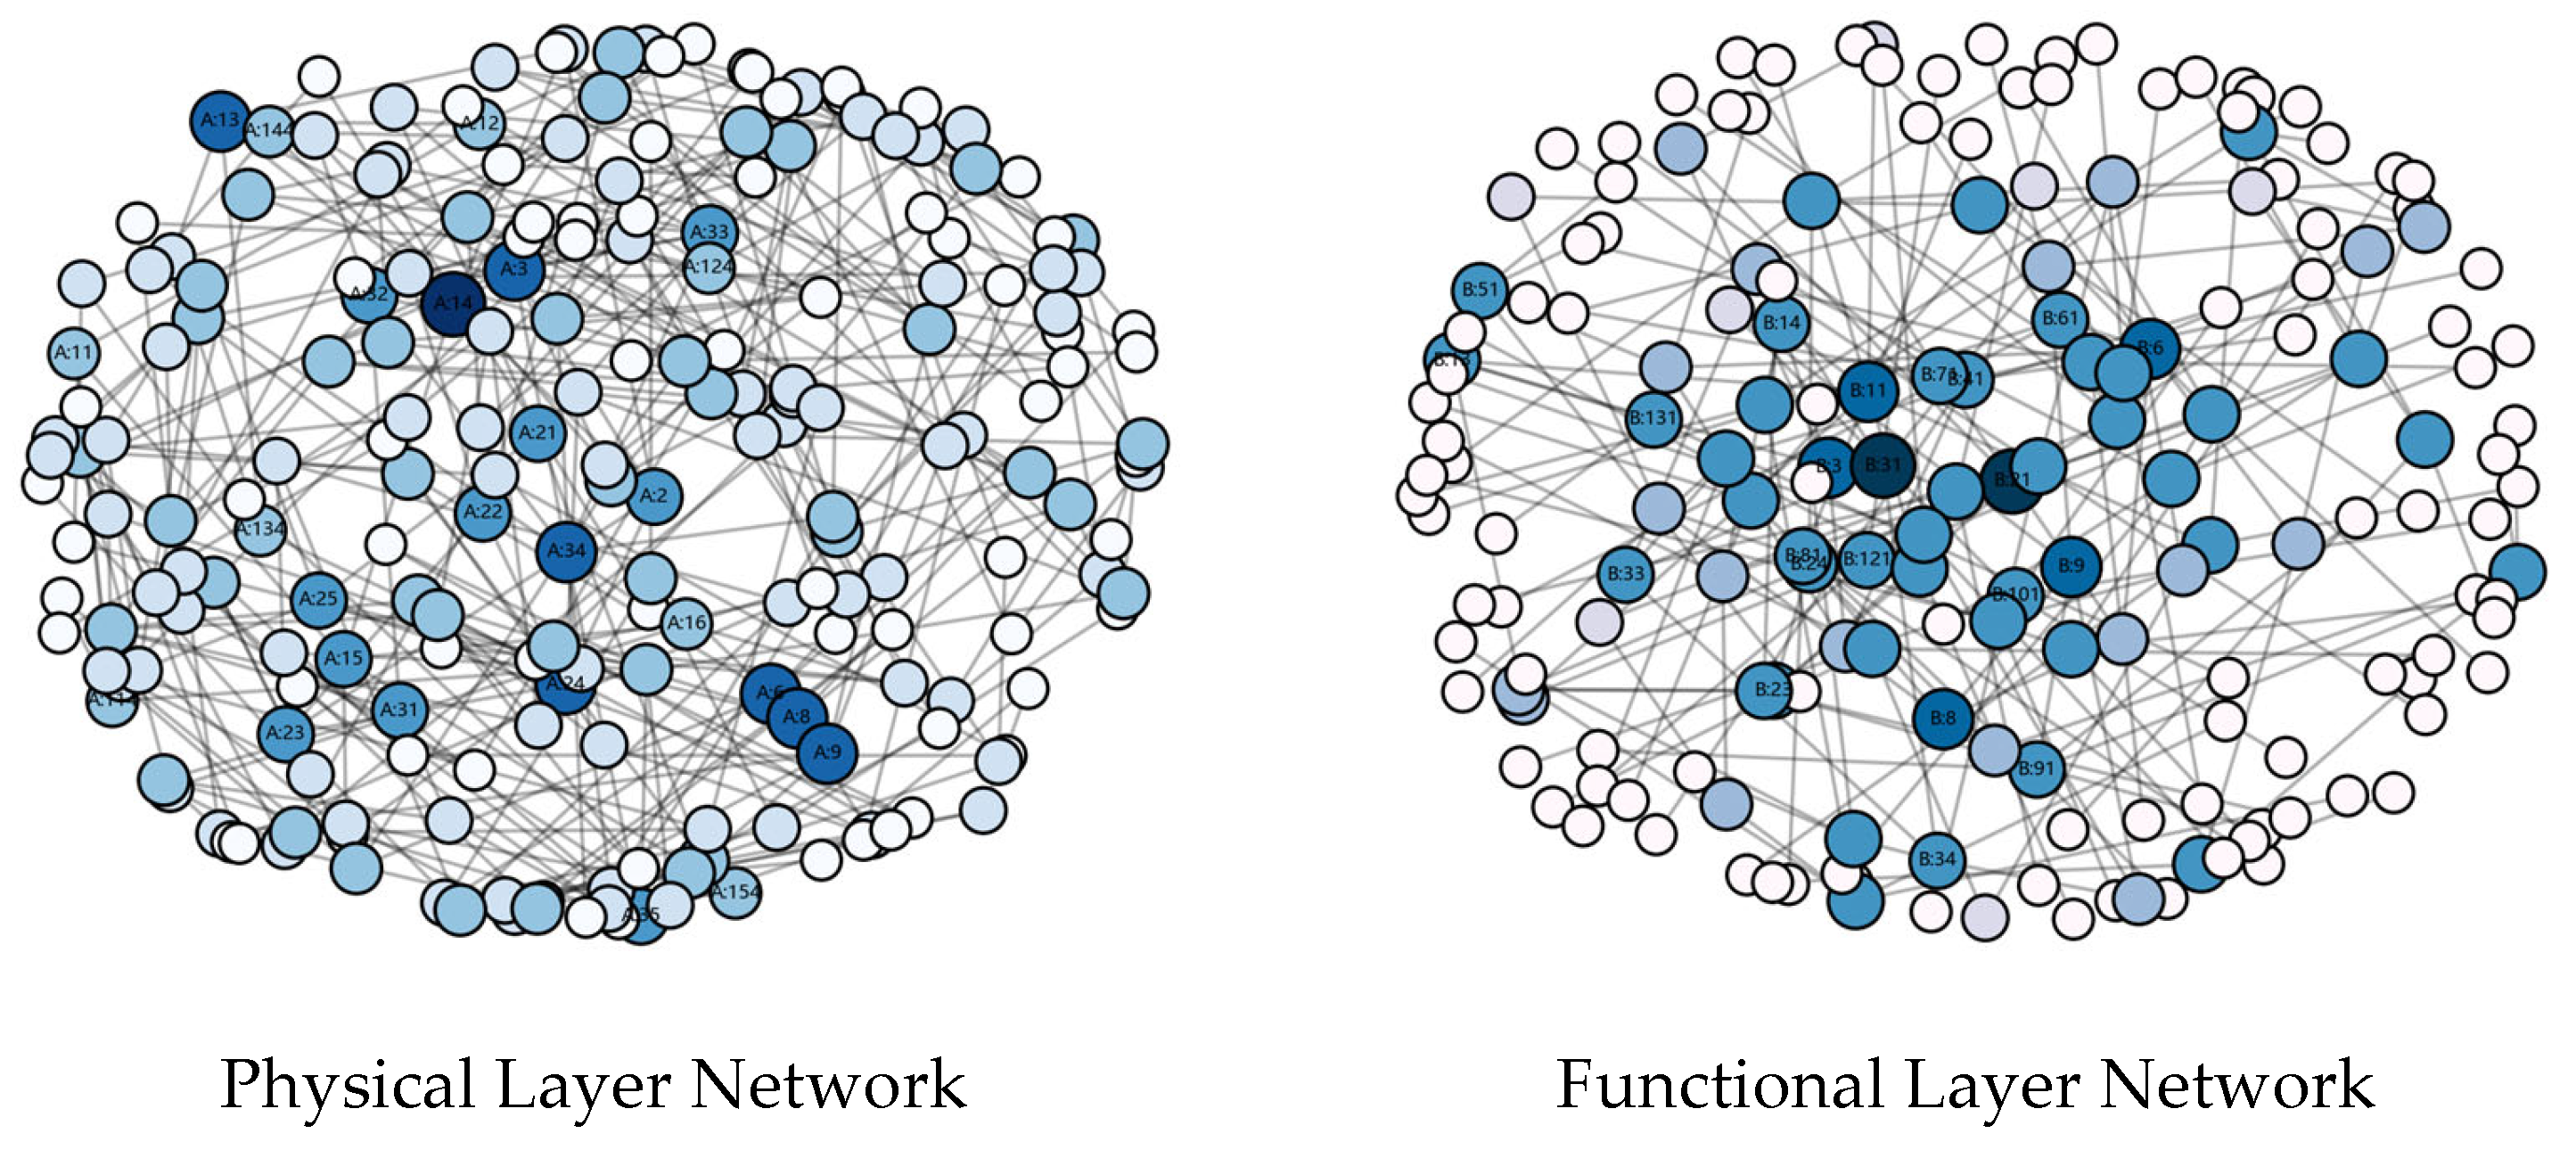
Incorporating the degree centrality-based node ranking method, node importance ranking results were obtained using the aforementioned four approaches (three improved DQN variants and the degree centrality method), as shown in
Figure 10.
Table 1 presents the node rankings derived from these four methods.
Figure 8 visualizes the metro network with node rankings obtained from different methods, where higher-ranking nodes are represented with larger sizes and increased color saturation and brightness. As is evident from the figure, critical nodes identified based on degree centrality are closely interconnected and tend to cluster within specific regions of the network. In contrast, critical nodes identified by the improved DQN, Dueling DQN, and Double DQN methods exhibit relatively uniform distribution, span the entire network scope. The underlying reason for this disparity is that traditional critical node identification methods lack global feature extraction capabilities. These ranking results will serve as the basis for formulating intentional attack strategies, providing a foundation for subsequent vulnerability analysis of complex networks.
5.2. Validation of the Improved Sandpile Model Applicability
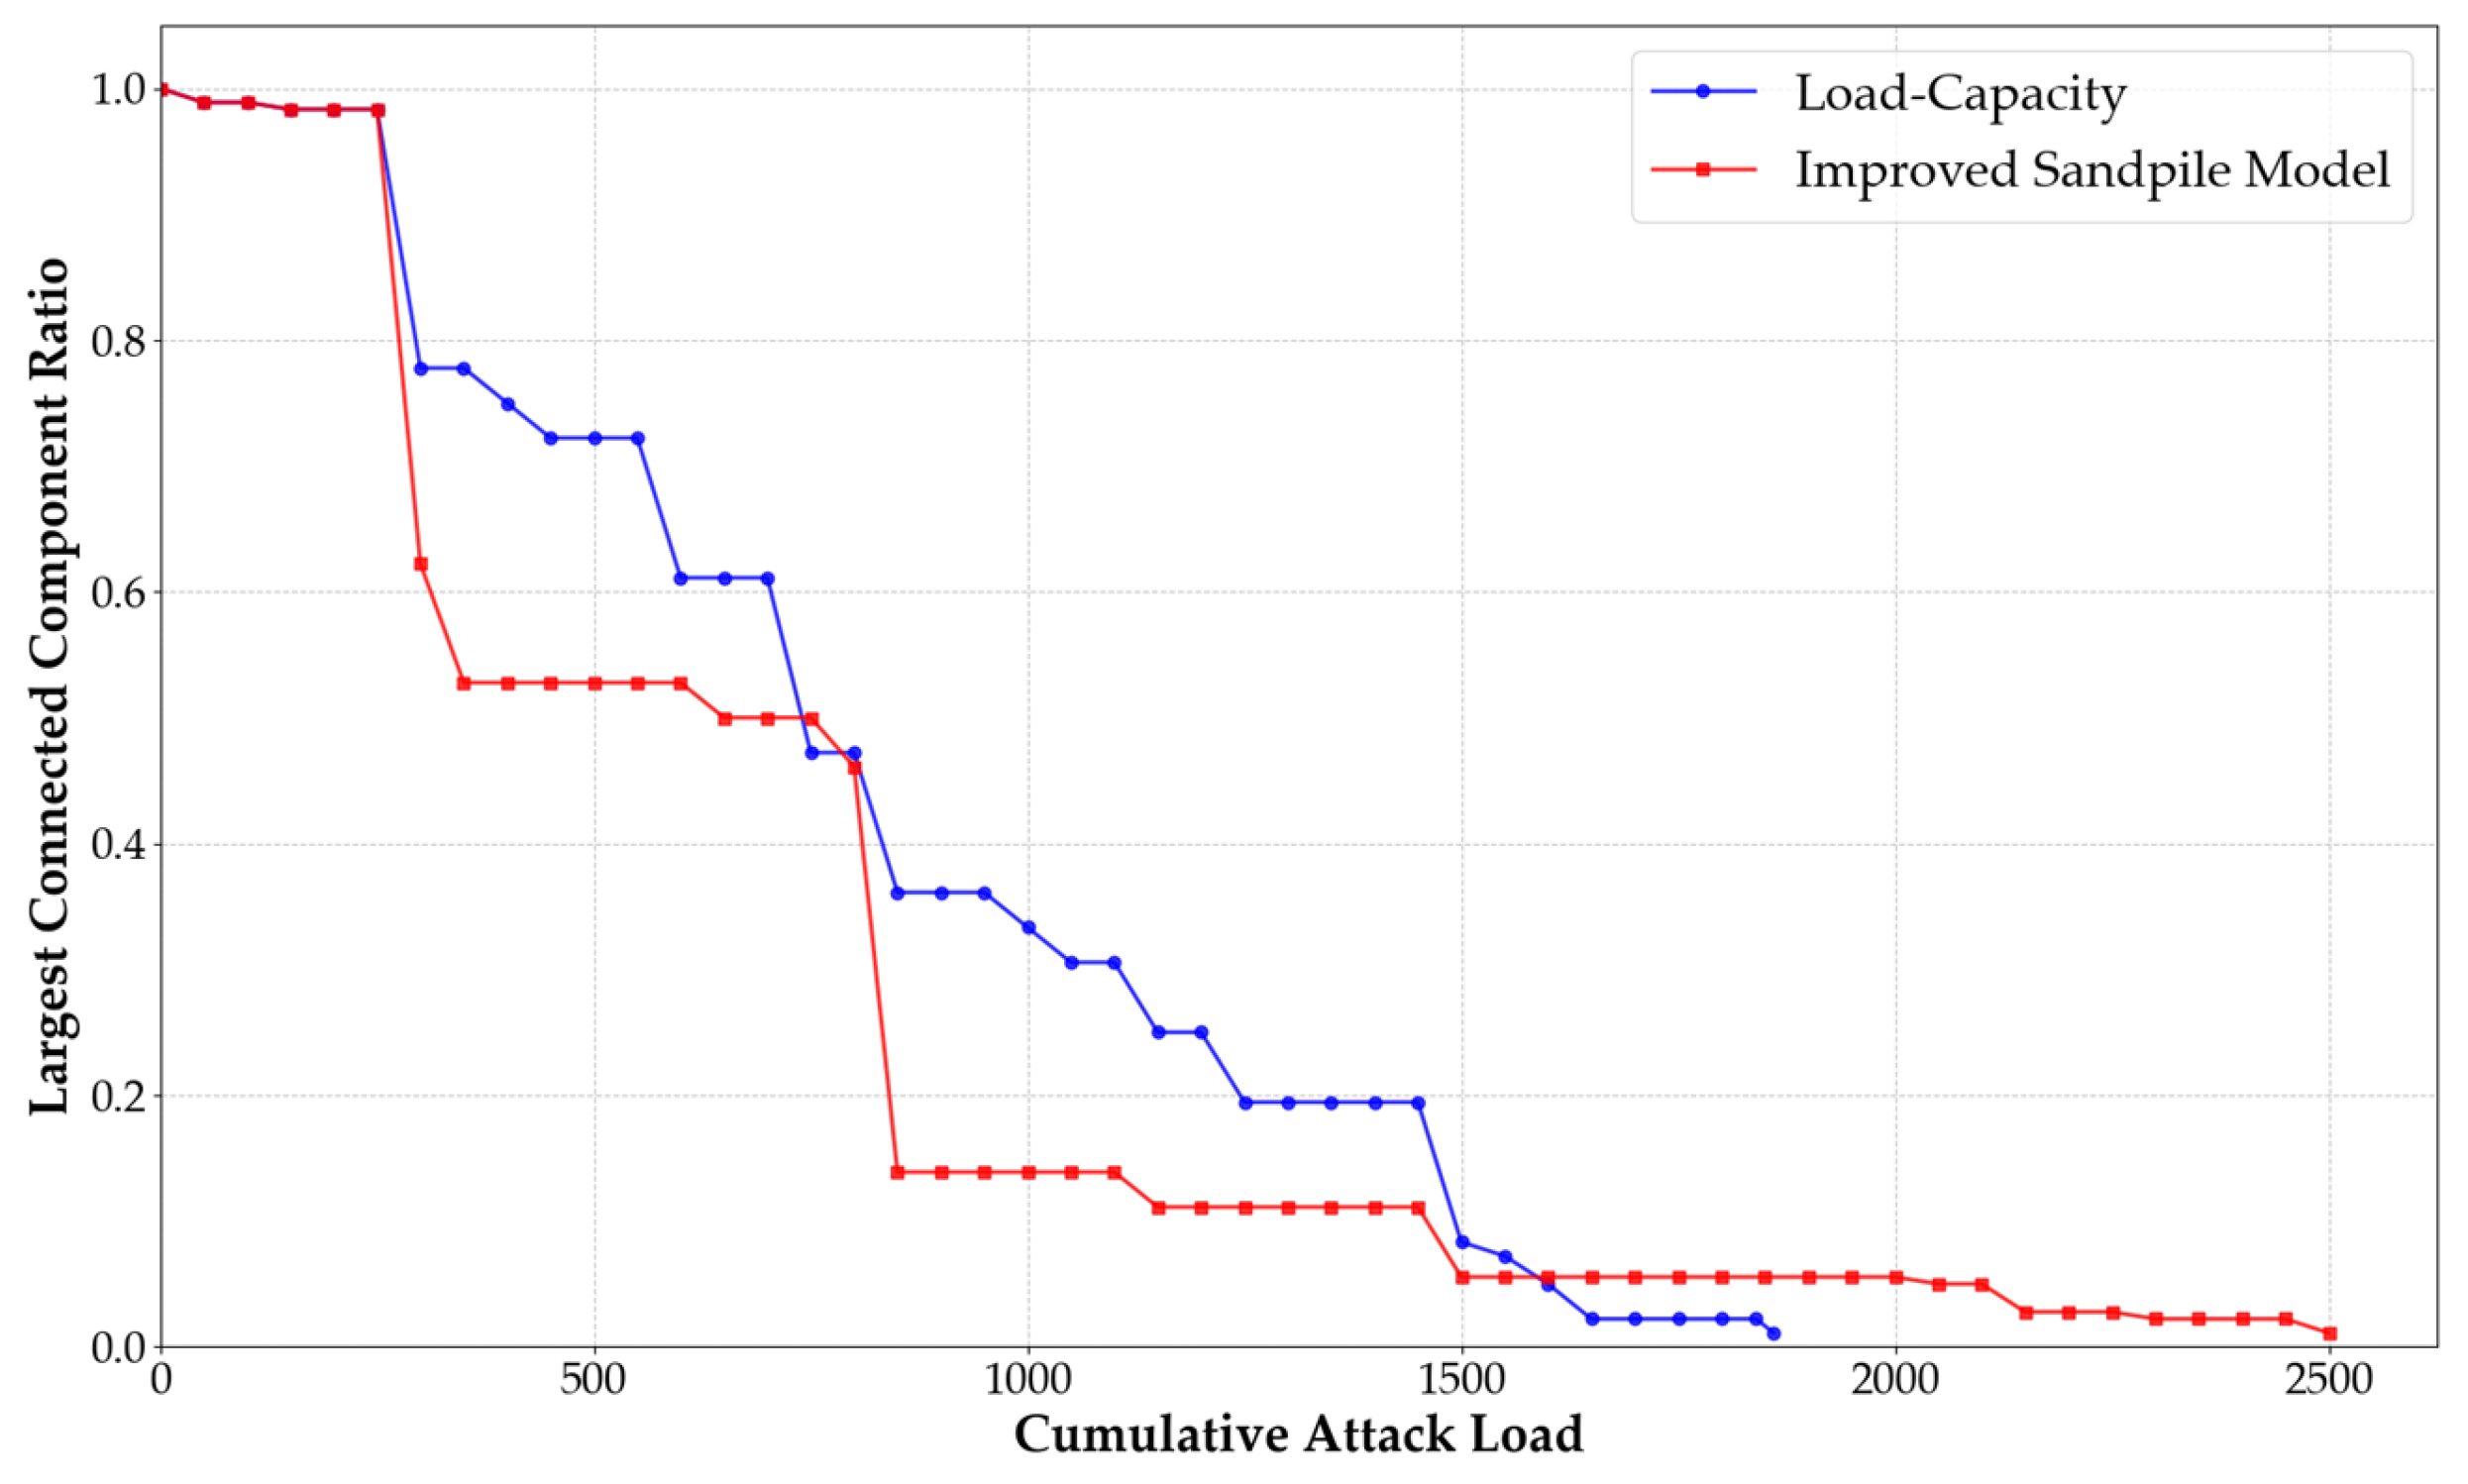
To evaluate the capacity of the improved sandpile model in capturing cascading failure dynamics, this study compares the evolution of the largest connected component ratio under sustained attack loads using two alternative failure rules: the conventional load–capacity model and the improved sandpile model. The results are presented in
Figure 11.
The two rules yield markedly distinct robustness profiles. The conventional load–capacity model exhibits an abrupt, cliff-like phase transition—network connectivity collapses precipitously as attacks accumulate, reflecting the implicit assumption that local overload instantaneously triggers global failure. In contrast, the improved sandpile model displays a continuous phase transition, with connectivity declining gradually as attack loads increase. This pattern captures the progressive diffusion of local perturbations through inter-layer coupling, buffered by system redundancy—a “local accumulation–gradual propagation” dynamic that aligns more closely with the observed behavior of real metro networks, where failures emerge slowly and propagate with inherent buffering capacity [
27]. It should be noted that the effectiveness of sandpile-based propagation rules in simulating cascading failure processes in clustered transportation infrastructure networks has been substantiated in the existing literature. For instance, Dui et al. [
27], in analyzing cascading failures in traffic networks, similarly employed cluster-aggregation-based load redistribution rules and demonstrated that networks exhibit enhanced stabil ity and improved flow capacity after aggregation. This provides methodological support for the application of the improved sandpile model to vulnerability analysis of bilayer metro networks in the present study.
In summary, the continuous phase transition driven by self-organized criticality in the improved sandpile model is more consistent with theoretical expectations for failure dynamics in hierarchically coupled networks than the abrupt collapse mode of the conventional model. It should be emphasized that this comparison serves as a theoretical plausibility argument for the model’s ability to capture failure propagation in clustered bilayer networks, rather than as direct empirical validation against historical incident data. The network topology data, passenger flow data, and facility coupling relationships used in this study are all derived from real-world collection and field investigations, thereby providing a realistic data foundation for the model analysis. Empirical verification of the model awaits the accumulation of real-world cascading failure cases in future work.
5.3. Analysis of the Safety Tolerance Coefficient
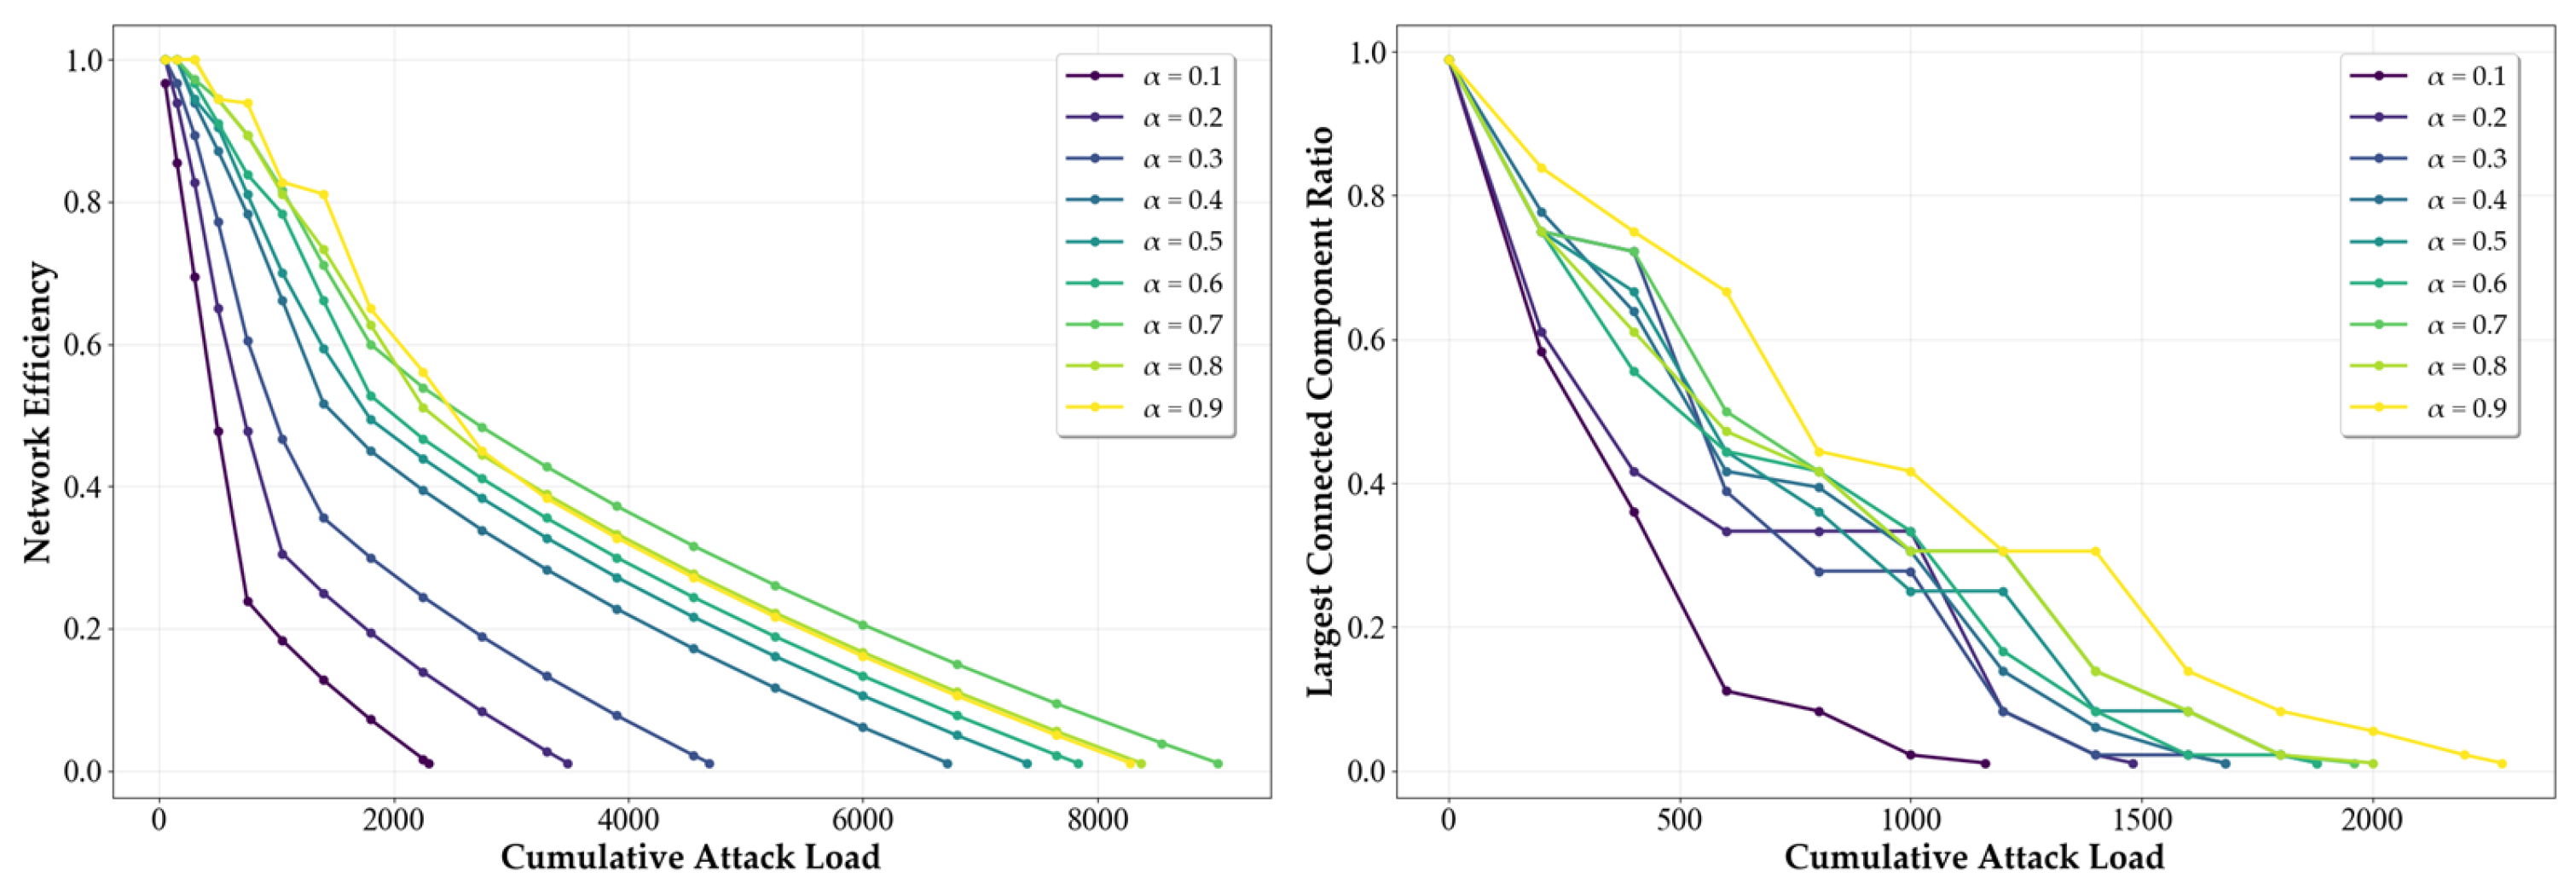
The safety tolerance coefficient α determines the level of redundancy in node capacity design: a larger α enhances a node’s ability to withstand overload, thereby suppressing the propagation of cascading failures. Drawing on typical redundancy ranges encountered in engineering design, this study adopts α ∈ [0.1, 0.9] to cover a gradient of scenarios from minimal to high redundancy. Under a fixed limit coefficient β = 1.2 and a deliberate attack strategy, we examine the influence of α on both the largest connected component ratio and network efficiency, with the results presented in
Figure 12.
As the cumulative attack load increases, overall network performance exhibits a declining trend; however, the value of α markedly modulates the pattern of degradation. At low redundancy (α = 0.1), the network undergoes a precipitous, cliff-like collapse early in the attack sequence. When α is raised to 0.3, the moderate redundancy partially buffers the overload impact, leading to a noticeably slower rate of decline. For α ≥ 0.5, the network maintains a gradual descent—or even brief plateaus—over a substantial range of attack loads, indicating a significant enhancement in resilience. These results demonstrate that increasing the safety tolerance coefficient effectively delays the cascading failure process, and that a critical interval exists within which network performance transitions from brittle collapse to progressive degradation.
In summary, a larger safety tolerance coefficient α substantially improves network robustness against cascading failures, shifting the degradation mode from brittle collapse toward gradual decline. Accordingly, reasonable redundancy capacity should be allocated to critical nodes during metro network design and operation to strengthen the system’s ability to buffer localized failures.
5.4. Analysis of the Limit Coefficient
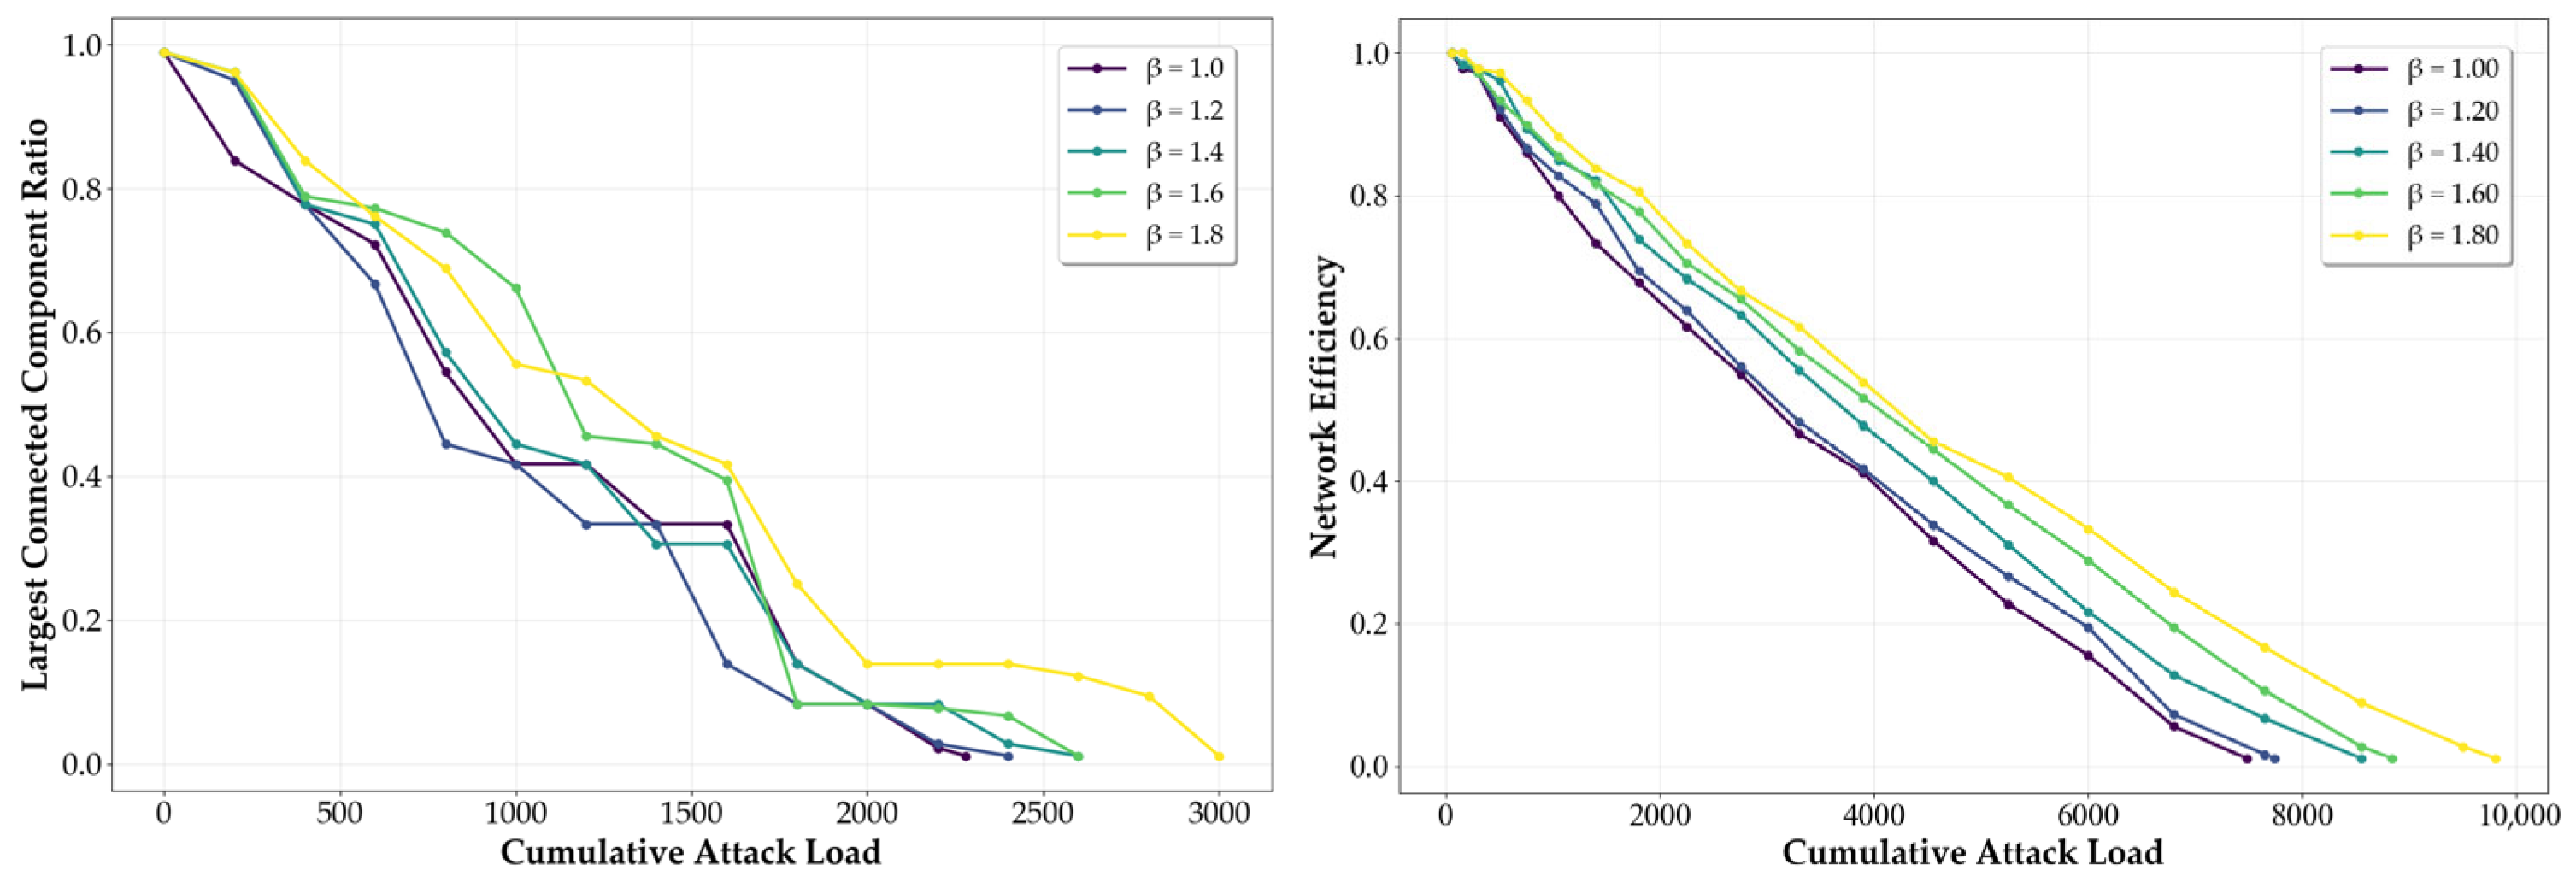
The limit coefficient β defines the maximum overload capacity of a node beyond its baseline redundancy: a larger β reduces the likelihood of node failure under load surges, thereby constraining both the spatial extent and the severity of cascading failure propagation. Consistent with engineering practice, this study selects β ∈ [1.0, 1.8] to represent a gradient from relatively low to relatively high overload margins. With the safety tolerance coefficient fixed at α = 0.3 and a deliberate attack strategy employed, we investigate the influence of β on the largest connected component ratio and network efficiency, as shown in
Figure 13.
As the cumulative attack load grows, network performance exhibits an overall downward trend; yet increasing β substantially alters the degradation trajectory. At low β (β = 1.2), the maximum overload capacity is limited, and a steep performance collapse occurs early in the attack. Raising β to 1.5 expands the overload margin, visibly flattening the decline curve. At β = 1.8, performance degrades only very gradually across a wide range of attack loads, demonstrating effective suppression of overload-driven failure. These findings indicate that a larger limit coefficient delays the cascading failure process, and that a critical interval exists across which the network transitions from rapid collapse to progressive degradation.
5.5. Vulnerability Analysis Based on the Improved Sandpile Model
The physical layer of metro networks is highly susceptible to physical disruptions such as passenger surges, rainstorm flooding, and malicious attacks, whereas the functional layer is vulnerable to cyber threats [
28,
29,
30]; moreover, failures in the two layers can propagate reciprocally. In light of this, the present study employs the cascading failure propagation rules of the improved sandpile model to conduct a vulnerability analysis of the Zhengzhou metro bilayer complex network [
31].
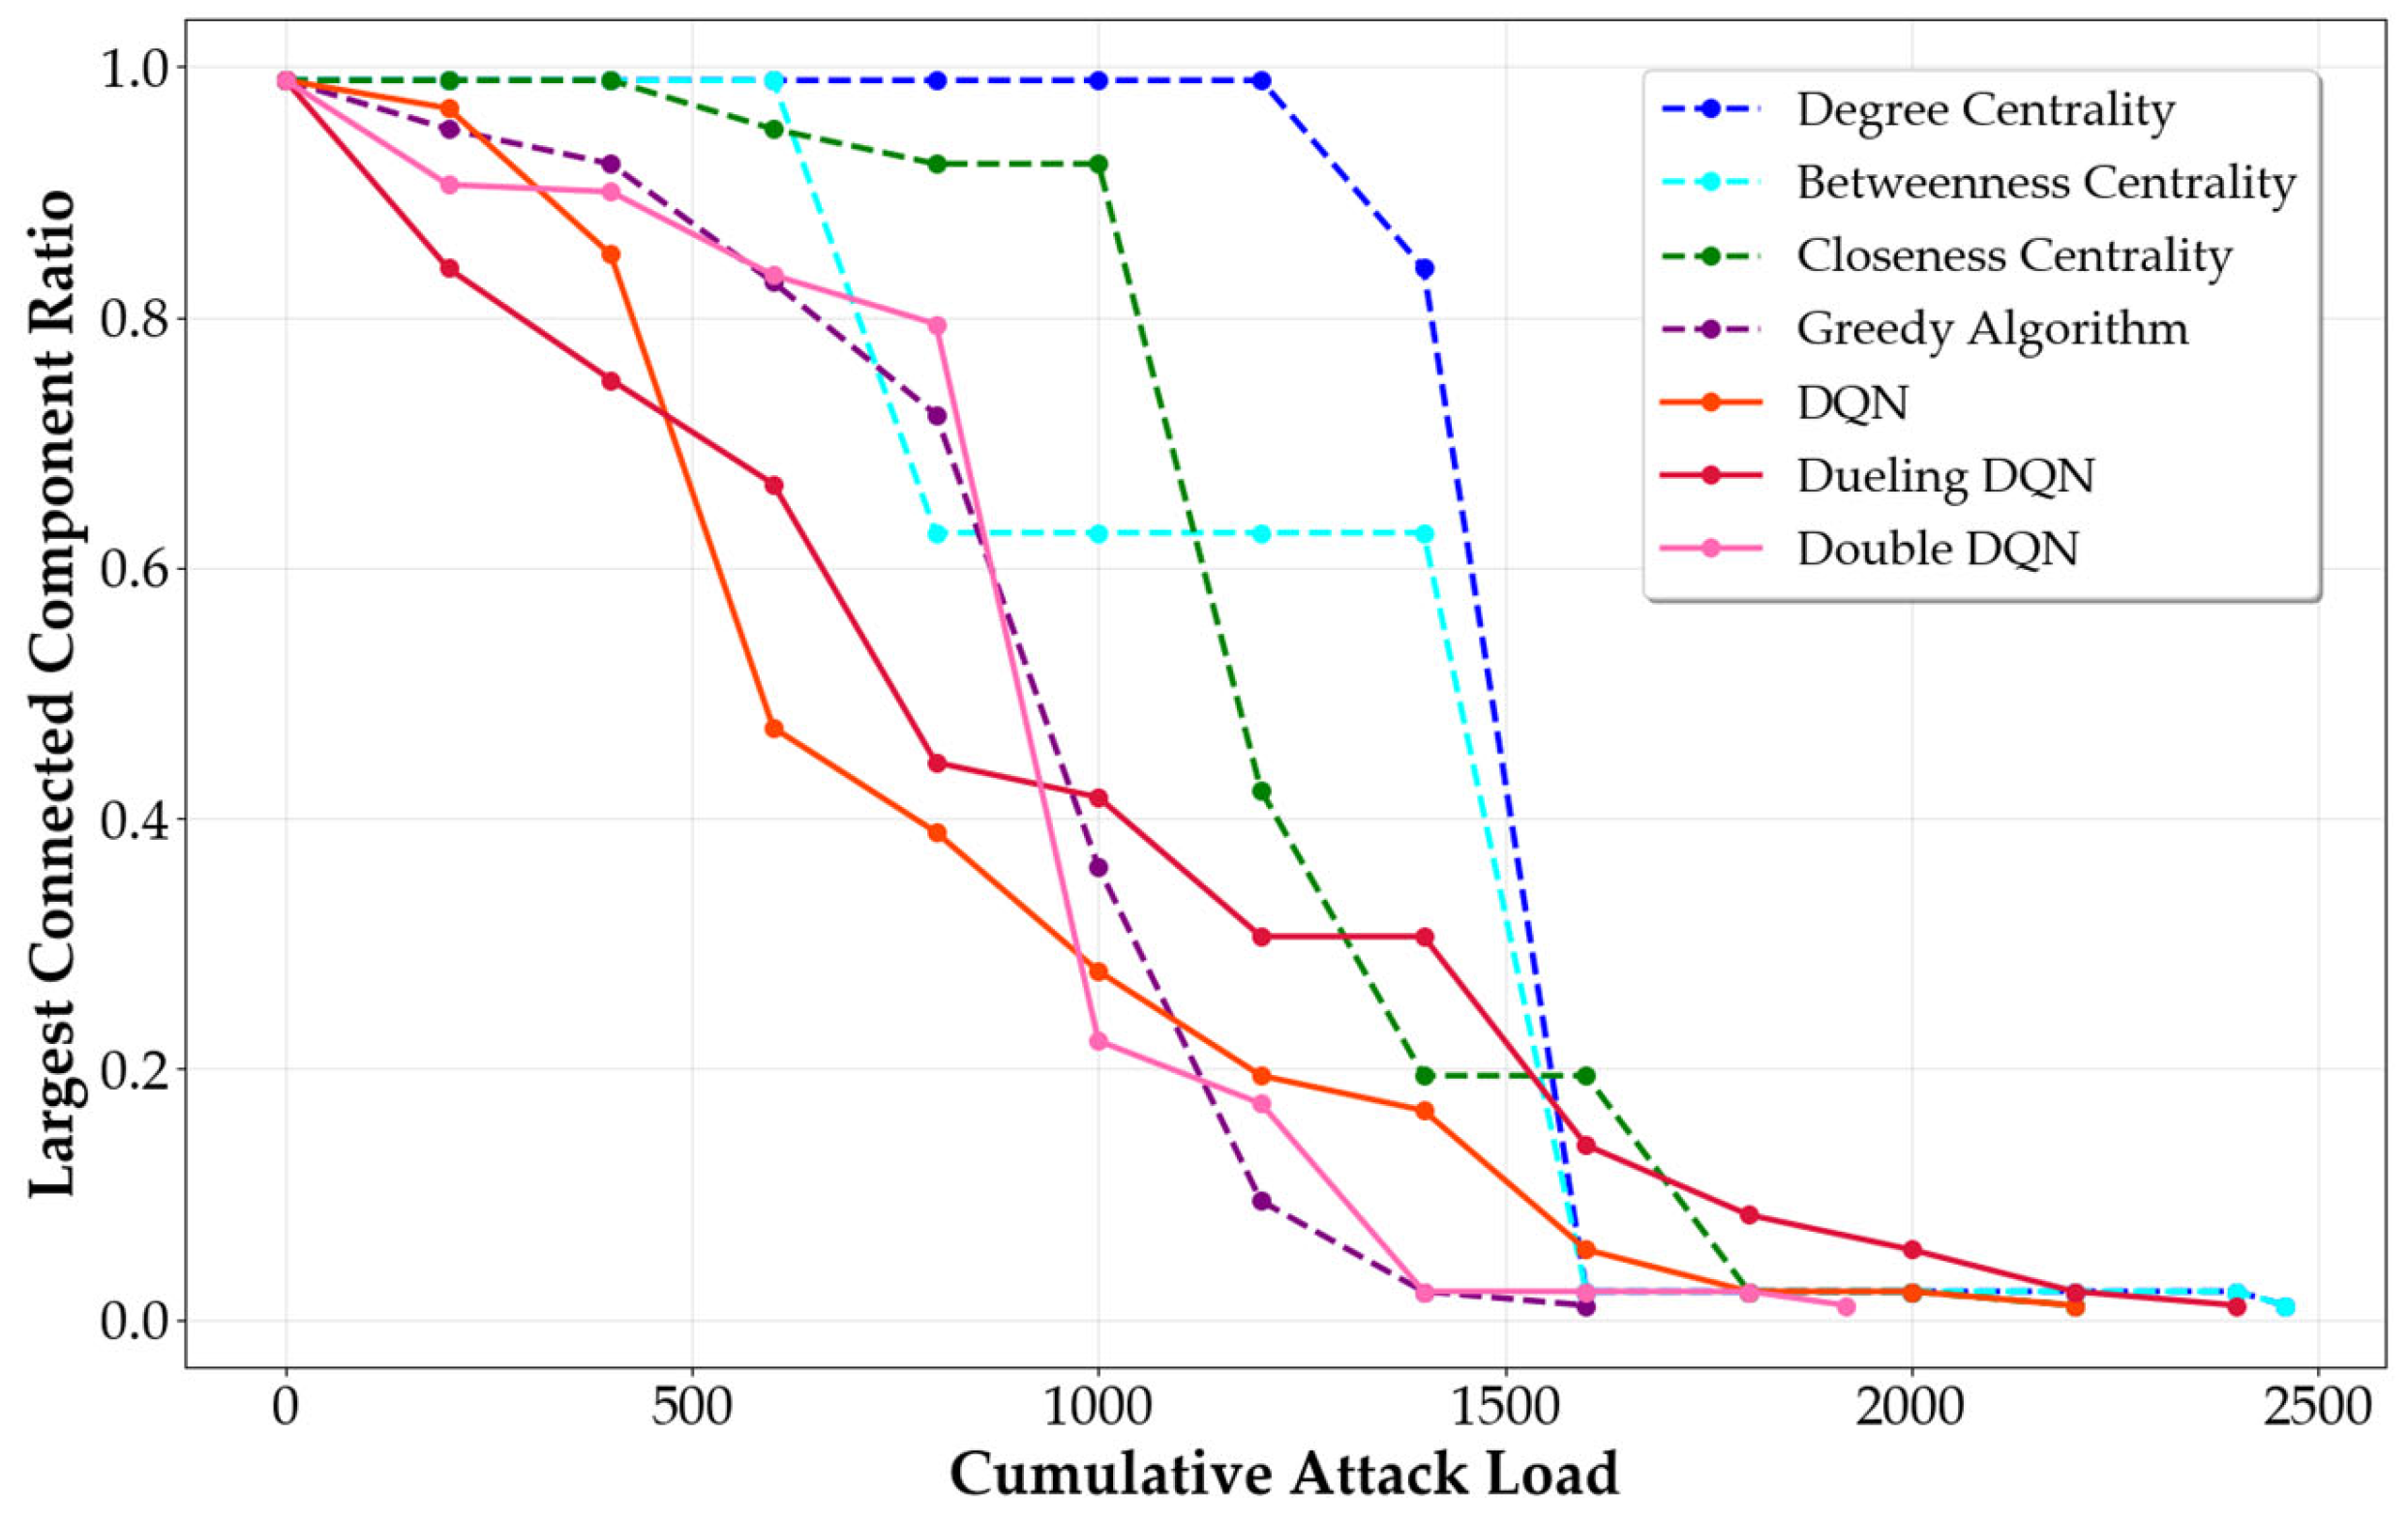
To evaluate the impact of different node importance ranking methods on network robustness, seven node ranking strategies are adopted in deliberate attack simulation experiments, during which the largest connected component ratio is monitored in real time as the cumulative attack load increases. The seven strategies comprise four classical methods—degree centrality, betweenness centrality, closeness centrality, and the greedy algorithm—along with the three improved DQN variants proposed in this work: DQN, Dueling DQN, and Double DQN. The simulation results are presented in
Figure 14.
As can be clearly observed from
Figure 14, the largest connected component ratio exhibits a declining trend under all strategies as the cumulative attack load increases. Notably, the curves corresponding to the three improved DQN algorithms descend significantly faster than those of all classical methods. At a cumulative attack load of only 2000, the largest connected component ratio under the DQN method has already dropped to 0.2, whereas the corresponding ratios for degree centrality, betweenness centrality, and closeness centrality remain as high as 0.90, 0.97, and 0.97, respectively, and the greedy algorithm reaches only 0.85. As the attack load further increases, the DQN series continues to exhibit the fastest rate of connectivity decay, ultimately leading to global network collapse under comparatively small attack loads.
The above results indicate that, in the examined case, the node sequences identified by the improved DQN algorithms achieve greater disruption efficiency against network connectivity than the classical centrality methods and the greedy algorithm included in the comparison. This phenomenon may be attributed to the following: classical centrality methods compute rankings based on a static topology and are therefore ill-equipped to capture the dynamic evolution of network structure and the consequent reassessment of residual node importance following sequential removals; the greedy algorithm, although capable of re-evaluating at each step, remains constrained by a locally optimal perspective. In contrast, the improved DQN implicitly incorporates topological evolution information by learning a mapping from network states to removal actions, thereby exhibiting certain advantages in sequential disruption tasks.
In summary, within the bilayer coupled network context examined in this study, the improved DQN algorithms demonstrate better performance in critical node identification compared with the classical methods considered, offering a viable technical pathway for subsequent vulnerability analysis and protection strategy research.