Article

Biomechanical Evaluation of Loading Variability and Bone Quality in Total Knee Arthroplasty: A Finite Element Sensitivity Study


BEAMS Department (Bio Electro and Mechanical Systems), École Polytechnique de Bruxelles, Université Libre de Bruxelles, 1050 Bruxelles, Belgium
*
Author to whom correspondence should be addressed.
Appl. Sci. 2026, 16(13), 6731; https://doi.org/10.3390/app16136731
Submission received: 11 June 2026 / Revised: 30 June 2026 / Accepted: 3 July 2026 / Published: 5 July 2026
(This article belongs to the Special Issue Mechanical Design and Modeling for Medical Devices and Simulators)

Featured Application

The computational framework used in this study can be utilized by orthopedic researchers, clinicians, and orthopedic implant manufacturers for comprehensive planning, execution of surgical operations, and preclinical evaluations of knee arthroplasty. By performing parametric sensitivity analysis across extreme kinetic load profiles (50% and 200% variance) and different bone qualities, this study can help manage patient-specific treatment approaches, identify worst-case scenarios, and implant design optimizations.

Abstract

While total knee arthroplasty (TKA) is highly successful, wear, primary fixation stability and structural failure remain significant challenges, particularly in patients with diverse kinetic profiles and compromised bone. This study evaluates a fixed-bearing cruciate-retaining TKA prosthesis under extreme load variability in healthy and osteoporotic bone. Finite element simulations utilized ISO-standardized baseline gait cycle, scaling independently axial forces, antero-posterior forces, and rotational torque to 50% and 200%. Polyethylene insert stress, tibial stress, and bone–implant micromotion were evaluated to assess structural safety, load transfer, and primary stability. Kinetic variability directly influenced the stress magnitude and load transfer. Insert load distribution revealed a compartmental split (medial side bearing 47.6% to 60.9%) sensitive to force orientation and translational load magnitudes (axial and shear), but totally independent of rotational torque magnitude. While reduced bone quality did not significantly affect overall polyethylene stresses, it directly impacted primary stability. Osteoporotic conditions nearly doubled the total baseline interface micromotion (from 19 µm to 37 µm) and exhibited an absolute maximum of 63 µm under 200% axial load scaling. These findings highlight the necessity of definition of model parameters for careful preclinical planning for patients with compromised bone quality regarding prosthesis selection, fixation method and alignment.

1. Introduction

Total knee arthroplasty (TKA) remains one of the most performed surgical procedures for patients with severe knee pathologies [1,2]. In cases where the posterior cruciate ligament (PCL) is healthy and functional enough to provide knee joint stability, the fixed-bearing cruciate-retaining (FB CR) design is frequently adopted as the primary option, offering both high success rates and cost-effectiveness [3]. From a clinical perspective, FB CR implants are valued for their biomechanical simplicity and primary stability, helping patients maintain physiological knee function while reducing stress at the bone–implant interface and minimizing the risk of wear or loosening [4,5].
Preclinical evaluation of TKA designs’ performance typically relies on testing standards, such as ISO 14243-1 gait cycle [6]. However, the actual joint loading is highly dependent on patient-specific factors that are often underrepresented in these standardized methods. Therefore, the debate about whether these standards are suitable for preclinical stages is still ongoing, as they ignore real-world patient load variability such as body weight, muscle strength and kinetic profiles [7,8,9]. Another critical patient-specific factor impacting the implant performance is bone quality. Poor bone quality, such as osteoporosis that induces a decreased bone mass and density, when associated with unpredictable variations in the loading conditions [10,11], can significantly lead to increased stress in the peri-implant region, uneven force distribution, higher risks for wear and aseptic loss of fixation, reducing overall the implant stability and long-term durability [12,13]. Computational stress analysis methods, such as finite element analysis (FEA), are powerful tools that are used alongside experimental tests, allowing for virtual parametric evaluation of these variable scenarios [14]. The advantage of this method is the possibility to vary the desired boundary conditions or material, while keeping the same setup for the input model and virtual simulation, which makes it a useful tool for this framework.
Therefore, this finite element study investigates the biomechanical performance of a single FB CR total knee arthroplasty design under the influence of patient-specific kinetic variability and varied bone quality (osteoporotic bone), in terms of load transfer, primary stability and structural safety.
Our hypothesis is that standard implant testing protocols do not count for specific, high-risk patient cohorts and that incorporation of varied patient kinetic profiles and compromised bone quality will reveal significant differences in load transfer mechanics and implant stability when compared to baseline standards.
Our findings showed that force variability primarily affects the insert contact stress and load distribution, whereas poor bone quality triggered a severe stress shielding effect on cortical bone and amplified implant–bone interface micromotion.

2. Materials and Methods

The computational framework and modeling protocols employed for this FEA study were based on previously validated and published papers [15,16,17,18].

2.1. Geometries

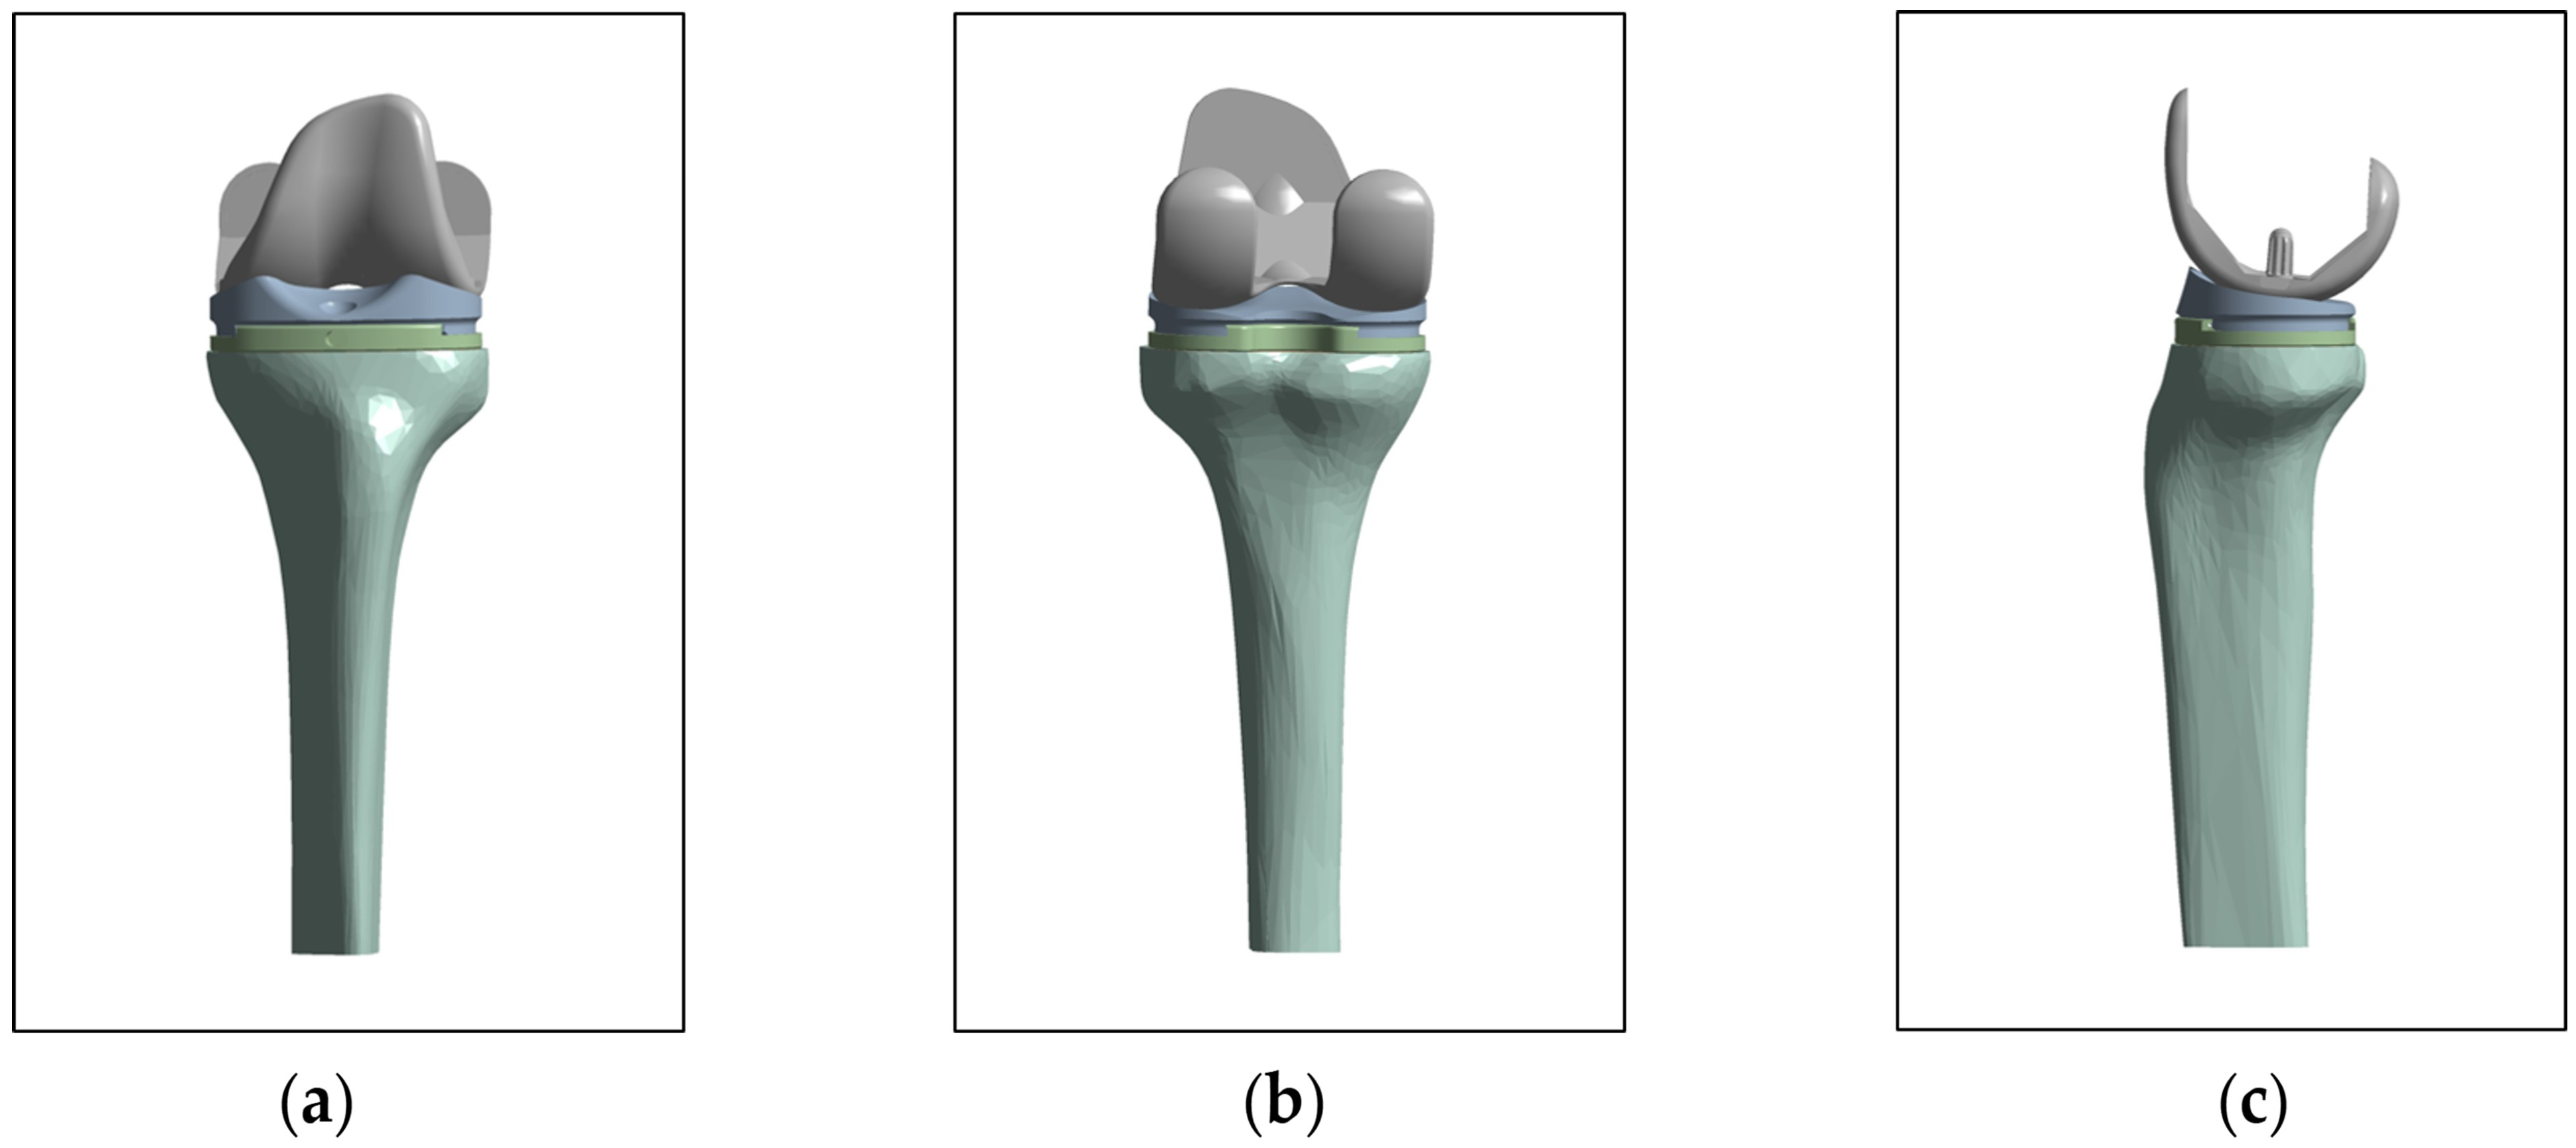
A fourth-generation left Sawbones composite tibia (SKU #3401, Sawbones, Pacific Research Laboratories Inc., Malmo, Sweden) 3D model, derived from computed tomography CT images, was used in this study. The model was split into cortical and cancellous bone [15]. A Genus FB CR implant (Adler Ortho, Cormano, Milan, Italy), comprising femoral component, tibial insert, and tibial tray, was used. Implant size 5 was selected as the closest fit to the corresponding bone. The prosthesis was virtually implanted using mechanical alignment, press-fit fixation, with a 10 mm resection of proximal tibia bone following the manufacturer surgical guide. The virtual surgical operation on the model configuration was conducted on ANSYS 2024 SpaceClaim (ANSYS Inc., Canonsburg, PA, USA). Figure 1 represents the complete 3D TKA model assembly (FB CR TKA prosthesis virtually implanted on synthetic tibia bone). The main ligaments were introduced as mentioned in the previous validated methods [17,18]. Respectively, the medial collateral ligament (MCL) was modeled as two bundles: anterior medial collateral ligament (aMCL) and posterior medial collateral ligament (pMCL). Both the MCL and the lateral collateral ligament (LCL) were modeled as pre-strained beams that allowed for the definition of their physical cross-sectional properties. The posterior cruciate ligament (PCL) was modeled as spring element.

2.2. Material Models and Properties

Material properties were assigned according to the corresponding datasheet of the manufacturer and previous validated literature [16,19,20,21,22,23]. Cortical bone was modeled as a transversely isotropic linear elastic material behavior. Cancellous bone, femoral component, tibial tray, tibial insert, LCL, and MCL were modeled as isotropic linear elastic material behavior. To mimic the osteoporotic bone behavior, the cortical bone Young and shear modulus were reduced by 32%, whereas for cancellous bone were reduced by 66%, as reported in [21,22]. Posterior cruciate ligament (PCL) was modeled as a spring element with a stiffness coefficient of 350 N/mm [15]. Pre-strains were applied respectively for aMCL, pMCL, and LCL [24]. All material properties of this study are shown in Table 1.

2.3. Interactions

The contacts between parts were defined as follows. Tibial tray to tibial insert contact was modeled as bonded. Tibial bone to tibial tray contact and femoral component to tibial insert contact were modeled as frictional with a coefficient of 0.4 and 0.04, respectively [16]. Contact formulation for frictional interaction is modeled as Augmented Lagrange, and interface treatment was set to Adjust to Touch. These contacts ensured that model components remain tight and represent the functionality of the joint in press-fit TKA.

2.4. Applied Loads and BCs

Simulations for this study were conducted in ANSYS Mechanical 2024 R1 (ANSYS Inc., Canonsburg, PA, USA) using multiple-step loading conditions derived from the ISO 14243-1:2009 gait cycle [6].
The knee joint was positioned in 0° flexion (full extension) and loaded using axial force, antero-posterior (AP) force and internal–external (IE) rotational torque throughout 10 load steps (Table 2), representing key points of the stance phase of the gait cycle.
This phase was selected for analysis as it represents the primary weight-bearing segment of the GC, during which the knee joint is subjected to peak physiological loads and maximal compressive axial forces. Consequently, it represents the most critical scenarios for evaluations of structural safety and primary stability.
Boundary conditions were introduced to maintain tibial translational and rotational degrees of freedom (DOFs) unconstrained to allow the 3D TKA configuration model to naturally adapt under the applied loading conditions. This approach allows for controlled evaluation and comparisons of pure kinetics and structural response. Although the method does not account for flexion-dependent kinematics, it is commonly employed to isolate the impact of varied gait loads on knee mechanics [25,26].
All applied loads were defined by component vectors and applied to the proximal surface of the femoral component. A fixed support boundary condition was applied to the entire distal surface of the distal tibia.
The scenarios for investigation were conducted as follows: a healthy mechanical baseline under standard ISO gait cycle was established. Subsequently, parametric sensitivity analysis was performed by independently scaling axial force, antero-posterior (AP) force, and rotational torque to 50% and 200% of their baseline magnitudes. Then the same complete framework was applied to an osteoporotic bone model, allowing a comparative evaluation of load transfer and failure risks of the implant when varied patient physiological conditions are present. FEA was employed to analyze and compare the scenarios under investigation.

2.5. Mesh Generation

The model was discretized in ANSYS Mechanical 2024 R1 (ANSYS Inc., Canonsburg, PA, USA) using 10-node quadratic tetrahedral elements (Tet10). A global element size of 3.0 mm was assigned to the cortical bone, cancellous bone, femoral component and tibial tray, whereas a finer element size of 2.0 mm was applied to the tibial insert. Local refinement was made on the contact faces of the femoral component with the tibial insert and the proximal tibia, where a face sizing of 1 mm was applied. The mesh size was selected based on a mesh independence and sensitivity study, as well as from previous validated mesh quality protocol for similar biomechanical models [15]. The finalized discretization across the model resulted in a total of 246,450 elements and 423,260 nodes. Mesh metric evaluations were conducted to confirm mesh reliability. The discretized model yielded an average skewness of 0.46 and an average element quality of 0.67. These values fall within the accepted range of mesh for complex geometries, ensuring that element distortion does not affect the simulation results [27].

2.6. Model Configurations and Region of Interests (ROIs)

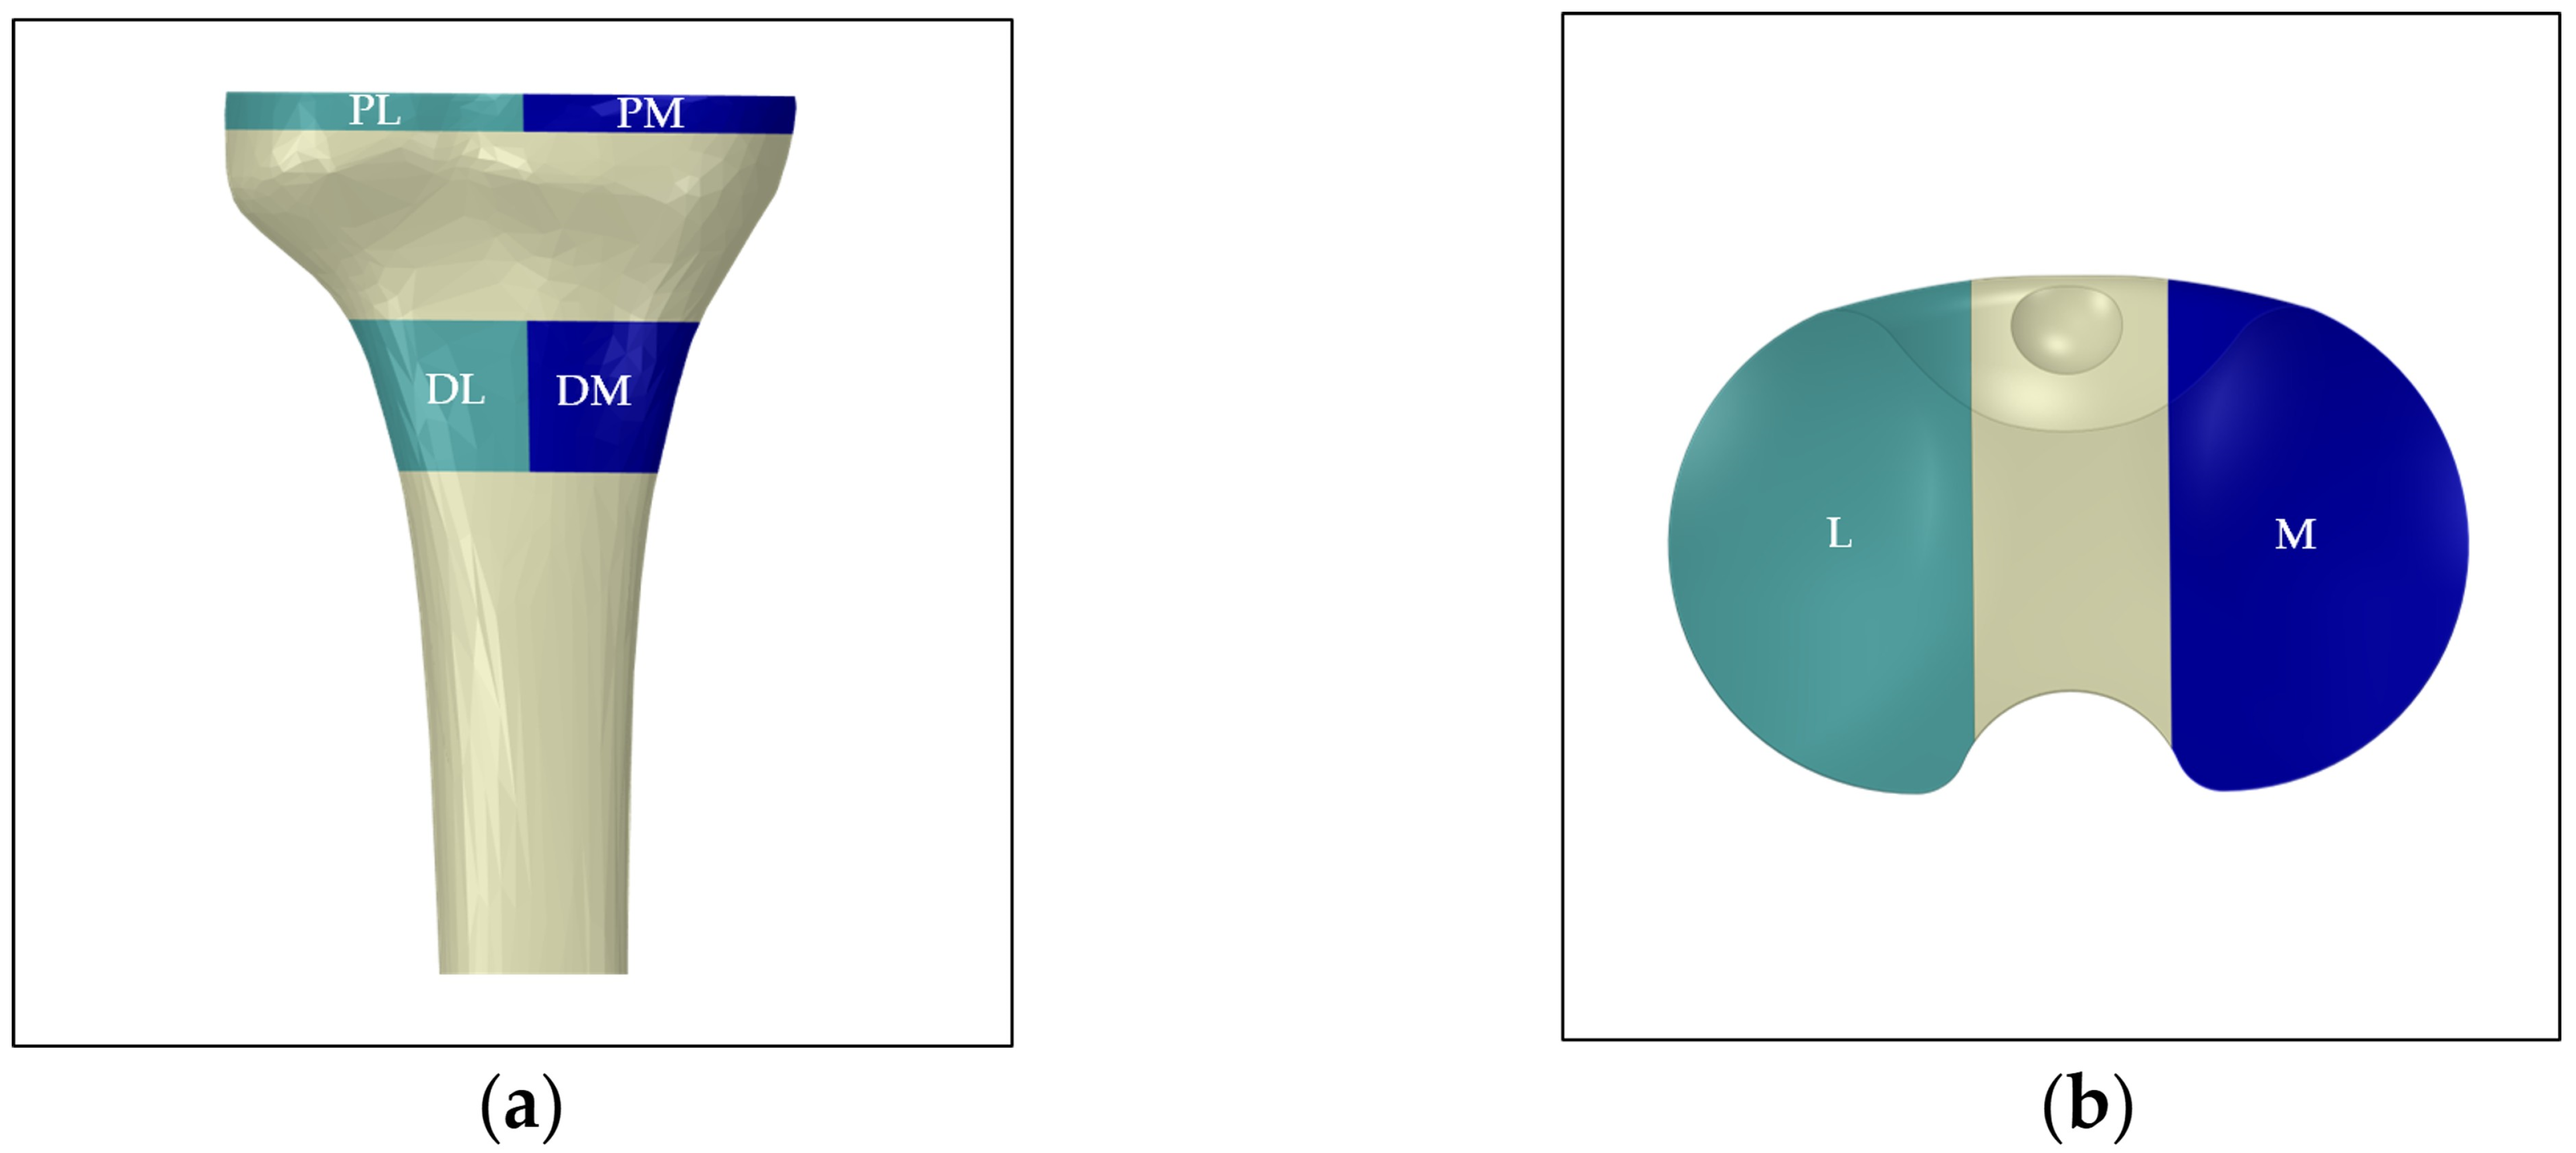
To analyze the distribution of stress on the tibia bone, four Regions of Interest (ROIs) [15,18] were defined on proximal and distal medial and lateral zones as shown in Figure 2a. From the tibial most upper cut surface, the proximal medial (PM) and proximal lateral (PL) were extended 5 mm towards the distal zone. The volume-weighted average von Mises stress was evaluated on these zones to compare the instantaneous load transfer from the prosthesis to the tibia bone. Similarly, distal medial (DM) and distal lateral (DL) regions, with a 20 mm thickness, were defined at 30 mm from the tibial most upper cut surface. These areas provided an overall assessment of the load distribution along the tibial shaft. Polyethylene insert was also evaluated with two ROIs, as shown in Figure 2b, respectively the medial and lateral sides as in the previous literature [15,18,21].
For each model configuration, these key parameters were evaluated: average von Mises stress on polyethylene insert, tibia bone, vector decomposition (tangential, axial) micromotion, along with total micromotion at the bone–implant interface and Normalized Sensitivity Coefficients (NSCs).

3. Results

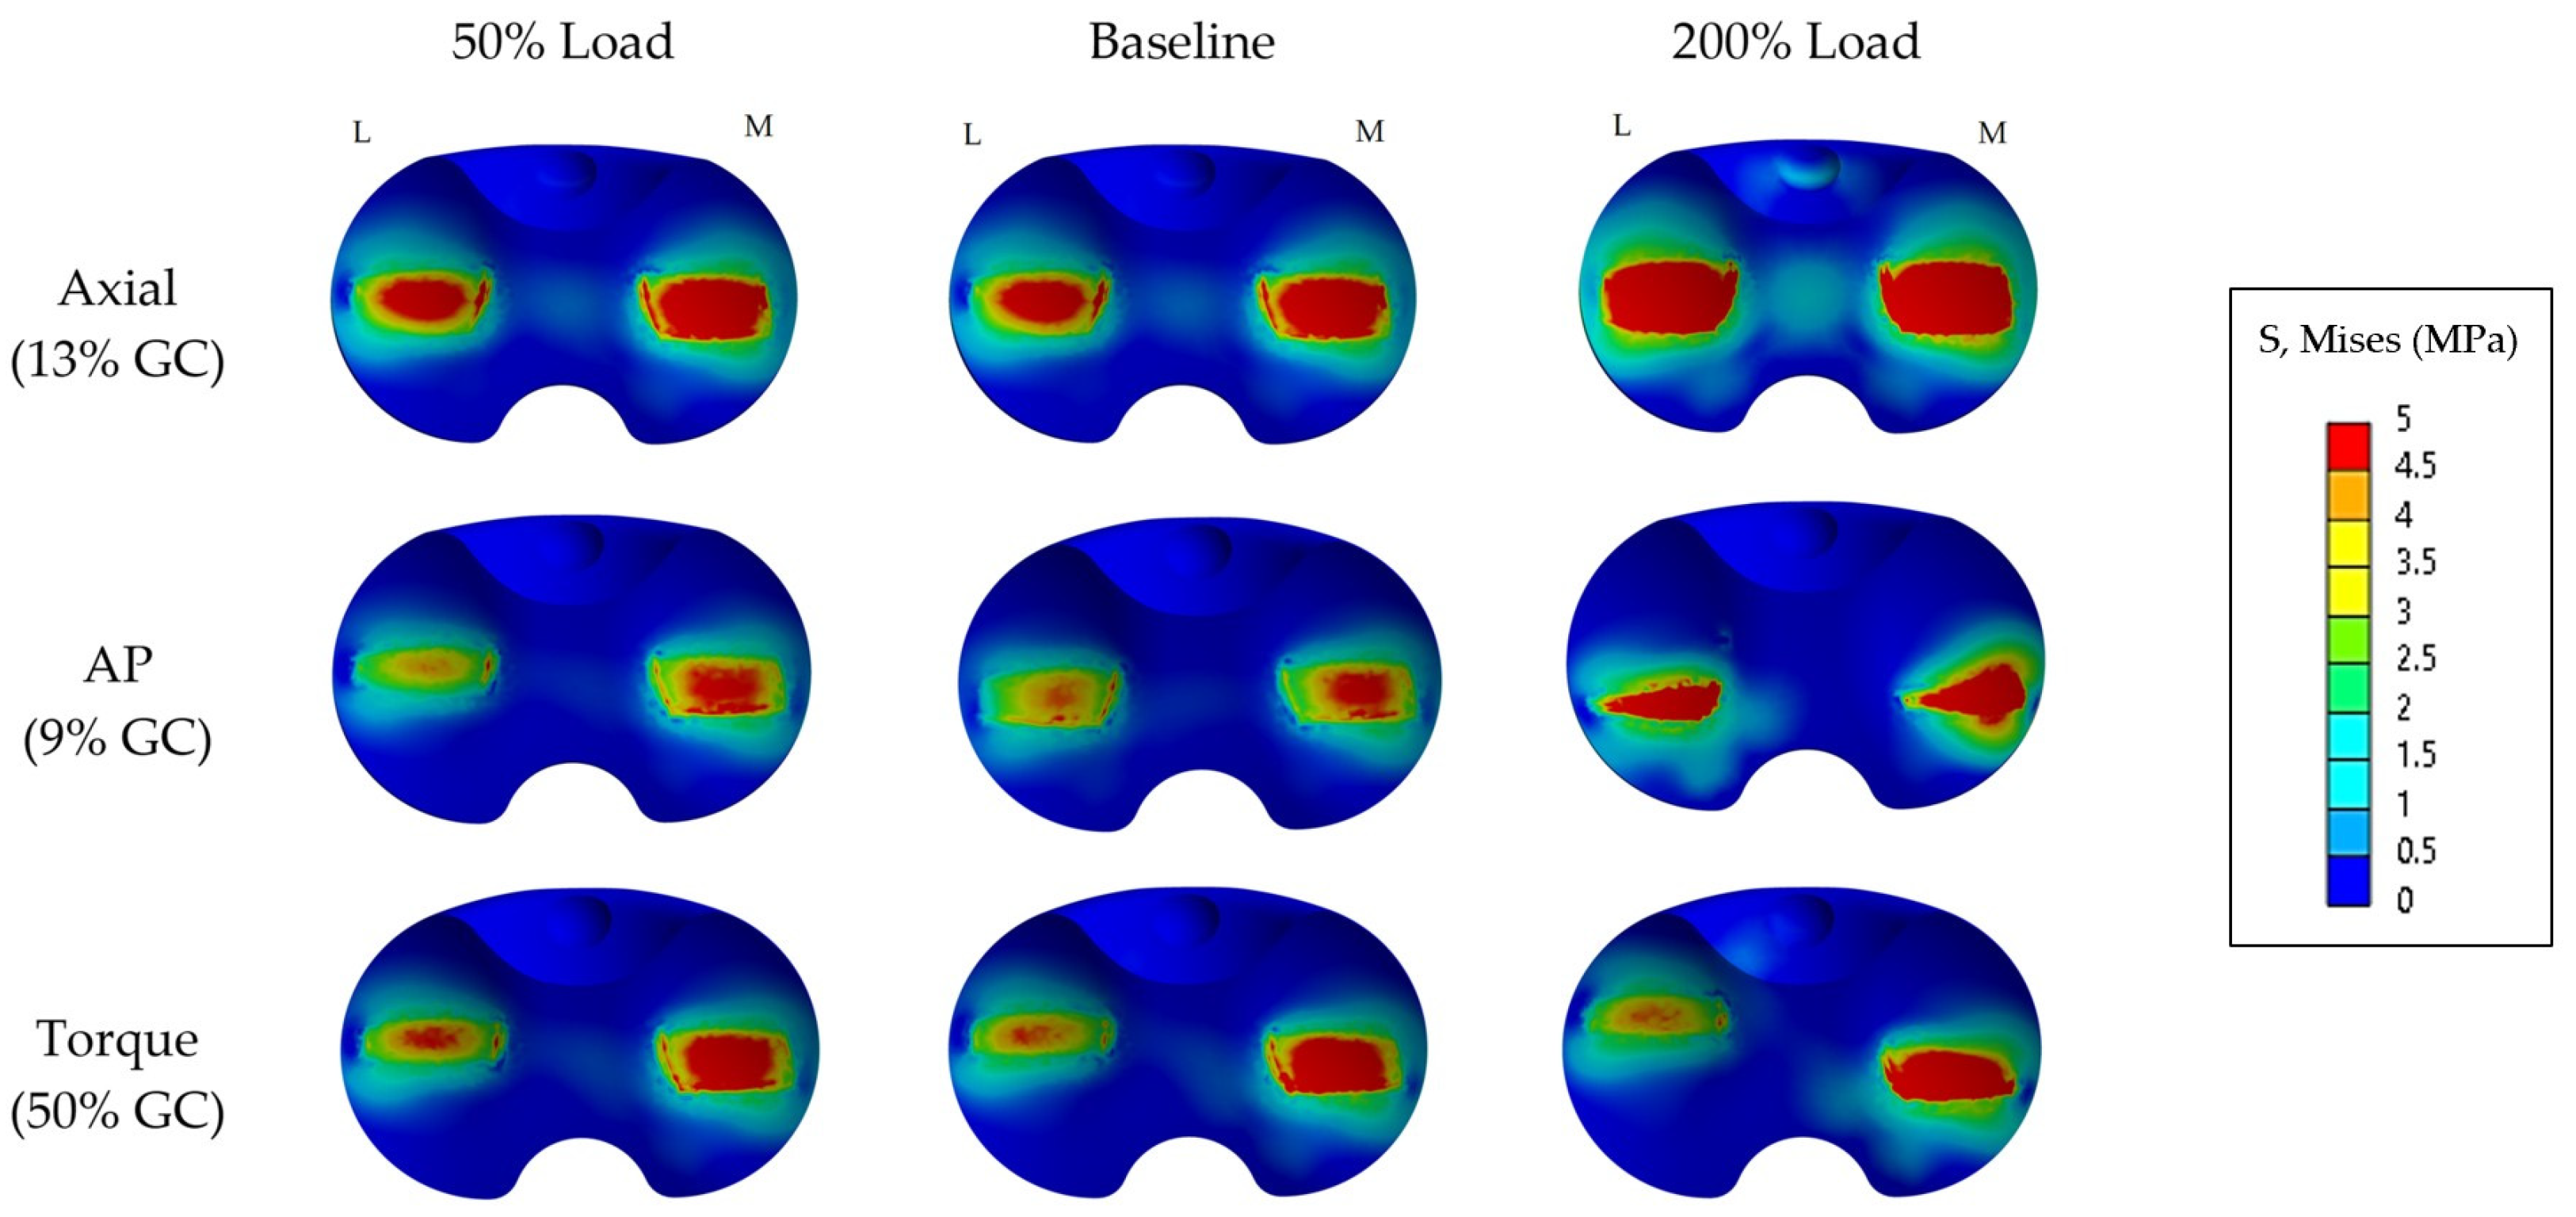
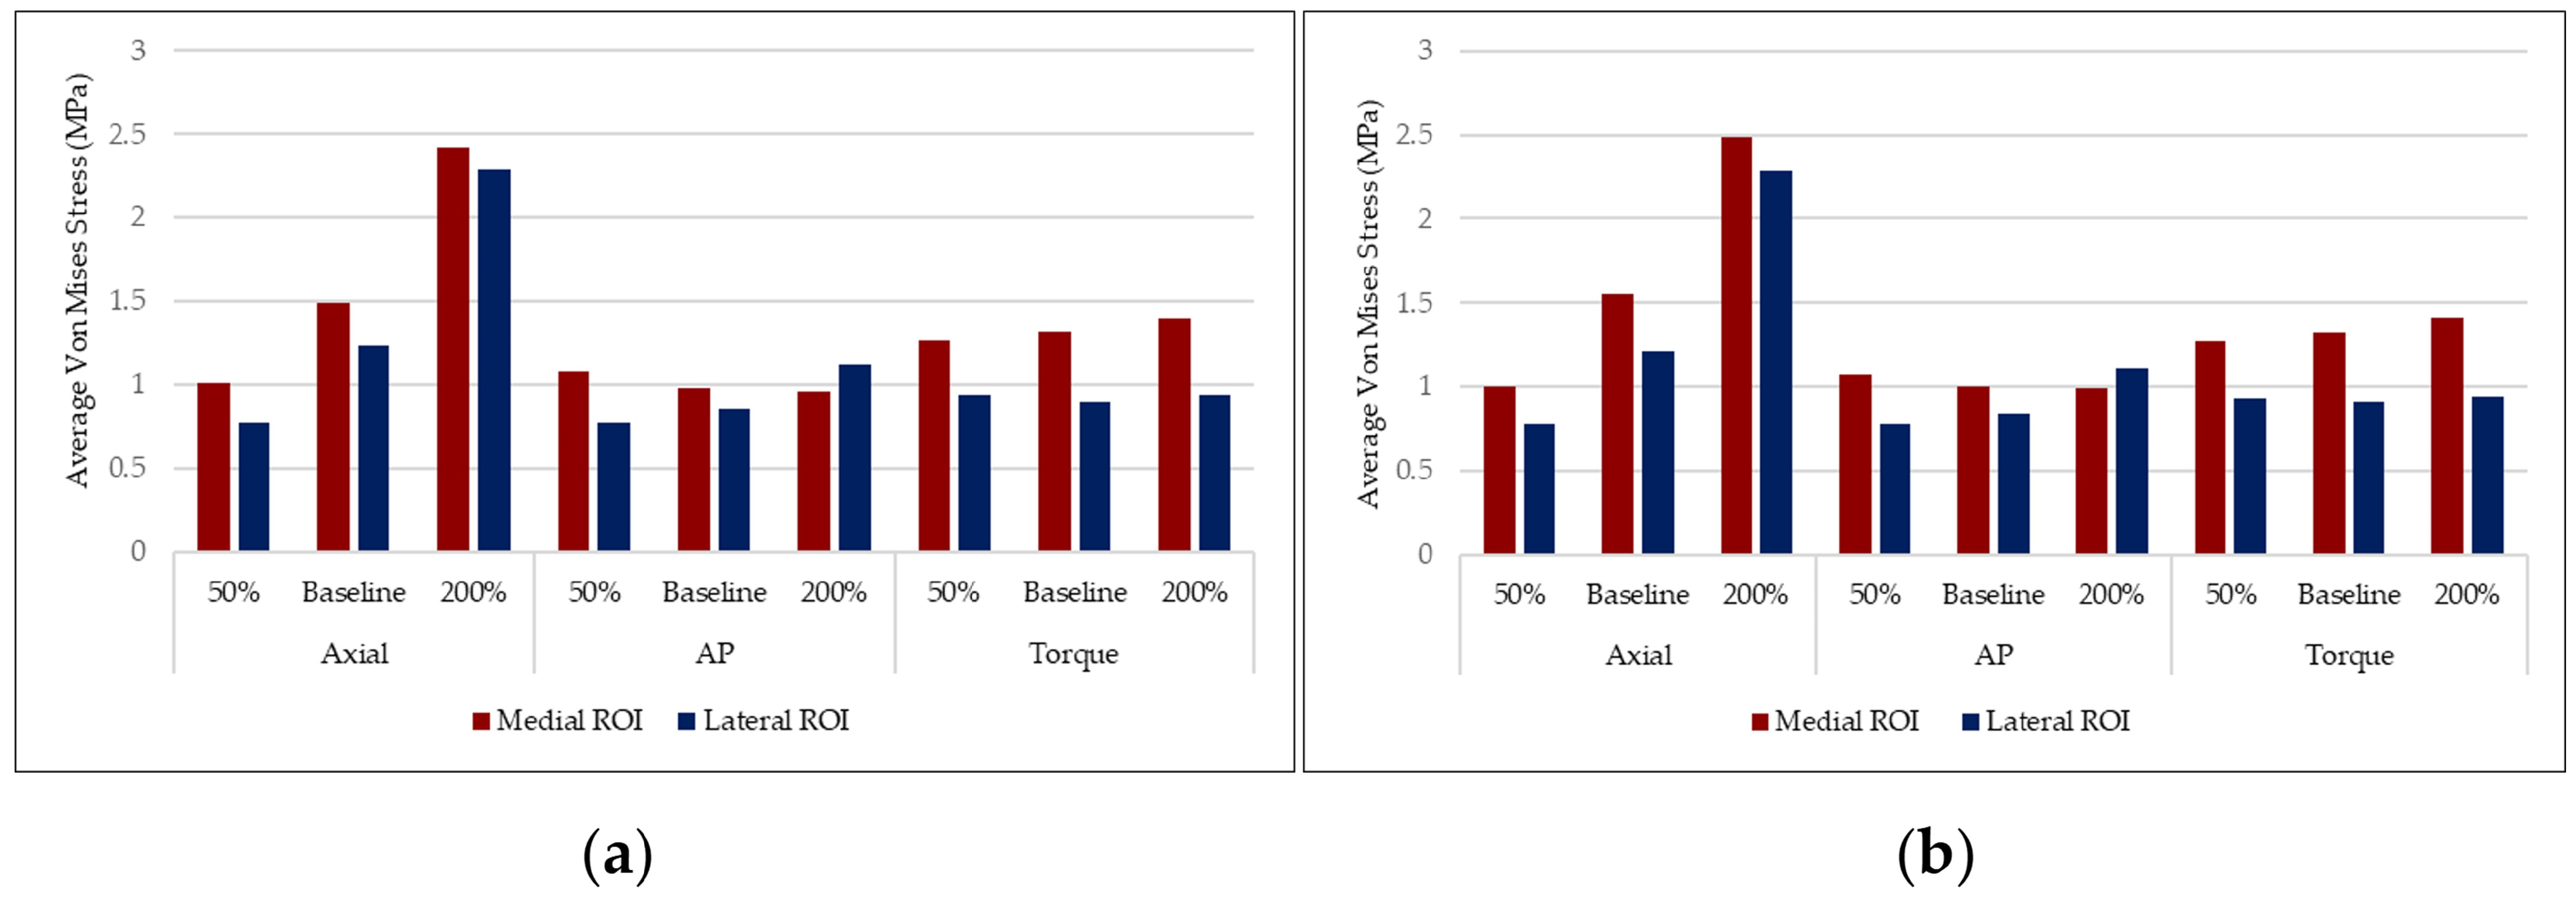
Figure 3 and Figure 4 represent respectively the qualitative and quantitative overview of average von Mises stress on the proximal surface of the polyethylene (tibial) insert. Although parametric scaling was applied across the entire 10-step GC, the displayed results isolate the critical peak instants for each evaluated force (axial at 13%, AP at 9%, and Torque at 50%) to assess the worst-case scenarios for structural safety. The overall results indicated that the insert experiences low stress level distributions, with peaks on the articulating surfaces with femoral condyles. The average medial and lateral values respectively remained under 2.5 MPa for both healthy and osteoporotic bone scenarios. Under the ISO standard baseline, 13% gait cycle (GC) where axial force peaks, the medial ROI resulted in an average stress of 1.5 MPa, whereas the lateral ROI resulted in an average stress of 1.2 MPa. From these approximated values, the calculated load distribution corresponded to a 55.6% medial to 44.4% lateral split, reflecting the natural knee asymmetrical kinetics, dominating on the medial plateau, during the stance phase of the gait.
A near linear trend was observed on the polyethylene insert during axial load scaling. Respectively, when the axial load was amplified to 200%, a maximum of 2.4 MPa internal stress was observed on the medial ROI and 2.3 MPa on the lateral ROI. As for the M/L load split, it approached a more symmetrical distribution corresponding to approximately 51.1% medial/48.9% lateral.
Variations in other kinetic vectors, respectively antero-posterior (AP) force and rotational torque altered the insert stress distribution in different ways. Variations in the AP force shifted the dominant load distribution laterally, where a 200% AP force resulted in a 47.6% medial/52.4% lateral split. Conversely, the application of rotational torque shifted the stress localization more medially, exhibiting an approximately 60.9% medial to 39.1% lateral split at 50% GC observance: its variation did not significantly alter the distribution. Comparing the 50%, baseline and 200% torque scaling scenarios, there is almost no deviation in stress magnitude or distribution, indicating that this asymmetry remains constant regardless of the magnitude the applied twisting force.
Importantly, there was no difference between healthy and osteoporotic models for the stress distribution and magnitude on the polyethylene insert.
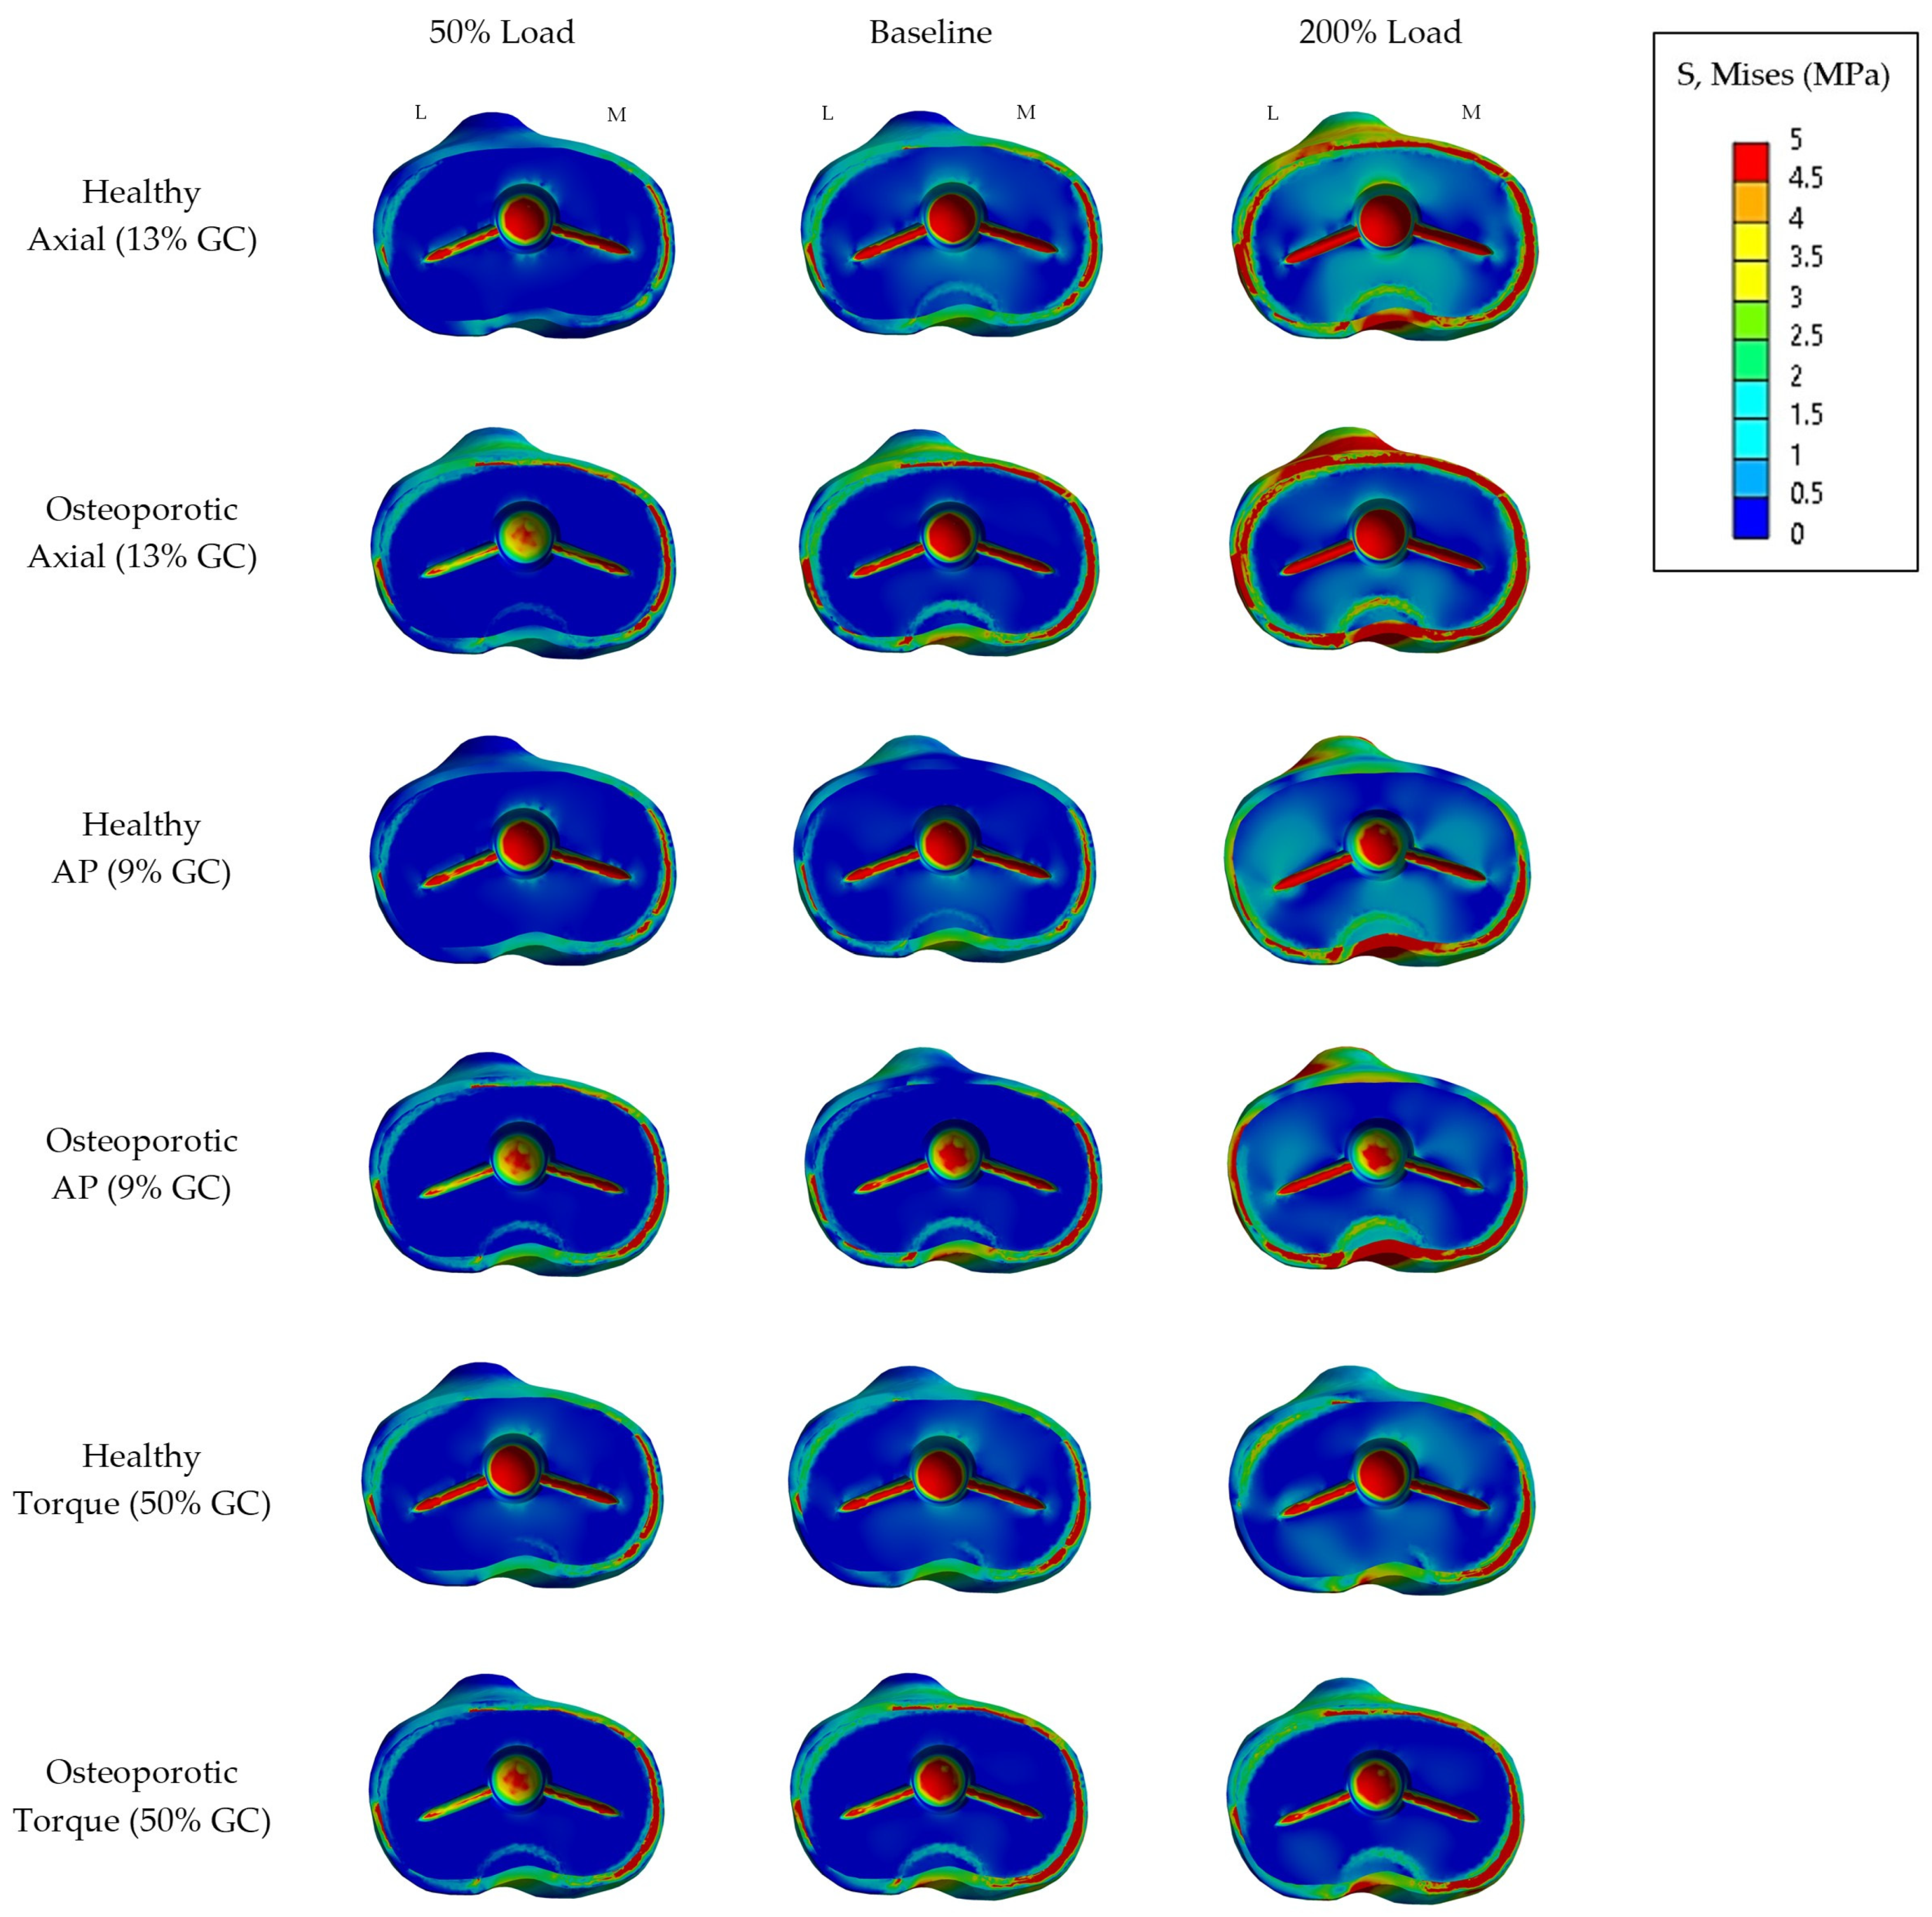
Figure 5 shows a qualitative overview of the average von Mises (MPa) stress on the proximal tibia surface (bone–implant interface) for all 14 selected representative scenarios.
To complement these findings, Table 3 represents a quantitative summary of the corresponding average von Mises stress values (MPa) for healthy and osteoporotic models under each simulated loading scenario.
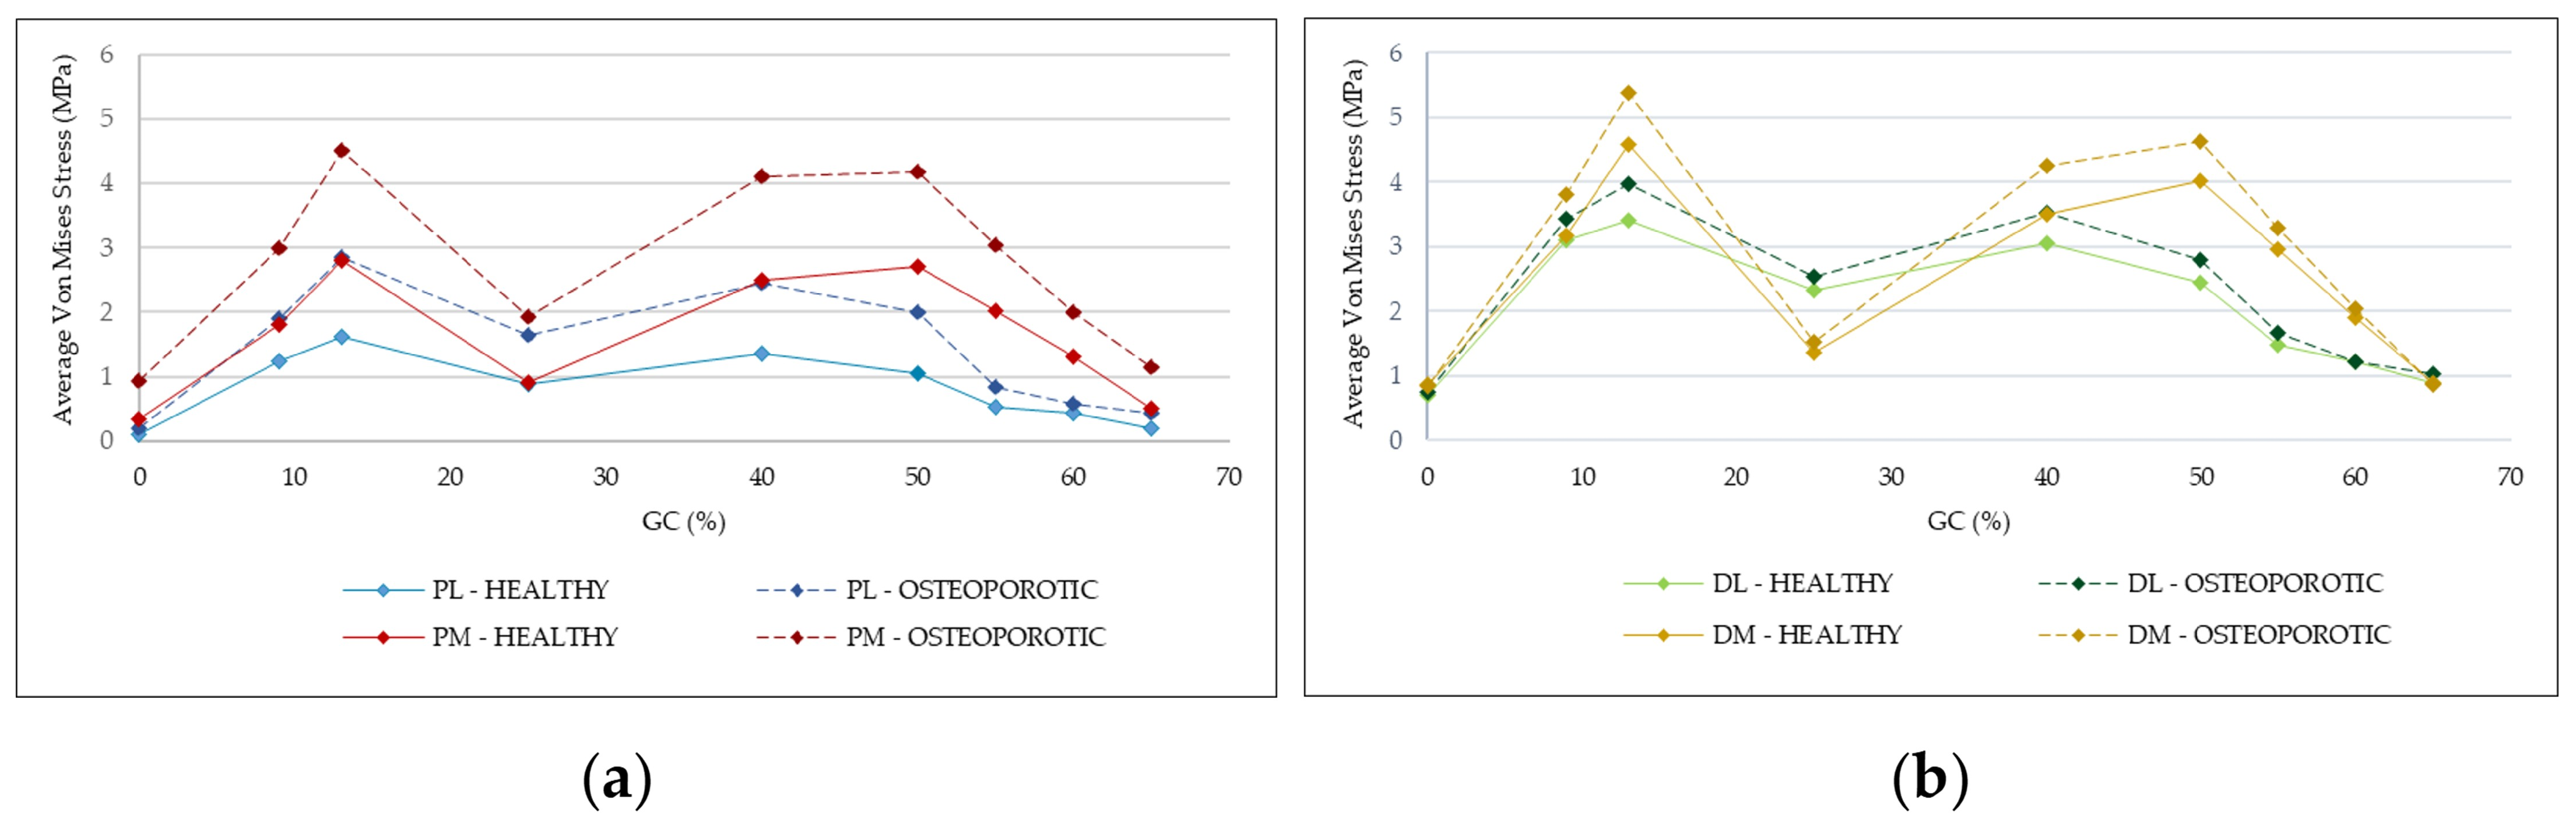
Figure 6 provides a quantitative overview of average von Mises stress on cortical tibia bone ROIs for the baseline gait cycle across healthy and osteoporotic models. As noticed at 13% GC (maximum axial load), the average stress peaks at the PM region with a magnitude of 2.8 MPa for the healthy bone model and 4.5 MPa for the osteoporotic one. Similarly on distal ROIs, the average stress on DM ROI peaks at 4.6 MPa on the healthy model, and 5.4 MPa on the osteoporotic one. The lateral ROIs followed a similar trend but with lower magnitudes, respectively 1.6 MPa (healthy) and 2.9 MPa (osteoporotic) on DM ROI, and 3.4 MPa (healthy) to 3.9 MPa (osteoporotic) on DL ROI. The M/L split was maintained medially dominant at most of the GC.
Table 4 summarizes the maximum tangential, axial and total absolute micromotion (µm) yielded at the bone–implant interface across the entire GC for all the tested scenarios. The results revealed that the interface micromotion was primarily driven by tangential shear along the resected proximal tibia surface, while the axial subsidence remained relatively minimal. The total absolute peak value for the baseline was recorded at 19 microns (µm) comprising 19 µm tangential and 3 µm axial micromotion. Across the healthy models, the maximum recorded total value occurred under 200% axial scaling, at 29 µm. The 200% scale of AP force influenced the interface stability, exhibiting a 23 µm total absolute micromotion, whereas the 50% scale demonstrated almost identical value with the baseline (19 µm), indicating a strong frictional resistance under standard compressive loads.
In contrast the osteoporotic models exhibited significantly higher values in all varied loading conditions, typically recording approximately doubled magnitude compared to the healthy counterparts. During the ISO standard baseline GC, the total maximum micromotion value reached 37 µm (comprising 37 µm tangential and 6 µm axial micromotion), increasing to 45 µm under 200% AP force and reaching an absolute maximum value of 63 µm (primarily driven by 62 µm of tangential slip) under 200% axial force scenario.
An interesting behavior was demonstrated in the scaled rotational torque scenarios, where under healthy bone conditions, a proportionally scaled total micromotion was exhibited, rising from 18 µm at 50% torque to 23 µm at 200% torque. Conversely, the osteoporotic bone conditions displayed a slightly inversed trend, with total micromotion of 38 µm for the 50% torque, and 37 µm for the 200% torque. This indicates that extreme torque magnitude leads to a firm seating of the implant in the cancellous bone, where axial micromotion stabilizes at approximately 6 µm, effectively acting as mechanical constraint restricting further tangential sliding.
To assess how well the TKA healthy and osteoporotic models withstand extreme kinetic variations, a normalized sensitivity framework was utilized. The sensitivity was quantified using Normalized Sensitivity Coefficients (NSCs) defined as the ratio of the fractional change in the biomechanical output with fractional change in input load component. For key reported parameters such as average stress on insert (medial ROI), average stress on proximal tibia interface, and total absolute micromotion, the NSCs were calculated at both 50% and 200% for all input loads, as represented in Table 5. Across all loading conditions, overall average stress and interface micromotion demonstrated a stable sub-linear response (NSC < 1.0). Importantly, the bone–implant interface revealed negligible sensitivity to extreme AP and rotational torque inputs. Particularly, in the osteoporotic models, the kinematic NSC approached close to zero (NSC < 0.01), indicating neutralization of these shear and torsional loads, by preventing micromotion increment regardless of the input magnitude.

4. Discussion

This study performed a finite element sensitivity analysis to evaluate the biomechanical performance of one design of FB CR TKA prosthesis under the influence of kinetic variability and compromised bone quality. All models across healthy and osteoporotic bone conditions were evaluated in terms of polyethylene and tibial bone average von Mises stresses, and bone–implant interface tangential, axial and total micromotion.
The obtained simulation results revealed that the FB CR articular surface exhibited a direct dependence on varied kinetic loading conditions, but was largely unaffected in decreased bone quality [13,21,28]. Previous studies have also demonstrated the sensitivity of different implant designs under load variations [26,29,30] which were proven to be more sensitive and showed higher influence by AP shear and internal–external torques compared to more constrained designs. The average stress values on the insert remained below 2.5 MPa, which is safely below the ultimate yield strength of polyethylene, ensuring that the insert is within the mechanical safety ranges for all tested scenarios [31,32].
Nevertheless, the quantitative analysis of the load distribution on the insert demonstrated that the M/L split is highly sensitive to the specific kinetic vector orientation and, depending on the force type, its magnitude. Under the gait cycle baseline conditions, the medial side experienced higher contact stresses; under extreme axial, it loads demonstrated more equal stress distribution. Exertion of the extreme AP shear loads resulted in a significant shift in the stress distribution from the medial to the lateral compartment. Conversely, while the torque introduction led to a highly asymmetrical medial dominant stress profile, its distribution proved to be entirely independent of torque magnitude, indicating that the design of the FB-CR tray prevents the insert from shifting, and locks the system into an uneven load distribution at the peak torque values.
This dynamic variation on articular contact stress distribution may influence the long-term multi-axial wear pattern, especially for heavier and highly active patients who are exposed to diverse loadings. Mell et al. [9] similarly evaluated the NextGen CR implant by scaling the magnitudes of baseline kinematic and kinetic peaks from 75% to 125%. Although their findings indicated that no single parameter dominated the variability on wear, they concluded that the wear rates are highly dependent on the interactions of these parameters with other factors, such as patient-specific ones, noting that considerable variability occurs even within the tolerances permitted by ISO standards. Notably, this study extends their foundation by applying a broader parametric kinetic range (50–200%), therefore capturing extreme boundary conditions that can reflect more accurately the high-risk patient-specific loading conditions. Whereas their framework included variation in kinematic factors such as flexion angles, the present model constrains kinematics to a constant angle at each gait cycle phase. This controlled approach allowed assessment of pure kinetic effects, understanding how load magnitude, orientation and bone quality independently affect the stress contours.
It is important to note the origin of the non-linear mechanical behavior observed across all the models. Since the material properties were modeled as linear elastic, and the macroscopic structural deformations were assumed infinitesimal, the observed nonlinear relationship between the applied load magnitudes and von Mises stresses is primarily driven by the boundary conditions, particularly the frictional contact formulation. As the load varies, the frictional contact formulation updates the contact patch and nodal states. From the evaluation of contact status, the articular and bone–implant contact areas actively evolve in the distribution of the applied load vectors without experiencing macroscopic separations or tensile lift off. This means that the interfaces maintain a purely compressive primary stability during the entire gait cycle.
Differences in the average stress distribution were observed on the tibia bone–implant interface and cortical tibia ROIs between healthy and osteoporotic models, particularly more prominent under 200% kinetic variation. The load transfer shifts from the center cancellous bone to the peripheral cortical bone, suggesting potential stress shielding phenomena [33]. Since the osteoporotic bone possesses a drastically reduced elastic modulus, it cannot provide adequate structural support against the implant tray. As a result, variations in extreme loading conditions on the osteoporotic model led to a more severe localized stress concentration, which raises concern of potential future periprosthetic micro-fractures and risk associated with medial plateau breakage. Alternative ways to mitigate this risk, according to Completo et al. [34], would be through optimized implant designs particularly on the stem length and diameter, which have shown promising improved biomechanical load transfer and reduced implant failure.
To evaluate the primary stability of the implant, the bone–implant interface was analyzed in terms of tangential, axial and total absolute micromotion. The observed results show that the FB CR prosthesis under press-fit modeling maintained high stability in the healthy bone model even under extreme kinetic conditions. In all the healthy bone models with varied kinetic conditions, the total absolute micromotion (peaking at 29 µm) remained consistent below the clinical threshold of 40–150 µm, allowing for bone ingrowth and stable implant fixation [35]. Vector breakdown micromotion showed that the interface was heavily influenced from the tangential sliding, whereas the axial micromotion remained negligible due to the rigid support provided by the healthy bone. These findings highlight that shear displacement alters the interface whereas normal (axial) restriction reinforces stability across the resected proximal tibia plane.
As for the osteoporotic models, the micromotion values were approximately twice as high as these of the healthy models (peaking at 63 µm). While theoretically the recorded peak values remain below the biological threshold for fibrous encapsulation, they demonstrated that interface kinematics was heavily driven by tangential shear and any sub-threshold peak value can mechanically disrupt early micro-attachment on cancellous bone which can lead to partial bone ingrowth [35,36,37]; it is necessary to carefully monitor poor bone quality patients, particularly older ones. The combination of extreme kinetic profile with reduced bone quality can delay osteogenesis and increase the risk of aseptic loosening [38,39].
Gong et al. [28] reported similar findings in their evaluations of varied degrees of bone quality, indicating that the bone–implant micromotion exceeded the bone ingrowth biological threshold when the elastic modulus was reduced by 60%. This directly supports our results, where a 66% reduction in modulus for cancellous bone demonstrated the highest peak micromotion near the limit of osseointegration biological threshold. Furthermore, our data highlighted that the interaction between osteoporotic bone with varied kinetic profiles alters fixation mechanics. Unlike the proportional behavior observed in the healthy bone under variation in rotational torque, the osteoporotic bone behavior shifted from a pure horizontal slip to a further localized subsidence behavior, demonstrating an increase in axial penetration on the compromised cancellous bone, which can lead to higher risk of micro-tilting and progressive sinking. Clinically, these results imply that standard uncemented press-fit modeling is likely sub-optimal for patients with severe bone density deficit. However, to fully establish and conclude an optimal clinical approach, for this high-risk patient group, future computational investigation should be done to evaluate alternative stabilization scenarios, such as different fixation of the implant (fully cemented tray component), or utilization of a varied tray stem. While these findings underscore further preclinical investigations, a deeper sensitivity assessment confirms that biomechanical stability is preserved.
A formal sensitivity framework, as represented in Table 5, provided strong mathematical evidence for the reliability of the implant design, even under osteoporotic bone conditions. While extreme variations in axial loading resulted in the highest stress gradients, the observed response remained sub-linear (NSC 0.59–0.91 < 1.00). Notably, the sensitivity of the bone–implant interface to AP shear and rotational torque-twisting inputs was remarkably low, recording a negligible impact (absolute NSC < 0.01) on total micromotion. Biomechanically speaking, this near-zero sensitivity indicates robust primary mechanical stability. Once the implant achieves a firm seating within the cancellous bone, its design geometry and interfacial friction act as a constraint against further subsidence, effectively neutralizing the extreme kinetic profiles.
Even though the findings of this study align with existing literature, there are various limitations mainly associated with the assumptions made for the FE models. All the materials were considered homogeneous and linearly elastic, which is well-established from previous protocols [15,16,18]; non-homogeneous properties are common in terms of tibia bone. Another assumption was made in terms of ligaments, which have 1D spring/beam elements and may not capture the full anatomical features. However, the validity of their establishment is widely used in the literature [15,16,18,40]. There was no femur bone included in this study, and the ligaments were attached to the femoral component, which may over-constrain their behavior. Nevertheless, the model is valid and there are well-established [21,41,42,43] protocols implementing this FE model to reduce computational cost and simulation time. Apart from the collateral ligaments and PCL, other surrounding soft tissue (such as muscles) were not explicitly incorporated in the model; however, their influence was indirectly accounted from the applied loading conditions. The bone model was a synthetic bone, which may not account for bone anatomy and deformity variations that would alter the final TKA results. The implant was positioned based on mechanical alignment (MA), which is a well-known standard for TKA alignment [44,45,46]; however, for patients with varus-valgus deformation it may not count as the optimal alignment. Additionally, only single TKA implant design was evaluated, particularly the fixed-bearing cruciate-retaining prosthesis; the observed results may not directly generalize to alternative designs such as mobile bearing configurations. The study is quasi-static and focused exclusively on the stance phase of GC, which means it accounts for critical kinetic loading profiles but does not account for kinematics and the swing phase, which limits the understanding of knee dynamics under daily activities. Future studies will include knee kinematics factors, the full gait cycle, different implant designs, alignment and fixation methods for a more comprehensive comparison.

5. Conclusions

This study evaluated the biomechanical behavior of a FB CR TKA configuration under variable loading and bone quality. The prosthesis exhibited a satisfactory performance in the healthy bone model, even under extreme kinetic profiles. However, reduced bone quality combined with kinetic variability influenced the tibial stress distribution and primary stability. While bone quality did not affect the polyethylene insert, the insert demonstrated a high distributional sensitivity to load vector variations, significantly altering the stress pattern and magnitude in terms of the medial/lateral split. The increased interface micromotion and severe localized stress on the cortical rim observed in osteoporotic models represent preclinical implications for prosthesis selection and fixation strategies that require further experimental validation.

Author Contributions

Conceptualization, B.I. and M.S.; methodology, S.M., B.I. and M.S.; software, S.M.; validation, S.M., B.I. and M.S.; formal analysis, S.M.; investigation, S.M., B.I. and M.S.; resources, B.I. and M.S.; data curation, S.M.; writing—original draft preparation, S.M.; writing—review and editing, B.I. and M.S.; visualization, S.M.; supervision, B.I. and M.S.; project administration, B.I. and M.S. All authors have read and agreed to the published version of the manuscript.

Funding

This research received no external funding.

Institutional Review Board Statement

Not applicable.

Informed Consent Statement

Not applicable.

Data Availability Statement

Additional data can be provided upon reasonable request.

Acknowledgments

We would like to thank Adler Ortho® for providing the 3D models of the TKA implants used in the finite element analysis presented in this study.

Conflicts of Interest

The authors declare no conflicts of interest.

Abbreviations

AAnterior
aMCLAnterior Medial Collateral Ligament
AP Anterior–Posterior
CRCruciate Retaining
DMDistal Medial
DLDistal Lateral
DOFs Degrees of Freedom
FBFixed Bearing
FEAFinite Element Analysis
LLateral
LCLLateral Collateral Ligament
MMedial
MAMechanical Alignment
MCLMedial Collateral Ligament
PPosterior
PCLPosterior Cruciate Ligament
pMCLPosterior Medial Collateral Ligament
PMProximal Medial
PLProximal Lateral
ROIsRegions of Interest
TKATotal Knee Arthroplasty

Appendix A

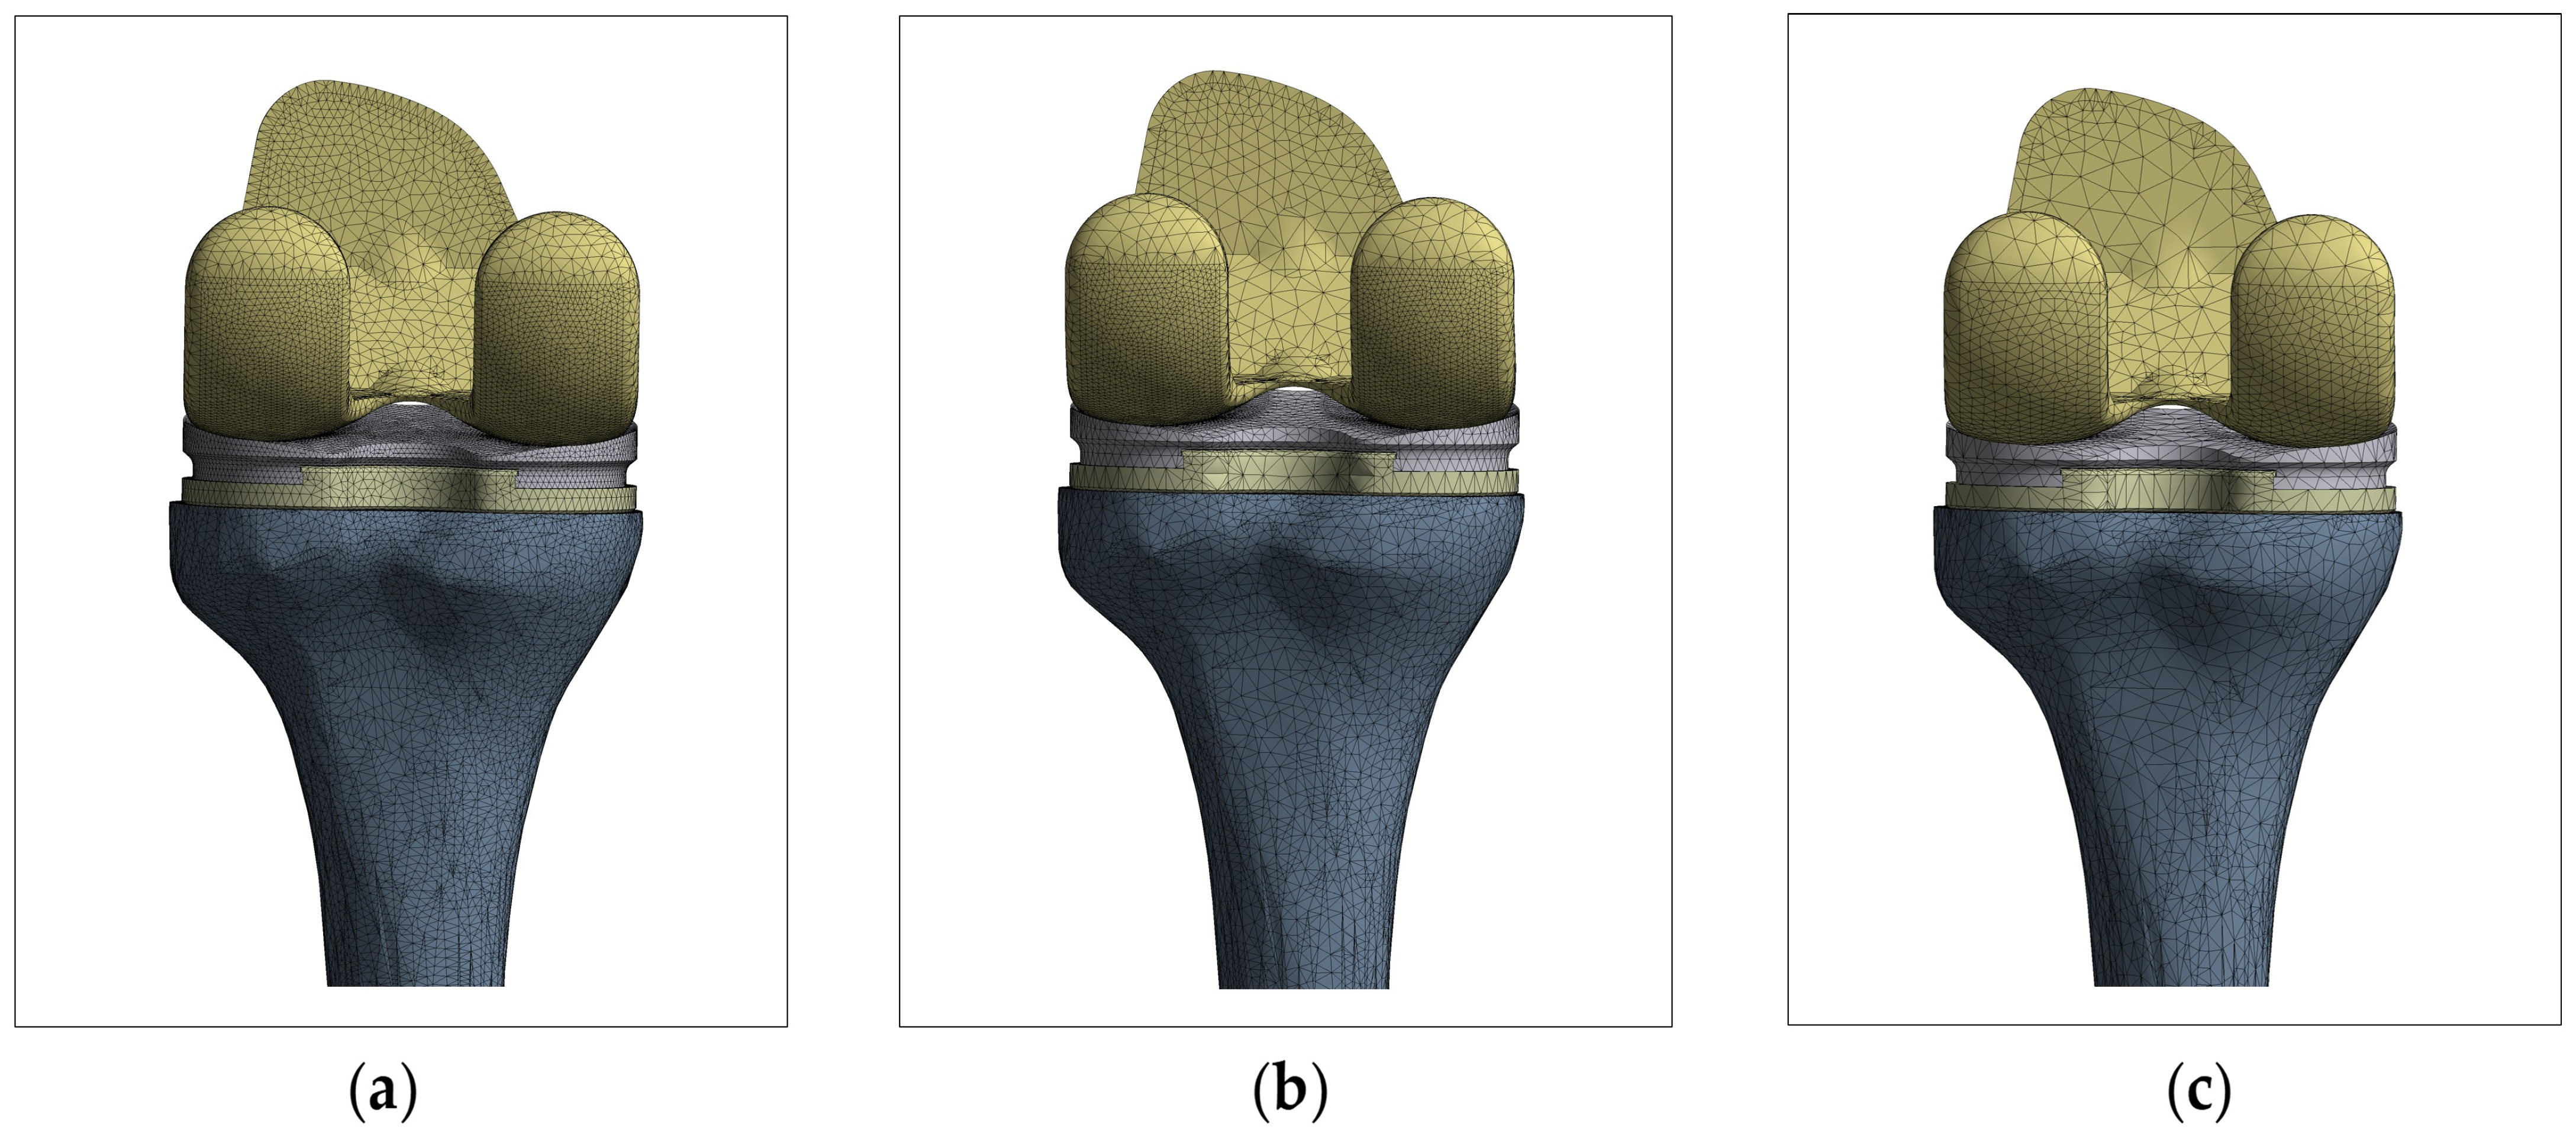
To provide a quantitative assessment of the numerical precision and resolution limits, a mesh convergence study was conducted. The baseline mesh size was varied to a coarser configuration (200%) and to a finer configuration (50%) on the worst-case parametric scenario (osteoporotic bone condition under 200% axial load scaling), illustrated in Figure A1.
Figure A1. Mesh sensitivity analysis models demonstrating the three tested element density variations: (a) 50% finer mesh, (b) the validated baseline mesh, and (c) 200% coarser mesh.
Applsci 16 06731 g0a1
The global and local biomechanical outputs were extracted for each mesh size variation, and presented in Table A1, to investigate the difference. A maximum average von Mises stress of 6.49 MPa was observed for the coarser (200% element) mesh, stabilized at 6.19 MPa for the baseline mesh, and 6.55 MPa for the finer mesh (50% element sizes). The calculated deviation between the baseline and finer mesh in terms of peak average stress resulted in 5.7%. Similarly, the max. average insert stress resulted in 3.3% difference between the baseline and the finer meshed model. At the global level, the selected element size is optimal with no significant difference. Localized interfacial kinematics evaluation, such as peak total micromotion (μm) demonstrated a shift from 70 μm for the coarse mesh, to 63 μm for the baseline mesh and 85 μm for the fine mesh, with a significant difference of 29.7% between the baseline to 50% element size variation. Due to non-linear frictional contact at sharp implant–bone edges, and the investigation of the worst-case scenario (osteoporotic condition with 200% axial load) this variance mathematically can be expected. Importantly, it still stays within the 40–150 μm clinical threshold for bone ingrowth. Consequently, to reflect more accurately the true resolution limit of the FE model based on this variance, micromotion values throughout this study are reported as whole integers. The baseline mesh was maintained for the full study, since it proved global convergence without introducing the need for higher computational cost and time.
Table A1. Mesh convergence and sensitivity matrix quantifying numerical precision and resolution limits for global and localized biomechanical outputs for osteoporotic bone under 200% axial scaling scenario.
Biomechanical OutputCoarse Mesh (200%)Baseline MeshFine Mesh (50%)% Difference
(Baseline vs. Fine)
Max. Average Tibia Stress (MPa)6.496.196.555.7%
Max. Average PE Insert Stress (MPa)2.212.402.483.3%
Peak Total Tibial Displacement (mm)1.100.830.863.6%
Peak Tangential Micromotion (μm)68628430.1%
Peak Axial Micromotion (μm)16111316.7%
Peak Total Micromotion (μm)70638529.7%
Peak PE Insert Stress (MPa)10.9312.2314.7118.4%

References

  1. Varacallo, M.; Johanson, N.A. Total Knee Arthroplasty (TKA) Techniques; StatPearls Publishing: Treasure Island, FL, USA, 2018. [Google Scholar]
  2. Dalury, D.F. Cementless Total Knee Arthroplasty: Current Concepts Review. Bone Jt. J. 2016, 98, 867–873. [Google Scholar] [CrossRef] [Scilit]
  3. Gundle, R.; Pandit, H. Results of Cruciate Retaining Total Knee Arthroplasty. Curr. Orthop. Pract. 2008, 19, 155–159. [Google Scholar] [CrossRef] [Scilit]
  4. Thippanna, R.K.; Mahesh, P.; Kumar, M.N. PCL-Retaining versus PCL-Substituting TKR—Outcome Assessment Based on the “Forgotten Joint Score”. J. Clin. Orthop. Trauma 2015, 6, 236–239. [Google Scholar] [CrossRef] [Scilit] [PubMed]
  5. Phillips, M.; Davis, C.; Civinini, R.; Ebied, A.; Carbo, L.; Mahapatra, A.; Ong, M.; Ekhtiari, S. Is There a Difference Between Posterior-Stabilized, Cruciate-Retaining, or Medial-Pivot Implants Used During Primary Total Knee Arthroplasty? J. Arthroplast. 2025, 40, S75–S78. [Google Scholar] [CrossRef] [Scilit]
  6. ISO 14243-1:2009; Implants for Surgery. Wear of Total Knee-Joint Prostheses. Loading and Displacement Parameters for Wear-Testing Machines with Displacement Control and Corresponding Environmental Conditions for Test. British Standards Institution: London, UK, 2009.
  7. Kowalski, E.; Catelli, D.S.; Dervin, G.; Lamontagne, M. Knee Biomechanics Variability before and after Total Knee Arthroplasty: An Equality of Variance Prospective Study. Sci. Rep. 2024, 14, 2673. [Google Scholar] [CrossRef] [Scilit] [PubMed]
  8. Smith, J.W.; Christensen, J.C.; Marcus, R.L.; LaStayo, P.C. Muscle Force and Movement Variability before and after Total Knee Arthroplasty: A Review. World J. Orthop. 2014, 5, 69–79. [Google Scholar] [CrossRef] [Scilit] [PubMed]
  9. Mell, S.P.; Wimmer, M.A.; Lundberg, H.J. Sensitivity of Total Knee Replacement Wear to Variability in Motion and Load Input: A Parametric Finite Element Analysis Study. J. Orthop. Res. 2020, 38, 1538–1549. [Google Scholar] [CrossRef] [Scilit] [PubMed]
  10. Kutzner, I.; Heinlein, B.; Graichen, F.; Bender, A.; Rohlmann, A.; Halder, A.; Beier, A.; Bergmann, G. Loading of the Knee Joint during Activities of Daily Living Measured in Vivo in Five Subjects. J. Biomech. 2010, 43, 2164–2173. [Google Scholar] [CrossRef] [Scilit] [PubMed]
  11. Zimmerman, W.F.; Miller, M.A.; Cleary, R.J.; Izant, T.H.; Mann, K.A. Damage in Total Knee Replacements from Mechanical Overload. J. Biomech. 2016, 49, 2068–2075. [Google Scholar] [CrossRef] [Scilit] [PubMed]
  12. Zhao, G.; Luo, J.; Ma, J.; Wang, J. Decreased Stress Shielding with Poly-Ether-Ether-Ketone Tibial Implant for Total Knee Arthroplasty—A Preliminary Study Using Finite Element Analysis. Heliyon 2024, 10, e27204. [Google Scholar] [CrossRef] [Scilit] [PubMed]
  13. Senesi, G.; Barone, G.; Pinelli, S.; Scoppolini Massini, M.; Zinno, R.; Alesi, D.; Pinelli, E.; Bragonzoni, L. The Relationship between Stress Shielding, Bone Density Changes and Implant Migration, Failure and Fracture after Total Knee Arthroplasty: A Systematic Review. J. Exp. Orthop. 2025, 12, e70350. [Google Scholar] [CrossRef] [Scilit] [PubMed]
  14. Innocenti, B.; Bori, E.; Armaroli, F.; Schlager, B.; Jonas, R.; Wilke, H.J.; Galbusera, F. The Use of Computational Models in Orthopedic Biomechanical Research. In Human Orthopaedic Biomechanics: Fundamentals, Devices and Applications; Academic Press: London, UK, 2022. [Google Scholar]
  15. Castellarin, G.; Bori, E.; Rapallo, L.; Pianigiani, S.; Innocenti, B. Biomechanical Analysis of Different Levels of Constraint in TKA during Daily Activities. Arthroplasty 2023, 5, 3. [Google Scholar] [CrossRef] [Scilit] [PubMed]
  16. Russo, A.; Sisella, M.; Carrara, A.; Giacoppo, N.; Costa, G.G.; Zocco, G.; Innocenti, B. Increased Varus Deformity Requires Greater Personalisation of Alignment: A Finite Element Biomechanical Study. J. Exp. Orthop. 2025, 12, e70482. [Google Scholar] [CrossRef] [Scilit] [PubMed]
  17. Blankevoort, L.; Huiskes, R. Ligament-Bone Interaction in a Three-Dimensional Model of the Knee. J. Biomech. Eng. 1991, 113, 263–269. [Google Scholar] [CrossRef] [Scilit] [PubMed]
  18. Innocenti, B.; Fekete, G.; Pianigiani, S. Biomechanical Analysis of Augments in Revision Total Knee Arthroplasty. J. Biomech. Eng. 2018, 140, 111006. [Google Scholar] [CrossRef] [Scilit] [PubMed]
  19. Heiner, A.D. Structural Properties of Fourth-Generation Composite Femurs and Tibias. J. Biomech. 2008, 41, 3282–3284. [Google Scholar] [CrossRef] [Scilit] [PubMed]
  20. Rho, J.Y.; Hobatho, M.C.; Ashman, R.B. Relations of mechanical properties to density and CT numbers in human bone. Med. Eng. Phys. 1995, 17, 347–355. [Google Scholar] [CrossRef] [Scilit] [PubMed]
  21. Brihault, J.; Navacchia, A.; Pianigiani, S.; Labey, L.; De Corte, R.; Pascale, V.; Innocenti, B. All-Polyethylene Tibial Components Generate Higher Stress and Micromotions than Metal-Backed Tibial Components in Total Knee Arthroplasty. Knee Surg. Sports Traumatol. Arthrosc. 2016, 24, 2550–2559. [Google Scholar] [CrossRef] [Scilit] [PubMed]
  22. Soenen, M.; Baracchi, M.; De Corte, R.; Labey, L.; Innocenti, B. Stemmed TKA in a Femur with a Total Hip Arthroplasty: Is There a Safe Distance between the Stem Tips? J. Arthroplast. 2013, 28, 1437–1445. [Google Scholar] [CrossRef] [Scilit] [PubMed]
  23. Solórzano, W.; Ojeda, C.; Lantada, A.D. Biomechanical Study of Proximal Femur for Designing Stems for Total Hip Replacement. Appl. Sci. 2020, 10, 4208. [Google Scholar] [CrossRef] [Scilit]
  24. Smith, C.R.; Lenhart, R.L.; Kaiser, J.; Vignos, M.F.; Thelen, D.G. Influence of Ligament Properties on Tibiofemoral Mechanics in Walking. J. Knee Surg. 2014, 29, 99–106. [Google Scholar] [CrossRef] [Scilit] [PubMed]
  25. Bolcos, P.O.; Mononen, M.E.; Mohammadi, A.; Ebrahimi, M.; Tanaka, M.S.; Samaan, M.A.; Souza, R.B.; Li, X.; Suomalainen, J.S.; Jurvelin, J.S.; et al. Comparison between Kinetic and Kinetic-Kinematic Driven Knee Joint Finite Element Models. Sci. Rep. 2018, 8, 17351. [Google Scholar] [CrossRef] [Scilit] [PubMed]
  26. Luan, Y.; Wang, H.; Fang, C.; Zhang, M.; Li, J.; Zhang, N.; Liu, B.; Su, J.; Cheng, C.K. Mechanical Alignment Tolerance of a Cruciate-Retaining Knee Prosthesis under Gait Loading—A Finite Element Analysis. Front. Bioeng. Biotechnol. 2023, 11, 1148914. [Google Scholar] [CrossRef] [Scilit] [PubMed]
  27. Okereke, M.; Keates, S. Finite Element Mesh Generation. In Springer Tracts in Mechanical Engineering; Springer: Cham, Switzerland, 2018. [Google Scholar]
  28. Gong, S.; Zhang, J.; Han, J.; Dong, T.; Zhang, W.; Chen, Z.; Yao, S.; Ma, J. The Biomechanical Effects of Patient Bone Osteoporosis on Tibial Prosthesis Fixation in Total Knee Arthroplasty. Med. Nov. Technol. Devices 2025, 28, 100413. [Google Scholar] [CrossRef] [Scilit]
  29. Lee, J.H.; Schwarzkopf, R.; Fraipont, G.; Bouzarif, G.; McGarry, M.H.; Lee, T.Q. Load-Dependent Characteristics of Cruciate-Retaining and Posterior-Stabilized Total Knee Arthroplasty: A Biomechanical Study. Clin. Orthop. Surg. 2024, 16, 570–577. [Google Scholar] [CrossRef] [Scilit] [PubMed]
  30. Ardestani, M.M.; Moazen, M.; Maniei, E.; Jin, Z. Posterior Stabilized versus Cruciate Retaining Total Knee Arthroplasty Designs: Conformity Affects the Performance Reliability of the Design over the Patient Population. Med. Eng. Phys. 2015, 37, 350–360. [Google Scholar] [CrossRef] [Scilit] [PubMed]
  31. Kurtz, S.M. UHMWPE Biomaterials Handbook: Ultra High Molecular Weight Polyethylene in Total Joint Replacement and Medical Devices; Plastics Design Library: Amsterdam, The Netherlands, 2015. [Google Scholar]
  32. Singh, D.K.; Verma, R.K. A Critical Review on Ultra High Molecular Weight Polyethylene (UHMWPE) for Prosthesis and Implant Functions. In Proceedings of the E3S Web of Conferences; EDP Sciences: Les Ulis, France, 2021; Volume 309. [Google Scholar]
  33. Au, A.G.; James Raso, V.; Liggins, A.B.; Amirfazli, A. Contribution of Loading Conditions and Material Properties to Stress Shielding near the Tibial Component of Total Knee Replacements. J. Biomech. 2007, 40, 1410–1416. [Google Scholar] [CrossRef] [Scilit] [PubMed]
  34. Completo, A.; Talaia, P.; Fonseca, F.; Simões, J.A. Relationship of Design Features of Stemmed Tibial Knee Prosthesis with Stress Shielding and End-of-Stem Pain. Mater. Des. 2009, 30, 1391–1397. [Google Scholar] [CrossRef] [Scilit]
  35. Reimeringer, M.; Nuño, N.; Desmarais-Trépanier, C.; Lavigne, M.; Vendittoli, P.A. The Influence of Uncemented Femoral Stem Length and Design on Its Primary Stability: A Finite Element Analysis. Comput. Methods Biomech. Biomed. Eng. 2013, 16, 1221–1231. [Google Scholar] [CrossRef] [Scilit] [PubMed]
  36. Engh, C.A.; O’Connor, D.; Jasty, M.; McGovern, T.F.; Bobyn, J.D.; Harris, W.H. Quantification of Implant Micromotion, Strain Shielding, and Bone Resorption with Porous-Coated Anatomic Medullary Locking Femoral Prostheses. In Proceedings of the Clinical Orthopaedics and Related Research; Lippincott Williams & Wilkins: Philadelphia, PA, USA, 1992; Volume 285. [Google Scholar]
  37. Chen, Z.; Ma, Z.; Liang, B.; Han, J.; Zhang, J.; Peng, Y.; Jin, Z. Effect of Tibial Tray Backside Design on Stress Transfer and Micromotion in Uncemented Posterior-Stabilized TKA: A Finite Element Study. J. Exp. Orthop. 2026, 13, e70608. [Google Scholar] [CrossRef] [Scilit] [PubMed]
  38. Ekhtiari, S.; Bozzo, A.; Madden, K.; Winemaker, M.J.; Adili, A.; Wood, T.J. Unicompartmental Knee Arthroplasty: Survivorship and Risk Factors for Revision: A Population-Based Cohort Study with Minimum 10-Year Follow-Up. J. Bone Jt. Surg. 2021, 103, 2170–2176. [Google Scholar] [CrossRef] [Scilit] [PubMed]
  39. Soltanihafshejani, N.; Bitter, T.; Verdonschot, N.; Janssen, D. The Effect of Periprosthetic Bone Loss on the Failure Risk of Tibial Total Knee Arthroplasty. J. Orthop. Res. 2024, 42, 90–99. [Google Scholar] [CrossRef] [Scilit] [PubMed]
  40. Weiss, J.A.; Gardiner, J.C. Computational Modeling of Ligament Mechanics. Crit. Rev. Biomed. Eng. 2001, 29, 303–371. [Google Scholar] [CrossRef] [Scilit] [PubMed]
  41. Eidel, B.; Gote, A.; Fritzen, C.P.; Ohrndorf, A.; Christ, H.J. Tibial Implant Fixation in TKA Worth a Revision?—How to Avoid Stress-Shielding Even for Stiff Metallic Implants. Comput. Methods Biomech. Biomed. Eng. 2021, 24, 320–332. [Google Scholar] [CrossRef] [Scilit] [PubMed]
  42. Hunt, P.J.; Noori, M.; Hazelwood, S.J.; Noori, N.B.; Altabey, W.A. A Study on the Effects of Cementless Total Knee Arthroplasty Implants’ Surface Morphology via Finite Element Analysis. BioMedInformatics 2024, 4, 1425–1440. [Google Scholar] [CrossRef] [Scilit]
  43. Lee, H.H.; Hong, H.T.; Kim, J.K.; Koh, Y.G.; Park, K.K.; Kang, K.T. Optimization of Tibial Stem Geometry in Total Knee Arthroplasty Using Design of Experiments: A Finite Element Analysis. Bioengineering 2025, 12, 172. [Google Scholar] [CrossRef] [Scilit] [PubMed]
  44. Ahmed, A.H.; Din, S.; Chahal, K.; Rowe, C.; Shakshak, M. Kinematic Alignment Versus Mechanical Alignment in Total Knee Arthroplasty: A Systematic Review of Mid-Term Functional Outcomes. Cureus 2026, 18, 100874. [Google Scholar] [CrossRef] [Scilit] [PubMed]
  45. Young, S.W.; Sullivan, N.P.T.; Walker, M.L.; Holland, S.; Bayan, A.; Farrington, B. No Difference in 5-Year Clinical or Radiographic Outcomes between Kinematic and Mechanical Alignment in TKA: A Randomized Controlled Trial. Clin. Orthop. Relat. Res. 2020, 478, 1271–1279. [Google Scholar] [CrossRef] [Scilit] [PubMed]
  46. Gibbons, J.P.; Zeng, N.; Bayan, A.; Walker, M.L.; Farrington, B.; Young, S.W. No Difference in 10-Year Clinical or Radiographic Outcomes between Kinematic and Mechanical Alignment in TKA: A Randomized Trial. Clin. Orthop. Relat. Res. 2025, 483, 140–149. [Google Scholar] [CrossRef] [Scilit] [PubMed]
Figure 1. Full 3D geometric assembly of the finite element model. The multi-panel view illustrates the FB CR TKA prosthesis aligned on the synthetic tibia: (a) anterior view, (b) posterior view, and (c) lateral view. The complete structural assembly comprises the femoral component, polyethylene insert, tibial tray, and tibial bone model.
Applsci 16 06731 g001
Figure 2. Regions of interest (ROIs) defined for the finite element data extraction. (a) Posterior view of cortical bone partitioned into proximal lateral (PL), proximal medial (PM), distal lateral (DL) and distal medial (DM) regions. (b) Proximal view of polyethylene insert partitioned into lateral (L), and medial (M) regions.
Applsci 16 06731 g002
Figure 3. Average von Mises stress (MPa) distribution on the polyethylene insert for the healthy bone model. Contour plots highlighting critical peak loads extracted from the fully scaled 10-step gait cycle (GC): top row, axial force (13% GC); middle row, antero-posterior (AP) force (9% GC); and bottom row, rotational torque (50% GC). Columns illustrate the influence of varied kinetic profiles (50% Load, Baseline and 200% Load). (M: medial, L: lateral; orientation is uniform across all panels).
Applsci 16 06731 g003
Figure 4. Average von Mises stress (MPa) extracted from the Medial and Lateral ROIs of the polyethylene insert under varying load magnitudes. (a) Healthy bone models. (b) Osteoporotic bone models.
Applsci 16 06731 g004
Figure 5. Average von Mises stress (MPa) at the proximal tibia interface. Columns compare increasing load profiles (50%, baseline, 200%). Rows denote isolated peak forces for healthy and osteoporotic models: axial (13% GC. Rows 1–2), antero-posterior (9% GC. Rows 3–4), and rotational torque (50% GC. Rows 5–6). (M: medial, L: lateral orientation is uniform across all panels).
Applsci 16 06731 g005
Figure 6. Average von Mises stress (MPa) over the stance phase of the gait cycle (GC) for the cortical bone Regions of Interest (ROIs). Solid lines represent healthy bone models, and dashed lines represent osteoporotic bone models. (a) Proximal lateral (PL) and proximal medial (PM) ROIs. (b) Distal lateral (DL) and distal medial (DM) ROIs.
Applsci 16 06731 g006
Table 1. Material properties used in the finite element models.
MaterialMaterial BehaviorYoung’s Modulus (MPa)Poisson’s RatioPre-Strain εrReferences
Healthy cortical bone * E1 = 11,500ν23 = 0.31
Transversely isotropicE2 = 11,500ν31 = 0.31/[16,21,22]
E3 = 17,000ν12 = 0.51
Osteoporotic cortical bone * E1 = 7820ν23 = 0.31
Transversely isotropicE2 = 7820ν31 = 0.31/[21,22]
E3 = 11,560ν12 = 0.51
Cancellous boneElastic isotropic21300.30/[16,21,22]
Osteoporotic cancellous boneElastic isotropic7240.30/[21,22]
CoCrMoElastic isotropic240,0000.30/[16]
Ti6Al4VElastic isotropic114,0000.30/[16]
UHMWPEElastic isotropic724.20.46/[16]
aMCLElastic isotropic3320.45 0.04[15,16,24]
pMCLElastic isotropic3320.450.03[15,16,24]
LCLElastic isotropic3450.450.05[15,16,24]
* For the tibia bone, the direction E1 represents medio-lateral axis of the bone; E2 represents anterior–posterior axis of the bone; E3 represents the longitudinal anatomical axis of the bone.
Table 2. Baseline kinetic loading conditions extracted from the ISO 14243-1:2009 standard [6] standard across the stance phase of the gait cycle (GC).
Gait Cycle (%)Axial Force (N)AP Force (N)Rotational Torque (N.mm)
00.0.0.
0167.60.0.
91530.9−265.−500.
132600.109.62−903.3
25838.250.1160.6
402199.9−99.114974.9
501867.−167.536000.
55734.1−177.4500.
60167.6−62.51500.
65167.652.0.
Table 3. Quantitative overview of average von Mises stress (MPa) at the proximal tibia interface for healthy and osteoporotic models.
50% LoadBaseline 200% Load
Axial 13% GCHealthy 0.71.22.4
Osteoporotic0.81.42.6
AP 9% GCHealthy 0.80.91.6
Osteoporotic0.90.91.7
Torque 50% GCHealthy 1.01.11.2
Osteoporotic1.11.21.3
Table 4. Maximum tangential, axial, and total absolute micromotion (µm) at the bone–implant interface across the entire gait cycle (GC) for healthy and osteoporotic bone models under baseline and scaled kinetic loading conditions.
Max. Tangential
Micromotion (µm)
Max. Axial
Micromotion (µm)
Total Absolute
Micromotion (µm)
BaselineHealthy 19319
Osteoporotic37637
Axial 50%Healthy 15215
Osteoporotic26326
Axial 200%Healthy 29529
Osteoporotic621163
AP Force 50%Healthy 19319
Osteoporotic35636
AP Force 200%Healthy 23323
Osteoporotic44845
Torque 50%Healthy 18318
Osteoporotic38638
Torque 200%Healthy 23323
Osteoporotic36637
Table 5. Sensitivity analysis of the bone–implant configuration detailing the Normalized Sensitivity Coefficients (NSC) across all multi-axial load scenarios for healthy and osteoporotic bone condition.
Average Insert Stress
(Medial ROI) NSC
Average Interface Stress NSC Total Micromotion NSC
Axial 50%Healthy0.650.790.37
Osteoporotic0.720.820.6
Axial 200%Healthy0.620.910.56
Osteoporotic0.590.890.7
AP Force 50%Healthy−0.19 *0.150
Osteoporotic−0.15 *0.130.07
AP Force 200%Healthy−0.03 *0.850.23
Osteoporotic−0.01 *0.810.2
Torque 50%Healthy0.090.060.05
Osteoporotic0.070.05−0.04 *
Torque 200%Healthy0.060.180.21
Osteoporotic0.070.150
* Negative NSC values indicate an inverse relationship.
Disclaimer/Publisher’s Note: The statements, opinions and data contained in all publications are solely those of the individual author(s) and contributor(s) and not of MDPI and/or the editor(s). MDPI and/or the editor(s) disclaim responsibility for any injury to people or property resulting from any ideas, methods, instructions or products referred to in the content.