1. Introduction
Prolonged standing work is common across a wide range of activities in both industrial and service sectors and has been associated with increased leg volume and adverse vascular effects [
1,
2]. Some of the key factors that should be considered when characterizing standing work include standing posture (static and dynamic) [
1,
3,
4,
5], continuous and total standing time [
1,
6,
7], the type of footwear used and the use of insole inserts [
1,
8,
9,
10,
11], and the type of flooring surface [
9,
12,
13,
14,
15,
16]. However, most of the available evidence comes from observational or experimental studies that have examined these factors in isolation. Therefore, it is necessary to analyze both individual exposure and the interaction among these factors during standing work.
Increased leg volume has become established as one of the adverse effects of standing work [
1,
9]. The increase in leg volume during standing work results from reduced blood flow in the leg muscles, which causes venous distension and, over time, may progress to varicose veins or chronic venous insufficiency [
17]. Reduced blood flow leads to blood pooling in the lower extremities; this accumulation, in turn, impairs the venous pump, which depends on the alternating muscle contractions of the lower leg that help return venous blood to the heart [
18,
19,
20,
21]. Consequently, the reduced blood supply to static muscles may further intensify the adverse effects of muscle fatigue and pain due to the accumulation of metabolites within the muscles, which may lead to muscle hypersensitivity [
1,
16].
The adverse effect of increased leg volume during standing work has been studied particularly in occupational settings in developed countries, where leg edema has been documented as a consistent physiological response [
22]. Experimental and field studies have reported that standing exposures lasting between 3 and 12 h can induce significant increases in leg volume, associated with interstitial fluid accumulation, muscle fatigue, and impaired venous return [
20,
23,
24]. Similarly, leg volume increase has been shown to occur after as little as 3 h of static standing, becoming more pronounced over a full work shift, and its magnitude is influenced by factors such as exposure duration, posture, and anthropometric characteristics [
21,
25]. Despite the existing evidence on increased leg volume, technical and scientific evidence remains limited in developing countries; evidence is also limited regarding the relationship between standing work, exposure to multiple risk factors, and the physiological response reflected in changes in leg volume.
In Colombia, studies that assessed leg volume among healthcare workers [
26], among flower growers [
27], and manufacturing workers have been reported [
28]. To date, a characterization of standing work in Colombian companies has been conducted by a research group in collaboration with the Directorate of Surveillance and Control of the Colombian Ministry of Labor, which found that 60% of companies had workers standing in confined spaces with limited mobility for prolonged periods, and that hard surfaces were the most common [
29]. Despite this characterization and the studies conducted in some economic sectors, no formal study has been carried out to characterize standing work within companies, nor have controlled studies examined the interaction among multiple risk factors associated with changes in leg volume during standing work. This gap limits the generation of local evidence with explanatory and transferable value for the implementation of effective interventions.
The aim of this study was to analyze changes in leg volume across eight experimental scenarios integrating posture, flooring surface, insole use, and individual characteristics associated with standing work. To achieve this, leg volume was evaluated using a controlled (23) factorial experiment with a random effect during a 120 min simulated standing task.
2. Materials and Methods
2.1. Experimental Design
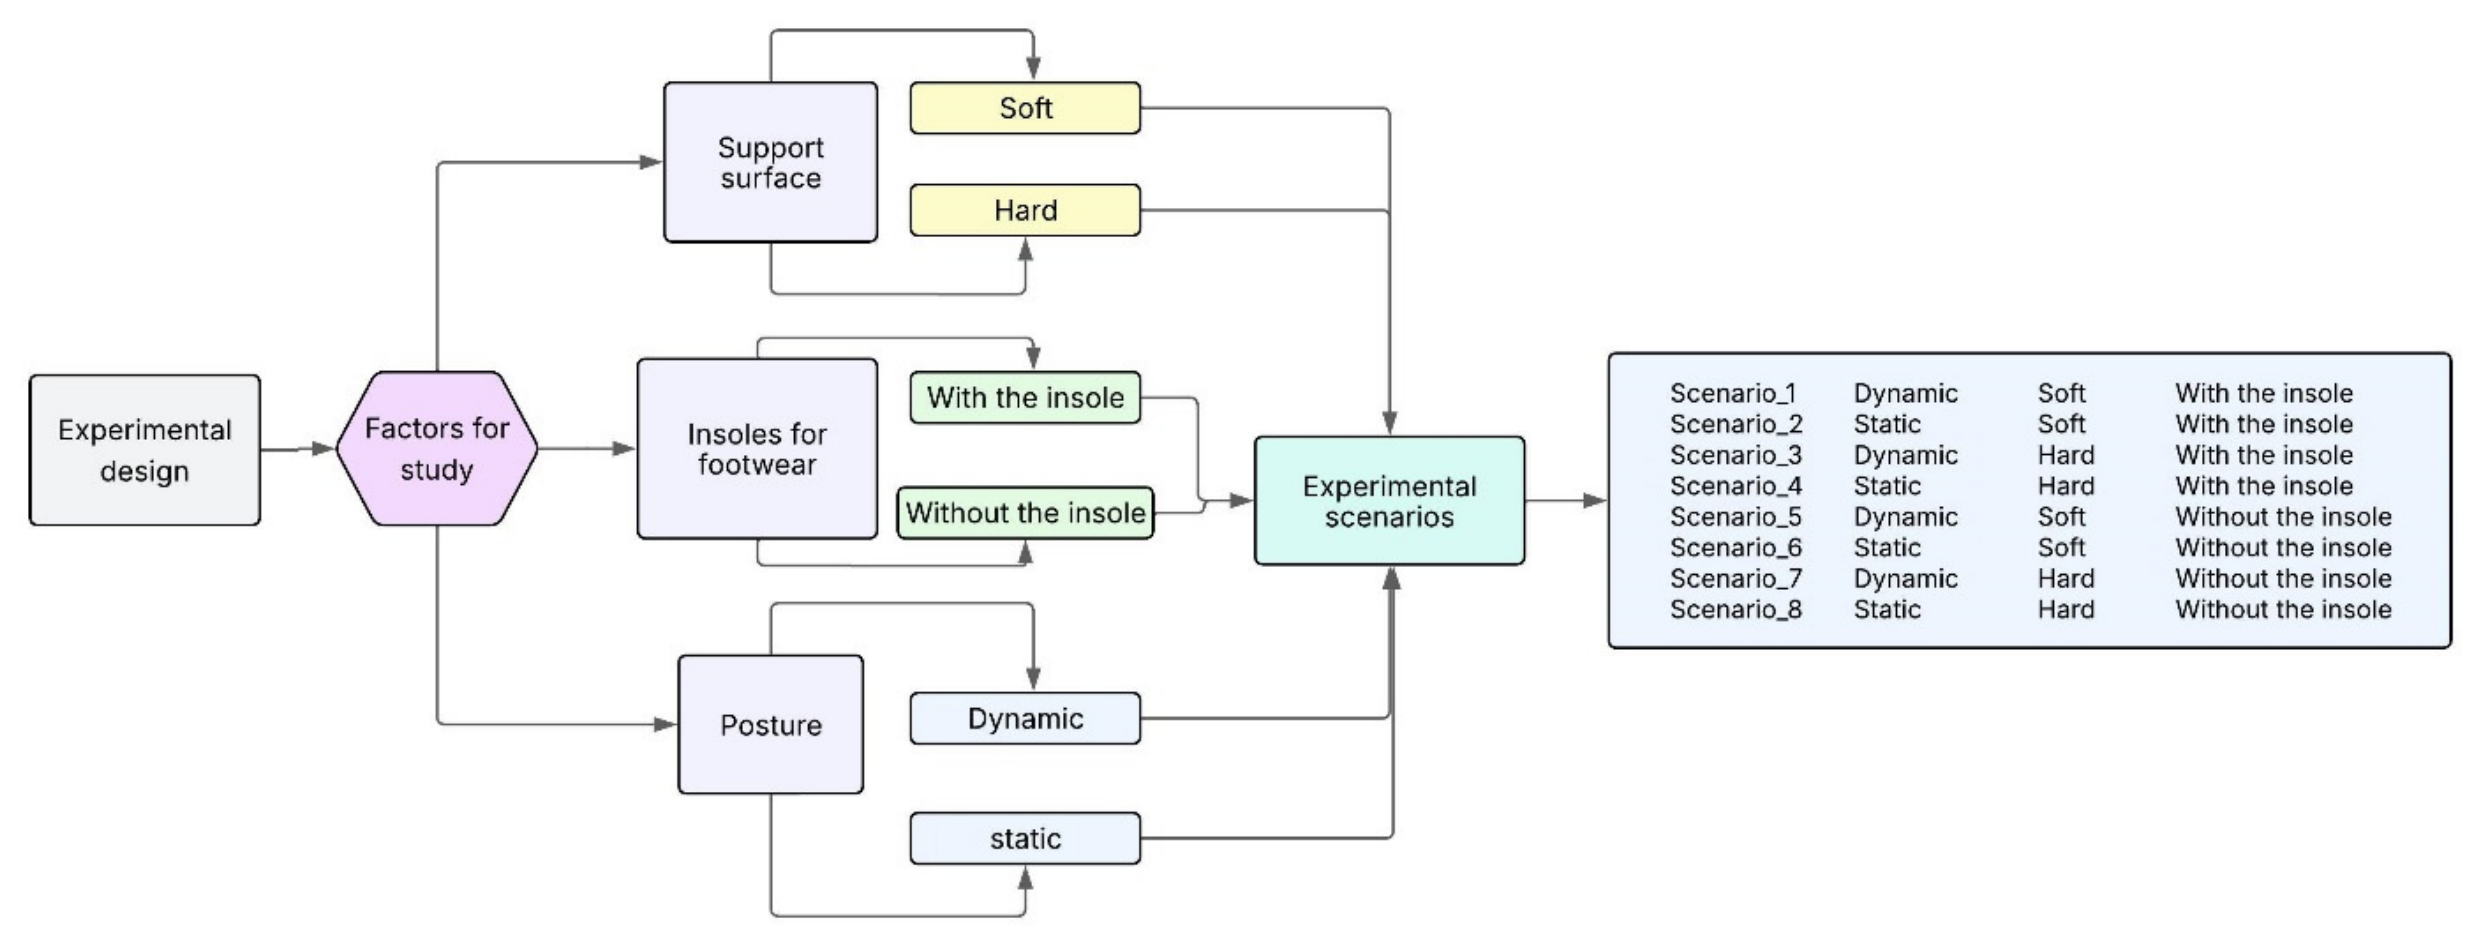
A factorial design with a random effect was used, considering three factors of interest with two levels each. The factors and levels included in the experiment are shown in
Figure 1. A total of eight experimental scenarios were evaluated during a 120 min simulation in which participants remained standing continuously. Other experimental studies that also evaluated changes in leg volume used 120 min experimental protocols [
10,
30,
31]. The experiment was conducted at the Biomechanics and Rehabilitation Laboratory of Institución Universitaria ITM.
2.2. Participants
A total of 32 volunteers (>18 years old) from Institución Universitaria ITM were recruited. The final sample consisted of 30 participants (16 men and 14 women), with a mean age of 21.83 ± 2.13 years; mean height was 167.98 ± 8.48 cm, mean body weight was 67.72 ± 8.24 kg, and the dominant foot was the right foot in 87.5% of participants. Young adults of both sexes were considered eligible to participate if they had no previous diagnosis of chronic disease, agreed to participate voluntarily, and provided written informed consent. Additionally, participants were required to have sufficient functional capacity to maintain a continuous standing posture for 120 min, which was necessary to complete the experimental protocol. Individuals with a history of vascular disease in the lower extremities were excluded, as were those who had previously required medical intervention for musculoskeletal or neuromotor conditions (e.g., treatment by a physician, physical therapist, or occupational therapist); those who performed jobs requiring prolonged standing were also excluded, as were individuals with any functional impairment that could compromise their ability to remain continuously upright for the required period. After meeting the study inclusion criteria, participants provided written informed consent for the study protocol by signing the consent form approved by the Research Ethics Committee of Institución Universitaria ITM through a formal communication issued on 18 October 2023.
2.3. Experimental Procedure
Eight experimental scenarios were simulated, following the principles of factorial experimental design (2
3) (
Figure 1). Each experimental scenario was repeated four times, yielding a total of 32 simulations. Each simulation was coded, and the order of the simulations was then randomized using a spreadsheet. Each participant was assigned to a single simulation, and no washout period was required because each simulation involved a different participant. Simulations were scheduled between 08:00 and 21:00 h. Participants were required to arrive at the laboratory at the scheduled time for their simulation. Although they were informed of the study objective, none knew in advance which experimental scenario they would be exposed to. Assignment to the experimental scenario was carried out through simple manual randomization, in which participants randomly selected the code corresponding to their simulation from a bag.
After the simulation assignment, participants’ height and body weight were measured using calibrated anthropometric and weighing equipment, respectively. Participants then completed a 30 min seated rest period without shoes before the simulation began. During this time, each participant was informed about the experimental protocol, the marked area for the postures (static or dynamic), depending on the assigned experimental scenario, the tasks to be performed, the leg measurement procedure, the informed consent process, and the shoe size to be used, with or without an insole insert, depending on the assigned scenario. In addition, participants were allowed to drink water voluntarily at any time during the 120 min simulation. If a participant chose to withdraw voluntarily or discontinue the simulation for any reason, the record was excluded, and the scenario was returned to the randomization process for reassignment to another participant.
Before the simulation began, leg circumference was recorded as the baseline measurement (initial measurement, T0). Time was then monitored using a stopwatch equipped with an alarm to indicate the end of the exposure period (120 min). At the end of the simulation, leg circumference was measured again (final measurement, T1). After the final leg circumference measurement was recorded, participants remained seated in a chair for 30 min. During this time, they were monitored to verify that the simulation had not caused any adverse health effects.
2.4. Experimental Factors
Posture: Two postures were defined in the experiment: static and dynamic. Static posture was established based on the guidelines of the German Committee for Occupational Safety and Health [
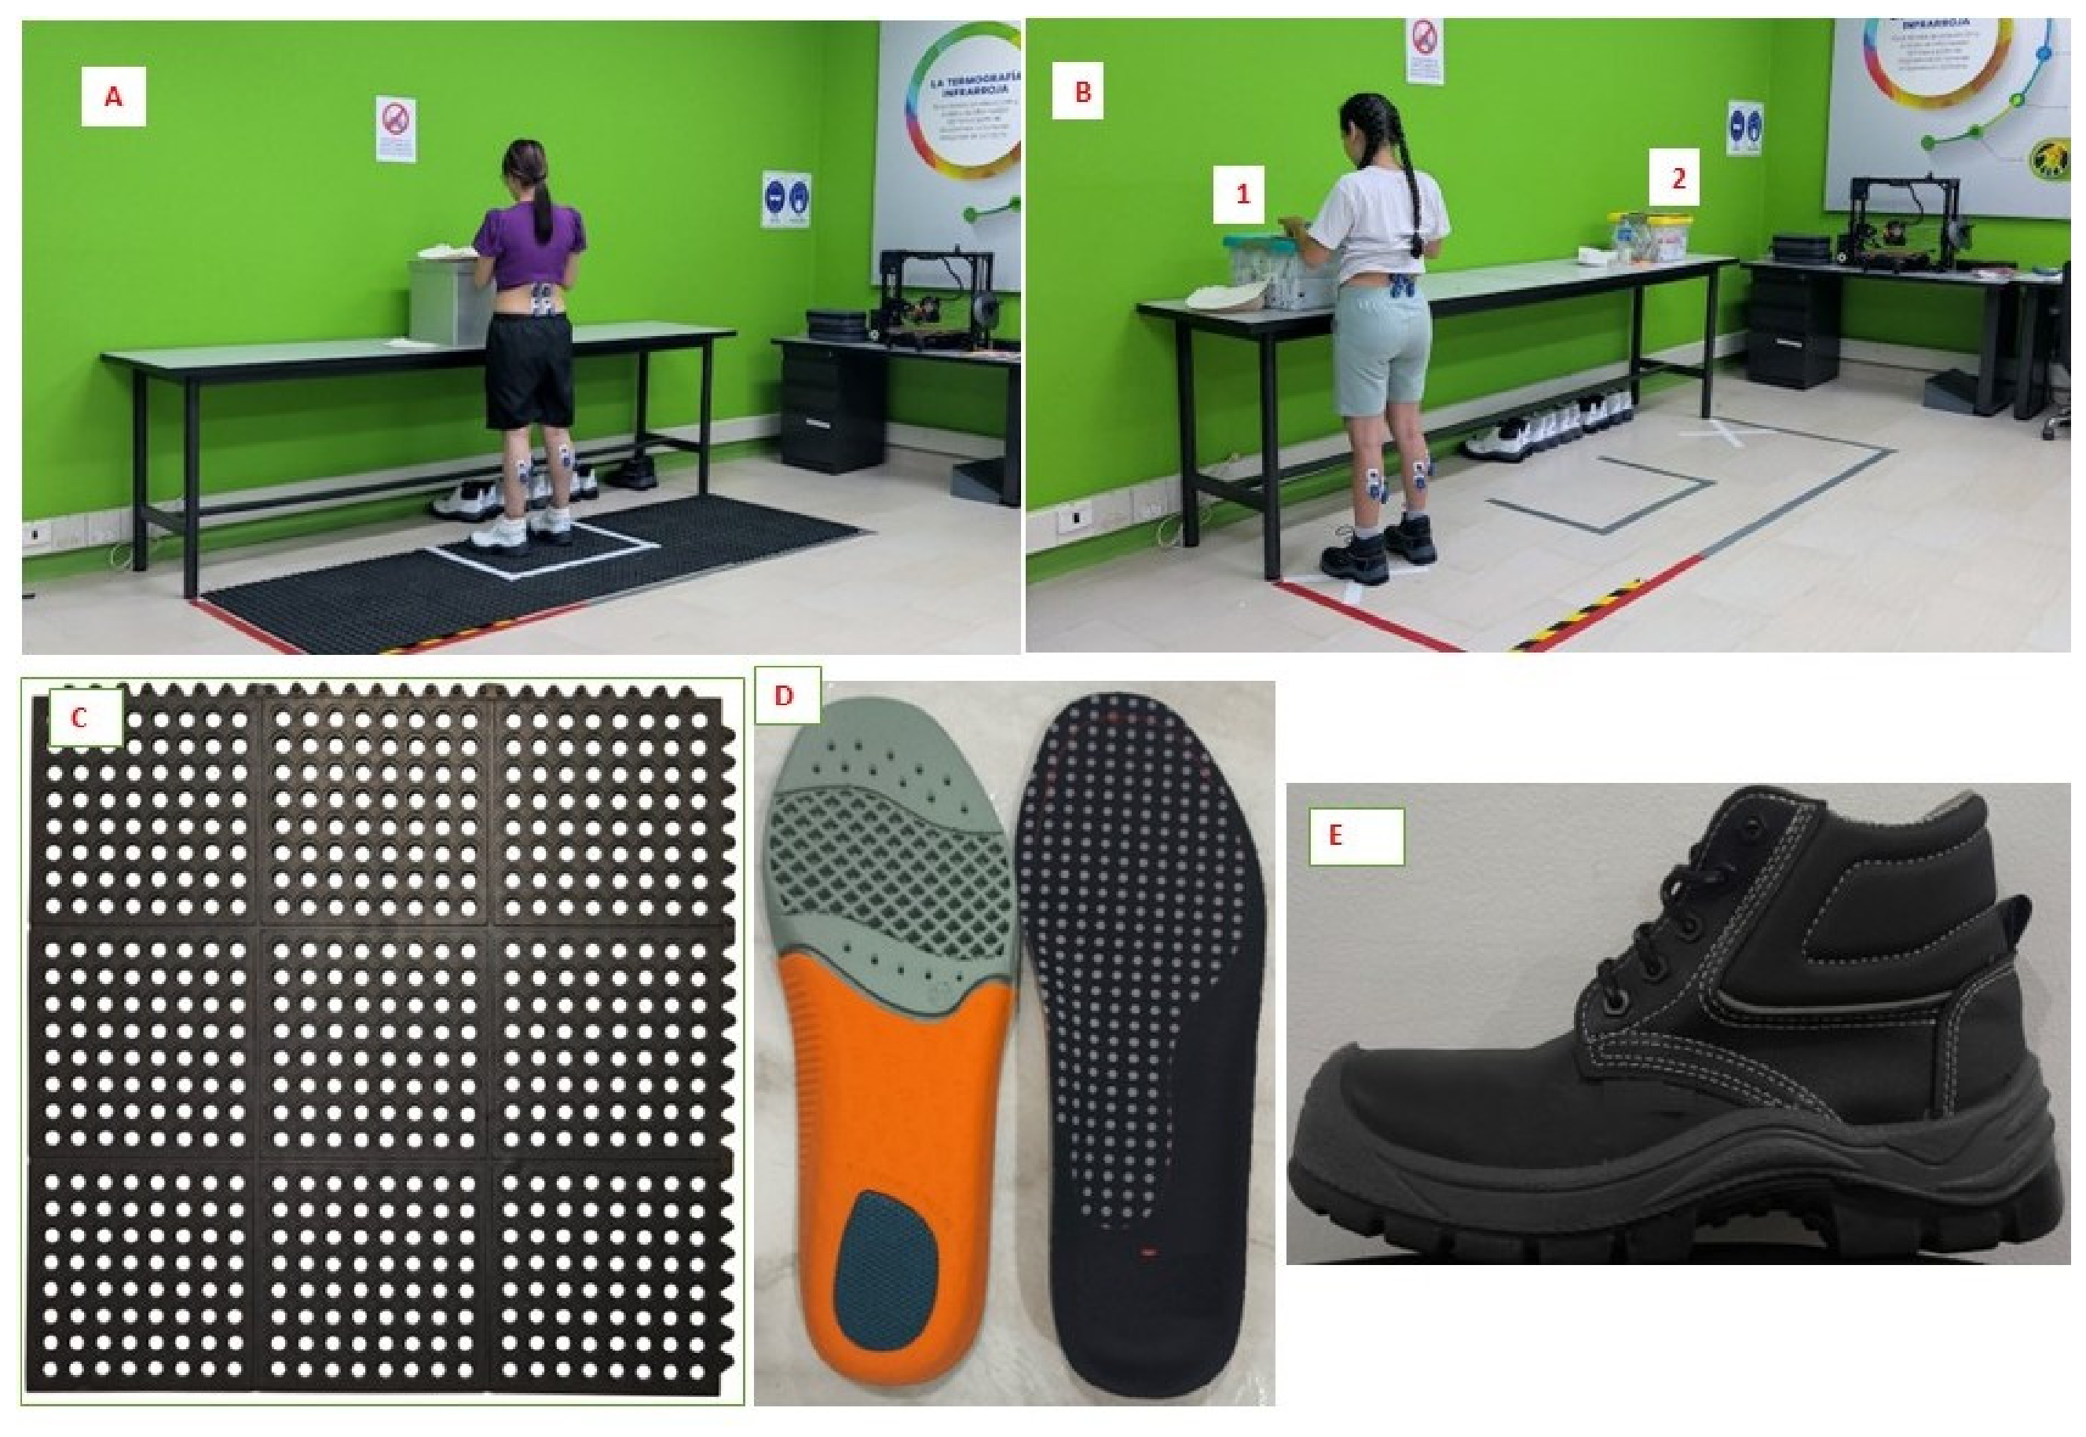
30]. According to these guidelines, static standing is defined as standing without the possibility of moving forward, backward, or sideways beyond a radius of 20 cm. This area was marked with adhesive tape on the floor or on the mat, depending on the assigned scenario. Participants assigned to the static posture condition were instructed not to move beyond this marked area (
Figure 2A). For the dynamic posture condition, participants were instructed to move from station 1 to station 2 at least approximately every 5 min while standing and performing the experimental tasks (
Figure 2B). The movement consisted of walking a distance greater than 20 cm (2.7 m) between the two locations marked with an X on the floor.
Support surface: One hard and one soft support surface were used. The hard support surface was the laboratory floor, which consisted of porcelain tile (
Figure 2B). For the soft surface, a commercial anti-fatigue mat was selected (Model No. 5500 Modular Classic). The mat was made of styrene-butadiene rubber (SBR) and measured 90 cm × 90 cm (
Figure 2C). The mat thickness was 1.58 cm. It had a medium hardness, with a Shore A value of 50 ± 5, providing a balance between comfort and support. Its tensile strength was 500 psi (3.45 MPa). Maximum elongation was 400%, and the temperature range within which the anti-fatigue mat maintains its properties was −25 to 80 °C. Both support surfaces were marked with adhesive tape to ensure the conditions required for each experimental scenario.
Insole inserts for footwear: Footwear was used without the insole insert, and the same footwear was also used with the insole insert. The footwear used consisted of commercially available industrial safety boots with unstable soles and steel toe caps. One pair of boots was available for each shoe size from 37 to 42 (Colombian sizing) (
Figure 2E). This was done to accommodate variability in participant shoe size and to minimize exclusions on that basis. Each participant freely selected the shoe size that best fit their feet. Commercial insole inserts designed for safety boots were used. The insole inserts were made of polyurethane and gel (
Figure 2D). The insole model was CGEL/L, and the material composition consisted of a 100% polyester lining, 93% rubber, and 7% textile. One pair of insoles was available for each shoe size from 37 to 42 (Colombian sizing).
2.5. Experimental Tasks
Two light tasks that required participants to remain standing throughout the 120 min evaluation period were simulated. In the first task, participants were required to assemble and disassemble hamburger boxes. The workstation for this task was always adjusted to elbow height to prevent forward trunk inclination and allow participants to keep their backs upright throughout the task; participants were instructed not to bend down or lean forward for any reason. Participants were not required to maintain a fixed pace for assembling or disassembling the boxes, nor a specific number of boxes within a given time period. They were allowed to perform this light task at their own pace until they decided to begin the second task. However, the estimated workload indicated that participants could assemble an average of 10 boxes per minute and disassemble an average of 16 boxes per minute. The second task was optional and was used primarily when participants became fatigued from assembling and disassembling boxes. This task consisted of completing a Tetris puzzle using wooden pieces and could also be alternated with assembling and disassembling jigsaw puzzles. These activities were performed throughout the 120 min simulation period.
2.6. Leg Circumference Measurement and Volume Calculation
Right and left leg circumference were measured using a Gulick II tape measure model 67019 (Country Technology, Gays Mills, WI, USA) [
31]. The tape measure is designed to reduce measurement error by applying a standardized tension of 4 oz through a spring-loaded control device, thereby ensuring that approximately the same amount of force is applied in each measurement, unlike conventional tape measures. The Gulick II tape measure standardizes the measurement procedure by ensuring that approximately the same amount of tension is applied each time the tape is pulled, thereby improving measurement accuracy [
10,
11,
16].
A study evaluating the reliability of spring-loaded tape measures used to standardize measurements reported reliability coefficients of 0.97 for the calf and 0.98 for the ankle in healthy subjects, with low relative imprecision of 6.36% for the calf and 12.49% for the ankle [
32]. Similarly, in a study comparing leg edema measurements obtained with the Gulick tape measure and the automated optoelectronic Pero-System method, volume measurements showed a high correlation between the two methods, with coefficients of 0.98 for the legs and 0.96 for the arms [
33]. Tape-measure measurements have been shown to be a reliable and reproducible method for assessing lower-extremity circumference [
34].
For leg measurements, all participants wore standard athletic shorts. Before the simulation began, participants sat in a chair and initially extended the right lower limb, with the foot bare and without socks, supported on another chair of the same height so that the entire lower extremity remained straight for the baseline measurement (T0). To optimize the initial circumference measurement and standardize leg volume calculation, a wooden ruler divided into six 4 cm segments was used, together with a permanent ink marker to mark the anatomical reference points on the skin for the final measurement (T1). The ruler was positioned from the lateral malleolus, starting at the ankle, and extended 20 cm along the longitudinal axis of the leg, corresponding to the region where the calf reaches its maximum circumference [
10,
11,
16].
For leg volume calculation, the truncated cone formula was applied to the circumference measurements and programmed in a spreadsheet with Equation (1) [
10,
16,
33]:
where V is leg volume, X is the circumference of the lower segment, and Y is the circumference of the upper segment located 4 cm above X. The formula was used to calculate leg volume at the start of the simulation and at the end of the simulation.
2.7. Statistical Analysis
Statistical analyses were performed using R software (version 4.5.2) [
35]. For each experimental scenario, a descriptive graphical representation was generated based on the mean values of right and left leg volume. Because changes in lower-extremity volume constitute an individual-dependent response, linear mixed-effects models with subject-level random effects were explored using the lme4 package. To optimize model fit, a logarithmic transformation of the outcome variable corresponding to right leg volume was evaluated. In addition, marginal measures, effect sizes, and power analyses were estimated for each factor considered in the experiment. Model validity was assessed by evaluating the statistical assumptions, including residual normality, homoscedasticity, and independence of observations.
2.8. Ethical Considerations
This study was approved by the Research Ethics Committee of the Institución Universitaria ITM, as communicated on 18 October 2023, and was classified as minimal risk in accordance with Resolution 8430 of 1993 of the Ministerio de Salud de Colombia. All participants provided written informed consent prior to participation, acknowledging the experimental protocol.
3. Results
3.1. Post Hoc Data Analysis
A post hoc analysis was conducted using Monte Carlo simulations to determine the statistical power of the factors and individual characteristics considered for inclusion in the linear mixed-effects models of leg volume. Based on an effect-size criterion, only variables with a Cohen’s effect size of at least 0.30 (Cohen’s f2) were selected.
In the initial analytical model for the right leg, time (power: 96%; Cohen’s f
2: 0.88; partial η
2: 44%), posture (power: 52%; Cohen’s f
2: 0.45; partial η
2: 17%), and body weight (power: 97%; Cohen’s f
2: 0.98; partial η
2: 49%) were included. The remaining variables were excluded because their effects were below the predefined threshold. The overall marginal measure of the original model was 50.5%, indicating that the fixed effects explained more than half of the model variance. The remaining results are presented in
Table 1. The initial analytical model was then evaluated against the statistical assumptions, and the residuals did not follow a normal distribution. Therefore, a logarithmic transformation of the volume variable was tested.
To correct for positive skewness and heteroscedasticity inherent to physiological variables associated with standing work, in which dispersion tends to increase proportionally with the magnitude of leg volume, a logarithmic transformation was applied to the dependent variable. This approach stabilized the variance and improved model fit without distorting the functional structure of the interactions. The log-transformed linear mixed-effects model allowed a more robust estimation of the effects of time, posture, and individual characteristics on leg volume, while simultaneously accounting for interindividual variability through a random intercept for each participant and achieving reasonable compliance with model assumptions.
In the log-transformed model, time (power: 96%; Cohen’s f
2: 0.89; partial η
2: 44%), posture (power: 52%; Cohen’s f
2: 0.51; partial η
2: 20%), height (power: 52%; Cohen’s f
2: 0.30; partial η
2: 20%), and body weight (power: 98%; Cohen’s f
2: 1.04; partial η
2: 52%) were included; all remaining factors showed an effect size below 0.30. The overall marginal measure of the model was 52%, indicating that the fixed effects explained more than half of the model variance. The final analytical model for the right leg was tested using only the variables that showed a large effect. The remaining results are presented in
Table 1. The log-transformed model improved both the effect estimates and the marginal measure relative to the initial model; it also improved the overall effect and incorporated height as an individual characteristic. These findings support the use of the log-transformed model as an improved analytical model for right leg volume.
For the left leg, the final model consistently included time (power: 100%; Cohen’s f
2: 1.43; partial η
2: 67%), posture (power: 55%; Cohen’s f
2: 0.54; partial η
2: 23%), height (power: 39%; Cohen’s f
2: 0.43; partial η
2: 16%), and body weight (power: 97%; Cohen’s f
2: 0.98; partial η
2: 49%). The remaining factors showed an effect size below 0.30. The overall marginal measure of the model was 50.6%, indicating that the fixed effects explained more than half of the model variance. The remaining results are presented in
Table 2.
3.2. Distribution of Leg Volume Across Experimental Scenarios for the Right and Left Legs
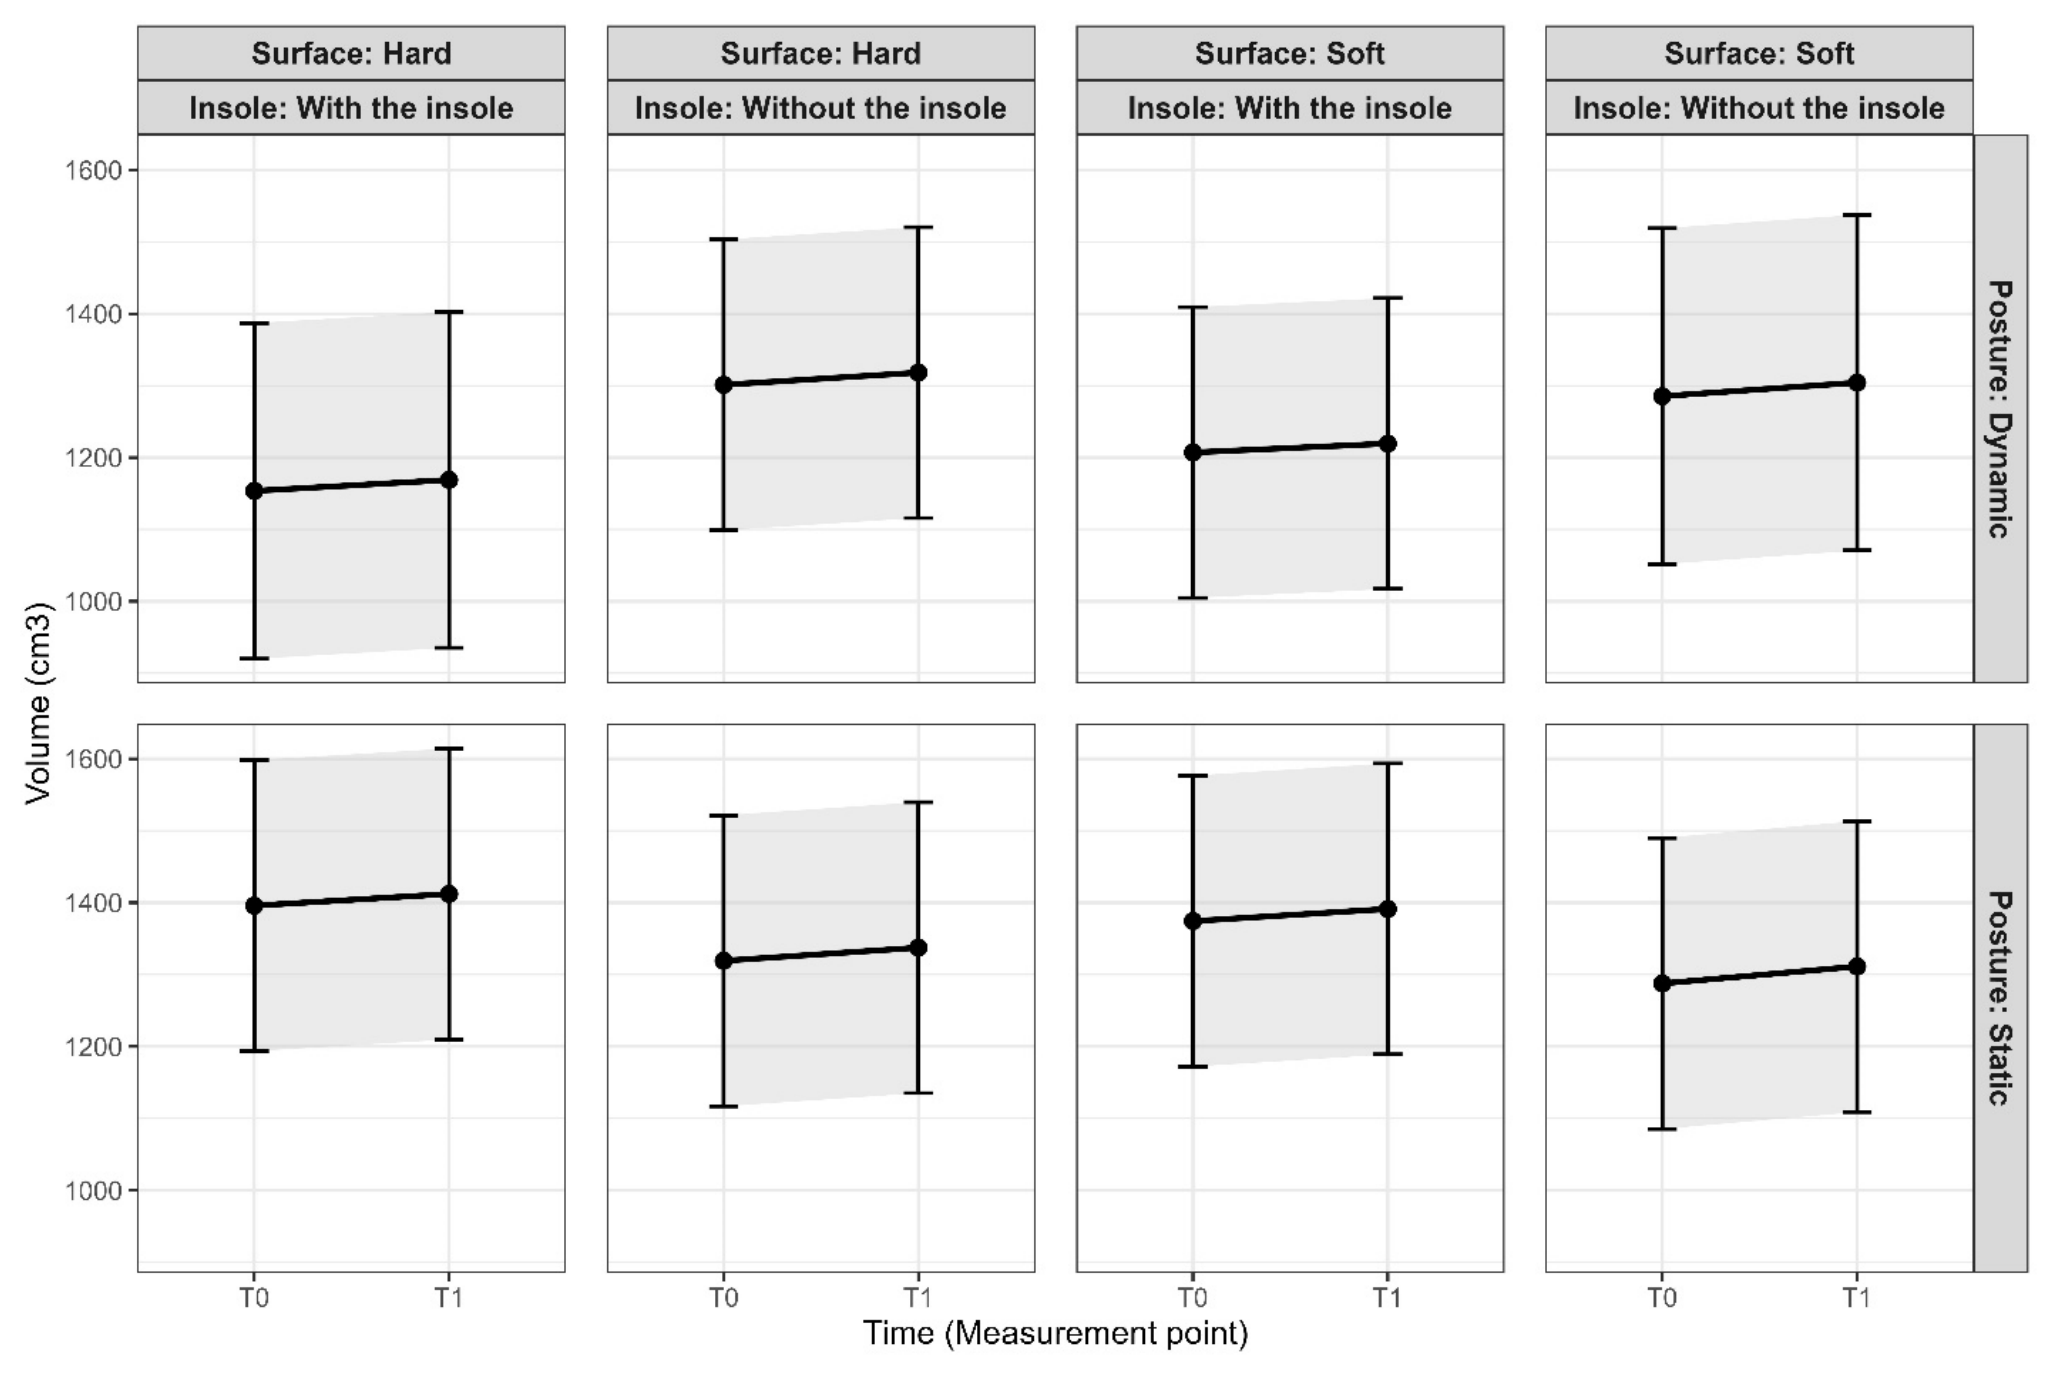
The mean right-leg volume increased from baseline (T0) in each of the eight experimental scenarios, as shown in
Figure 3, with a mean final increase of 17.358 cm
3 between T0 and T1. Scenarios involving static posture consistently showed higher values than those involving dynamic posture. On hard surfaces, values also tended to be higher than on soft surfaces, particularly under static posture conditions. The scenario that appeared visually most unfavorable was static posture on a hard surface, whereas the lowest values were observed under dynamic posture, particularly on a soft surface. However, no significant differences were found among the eight experimental scenarios analyzed, including two-way and three-way interactions. Therefore, right-leg volume increased similarly across all scenarios.
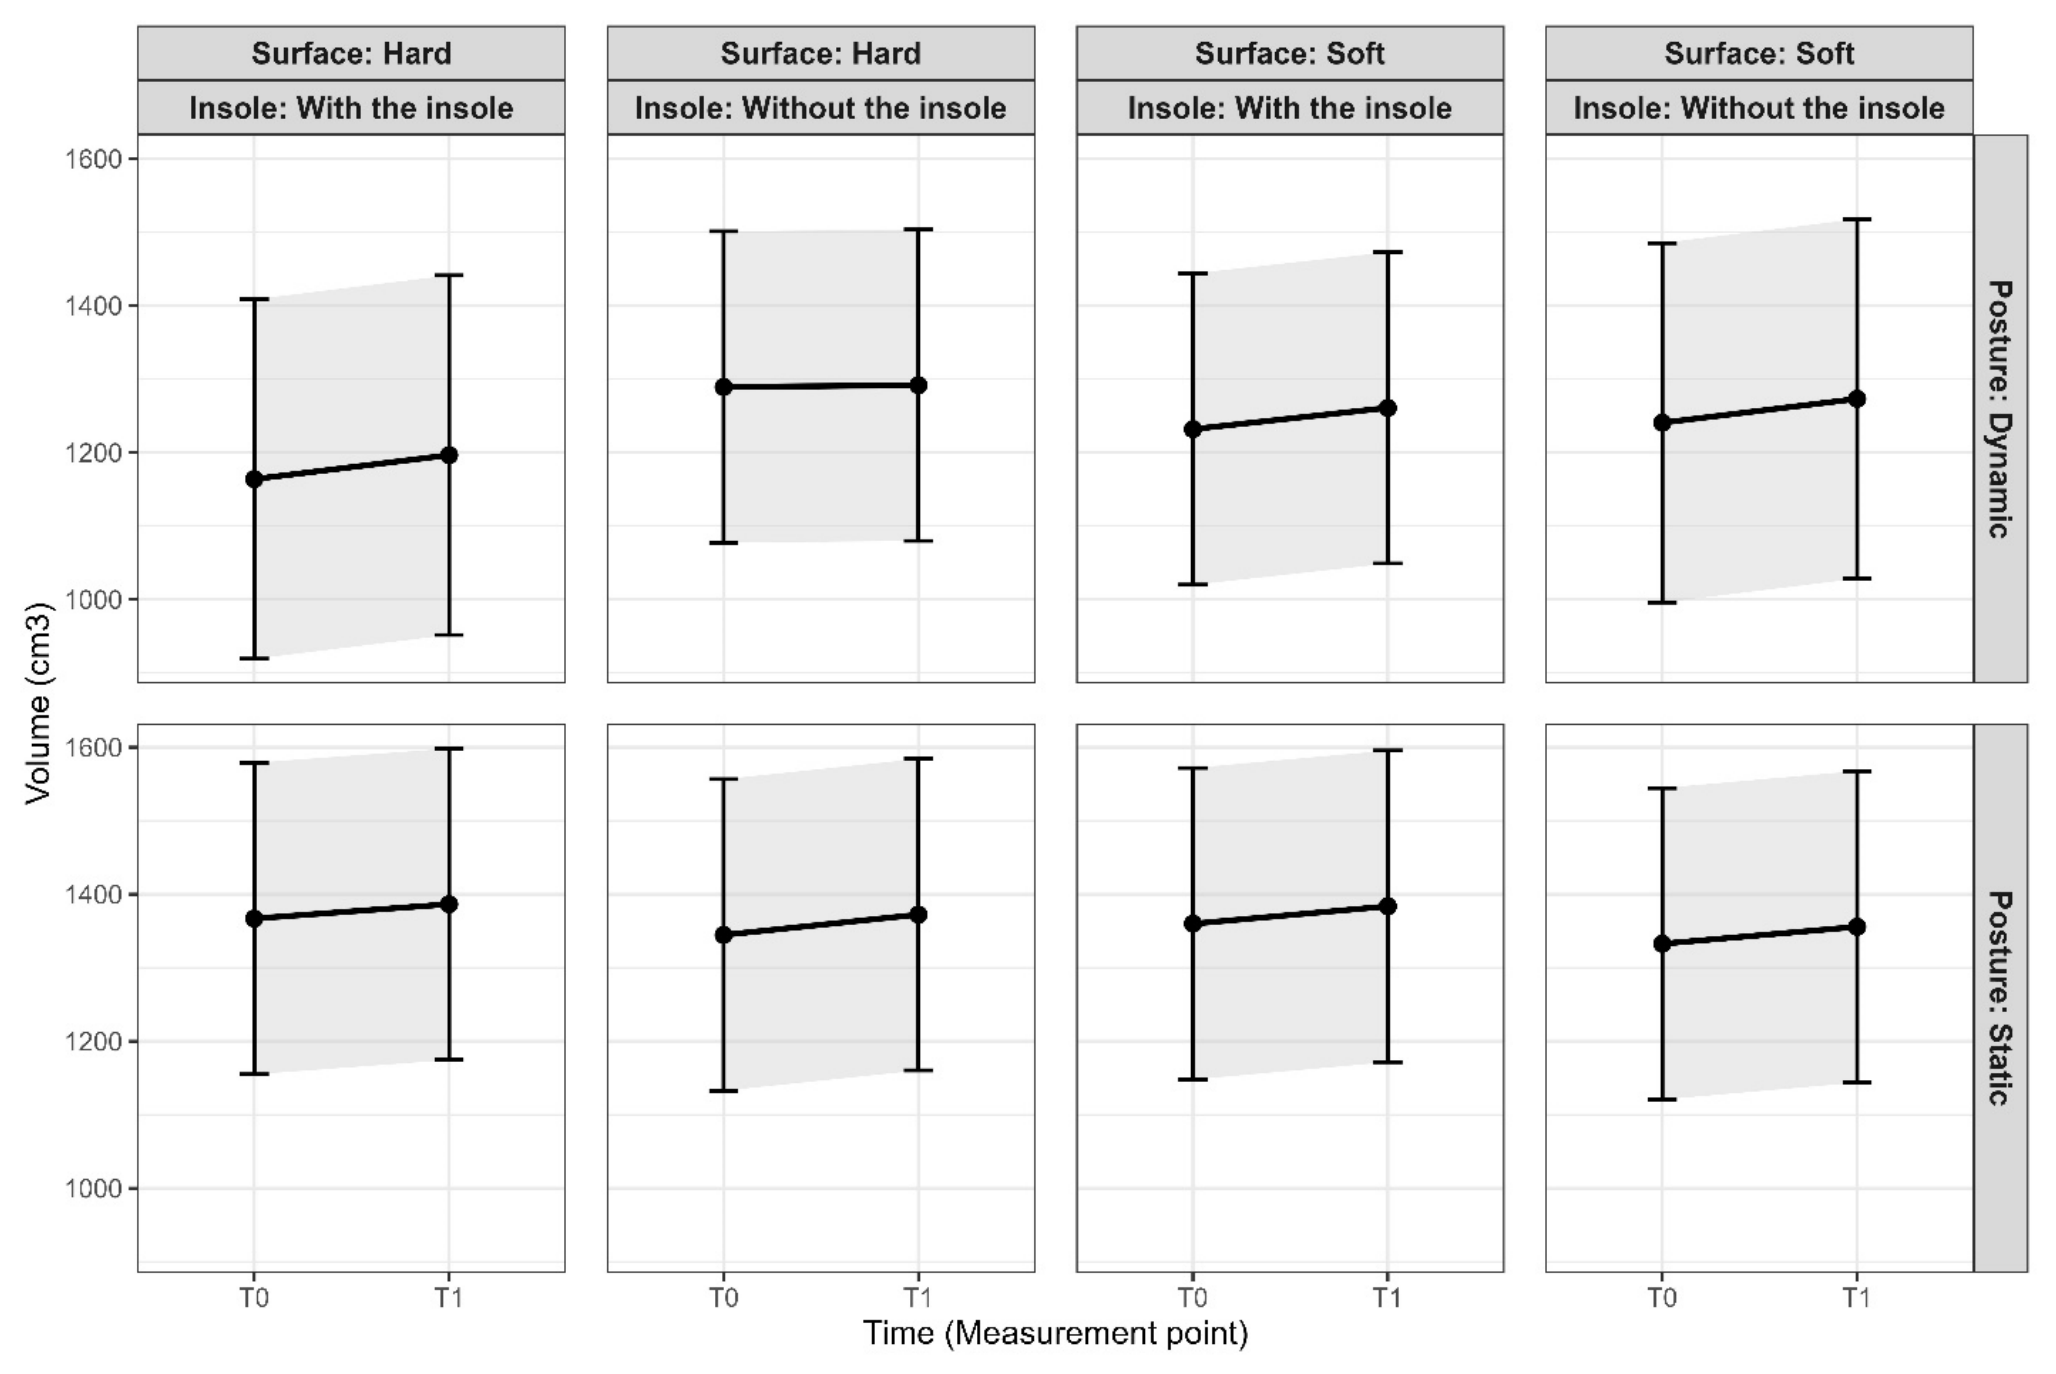
The mean left-leg volume increased from baseline (T0) in seven of the eight experimental scenarios, as shown in
Figure 4, with a mean increase of 23.234 cm
3 between T0 and T1. Only the experimental scenario involving dynamic posture, a hard surface, and no insole insert showed the same mean leg volume at T0 and T1. As with right-leg volume, values on hard surfaces tended to be higher than those on soft surfaces. However, no significant differences were found among any of the eight experimental scenarios analyzed, including two-way and three-way interactions.
3.3. Analysis of the Linear Mixed-Effects Models for Right and Left Leg Volume
For the right leg, a log-transformed linear mixed-effects model was fitted to leg volume. The predictors showed statistically significant effects, with confidence intervals that did not include zero. On the logarithmic scale, the coefficients are interpreted as relative changes in volume, showing a significant increase at T1 (0.013), greater volume under static posture (0.096), a reduction in volume with greater height (−0.0066), and an increase in volume with higher body weight (0.0115). The remaining results are presented in
Table 3. The magnitude of the subject-level random component confirms interindividual variability, thereby justifying the use of the mixed-effects model.
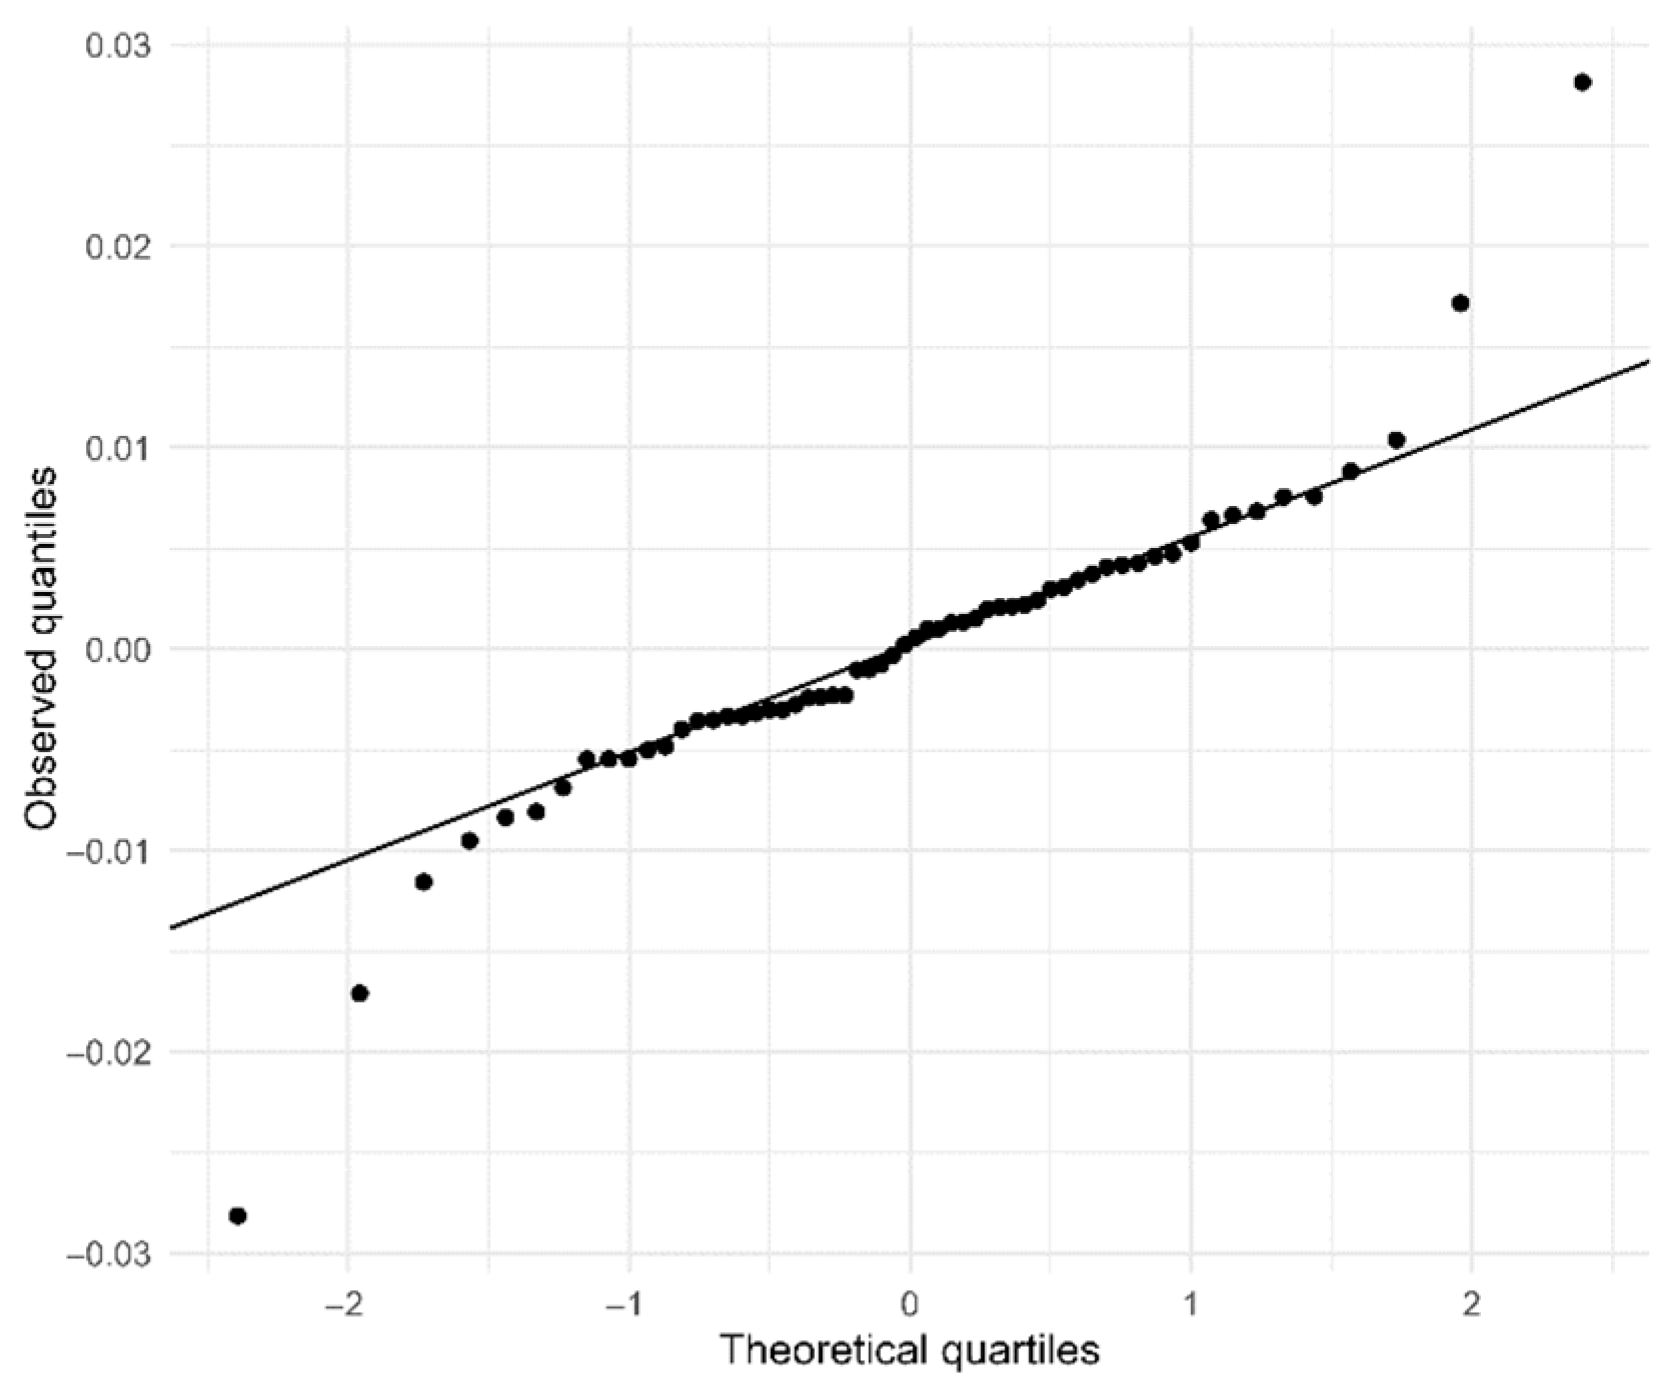
The model was evaluated for residual normality using the Shapiro–Wilk test (
p = 0.00034,
p < 0.05). Residual diagnostics showed slight deviations from perfect normality, as indicated by the Shapiro–Wilk test (
p < 0.001). However, the Q–Q plots (
Figure 5) revealed only minor deviations in the tails. Given the robustness of linear mixed-effects models to moderate non-normality and the absence of systematic patterns, the log-transformed model was retained [
36,
37]. Breusch–Pagan homoscedasticity (
p = 0.9311,
p > 0.05) and multicollinearity among predictors were assessed using the variance inflation factor (VIF), with no evidence of problematic collinearity: time, 1.00; posture, 1.15; height, 1.20; and weight, 1.08 (all VIFs < 1.3). The random-effects linear mixed model with logarithmic transformation is presented in Equation 2. Therefore, this model explains and may predict right-leg volume under conditions similar to those examined in the present study.
In Equation (2), Volumeij represents the estimated leg volume for observation i in subject j; T1ij is a dummy variable for time, with T0 as the reference category; b0j~N (0.09417) is the random effect for subject j, capturing interindividual variability; and Ɛij ~ N (0.01091) is the residual error, representing the variability not explained by the model.
For the left leg, a linear mixed-effects model was fitted. The predictors showed statistically significant effects, with confidence intervals that did not include zero. The coefficients are interpreted as changes in leg volume, showing a significant increase at T1 (23.234), greater volume under static posture (131.722), a reduction in volume with greater height (−10.069), and an increase in volume with higher body weight (15.582). The remaining results are presented in
Table 4. The magnitude of the subject-level random component confirms interindividual variability, thereby justifying the use of the mixed-effects model.
The model met the statistical assumptions for residual normality according to the Shapiro–Wilk test (
p = 0.6197728,
p > 0.05). Homoscedasticity was assessed using the Breusch–Pagan test (
p = 0.2007,
p > 0.05), and multicollinearity among predictors was evaluated using the variance inflation factor (VIF). No evidence of problematic collinearity was found: time, 1.00; posture, 1.15; height, 1.20; and weight, 1.08 (all VIFs < 1.3). The random-effects linear mixed model is presented in Equation 3. Therefore, this model explains and may predict left-leg volume under conditions similar to those examined in the present study.
In Equation (3), Volumeij represents the estimated leg volume for observation i in subject j; T1ij is a dummy variable for time, with T0 as the reference category; b0j ~N (16,085.8) is the random effect for subject j, capturing interindividual variability; and Ɛij ~N (184.4) is the residual error, representing the variability not explained by the model.
4. Discussion
In this study, right- and left-leg volume behavior was analyzed across eight experimental scenarios integrating different risk factors associated with standing work. This is one of the first experimental studies in a Latin American population to evaluate multiple factors simultaneously under controlled conditions. The results confirm that even light tasks performed in a standing posture produce significant increases in leg volume over a 120 min period, and that, under the conditions studied, this adverse effect depends on exposure time, static posture, participants’ height, and body weight.
A central finding of this study is that none of the eight experimental scenarios showed significant differences in changes in right- or left-leg volume (
p > 0.05). This result suggests that, under the factors studied, right- and left-leg volume increased similarly across all experimental scenarios, and that time, static posture, height, and body weight were directly associated with increases in leg volume. Although none of the eight scenarios showed significant differences, a descriptive trend can be observed in
Figure 3 and
Figure 4, indicating that both right- and left-leg volume tended to increase less in scenarios involving soft surfaces and dynamic posture (movement greater than 20 cm at least every 5 min) than in those involving hard surfaces and static posture, which showed greater increases in leg volume. This finding warrants further investigation in future studies.
This study strengthens the evidence regarding the importance of time as a factor contributing to increased leg volume. The results of this study showed that, at the end of the 120 min simulation, mean leg volume had increased significantly from baseline in both the right leg (17.358 cm
3) and the left leg (23.234 cm
3). Other studies have shown that time is a risk factor for the development of other adverse effects, such as pain and fatigue [
2]. This study also strengthens the evidence regarding the adverse effects of static posture. A recent study showed that static standing increased leg volume compared with dynamic posture; moreover, dynamic posture contributes to reducing leg volume when stepping is performed properly [
38]. Another study also showed that static posture is unfavorable during standing work and that walking or adopting a dynamic posture helps prevent increases in leg volume [
24]. The results of this study suggest that time (at least 120 min of standing) and static posture (mobility restricted to a 20 cm space in any direction) are risk factors associated with the adverse effect of increased leg volume, and that reducing continuous standing time together with adopting a dynamic posture (movement greater than 20 cm at least every 5 min) may help mitigate increases in leg volume.
The results of this study confirm that height and body weight, as individual characteristics, are factors that influence changes in leg volume. In addition, this finding highlights the importance of considering individual characteristics or sociodemographic variables as risk factors in standing work, since in some studies they have been disregarded or treated merely as confounding variables [
2]. This study confirms body weight as a risk factor, indicating that greater body weight is associated with a significantly greater increase in leg volume across all eight scenarios simulated in this study. In a study that evaluated three different surfaces during standing work, body weight was found to be strongly correlated with leg volume, whereas height showed only a weak correlation. However, in the present study, height showed an inverse relationship with leg volume, indicating that taller participants exhibited lower leg volume. The findings of this study suggest that height and body weight are variables that influence changes in leg volume and should be examined more closely in similar contexts. Although body weight and height were statistically significant factors influencing changes in leg volume, no interaction was found between these individual characteristics and the evaluated factors; therefore, body weight and height influenced all eight scenarios similarly, with no particular scenario in which their effect was greater or smaller.
Mean left-leg volume increased by 5.876 cm
3 relative to right-leg volume. One possible explanation is that, during standing, individuals may tend to place greater weight on the non-dominant leg. In this study, 87.5% of participants had a dominant right leg, and no restrictions were imposed during the simulations regarding bilateral or unilateral weight bearing [
26]. However, in another study comparing volume between both legs in floriculture workers performing different tasks, right-leg volume was found to be 0.29% higher than left-leg volume [
39]. This result suggests that future studies evaluating leg volume in relation to standing work should examine unilateral and bilateral postural loading more closely.
Limitations
The results of this study are specific to the experimental conditions and sample characteristics evaluated; therefore, the conclusions should be interpreted within that context. Similarly, the results provide evidence on the evaluated risk factors and their influence on increases in leg volume during the 120 min period examined in this study. Although these results may serve as a basis for the future design of ergonomic interventions related to standing work, any generalization to real occupational settings should be treated only as a hypothesis requiring empirical confirmation through field studies in actual work environments.
The conditions of the tasks performed by participants limit the extent to which the findings can be generalized to occupational settings involving higher physical demands. Although the selected activities—assembling boxes, completing jigsaw puzzles, and playing Tetris—represent light manual tasks that can be performed while standing, their physical demand is considerably lower than that of many real occupational activities. In addition, this study did not include components inherent to standing work, such as manual material handling, repetitive movements or exposure to psychosocial stressors. In this regard, future studies should incorporate a more detailed quantification of physical demands—for example, movement frequency, upper-extremity involvement, or perceived exertion levels or replicate the experimental protocol using tasks that more realistically represent occupational settings in industry and service sectors.
The small sample size may have been one of the reasons why no statistically significant differences were found for some of the evaluated factors and their interactions, particularly insole use and surface type. The limited power of the factors in the post hoc analysis may explain why a significant effect was not detected. Although the results obtained provide relevant information on the observed trends and the potential relationships between experimental conditions and increases in leg volume in real standing-work contexts. Future studies with a larger number of participants will allow these findings to be confirmed and extended, thereby strengthening the understanding of occupational factors that influence increases in leg volume.
5. Conclusions
Standing work, even under conditions of low physical demand, causes a significant increase in leg volume over a short period of time (120 min of exposure). Prolonged standing time and static posture were the main factors associated with this adverse effect. The evidence obtained suggests that adopting dynamic postures and reducing uninterrupted standing time are key ergonomic strategies for mitigating increases in leg volume, regardless of the specific scenario in which the tasks are performed.
Although none of the eight experimental scenarios was statistically significant, it is important to note that the scenarios involving insole use, dynamic posture, and a soft surface showed lower mean increases in leg volume. These descriptive results suggest that such measures could be considered in the ergonomic design or intervention of standing workstations, although their effect should be confirmed in studies with greater statistical power.
Individual characteristics influence the physiological response to standing work: body weight is associated with a greater increase in leg volume, whereas greater height is associated with a smaller increase. These findings underscore the need to incorporate anthropometric variables into the assessment of risk associated with standing work and into the design of preventive interventions, moving beyond approaches that treat them solely as confounding factors and toward more integrative ergonomic models.
Overall, the findings of this study provide evidence that may be useful for developing countries such as Colombia and, more broadly, for Latin American countries, where the adverse effects of standing work remain underexplored; furthermore, based on this evidence, more in-depth studies should be developed to inform the formulation of policies or technical guidelines grounded in ergonomic principles that help reduce the adverse effects of standing work, such as increases in leg volume.




 ,
,