1. Introduction
Global supply chains have evolved into tightly coupled, globe-spanning networks whose uninterrupted operation underpins modern economic stability. Yet this very interconnectedness renders them acutely vulnerable to a spectrum of disruptions originating from geopolitical upheaval, extreme weather events, public health crises, and logistical bottlenecks [
1,
2]. The cascading effects of a single node failure can propagate rapidly, inflicting substantial financial losses and eroding organizational resilience [
3]. In this landscape, the ability to provide early warning—to anticipate whether an unfolding situation is a genuine “tipping point” or merely a “false alarm”—has become a strategic imperative for supply chain managers. However, the multi-source, heterogeneous, and often noisy nature of the data that signal such disruptions poses a formidable modeling challenge, demanding predictive frameworks that are simultaneously accurate, interpretable, and robust to uncertainty.
A substantial body of research has sought to address supply chain disruption prediction through both statistical and machine learning paradigms. Early work predominantly relied on econometric models and traditional time-series forecasting, which, while interpretable, often assume linearity and stationarity and struggle to capture the high-dimensional interactions characteristic of real-world logistics data [
4,
5]. The advent of ensemble learning methods—most notably random forests and gradient boosting machines—offered improved predictive performance by modeling non-linear relationships and feature interactions, and they have been successfully applied in contexts such as supplier risk scoring and demand volatility forecasting [
6,
7]. Concurrently, deep learning architectures, particularly long short-term memory (LSTM) networks and convolutional neural networks, have demonstrated state-of-the-art results in extracting complex temporal patterns from operational data [
8,
9]. Despite these advances, two critical gaps persist. First, the performance gains of purely deep learning approaches over carefully tuned tree-based ensembles are often marginal in tabular data regimes, while the computational cost and opacity of the former can hinder practical deployment [
10]. Second, and more importantly, most existing models operate as black-box predictors, offering little insight into why a particular shipment is flagged as high-risk. For decision-makers, actionable intelligence requires not only a disruption probability but also an understanding of the contributing factors, so that targeted mitigation measures can be designed [
11].
Recent work has begun to explore the integration of attention mechanisms—originally developed for natural language processing—into predictive models as a means of injecting interpretability. Feature-attention modules, for instance, can learn to assign dynamic importance weights to input variables, thereby making the contribution of each risk factor transparent [
12,
13]. While such mechanisms have been employed in domains like finance and healthcare, their application to supply chain disruption early warning remains nascent. Moreover, the potential of coupling an attention-based feature reweighting scheme with a high-performance ensemble learner to create a hybrid framework that jointly maximizes predictive accuracy and explainability has not been systematically investigated, particularly in the context of supply chain disruption early warning where both prediction fidelity and decision transparency are simultaneously required.
Prior work has explored combining attention mechanisms with boosting models in various domains. Ying et al. [
14] proposed a hybrid boosted attention-based LightGBM framework for credit risk assessment, where attention weights guided feature selection before boosting. He et al. [
15] developed an attention-based BiLSTM-XGBoost model for reliability assessment and lifetime prediction of digital microfluidic systems. Cao and Li [
16] demonstrated a multi-model attention fusion perceptron for subway passenger flow prediction under pandemic conditions. Han et al. [
17] designed a dual-attention convolutional network for early-stage electrical fault identification in traction transformers. Li et al. [
18] combined BiGRU-attention with XGBoost for telecom customer churn prediction. Despite these advances, the application of such attention-boosting hybrids to supply chain disruption early warning remains unexplored, and none of the existing studies provide the dual-perspective feature importance analysis (attention weights plus tree-based Gini scores) that we demonstrate here.
This represents a promising direction, especially for operational settings where both the prediction outcome and its rationale must be communicated to non-technical stakeholders.
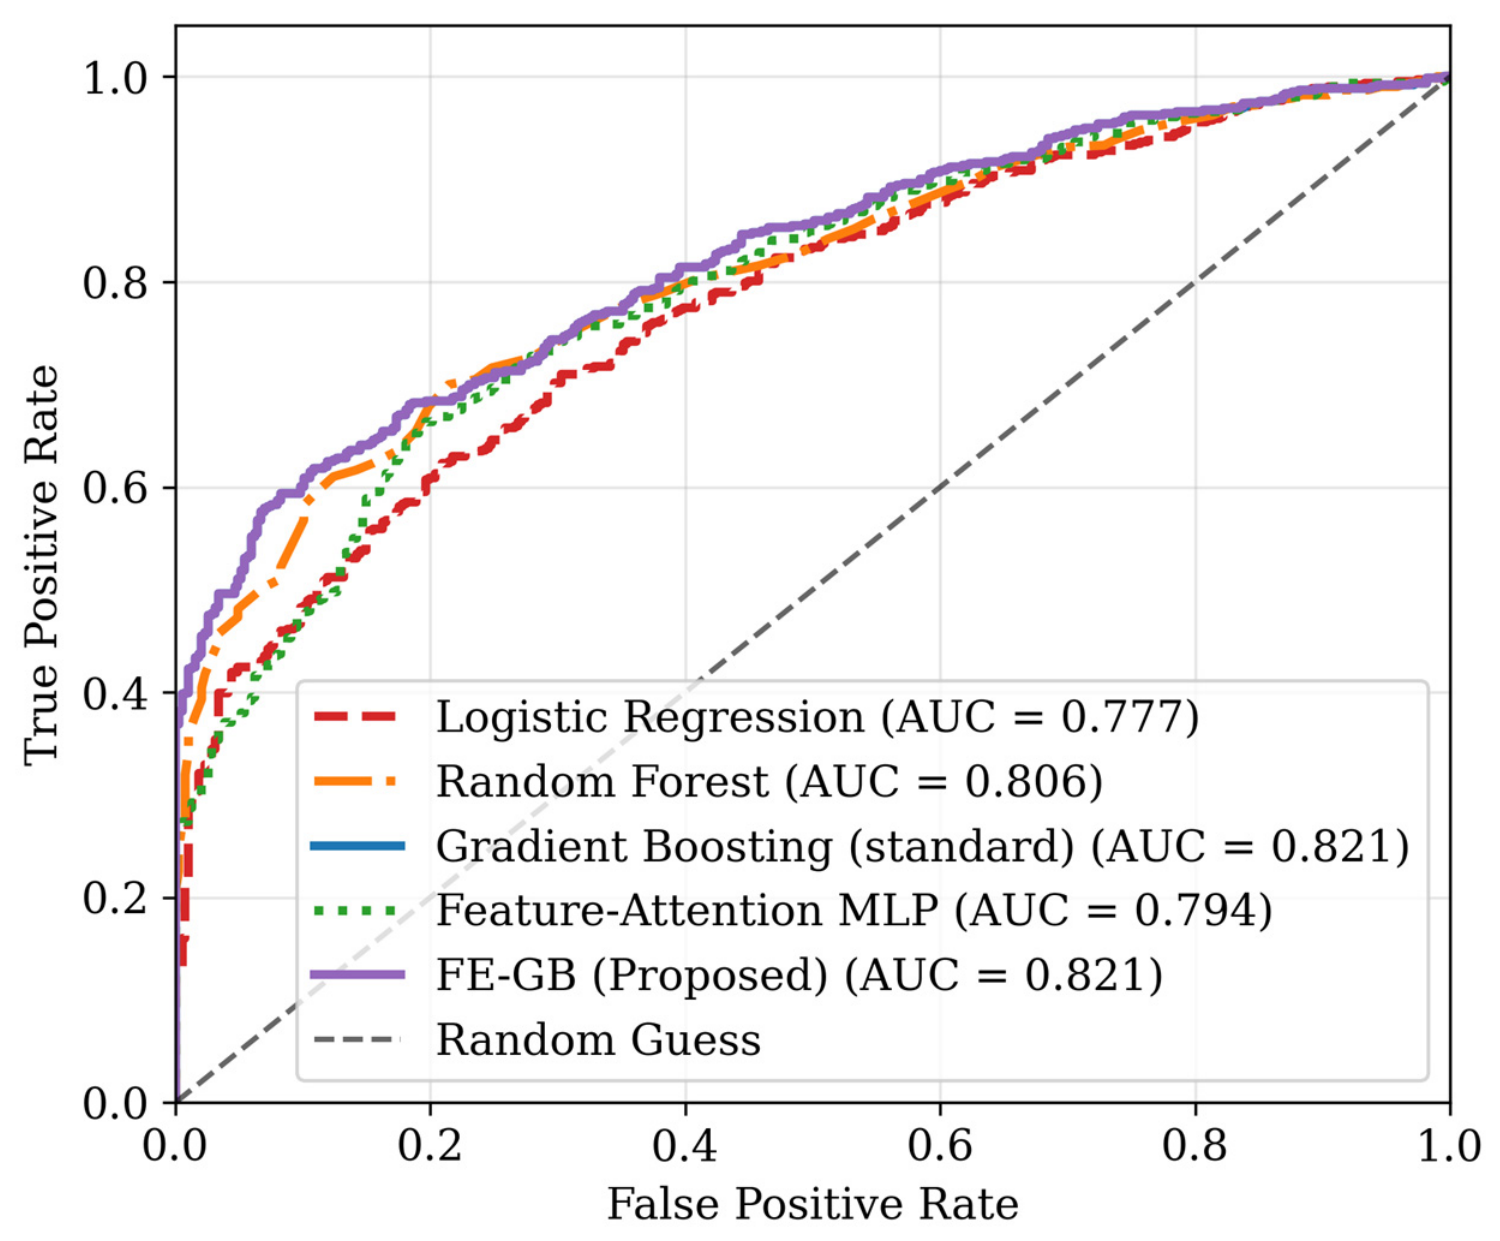
To bridge this gap, the present study proposes and validates an interpretable machine learning framework for supply chain disruption early warning that combines a feature-attention mechanism with a gradient-boosted decision tree ensemble. The framework is designed to address the dual objectives of high classification performance and managerial interpretability. Concretely, our work makes the following three contributions: (i) We design an end-to-end pipeline in which a dedicated attention network learns to weight 14 heterogeneous risk factors—spanning geopolitical, meteorological, operational, and temporal dimensions—directly from data, producing an interpretable feature importance hierarchy. (ii) We demonstrate that feeding these attention-weighted features into a gradient boosting classifier yields a predictive model that matches the best-performing gradient boosting baseline and outperforms logistic regression, random forest, and the standalone attention network on a publicly available dataset of 5000 international freight records, achieving an AUC of 0.8213 while maintaining a balanced precision–recall profile. (iii) We provide a detailed analysis of the attention weights and feature importance patterns, revealing that factors such as lead-time days, geopolitical risk score, and carrier reliability serve as dominant early-warning signals—insights that can directly inform risk mitigation strategies. By distinguishing “tipping points” from “false alarms,” the proposed framework offers a transparent decision-support tool that bridges the gap between advanced analytics and operational supply chain management.
The remainder of this paper is structured as follows.
Section 2 describes the materials and methods, including the dataset, preprocessing steps, feature-attention network architecture, and the experimental setup.
Section 3 presents the results of the model evaluation, comparative analysis, and feature importance inspection.
Section 4 discusses the implications of the findings, acknowledges the limitations of the current work, and outlines directions for future research. Finally,
Section 5 concludes the study.
2. Materials and Methods
2.1. Dataset Description and Preprocessing
The dataset employed in this study, Global Supply Chain Risk & Logistics (2024–2026), is publicly available on Kaggle at
https://www.kaggle.com/datasets/nudratabbas/global-supply-chain-risk-and-logistics-2024-2026 (accessed on 20 May 2026) and comprises 5000 records of international freight shipments, each described by 14 heterogeneous attributes and a binary disruption label. The raw variables, summarized in
Table 1, encompass categorical identifiers (origin port, destination port, transport mode, product category, weather condition) and numerical measures (distance in kilometers, weight in metric tons, fuel price index, geopolitical risk score, carrier reliability score, and lead time in days). The target variable, Disruption_Occurred, is a binary indicator taking the value 1 if the shipment experienced a disruption event and 0 otherwise. In the original sample, the positive class prevalence is 0.613, indicating a moderately imbalanced but realistic distribution.
To prepare the data for machine learning, a multi-stage preprocessing pipeline was implemented. First, the shipment date was parsed, and three auxiliary temporal features—month, day of month, and day of week—were extracted to capture seasonal and weekly patterns. All five categorical variables were integer-encoded using a standard label encoder. Subsequently, the complete set of 14 predictive features was assembled: the five encoded categorical variables, the six original numerical variables, and the three derived temporal attributes. No missing values were present in the dataset; however, forward-fill and backward-fill procedures were included in the pipeline as safeguards. Finally, each feature was standardized to zero mean and unit variance using a StandardScaler (scikit-learn 1.3.0), ensuring that all variables contributed equally to distance-based computations and that the feature-attention module received data on a consistent scale. The processed dataset was partitioned into a training set (80%, n = 4000) and a held-out test set (20%, n = 1000) using stratified random sampling to preserve the original class ratio in both splits.
2.2. Feature-Attention Mechanism
To endow the predictive framework with interpretability and to amplify the signal of salient risk drivers, a feature-attention module was designed and trained as the first component of the proposed hybrid system. The module is realized as a shallow multi-layer perceptron that receives the standardized feature vector x ∈ ℝ14 and outputs a vector of attention weights α ∈ [0,1]14 of the same dimensionality. Concretely, the architecture employs a squeeze-and-excitation-style bottleneck: the input is first passed through a hidden layer with a reduction factor of four, activated by the ReLU function, and then projected back to the original feature dimension through a sigmoid-activated output layer. This design allows the network to capture feature interdependencies and to produce a set of gating coefficients that indicate the relative importance of each input for the downstream task.
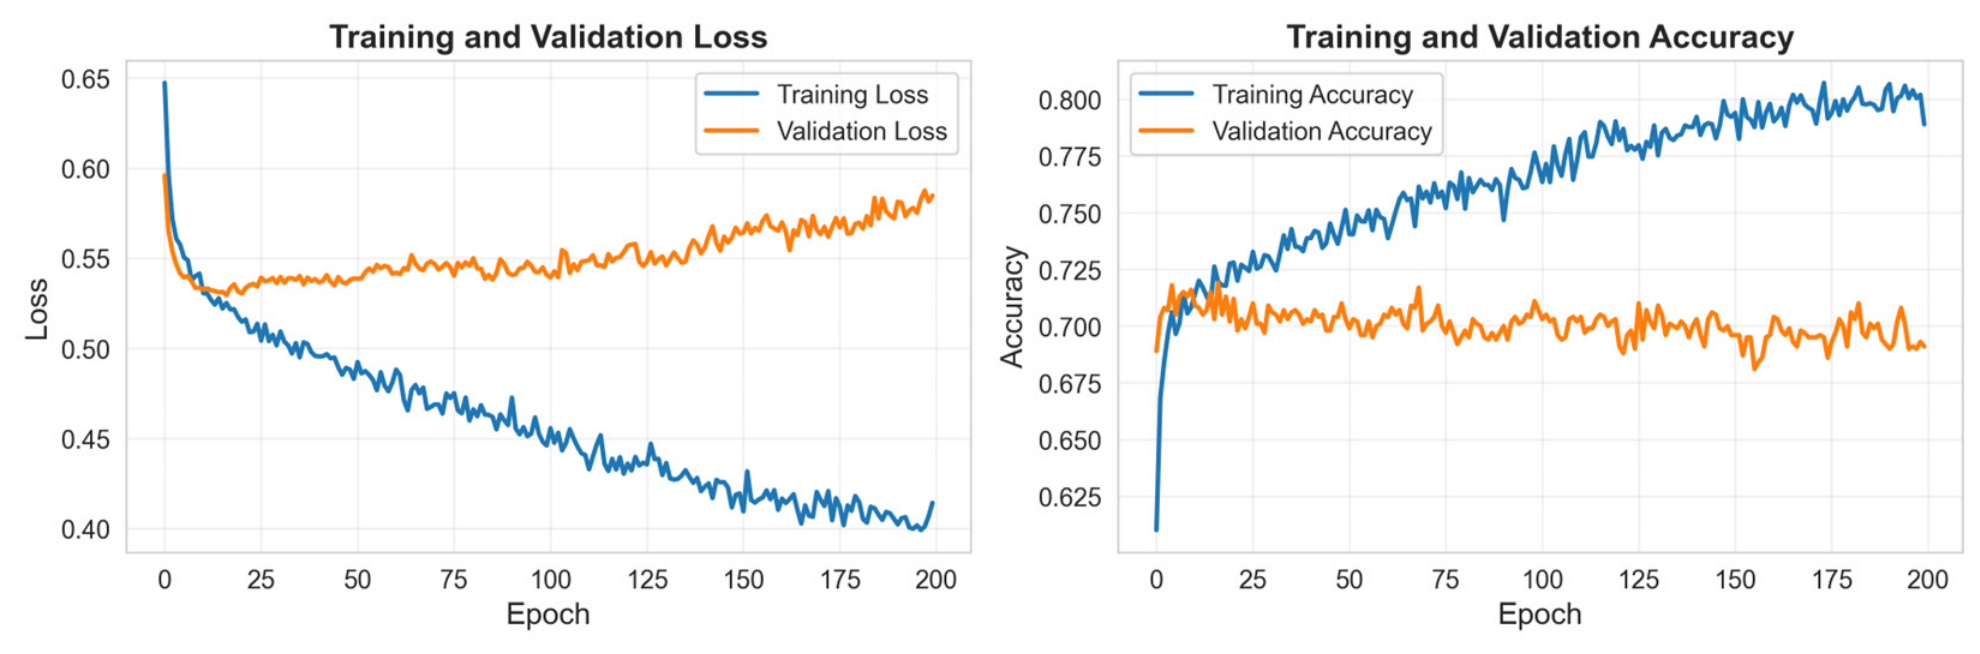
The attention network was trained for 200 epochs in conjunction with a lightweight classifier head—a two-layer fully connected network terminated by a sigmoid unit—on the training split using the binary cross-entropy loss. Early stopping with a patience of 10 was applied, and the model weights achieving the lowest validation loss (at epoch 80) were restored. Crucially, the attention weights were learned end-to-end with the classification objective, ensuring that they are optimized to highlight features that are genuinely discriminative for disruption prediction.
The training procedure follows a two-stage, sequential pipeline:
Stage 1—Attention weight learning. The feature-attention module and the lightweight classifier head are jointly trained on the training set. After training, global attention weights α are obtained by averaging the output of the attention module over all 4000 training instances.
Stage 2—Gradient boosting with reweighted features. The original standardized features x are reweighted as x′ = x ⊙ α, and a separate Gradient Boosting classifier is trained on these attention-weighted features.
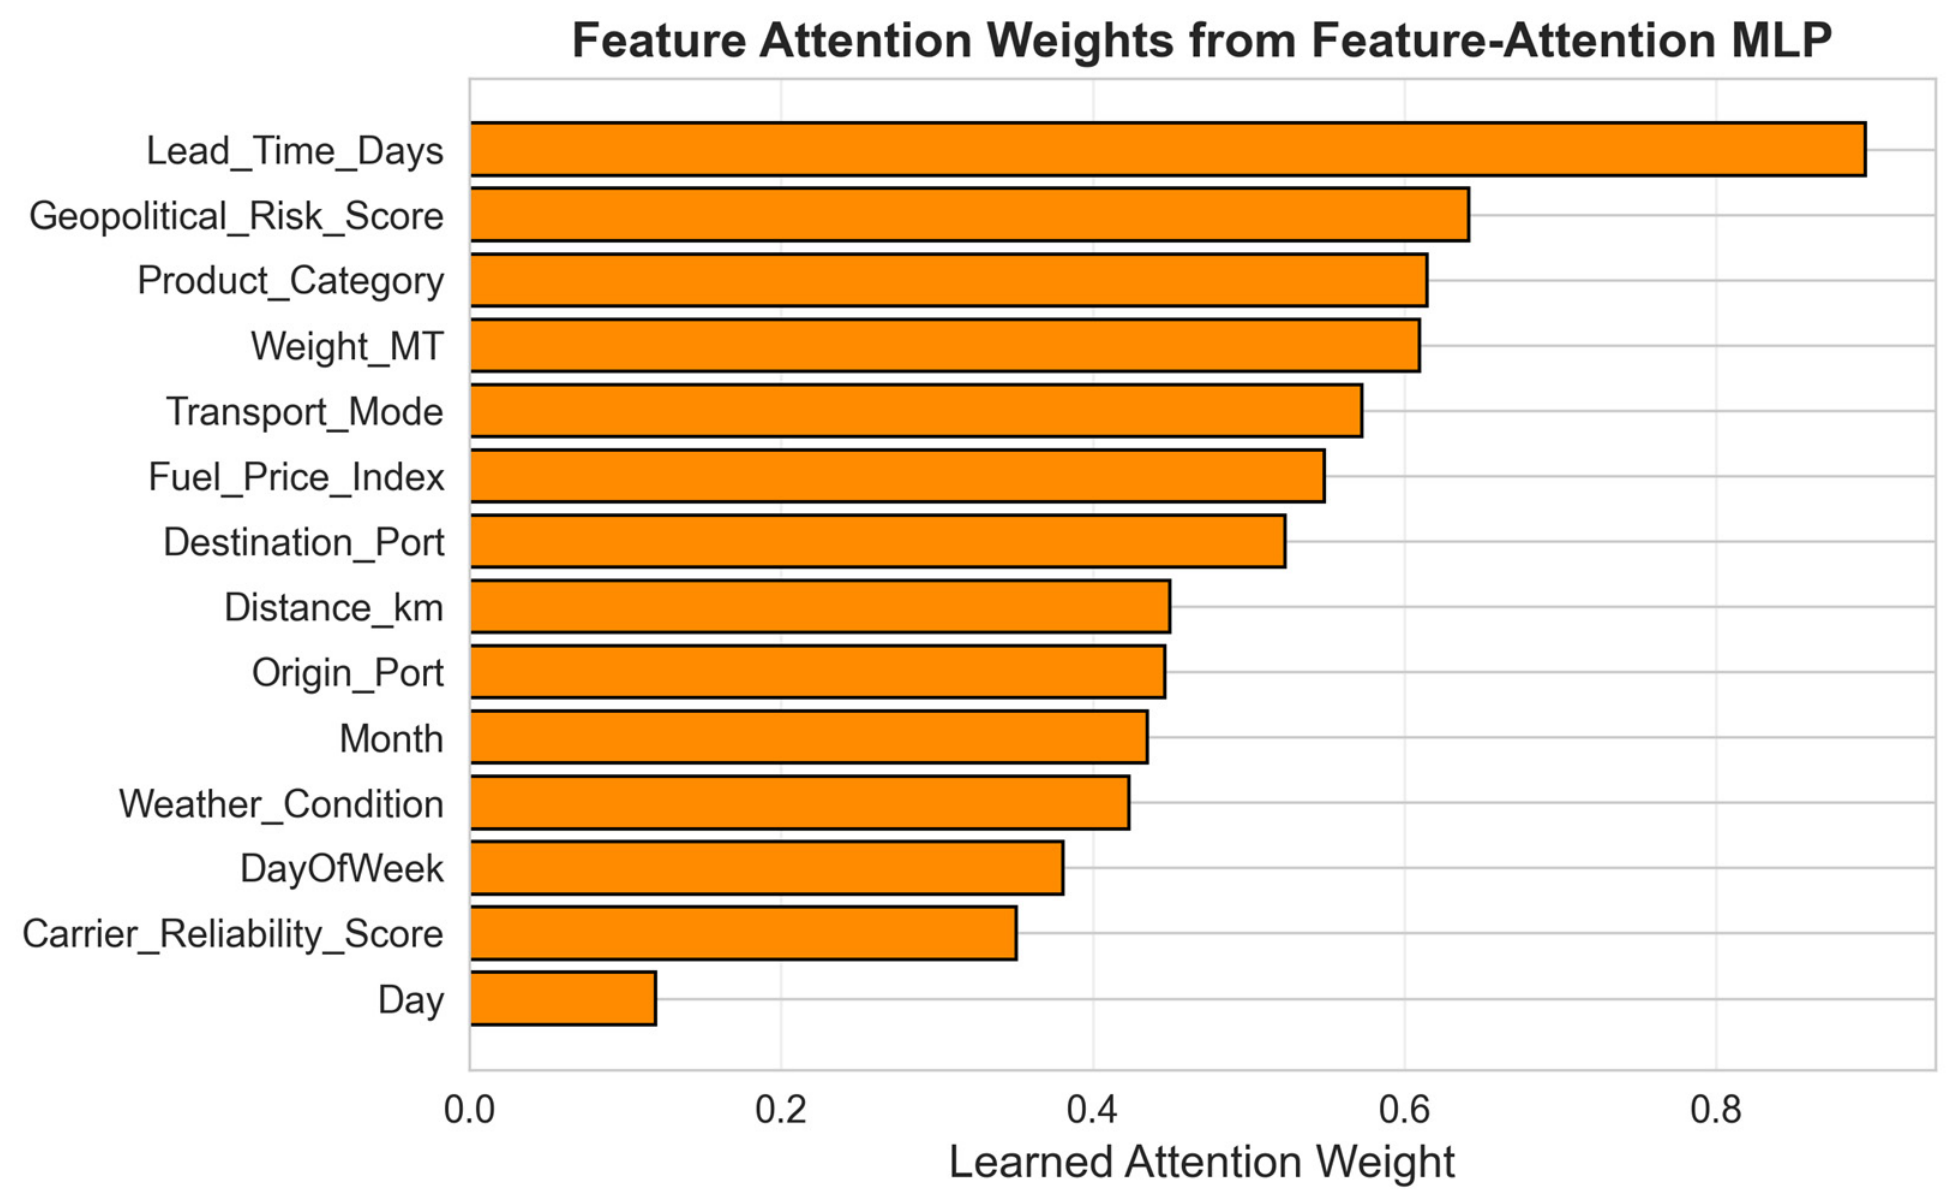
The two components are trained independently; the attention module is frozen after Stage 1, and only the learned weights are passed to Stage 2. These weights are visualized in the
Section 3.
2.3. Gradient Boosting Classifier
The core predictive engine of the proposed framework is a gradient boosting decision tree (GBDT) ensemble, specifically implemented using the XGBoost library. GBDT was selected for its well-documented ability to handle heterogeneous, tabular data, capture complex non-linear interactions, and deliver state-of-the-art performance in binary classification tasks with moderate sample sizes. In this two-stage framework, the GBDT classifier does not operate on the raw standardized features but on the attention-weighted features x′ = x ⊙ α, where ⊙ denotes element-wise multiplication. In this way, the discriminative power of the gradient boosting algorithm is synergistically combined with the attention module’s capacity to suppress noise and amplify informative signals.
The hyperparameters of the GBDT classifier were tuned via five-fold stratified cross-validation on the training set. The final configuration employed 100 boosting rounds, a maximum tree depth of 6, a learning rate of 0.1, subsampling of 80% of observations per tree, and column sampling of 80% of features per node. These settings balance model complexity and generalization, and they were held constant across all experiments to ensure a fair comparison.
2.4. Baseline Models and Evaluation Protocol
To rigorously assess the added value of the proposed hybrid framework, five baseline classifiers were implemented under identical training–test conditions: (i) Logistic Regression, serving as a simple linear benchmark; (ii) Random Forest with 100 trees, representing a bagged ensemble; and (iii) Gradient Boosting with 100 trees, representing a standalone boosting model without feature-attention reweighting. All models were tuned using the same five-fold stratified cross-validation on the training set. For LR, default hyperparameters were used due to limited tunable parameters. For RF, the number of trees and maximum depth were tuned. For GB, the learning rate, maximum depth, and subsampling ratios were tuned. All baselines were trained on the original standardized features, while the proposed model (denoted “Feature-Enhanced Gradient Boosting”) was trained on the attention-weighted features.
Model performance was evaluated on the held-out test set using five metrics that jointly capture different facets of predictive quality: accuracy, precision, recall, F1-score, and area under the receiver operating characteristic curve (AUC). Precision and recall are particularly pertinent in the context of disruption early warning, as they respectively quantify the cost of false alarms and the ability to detect true disruptions. AUC provides a threshold-independent measure of discriminative capacity. In addition, confusion matrices and ROC curves were constructed to facilitate visual comparison, and feature importance scores—both from the gradient boosting model and from the attention module—were extracted to support the interpretability analysis.
No class weighting, oversampling, or threshold tuning was applied, as the 61.3% positive class prevalence, while moderately imbalanced, does not severely distort model performance. Stratified random sampling was used during the train–test split to preserve the original class distribution. All models use the default 0.5 classification threshold.
The entire experimental pipeline was implemented in Python 3.12.0 (Python Software Foundation, Wilmington, DE, USA), using scikit-learn 1.3.0, PyTorch 2.1.0, and XGBoost 2.0.0 for the gradient boosting classifier. All experiments were executed on a standard laptop CPU (Intel Corporation, Santa Clara, CA, USA).
4. Discussion
4.1. Interpretation of Key Findings
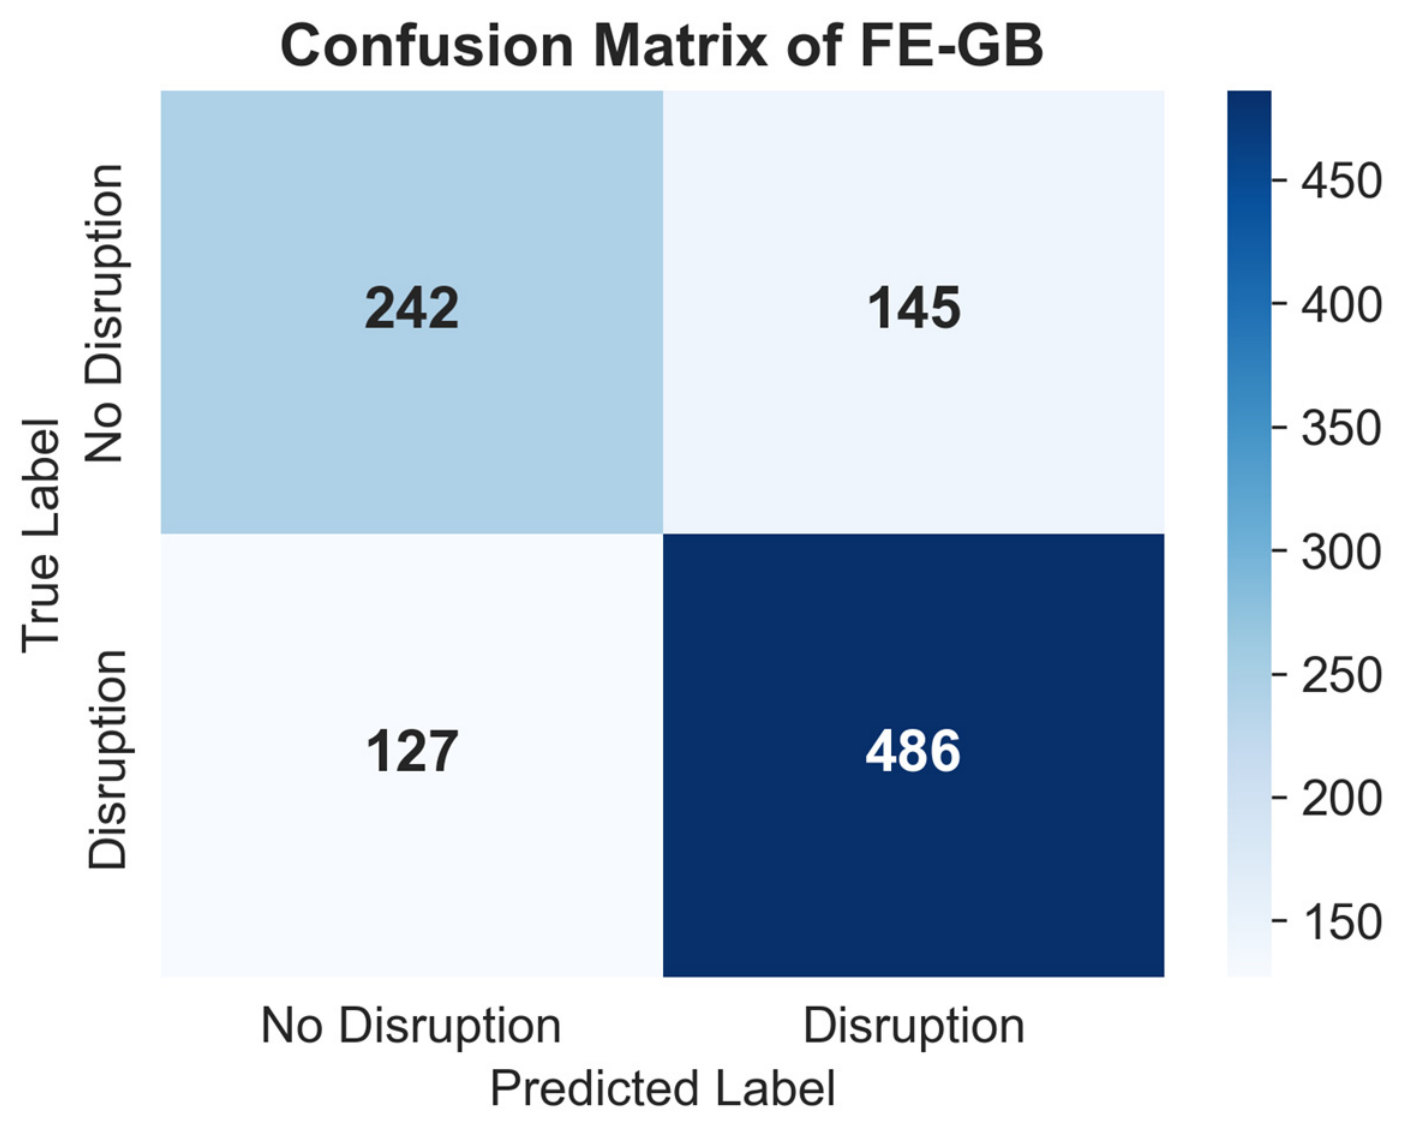
The experimental results demonstrate that the proposed FE-GB framework achieves highly competitive predictive performance for shipment-level disruption early warning, attaining an AUC of 0.8213 and an accuracy of 0.728 on a publicly available dataset. Notably, the attention-weighted features did not diminish the discriminative power of the gradient boosting algorithm; instead, they preserved its full capability while generating an interpretable layer that is absent in conventional black-box implementations. This finding challenges the implicit assumption that interpretability must come at the expense of accuracy—a trade-off that has been frequently reported in the literature [
21,
22]. In our case, the attention module acts as a feature-wise preconditioner that reorganizes the input space without distorting the underlying signal, thereby allowing the gradient boosting classifier to operate at its maximal potential.
Our finding that standard GB achieves performance equivalent to the attention-enhanced version aligns with Grinsztajn et al. [
10], who demonstrated that tree-based models often match or exceed deep learning on tabular data. Importantly, our work extends this insight by showing that a lightweight attention module can be integrated with GB without degrading performance, thereby providing interpretability—a dimension not addressed by Grinsztajn et al.—while preserving strong predictive capability.
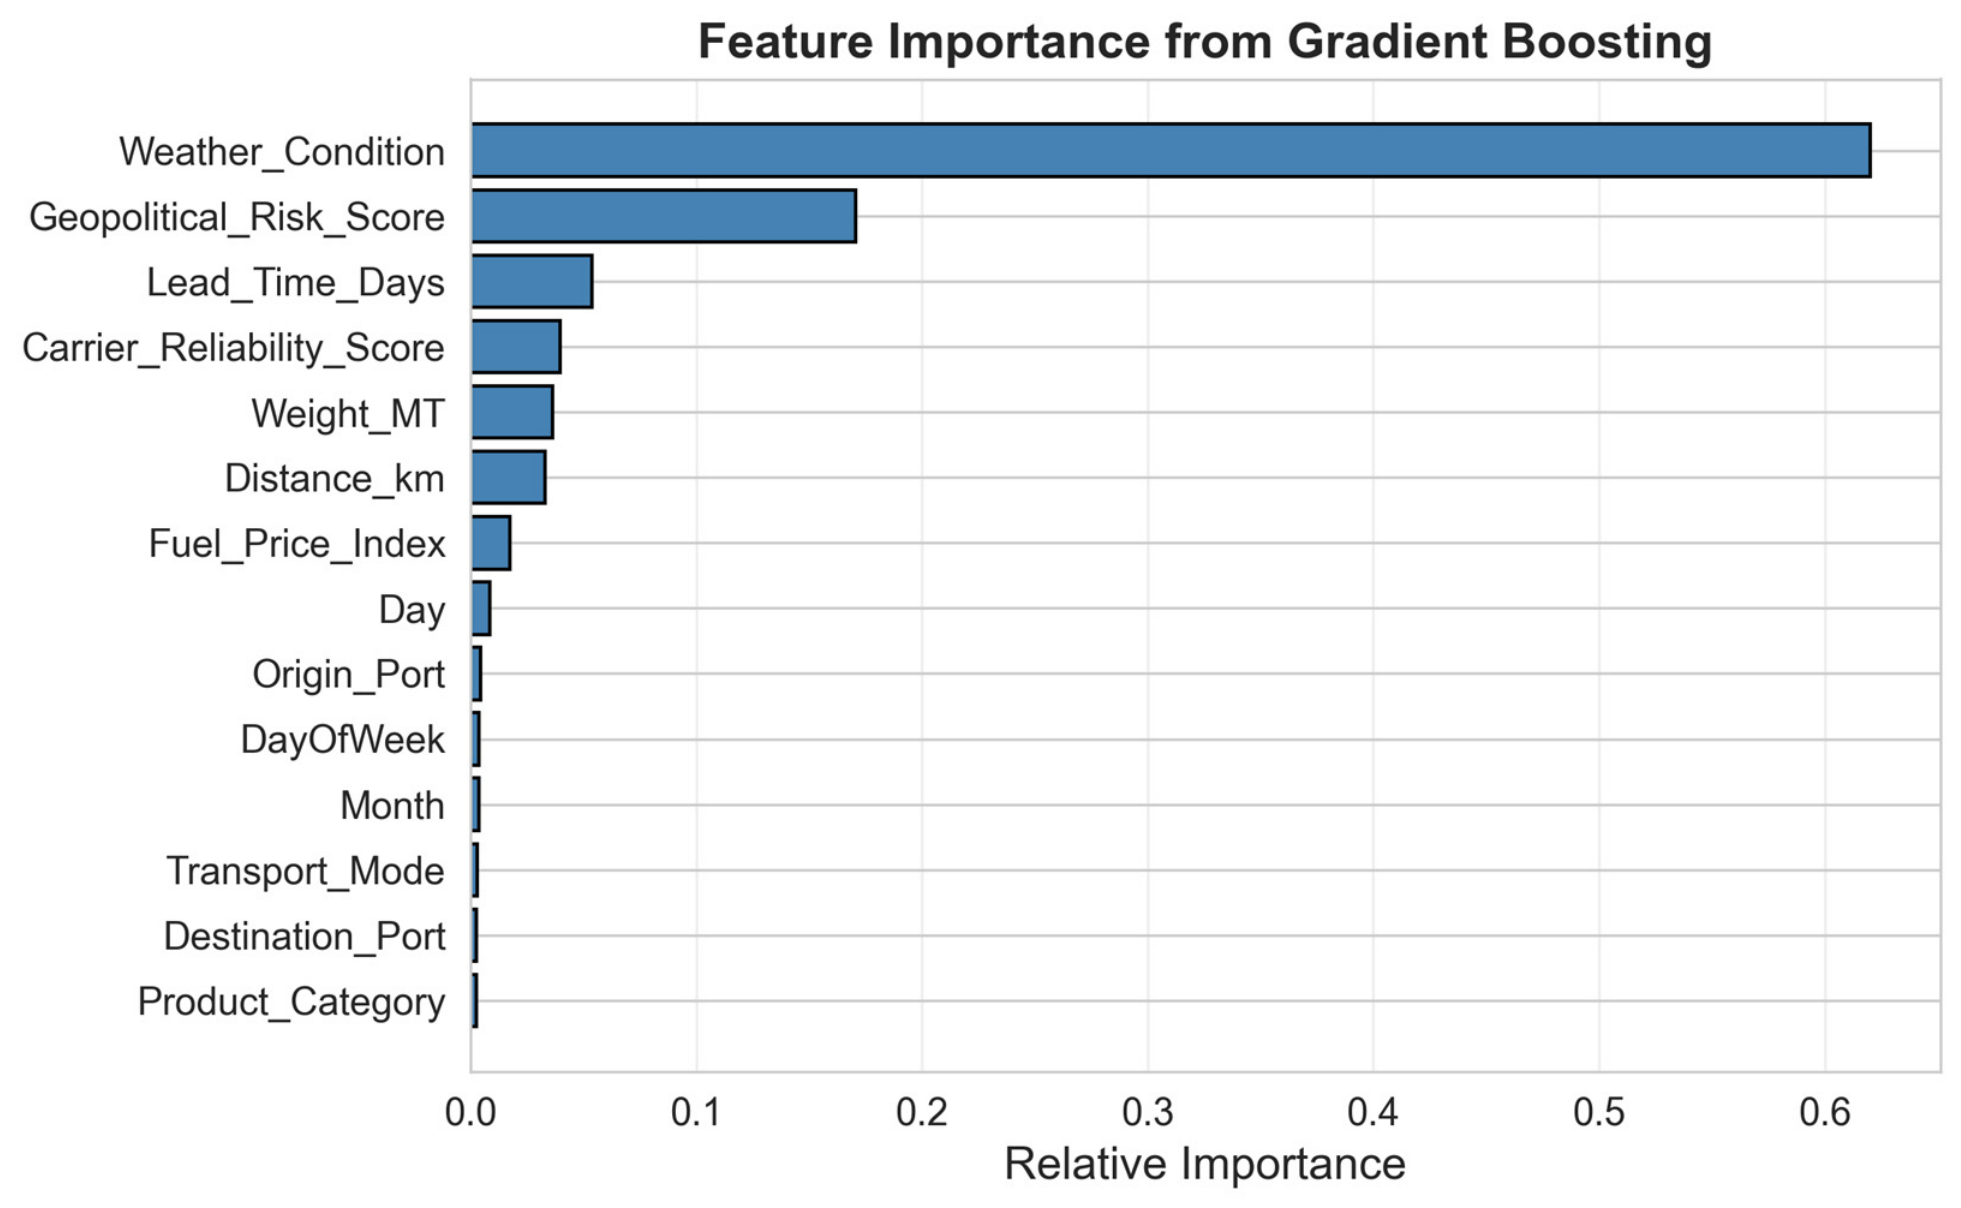
The convergence of the two feature importance analyses—the Gini-based scores from the tree ensemble and the learned attention weights—is particularly instructive. Weather_Condition, Lead_Time_Days, and Geopolitical_Risk_Score are the top three from the tree ensemble, while Lead_Time_Days, Geopolitical_Risk_Score, and Product_Category are highlighted by the attention module. The substantial overlap, particularly for Lead_Time_Days and Geopolitical_Risk_Score, strengthens the credibility of the extracted insights. The primacy of lead time aligns with established supply chain risk management principles, while the prominence of geopolitical risk resonates with recent studies on supply chain reconfigurations following trade disputes. The relatively low importance of temporal features suggests that disruption patterns are structurally driven rather than seasonally modulated.
4.2. Practical Implications
From a practitioner’s standpoint, the FE-GB framework offers three tangible advantages. First, it provides a ranked and weighted checklist of risk factors that can be directly incorporated into existing supplier scorecards or logistics platforms. Rather than treating all 14 input variables as equally relevant, managers can prioritize data collection and monitoring efforts on the top-five features identified by both the attention module and the tree-based importance scores. Second, the hybrid design retains the computational efficiency of gradient boosting—training and inference can be performed on commodity hardware without the need for specialized accelerators—which is a crucial consideration for deployment in small- and medium-sized enterprises or in field offices with limited IT infrastructure. Third, the attention weights can serve as a communication bridge between data scientists and business stakeholders. By visualizing which factors drive a disruption alert, the model transforms a probabilistic prediction into a narrative that can be understood, challenged, and acted upon by non-technical decision-makers.
4.3. Limitations and Future Research Directions
Several limitations of the present study should be acknowledged, each pointing toward avenues for future research. First, the dataset, while diverse in its feature coverage, is limited to 5000 records and a single temporal snapshot. Supply chain dynamics evolve over time, and models trained on historical data may degrade in performance when deployed in a non-stationary environment. Future work should explore online learning or continual adaptation mechanisms. Second, the current framework operates at the level of individual shipments and does not explicitly model network-level dependencies or cascading failure effects. Extending the approach to incorporate graph-structured data could yield richer predictive signals. Third, the study focuses exclusively on disruption prediction and stops short of prescriptive decision support. Embedding the FE-GB predictions within a reinforcement learning or stochastic optimization loop represents a high-impact next step.
Fourth, the dataset was sourced from Kaggle rather than directly from a logistics provider. While the data exhibits realistic distributions across all features, its provenance cannot be definitively verified. Validation on proprietary, real-world logistics datasets is needed to confirm the framework’s practical applicability. Fifth, the current study does not employ class weighting, oversampling, or threshold tuning. Future work could explore cost-sensitive learning strategies to shift the precision–recall trade-off based on the relative cost of false alarms versus missed disruptions. Furthermore, while label encoding was used for categorical variables, alternative strategies such as target encoding or frequency encoding may improve performance and should be investigated. Finally, the generalizability of the findings to other industry sectors, geographical regions, and data modalities remains an open empirical question.
4.4. Connection to the Broader Literature
The present work contributes to a growing body of research at the intersection of interpretable machine learning and operations management. Recent studies have advocated for the integration of attention mechanisms into predictive models for supply chain and manufacturing contexts, arguing that interpretability is not merely a desirable property but a prerequisite for adoption in risk-sensitive environments [
23,
24]. Our findings extend this line of work by demonstrating that a lightweight attention module can be synergistically paired with a state-of-the-art tree ensemble without any performance penalty, thereby resolving the tension between accuracy and transparency. Furthermore, the identification of lead time and geopolitical risk as dominant predictors aligns with macro-level research on supply chain resilience, which has increasingly emphasized the need for firms to map and monitor geopolitical exposure in their sourcing networks [
25]. By providing a micro-level, shipment-specific instantiation of these macro-level insights, the FE-GB framework bridges the gap between strategic risk management and operational execution.
5. Conclusions
This study set out to address a pressing challenge in contemporary supply chain management—the need for accurate, interpretable early warning of shipment-level disruption events under multi-source uncertainty. To this end, we proposed an interpretable machine learning framework that couples a feature-attention mechanism with a gradient-boosted decision tree ensemble. The attention module learns to assign importance weights to 14 heterogeneous risk factors, yielding an interpretable feature ranking that highlights lead-time days, geopolitical risk, and product category as the top-three attention-weighted features, while the Gini importance additionally identifies weather condition as a dominant predictor. The reweighted features are then fed into a gradient boosting classifier, which captures non-linear interactions and delivers competitive predictive performance. Evaluated on a publicly available dataset of 5000 international freight records, the proposed FE-GB framework achieves an AUC of 0.8213 and an accuracy of 0.728, matching the best-performing baseline while adding an explainability layer that conventional black-box models lack.
The principal contributions of this work are threefold. First, we demonstrate that a lightweight feature-attention network can be synergistically integrated with a state-of-the-art tree ensemble without any degradation in predictive accuracy, thereby resolving the oft-cited tension between interpretability and performance. Second, the dual-perspective feature importance analysis—combining tree-based Gini scores with learned attention weights—provides a robust, triangulated view of disruption risk factors. Third, the framework is computationally inexpensive and can be deployed on commodity hardware, making it accessible to a wide range of practitioners.
From a practical standpoint, the FE-GB framework offers supply chain managers a transparent decision-support tool that distinguishes genuine “tipping points” from “false alarms.” The ranked attention weights translate directly into a prioritized risk monitoring checklist. Future work should extend the current approach by incorporating temporal dynamics, modeling network-level dependencies, embedding the predictions within a prescriptive loop, and validating them on larger, multi-industry datasets. In conclusion, the proposed framework demonstrates that high-performance disruption early warning can coexist with the interpretability required for confident, evidence-based supply chain decisions.