1. Introduction
Behavior change systems are increasingly deployed in real-world environments where perceptual and decision errors are difficult to avoid. Such errors threaten both system stability and user experience. Because these systems depend on sustained engagement to produce their intended effects, even occasional failures can undermine trust, reduce motivation to participate [
1], and ultimately cause abandonment [
2]. Researchers have explored several fault-tolerant design strategies to address this problem. One direction focuses on transparency and comprehensibility [
3], for example, by providing explanatory feedback that helps users understand the reasoning and uncertainty behind system outputs [
4]. A second direction draws on emotional design, including anthropomorphic representations and social behaviors that evoke empathy and encourage charitable interpretation of system errors [
5]. A third line of work shows that acknowledging failures or offering apologies can partially restore trust and maintain engagement [
6,
7].
Recent work in human–agent interaction treats trust not as a fixed attribute but as a dynamic process of formation, violation, and repair [
8]. From this perspective, the present study examined the longitudinal effects of anthropomorphic vulnerability on users’ responses to system errors. Although highly confident agents may be effective during successful interactions, they can create different expectations regarding system reliability when errors occur. By contrast, agents who actively expressed vulnerability and uncertainty were expected to influence how users interpreted system failures, potentially supporting trust repair over repeated interactions [
8].
This study addresses two research questions:
RQ1: How did different levels of expressed agent confidence (ConfidentAgent vs. AdaptiveAgent) affect users’ immediate behavioral responses when a system perception error occurred?
RQ2: Did anthropomorphic vulnerability support long-term trust resilience and sustained engagement in a real-world behavior change task, despite continuous exposure to imperfect sensing?
To address these questions, a design approach was proposed that combined anthropomorphic presentation with explicit communication of uncertainty. Rather than maintaining the illusion of a flawless system, this approach disclosed limitations to users, aiming to cultivate realistic expectations and increase tolerance for inevitable errors. The approach was implemented in an interactive waste-sorting system and evaluated as a three-week in-the-wild case study.
The remainder of this paper is organized as follows:
Section 2 reviews relevant literature on behavior change systems, anthropomorphism, and trust calibration;
Section 3 introduces the proposed dual-channel feedback architecture and the five-level vulnerability signaling framework;
Section 4 details the design and implementation of the behavior change system;
Section 5 describes the field study and experimental methodology;
Section 6 reports the results of behavioral analysis and long-term engagement metrics;
Section 7 discusses the design implications and research limitations; and
Section 8 concludes the paper with a summary of findings and the future outlook.
2. Related Work
2.1. Behavior Change Systems in the Wild
Behavior change technologies aim to persuade users to adopt healthier or more sustainable habits, such as waste sorting or energy conservation [
9]. Foundational theories of persuasive technology often assume reliable system performance, but a critical challenge arises when interventions move from controlled laboratory settings to naturalistic ones [
10,
11]. In everyday environments, variable lighting, background clutter, and unpredictable user behavior all degrade sensor accuracy and classification reliability. These perception errors are especially damaging over time. In short laboratory studies, users may tolerate occasional errors as novelty, but during extended daily deployments, repeated faulty feedback erodes a system’s persuasive credibility and typically leads to abandonment [
12,
13]. Realistically, standard engineering responses such as improving algorithms or upgrading hardware cannot eliminate all errors under open-world conditions. Researchers have therefore argued for a shift in focus from error prevention to error management in design [
14,
15]. The challenge is not just about technical accuracy but also about how systems respond when failures occur. This directs attention towards trust repair mechanisms.
2.2. Trust Resilience and Error Tolerance
System errors in everyday behavior change applications directly threaten human–computer cooperation by undermining trust. Traditional HCI research treated reliability and accuracy as the primary foundations of trust. Research on automation trust, however, showed that users are acutely sensitive to failures: after observing a single system error, users often abandoned the system even when its average performance exceeded that of human alternatives, a pattern termed “algorithm aversion” [
2,
16].
Recent work reframed the question from error prevention to trust resilience: the capacity of a human–agent partnership to absorb and recover from trust violations [
17]. Trust cycles through stages of formation, violation, and repair [
7], and when a highly confident automated system erred, the expectation violation was severe and trust diminished sharply [
1,
18]. Designing systems that managed expectancy violations and supported active trust repair was therefore central to sustaining long-term engagement. Explainable AI (XAI) has been the most widely used approach to building initial trust through transparency [
19,
20,
21]. XAI methods expose the reasoning behind system decisions via feature attributions or confidence metrics. Their effectiveness, however, declined with frequent errors and prolonged use. Technical explanations imposed cognitive load [
22], making them poorly suited to quick, repetitive daily tasks. Over time, users habituated and stopped attending to them, and when a confident explanation proved to be wrong, it amplified perceived incompetence and deepened the expectation violation rather than repaired it [
23,
24,
25]. These limitations called for alternative, lower-burden mechanisms that handled uncertainty intuitively in everyday interactions.
2.3. Anthropomorphism, Vulnerability, and Empathy
Anthropomorphism, defined as the attribution of human-like characteristics or social cues to non-human entities, is a well-established strategy for increasing user trust [
26,
27]. Users instinctively applied social schemas to anthropomorphic agents, perceiving them as more approachable and capable [
28]. In short-term interactions, this persona buffered occasional errors: users extended a “forgiveness effect” to a failing agent as they would to a human partner, enabling rapid, informal trust repair [
12,
29]. Under long-term, error-prone conditions, however, this buffer eroded. An agent that persistently projected confidence set a high expectation threshold, and when it repeatedly failed in real-world deployments, the gap between its confident appearance and its actual performance became a source of betrayal rather than forgiveness [
30]. Users came to perceive the agent as deceptive or incompetent, which accelerated trust collapse [
31].
Recent work proposed a further shift: from projecting competence to strategically expressing vulnerability [
8]. Rather than concealing uncertainty, systems used nonverbal signals such as hesitation, averted gaze, and visible signs of internal struggle to proactively signal their limitations. Such expressions reset expectations to a realistic baseline and could elicit user empathy [
32]. The proposed connection between empathy and trust repair rests on causal attribution. When vulnerable expressions successfully evoke empathy, users may shift responsibility for failure from the agent’s character (incompetence, deception) to external situational factors such as poor lighting or task difficulty [
6,
33]. This shift could transform a mechanical failure into a shared social challenge, moving the user from critic to collaborator. The present work adopts anthropomorphic vulnerability as its core design mechanism on this basis while recognizing that the vulnerability-empathy-trust pathway is a candidate explanation that the present study can only examine in an exploratory manner.
2.4. Positioning of the Present Work
This work built on research in persuasive systems, anthropomorphic trust calibration, and error management while also accounting for shifts in user expectations brought about by widespread exposure to LLM-based AI systems [
34]. Unlike approaches that sought to improve trust through higher sensing accuracy or explicit explanations, this work focused on how systems communicated uncertainty during interaction. Anthropomorphic approaches offered a more intuitive alternative through social cues, but prior work concentrated largely on projecting competence and confidence. In long-term, error-prone settings, this orientation produced a mismatch between system behavior and user expectations whenever errors occurred. Rather than projecting constant confidence, the system expressed its internal uncertainty through anthropomorphic vulnerability while keeping task outcome feedback and confidence feedback structurally separate so that uncertain results were never presented with a confident appearance. By evaluating this design through an exploratory three-week field deployment, the work extended theoretical insights on trust repair [
8] to the semi-public, repeated-use context of ubiquitous behavior change systems.
3. Proposed Method
3.1. From Error Prevention to Uncertainty Communication
Behavior change technologies share a common persuasive logic: a system observes or infers a user’s action, evaluates it against a target behavior, and returns a feedback signal intended to reinforce correct behavior or redirect an incorrect one [
5]. This pattern underlies a broad range of everyday applications including mobile health coaches that assess dietary intake from food photographs, fitness trackers that infer exercise type from movement data, waste sorting stations that identify disposed items through computer vision, hand-hygiene monitors that detect soap application, energy dashboards that attribute consumption to behavioral patterns, and conversational agents that evaluate study or work habits. What these systems share is not only their persuasive intent but a structural dependence on automated inference: the feedback a user received was only as reliable as the underlying classification pipeline [
14,
35].
In controlled laboratory conditions, this dependence was easy to overlook. Systems could be evaluated under near-ideal circumstances, and the feedback channel could be designed to deliver a clean binary signal of correct or incorrect. In real-world deployments, however, this assumption broke down systematically. Naturalistic environments introduced noise at every step of the inference pipeline: variable lighting and occlusion in vision-based systems, ambiguous movement patterns in accelerometry, incomplete logs in dietary trackers, and atypical phrasing in conversational assessors. The resulting state of classifier uncertainty was one that conventional single-channel feedback architectures were not designed to express. When a model operated near its confidence boundary, the feedback it produced might be inaccurate, yet the system presented that feedback with exactly the same visual weight and affective tone as a high-confidence correct assessment.
This design gap had a predictable consequence. When users received a confidently presented signal that contradicted their own perception of what they had just done, the mismatch produced cognitive dissonance [
36]: they hesitated, re-attempted, or abandoned the interaction. Accumulated over weeks of daily use, this eroded trust and ultimately drove abandonment [
2,
12]. Improving classifier accuracy reduced this problem but could not eliminate it under open-world conditions. A complementary design response was therefore needed: feedback architectures that communicated system uncertainty honestly rather than concealing it behind artificial confidence.
3.2. Dual-Channel Feedback as a General Design Principle
This study proposed a general design principle for behavior change systems operating under real-world inference uncertainty: decouple task-outcome feedback from system-confidence feedback and deliver them through independent, simultaneously active channels. In traditional persuasive interfaces, the distinction between a system’s decision and its confidence level is often lost. These systems use a single channel for feedback (e.g., a “correct” animation), which lacks the vocabulary to express uncertainty [
5,
14]. This creates a transparency gap: a system’s tentative classification is rendered with the same definitive cues as a certain one. Consequently, the interface becomes “confidently wrong” during moments of low reliability, misleading users by masking the underlying probabilistic nature of the classification.
The dual-channel architecture separated these two communicative functions:
Channel 1 (Task-outcome feedback): This channel communicated the classifier’s predicted outcome to the user, functioning as the persuasive signal that drove behavior change. It operated on the same logic as conventional single-channel feedback, rewarding correct actions and flagging incorrect ones.
Channel 2 (System-confidence feedback): This channel independently communicated the system’s internal certainty. When the classifier operated with high confidence, this channel remained neutral or positive. When confidence was low, it signaled uncertainty even if the outcome channel simultaneously indicated a classification result. Critically, Channel 2 could express uncertainty before an error became apparent to the user, pre-calibrating expectations rather than reacting to a failure after the fact.
This structural separation prevented the system from projecting false confidence when it was perceptually uncertain, thereby preserving its social integrity even when technical failures occurred. The principle was application-agnostic: the same dual-channel logic applied to any behavior change system in which a sensor-classifier pipeline produced outcomes with variable confidence, including hand hygiene monitors, dietary classification systems, activity trackers, and posture monitors.
3.3. Embodying Uncertainty Through Anthropomorphic Vulnerability
The dual-channel principle left open the question of how system confidence should be communicated. A numerical display such as “73% certain” satisfied the structural requirement but imposed cognitive load [
22] and was poorly suited to the quick, habitual interactions of everyday behavior change tasks. Users did not pause to read a percentage while disposing of waste or washing their hands. Explainable AI approaches faced the same limitation: technical explanations demanded deliberate attention that habitual tasks did not afford [
25]. This study proposed embodying system uncertainty through anthropomorphic vulnerability by mapping system confidence to the nonverbal expressive state of an embodied agent. Anthropomorphism is a well-established design strategy for increasing engagement and trust in interactive systems [
26]. Humans are highly adept at reading nonverbal social cues such as hesitation, averted gaze, and slouched posture as signals of internal uncertainty, and they do so rapidly and without deliberate effort [
37]. An agent that visibly looked uncertain communicated the same information as a confidence score but did so through a channel that users processed automatically and intuitively.
Conventional anthropomorphic designs projected competence: the agent was made to appear confident, capable, and cheerful at all times [
5,
38]. Under long-term, error-prone conditions, this strategy backfired. Persistent confidence set a high expectation threshold, and repeated failures widened the gap between apparent capability and actual performance until users perceived the agent as deceptive rather than just imperfect, accelerating trust collapse [
31]. The present work proposed a reversal: using anthropomorphism to express vulnerability rather than to project competence. Rather than concealing uncertainty, the agent communicated its internal confidence state through posture, facial expression, and motion intensity. When the underlying classifier was confident, the agent was upright and animated; as confidence declined, it became hesitant, subdued, and visibly distressed. The candidate mechanism underlying this approach is that proactively signaling struggle may reset user expectations to a more realistic baseline and elicit empathy [
32,
39], potentially transforming a trust violation into a shared social challenge.
3.4. Five-Level Expressive Framework
To operationalize anthropomorphic vulnerability as Channel 2, the agent’s expressive repertoire was structured into a five-level confidence scale [
40], shown in
Table 1. Levels ranged from very confident to highly vulnerable, each corresponding to a distinct combination of postural, facial, and motion signals that users could understand without instruction. Higher-confidence states conveyed reliability through energetic postures and face. As confidence declined, the agent transitioned into vulnerable states characterized by distressed facial features. This mapping translated opaque probabilistic uncertainty into an intuitive social signal that tempered user expectations before an error occurred.
To verify that the designed facial expressions correctly conveyed the intended confidence levels, we conducted a formative cognition survey (
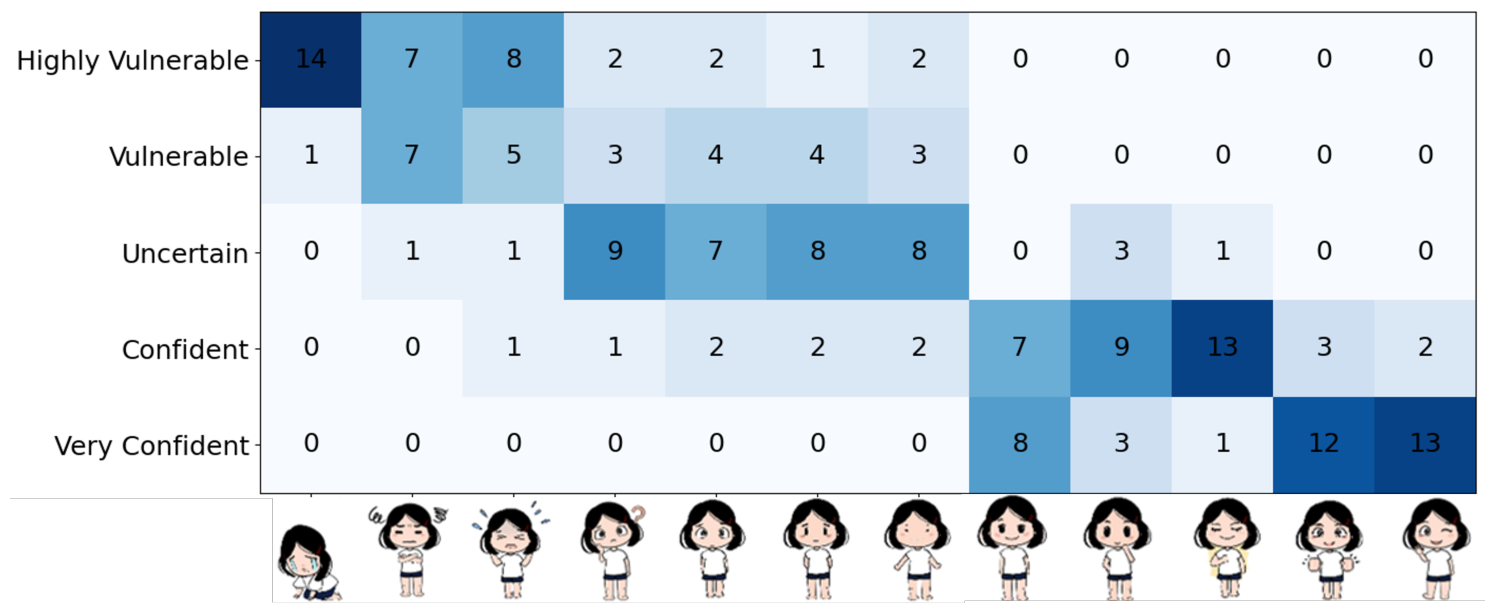
; 8 females, 7 males) as a design and validation step before deployment. A total of 12 candidate agent expressions were designed across five confidence levels. The survey was conducted in three iterative rounds, with the expression designs revised after each round based on participant feedback. The final survey results are shown in
Figure 1. The optimal result from each design was selected as the final confident expression scheme for the anthropomorphic agent.
The five-level structure was designed to be system-agnostic. The full posterior probability range
, where
n is the number of target classes in any given classifier, was partitioned into five equal-width intervals, each corresponding to one expressive level.
Table 2 specifies this general mapping.
4. Design and Implementation of a Waste Sorting Behavior Change System
To empirically evaluate the proposed dual-channel framework, it was instantiated as a concrete interactive system targeting plastic waste sorting behavior.
4.1. Target Behavior and Intervention Design
Plastic waste mismanagement contributed well-documented harm to marine ecosystems: incorrectly sorted plastics escaped recycling pipelines and accumulated in waterways and oceans [
5]. Improving public sorting accuracy thus carried direct ecological relevance. Waste sorting was also technically well-suited to evaluating the dual-channel design: the target behavior was discrete and detectable at the moment of action, disposal stations were encountered multiple times daily, and sorting errors occurred even among motivated users [
35], precisely the conditions of naturalistic classification uncertainty that the framework was designed to handle.
The system was designed as a feedback intervention rather than a fully automated sorting machine. An automated bin that sorted on the user’s behalf would have bypassed the human judgment the study aimed to improve, and would have required structural modifications preventing attachment to standard public waste bins. A feedback-only design attached to existing infrastructure, targeted the formation of correct sorting habits, and, critically for the research, kept the physical sorting outcome identical across all experimental conditions so that only the feedback strategy varied. For Channel 1 behavior-level feedback, an animated whale character was chosen whose health state reflected the cumulative correctness of the user’s sorting behavior. This choice was grounded in the ecological narrative connecting the target behavior to its environmental consequences: correct disposal sustained ocean health, represented by a healthy whale, while repeated incorrect sorting degraded the marine environment, represented by progressive injury to the whale across four severity levels. This frame made the causal link between a single disposal event and its macro-level ecological impact immediate and emotionally legible [
5], consistent with established principles of persuasive technology.
4.2. Functional Requirements
The design goal and dual-channel framework together generated four functional requirements, stated independently of any specific implementation technology:
Action detection: The system had to detect when a user disposed of an item and classify it into a behavioral category (plastic waste, burnable waste, or non-disposal event) in real time.
Confidence estimation: The system had to produce a continuous internal confidence value for each classification decision, reflecting the reliability of action detection.
Channel 1 (Behavior-level feedback): The system had to deliver an immediate, affectively salient outcome signal following each disposal event, communicating whether the sorting decision was correct or incorrect.
Channel 2 (System-level feedback): The system had to simultaneously deliver an independently driven signal communicating the system’s internal confidence level through the five-level anthropomorphic framework.
For the research context, an additional requirement applied: behavioral logging. The system had to passively record interaction events, timing, and proximity data to support post hoc analysis without disrupting naturalistic interaction or compromising user privacy.
4.3. Implementation
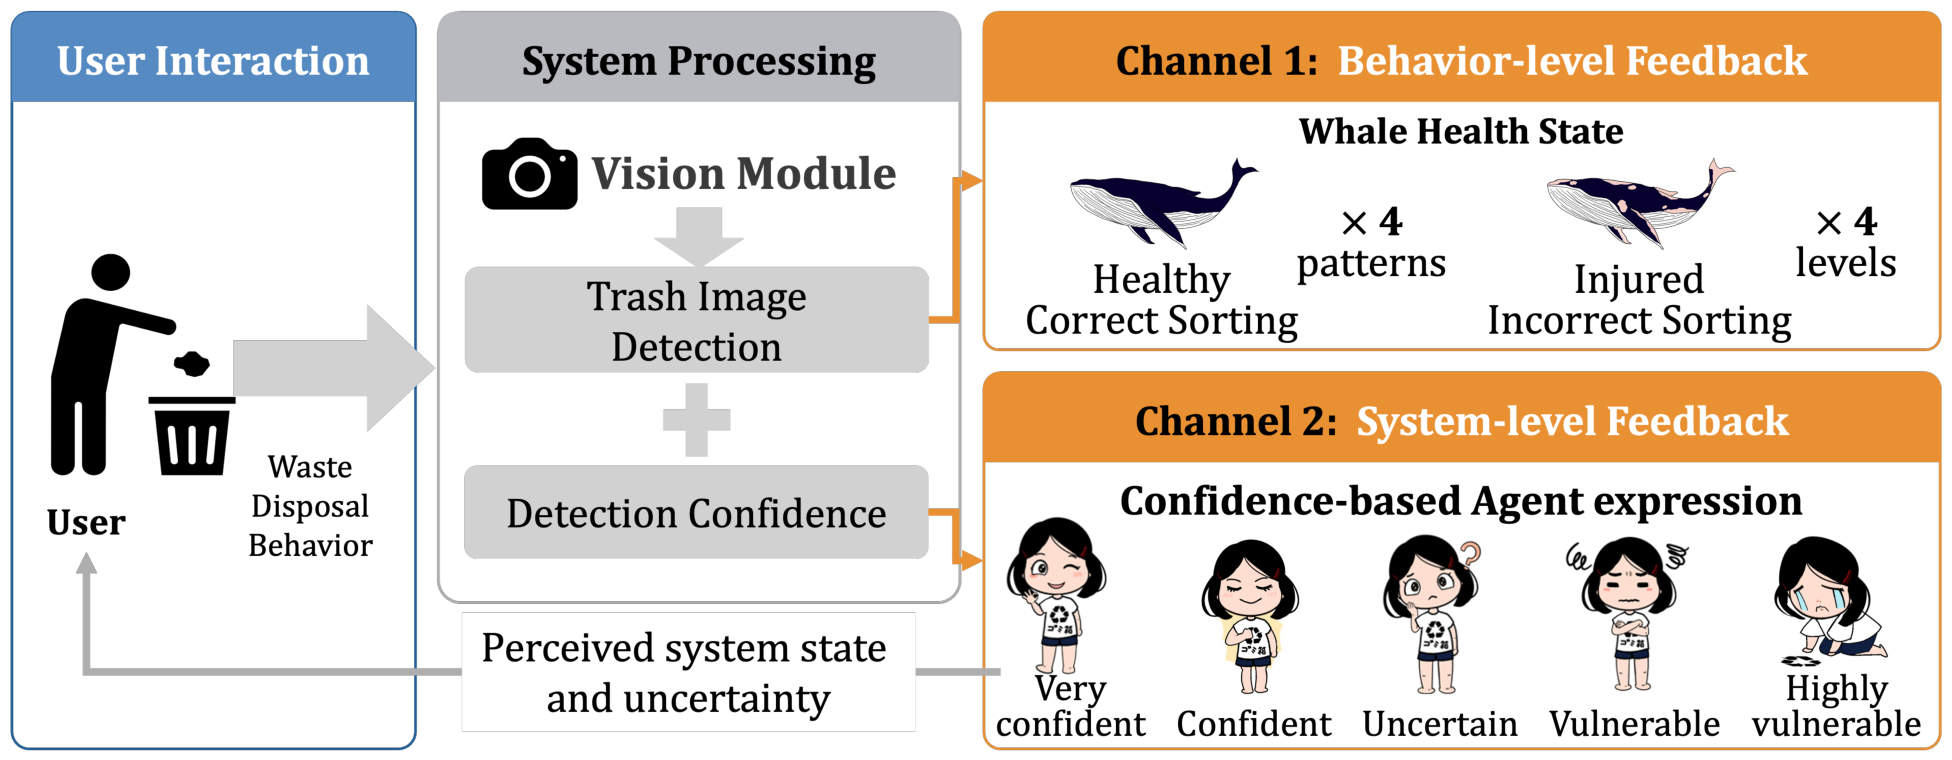
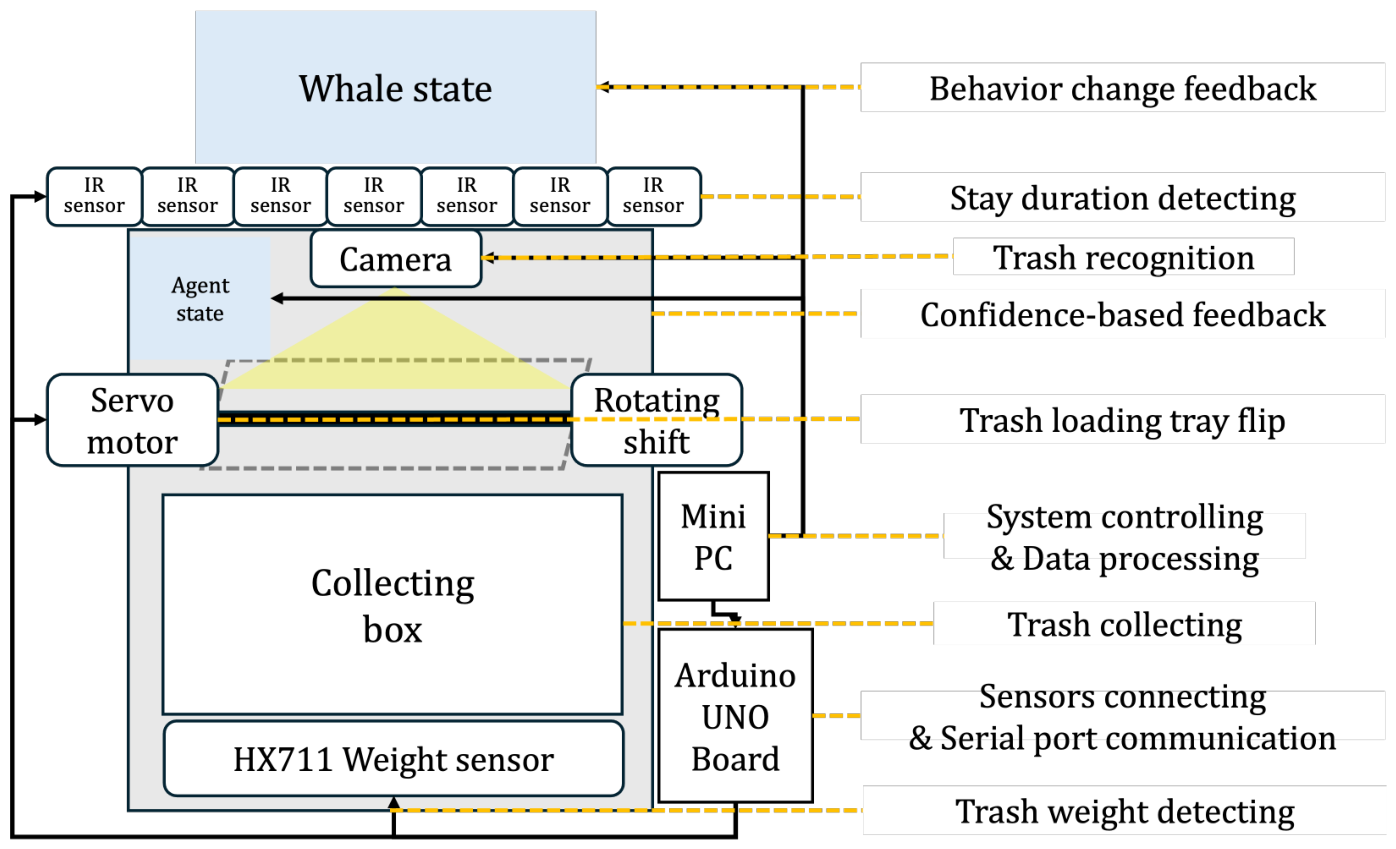
The general architecture is illustrated in
Figure 2. Channel 1 delivers task-outcome feedback through the whale narrative (correct disposal sustains whale health; repeated errors injure the whale). Channel 2 delivers confidence-state feedback through the anthropomorphic agent’s expressive state, which is driven by the detection confidence (see
Section 5.5). The final confidence-based agent expression was decided in
Section 3.4.
The system was implemented that integrated sensing, computing, and display components into one unit that attached to a waste bin.
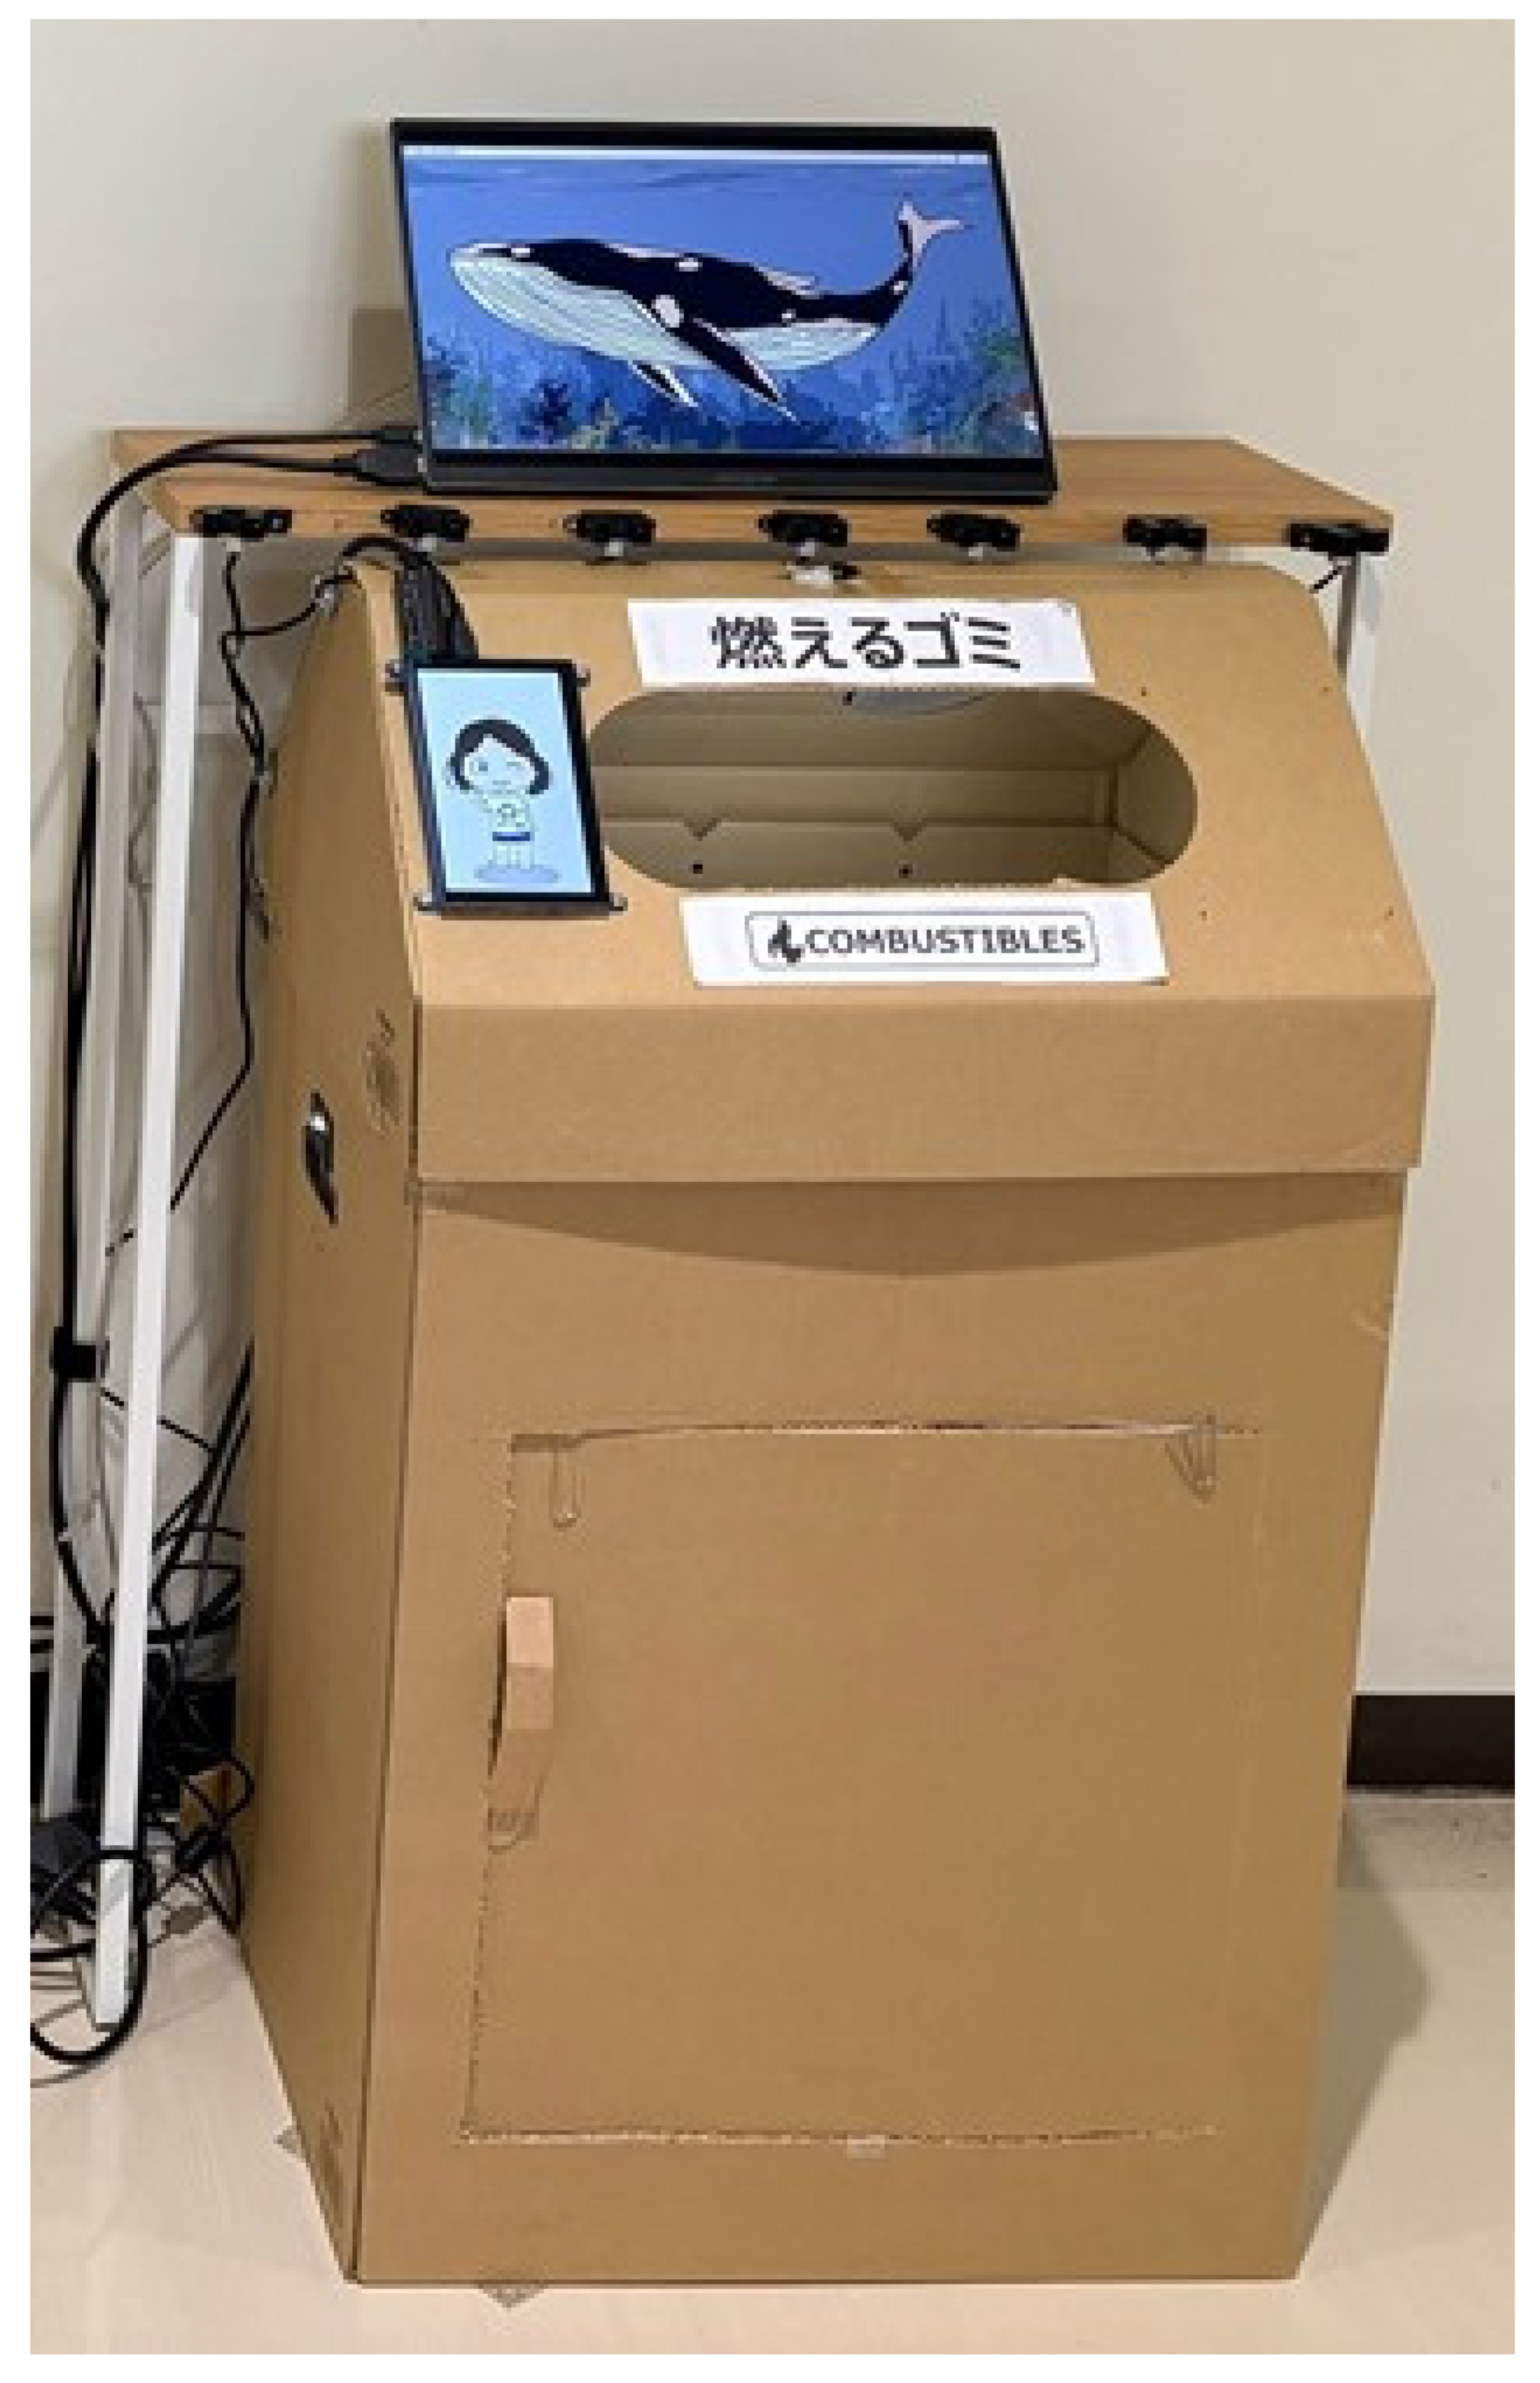
Figure 3 illustrates the hardware configuration, and
Figure 4 shows the deployed prototype.
Physical action. An Elecom autofocus webcam (2 MP, 60 fps, Full HD) equipped with a LED ring light was mounted downward above the loading tray inside, capturing an image of each item at the moment of disposal under consistent illumination. Once an item was classified, a Smraza digital servo motor (20 kg·cm torque, 270° control range) connected to an Arduino UNO R3 board drove a rotating tray mechanism that physically directed the disposed item into an internal collecting box. All computations ran locally on the MINISFORUM UM760 mini PC without requiring an external network connection.
Feedback display. The whale character for Channel 1 was displayed on a 14-inch screen, accompanied by an ocean background. The anthropomorphic agent for Channel 2 was displayed on a 5-inch LCD screen, which is mounted to the left of the trash disposal slot.
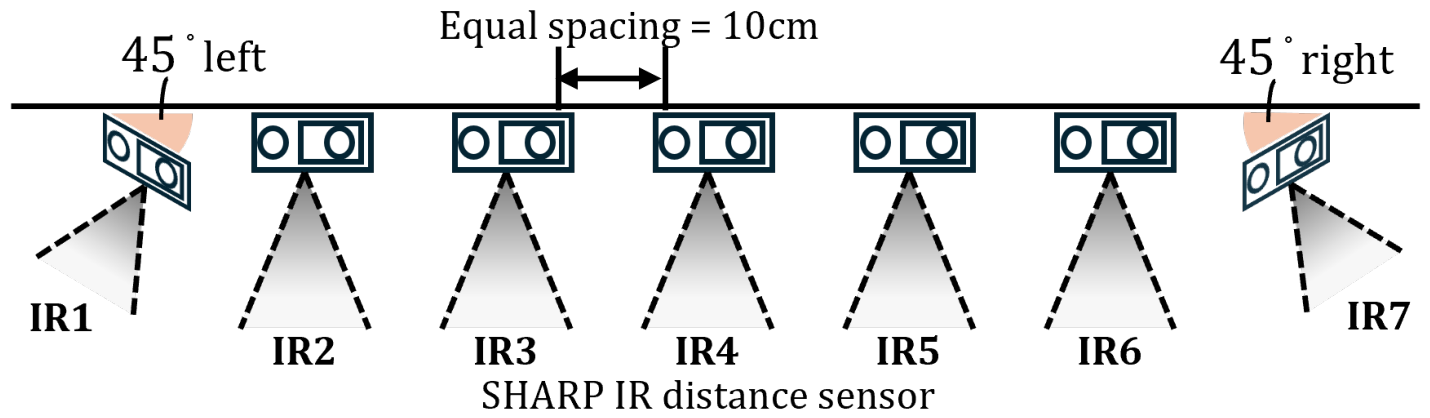
Behavioral logging. Seven Sharp GP2Y0A02YK0F infrared (IR) distance sensors (detection range 20–150 cm) were connected to the Arduino UNO board. As illustrated in
Figure 5, the sensors are mounted in a linear array along the unit’s front exterior; the outermost units are angled to expand the peripheral detection envelope. The system logged timestamps, sensor activation sequences across all seven positions, and the resulting stay duration for each interaction episode, providing the dense behavioral data used in stay-duration and interaction-frequency analyses.
4.4. Item Classification
For item classification, MobileNetV3-Small [
41] was deployed, a lightweight convolutional neural network chosen for efficient on-device inference on the embedded mini PC without requiring a network connection. The model operated in near real time, with a mean per-frame inference latency of approximately 60 ms. The complete feedback pipeline, from item placement through image capture, classification, servo actuation, and display update, took approximately 3 s, ensuring prompt feedback delivery.
The training dataset combined the open-source TrashNet dataset [
42] with custom images captured in the deployment environment. Images were labeled into four classes: burnable waste (1087 images), plastic waste (1097 images), background, and hand. Including background and hand classes suppressed false positives arising from environmental clutter and incidental hand presence, which was a critical design choice for an always-on installation. The fine-tuned model achieved a training accuracy of 0.91, a validation accuracy of 0.88, and a held-out test accuracy of 0.87. The raw posterior probability of the top-predicted class serves as the baseline confidence signal to the Channel 2 system-level feedback pipeline. The derivation of the operative confidence value
p was used to drive the agent’s confident expression as shown in
Section 3.4.
5. Field Study
5.1. Study Design
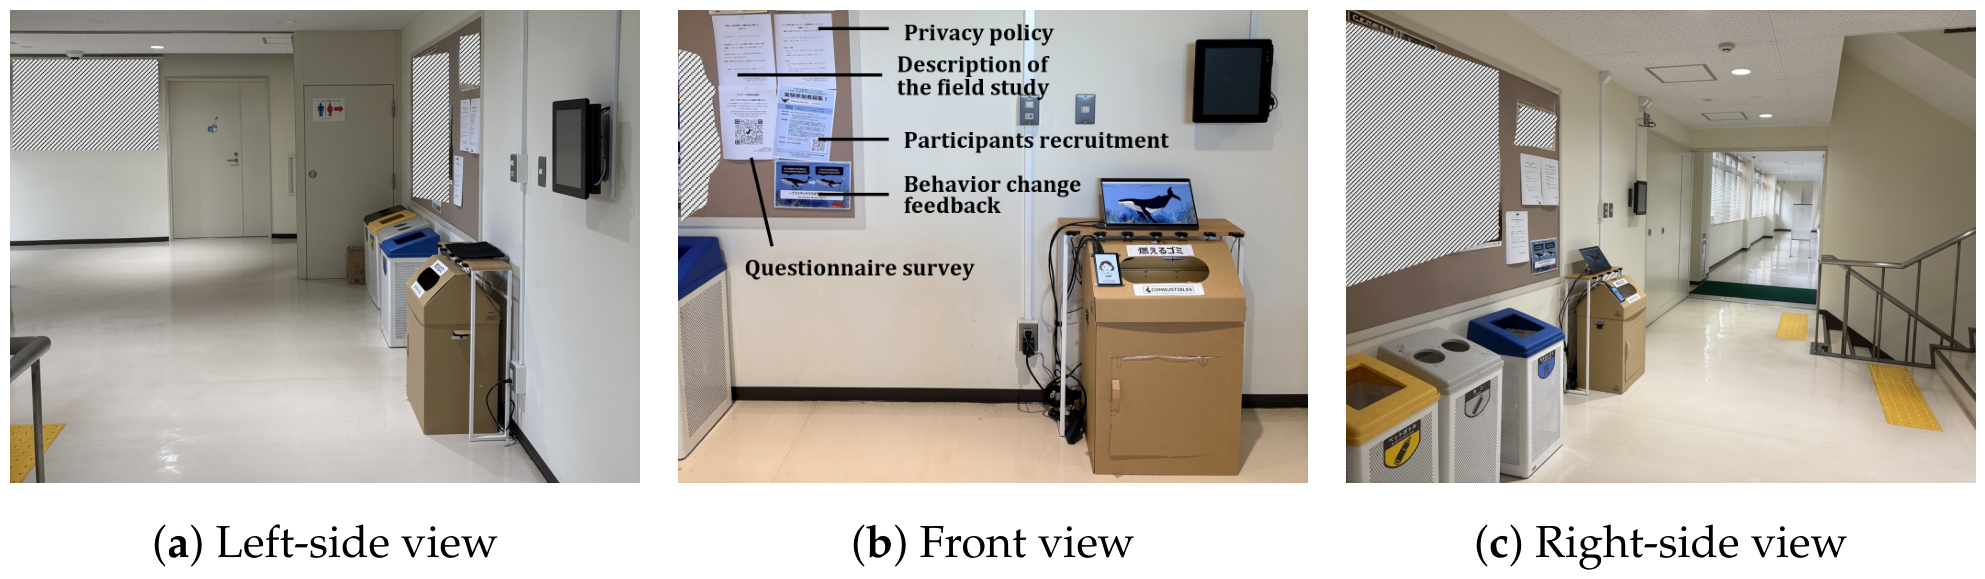
To evaluate the proposed system under naturalistic conditions, a three-week exploratory field deployment was conducted in which the interactive smart trash bin was installed in a common corridor of a university building, replacing a traditional waste disposal station.
Figure 6 shows the deployment environment from three viewpoints. Instructional posters placed next to the bin explained the behavior-change feedback mechanism to passers-by (e.g., correct sorting maintained the whale’s health, while incorrect disposal injured it).
The deployment spanned three weeks, each corresponding to one experimental condition administered in the following fixed order: Condition 1 (WhaleOnly) in Week 1, Condition 2 (ConfidentAgent) in Week 2, and Condition 3 (AdaptiveAgent) in Week 3. This ordering was chosen to progress from baseline feedback to the most complex adaptive condition, minimizing carryover effects from prior exposure to anthropomorphic agents. The condition active in a given week was not disclosed to users; the system’s outward appearance remained unchanged across conditions except for the agent display, and no signage indicated that the feedback strategy had changed between weeks. Users who interacted over multiple weeks might have noticed a change in agent behavior but were not informed of the experimental structure.
Condition 1 (WhaleOnly): Outcome-based feedback was delivered via the whale character only, without the anthropomorphic agent.
Condition 2 (ConfidentAgent): The agent was present and maintained a consistently high-confidence expression regardless of actual detection confidence.
Condition 3 (AdaptiveAgent): The agent’s expressions, ranging from very confident to highly vulnerable, were dynamically mapped to the detection confidence output.
The system was available for voluntary use by anyone in the vicinity during their normal daily routines, ensuring high ecological validity. To maintain comparability across conditions, each seven-day deployment period was monitored for atypical events that could distort the interaction record. On days when a scheduled campus event substantially reduced corridor traffic or introduced an anomalous usage spike, data from the affected day were replaced with data from a corresponding weekday in the immediately following week under the same condition. This substitution ensured that each condition’s record reflected typical daily interaction patterns rather than event-driven outliers.
The experimental protocol was approved by the Institutional Review Board of the Tokyo University of Agriculture and Technology (No. 250907-0742).
5.2. Participants
The system was installed in the corridor connecting the laboratory floors to the elevator lobby, an area frequently passed through by building users during their daily activities and when disposing of trash. Under normal weekday conditions, approximately 30 regular users (graduate students, researchers, and faculty members from nearby laboratories) pass through this area during their daily routines; therefore, they are likely to come into contact with the system multiple times during the deployment period. When scheduled classes are held in adjacent classrooms, an estimated 40 additional undergraduate students are expected to pass through the corridor, thereby increasing the potential exposure population. This study did not intentionally recruit participants; interaction with the system was entirely voluntary, and users could decide whether to participate during their normal activities. To protect user privacy and comply with ethical guidelines for public deployment, the system did not collect personally identifiable information such as facial images or personal identification numbers. At the end of each experimental week, questionnaires were distributed to users who voluntarily provided subjective feedback. Due to the naturalistic design, the number of respondents varied: 11 participants completed the questionnaire in Condition 1, 9 in Condition 2, and 10 in Condition 3.
5.3. Data Analysis Strategy
The two research questions called for different types of evidence. RQ1 required a fine-grained, moment-level account of how users responded at the instant a system error occurred. This pointed toward behavioral metrics derived from sensor logs, specifically the temporal pattern of each interaction event. RQ2 required evidence at a longer timescale, capturing whether sorting behavior and engagement remained stable or degraded across the full deployment period. Subjective data were needed to complement the behavioral record by indicating whether the observed differences were also reflected in users’ own perceptions of trust and empathy. To address these demands, the analysis was organized into three complementary streams.
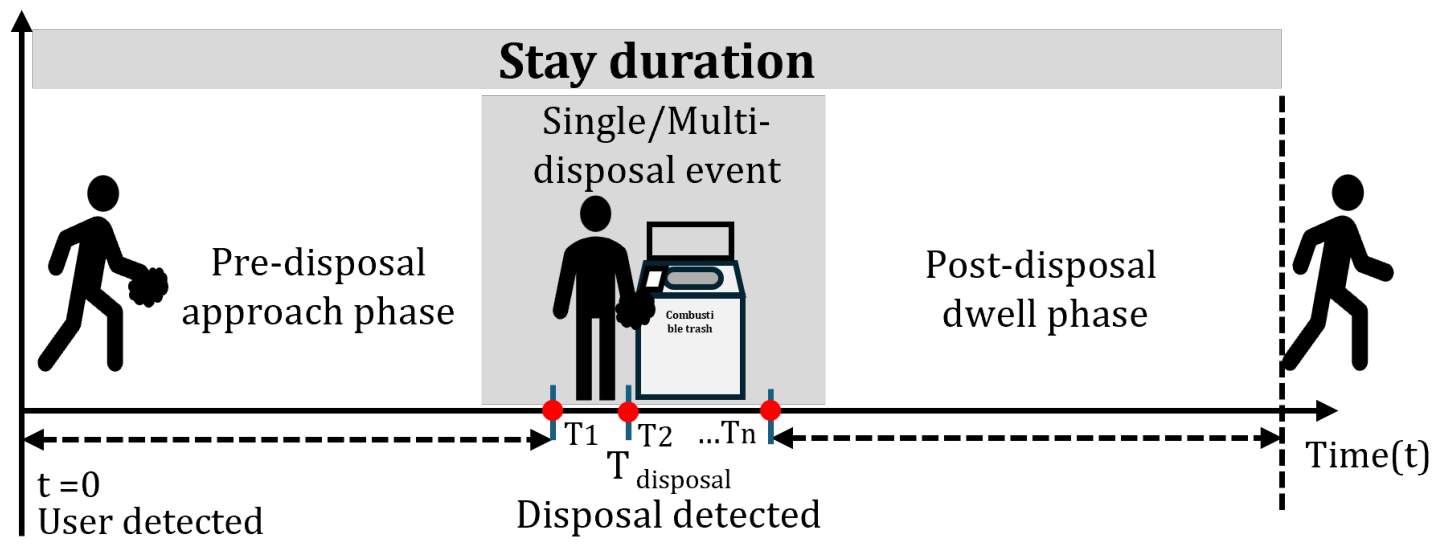
Stream 1 (Quantitative behavioral metrics) was designed to analyze both RQ1 and RQ2 from the system’s continuous interaction logs. For RQ1, the primary measure was stay duration during incorrect classification trials: a short duration after an error indicated that the user resolved the interaction efficiently, while a prolonged stay suggested hesitation or confusion. To isolate where this temporal cost arose, each interaction duration was decomposed into a pre-disposal approach phase and post-disposal dwell phase, illustrated in
Figure 7. Stay duration refers to the total time a user was detected during an interaction. The duration before the first disposal behavior was described as the pre-disposal approach phase. The duration after the last disposal was defined as the post-disposal dwell phase. For RQ2, the primary measure was the daily classification correctness trajectory across the deployment week, with daily disposal weight serving as a supplementary indicator of engagement stability. Between-condition differences were tested with one-way ANOVA and post hoc Tukey HSD comparisons; Levene’s test was used to assess variance equality as an index of behavioral consistency.
Stream 2 (Behavioral pattern analysis) was designed to analyze users’ latent behavioral patterns across different conditions. This approach combined spatial symbolization, bigram tokenization, and Agglomerative Hierarchical Clustering (AHC) with Ward’s linkage across three stages. Whole stay duration clustering clustered whole interactions (entry to exit) to characterize overall behavior patterns across conditions. Post-disposal clustered the post-disposal dwell phase segment of each interaction on a separately constructed post-disposal dataset, on the rationale that the user could not respond to feedback from the current disposal action until after it had occurred. Cluster distribution by system correctness then partitioned Post-disposal cluster assignments by classification correctness to examine whether the post-disposal pattern interacted with system performance.
Stream 3 (Subjective questionnaire data) was designed to test whether the behavioral differences observed in Streams 1 and 2 were accompanied by corresponding changes in users’ subjective perceptions. For RQ2, the key question was whether users who experienced the AdaptiveAgent also reported higher trust, particularly on the performance-related subscales of competence and predictability. An empathy measure was included as an exploratory check of the proposed vulnerability–empathy–trust-repair mechanism. Because questionnaire respondents were a self-selected subset who could not be linked to individual behavioral log entries, Stream 3 data were treated as supporting rather than confirmatory evidence. Nonparametric tests were used for between-condition comparisons given unequal group sizes.
5.4. Data Collection and Measures
The data sources used across the three analytical streams were as follows.
- (1)
Physical Waste Weight. Daily total weight of disposed trash was measured to monitor usage volume and serve as a supplementary indicator of long-term engagement stability (RQ2, Stream 1).
- (2)
Ground Truth Images. Images of disposed items were used exclusively for manual ground-truth labeling to verify sorting accuracy against model predictions (Stream 1).
- (3)
System Logs. Real-time classification results (predicted class and posterior probabilities) were continuously logged. In Condition 3, these probability values dynamically drove the agent’s expressive states (Stream 1).
- (4)
Behavioral Sensor Data. User proximity was continuously monitored by the IR sensor array. For each interaction, the system recorded entry and exit timestamps, sensor activation sequences, and detected distances. These data supported stay-duration analyses (Stream 1) and the latent behavioral pattern analysis (Stream 2), which were described in
Section 6.2.
- (5)
Subjective Questionnaires. Three standardized instruments were administered (Stream 3): the System Usability Scale (SUS) [
43] as a usability confound check; the Multi-Dimensional Trust Measure v2 (MDMTv2) [
44] for trust across four subscales (competence, predictability, dependability, intention); and the Interpersonal Reactivity Index (IRI) [
45,
46] for empathy across four subscales.
5.5. Confidence Signal Transformation
A prerequisite for evaluating the five-level expressive framework was that the displayed confidence signal spanned all agent states during the study. Pilot observations revealed that the fine-tuned MobileNetV3-Small model, precisely because of its high accuracy, produced posterior probabilities concentrated in a narrow high-value band. Under the raw signal, the agent would almost always have remained in the Very Confident or Confident states, leaving the three lower vulnerability levels rarely or never activated and preventing evaluation of the full expressive framework.
To address this coverage problem without altering the predicted category, a post-processing transformation was applied to widen the dynamic range of the confidence distribution so that all five expressive levels could be exercised:
where
denotes the classifier’s output logit vector,
,
, and
. The model’s temperature-scaled softmax output [
47] was mixed with a Beta-distributed sample [
48] and lightly perturbed by a uniform noise term [
49]. The resulting operative confidence value
p was used to determine the agent’s displayed confidence level and did not affect the underlying classification result. This transformation should therefore be understood as an experimental design decision rather than a system-level feature.
5.6. Latent Behavior Pattern Analysis Pipeline
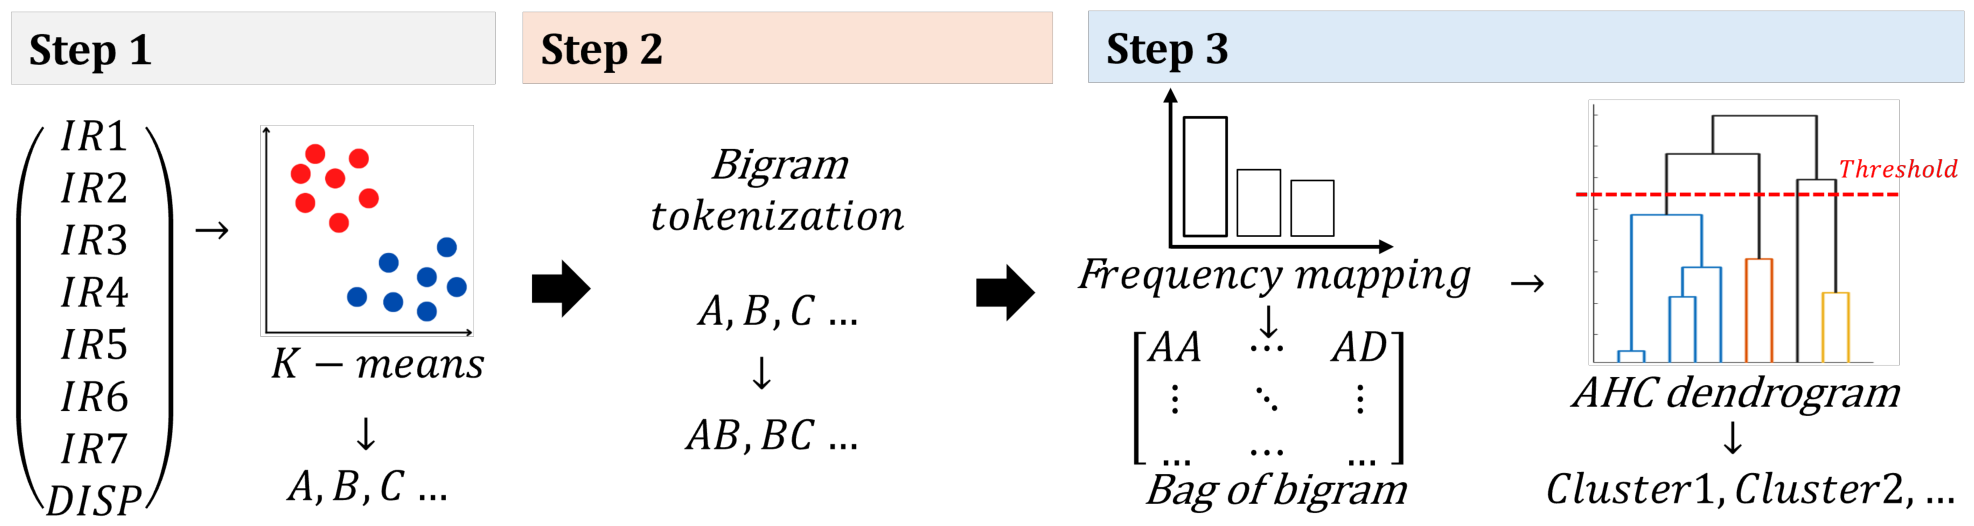
The proposed analysis pipeline is illustrated in
Figure 8. The pipeline systematically transforms raw IR sensor data and the disposal event into behavioral insights through three steps.
Step 1: Spatial symbolization. IR sensor data were separated into 1-s intervals. Each observation was represented by 8 feature vectors containing 7 distance-based sensor sequences and a disposal event () trigger. This 1-s granularity was chosen to capture the subtle dynamics of pedestrian movement within the exhibition area. Sub-second resolution would result in oversampling of stationary periods, introducing sequence redundancy; conversely, coarser resolutions (e.g., 2–5 s) would lead to information loss due to the merging of distinct spatial transitions. These discrete observations were partitioned into spatial states using K-means clustering. For the “Whole interaction duration” and “Post-disposal dwell phase” datasets, the optimal K values were determined using the elbow method and silhouette score.
Step 2: Time sequence tracking. Bigram encoding was applied to the symbolic state sequences produced in Step 1. Contiguous two-state pairs were aggregated into single tokens. Bigrams were chosen over higher-order n-grams because they capture immediate transitions while keeping the token vocabulary tractable for the relatively small number of interactions.
Step 3: Clustering behavior patterns. Each interaction is mapped to a feature vector that represents the relative frequency of a bigram observed in its sequence. To identify behavior patterns under different interaction conditions, this study employed AHC with the Ward’s linkage. Considering the limited sample sizes across conditions, this approach was selected for its ability to maximize within-cluster homogeneity and provide a stable classification structure without requiring a pre-specified number of clusters.
6. Results
The analyses were structured around the two research questions.
RQ1 examined how expressed agent confidence affected users’ immediate behavioral responses. This question was investigated in
Section 6.1 through stay-duration analysis, pre- and post-disposal stay duration, and agent-state-specific engagement patterns in Conditions 2 and 3. Furthermore, it was also explored in
Section 6.2 by the latent behavior pattern analysis.
RQ2 investigates whether anthropomorphic vulnerability contributes to long-term trust resilience and sustained engagement in
Section 6.3 and
Section 6.4. This was evaluated using two analytical methods: (1) longitudinal behavioral metrics (daily classification correctness) as indicators of behavioral persistence and (2) subjective assessment scales (trust, empathy, and usability) as measures of perceived user experience.
6.1. Behavioral Results
6.1.1. Stay Duration
RQ1 was measured by tracking stay duration across different conditions. A longer duration after an error suggested that the user hesitated or struggled to resolve the interaction, while a shorter duration reflected faster error resolution. It should be noted that only a small number of incorrect classification events were observed, particularly under ConfidentAgent and AdaptiveAgent conditions.
Table 3 provides a breakdown by classification correctness.
Condition 3 (AdaptiveAgent) had the shortest overall stay duration, which suggests that correct disposal interactions became more routine and habitual over time. Another explanation is that users in the later weeks were already familiar with the installation, which naturally led to quicker interactions regardless of the feedback strategy. The pattern for incorrect trials also told a more nuanced story. Condition 2 (ConfidentAgent) produced the shortest stay duration when errors occurred ( s, ), while Condition 3 produced longer ones ( s, ). Because only four incorrect trials were recorded in Condition 3, no statistical test was run, and this comparison should be interpreted with caution. One tentative explanation is that when the adaptive agent had already signaled low confidence before the error appeared, users did not simply walk away instead, they paused and reconsidered their disposal choice more carefully. Notably, Condition 1 showed a similar incorrect-trial duration to Condition 3, which suggests that taking longer to resolve errors was not a unique feature of the adaptive condition.
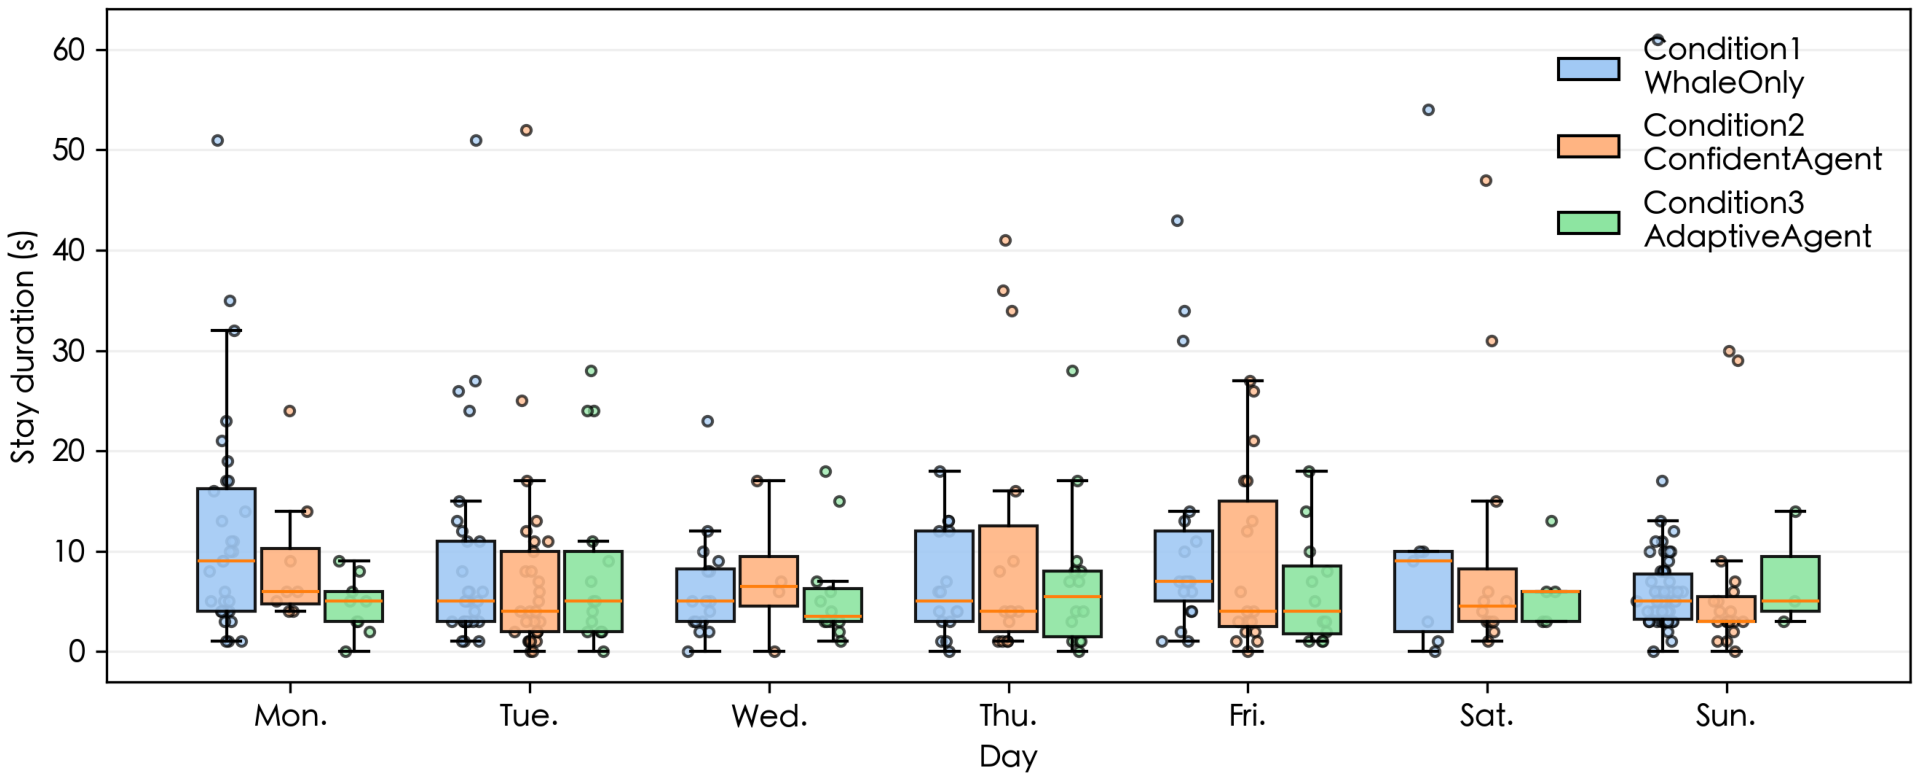
Daily stay duration in
Figure 9 showed high fluctuation in Condition 1, with no clear directional trend, which was consistent with curiosity-driven use. Condition 3 showed a more stable mean duration over time, suggesting that habitual interaction routines were forming. Condition 2 was intermediate in both overall duration and temporal stability.
Findings for RQ1: Correct-trial stay duration was shorter under the AdaptiveAgent than the other two conditions. While this effect was not significant, the descriptive data suggested a more efficient behavior under this condition. Conversely, on incorrect trials, stay durations were longer under the AdaptiveAgent condition, despite the very small sample. The result indicates that expressed vulnerability may affect the error-handling behavior.
6.1.2. Pre- and Post-Disposal Engagement
Each session was decomposed into a pre-disposal approach phase and a post-disposal dwell phase to locate where the total temporal cost arose as illustrated in
Section 5.3.
Table 4 summarizes the durations for each segment.
The approach phase was brief and nearly identical across conditions (medians all 1.0 s), indicating that the decision to dispose was unaffected by Channel 2 expressions. The post-disposal dwell phase, by contrast, differed clearly across conditions and accounted for most of the total stay duration. Condition 3 showed the shortest post-disposal dwell, suggesting that graded confidence expressions allowed users to accept the feedback outcome and move on more quickly. This reduction in dwell time is the more interpretable finding: it reflects outcome clarity rather than any change in the approach decision.
Findings for RQ1: Post-disposal dwell was the primary temporal cost in the stay duration. Mean post-disposal dwell was approximately 37% shorter under the AdaptiveAgent than the WhaleOnly baseline. While this numerical trend suggested that confidence cues speed up outcome acceptance, it did not reach statistical significance.
6.1.3. Agent State Engagement Dynamics
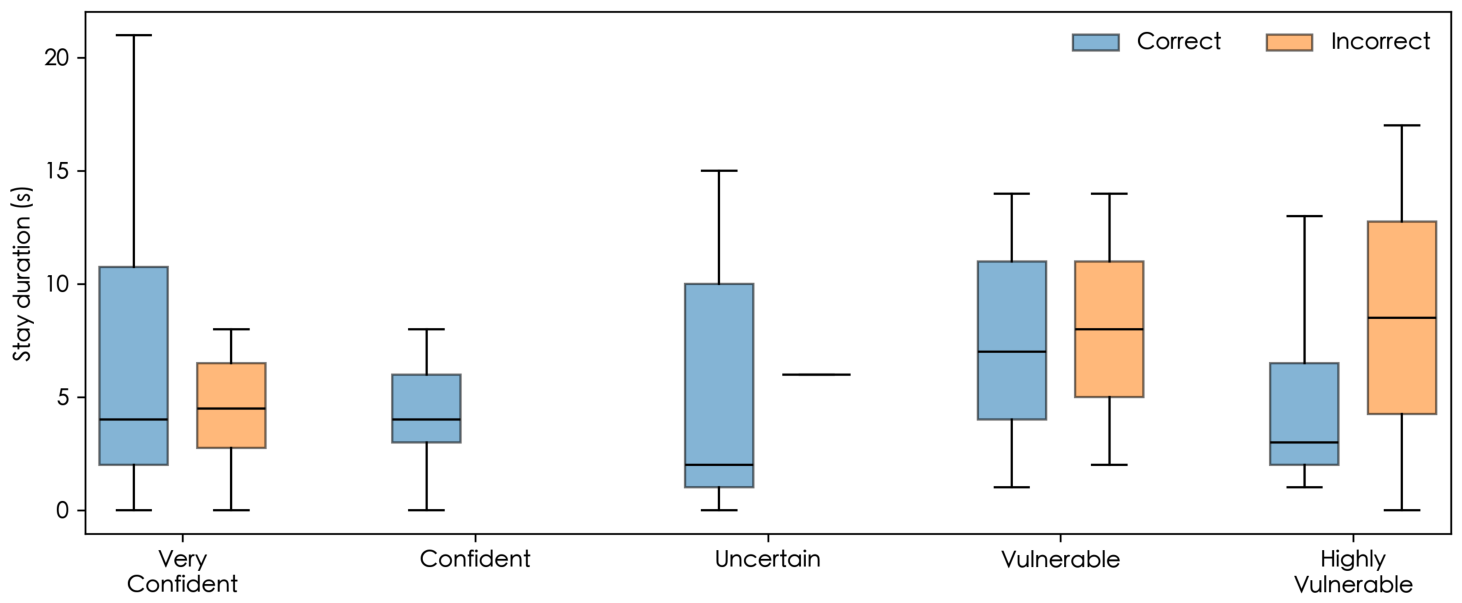
Stay duration in Condition 3 (AdaptiveAgent) was analyzed as a function of agent state to examine whether the five expressive levels produced distinguishable behavioral effects (
Figure 10).
Interaction patterns varied significantly according to the agent’s displayed confidence level. High-confidence states were associated with brief, stable interactions, suggesting efficient and routine-like user behavior. Conversely, as the agent transitioned into vulnerability-related states, stay durations increased and became more variable. Notably, most classification errors occurred when the agent was in a “Vulnerable” or “Highly Vulnerable” state. This suggests that the agent’s nonverbal signaling provided users with a “pre-warning” of potential unreliability before the error was fully manifested.
Findings for RQ1: High-confidence signals seem to support efficiency, while vulnerability signals prompt longer, more cautious engagement during error trials.
6.2. Latent Behavioral Pattern Analysis
6.2.1. Whole Stay Duration Clustering
Whole stay duration clustering applied the feature engineering pipeline in
Section 5.6 to the whole-interaction dataset, comprising 3728 per-second observations across all sessions and including 286 disposal events. The
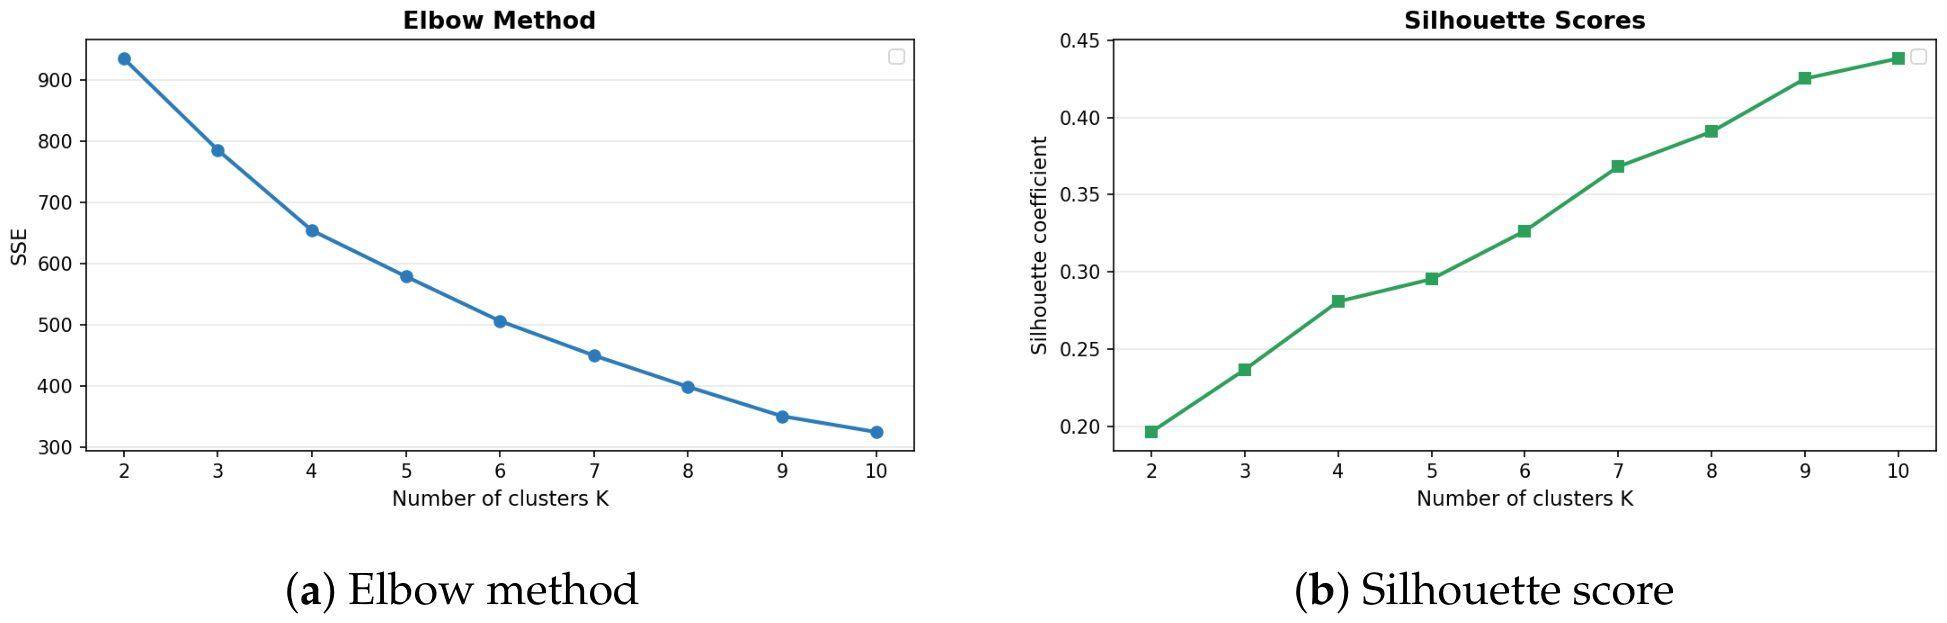
was selected based on the elbow method and silhouette score as shown in
Figure 11. Inertia decreased sharply from
to
and then leveled off, indicating an elbow point at
. The silhouette score showed only modest variation across candidate values of
K and did not provide a clear alternative optimum.
The four states were interpreted from their dominant sensor-activation patterns and disposal-event rates as summarized in
Table 5. State
functioned as the exclusive locus of disposal events, with all 286 disposal triggers falling into this state, while States
,
, and
represented different non-disposal proximity configurations along the linear sensor array.
After bigram encoding (Step 2) and vector-space representation (Step 3), AHC with ward’s linkage was applied to the inlier 282 interactions using Euclidean distance. Inspection of the merge height sequence revealed the largest gap (3.71 Ward units; 18.9% of the total height range) at K = 3, which was adopted.
Table 6 summarizes the whole-interaction cluster distribution across conditions. The three whole-interaction clusters can be interpreted from the bigram that dominates each one. Cluster
(Left-side path) presents that the user enters from the left-side zone, transitions into disposal, and returns through the central zone. Cluster
(Front-and-center) is dominated by
(0.48),
(0.14),
(0.11), and
(0.09) transitions, with the heavy concentration on sustained
-state transitions indicating that the user spends most of the visit in the central zone, approaching and leaving through it. Cluster
indicates that the user enters from and returns to the right-side zone after disposal.
The cluster distribution was broadly similar across conditions, with no condition concentrating disproportionately in any single cluster. This reflects that movement topography across the entire interaction was largely invariant to the feedback condition. Whole-interaction analysis is therefore not informative about the effect of the feedback strategy, which motivated the post-disposal cluster.
6.2.2. Post-Disposal Clustering
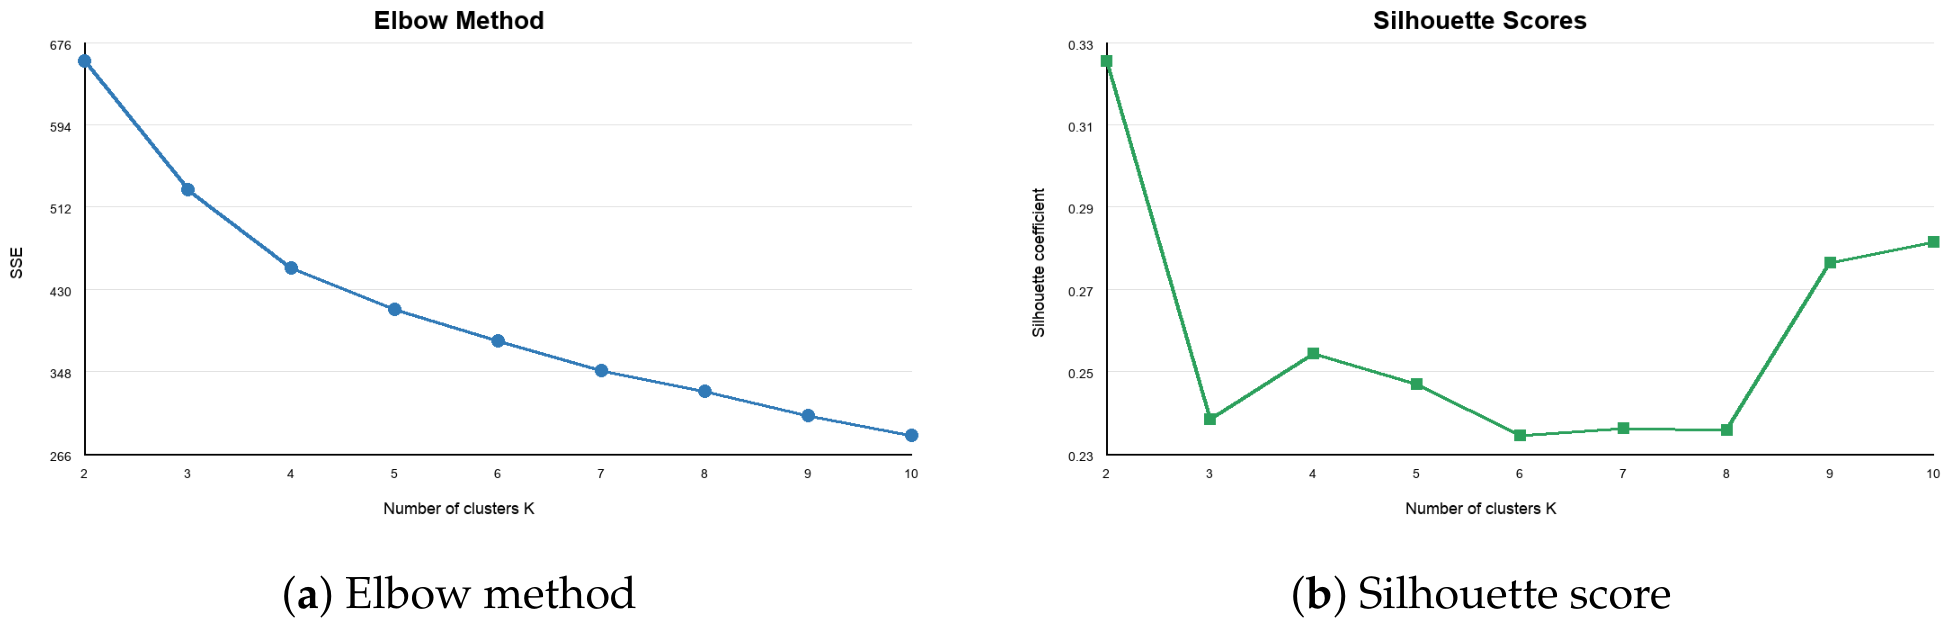
Post-disposal clustering applied the same original pipeline but utilized a separately constructed post-disposal dataset. This independent dataset was then re-clustered using
K-means, following the procedure in Step 1.
K selection was illustrated in
Figure 12. The inertia curve showed an inflection point at
, suggesting that there would be diminishing returns in terms of within-cluster compactness beyond this point. While the highest silhouette score occurred at
, this solution was considered too coarse to capture distinct movement patterns. A local silhouette maximum was observed at
, which supported the selection of four clusters for subsequent analysis.
The four resulting position states had semantics analogous to those in the whole duration of stay clustering, as shown in
Table 7, defined by the centroids of the post-disposal data alone.
AHC with Ward’s linkage was applied to select the optimal number of clusters. The merge-height gap analysis produced its largest relative gap at K = 3 (gap = 3.44, 19.8% of the total height range). The resulting three post-disposal clusters contained 89, 56, and 44 interactions, respectively.
Table 8 summarizes the post-disposal cluster distribution across the three conditions. The three post-disposal clusters can be interpreted from the bigram that dominates each one. Cluster
indicates that the user stays in the lateral zone after disposal and lingers near the unit. Cluster
(Drop–leave) shows a heavy concentration on
–
and
–
transitions, indicating that the user remains near the disposal slot only briefly, with little post-disposal movement before leaving. Meanwhile, Cluster
(Step-aside-and-pause) is dominated by
(0.43),
(0.28), and
(0.10) transitions, indicating that the user moves to the opposite side of the unit after disposal and pauses there, a position consistent with re-evaluation at a slight removal from the disposal slot.
The post-disposal cluster distribution was broadly similar across conditions, with stay-watch (Cluster
) being the most common pattern in all three. Condition 3 (AdaptiveAgent) showed a noticeable elevation of step-aside-and-pause (Cluster
) at 30.4%, compared to 21.7% in Condition 1 and 18.8% in Condition 2. This pattern, characterized by movement to the opposite side of the unit after disposal, is consistent with the longer post-disposal dwell observed in incorrect-trial cases under the AdaptiveAgent (
Section 6.1): rather than disengaging, users in Condition 3 were more likely to step aside briefly and remain within the system’s detection envelope before leaving.
6.2.3. Cluster Distribution by System Correctness
Cluster distribution by system correctness partitioned the Post-disposal cluster assignments by system detection correctness to examine whether the agent’s confidence expression interacted with system performance. Each of the post-disposal interactions was tagged as correct or incorrect based on the system’s classification log, and the results were summarized by the Post-disposal cluster. Analysis of cluster assignments by system performance reveals how agent expressions interacted with detection accuracy (
Table 9). Due to the small number of cases of incorrect classification, the cluster analysis based on system performance is only supported by a few observations of errors.
Two primary behavior trends emerged: (1) On correct trials, all three conditions converged on Cluster (stay-watch) as the dominant post-disposal pattern, indicating a common “acceptance” routine when the system worked as expected. (2) Behavioral patterns shifted significantly during incorrect trials, particularly in the agent conditions. The 0% rate for in both agent conditions during errors suggests that having an agent keeps the user at the exhibit longer, preventing them from simply “dropping and leaving” when a mistake occurs. Under the ConfidentAgent, incorrect trials were largely anchored in (83.3%). Users continued to stay without altering their movement, likely because the agent signaled no uncertainty to prompt a change in routine. In contrast, incorrect trials under the AdaptiveAgent shifted to (step-aside-pause, 66.7%). Visitors more frequently moved to the side and paused. Although based on a limited sample (), this shift is directionally consistent with the theory that vulnerability cues facilitate systematic re-evaluation rather than passive dwelling or abandonment.
Findings for RQ1: Whole stay duration clustering showed no condition-specific structure, indicating that the field setting determines overall movement topography rather than feedback strategy. Post-disposal clustering did reveal a noticeable elevation in step-aside-and-pause behavior under the AdaptiveAgent. Correctness-segmented analysis further showed that the AdaptiveAgent condition only occurred when incorrect trials moved out of the dominant correct-trial cluster, with users moving to the opposite side of the unit and pausing rather than remaining anchored near the disposal slot.
6.3. Long-Term Engagement Results
Longitudinal Trends in Classification Correctness
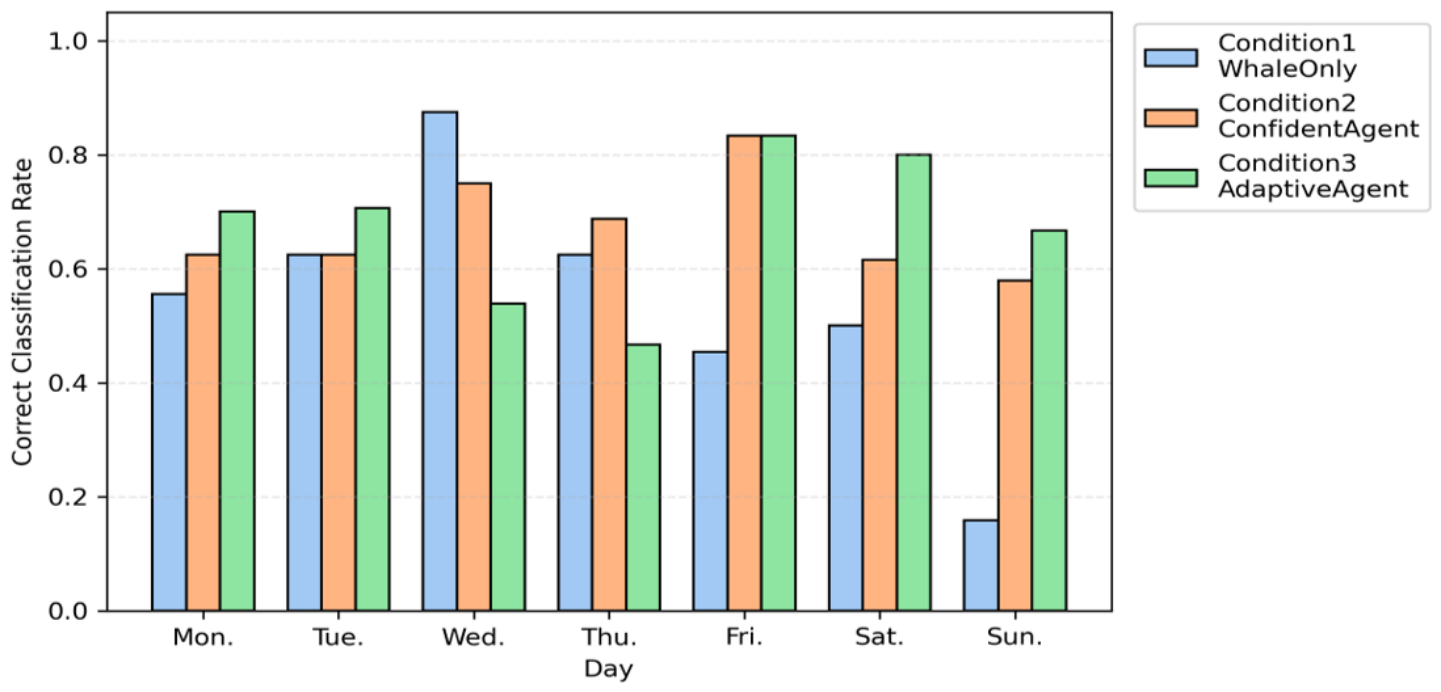
The temporal evolution of the correct classification rate across the three conditions is illustrated in
Figure 13.
Condition 1 (WhaleOnly) was marked by high volatility (, ) and a terminal erosion of precision; the lack of agent feedback appeared to hinder the formation of stable mental models, resulting in erratic performance that reached its minimum at the end of the study. In contrast, Condition 2 (ConfidentAgent) showed a more stable inverted-U progression. It achieved a higher overall mean accuracy (), where consistent feedback provided initial guidance, but the accuracy continued to decline over the last two days as fatigue from engagement set in. Condition 3 (AdaptiveAgent) followed a distinctive fluctuation-recovery trajectory. After an initial drop in accuracy during the first four days, performance recovered substantially, remaining above 65% throughout the final stage of the experiment. A one-way ANOVA of daily classification correctness yielded , . The post hoc Tukey HSD comparisons indicated that Condition 3 achieved significantly higher correctness during the final recovery phase (Friday, Saturday and Sunday) compared to Condition 1. Although the overall mean difference between Conditions 2 and 3 for the entire week was negligible, their terminal trajectories differed significantly, with Condition 3 demonstrating late-stage recovery whereas Condition 2 showed sustained decline.
Findings for RQ2: Unlike the terminal decline observed in Condition 2, Condition 3 exhibited a robust fluctuation-recovery pattern, with accuracy returning to 65% or above during the final three days of deployment.
6.4. Subjective Evaluation Results
The SUS confirmed that adaptive design complexity did not increase perceived interaction cost, which was a necessary condition for attributing trust differences to agent strategy rather than usability. The MDMTv2 trust scale provided subjective evidence relevant to RQ2, with particular attention to the competence and predictability subscales that most directly reflected long-term confidence in the system. The IRI empathy scale offered an exploratory test of the proposed vulnerability–empathy–trust-repair mechanism: if vulnerability expression elicited empathy, IRI scores were expected to trend higher under the AdaptiveAgent condition. Given sample sizes of to 11 per condition, all three instruments were treated as supporting rather than confirmatory evidence.
6.4.1. System Usability Results
Participants completed the System Usability Scale (SUS) after each condition to confirm that adaptive uncertainty expression did not increase perceived interaction cost. SUS scores range from 0 to 100; a score above 68 is considered above average, while scores exceeding 80 are generally classified as excellent (A-grade). All three conditions achieved high usability ratings. Condition 1 (WhaleOnly) received the highest mean score (, ), placing it in the excellent category. Conditions 2 and 3 followed, with mean scores of 76.94 () and 77.75 () respectively, both well above the industry average of 68. These results suggest that all three system conditions were considered usable. Introducing agent-based feedback and uncertainty expression did not substantially reduce perceived usability.
6.4.2. Trust Results
To assess whether adaptive vulnerability expression maintained or improved perceived trust, the MDMTv2 was employed. Trust was assessed through two broad dimensions: performance-based trust (competence and predictability), which most directly reflected confidence in the system’s long-term capability, and character-based trust (dependability and intention). All items were rated on a 7-point Likert scale.
Table 10 summarizes the subscale descriptive statistics.
Overall trust scores remained high in all conditions, with means exceeding the scale midpoint of 4.0. Condition 1 (WhaleOnly) and 3 (AdaptiveAgent) achieved nearly identical overall ratings ( and , respectively), while Condition 2 (ConfidentAgent) received the lowest mean (). Descriptively, it can be observed that Condition 3 showed the highest mean scores for competence (5.60) and predictability (5.45), whereas Condition 2 showed the lowest scores for these two subscales. Intention was the highest-rated trust dimension across all conditions ().
6.4.3. Empathy Results
Empathy was included as an exploratory measure to examine whether different strategies for expressing uncertainty were associated with differences in users’ empathic responses towards the anthropomorphic agent. If the mechanism operated as theorized, IRI scores, especially Perspective Taking and Empathic Concern, would trend higher in the AdaptiveAgent condition. The IRI therefore served as a mechanism indicator rather than a primary outcome. Empathy toward the anthropomorphic agent was measured, covering overall empathy and four subscales: Perspective Taking, Empathic Concern, Fantasy, and Personal Distress. Comparisons were made between Condition 2 (ConfidentAgent) and Condition 3 (AdaptiveAgent). Descriptive statistics are summarized in
Table 11.
The AdaptiveAgent showed a higher overall empathy score () than the ConfidentAgent (). The AdaptiveAgent condition also achieved higher mean scores on all four IRI subscales. The observed differences ranged from 0.13 to 0.64 points.
6.4.4. Open-Ended Responses
To complement the quantitative scales, open-ended responses were summarized thematically by condition. In Condition 1 (WhaleOnly), the participants mainly referred to the narrative of the whale. They expressed concern for the whale’s injured state and reported correcting previous disposal habits, such as separating plastics from burnable waste. Thus, emotional involvement was mainly directed toward ecological feedback. In Condition 2 (ConfidentAgent), responses indicated both engagement and reliability concerns. One participant reported a mechanical failure in which the bin opened and closed too quickly to use. Another noted that the injured whale motivated careful sorting. One participant also selected “Felt awkward,” suggesting that a confident agent may cause discomfort when system behavior is unexpected. In Condition 3 (AdaptiveAgent), the responses were consistently positive. Eight out of ten participants selected “Enjoyed it,” and two selected “Found it cute,” with no reports of awkwardness or indifference. One participant noted that the waiting time before disposal completion helped them reconsider how to sort the waste, suggesting that Channel 2’s expressions may support deliberate sorting.
7. Discussion
7.1. Adaptive Vulnerability and Trust Resilience
The study identified a directional pattern suggesting that decoupling task outcomes from confidence feedback may influence user responses to uncertainty over repeated interactions. Although exploratory, three observations support this dual-channel method: (1) The AdaptiveAgent’s classification correctness trajectory recovered at the end of the deployment, while the ConfidentAgent’s declined. (2) Post-disposal dwell time was 37% shorter for AdaptiveAgent in correct trials, suggesting that communicating uncertainty helped users understand outcomes more quickly. Under error conditions, users demonstrated a willingness to invest additional time in re-evaluating system outputs when prompted by the disclosure of system vulnerability. (3) Contrary to the assumption of “confidence equals competence”, the AdaptiveAgent received the highest ratings for predictability and competence. These observations suggest that calibrated uncertainty may lead to more resilient interactions than a consistently confident presentation [
1]. This interpretation also aligned with previous work [
8] showing that empathic agent behavior sustained engagement in repeated-tasks settings. The vulnerability expressions appeared to encourage continued interaction after errors rather than disengagement, consistent with findings that communicating uncertainty and system limitations mitigated algorithm aversion and supported trust repair [
16].
The effectiveness of the “vulnerability evokes empathy” response likely depends on the user’s prior experience with AI. In this cohort 2024–2025, high AI literacy meant that system errors were normalized, making the agent’s uncertainty appear credible rather than a sign of total failure [
50]. To prevent users from seeing AI doubt as a simple error, the reason behind the agent’s uncertainty needs to be interpreted.
7.2. Overconfidence, Cognitive Dissonance, and Interaction Stability
The observations were broadly consistent with the hypothesis that confident but incorrect feedback introduces cognitive dissonance and prolongs hesitation, although the present study did not directly measure dissonance and cannot test this account formally. Cognitive load theory holds that conflicting information increases processing demands and complicates decision-making [
51], and cognitive dissonance theory predicts that inconsistency between expectation and outcome produces psychological discomfort [
36]. One plausible reading of the data is that when systems expressed high confidence despite errors, users faced heightened ambiguity, whereas vulnerability-based feedback reduced this ambiguity by signaling limitations before users experienced them directly. Previous work has shown that communicating uncertainty improves the user’s understanding of AI behavior [
39].
The pattern also aligns, at a descriptive level, with research on automation bias. Excessive confidence in automated systems has been shown to reduce human vigilance and increase uncritical reliance on system output [
52], and over-trust in automation has been associated with reduced user engagement in error correction [
53]. Vulnerability signals, on the contrary, can encourage active participation and collaborative decision-making, although the mechanism by which this would operate in long-term deployments needs further investigation. A potential challenge observed in the deployment is that when vulnerability cues co-occurred with negative behavioral feedback, some users may have experienced a heightened emotional burden. Layered cognitive and affective demands have been shown to reduce usability in AI-assisted decision-making [
22]. Future designs might benefit from examining how vulnerability cues interact with performance feedback, potentially reducing emotional load through temporal or modal separation of the two channels.
7.3. Design Implications
Subject to the exploratory nature of the evidence, the present deployment suggests several tentative implications for persuasive anthropomorphic systems. First, structural separation of task-outcome feedback from confidence expression appears to be useful for systems that must communicate uncertainty without implicitly misrepresenting the reliability of outcome assessments. This structural separation is consistent with broader human-centered AI design guidelines that emphasize transparency and controllability [
14,
54]. Second, expressive diversity may support sustained engagement in long-term deployments: Previous work has shown that socially expressive agents maintain user engagement over repeated interactions more effectively than static ones [
53], and richer emotional expression can contribute to empathy and social acceptance in human-AI interaction [
32]. The whale feedback narrative was used as a common baseline in all conditions. However, it may also have influenced user responses emotionally. To better isolate the effects of the expression of anthropomorphic uncertainty, future studies should employ more neutral feedback designs and additional control conditions, such as a whale feedback condition paired with an expressionless agent or a neutral non-anthropomorphic uncertainty display.
Beyond passive communication of uncertainty, future systems could incorporate active error-intervention mechanisms, such as inviting users to confirm low-confidence decisions. Human-in-the-loop approaches have been shown to improve trust and usability in AI-assisted tasks [
14], and the opportunities for users to participate in resolving uncertain outcomes may further improve interaction stability. These directions should be evaluated in designs that allow for a proper between-condition comparison.
7.4. Limitations
Experimental design and sequence effects: The study employed a fixed sequential design without counterbalancing. Consequently, temporal factors, environmental variation, and familiarity effects may have influenced the observed behaviors. Due to the partial overlap of users over weeks, responses in later conditions may have been influenced by prior exposure to the system. Therefore, the findings should be interpreted as exploratory evidence of the effects of uncertainty communication strategies rather than as strong causal evidence.
Sample size and data attribution. Considering the anonymous and open-access implementation, it was not feasible to establish a direct correspondence between individual behavioral logs and specific survey responses. Consequently, the analysis relied on population-level averages, which can introduce conservative bias. Moreover, given the limited size of the behavioral data set, the questionnaire sample, and the panel of participants in the cognition survey, the findings should be considered preliminary rather than definitive. Additionally, only a few error cases were observed under the ConfidentAgent and AdaptiveAgent conditions. This limits the extent to which error-related behavioral patterns can be generalized beyond the current deployment.
Duration and longitudinal stability of the study; Each seven-day deployment was sufficient to capture immediate trends but insufficient to distinguish stable behavioral equilibrium from transient adaptation. The observed recovery in performance during the final days of Condition 3 may indicate the onset of habit formation, but longer-term deployments over several months are necessary to confirm a durable behavior change.
Confidence mapping and signal validity. The confidence signal driving agent expressions was a stylized transformation of classifier posteriors rather than a raw, calibrated probability. While necessary to activate the full five-level expressive range, this design choice introduces limitations in terms of ecological validity. As the displayed vulnerability was driven by a transformed confidence signal rather than a directly calibrated estimate of model uncertainty, user responses may not accurately reflect reactions to genuine classification difficulty, which could have influenced trust interpretation. Future iterations should incorporate dedicated uncertainty estimators for precise calibration.
Generalizability and Population Demographics. The deployment was restricted to a single Japanese university with a relatively homogeneous and technology-familiar population. Consequently, the findings may not generalize to broader demographic or cultural contexts. As discussed by Ding and Zou [
55], the formation of trust in unfamiliar systems may be influenced by culturally shaped schemas and dynamic adaptation processes, whereby individuals integrate their prior experiences with new environments. Accordingly, users from different cultural and social backgrounds may interpret anthropomorphic vulnerability and system trustworthiness in different ways. Furthermore, the semi-public corridor environment facilitates repeated interactions, which may result in behavior that differ from those observed in high-traffic public settings or among users who only interact once.
Error Severity and Boundary Conditions: This research focused exclusively on minor, everyday classification errors. The efficacy of vulnerability expression during “catastrophic” or safety-critical failures remains unknown. In high-stakes scenarios, admitting uncertainty might exacerbate user frustration rather than foster empathy, suggesting the need to identify the exact threshold where vulnerability ceases to be a functional recovery strategy.
8. Conclusions
This paper designed, implemented, and evaluated a dual-channel feedback architecture for behavior change systems operating under unavoidable sensor-based perception errors. The primary scientific contribution of this study is the proposed dual-channel feedback framework, which structurally separates task outcome feedback from system confidence signaling. Based on this framework, the study introduces anthropomorphic vulnerability as a means of communicating the uncertainty of the system through adaptive agent expressions.
Regarding RQ1, the findings suggest that different uncertainty-expression strategies were associated with differences in user behavior. In the AdaptiveAgent condition, correct trials were associated with shorter stay durations, which was consistent with a more streamlined interaction routine. For incorrect trials, some observations indicated longer engagement and re-evaluation behaviors. However, only a small number of error cases were available for analysis. Cluster analysis likewise suggests a possible relationship between expressed vulnerability and user responses to system errors, but these observations require further validation. Regarding RQ2, behavioral observations suggested differences in longitudinal interaction patterns across conditions, while the questionnaire results provided complementary descriptive insights. In terms of engagement, only the AdaptiveAgent condition showed a “fluctuation-recovery” correctness trajectory during its deployment week, suggesting a different adaptation pattern to repeated perception errors. These findings provide preliminary evidence that anthropomorphic vulnerability may influence how users respond to uncertainty within behavior change systems.
The present evidence supports the design shift from concealing errors to honestly communicating uncertainty. By making uncertainty visible through anthropomorphic expressions, behavior change systems may support more transparent and understandable interactions under imperfect sensing conditions. However, the findings should be regarded as preliminary evidence that motivates further investigation of uncertainty communication in behavior change systems. Future research should explore alternative strategies for communicating uncertainty under more ecologically valid conditions. This will help users to develop appropriate levels of trust in AI while also supporting the design of more resilient autonomous systems for real-world environments.
Author Contributions
Conceptualization, Y.H. and K.F.; Methodology, Y.H. and K.F.; Software, Y.H.; Validation, Y.H. and K.F.; Formal analysis, Y.H.; Investigation, Y.H.; Resources, K.F.; Data curation, Y.H.; Writing—original draft preparation, Y.H.; Writing—review and editing, Y.H., K.F. and B.I.; Visualization, Y.H.; Supervision, K.F. and B.I.; Project administration, K.F.; Funding acquisition, Y.H. and K.F. All authors have read and agreed to the published version of the manuscript.
Funding
This work was supported by JST SPRING, Grant Number JPMJSP2116.
Institutional Review Board Statement
The study was conducted in accordance with the Declaration of Helsinki and approved by the Institutional Review Board of Tokyo University of Agriculture and Technology (No. 250907-0742 (7 September 2025)).
Informed Consent Statement
Informed consent was obtained from participants who provided subjective evaluations. For other individuals who used the bin or passed nearby, informed consent was not obtained, as data collection was conducted in a public setting and did not involve the recording of personally identifiable information.
Data Availability Statement
The datasets presented in this article are not readily available because the data are part of an ongoing study.
Acknowledgments
The authors would like to express sincere gratitude to S. Hotta for his invaluable advice and technical guidance regarding garbage image recognition.
Conflicts of Interest
The authors declare no conflicts of interest.
References
- Vereschak, O.; Bailly, G.; Caramiaux, B. How to evaluate trust in AI-assisted decision making? A survey of empirical methodologies. Proc. ACM Hum.-Comput. Interact. 2021, 5, 1–39. [Google Scholar] [CrossRef] [Scilit]
- Dietvorst, B.J.; Simmons, J.P.; Massey, C. Algorithm Aversion: People Erroneously Avoid Algorithms After Seeing Them Err. J. Exp. Psychol. Gen. 2015, 144, 114–126. [Google Scholar] [CrossRef] [Scilit] [PubMed]
- Lim, B.Y.; Dey, A.K.; Avrahami, D. Why and Why Not Explanations Improve the Intelligibility of Context-Aware Intelligent Systems. In Proceedings of the SIGCHI Conference on Human Factors in Computing Systems, CHI ’09, New York, NY, USA, 4–9 April 2009; pp. 2119–2128. [Google Scholar] [CrossRef] [Scilit]
- Amershi, S.; Weld, D.; Vorvoreanu, M.; Fourney, A.; Nushi, B.; Collisson, P.; Suh, J.; Iqbal, S.; Bennett, P.N.; Inkpen, K.; et al. Guidelines for Human–AI Interaction. In Proceedings of the 2019 CHI Conference on Human Factors in Computing Systems, CHI ’19, New York, NY, USA, 4–9 May 2019; pp. 1–13. [Google Scholar] [CrossRef] [Scilit]
- Fogg, B.J. Persuasive Technology: Using Computers to Change What We Think and Do; Morgan Kaufmann: San Francisco, CA, USA, 2003. [Google Scholar] [CrossRef] [Scilit]
- Kox, E.S.; Kerstholt, J.H.; Hueting, T.F.; de Vries, P.W. Trust repair in human-agent teams: The effectiveness of explanations and expressing regret. Auton. Agents Multi-Agent Syst. 2021, 35, 30. [Google Scholar] [CrossRef] [Scilit]
- Baker, A.L.; Phillips, E.K.; Ullman, D.; Keebler, J.R. Toward an Understanding of Trust Repair in Human-Robot Interaction: Current Research and Future Directions. ACM Trans. Interact. Intell. Syst. 2018, 8, 30. [Google Scholar] [CrossRef] [Scilit]
- Tsumura, T.; Yamada, S. Making a Human’s Trust Repair for an Agent in a Series of Tasks Through the Agent’s Empathic Behaviour. Front. Comput. Sci. 2024, 6, 1461131. [Google Scholar] [CrossRef] [Scilit]
- Ervas, F.; Gunia, A.; Lorini, G.; Stojanov, G.; Indurkhya, B. Fostering Safe Behaviors via Metaphor-Based Nudging Technologies. In Proceedings of the Software Engineering and Formal Methods. SEFM 2021 Collocated Workshops: CIFMA, CoSim-CPS, OpenCERT, ASYDE, Virtual Event, 6–10 December 2021; Revised Selected Papers; Springer: Berlin/Heidelberg, Germany, 2021; pp. 53–63. [Google Scholar] [CrossRef] [Scilit]
- Rogers, Y. Interaction Design Gone Wild: Striving for Wild Theory. Interactions 2011, 18, 58–62. [Google Scholar] [CrossRef] [Scilit]
- Klasnja, P.; Consolvo, S.; McDonald, D.W.; Landay, J.A.; Pratt, W. Using Mobile Personal Sensing Technologies to Support Health Behavior Change in Everyday Life: Lessons Learned. In Proceedings of the AMIA Annual Symposium; American Medical Informatics Association: Bethesda, MD, USA, 2009; pp. 338–342. [Google Scholar]
- Salem, M.; Lakatos, G.; Amirabdollahian, F.; Dautenhahn, K. Would You Trust a (Faulty) Robot? Effects of Error, Task Type and Personality on Human-Robot Cooperation and Trust. In Proceedings of the Tenth Annual ACM/IEEE International Conference on Human-Robot Interaction, HRI ’15, New York, NY, USA, 2–5 March 2015; pp. 141–148. [Google Scholar] [CrossRef] [Scilit]
- Rapp, A.; Boldi, A. Exploring the lived experience of behavior change technologies: Towards an existential model of behavior change for HCI. ACM Trans.-Comput.-Hum. Interact. 2023, 30, 1–50. [Google Scholar] [CrossRef] [Scilit]
- Amershi, S.; Cakmak, M.; Knox, W.B.; Kulesza, T. Power to the People: The Role of Humans in Interactive Machine Learning. AI Mag. 2014, 35, 105–120. [Google Scholar] [CrossRef] [Scilit]
- Frijns, H.A.; Hirschmanner, M.; Sienkiewicz, B.; Hönig, P.; Indurkhya, B.; Vincze, M. Human-in-the-loop error detection in an object organization task with a social robot. Front. Robot. AI 2024, 11, 1356827. [Google Scholar] [CrossRef] [Scilit] [PubMed]
- Dietvorst, B.J.; Simmons, J.P.; Massey, C. Overcoming Algorithm Aversion: People Will Use Imperfect Algorithms If They Can (Even Slightly) Modify Them. Manag. Sci. 2018, 64, 1155–1170. [Google Scholar] [CrossRef] [Scilit]
- Hoff, K.A.; Bashir, M. Trust in Automation: Integrating Empirical Evidence on Factors That Influence Trust. Hum. Factors 2015, 57, 407–434. [Google Scholar] [CrossRef] [Scilit] [PubMed]
- Lee, J.D.; See, K.A. Trust in Automation: Designing for Appropriate Reliance. Hum. Factors 2004, 46, 50–80. [Google Scholar] [CrossRef] [Scilit] [PubMed]
- Ribeiro, M.T.; Singh, S.; Guestrin, C. “Why Should I Trust You?”: Explaining the Predictions of Any Classifier. In Proceedings of the 22nd ACM SIGKDD International Conference on Knowledge Discovery and Data Mining, KDD ’16, New York, NY, USA, 13–17 August 2016; pp. 1135–1144. [Google Scholar] [CrossRef] [Scilit]
- Liao, Q.V.; Gruen, D.; Miller, S. Questioning the AI: Informing Design Practices for Explainable AI User Experiences. In Proceedings of the 2020 CHI Conference on Human Factors in Computing Systems, CHI ’20, New York, NY, USA, 25–30 April 2020; pp. 1–15. [Google Scholar] [CrossRef] [Scilit]
- Arrieta, A.B.; Díaz-Rodríguez, N.; Del Ser, J.; Bennetot, A.; Tabik, S.; Barbado, A.; García, S.; Gil-López, S.; Molina, D.; Benjamins, R.; et al. Explainable Artificial Intelligence (XAI): Concepts, Taxonomies, Opportunities and Challenges toward Responsible AI. Inf. Fusion 2020, 58, 82–115. [Google Scholar] [CrossRef] [Scilit]
- Bucinca, Z.; Malaya, M.B.; Gajos, K.Z. To Trust or to Think: Cognitive Forcing Functions Can Reduce Overreliance on AI in AI-Assisted Decision-Making. In Proceedings of the ACM on Human-Computer Interaction; ACM: New York, NY, USA, 2021; Volume 5, pp. 1–21. [Google Scholar] [CrossRef] [Scilit]
- Bansal, G.; Wu, T.; Zhou, J.; Fok, R.; Nushi, B.; Kamar, E.; Ribeiro, M.T.; Weld, D. Does the Whole Exceed Its Parts? The Effect of AI Explanations on Complementary Team Performance. In Proceedings of the 2021 CHI Conference on Human Factors in Computing Systems, CHI ’21, New York, NY, USA, 8–13 May 2021; pp. 1–16. [Google Scholar] [CrossRef] [Scilit]
- Kizilcec, R.F. How Much Information? Effects of Transparency on Trust in an Algorithmic Interface. In Proceedings of the 2016 CHI Conference on Human Factors in Computing Systems, CHI ’16, New York, NY, USA, 7–12 May 2016; pp. 2390–2395. [Google Scholar] [CrossRef] [Scilit]
- Zhang, Y.; Liao, Q.V.; Bellamy, R.K.E. Effect of Confidence and Explanation on Accuracy and Trust Calibration in AI-Assisted Decision Making. In Proceedings of the 2020 Conference on Fairness, Accountability, and Transparency, FAccT ’20, New York, NY, USA, 27–30 January 2020; pp. 295–305. [Google Scholar] [CrossRef] [Scilit]
- Waytz, A.; Heafner, J.; Epley, N. The Mind in the Machine: Anthropomorphism Increases Trust in an Autonomous Vehicle. J. Exp. Soc. Psychol. 2014, 52, 113–117. [Google Scholar] [CrossRef] [Scilit]
- Li, J.; Zhu, Z.; Zhang, R.; Lee, Y.C. Exploring the Effects of Chatbot Anthropomorphism and Human Empathy on Human Prosocial Behavior Toward Chatbots. Proc. Acm Hum.-Comput. Interact. 2025, 9, 1–29. [Google Scholar] [CrossRef] [Scilit]
- Kulms, P.; Kopp, S. More Human-Likeness, More Trust? The Effect of Anthropomorphism on Self-Reported and Behavioral Trust in Continued and Interdependent Human-Agent Cooperation. In Proceedings of the Proceedings of Mensch Und Computer 2019, MuC ’19, New York, NY, USA, 8–11 September 2019; pp. 31–42. [Google Scholar] [CrossRef] [Scilit]
- de Visser, E.J.; Monfort, S.S.; McKendrick, R.; Smith, M.A.B.; McKnight, P.E.; Krueger, F.; Parasuraman, R. Almost Human: Anthropomorphism Increases Trust Resilience in Cognitive Agents. J. Exp. Psychol. Appl. 2016, 22, 331–349. [Google Scholar] [CrossRef] [Scilit] [PubMed]
- Heron, S.; Lau, M.C. Trust in Autonomous Human–Robot Collaboration: Effects of Responsive Interaction Policies. arXiv 2026, arXiv:2603.00154. [Google Scholar] [CrossRef] [Scilit]
- Robinette, P.; Li, W.; Allen, R.; Howard, A.M.; Wagner, A.R. Overtrust of Robots in Emergency Evacuation Scenarios. In Proceedings of the 11th ACM/IEEE International Conference on Human-Robot Interaction; HRI ’16; IEEE: Piscataway, NJ, USA, 2016; pp. 101–108. [Google Scholar] [CrossRef] [Scilit]
- Paiva, A.; Leite, I.; Boukricha, H.; Wachsmuth, I. Empathy in Virtual Agents and Robots: A Survey. ACM Trans. Interact. Intell. Syst. 2017, 7, 1–40. [Google Scholar] [CrossRef] [Scilit]
- Naderi, H.; Shojaei, A.; Agee, P.; Afsari, K.; Akanmu, A. Impact of Robot Facial-Audio Expressions on Human Robot Trust Dynamics and Trust Repair. arXiv 2025, arXiv:2512.1398. [Google Scholar] [CrossRef] [Scilit]
- Jung, M.; Zhang, A.; Fung, M.; Lee, J.; Liang, P.P. Quantitative Insights into Large Language Model Usage and Trust in Academia: An Empirical Study. arXiv 2024, arXiv:2409.09186. [Google Scholar]
- Consolvo, S.; McDonald, D.W.; Landay, J.A. Theory-Driven Design Strategies for Technologies that Support Behaviour Change in Everyday Life. In Proceedings of the SIGCHI Conference on Human Factors in Computing Systems, CHI ’09, New York, NY, USA, 4–9 April 2009; pp. 405–414. [Google Scholar] [CrossRef] [Scilit]
- Festinger, L. A Theory of Cognitive Dissonance; Stanford University Press: Stanford, CA, USA, 1957. [Google Scholar]
- Leusmann, J.; Wang, C.; Gienger, M.; Schmidt, A.; Mayer, S. Understanding the uncertainty loop of human-robot interaction. arXiv 2023, arXiv:2303.07889. [Google Scholar]
- Nass, C.; Moon, Y. Machines and Mindlessness: Social Responses to Computers. In Proceedings of the Journal of Social Issues; Wiley: Hoboken, NJ, USA, 2000; Volume 56, pp. 81–103. [Google Scholar] [CrossRef] [Scilit]
- Martelaro, N.; Nneji, V.C.; Ju, W.; Hinds, P. Tell Me More: Designing HRI to Encourage More Trust, Disclosure, and Companionship. In Proceedings of the 11th ACM/IEEE International Conference on Human-Robot Interaction; HRI ’16; IEEE: Piscataway, NJ, USA, 2016; pp. 181–188. [Google Scholar] [CrossRef] [Scilit]
- Saunderson, S.; Nejat, G. How robots influence humans: A survey of nonverbal communication in social human–robot interaction. Int. J. Soc. Robot. 2019, 11, 575–608. [Google Scholar] [CrossRef] [Scilit]
- Howard, A.; Sandler, M.; Chu, G.; Chen, L.C.; Chen, B.; Tan, M.; Wang, W.; Zhu, Y.; Pang, R.; Vasudevan, V.; et al. Searching for MobileNetV3. In Proceedings of the IEEE/CVF International Conference on Computer Vision; ICCV ’19; IEEE: Piscataway, NJ, USA, 2019; pp. 1314–1324. [Google Scholar] [CrossRef] [Scilit]
- Yang, M.; Thung, G. Classification of Trash for Recyclability Status; CS229 Project Report; Stanford University: Stanford, CA, USA, 2016; Volume 2016, p. 3. [Google Scholar]
- Brooke, J. SUS: A “Quick and Dirty” Usability Scale. In Usability Evaluation in Industry; Jordan, P.W., Thomas, B., Weerdmeester, B.A., McClelland, I.L., Eds.; Taylor & Francis: London, UK, 1996; pp. 189–194. [Google Scholar]
- Ullman, D.; Malle, B.F. MDMT: Multi-Dimensional Measure of Trust (Version 2); Technical Report; Brown University, Department of Cognitive, Linguistic and Psychological Sciences: Providence, RI, USA, 2020. [Google Scholar]
- Davis, M.H. Measuring Individual Differences in Empathy: Evidence for a Multidimensional Approach. J. Personal. Soc. Psychol. 1983, 44, 113–126. [Google Scholar] [CrossRef]
- Keaton, S.A. Interpersonal Reactivity Index (IRI) (Davis, 1980). The Sourcebook of Listening Research: Methodology and Measures; Worthington, D.L., Bodie, G.D., Eds.; John Wiley & Sons, Inc.: Hoboken, NJ, USA, 2017; pp. 340–347. [Google Scholar] [CrossRef] [Scilit]
- Guo, C.; Pleiss, G.; Sun, Y.; Weinberger, K.Q. On Calibration of Modern Neural Networks. arXiv 2017, arXiv:1706.04599. [Google Scholar] [CrossRef] [Scilit]
- Johnson, N.; Kotz, S.; Balakrishnan, N. Continuous Univariate Distributions; Wiley Series in Probability and Statistics; Wiley: Hoboken, NJ, USA, 1995; Volume 2. [Google Scholar]
- Bishop, C. Pattern Recognition and Machine Learning; Springer: New York, NY, USA, 2006; Volume 4. [Google Scholar]
- Bani-Harouni, D.; Pellegrini, C.; Stangel, P.; Özsoy, E.; Zaripova, K.; Navab, N.; Keicher, M. Rewarding doubt: A reinforcement learning approach to calibrated confidence expression of large language models. arXiv 2025, arXiv:2503.02623. [Google Scholar]
- Sweller, J.; van Merrienboer, J.J.G.; Paas, F.G.W.C. Cognitive Architecture and Instructional Design. Educ. Psychol. Rev. 1998, 10, 251–296. [Google Scholar] [CrossRef] [Scilit]
- Schemmer, M.; Bartos, A.; Spitzer, P.; Hemmer, P.; Kühl, N.; Liebschner, J.; Satzger, G. Towards effective human-AI decision-making: The role of human learning in appropriate reliance on AI advice. arXiv 2023, arXiv:2310.02108. [Google Scholar]
- Vaccaro, M.; Almaatouq, A.; Malone, T. When combinations of humans and AI are useful: A systematic review and meta-analysis. Nat. Hum. Behav. 2024, 8, 2293–2303. [Google Scholar] [CrossRef] [Scilit] [PubMed]
- Norman, D.A. The Design of Everyday Things: Revised and Expanded Edition; Basic Books: New York, NY, USA, 2013. [Google Scholar]
- Ding, Y.; Zou, Y. Cultural adaptation and identity reconstruction among rural-to-urban educational migrants in Chinese higher education: A dynamic integration perspective. Int. J. Intercult. Relat. 2026, 113, 102412. [Google Scholar]
Figure 1.
Confusion matrix of the agent confidence expression cognition survey.
Figure 1.
Confusion matrix of the agent confidence expression cognition survey.
Figure 2.
System overview.
Figure 2.
System overview.
Figure 3.
Hardware configuration and system components.
Figure 3.
Hardware configuration and system components.
Figure 4.
The deployed prototype installed on the burnable waste bin.
Figure 4.
The deployed prototype installed on the burnable waste bin.
Figure 5.
The layout of IR distance sensors.
Figure 5.
The layout of IR distance sensors.
Figure 6.
Semi-public corridor deployment environment.
Figure 6.
Semi-public corridor deployment environment.
Figure 7.
Phases of user stay duration.
Figure 7.
Phases of user stay duration.
Figure 8.
Overview of the latent behavior pattern analysis pipeline.
Figure 8.
Overview of the latent behavior pattern analysis pipeline.
Figure 9.
Stay duration by day.
Figure 9.
Stay duration by day.
Figure 10.
Stay duration by agent expressive state.
Figure 10.
Stay duration by agent expressive state.
Figure 11.
K selection results for whole stay duration.
Figure 11.
K selection results for whole stay duration.
Figure 12.
K selection results for post-disposal duration.
Figure 12.
K selection results for post-disposal duration.
Figure 13.
Daily classification correctness results.
Figure 13.
Daily classification correctness results.
Table 1.
Five-level agent state framework.
Table 1.
Five-level agent state framework.
| Agent State | Visual Expression | Expected User Perception |
|---|
| Very Confident | Energetic motion, positive face | Reliable |
| Confident | Stable posture, neutral face | Dependable |
| Uncertain | Reduced motion, puzzled face | Ambiguous |
| Vulnerable | Slouched posture, worried face | Fallible |
| Highly Vulnerable | Drooping posture, distressed face | Highly uncertain |
Table 2.
General mapping between detection confidence value p and agent expressive state. n denotes the number of target classes; is the theoretical lower bound of the softmax posterior.
Table 2.
General mapping between detection confidence value p and agent expressive state. n denotes the number of target classes; is the theoretical lower bound of the softmax posterior.
| Agent Expressive State | Confidence Value Range |
|---|
| Very Confident | |
| Confident | |
| Uncertain | |
| Vulnerable | |
| Highly Vulnerable | |
| , |
Table 3.
Stay duration across three conditions.
Table 3.
Stay duration across three conditions.
| Condition | Correctness | N | Mean[s] (SD) | Median[s] |
|---|
| WhaleOnly | Correct | 75 | 10.77 (12.69) | 6.0 |
| | Incorrect | 19 | 10.00 (8.76) | 9.0 |
| ConfidentAgent | Correct | 68 | 8.71 (10.74) | 4.0 |
| | Incorrect | 8 | 5.62 (5.26) | 4.5 |
| AdaptiveAgent | Correct | 51 | 6.08 (6.28) | 4.0 |
| | Incorrect | 4 | 9.75 (6.95) | 10.0 |
Table 4.
Pre- and post-disposal duration across conditions.
Table 4.
Pre- and post-disposal duration across conditions.
| Condition | Segment | N | Mean[s] (SD) | Median[s] |
|---|
| WhaleOnly | Pre-disposal | 94 | 2.59 (3.80) | 1.0 |
| Post-disposal | 94 | 5.50 (6.34) | 4.0 |
| ConfidentAgent | Pre-disposal | 76 | 1.78 (3.22) | 1.0 |
| Post-disposal | 76 | 4.66 (6.36) | 3.0 |
| AdaptiveAgent | Pre-disposal | 55 | 1.87 (2.78) | 1.0 |
| Post-disposal | 55 | 3.45 (3.29) | 2.0 |
Table 5.
The four position states in the whole stay duration dataset.
Table 5.
The four position states in the whole stay duration dataset.
| State | Behavioral Interpretation | Dominant Sensors | N | Disposal |
|---|
| Right-side stay | IR4–IR6 (≈0.49–0.58 m) | 986 | 0.00 |
| Left-side stay | IR1, IR2 (≈0.54–0.59 m) | 1088 | 0.00 |
| Central stay | IR2–IR5 (≈0.47–0.57 m) | 1368 | 0.00 |
| Disposal interaction | IR2–IR5 (≈0.48–0.56 m) | 286 | 1.00 |
Table 6.
Whole-interaction behavioral cluster distribution by condition.
Table 6.
Whole-interaction behavioral cluster distribution by condition.
| Cluster | Type | Condition 1 | Condition 2 | Condition 3 | Total |
|---|
| Left-side path | 41 (31.8%) | 29 (29.9%) | 19 (31.1%) | 89 (31.0%) |
| Front-and-center | 43 (33.3%) | 36 (37.1%) | 21 (34.4%) | 100 (34.8%) |
| Right-side path | 43 (33.3%) | 32 (33.0%) | 20 (32.8%) | 95 (33.1%) |
| Total | | 127 | 97 | 60 | 284 |
Table 7.
The four position states in the post-disposal dataset.
Table 7.
The four position states in the post-disposal dataset.
| State | Behavioral Interpretation | Dominant Sensors (Mean Dist.) | N | Disposal |
|---|
| Right-side stay | IR4–IR6 (≈0.54–0.61 m) | 284 | 0.00 |
| Central stay | IR2–IR4 (≈0.49–0.59 m) | 491 | 0.00 |
| Disposal interaction | IR2–IR5 (≈0.49–0.58 m) | 224 | 1.00 |
| Left-side stay | IR1, IR2 (≈0.54–0.58 m) | 248 | 0.00 |
Table 8.
Post-disposal behavioral cluster distribution by condition.
Table 8.
Post-disposal behavioral cluster distribution by condition.
| Cluster | Type | Condition 1 | Condition 2 | Condition 3 | Total |
|---|
| stay-watch | 40 (48.2%) | 30 (46.9%) | 18 (39.1%) | 88 (45.6%) |
| Disposal-leave | 24 (28.9%) | 20 (31.3%) | 13 (28.3%) | 57 (29.5%) |
| Step aside-pause | 18 (21.7%) | 12 (18.8%) | 14 (30.4%) | 44 (22.8%) |
| Total | | 82 | 62 | 45 | 189 |
Table 9.
Post-disposal cluster proportions by condition and system detection correctness.
Table 9.
Post-disposal cluster proportions by condition and system detection correctness.
| Condition | Correctness (N) | | | |
|---|
| WhaleOnly | Correct () | 0.477 | 0.277 | 0.231 |
| Incorrect () | 0.500 | 0.333 | 0.167 |
| ConfidentAgent | Correct () | 0.431 | 0.328 | 0.207 |
| Incorrect () | 0.833 | 0.000 | 0.167 |
| AdaptiveAgent | Correct () | 0.395 | 0.302 | 0.279 |
| Incorrect () | 0.333 | 0.000 | 0.667 |
Table 10.
Trust scores across conditions.
Table 10.
Trust scores across conditions.
| Subscale | WhaleOnly | ConfidentAgent | AdaptiveAgent |
|---|
| ()
| ()
| ()
|
|---|
| Overall Trust | 5.42 (0.69) | 5.06 (1.35) | 5.41 (0.89) |
| Competence | 5.39 (0.89) | 4.93 (1.72) | 5.60 (0.94) |
| Predictability | 5.27 (0.98) | 5.00 (1.09) | 5.45 (1.14) |
| Dependability | 5.27 (0.86) | 4.89 (1.54) | 5.00 (1.05) |
| Intention | 5.73 (0.77) | 5.48 (1.59) | 5.60 (0.86) |
Table 11.
Empathy scores and subscales.
Table 11.
Empathy scores and subscales.
| Subscale | ConfidentAgent | AdaptiveAgent |
|---|
| ()
| ()
|
|---|
| Overall Empathy | 3.26 (0.71) | 3.58 (0.61) |
| Perspective Taking | 3.93 (1.12) | 4.23 (0.98) |
| Empathic Concern | 3.48 (0.56) | 3.67 (0.74) |
| Fantasy | 3.67 (1.22) | 3.80 (0.75) |
| Personal Distress | 1.96 (1.24) | 2.60 (1.53) |
| Disclaimer/Publisher’s Note: The statements, opinions and data contained in all publications are solely those of the individual author(s) and contributor(s) and not of MDPI and/or the editor(s). MDPI and/or the editor(s) disclaim responsibility for any injury to people or property resulting from any ideas, methods, instructions or products referred to in the content. |