Systematic Review

Radiological Findings in Gliosarcoma: A Diagnostic Challenge

by
Domenico La Torre
1,*,
Attilio Della Torre
2,
Prospero Longo
3,
Ilaria Rania
3,
Emilio De Bartolo
4,
Giada Garufi
5,
Valeria Garufi
3 and
Salvatore Massimiliano Cardali
4,5
1
Neurological Unit, Department of Pharmacy, Health and Nutrition Sciences, University of Calabria, 87036 Rende, Italy
2
Department of Medical and Surgical Sciences, University Magna Grecia of Catanzaro, 88100 Catanzaro, Italy
3
Department of Biomedical, Dental Science and Morphological and Functional Images, University of Messina, 98125 Messina, Italy
4
Department of Neurosurgery, Hospital “SS. Annunziata” of Cosenza, 87100 Cosenza, Italy
5
Department of Neurosurgery, Hospital “Papardo” of Messina, 98158 Messina, Italy
*
Author to whom correspondence should be addressed.
Appl. Sci. 2026, 16(13), 6374; https://doi.org/10.3390/app16136374
Submission received: 27 April 2026 / Revised: 16 June 2026 / Accepted: 17 June 2026 / Published: 25 June 2026
(This article belongs to the Special Issue MR-Based Neuroimaging, 2nd Edition)

Abstract

Aim: This study aims to identify the primary differential MRI features between gliosarcoma (GS) and glioblastoma (GBM) based on a comprehensive review of existing literature. Given their close relationship, identifying preoperative neuroradiological markers is essential for distinguishing these two entities. Methods and Analysis: We reviewed studies involving patients with histologically confirmed GS and primary GBM. Our analysis, aligned with the 2021 WHO Classification of Tumors of the Central Nervous System, evaluated specific radiological characteristics in order to determine their diagnostic value in differential diagnosis. Results: While GS is categorized as a variant of GBM, distinct radiological patterns emerged from our literature review. Gliosarcomas are typically larger due to their sarcomatous component and exhibit more intense contrast enhancement and frequent cortical involvement. Notably, hemorrhagic patterns are more prevalent in GS, whereas GS displays less necrosis and a lower incidence of midline-crossing edema compared to GBM. Conversely, glioblastomas more frequently present with cystic components and pial involvements as well as a higher risk of ependymal invasion. Conclusions: Although specific radiological features—such as hemorrhage frequency and tumor size—can strongly suggest GS over GBM diagnosis, no single feature was considered pathognomonic. Among radiological tools, MRI remains the most important for guiding a diagnostic suspicion, but histopathological confirmation remains the gold standard for definitive diagnosis.

1. Introduction

Gliosarcoma (GS) is a rare IDH-wildtype variant of glioblastoma (GBM), accounting for approximately 1.8–8% of cases. It is characterized by the coexistence of glial and mesenchymal components [1,2]. Both primary and secondary forms are recognized. Secondary GS may develop following surgical resection and radiotherapy for GBM or other glial tumors [3], or present as a radiation-induced neoplasm [2,4,5,6,7,8]. The sarcomatous component is believed to originate from dedifferentiation of GBM cells, marked by loss of GFAP expression and acquisition of a mesenchymal phenotype [3]. Extracranial metastases have been reported in approximately 11% of cases [9]. Key radiographic variables include the tumor’s anatomical location, presence of eccentric cysts, intralesional necrosis, maximal tumor diameter, multiple contrast-enhancing foci, and contact with the skull base dura [10].
GS typically appears as a large, solitary, supratentorial mass with a peripheral location, well-defined margins, and rim-like contrast enhancement featuring an irregular, thick wall. It often exhibits significant mass effect and frequently invades adjacent meninges, with dural contact being a characteristic feature [9]. Moderate-to-marked peritumoral edema is commonly observed [1,11]. These tumors are predominantly located in the supratentorial compartment, especially affecting the temporal and frontal lobes [3,11].
They are generally situated deep within the brain parenchyma. An alternative pattern involves a central location with transependymal extension into the ventricular system, contrasting with the more typical peripheral distribution [11]. Multilobar involvement and extension to the corpus callosum may occur, whereas infratentorial, intraventricular, and multifocal presentations are uncommon at diagnosis [11]. Involvement of the optic pathway and posterior cranial fossa is exceedingly rare [12,13]. Unlike previous reviews primarily focused on clinical or histopathological aspects, this study aims to provide an updated multimodal neuroradiological overview of gliosarcoma and to clarify its differential diagnosis from other intracranial neoplasms.

2. Materials and Methods

A systematic literature review was conducted following the PRISMA (Preferred Reporting Items for Systematic Reviews and Meta-Analyses) guidelines. The primary search included articles published over the last two decades (2005–2026). The review protocol was not publicly registered. Only studies published in English were included. Studies published before 2005 were excluded to ensure methodological consistency and to incorporate neuroradiological data obtained with modern MRI techniques and current diagnostic criteria.
All duplicates were removed, and a manual search of references was performed to identify eventual additional studies. Two reviewers (P.L. and G.G.) independently screened the titles, abstracts, and full texts, with results subsequently combined and analyzed. The search employed the following MeSH and free text terms: (“Gliosarcoma” [MeSH] OR “Gliosarcoma” [Title/Abstract]) AND (“Glioblastoma” [MeSH] OR “Glioblastoma” [Title/Abstract]) AND (“Magnetic Resonance Imaging” [MeSH] OR “MRI” [Title/Abstract] OR “Neuroimaging” [MeSH]).
Inclusion criteria:
  • Full article in English;
  • Clinical studies (case reports, case series, retrospective studies);
  • Studies describing gliosarcoma and its differential diagnosis with glioblastoma;
  • Studies focusing on patients with “gliosarcoma” and its radiological features.
Exclusion criteria:
  • Articles not published in English;
  • Studies published before than 2005;
  • Studies lacking radiological data.

2.1. Quality Assessment and Risk of Bias

The methodological quality and risk of bias of the 23 included studies were independently assessed by two reviewers (P.L. and G.G.) using the Joanna Briggs Institute (JBI) critical appraisal checklists for case reports and case series (Table 1 and Table 2). Discrepancies were resolved through consensus discussion. Studies were assessed based on clarity of patient demographics, transparency of diagnostic pathways, description of clinical presentation, and adequacy of reported neuroimaging data.

2.2. Eligibility and Included Studies

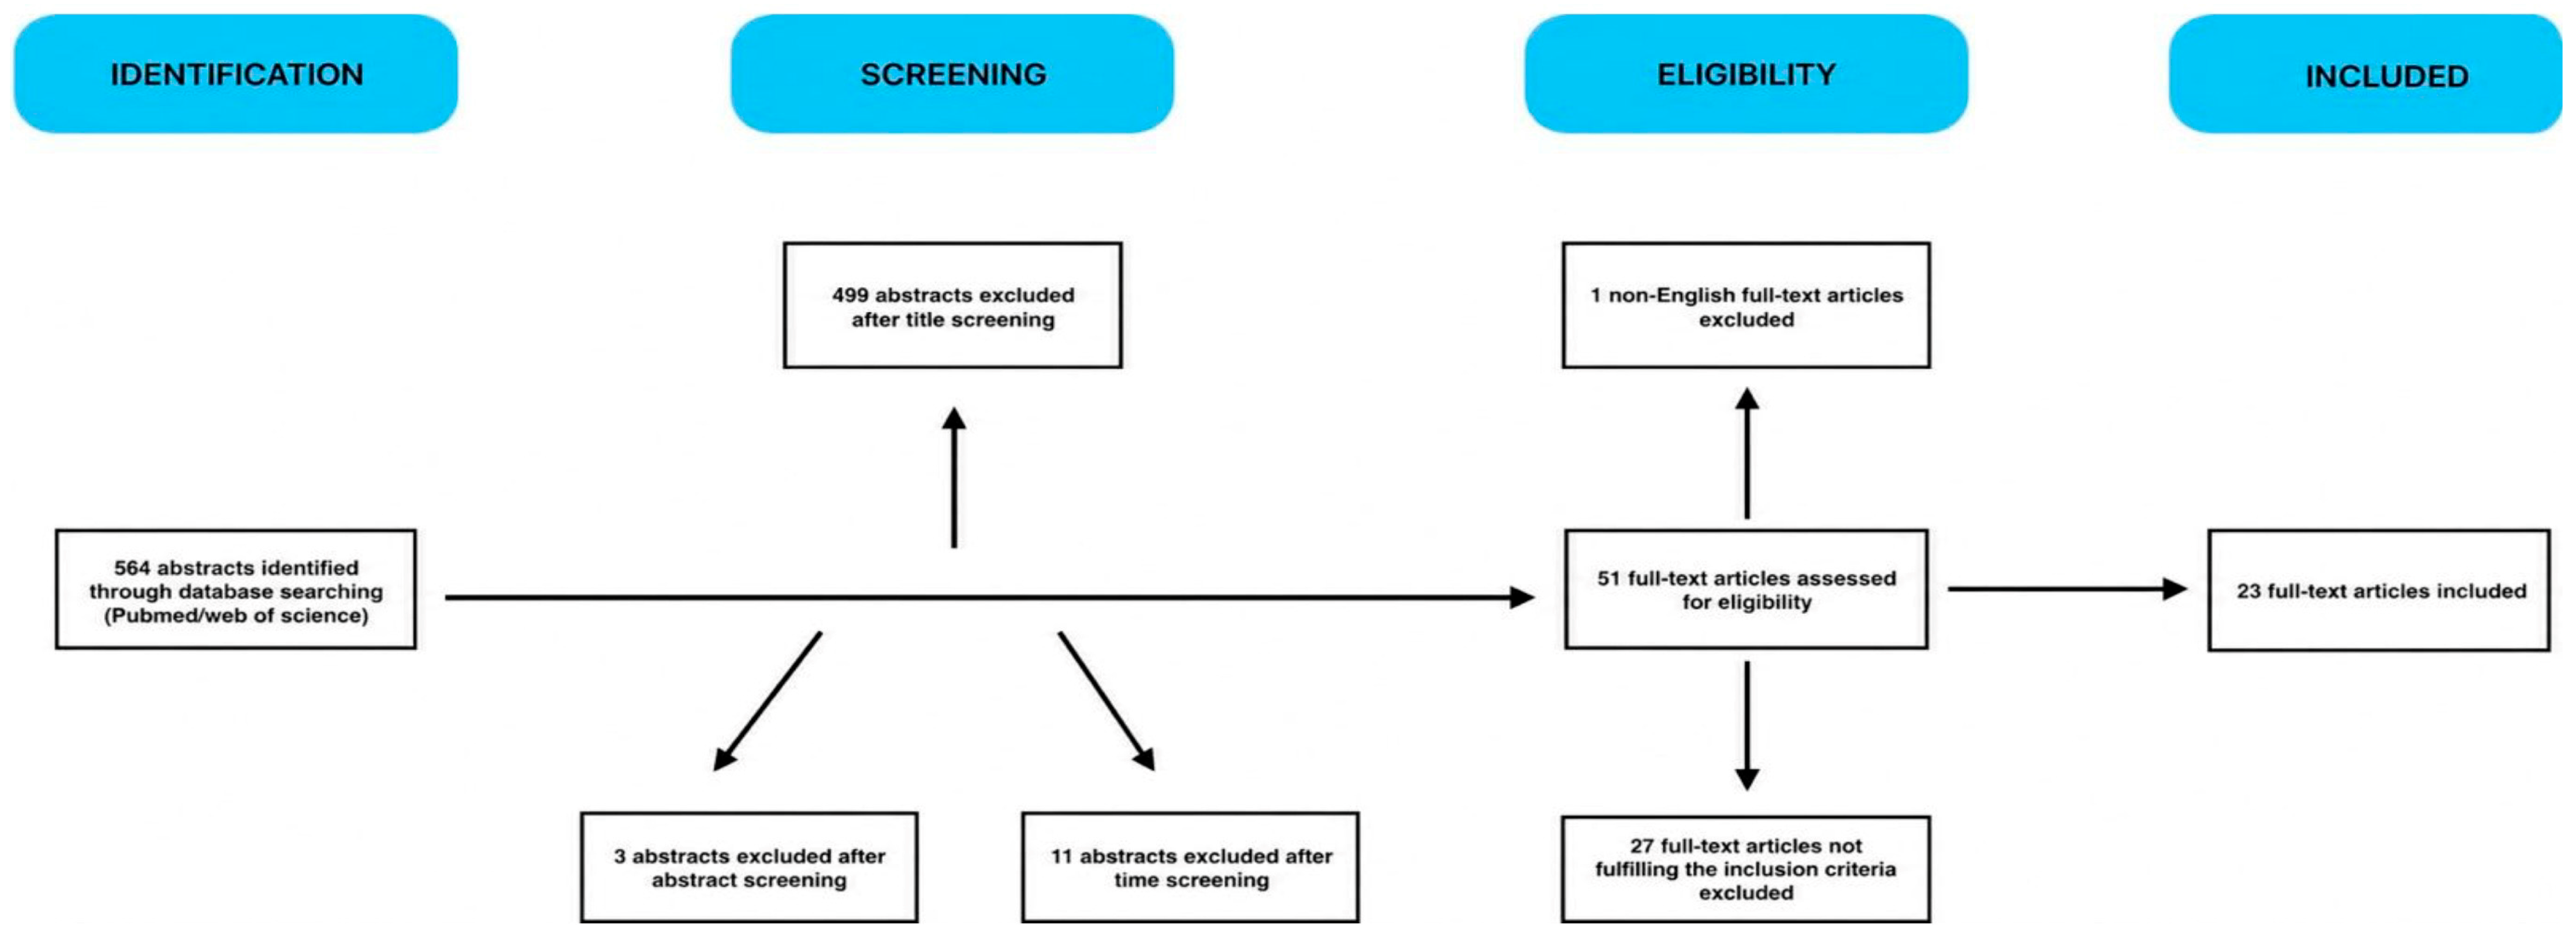
A total of 51 full-text articles were assessed for eligibility. After applying the inclusion and exclusion criteria, one article was excluded because it was not in English, and 27 additional articles were excluded for not meeting the inclusion benchmarks. Ultimately, 23 primary research articles were included in this systematic review. The process of identification, screening, eligibility assessment, and final inclusion is summarized in the PRISMA flow diagram (Figure 1). A comprehensive overview of the baseline clinical and radiological features of all included studies is provided in Table 3.

3. Results

A total of 51 published studies were identified through PubMed, Google Scholar and Scopus databases. The reporting of patient characteristics, demographics, and treatment details was inconsistent across the included studies.
Our analysis indicates that GS predominantly affects the adult population, typically between 40 and 60 years of age. In total, 549 patients were evaluated, with a mean age of 55.72 ± 14.38 years. A clear male predominance was observed, with 357 males (65.03%) and 191 females (34.79%), resulting in a male-to-female ratio of approximately 1.87:1.
GS is most commonly located in the temporal and frontal lobes, followed by the ventricles, parietal and occipital lobes, brainstem, and cerebellum, with a tendency for involvement of the left hemisphere. In our systematic review, approximately 25.32% of tumors were situated in the temporal lobe, 18.94% in the frontal lobe, 9.84% in the parietal lobe, 0.91% in the cerebellum, 2.37% in the IV/LV, 4.01% in the occipital lobe and 1.10% in the thalamic region. Regarding lateralization, the left hemisphere appears to be more frequently affected. Across the studies, about 549 preoperative MRIs were analyzed, with only a single preoperative FDG-PET scan evaluated.
The literature suggests that while GS does not have a single, pathognomonic radiological signature, certain morphological markers—such as well-demarcated margins, irregular or paliform enhancement (P-E) patterns, and the ‘salt and pepper’ (S–P) sign—frequently differentiates it from primary GBM [1,14,16,25,30,31]. However, these features show significant heterogeneity across studies. For instance, the ‘salt and pepper’ sign, indicative of intratumoral hemorrhage at the solid–cystic interface, is highly sequence-dependent; its diagnostic utility improves notably when susceptibility-weighted imaging (SWI) is used compared to conventional sequences. Similarly, paliform and uneven ring-like enhancements, characteristic of biphasic sarcomatous and gliomatous architecture, are subjected to inter-observer variability. Therefore, these features should be considered as a part of a cumulative set of indicators rather than standalone diagnostic criteria. Their presence increases the probability of GS being the correct diagnosis within the context of complex intracranial lesions [1,31].
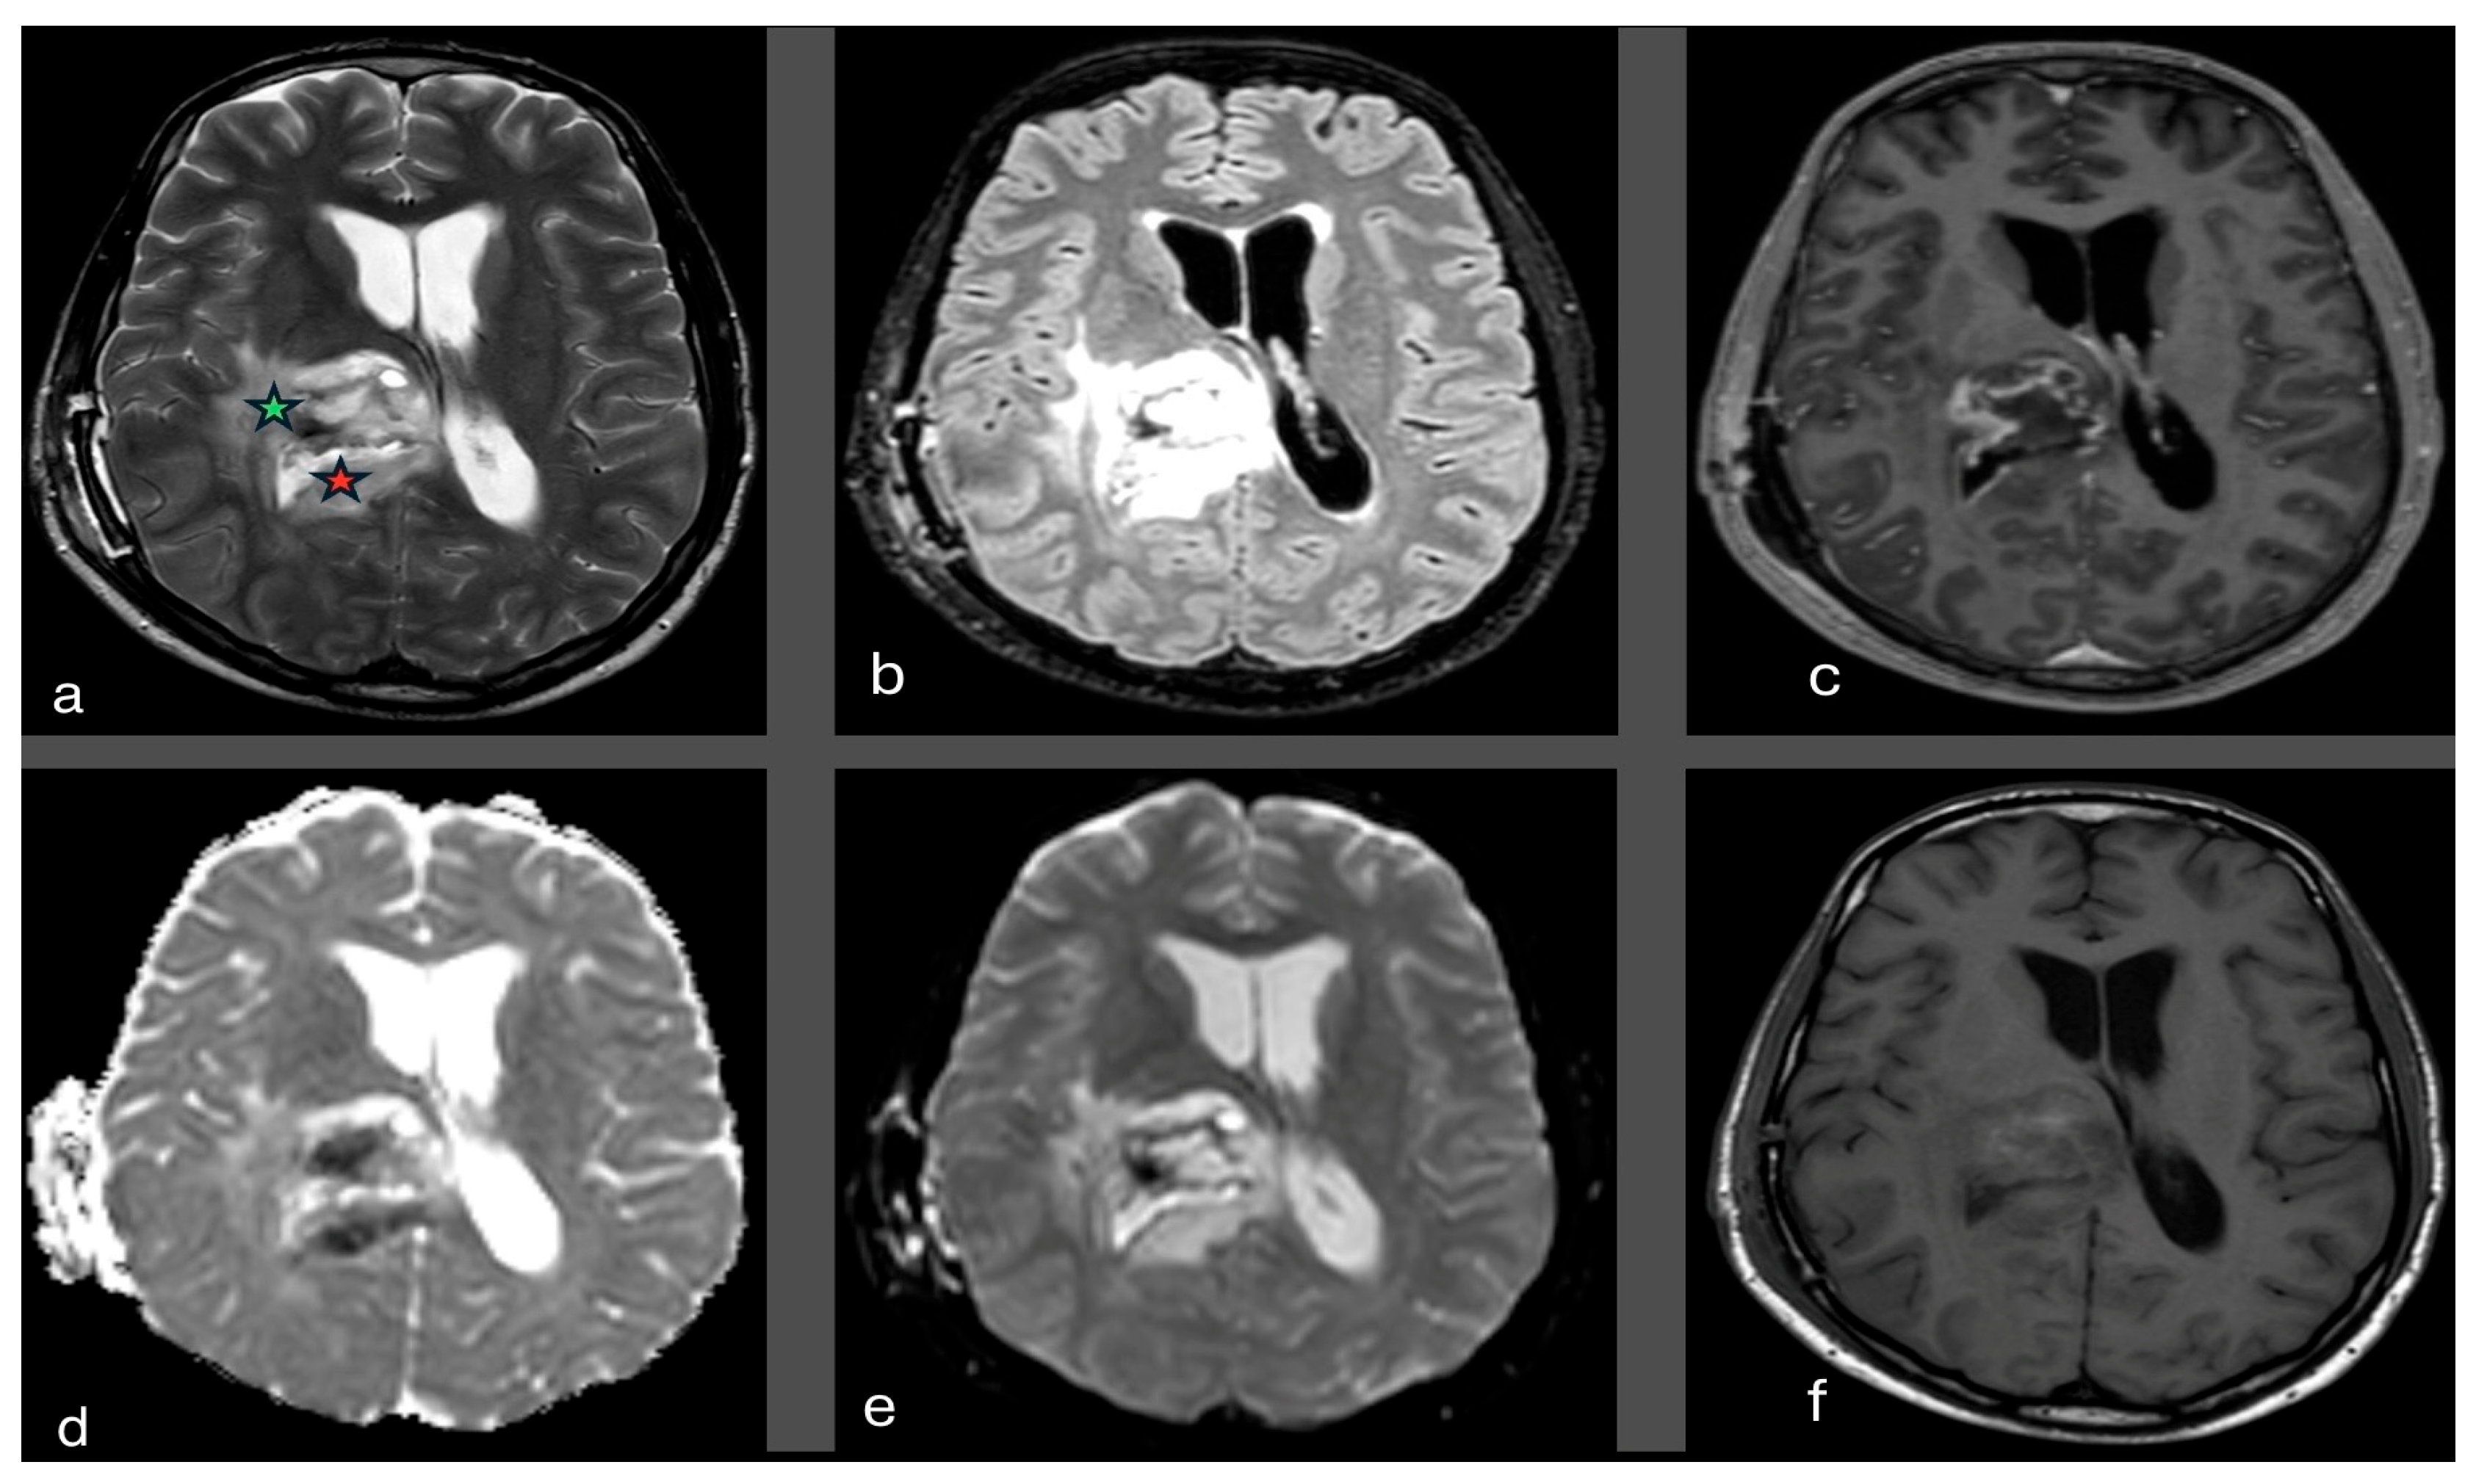
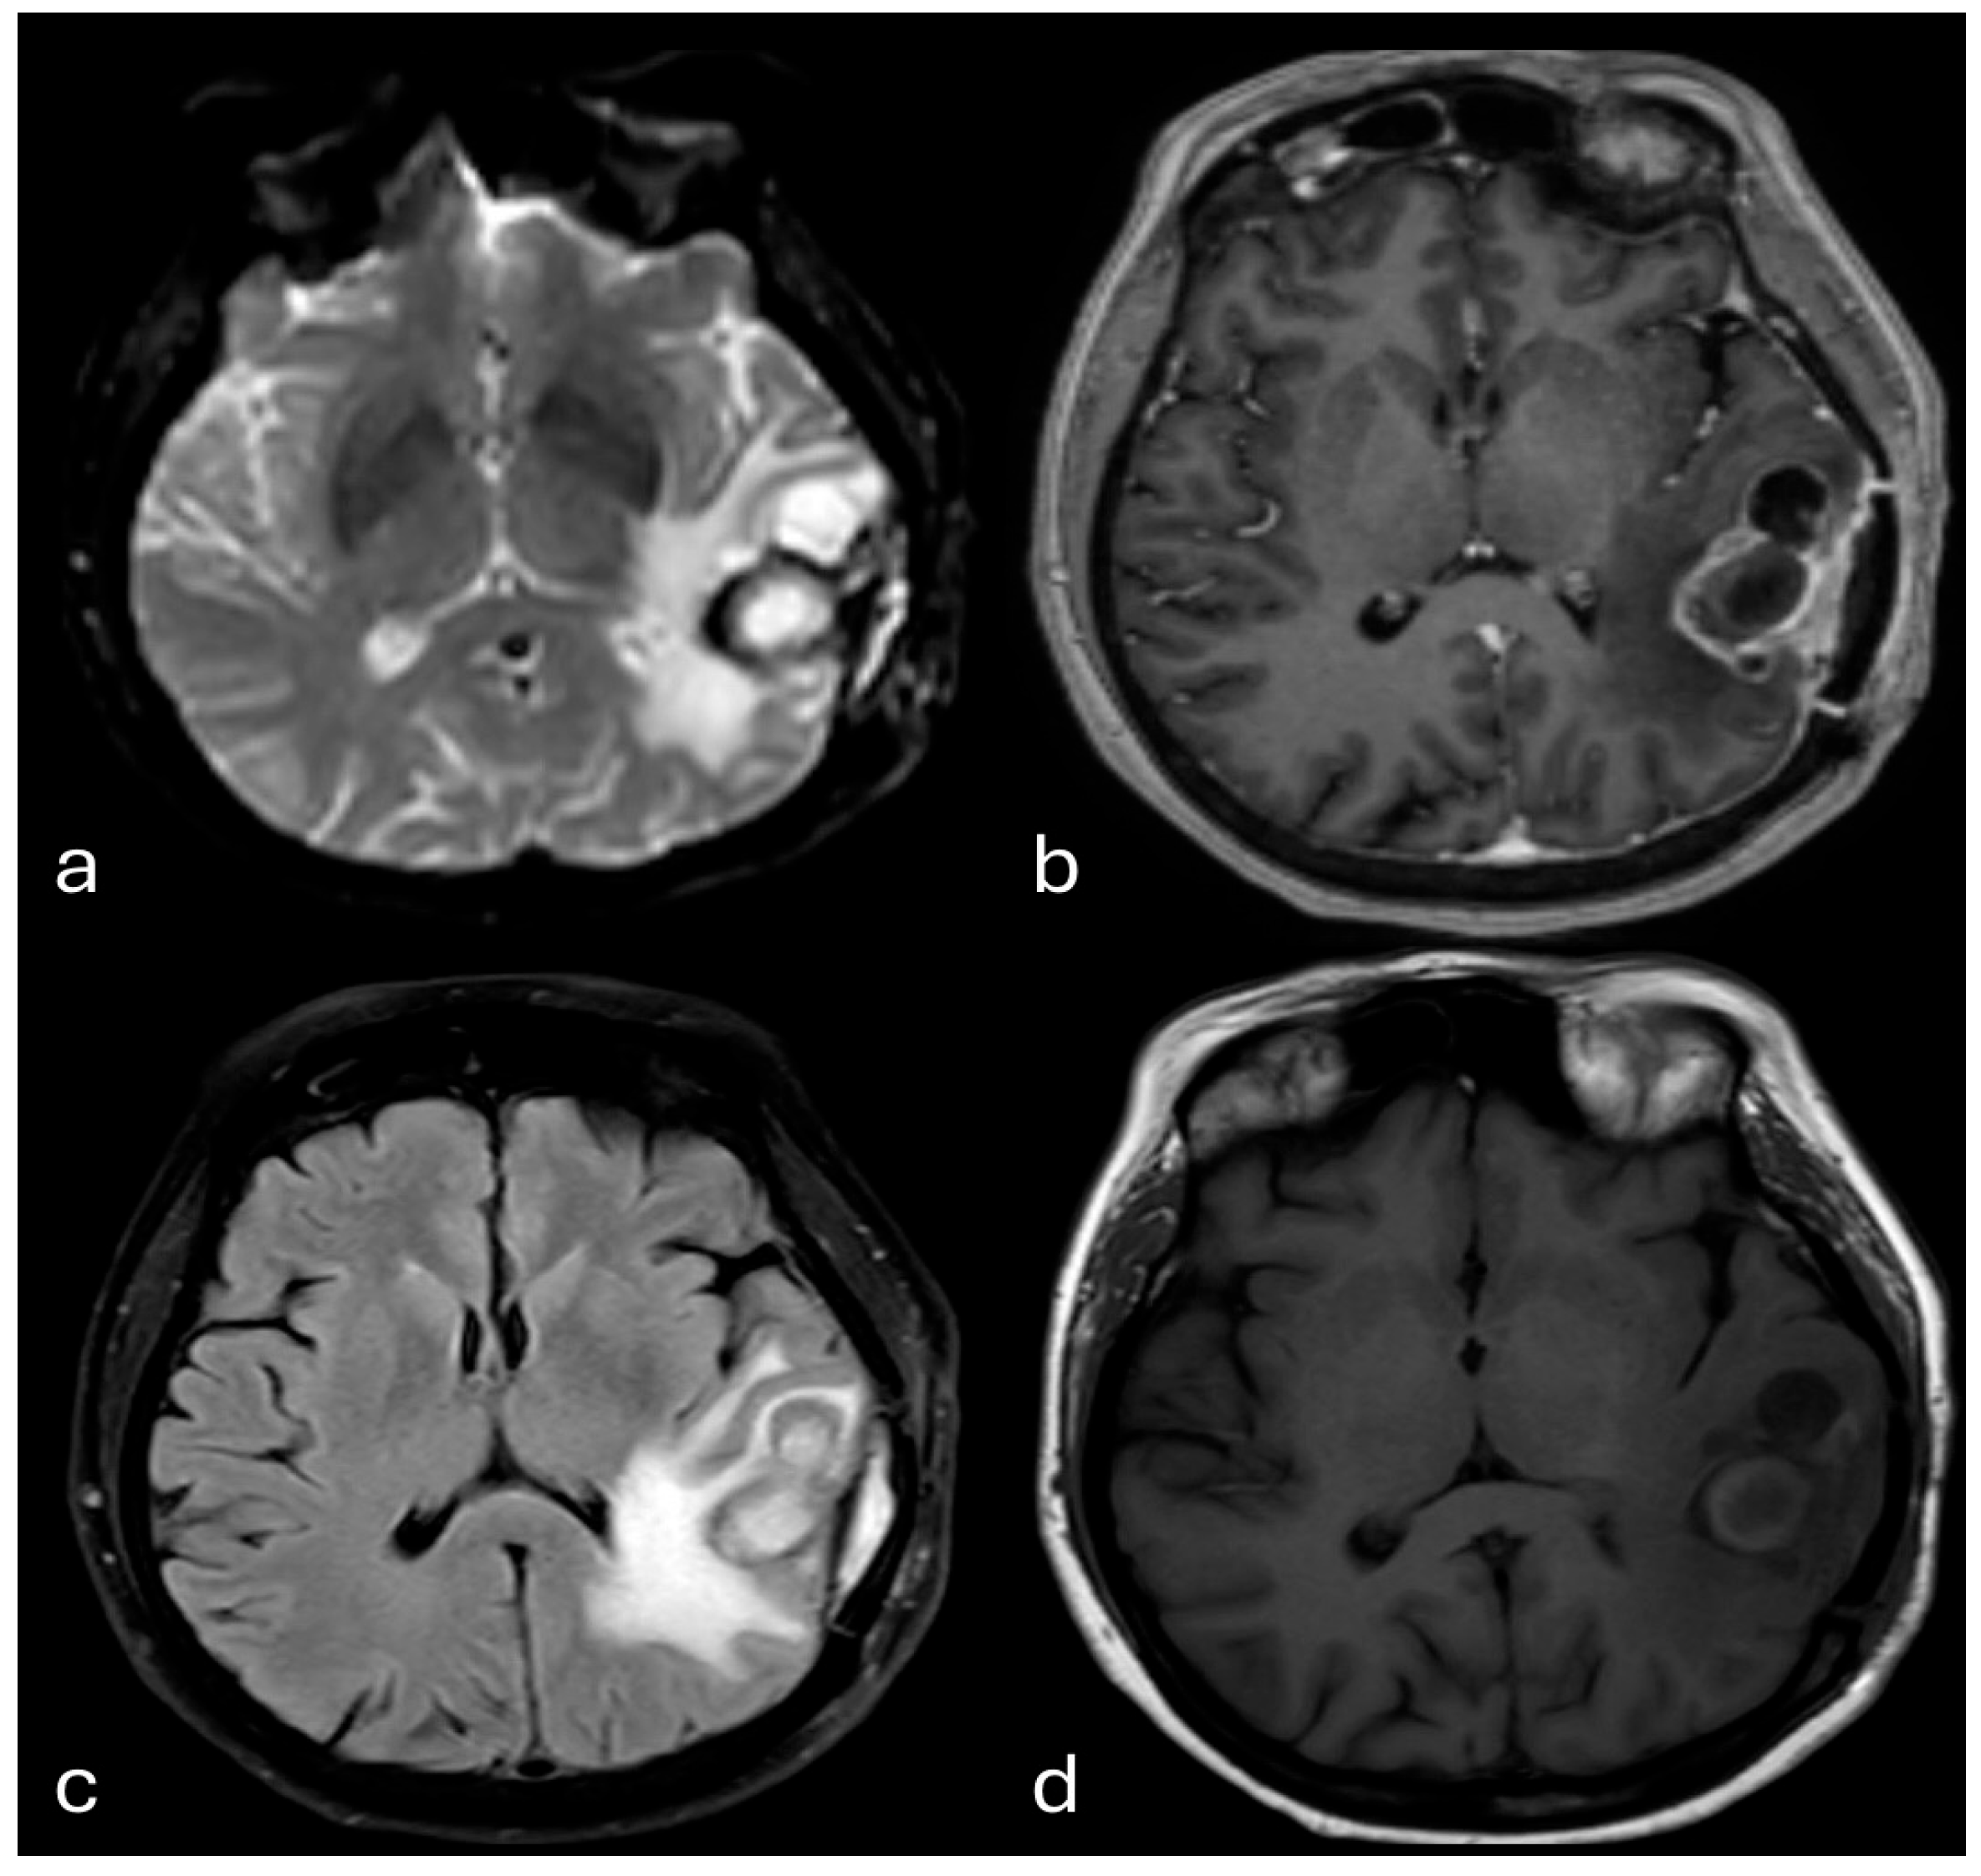
On T1-weighted imaging (T1WI), GS typically appears hypointense or heterogeneous, with both hypo- and hyperintense areas (Figure 2 and Figure 3). On T2-weighted imaging (T2WI), a hyperintense component is usually observed, and a mixed (hypo-/hyperintense) signal may also be present (Figure 2 and Figure 3).
Diffusion-weighted imaging (DWI) often reveals areas of restricted diffusion located within the more solid or thicker components (Figure 2 and Figure 3).
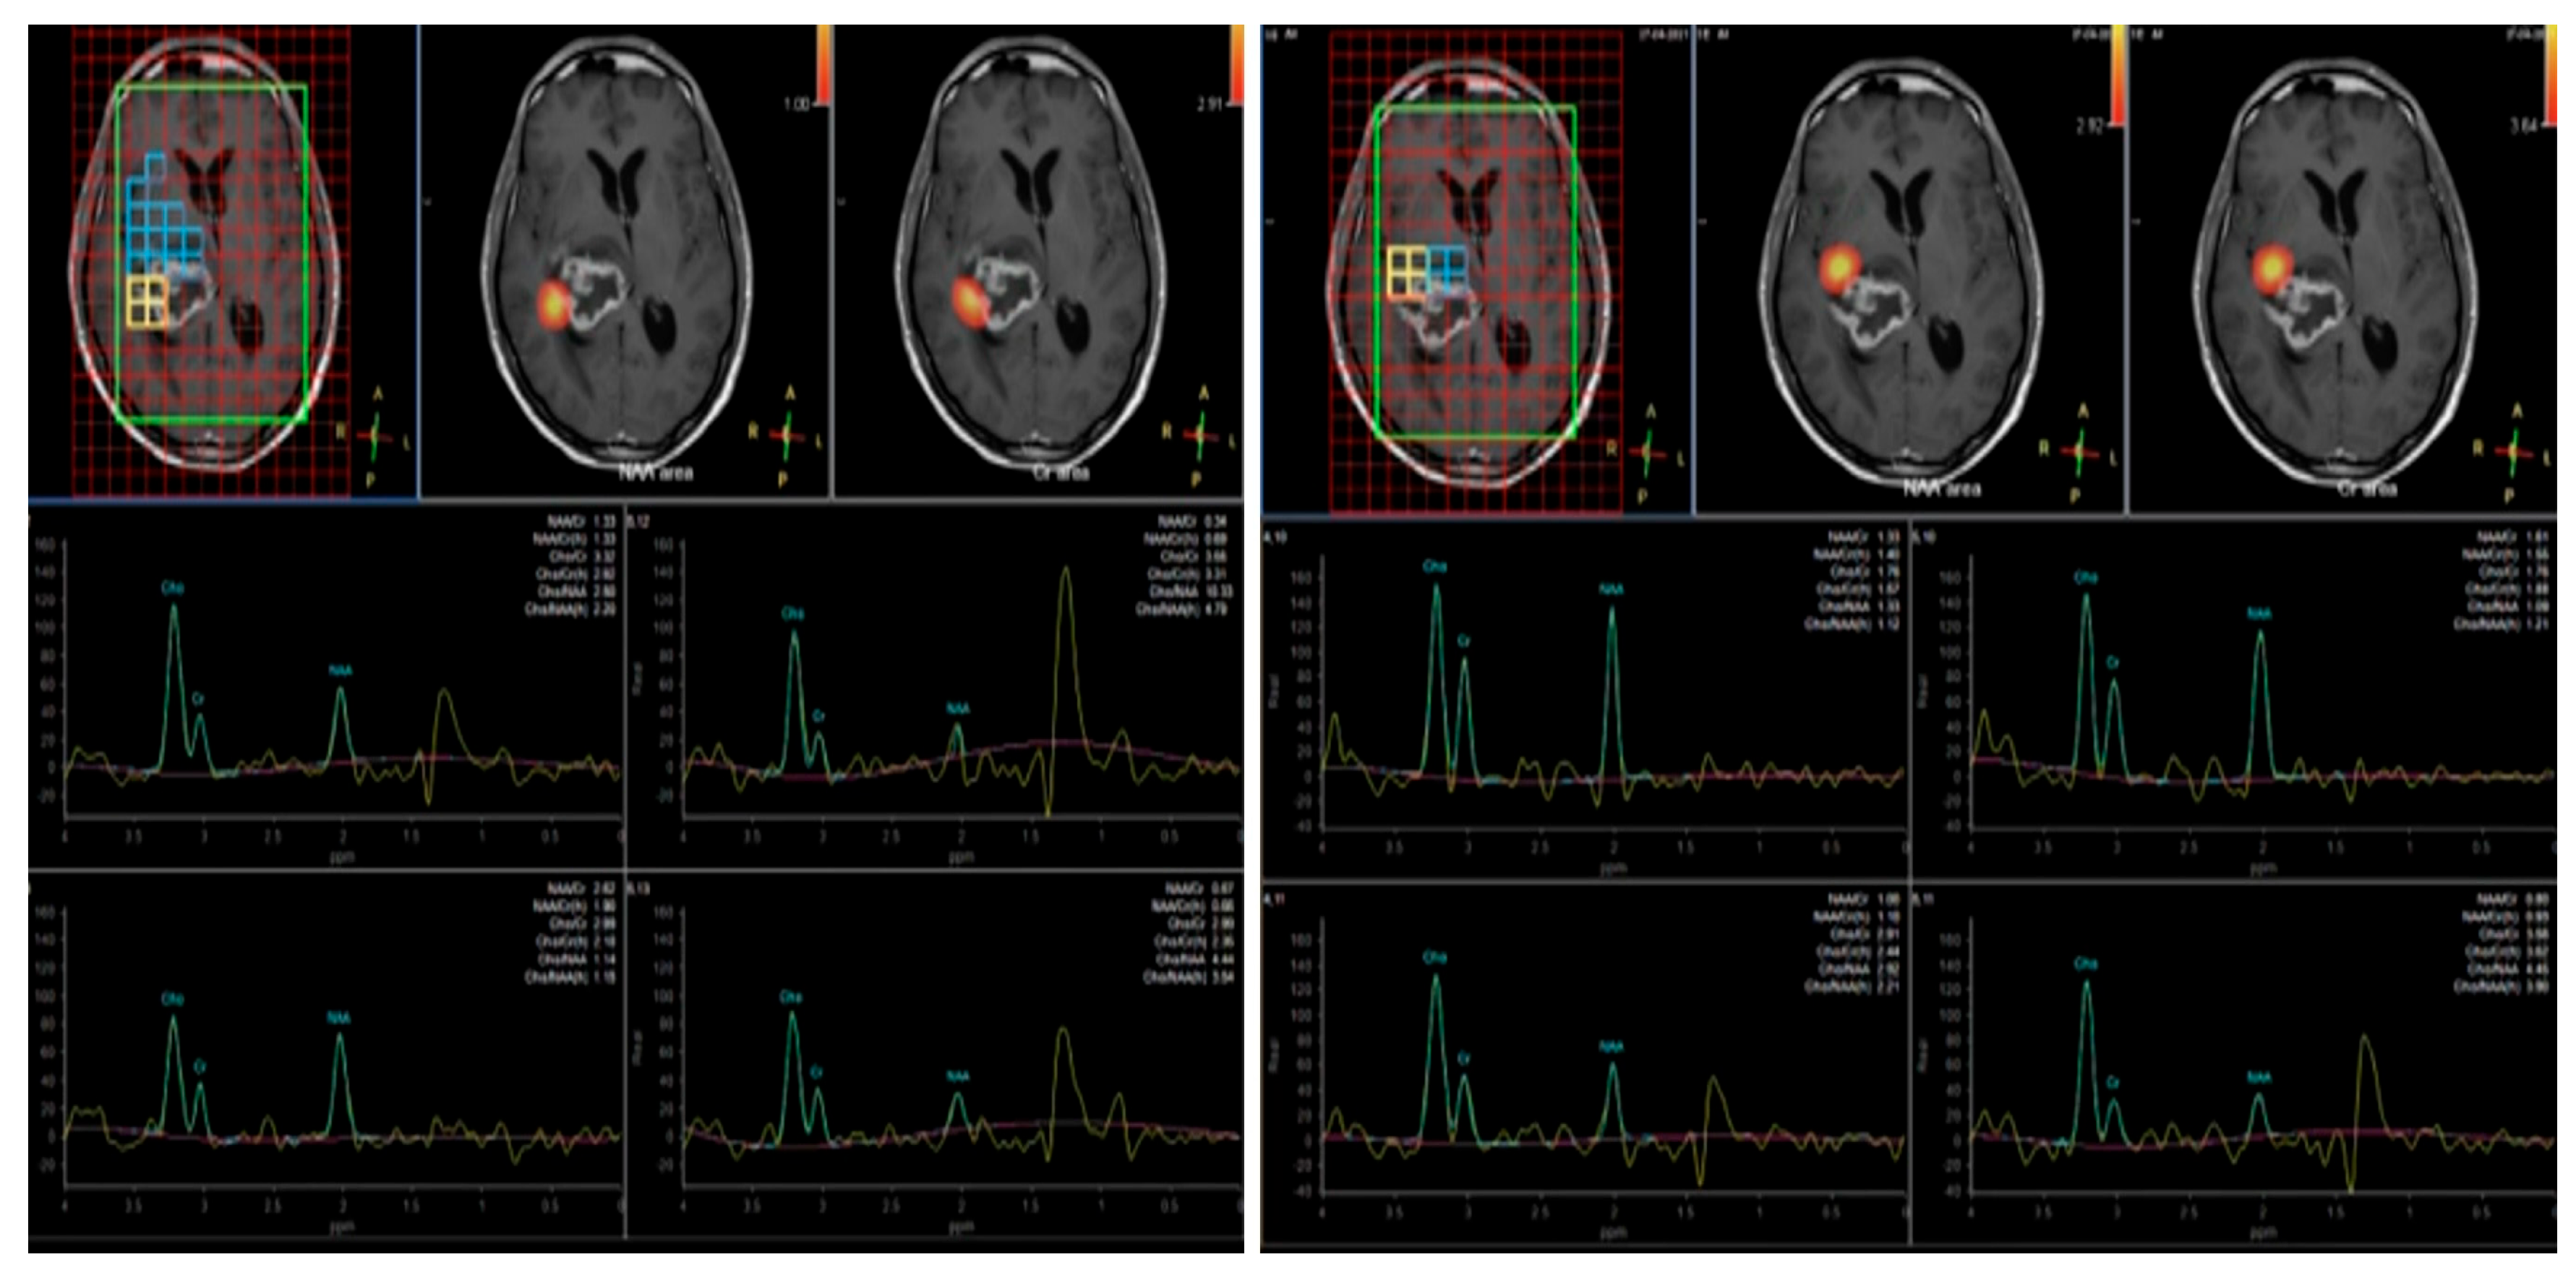
MRS characterizes GS by increased choline (Cho), elevated Cho/Cr and Cho/NAA ratios, increased lactate (Lac) and lipid (Lip) peaks, and decreased N-acetylaspartate (NAA), creatine (Cr), as well as a reduced NAA/Cr ratio (Figure 4).
Perfusion-weighted imaging (PWI), particularly rCBV maps, typically shows hyperperfusion in the non-necrotic, solid components of the lesion.
On T1- and T2-weighted imaging, GSs usually demonstrate heterogeneous signals, with predominant T1 hypointensity and T2 hyperintensity [11]. On FLAIR sequences, lesions are usually hyperintense relative to normal white matter (Figure 2 and Figure 3). Solid tumor components often show intermediate to low signal intensity on T2, possibly reflecting high cellularity and fibrous tissue, whereas hyperintense areas tend to correspond to necrotic or cystic changes [11,14,32].
Perilesional vasogenic edema is common and can be seen clearly on FLAIR imaging; however, some cases lack significant surrounding edema [11] (Figure 3). Diffusion-weighted imaging (DWI) may show heterogeneous diffusion patterns, with restricted diffusion in highly cellular tumor regions and hypointense areas corresponding to necrosis or cystic zones, aiding in delineating tumor heterogeneity [11] (Figure 2 and Figure 3).
Contrast-enhanced T1-weighted images typically reveal heterogeneous and marked enhancement patterns [11,14,32], often with rim- or ring-like configurations featuring thick, irregular walls and focal nodularities [11]. Intratumoral linear or strip-like enhancement and paliform patterns may also be observed (Figure 2 and Figure 3), possibly reflecting neoangiogenesis [11]. Ependymal lining enhancement can be present when the tumor extends into the ventricular system [11]. Cystic and necrotic zones generally do not become enhanced [9].
Dynamic susceptibility contrast (DSC) perfusion MRI usually demonstrates hyperperfusion within the solid, non-necrotic tumor parts [11]. No single imaging feature is pathognomonic for gliosarcoma; however, some findings—such as relatively thicker tumor wall, often with a “paliform” pattern, higher incidence of hemorrhage, and eccentric cystic components—are more suggestive of GS [2]. Univariate analyses suggest that gliosarcomas tend to be larger than glioblastomas (GBMs), with more pronounced contrast enhancement, greater cortical involvement, less necrosis, lower propensity for ependymal invasion, and less midline-crossing edema [2] (Figure 3). Similar to GBM, DSC MRI shows increased rCBV in the solid tumor components. Evaluation of percent signal recovery (PSR) may provide additional value in the differential diagnosis [11].
Spectroscopically, significant differences exist between GBM and GS in n-lipid peaks and lipid-to-choline ratios. Lipid resonances is generally more prominent in metastases than in GS or GBM, and the absence of lipid peaks argues against metastasis (MET) [21]. Creatine levels tend to be higher in GBM than in MET, with GS showing similar levels to GBM [21]. Therefore, increased lipid peaks combined with relatively preserved creatine levels may favor a diagnosis of GS [21].
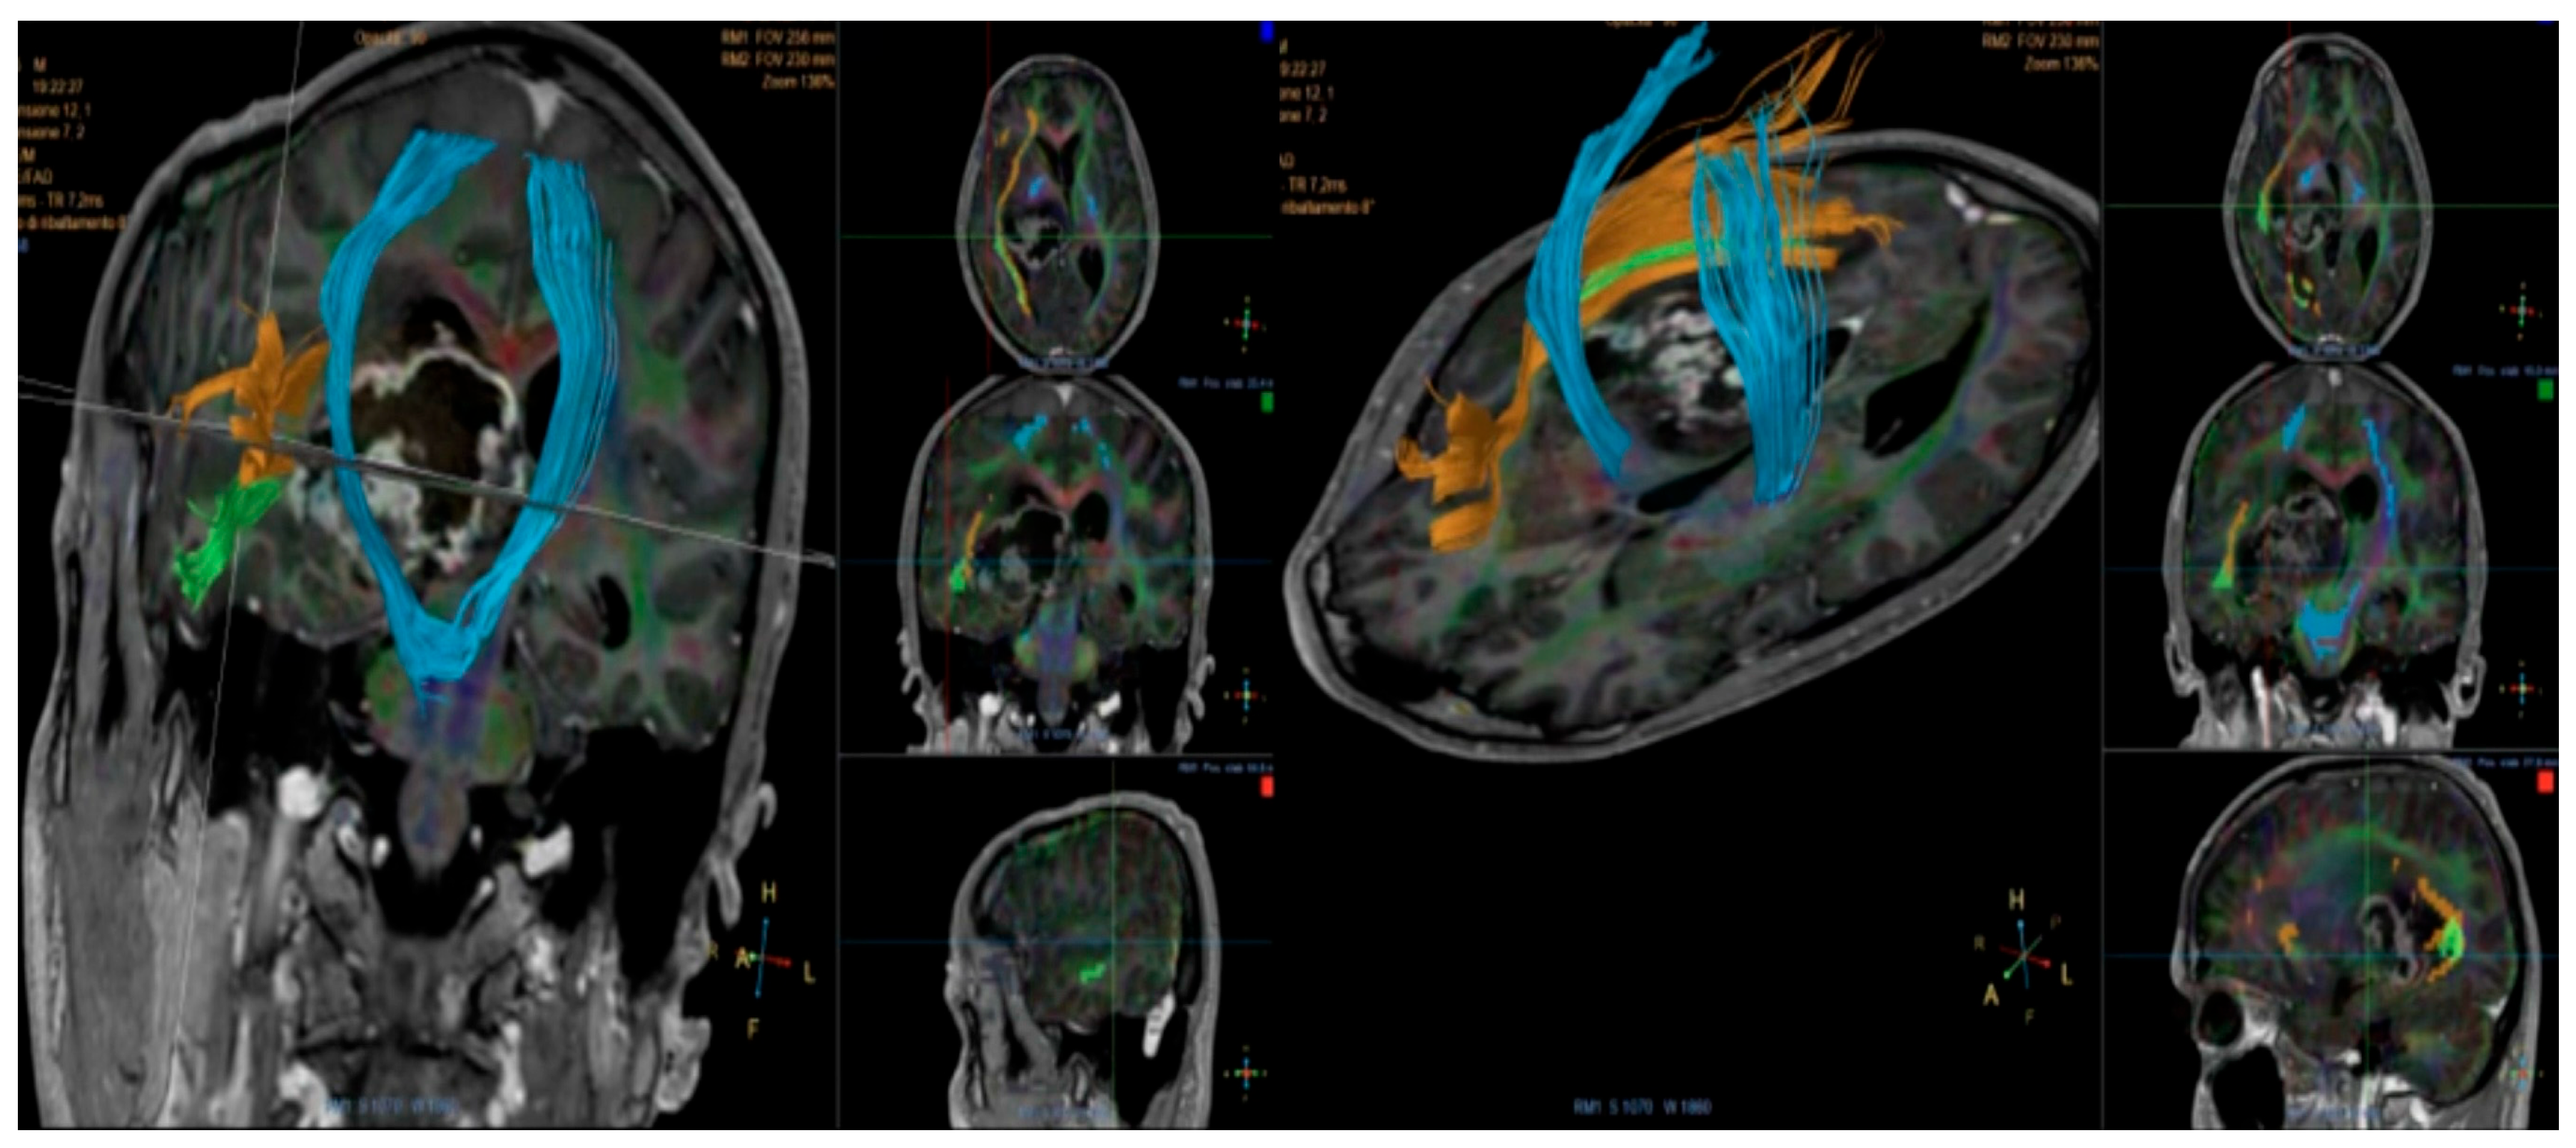
Diffusion tensor imaging (DTI) tractography is valuable for surgical planning, enabling visualization of major white matter tracts—such as the corticospinal tract and the arcuate fasciculus—in relation to the tumor, thereby helping to minimize fiber tract injury (Figure 5).
In cases evaluated where diffusion tensor imaging (DTI) has been performed, disruption of white matter tracts within the tumor region reflects malignant infiltration and destruction of neuronal structures [9]. The main differential diagnoses of GS include GBM, anaplastic meningioma, brain abscess, metastases, primitive neuroectodermal tumor (PNET), astroblastoma, and lymphoma [2,14,32]. Differentiating these entities based solely on imaging remains challenging.
Radiologically, GS may overlap with GBM and anaplastic meningioma, but some features are more common in GS, such as eccentric cystic components and a tendency toward peripheral location with dural or falcine involvement [2,11,14,32]. MR spectroscopy often shows increased lipid and macromolecule resonances, with a higher lipid-to-choline ratio compared to GBM [3]. Additionally, GS exhibits a greater propensity for extracranial and intra-axial metastases than GBM [14,32].
The appearance of abscesses differs notably; they typically show smooth, thin-walled ring enhancement and marked diffusion restriction with low ADC values, contrasting with the irregular, thick-walled rims seen in GS [14,32]. Meningiomas generally have homogeneous enhancement and are extra-axial, though aggressive variants can mimic intra-axial lesions [14,32]. Primary CNS lymphoma usually appears hypo- to isointense on T1 and T2, with homogeneous, intense enhancement; ring enhancement is uncommon but can occur when necrosis is present [9].

4. Discussion

According to the 2021 World Health Organization (WHO) classification, GS is considered a variant of GBM [1,33,34]. However, given the radiological, histological, and molecular differences observed, this classification may be somewhat ambiguous. Some authors propose that GS and GBM could represent distinct entities, highlighting the need for multicenter studies and large-scale meta-analyses to better characterize GS and develop tailored treatment strategies [1,3,10,35,36].
Our review indicates that, although differences in imaging, histology, and molecular features are evident, no consistent clinical or epidemiological distinctions have been established. GS appears to affect males more frequently than females [16,25,31], although La Torre et al. [1] reported no clear sex predominance. The typical age range is between 40 and 60 years [1,16,25,31]. The left hemisphere is more often involved [1], with the temporal lobe (27%) and frontal lobe (17%) being the most common sites, followed by the ventricles (10%). Less frequently affected areas include the parieto-occipital lobes (2%), brainstem, and cerebellum (2%) [1,31].
Similarly, Peckham et al. [23] have questioned earlier assumptions of a strong temporal lobe predilection (13/25 patients). In their cohort, right hemisphere involvement was more frequent (approximately 17/25 patients), and the mean lesion size was 5.6 cm [23]. Recent cohorts have challenged this consistency [30,31], suggesting that anatomical localization may be influenced by selection bias rather than intrinsic tumor biology. A more reliable diagnostic indicator appears to be the integrated imaging phenotype—specifically the combination of irregular, thick-walled rim enhancement with metabolic profiles indicating peritumoral infiltration—rather than lesion location alone [30,31].
Certain radiological features may raise suspicion for GS over GBM, including solid–cystic architecture, well-demarcated margins, the “salt and pepper” sign (crescent-shaped enhancement at the solid–cystic interface), irregular rim enhancement, ring-like or palisading enhancement patterns, and intratumoral linear enhancement [1,18,22,25,31]. The presence of an eccentric cystic component has also been proposed as an independent predictor of GS [1,37]. Overall, these radiological characteristics can assist in differentiating GS from GBM.
Conversely, Sampaio et al. [2,11] suggest that cystic components and invasion of the pial and ependymal surfaces are more characteristic of GBM, while perilesional hemorrhage tends to be more indicative of GS. However, Maurer et al. [2] have observed a higher incidence of cystic features in favor of GBM and found no significant association between temporal lobe predominance or dural involvement and GS, contrary to earlier reports [2,11,38,39]. Their findings suggest that sequences like SWI or GRE for hemorrhage detection can improve the diagnostic accuracy for GS, while radiological differentiation of GS from GBM remains challenging [2].
Finally, Yi et al. [22], in a study comparing 48 patients with GS and 48 matched GBM cases, confirmed the association between GS and hemorrhage, while ependymal invasion was more strongly linked to GBM [22].
According to Karasev et al. [30], GS should be considered in the differential diagnosis not only with GBM, but also with intracerebral metastases and anaplastic meningiomas.
Radiological differentiation among gliosarcoma, glioblastoma, intracerebral metastases, and anaplastic meningioma relies on an integrated interpretation of multiple imaging modalities—including conventional MRI sequences, diffusion-weighted imaging, perfusion imaging, and proton magnetic resonance spectroscopy—since no single parameter is sufficient alone. When these features are collectively analyzed, characteristic patterns emerge that enable reliable differential diagnosis [30].
A key initial consideration is the lesion’s location and its relationship to the dura mater. Both gliosarcoma and glioblastoma are intra-axial tumors involving the gray and white matter. However, gliosarcoma often exhibits dural involvement or adhesion, which can lead to confusion with extra-axial lesions. In contrast, glioblastoma typically remains confined within the intra-axial compartment and does not show dural attachment [1,10,30,35]. Intracerebral metastases are also intra-axial but tend to localize at the gray–white matter junction and are often multiple [30,40,41]. Anaplastic meningiomas are classically extra-axial, characterized by dural attachment—a key diagnostic feature—although more aggressive variants may partially lose these characteristics and mimic intra-axial malignancies [1,30].
Regarding contrast enhancement, both gliosarcoma and glioblastoma commonly display ring enhancement, often associated with central necrosis [1,30]. Metastases may also show ring-like enhancement with well-defined margins [30,40,41]. Anaplastic meningiomas generally demonstrate strong, relatively homogeneous enhancement; however, in more aggressive variants, this pattern may become heterogeneous or even ring-like, complicating diagnosis [30]. Therefore, enhancement pattern alone is insufficient for definitive differentiation [30].
Peritumoral edema provides a more useful distinguishing feature. High-grade gliomas, including glioblastoma and gliosarcoma, often present with signal abnormalities reflecting vasogenic edema and tumor infiltration, resulting in poorly defined margins [1,16,22,25,27,30]. Conversely, metastases and meningiomas are associated primarily with vasogenic, non-infiltrative edema, where the surrounding brain parenchyma is displaced rather than invaded. This distinction is crucial and consistently supported across various imaging techniques [30,40,41].
Diffusion-weighted imaging typically shows restricted diffusion within the solid components of these lesions, but this feature has limited specificity. Perfusion imaging offers greater discriminative value: high-grade gliomas demonstrate markedly increased cerebral blood volume (CBV), not only within the enhancing tumor core but also in surrounding non-enhancing regions, reflecting diffuse neovascularization and infiltration [1,16,25,30]. Metastases and anaplastic meningiomas may also show increased perfusion, but usually to a lesser extent and without significant involvement of the peritumoral tissue [30,40,41].
T2-weighted imaging provides additional diagnostic clues. Glioblastoma typically appears heterogeneous, but without prominent hypointense areas [21,30]. Gliosarcoma often exhibits marked heterogeneity with alternating hyperintense and hypointense regions, reflecting its biphasic histology (glial and sarcomatous components); this pattern can serve as an important diagnostic clue [1,16,22,25,30]. Metastases tend to be more uniform and less structurally complex, whereas anaplastic meningiomas may also appear heterogeneous and can sometimes mimic gliosarcoma [30,40,41]. Hemorrhage is common in gliosarcoma and glioblastoma but is more frequently observed in metastases and is relatively uncommon in meningiomas [1,30,40,41].
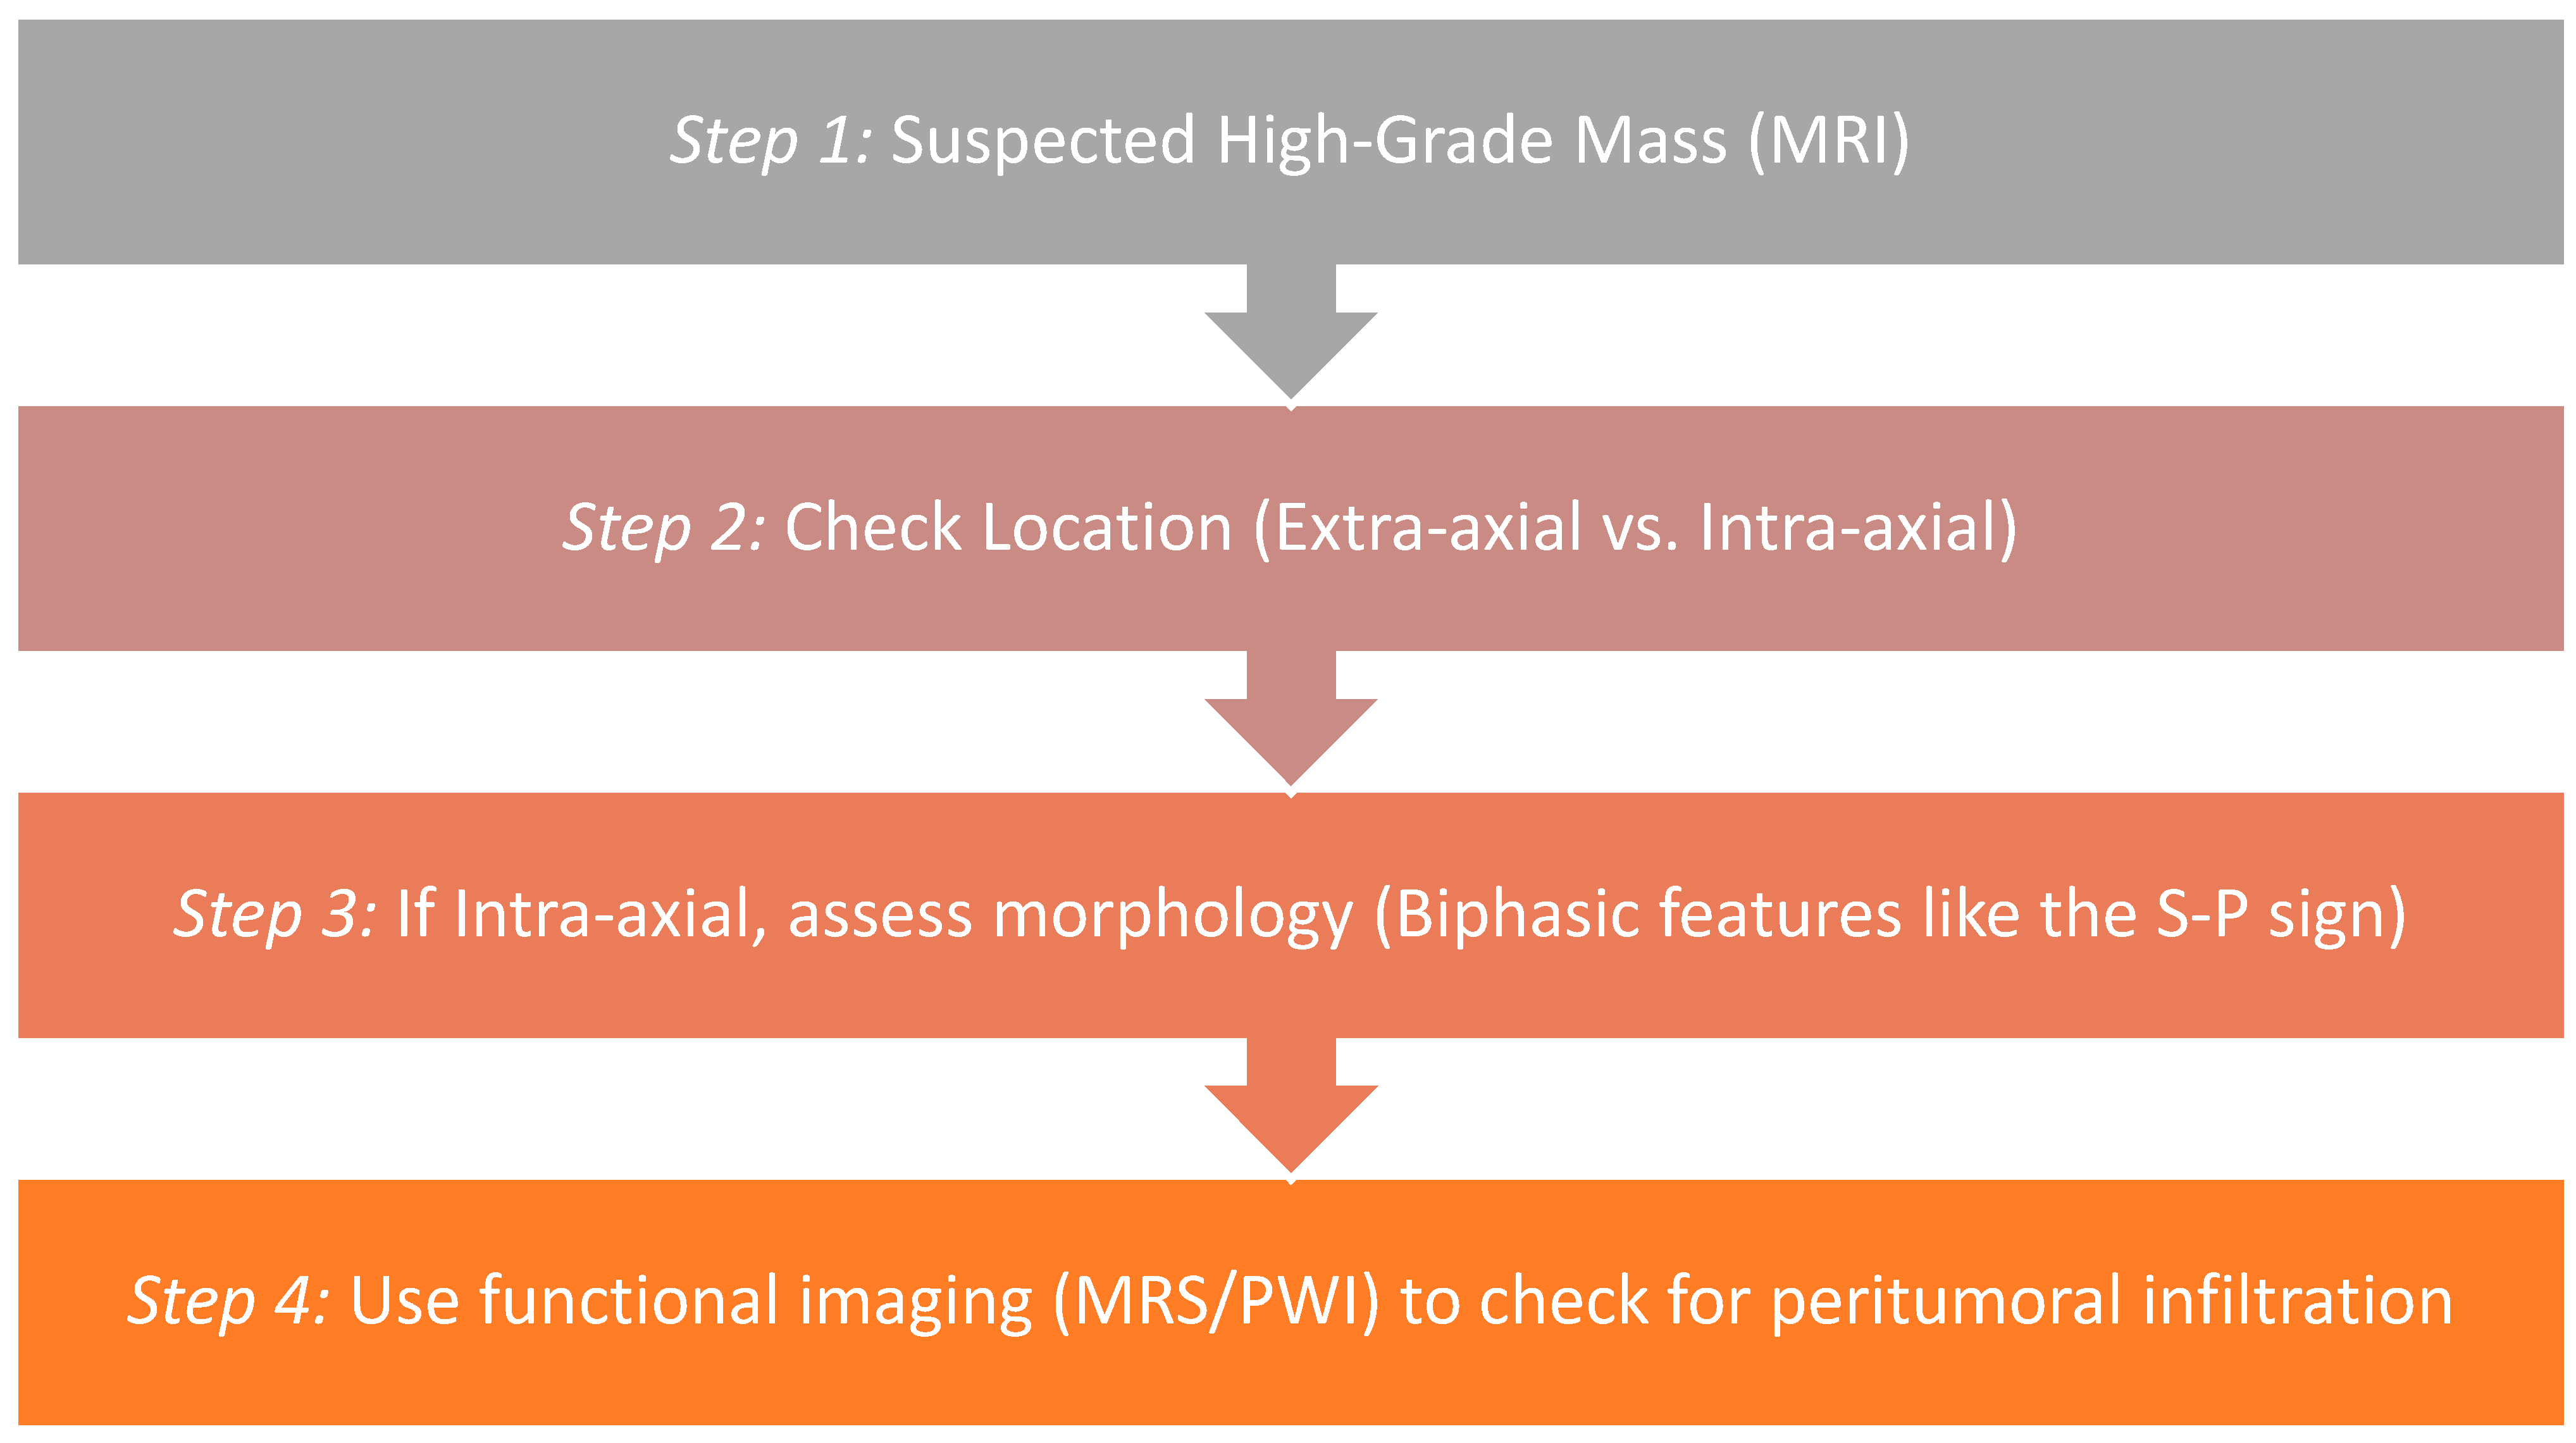
Differentiating GS from other lesions remains clinically challenging. While GS, GBM, and metastases can all present with ring enhancement and hemorrhage, the literature indicates that metabolic markers are critical for accurate diagnosis. Specifically, the presence of peritumoral metabolic abnormality (elevated choline/decreased NAA) serves as a reliable marker of infiltration in GS. Such metabolic changes are usually absent in most metastases, where the peritumoral environment remains relatively normal [1,30,31] (Figure 6 and Table 4).
Proton magnetic resonance spectroscopy provides vital metabolic insights. Gliosarcoma and glioblastoma share similar spectral profiles, characterized by markedly elevated choline (reflecting high cellular turnover), reduced N-acetylaspartate (indicating neuronal loss), and increased lipid and lactate peaks (associated with necrosis and hypoxia). These features result in high Cho/NAA ratios [1,16,22,25,30]. Importantly, metabolic abnormalities often extend into the peritumoral region in high-grade gliomas, consistent with infiltrative growth. In contrast, metastases may show similar spectral patterns within the lesion but usually do not exhibit significant infiltration into surrounding tissue, which maintains a near-normal spectral profile. This distinction is among the most reliable criteria for differentiating metastases from high-grade gliomas [1]. Anaplastic meningiomas, being extra-axial, typically show reduced or absent NAA and increased choline and may exhibit an alanine peak—a relatively specific marker for meningiomas [30]. Like metastases, the adjacent brain tissue generally lacks metabolic signs of infiltration [30,40,41].
Based on this review, we propose that the radiological assessment of suspected GS should follow an integrated ‘triad’ approach:
(1)
Morphological features (identifying the ‘salt and pepper’ or paliform patterns);
(2)
Perfusion-based characteristics (confirming hyperperfusion in the solid components);
(3)
Metabolic signatures (detecting infiltrative metabolic signatures).
This combined approach demonstrates that while no single feature is pathognomonic, the convergence of these signs provides sufficient diagnostic confidence to distinguish GS from its mimics [1,14,16,25,27,31].
Although some authors have proposed hallmark signs for GS, such as eccentric cystic components and paliform enhancement, the diagnostic reliability of these markers varies. Comparative reviews, such as those by Sampaio et al. (2017) and Maurer et al. (2021), reveal discrepancies regarding the frequency of dural involvement and predilection for the temporal lobe [2,11]. These differences may stem less from biological variability and more from differences in imaging techniques used. For instance, the inclusion of susceptibility-weighted imaging (SWI) in recent studies has significantly improved the detection of intratumoral hemorrhage—a key feature of GS.
Therefore, future diagnostic protocols should emphasize standardized multi-parametric imaging approaches—particularly incorporating magnetic resonance spectroscopy and perfusion metrics—over reliance on isolated morphological markers, which are more susceptible to inter-observer variability (Figure 6).
A comprehensive comparison of the neuroimaging features of these neoplasms is summarized in Table 4.

Limitations

Despite the systematic approach employed, several inherent limitations of the current literature must be acknowledged. First, most included studies are retrospective and primarily consist of case reports or small case series, reflecting the rarity of gliosarcoma (GSC). This inherently limits the statistical power and generalizability of the findings. Second, there is considerable heterogeneity in the imaging protocols across studies. Variations in magnetic resonance (MR) field strength, pulse sequences (such as inconsistent use of SWI or GRE sequences for hemorrhage detection), and the absence of standardized quantitative criteria for features like the ‘salt and pepper’ sign or ‘dural involvement’ introduce subjectivity and inter-observer variability. Third, demographic and clinical data are reported inconsistently across studies, complicating efforts to assess prognostic factors and epidemiological trends. Finally, although multiparametric MRI shows promise in differentiating GSC from its mimics, many studies report only qualitative findings rather than standardized quantitative metrics (e.g., specific thresholds for rCBV or metabolite ratios). This limits our ability to establish definitive, pathognomonic diagnostic criteria. Larger-scale, prospective multicenter studies are essential to validate these radiological markers and develop a standardized diagnostic framework.

5. Conclusions

In summary, our review confirms that MRI is a valuable tool for differentiating gliosarcoma from glioblastoma, intracerebral metastases, and anaplastic meningiomas. However, no single neuroradiological feature is pathognomonic for GSC with absolute certainty. Given the rarity of this tumor variant and the limited number of documented cases, larger multicenter studies are necessary to validate these findings and improve preoperative diagnostic accuracy. Ultimately, while imaging plays a crucial role in guiding clinical suspicion, histopathological and molecular analyses remain the gold standard for definitive diagnosis.

Author Contributions

Conceptualization, D.L.T., P.L. and G.G.; methodology, D.L.T., P.L. and G.G.; software, D.L.T., P.L., G.G., I.R. and E.D.B.; validation, D.L.T., P.L., A.D.T., E.D.B. and G.G.; formal analysis, D.L.T., P.L., G.G., A.D.T., I.R. and E.D.B.; investigation, D.L.T., P.L. and V.G.; resources, D.L.T., P.L. and V.G.; data curation, D.L.T., P.L., G.G., V.G. and A.D.T.; writing—original draft preparation, D.L.T., P.L., V.G., G.G. and I.R.; writing—review and editing, D.L.T., P.L., G.G. and I.R.; visualization, D.L.T., P.L., A.D.T., G.G. and S.M.C.; supervision, G.G., A.D.T. and S.M.C.; project administration, D.L.T., A.D.T. and S.M.C. All authors have read and agreed to the published version of the manuscript.

Funding

This research received no external funding.

Institutional Review Board Statement

Not applicable.

Informed Consent Statement

Not applicable.

Data Availability Statement

All data generated or analyzed during this study are included within the article.

Acknowledgments

No AI was used. No funding.

Conflicts of Interest

The authors declare no conflicts of interest.

Abbreviations

The following abbreviations are used in this manuscript:
GSGliosarcoma
GBMGlioblastoma
LVLateral ventricle
IVIntraventricular
NANot available
WHOWorld Health Organization
CBVCerebral Blood Volume
PNETPrimitive Neuroectodermal Tumor
DTI Diffusion Tumor Imaging
ADC Apparent Diffusion Coefficient
CBV/rCBVCerebral Blood Volume/Relative Cerebral Blood Volume
ChoCholine
CrCreatine
DSCDynamic Susceptibility Contrast
DWIDiffusion-Weighted Imaging
FLAIRFluid-Attenuated Inversion Recovery
MRIMagnetic Resonance Imaging
NAAN-acetyl Aspartate
T1W/T2WT1-Weighted/T2-Weighted
PWIPerfusion-Weighted Imaging
MRSMagnetic Resonance Spectroscopy
CTComputed Tomography
F-FDG-PETF-Fluorodeoxyglucose
MMale
FFemale
METMetastases
GBMGlioblastoma
PSRPerbene Signal Recovery
S-PSalt and pepper
LipLipid
LacLactate
SWI/GRESusceptibility-Weighted Imaging/Gradient Recalled Echo

References

  1. La Torre, D.; Della Torre, A.; Turco, E.L.; Longo, P.; Pugliese, D.; Lacroce, P.; Raudino, G.; Romano, A.; Lavano, A.; Tomasello, F. Primary Intracranial Gliosarcoma: Is It Really a Variant of Glioblastoma? An Update of the Clinical, Radiological, and Biomolecular Characteristics. J. Clin. Med. 2024, 13, 83. [Google Scholar] [CrossRef] [PubMed]
  2. Maurer, C.J.; Mader, I.; Joachimski, F.; Staszewski, O.; Märkl, B.; Urbach, H.; Roelz, R. Do gliosarcomas have distinct imaging features on routine MRI? Neuroradiol. J. 2021, 34, 501–508. [Google Scholar] [CrossRef] [PubMed]
  3. Hong, B.; Lalk, M.; Wiese, B.; Merten, R.; Heissler, H.E.; Raab, P.; Hartmann, C.; Krauss, J.K. Primary and secondary gliosarcoma: Differences in treatment and outcome. Br. J. Neurosurg. 2021, 38, 332–339. [Google Scholar] [CrossRef] [PubMed]
  4. Torregrossa, F.; Aguennouz, M.; La Torre, D.; Sfacteria, A.; Grasso, G. Role of Erythropoietin in Cerebral Glioma: An Innovative Target in Neuro-Oncology. World Neurosurg. 2019, 131, 346–355. [Google Scholar] [CrossRef] [PubMed]
  5. Coluccio, M.L.; Presta, I.; Greco, M.; Gervasi, R.; La Torre, D.; Renne, M.; Voci, C.P.; Lunelli, L.; Donato, G.; Malara, N. Microenvironment Molecular Profile Combining Glycation Adducts and Cytokines Patterns on Secretome of Short-term Blood-derived Cultures during Tumour Progression. Int. J. Mol. Sci. 2020, 21, 4711. [Google Scholar] [CrossRef] [PubMed]
  6. Bria, J.; Filardo, A.; Di Vito, A.; Della Torre, A.; Lavano, A.; Coscarella, I.; Chiarella, E.; Procopio, E.; Egiziano, M.T.; Longo, P.; et al. Recurrent Limitations of CAR-T Therapy in Gliomas: Evidence from Preclinical and Phase I Clinical Studies. Int. J. Mol. Sci. 2025, 26, 11435. [Google Scholar] [CrossRef] [PubMed]
  7. Di Vito, A.; Donato, A.; Bria, J.; Conforti, F.; La Torre, D.; Malara, N.; Donato, G. Extracellular Matrix Structure and Interaction with Immune Cells in Adult Astrocytic Tumors. Cell. Mol. Neurobiol. 2024, 44, 54. [Google Scholar] [CrossRef] [PubMed]
  8. Romeo, S.G.; Conti, A.; Polito, F.; Tomasello, C.; Barresi, V.; La Torre, D.; Cucinotta, M.; Angileri, F.; Bartolotta, M.; Di Giorgio, R.M.; et al. miRNA regulation of Sirtuin-1 expression in human astrocytoma. Oncol. Lett. 2016, 12, 2992–2998. [Google Scholar] [CrossRef] [PubMed]
  9. Fan, H.; Yu, Y.; Du, J.; Liu, L.; Luo, Y.; Yu, H.; Liao, X. Computed Tomography, Magnetic Resonance Imaging, and Pathological Features of Gliosarcoma. Neuropsychiatr. Dis. Treat. 2022, 18, 2577–2589. [Google Scholar] [CrossRef] [PubMed]
  10. Pierscianek, D.; Ahmadipour, Y.; Michel, A.; Rauschenbach, L.; Oppong, M.D.; Deuschl, C.; Kebir, S.; Wrede, K.H.; Glas, M.; Stuschke, M.; et al. Demographic, radiographic, molecular and clinical characteristics of primary gliosarcoma and differences to glioblastoma. Clin. Neurol. Neurosurg. 2021, 200, 106348. [Google Scholar] [CrossRef] [PubMed]
  11. Sampaio, L.; Linhares, P.; Fonseca, J. Detailed magnetic resonance imaging features of a case series of primary gliosarcoma. Neuroradiol. J. 2017, 30, 546–553. [Google Scholar] [CrossRef] [PubMed]
  12. Prado, R.M.d.A.; Tamura, B.P.; Gomez, G.D. Optic pathway gliosarcoma: A very rare location for a rare disease. Radiol. Case Rep. 2021, 16, 1665–1668. [Google Scholar] [CrossRef] [PubMed]
  13. Nitta, H.; Hayase, H.; Moriyama, Y.; Yamashima, T.; Yamashita, J. Gliosarcoma of the posterior cranial fossa: MRI findings. Neuroradiology 1993, 35, 279–280. [Google Scholar] [CrossRef] [PubMed]
  14. Han, L.; Zhang, X.; Qiu, S.; Li, X.; Xiong, W.; Zhang, Y.; Qu, H.; Chang, R.; Chen, B.; Wang, W.; et al. Magnetic resonance imaging of primary cerebral gliosarcoma: A report of 15 cases. Acta Radiol. 2008, 49, 1058–1067. [Google Scholar] [CrossRef] [PubMed]
  15. Moon, S.K.; Kim, E.J.; Choi, W.S.; Ryu, C.W.; Park, B.J.; Lee, J. Gliosarcoma of the cerebellar hemisphere: A case report and review of the literature. Korean J. Radiol. 2010, 11, 566–570. [Google Scholar] [CrossRef] [PubMed][Green Version]
  16. Zhang, B.Y.; Chen, H.; Geng, D.Y.; Yin, B.; Li, Y.X.; Zhong, P.; Wu, J.S.; Wang, X.Q. Computed Tomography and Magnetic Resonance Features of Gliosarcoma: A Study of 54 Cases. J. Comput. Assist. Tomogr. 2011, 35, 667–673. [Google Scholar] [CrossRef] [PubMed]
  17. Buhl, R.; Stark, A.M.; Hugo, H.H.; Rohr, A.; Mehdorn, H.M. Gliosarcoma: Clinical experiences and additional information with MR spectroscopy. Neurol. Res. 2009, 31, 873–877. [Google Scholar] [CrossRef] [PubMed]
  18. Romero-Rojas, A.E.; Diaz-Perez, J.A.; Ariza-Serrano, L.M.; Amaro, D.; Lozano-Castillo, A. Primary gliosarcoma of the brain: Radiologic and histopathologic features. Neuroradiol. J. 2013, 26, 639–648. [Google Scholar] [CrossRef] [PubMed]
  19. Singh, G.; Das, K.; Sharma, P.; Guruprasad, B.; Jaiswal, S.; Mehrotra, A.; Srivastava, A.; Sahu, R.; Jaiswal, A.; Behari, S. Cerebral gliosarcoma: Analysis of 16 patients and review of literature. Asian J. Neurosurg. 2015, 10, 195–202. [Google Scholar] [CrossRef] [PubMed]
  20. Doddamani, R.S.; Meena, R.K.; Selvam, M.M.; Venkataramanaa, N.K.; Tophkhane, M.; Garg, S.K. Intraventricular Gliosarcomas: Literature Review and a Case Description. World Neurosurg. 2016, 90, 707.e5–707.e12. [Google Scholar] [CrossRef] [PubMed]
  21. Raab, P.; Pilatus, U.; Hattingen, E.; Franz, K.; Hermann, E.; Zanella, F.E.; Lanfermann, H. Spectroscopic Characterization of Gliosarcomas—Do They Differ From Glioblastomas and Metastases? J. Comput. Assist. Tomogr. 2016, 40, 815–819. [Google Scholar] [CrossRef] [PubMed]
  22. Yi, X.; Cao, H.; Tang, H.; Gong, G.; Hu, Z.; Liao, W.; Sun, L.; Chen, B.T.; Li, X. Gliosarcoma: A clinical and radiological analysis of 48 cases. Eur. Radiol. 2019, 29, 429–438. [Google Scholar] [CrossRef] [PubMed]
  23. Peckham, M.E.; Osborn, A.G.; Palmer, C.A.; Tsai, A.; Salzman, K.L. Gliosarcoma: Neuroimaging and Immunohistochemical Findings. J. Neuroimaging 2019, 29, 126–132. [Google Scholar] [CrossRef] [PubMed]
  24. Fukuda, A.; Queiroz, L.d.S.; Reis, F. Gliosarcomas: Magnetic resonance imaging findings. Arq. Neuropsiquiatr. 2020, 78, 112–120. [Google Scholar] [CrossRef] [PubMed]
  25. Zhang, Y.; Ma, J.-P.; Weng, J.-C.; Wang, L.; Wu, Z.; Li, D.; Zhang, J.-T. The clinical, radiological, and immunohistochemical characteristics and outcomes of primary intracranial gliosarcoma: A retrospective single-centre study. Neurosurg. Rev. 2021, 44, 1003–1015. [Google Scholar] [CrossRef] [PubMed]
  26. Awadalla, A.S.; Al Essa, A.M.; Al Ahmadi, H.H.; Al Ojan, A.; Muazen, Y.; Alsayyah, A.; Alsaif, H.; Alsafwani, N.S. Gliosarcoma case report and review of the literature. Pan Afr. Med. J. 2020, 35, 26. [Google Scholar] [CrossRef] [PubMed]
  27. Qian, Z.; Zhang, L.; Hu, J.; Chen, S.; Chen, H.; Shen, H.; Zheng, F.; Zang, Y.; Chen, X. Machine Learning-Based Analysis of Magnetic Resonance Radiomics for the Classification of Gliosarcoma and Glioblastoma. Front. Oncol. 2021, 11, 699789. [Google Scholar] [CrossRef] [PubMed]
  28. Mirchia, K.; Mahoney, M.T.; Christie, O.; Mirchia, K.; Fuller, C.E. A Rare Tumor in a Rare Location: Radiology and Pathology Findings with a Literature Review on Intraventricular Gliosarcoma. Cureus 2023, 15, e34622. [Google Scholar] [CrossRef] [PubMed]
  29. Matute-González, M.; Mosteiro-Cadaval, A.; Vidal-Robau, N.; Páez-Carpio, A.; Valduvieco, I.; Pineda, E.; González, J.J.; Aldecoa, I.; Oleaga, L. Clinicopathological and Neuroimaging Features of Primary Gliosarcoma: A Case Series and Review of Literature. World Neurosurg. 2023, 178, e480–e488. [Google Scholar] [CrossRef] [PubMed]
  30. Karasev, S.; Talybov, R.; Chertoyev, S.; Trofimova, T.; Mochalov, V.; Kleshchevnikova, T.; Loginova, N.; Karaseva, I. Diagnostic challenges of gliosarcoma: Case report of a rare glioblastoma histopathological variant. Front. Radiol. 2025, 5, 1687401. [Google Scholar] [CrossRef] [PubMed]
  31. Rizzuto, I.; Ieni, A.; Scarcella, S.C.; Sciacca, V.; Fiorentino, V.; Napoli, C.; Martini, M.; Germanò, A.; Granata, F.; Pergolizzi, S.; et al. Gliosarcoma: A Reappraisal of Neuroradiological, Surgical, Morphological, and Radiotherapeutic Characteristics of a Cohort From South Italy Single-Center. Anal. Cell. Pathol. 2026, 2026, e4966984. [Google Scholar] [CrossRef]
  32. Han, S.J.; Yang, I.; Tihan, T.; Prados, M.D.; Parsa, A.T. Primary gliosarcoma: Key clinical and pathologic distinctions from glioblastoma with implications as a unique oncologic entity. J. Neuro-Oncol. 2010, 96, 313–320. [Google Scholar] [CrossRef]
  33. Kleihues, P.; Louis, D.N.; Scheithauer, B.W.; Rorke, L.B.; Reifenberger, G.; Burger, P.C.; Cavenee, W.K. The WHO classification of tumors of the nervous system. J. Neuropathol. Exp. Neurol. 2002, 61, 215–225. [Google Scholar] [CrossRef] [PubMed]
  34. Louis, D.N.; Perry, A.; Wesseling, P.; Brat, D.J.; Cree, I.A.; Figarella-Branger, D.; Hawkins, C.; Ng, H.K.; Pfister, S.M.; Reifenberger, G.; et al. The 2021 WHO classification of tumors of the central nervous system: A summary. Neuro-Oncology 2021, 23, 1231–1251. [Google Scholar] [CrossRef] [PubMed]
  35. Dardis, C.; Donner, D.; Sanai, N.; Xiu, J.; Mittal, S.; Michelhaugh, S.K.; Pandey, M.; Kesari, S.; Heimberger, A.B.; Gatalica, Z.; et al. Gliosarcoma vs. glioblastoma: A retrospective case series using molecular profiling. BMC Neurol. 2021, 21, 231. [Google Scholar] [CrossRef] [PubMed]
  36. Han, S.J.; Yang, I.; Ahn, B.J.; Otero, J.J.; Tihan, T.; McDermott, M.W.; Berger, M.S.; Prados, M.D.; Parsa, A.T. Clinical characteristics and outcomes for a modern series of primary gliosarcoma patients. Cancer 2010, 116, 1358–1366. [Google Scholar] [CrossRef] [PubMed]
  37. Wang, X.; Jiang, J.; Liu, M.; You, C. Treatments of gliosarcoma of the brain: A systematic review and meta-analysis. Acta Neurol. Belg. 2021, 121, 1789–1797. [Google Scholar] [CrossRef] [PubMed]
  38. Morantz, R.A.; Feigin, I.; Ransohoff, J. Clinical and pathological study of 24 cases of gliosarcoma. J. Neurosurg. 1976, 45, 398–408. [Google Scholar] [CrossRef] [PubMed]
  39. Dwyer, K.W.; Naul, L.G.; Hise, J.H. Gliosarcoma: MR Features. J. Comput. Assist. Tomogr. 1996, 20, 719–723. [Google Scholar] [CrossRef] [PubMed]
  40. Fink, K.; Fink, J. Imaging of brain metastases. Surg. Neurol. Int. 2013, 4, 209–219. [Google Scholar] [CrossRef] [PubMed]
  41. Pope, W.B. Brain metastases: Neuroimaging. Handb. Clin. Neurol. 2018, 149, 89–112. [Google Scholar] [CrossRef] [PubMed]
Figure 1. PRISMA flowchart illustrating the selection and exclusion process of the studies included in the systematic review.
Applsci 16 06374 g001
Figure 2. Axial T2 (a), T2 Flair (b), T1 with C (c), ADC (d), DWI (e) and T1 (f) MR images. There is a mass with a perifocal edema located in the right parietal lobe. On T2WI (a), the tumor is characterized by signal heterogeneity: a hypointense one (green star) and a hyperintense component (red star). The tumor has a ring-like rim contrast enhancement and contains necrotic areas (c), the diffusion restriction of the solid part (d,e). It is associated with surrounding T2/FLAIR (b) hyperintensity intending in the white matter of the frontal–parietal–temporal lobe and internal capsule, likely vasogenic edema. In T1WI (f), the mass is hypointense.
Applsci 16 06374 g002
Figure 3. Axial DWI (a), T1 with C (b), T2/FLAIR (c), T1WI (d) MR images. There is a mass with a perifocal edema located in the left parietal–temporal lobe. The tumor has a ring-like rim contrast enhancement and contains necrotic areas and a cystic component (b). It is associated with surrounding T2/FLAIR (b) hyperintensity intending in the white matter of the parieto-temporal lobe, likely vasogenic edema. In T1WI (d), the mass is hypointense. Dural-based T2-hyperintense and sharply delineated homogenously enhancing left parietal–temporal lobe displaying dural tail sign (b).
Applsci 16 06374 g003
Figure 4. Gliosarcoma in a 56-year-old man. On MRS, the tumors showed increased choline values and lactate peak with decreased N-acetylaspartate and creatine values.
Applsci 16 06374 g004
Figure 5. Brain MRI tractography showing the spatial relationship between the corticospinal tract (blue), the arcuate fasciculus (orange), and the gliosarcoma (GS).
Applsci 16 06374 g005
Figure 6. Flowchart of Diagnostic Algorithm.
Applsci 16 06374 g006
Table 1. JBI Critical Appraisal Check-list for case series (risk of bias quality assessment).
StudyQ1Q2Q3Q4Q5Q6Q7Q8Q9Q10%YesRisk
Zhang et al.VVV?XVVVVV80Low
Qian et al.VVVXXVVXVV70Low
Pierscianek et al.VVVVVVVVVV100Low
Maurer et al.VXV?XV?XVV50Moderate
Zhang et al.VXVVVVVXXX60Moderate
Yi et al.VXXVXVVV?V60Moderate
Peckham et al.VVV?XVVVV?70Low
Matute-Gonzalez et al.VVVV?VV?VV80Low
Sampaio et al.VXXXXVVVVV60Moderate
Buhl et al.V?X?VVVVVV70Low
Singh et al.VVVVVVVVVX90Low
L. Han et al.VVVXXVVVXX60Moderate
Fan et al.VVVXXVVVVV80Low
Rizzuto et al.VVV?XVVVVV80Low
Romero-Rojas et al.VVVVVVVVVV100Low
Fukuda et al.VVVXXXVVXX50Moderate
Q1Were there clear criteria for inclusion in the case series?VYes
Q2Was the condition measured in a standard, reliable way for all participants included in the case series?XNo
Q3Were valid methods used for identification of the
condition for all participants included in the case series?
?Unclear
Q4Did the case series have consecutive inclusion of participants?
Q5Did the case series have complete inclusion of participants?
Q6Was there clear reporting of the demographics of the participants in the study?
Q7Was there clear reporting of clinical information of the participants?
Q8Were the outcomes or follow up results of cases clearly reported?
Q9Was there clear reporting of the presenting site(s)/clinic(s) demographic information?
Q10Was statistical analysis appropriate?
Abbreviations: JBI Joanna Briggs Institute, Q1–Q10 indicate questions 1 to 10 based on the JBI risk assessment. Notes: The risk of bias was ranked as high when the study reached up to 49% of “yes” scores, moderate when the study reached from 50 to 69% of “yes” scores, and low when the study reached more than 70% of “yes” scores. V indicates yes, X indicates no, ? indicates unclear.
Table 2. JBI Critical Appraisal Check-list for case reports (risk of bias quality assessment).
StudyQ1Q2Q3Q4Q5Q6Q7Q8%YesRisk
Moon et al.VXVVVXXV62Moderate
Doddamani et al.VVVVV?XX62Moderate
Raab et al.VXXVXXXV38High
Awadalla et al.VXVVVVVV88Low
De Almeida Prado et al.VVVVVVVV100Low
Mirchia et al.VXVVVVVV88Low
Karasev et al.VVVVVVXV88Low
Q1Were patient’s demographic characteristics clearly described?VYes
Q2Was the patient’s history clearly described and presented as a timeline?XNo
Q3Was the current clinical condition of the patient on presentation clearly described??Unclear
Q4Were diagnostic tests or assessment methods and the results clearly described?-Not Applicable
Q5Was the intervention(s) or treatment procedure(s) clearly described?
Q6Was the post-intervention clinical condition clearly described?
Q7Were adverse events (harms) or unanticipated events identified and described?
Q8Does the case report provide takeaway lessons?
Abbreviations: JBI Joanna Briggs Institute, Q1–Q8 indicate questions 1 to 8 based on the JBI risk assessment. Notes: The risk of bias was ranked as high when the study reached up to 49% of “yes” scores, moderate when the study reached from 50 to 69% of “yes” scores, and low when the study reached more than 70% of “yes” scores. V indicates yes, X indicates no, ? indicates unclear.
Table 3. Literature Review of GS.
AuthorNumber of Patient, Mean Age and GenderTumor LocationNeurological Findings
TCMRIF-FDG-PET
(T1/T2)(DWI)(PWI)(MRS)
L.Han et al., 2008 [14]44 years;
M (11/15)
F (4/15)
Site of disease:
Right (6/15)
Left (8/15)
Midline (1/15)

Site of lesion:
Frontal (7/15)
Parietal (2/15)
Temporal (3/15)
Cerebello (1/15)
IV or LV (2/15)
NASolid and cystic components (11/15)
Predominantly solid component (2/15)
Cystic and necrotic areas (2/15)

T1:
Hypointense (10/15)
Hyperintense and Isointense (2/15)
Isointense (1/15)
Hypointense and isointense (2/15)

T2:
Hyperintense (6/15)
Hyperintense and isointense (8/15)
Mixed (1/15)
NANANANA
Moon et al., 2010 [15]70-year-old
woman
Right cerebellar
hemisphere
Solid component with heterogeneous peripheral enhancementT1:
well-defined hypointense mass

T2: intermediate signal intensity at the periphery, and central hyperintensity
NANANAHypermetabolism at the tumor periphery
Zhang et al., 2011 [16]45 years;
M (37/54)
F (17/54)
Site of disease:
NA

Site of lesion:
Temporal (26/54)
Frontal (15/54)
Parietal (6/54)
Parieto-occipital (4/54)
Temporo-occipital (3/54)
LV (3/54)
Cerebellum (2/54)
Hypodense (16/54)
Isodense (2/54)
Mixed (27/54)
Irregular (29/54), lobulate (21/54) and/or cystic mass (9/54)

T1:
Hypointense (17/54)
Mixed (19/54)

T2:
Isointense (2/54)
Hyperintense (2/54)
Mixed (32/54)
Inhomogeneous hyperintensity
(18/54)

Lightly hyperintense compared with white matter (4/54)
NAEnhanced portion of the tumors showed:

Choline (Cho) increased;

Lactate (Lac) increased;

Decreased N-acetylaspartate (NAA) and creatine (Cr)
NA
Buhl et al., 2013 [17]63 years;
M (11/16)
F (5/16)
Site of disease:
NA

Site of lesion:
Frontal (6/16)
Temporal (4/16)
Parietal (3/16)
Occipital (1/16)
Thalamic (2/16)
Solid component with heterogeneous peripheral enhancementSolid and/or cystic mass

T1: Well-defined hypointense mass

T2: Mixed
Inhomogeneous hyperintensityNAEnhanced portion of the tumors showed:

Choline (Cho) increased;

Lactate (Lac) increased;

Decreased N-acetylaspartate (NAA) and creatine (Cr)
NA
Romero-Rojas et al., 2013 [18]54 years;
M (4/5)
F (1/5)
Site of disease:
Left (4/5)
Right (1/5)

Site of lesion:
Frontal (1/5)
Fronto-parietal (1/5)
Parietal (3/5)
Solid heterogeneous massT1:
Hypointense (5/5)

T2:
Mixed (5/5)
NANACholine (Cho) increased

normal creatinine (Cr)

Low NAA (N-acetyl-aspartate)
NA
Singh et al., 2015 [19]45 years;
M (14/16)
F (2/16)
Side of disease:
NA

Side of lesion:
Frontal (2/16)
Temporal (9/16)
Parietal (2/16)
Peritrigonal (1/16)
Fronto-Parietal (1/16)
Corpus callosum (1/16)
Solid heterogeneous mass (12/16)
with cystic components (4/16)
T1:
Hypointense (16/16)

T2:
Mixed (16/16)
NANANANA
Doddamani et al., 2016 [20]23-year-old manOccipital horn of right LVCystic massT1: Hypointense

T2: Mixed
NANANANA
Raab et al., 2016 [21]62 years;
NA
Right temporal lobeSolid massNANANALipids increased;

Lactate (Lac) increased;

Lipid–Choline ratio increased
NA
Sampaio et al., 2017 [11]59 years;
M (7/17)
F (10/17)
Side of disease:
NA

Side of lesion:
Frontal (5/17)
Parietal (3/17)
Temporal (4/17)
Fronto-temporal (2/17)
Fronto-Parietal (1/17)
Parieto-occipital (1/17)
Fronto-temporo-parieto-insular (1/17)
Irregular massT1:
Hypointense (3/17)
Mixed (14/17)

T2:
Mixed (17/17)
Areas of restricted
diffusion located in the more solid or thick components (8/17)

No restricted diffusion (2/17)

Compromised appreciation due to hemorrhage (1/17)
NANANA
Yi et al., 2019 [22]53 years;
M (28/48)
F (20/48)
Side of disease:
NA

Side of lesion:
Frontal (8/48)
Temporal (13/48)
Parietal (1/48)
Occipital (1/48)
LV (5/48)
Cerebellum (1/48)
Overlapping (19/48)
Solid and/or cystic massT1: Hypointense

T2: Mixed
NANANANA
Peckham et al., 2019 [23]62 years;
M (13/25)
F (12/25)
Side of disease:
Left (8/25)
Right (17/25)

Side of lesion:
Frontal (6/25)
Temporal (13/25)
Fronto-Parietal (2/25)
Fronto-temporal (2/25)
Fronto-occipital (1/25)
Occipital (1/25)
Solid (12/25) and/or Irregular (13/25)T1:
Hypointense (18/25)
Mixed (7/25)

T2:
Hyperintense (8/25)
Hypointense (5/25)
Mixed (12/25)
Areas of restricted
diffusion located in the more solid or thick components
NANANA
Fukuda et al., 2020 [24]60 years;
M (1/3)
F (2/3)
Side of disease:
Left (2/3)
Right (1/3)

Side of lesion:
Frontal (1/3)
Temporal (1/3)
Temporo-parieto-occipital (1/3)
Solid massT1:
Hypointense (3/3)

T2:
Hyperintense (3/3)
Presence of restriction in the solid portion (3/3)rCBV increased in the solid area (3/3)Lipid and lactate peaks;

Increased creatinine (Cr);

Increased Choline (Cho)
NA
Zhang et al., 2021 [25]51 years;
M (67/103)
F (36/103)
Side of disease:
Left (49/103)
Right (45/103)
Bilateral (4/103)
Unknown (5/103)

Side of lesion:
Frontal (18/103)
Parietal (6/103)
Temporal (29/103)
Thalamus (2/103)
Spinal cord (1/103)
LV (1/103)
Brainstem (1/103)
Multiple (40/103)
Unknown (5/103)
Solid massIrregular (67/103) with cystic component (31/103)

T1:
Hypointense

T2:
Hyperintense
NANANANA
Awadalla et al., 2020 [26]60-year-old manLeft parieto-occipital lobeCystic and solid hypodense massT1: Hypointense

T2: Hyperintense
NANANANA
Pierscianek et al., 2021 [10]62 years;
M (40/56)
F (16/56)
Side of disease:
NA

Side of lesion:
Temporal
Solid mass with eccentric cystsT1: Hypointense

T2: Hyperintense
NANANANA
de Almeida Prado et al., 2021 [12]53-year-old manChiasm and right optic nerveSolid massT1: Hypointense

T2: Hyperintense
NANANANA
Qian et al., 2021 [27]51 years
M (58/83)
F (25/83)
Side of disease:
NA

Side of lesion:
Supratentorial
Solid massIrregular with cystic componentsNANANANA
Maurer et al., 2021 [2]62 years
M (32/56)
F (24/56)
NASolid mass with cystsT1: Hypointense

T2: Hyperintense
NANANANA
Fan et al., 2022 [9]52 years;
M (9/14)
F (5/14)
Side of disease;
NA

Side of lesion:
Frontal (3/14)
Temporal (4/14)
Occipital (1/14)
Fronto-temporal (3/14)
Fronto-parietal (1/14)
Temporo-Parietal (1/14)
Parieto-occipital (1/14)
Mixed dense mass with hemorrhageirregular ring-enhancement, with cystic degeneration and obvious surrounding edema

T1: Hypointense

T2: Mixed
Areas of restricted
diffusion located in the more solid components
Increased Choline (Cho);

Decreased N-acetylaspartate (NAA);

Decreased creatine (Cr);

Increased Cho/Cr and Cho/NAA ratio;

Decreased NAA/Cr ratio;
Increased Lactate (Lac);

Increased lipid (Lip)
NA
Mirchia et al., 2023 [28]68-year-old femaleFrontal horn of the left ventricleNoncystic, heterogeneously enhancing soft tissue lesionHeterogeneously enhancing non-cystic lesion

T1: Hypointense

T2: Hyperintense
NANANANA
Matute-Gonzàlez et al., 2023 [29]62 years;
M (12/21)
F (9/21)
Side of disease:
NA

Side of lesion:
Frontal (7/21)
Temporal (9/21)
Fronto-parietal (2/21)
Fronto-temporo-parietal (2/21)
Occipital (1/21)
Cystic and solid hypodense massHeterogenous lesions with necrotic cystic areas and a ring-enhancement pattern

T1: Hypointense

T2: Mixed
NANANANA
Karasev et al., 2025 [30]55-year-old manLeft frontoparietalintra-axial heterogeneous massCystic-solid mass

T1: Hypointense

T2: Mixed
Restricted in the solid componentElevated relative cerebral blood
volume (rCBV)
NANA
Rizzuto et al., 2026 [31]63 years;
M (9/10)
F (1/10)
Site of disease:
Right (4/10)
Left (6/10)

Site of lesion:
Frontal (3/10)
Temporal (7/10)
Parietal (5/10)
Occipital (5/10)
Insular (2/10)
NASolid and/or cystic component with irregular peripheral enhancement
T1:
Hypointense (8/10)
Isointense (2/10)

T2:
Hyperintense (6/10)
Mixed pattern (1/10)
Isointense (3/10)
Solid component (7/10)

Cystic component (3/10)
NANANA
M: male; F: female; IV: intraventricular; LV: lateral ventricle; NA: not available. Graphical representation of prior case reports of gliosarcoma (GS), identifying aspects of: age and gender at diagnosis, tumor type, location and imaging findings.
Table 4. Comparative characteristics of tumors given in the differential diagnosis.
CriteriaGliosarcomaGlioblastomaIntracerebral MetastasisAnaplastic
Meningioma
LocalizationIntra-axial, within gray and white matterIntra-axial, within gray and white matterIntra-axial, gray-white matter junctionExtra-axial
Shape and componentswell-defined, solid, and round or lobulated masses with cystics componentsHighly irregular shape, with ring-like
contrast enhancement pattern
(when it infiltrates across the corpus callosum it appears like “butterfly” shape)
Roughly spherical, nodular, and well-demarcated masses“Mushroom-shape” characterized by a prominent pannus extending over the cerebral surface from a globoid, dural-based portion
Involvement of dura materPossibleNo involvementPossibleAlways
Edema characteristicsEdema + infiltrationEdema + infiltrationVariable vasogenicVariable vasogenic
Contrast enhancement patternRing-likeRing-likeVariableUsually homogeneous, could be ring-like, characteristically intensive
HemorrhageVariablyVariablyOftenRarely
T1/T2WI featuresT1: often hypointense
T2: Mixed (alternation of high- and low-signal intensities)
Heterogeneous but without the low-signal intensityMainly low-signal intensityHeterogeneous (alternation of high- and low-signal intensities)
Diffusion-weighted imaging (DWI)Restricted in the solid componentRestricted in the solid componentRestricted in the solid componentRestricted in the solid component
Perfusion-weighted imaging (PWI)Increased values both within the enhanced and non-enhanced tumor componentsIncreased values both within the enhanced and non-enhanced tumor componentsIncreased values but less marked in comparison with diffuse gliomasIncreased values but less marked in comparison with diffuse gliomas and metastases
Magnetic Resonance Spectroscopy (MRS)Very high Increase in Choline (Cho), Lactate (Lac) and Lipids (Lip); decreased of N-acetylaspartate (NAA) and creatinine (Cr)Very high Increase in Choline (Cho), Lactate (Lac) and Lipids (Lip); decreased of N-acetylaspartate (NAA) and creatinine (Cr)Increase in of Choline (Cho), Lactate (Lac) and Lipids (Lip); decreased of N-acetylaspartate (NAA), but peritumoral region/edema shows normal metabolites.Increase in Choline (Cho), Lactate (Lac), and Lipids (Lip) and Alanine (Ala); lower or absent
N-acetylaspartate (NAA) and Creatine (Cr)
Disclaimer/Publisher’s Note: The statements, opinions and data contained in all publications are solely those of the individual author(s) and contributor(s) and not of MDPI and/or the editor(s). MDPI and/or the editor(s) disclaim responsibility for any injury to people or property resulting from any ideas, methods, instructions or products referred to in the content.