1. Introduction
Non-Public Networks (NPNs) provide enhanced security, full operational control, and more stable performance for specialized applications. Sectors including smart manufacturing, healthcare, military operations, and mining increasingly rely on Standalone Non-Public Networks (SNPNs), a class of NPNs that operate entirely outside any public land mobile network (PLMN) to meet stringent quality of service (QoS) requirements [
1,
2,
3].
According to 3GPP technical specification TS 23.251, SNPNs require dedicated infrastructure and resource management, offering full autonomy at the cost of higher deployment complexity, while public-network-integrated NPNs (PNI-NPNs) leverage shared PLMN capabilities for reduced overhead.
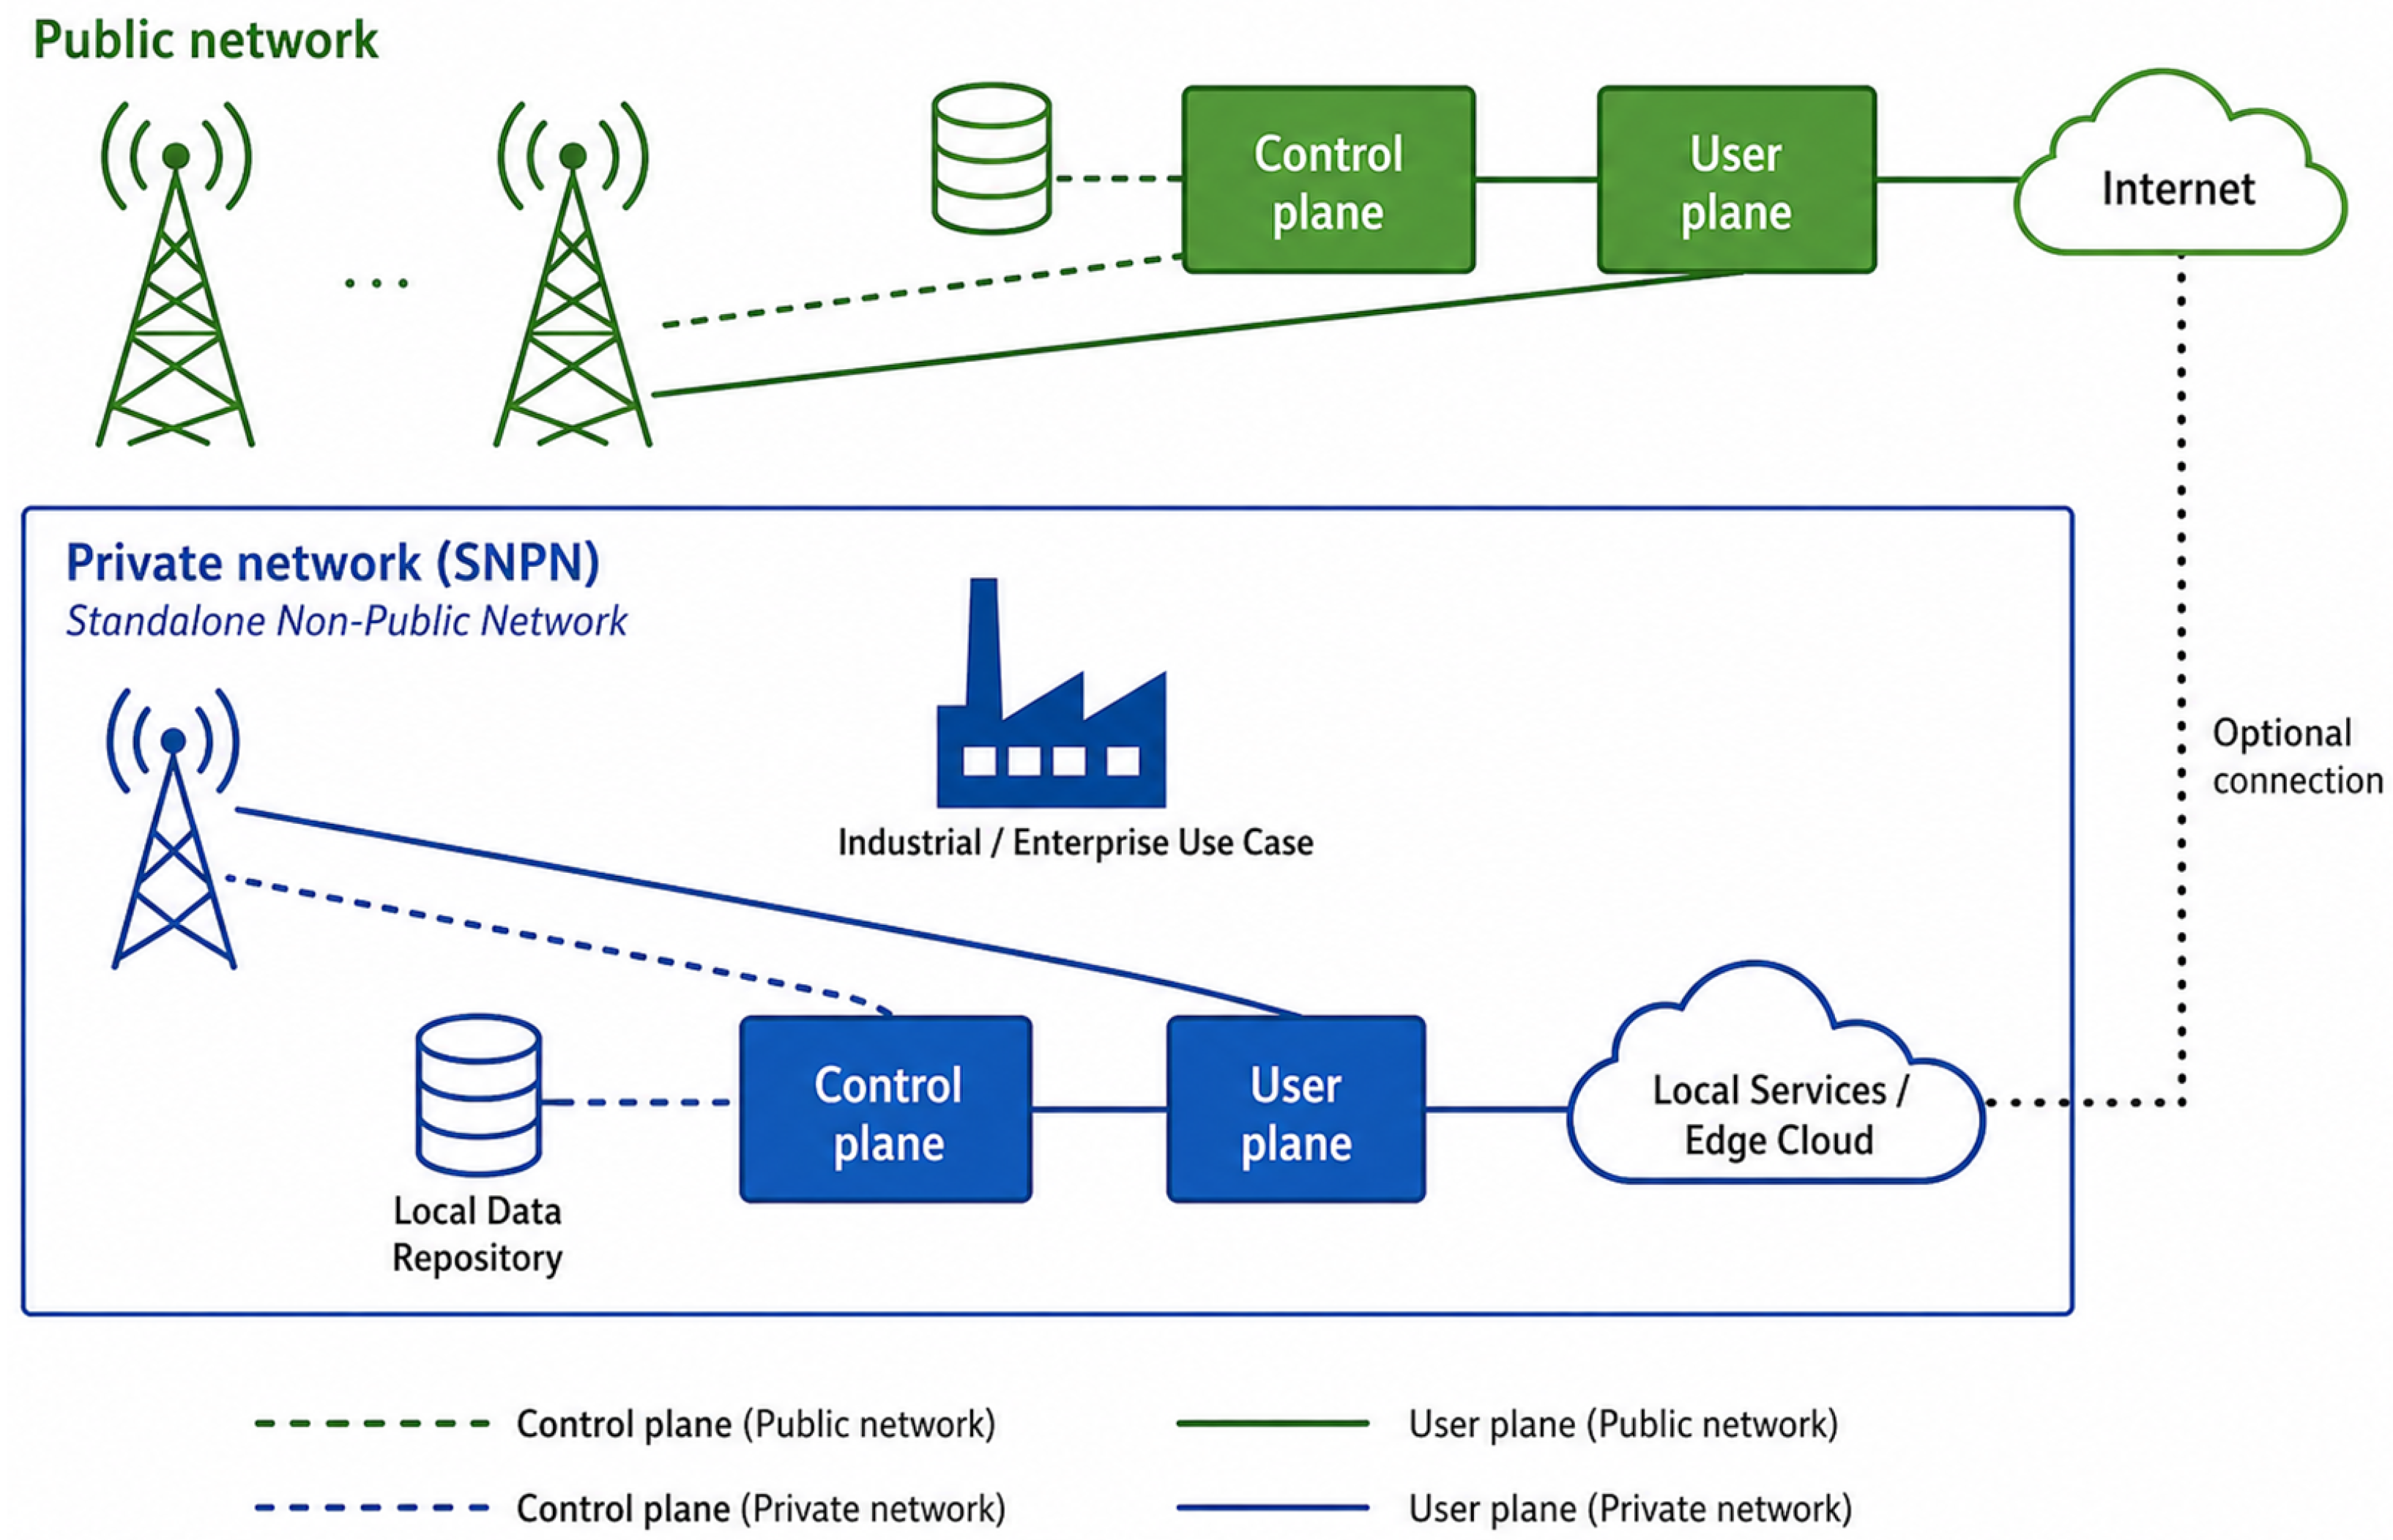
Figure 1 illustrates the architectural network implemented in this research. The variants of private NPNs span from fully isolated deployments to deeply integrated vertical slices within operator networks. NPNs are classified into SNPNs and PNI-NPNs. An SNPN operates independently of any Public Land Mobile Network (PLMN) and requires dedicated infrastructure and resource management, offering full autonomy at the cost of higher deployment complexity. In PNI-NPNs, the network resources such as RAN and control plane are shared with the PLMN. This allows operators to reduce operational complexity and improve resource efficiency. Four deployment categories of NPN are defined: standalone NPN, shared RAN NPN, shared RAN and control-plane NPN, and fully hosted NPN integrated with the PLMN [
1,
3].
Despite growing industrial demand, the experimental evaluation of SNPNs remains underdeveloped in three critical dimensions. First, the majority of existing studies are based on software emulators or simulators [
4,
5,
6,
7,
8], or are restricted to a single radio access technology (RAT), evaluating the 4G or 5G networks alone [
9,
10], thus failing to capture the behavior of real-world radio frequency (RF) cross-generation performance trade-offs that operators face when planning technology transitions. Second, while software-defined radio (SDR) platforms such as USRP have been used to deploy private network testbeds [
9,
10], no prior work has simultaneously deployed and evaluated both 4G and 5G SNPNs using SDR and COTS user equipment (UE) under live RF conditions. Third, existing evaluations focus only on raw KPIs such as SINR, throughput, and latency. These raw KPIs lack a systematic framework to aggregate heterogeneous metrics into a unified, interpretable quality indicator to determine the general suitability of the service. Raw KPIs carry different units, scales, and nonlinear relationships to perceived quality; a marginal improvement in SINR does not produce the same quality impact as an equivalent improvement in latency. Simple aggregation methods such as weighted averages impose linear assumptions and produce sharp classification boundaries that do not reflect gradual quality transitions. However, threshold-based rules fail to handle borderline cases. Therefore, a unified quality measurement method is needed. A fuzzy logic-based approach can encode domain knowledge, handle nonlinearity, and provide interpretable results by network operators and non-technical stakeholders. To address these gaps, the Mamdani fuzzy logic-based network quality index (NQI) to unify heterogeneous KPIs [
11] is implemented to measure both 4G and 5G networks using USRP, open-source software, and COTS UE. This NQI framework provides a linguistic interpretation of network conditions with multiple raw KPIs to present a unified performance perspective across heterogeneous radio generations.
The Mamdani Fuzzy Inference System (FIS) is adopted for its interpretability and mathematical consistency in handling linguistic outputs. It employs a min–max composition, where rule evaluation uses the minimum operator and aggregation uses the maximum operator, preserving the structure and semantic meaning of the output fuzzy sets [
11]. Sugeno FIS produces crisp outputs through weighted averaging of polynomial consequents, while Tsukamoto FIS requires monotonic consequents and directly generates crisp values. These approaches do not preserve the full linguistic structure of the output space. Therefore, Mamdani is more suitable for service-level agreement (SLA) monitoring, as it maintains interpretable quality levels when mapping heterogeneous QoS parameters into QoE-oriented network quality indicators.
1.1. Related Works
Software-defined radio and open-source platforms have played a crucial role in accelerating the development and evaluation of 5G Standalone (SA) systems, particularly in the context of private and non-public network deployments. Several widely adopted open-source frameworks are available for implementing both the core network (CN) and radio access network (RAN) components. For the CN, solutions such as Open5GS (
https://open5gs.org accessed on 18 January 2025), free5GC (
https://www.free5gc.org accessed on 18 January 2025), OpenAirInterface (OAI) (
https://www.openairinterface.org accessed on 18 January 2025), and Aether (
https://aetherproject.org accessed on 18 January 20255) provide flexible and modular implementations of 5G core functionalities. On the RAN side, tools such as UERANSIM (
https://github.com/aligungr/UERANSIM accessed on 18 January 2025), srsRAN (
https://www.srsran.com accessed on 18 January 2025), and OAI enable realistic emulation and deployment of 5G radio access networks. These platforms support rapid prototyping, performance evaluation, and end-to-end experimentation of 5G systems, making them essential for both academic research and industrial applications.
Table 1 summarizes the related works employing these open-source technologies across different deployment scenarios.
Amini et al. [
4] conducted a comparative analysis of open-source end-to-end (E2E) 5G software stacks, including srsRAN, OAI, and Open5GS. The RAN part uses a Quectel 5G modem and a PC for simplicity. Their research demonstrates interoperability and valuable insights into software selection and configuration, but its scope is limited by the exclusive focus on single generation 5G SA deployments and a single UE scenario. Their work employs both qualitative and quantitative approaches; the former covers ease of use and software robustness, while the latter evaluates performance metrics including bandwidth, downlink and uplink data rates, and latency. Although the study offered practical insights into software maturity and functional completeness, it does not extend the analysis to RAN behavior, nor does it evaluate performance using COTS UE in real RF environments. Their findings indicate that the open-source software combination between RAN and CN that reach the highest performance is between srsRAN and Open5GS.
Nguyen-Tan et al. [
5] integrated a 5G private mobile network (PMN) with lightweight deep learning to support smart agriculture applications such as irrigation control and crop monitoring. Their testbed employed Free5GC as the core and UERANSIM to emulate both the gNodeB and UE, mainly due to budget constraints. The research depends entirely on software emulation so it could not simulate realistic assessment of the performance of cellular networks.
Zivkovic et al. [
6] implemented a multi-connectivity framework using Free5GC and UERANSIM, leveraging the flexibility of the emulator-based approach. The findings from their research are the efficiency and scalability of the architecture. Low CPU (5.3% usage for kubelet, 3.3% for kube-api server and minimal memory usage 0.2% and 0.6%, respectively). It shows that the proposed setup can handle increasing traffic loads with efficient resource utilization. However, the evaluation remains limited to a virtual environment. As a result, the reported resource efficiency may not fully capture the complexity of live network deployments.
Mubasier et al. [
9] successfully demonstrated a real 5G standalone testbed using SDR-based architecture. Their work is limited to a single-generation deployment. They evaluated system-level CPU utilization without incorporating detailed radio frequency performance metrics.
Phan et al. [
7] used UERANSIM for UE emulation in their 5G testbed design, primarily due to its cost-effectiveness and ease of deployment. Their work serves as a practical reference for the research community by documenting setup procedures, lessons learned, and providing a GitHub repository to facilitate replication. This contribution is valuable in lowering the entry barrier to the development of the 5G testbed. However, emulator-based testbeds cannot accurately capture hardware-related constraints, radio variability, or performance trade-offs observed in real network deployments.
Tasin et al. [
10] researched on 2G and 4G networks using srsEPC and srsLTE with COTS user equipment, leveraging the compatibility of devices that supported both generations. The study showed the feasibility of deploying multi-generation networks with open-source platforms but was constrained by the lack of suitable open-source software for 5G implementation. As a result, the work did not extend to 5G deployments, limiting its applicability to next-generation SNPNs.
Novanana et al. [
8] showed the feasibility of using Free5GC and UERANSIM in a VPS-based laboratory-as-a-service (LaaS) environment, targeting academic training scenarios. It was effective for instructional purposes, fully emulator, and therefore was unable to capture the real radio conditions, hardware resource utilization, or cross-radio access technology (RAT) interoperability. Existing SDR-based private network studies still lack an interpretable mechanism for integrating heterogeneous KPIs into a unified quality assessment.
The adoption of fuzzy logic in this study is motivated by its suitability for interpretable, rule-based, and computationally efficient decision making under uncertain and heterogeneous network conditions. Although ML/DL approaches, including reinforcement learning and deep learning, have been increasingly adopted in wireless network optimization, they generally require large training datasets, and careful reward or model design, and may introduce additional computational complexity and limited interpretability. In contrast, fuzzy logic provides transparent linguistic reasoning that can directly map domain knowledge into human-understandable quality levels, making it particularly suitable for network quality assessment and operator-oriented service-level agreement (SLA) monitoring.
Recent studies further confirm that fuzzy logic remains relevant in contemporary 5G and 6G research. It has been integrated with reinforcement learning for DUDe-aware handover and 6G V2X resource allocation [
12,
13], applied to fuzzy-based clustering and routing for energy-efficient 5G paging [
14], used in adaptive GNSS/5G positioning with reduced computational overhead [
15], and adopted for adaptive mmWave power management and routing optimization in 5G-enabled MANETs [
16,
17].
Therefore, the use of a Mamdani fuzzy inference system in this research is to provide an interpretable, lightweight, and technology-agnostic evaluation layer for integrating SINR, throughput, latency, and jitter into a unified Network Quality Index (NQI).
It should be noted that this study focuses on a controlled indoor experimental deployment using SDR-based 4G LTE and 5G SNPNs with COTS UE. The evaluation is therefore intended to provide a baseline measurement-driven comparison under practical laboratory conditions rather than a large-scale field deployment. Although LOS and NLOS scenarios are considered, the experiments are limited to a single indoor environment, a limited number of UE configurations, and specific SDR hardware and open-source software settings. These limitations are addressed by positioning the proposed framework as a replicable experimental baseline for future extended evaluations involving multiple users, wider coverage areas, mobility scenarios, and diverse industrial deployment environments.
1.2. Contributions
This paper addresses these gaps by deploying 4G and 5G SNPNs using USRP-based SDR platforms and evaluating their performance through a fuzzy-based NQI. Unlike prior work, this study integrates multi-KPI measurements with a Mamdani inference layer to provide interpretable linguistic quality assessments.
The contributions of this research are:
Evaluation of side-by-side 4G and 5G SNPNs on the same SDR testbed. Deployment and evaluation of both RAT generations under identical hardware USRP B210, open source software Open5GS and srsRAN with real COTS UE in live RF environment. The performance benchmark grounded in real measurements rather than simulations.
A Mamdani fuzzy logic-based NQI for unified, interpretable quality assessment. Four KPIs (SINR, throughput, latency, and jitter) are mapped into linguistic quality levels (Poor, Fair, Good, Excellent) via Mamdani FIS. Mamdani is selected over the Sugeno and Tsukamoto models because it expresses both input and output variables as linguistic fuzzy sets, enabling human-interpretable QoS-to-QoE mapping without imposing monotonic or polynomial output constraints. It is critical for capturing the nonlinear relationships among heterogeneous KPIs.
1.3. Organization of This Research
The structure of this paper is organized as follows:
Section 1 presents the contextual background and motivation for the study on NPN and the fuzzy logic-based NQI evaluation, highlighting the main contributions and overall structure of the paper.
Section 2 describes the system model of the SNPN using USRP and open-source software, including Open5GS, and srsRAN, along with COTS UE. This section also describes the scope of work and the experimental setup.
Section 3 discusses performance metrics and methodology by using quantitative performance metrics.
Section 4 introduces the fuzzy logic framework employed to interpret the network performance parameters linguistically, enabling adaptive assessment of QoS.
Section 5 discusses the experimental results and fuzzy-based interpretation of SNPN performance. The analysis includes quantitative performance metrics (SINR, throughput, latency, and jitter) and qualitative linguistic evaluation derived from the fuzzy inference system. Finally,
Section 6 concludes the paper and outlines potential directions for integrating intelligent decision systems into future NPN deployments.
2. System Model
The system model involves the design, deployment, and evaluation of SDR-based SNPN configurations.
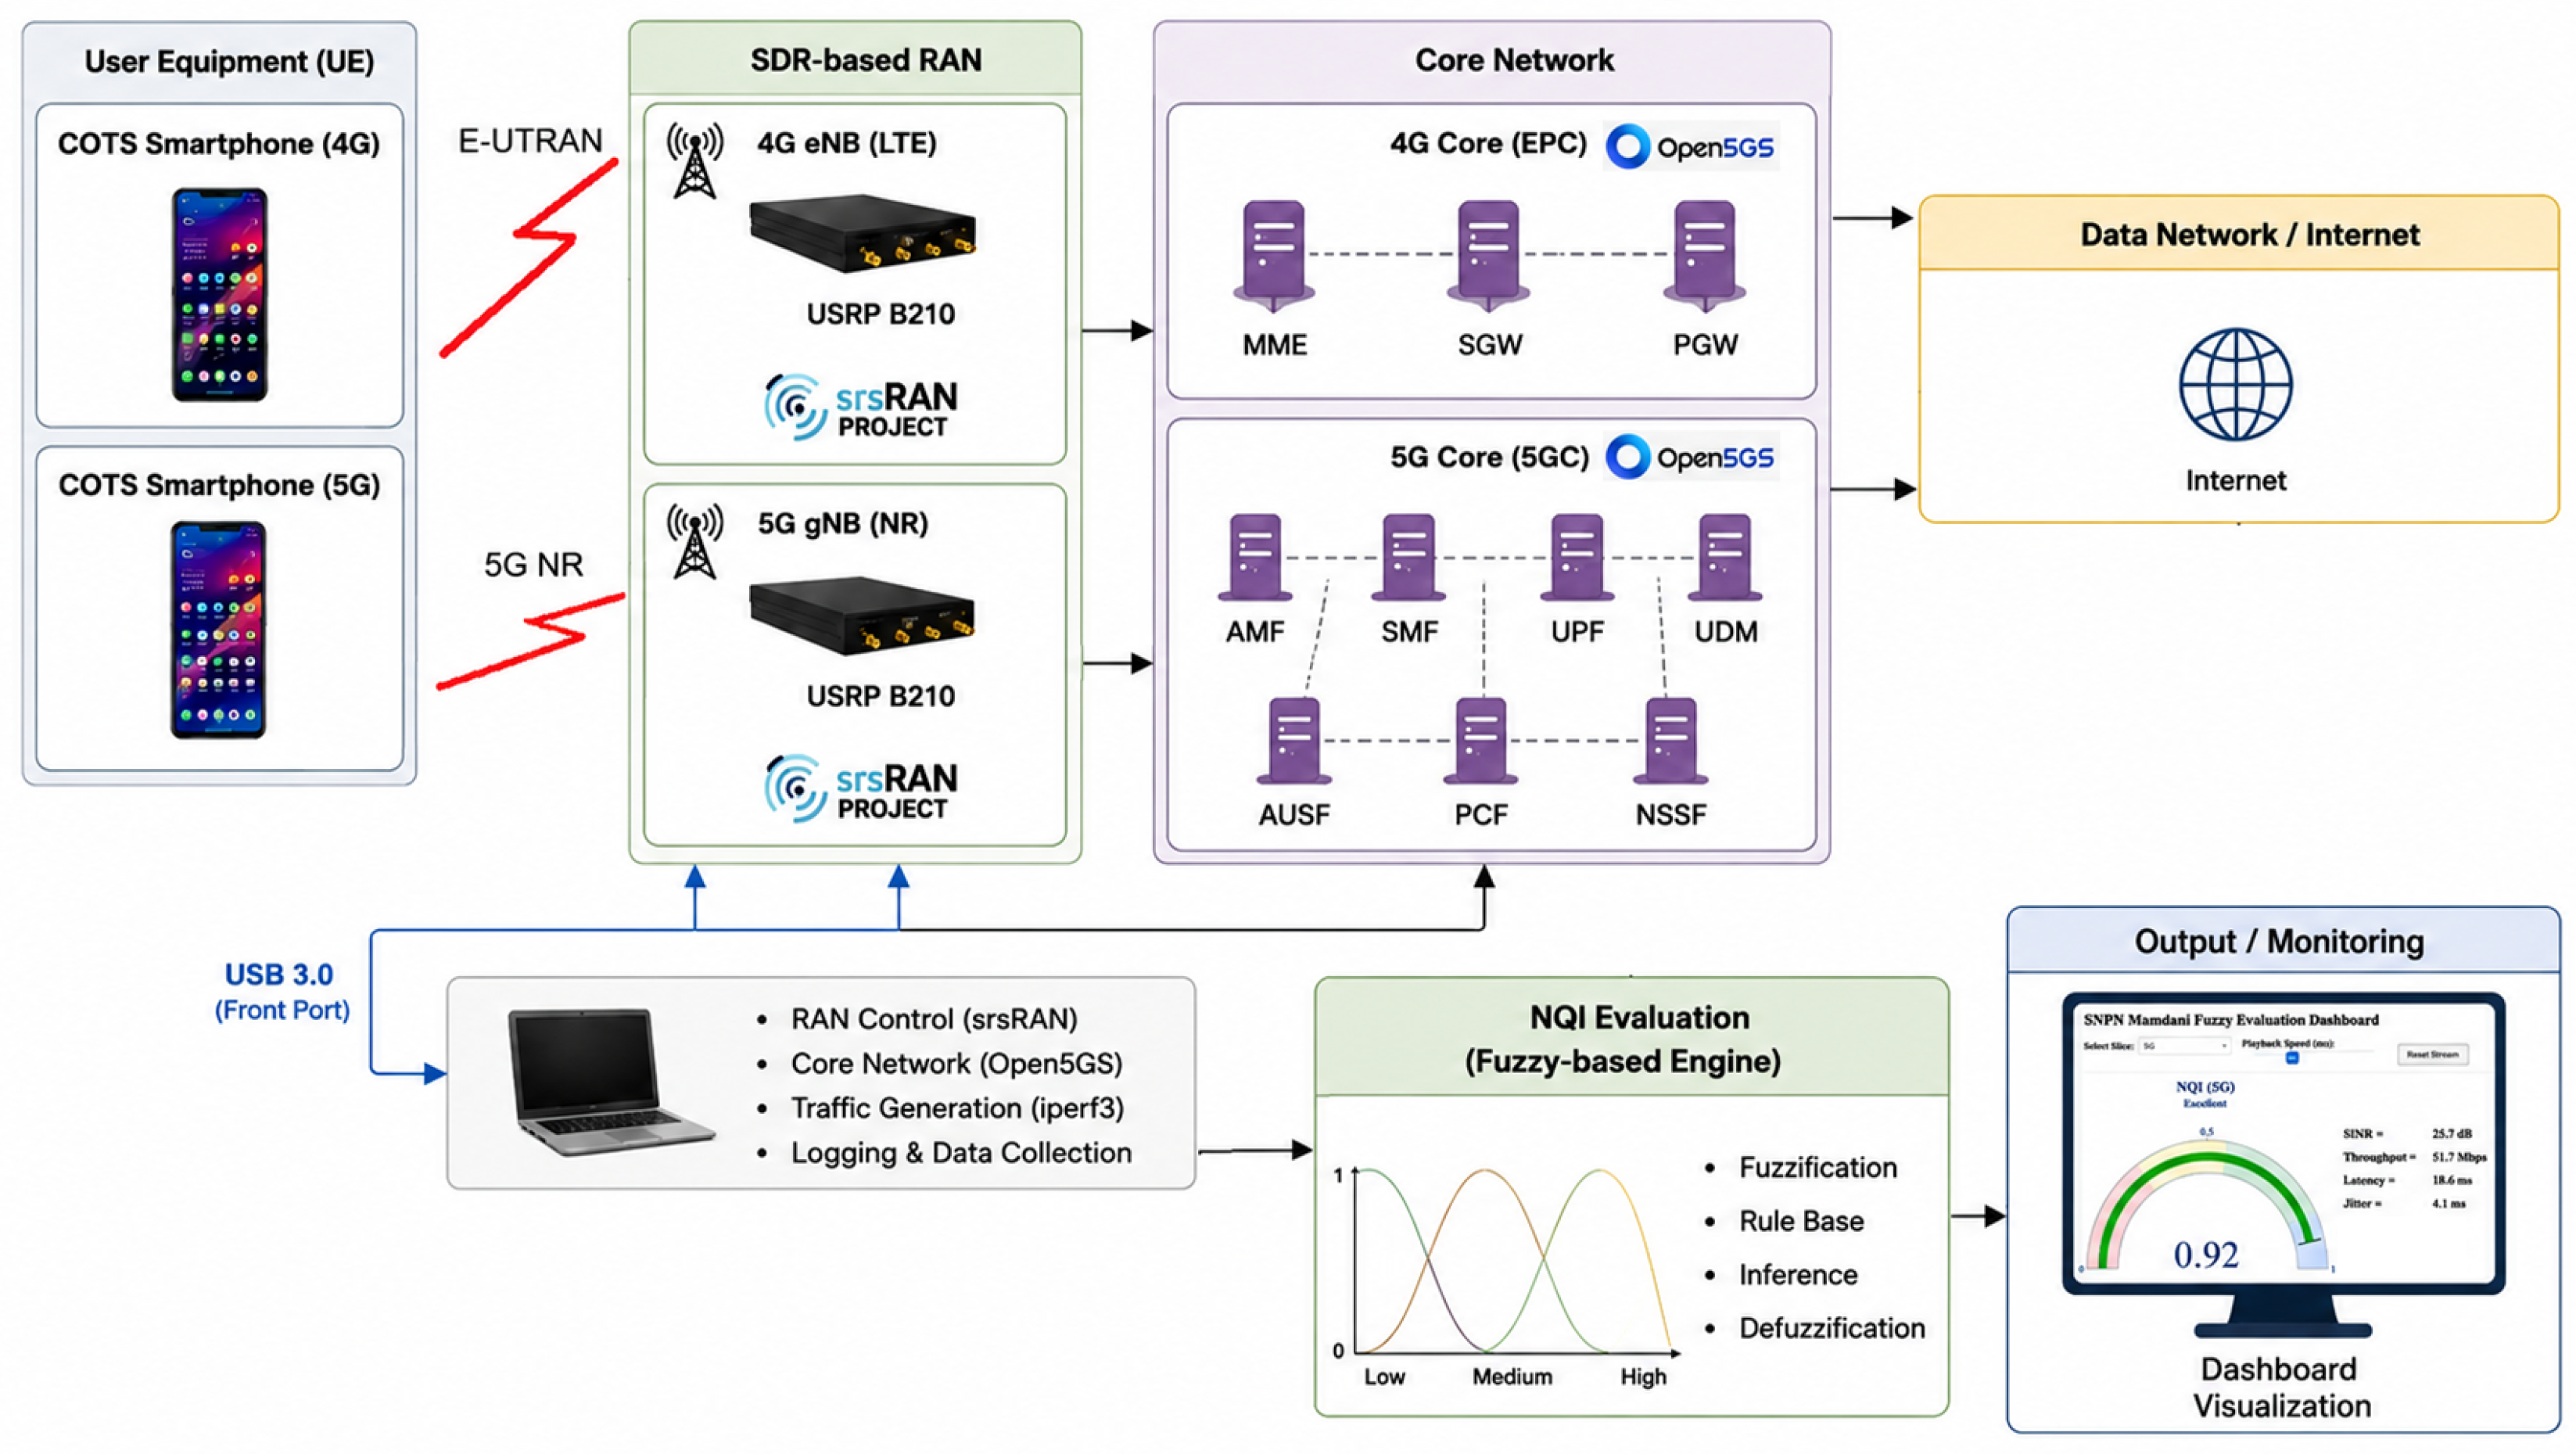
Figure 2 illustrates the system model used in this research, in which the UE accesses two RAT networks, namely 4G and 5G. The architecture of the private network or SNPN is implemented using SDR technology, and COTS-UE.
The RAN part consists of two distinct radio access technologies: 4G and 5G. The 4G part employs an eNodeB, while the 5G part uses a gNodeB, both implemented using USRP hardware connected to antennas. These SDR-based base stations provide flexibility in deploying private networks.
The CN consists of two parts. The 4G core, based on the evolved packet core (EPC), includes key components such as the mobility management entity (MME), serving gateway (SGW), packet data network gateway (PGW), home subscriber server (HSS), and policy and charging rules function (PCRF). In parallel, the 5G core (5GC) incorporates network functions such as the access and mobility management function (AMF), session management function (SMF), user plane function (UPF), network repository function (NRF), network slice selection function (NSSF), unified data management (UDM), and policy control function (PCF).
Both 4G and 5G networks are connected to the Internet, enabling end-to-end communication. The architecture supports simultaneous operation of multiple radio access technologies within a unified SNPN framework.
The novelty of this work lies in its hardware-centric approach to exploring SNPNs, bridging the gap between theoretical models and real-world deployment by providing a replicable fuzzy logic-based NQI framework for performance evaluation and detailed insights into SDR-based SNPN implementation. The use of COTS UE enables a real network experience rather than relying solely on simulators.
2.1. Experimental Setup
The research employed USRP B210 SDR platforms with Open5GS for the core network and srsRAN for the radio access network. The experimental setup was implemented on GEN10 host computers, where the USRP B210 devices provided SDR-based radio access functionality. Two OnePlus CPH2415 smartphones were used as COTS UE devices, one for the 4G SNPN measurement and the other for the 5G SNPN measurement. A SIM card reader and writer were used to configure the SIM cards required for COTS UE access.
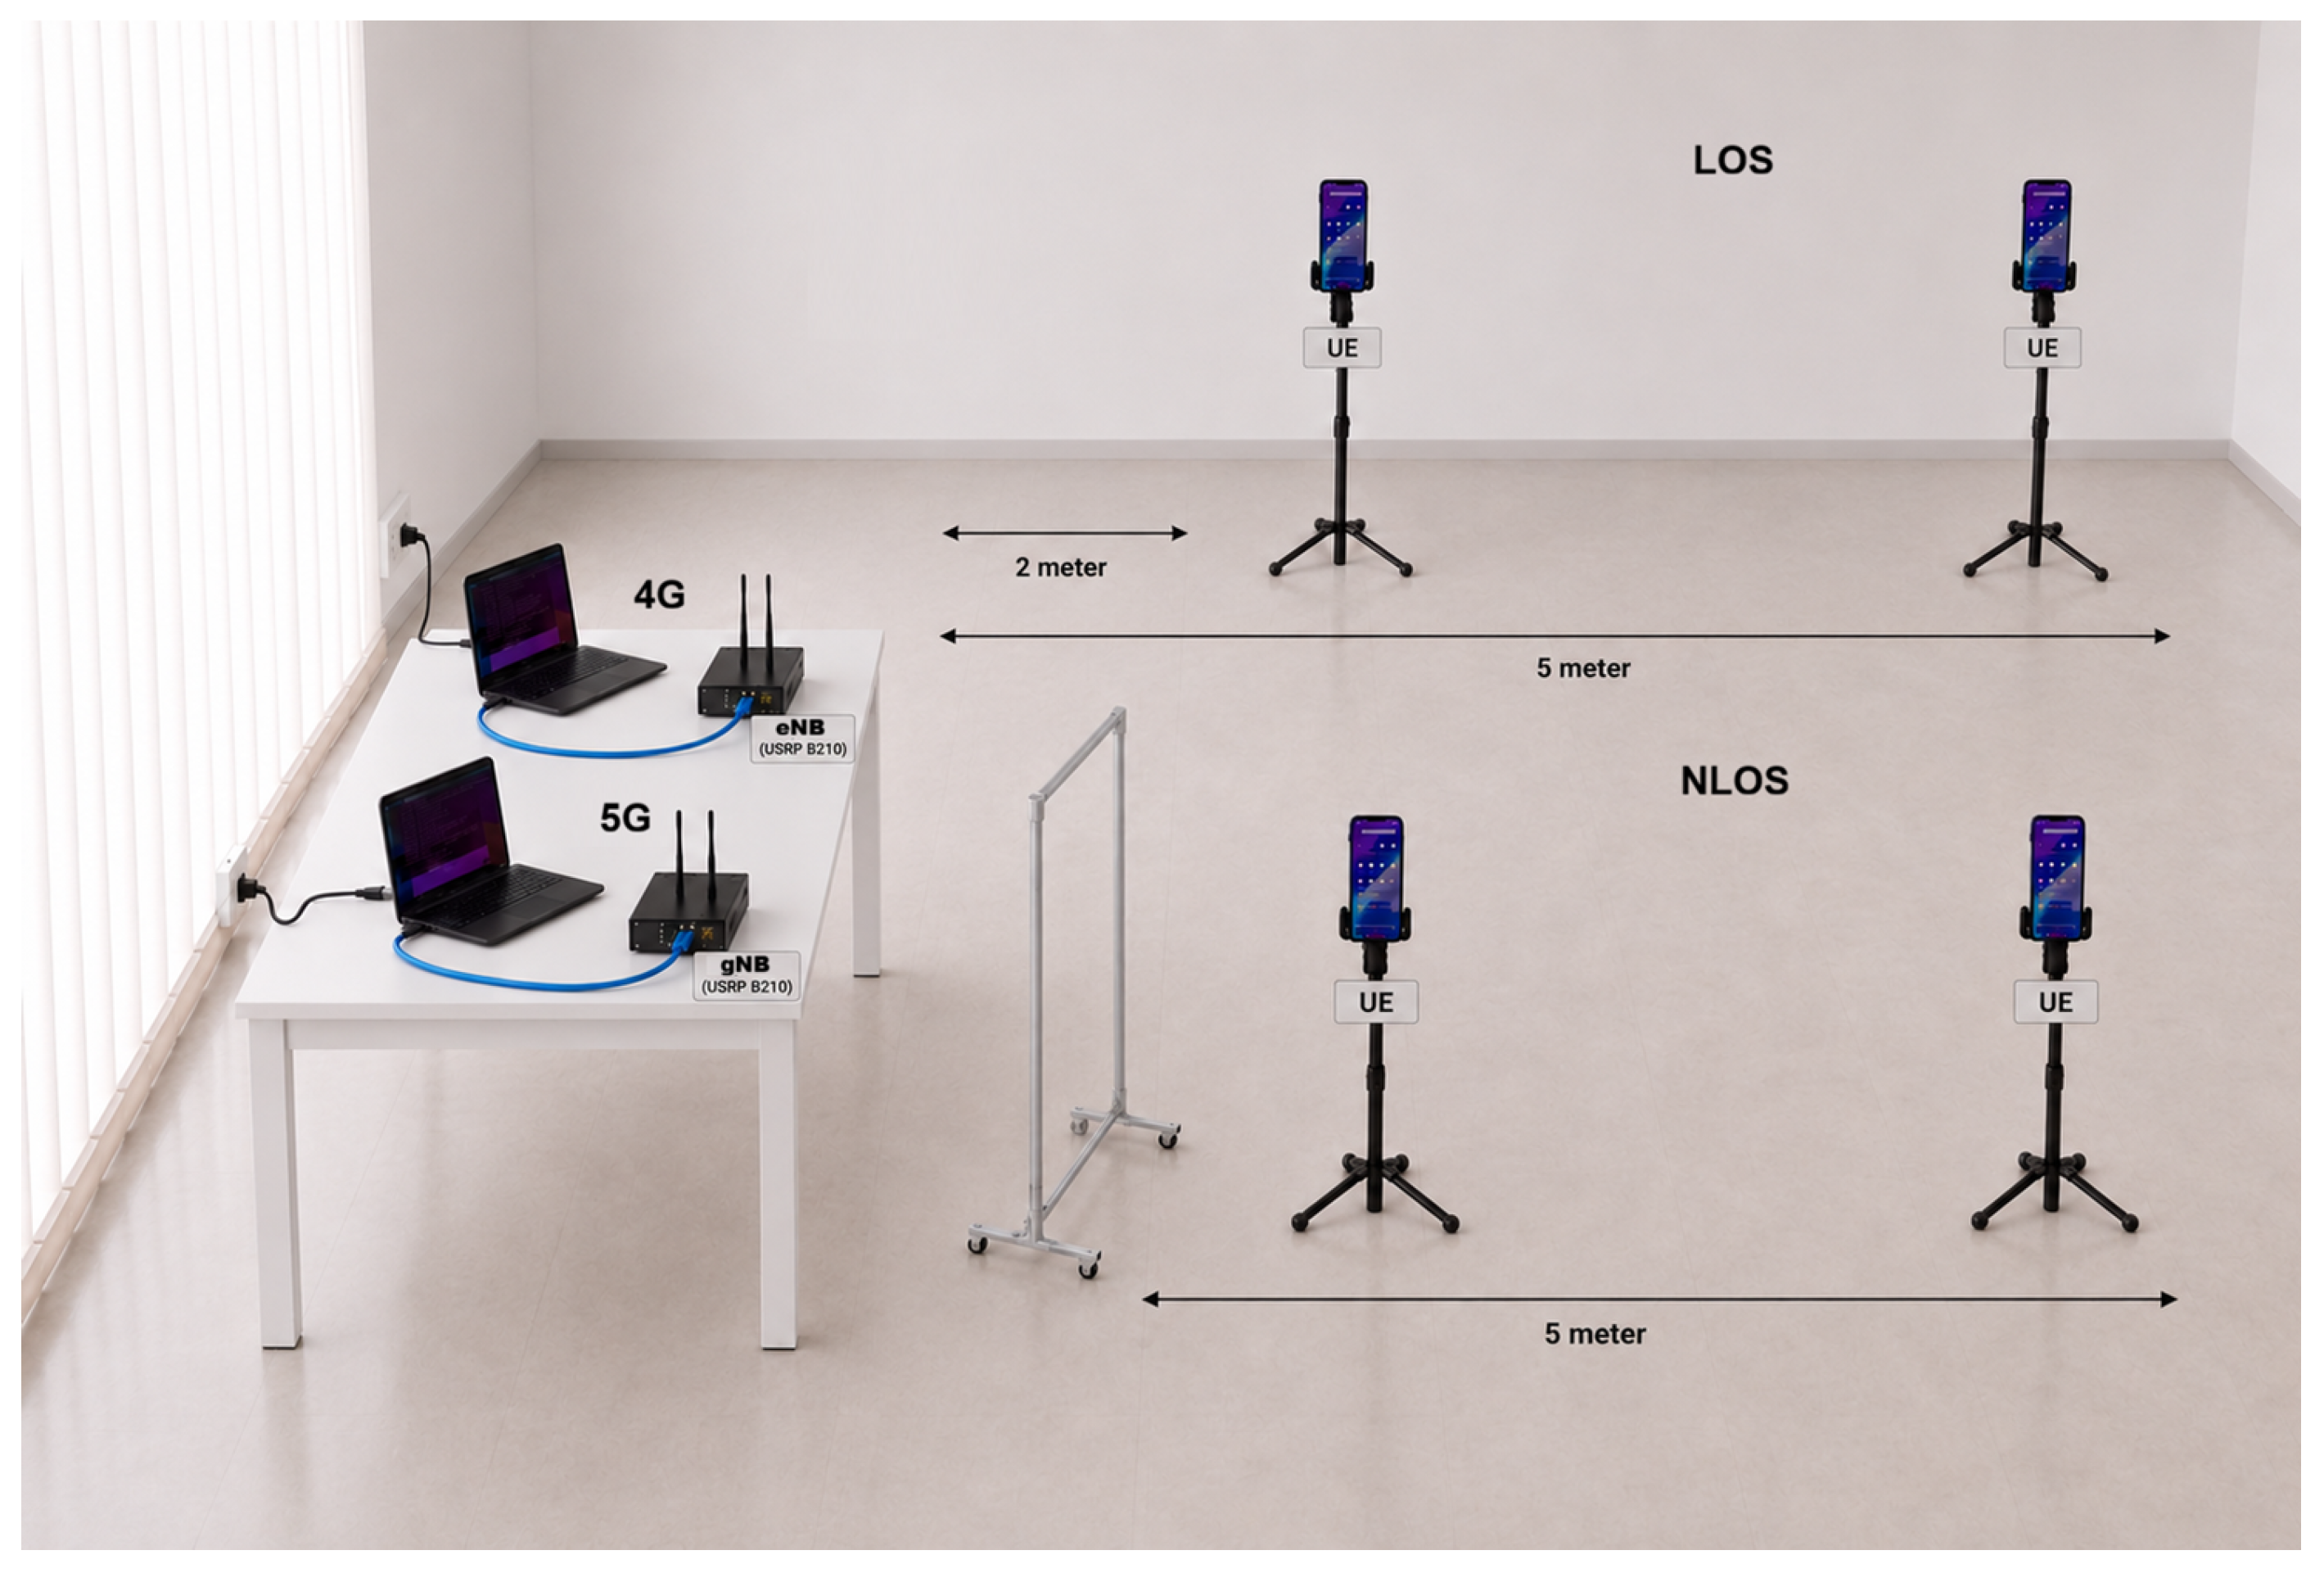
Figure 3 shows the physical indoor setup used to evaluate the SDR-based 4G and 5G SNPN under LOS and NLOS propagation conditions. The 4G eNodeB and 5G gNodeB were implemented using USRP B210 devices connected to host computers and antennas. The UE devices were positioned at 2 m and 5 m from the SDR-based RAN. In the LOS scenario, the UE had a direct propagation path to the base station antenna, whereas in the NLOS scenario, an obstacle was placed between the UE and the SDR-based RAN to emulate indoor signal blockage.
2.1.1. USRP B210
The Ettus Research B210 is widely selected for wireless communication research and prototyping, particularly in 5G, LTE, and IoT. The USRP B210 as in
Figure 3 provides extensive RF coverage, operating across a frequency range of 70 MHz to 6 GHz, encompassing nearly all cellular bands, Wi-Fi, IoT, and other wireless communication standards. This versatility makes it suitable for multi-technology applications such as 5G, LTE, IoT, and many others. It features two transmit (Tx) and two receive (Rx) channels, supporting both half-duplex and full-duplex communication modes.
The USRP utilizes a USB 3.0 SuperSpeed interface to connect the radio module to the core network, providing high-speed data transfer for real-time applications and efficient system integration. This ensures minimal latency and efficient handling of high-bandwidth signals, which are critical for real-time LTE and 5G testing [
18].
2.1.2. Radio Access Network (RAN)
srsRAN is used for the RAN component in this study. It is an open-source software suite developed by Software Radio System (SRS), which is now part of Rohde & Schwarz (R&S). Formerly known as srsLTE, srsRAN is a comprehensive open-source software suite designed for LTE and 5G RAN development. Compliant with the 3GPP specifications for 5G NR, srsRAN offers an accessible and flexible platform for academic and industrial research. Its modular architecture supports the prototyping, testing, and deployment of innovative wireless communication technologies in both real-world and simulated environments.
UERANSIM excels in RAN simulation for 5G NR, particularly for testing the gNB and UE, as well as UE control and user plane protocols in virtualized environments. However, its lack of real-time and over-the-air capabilities limits its applicability to theoretical studies. In contrast, srsRAN enables both simulation and live testing, offering greater versatility [
19].
The configuration for the radio access network in RAT is shown in
Table 2. The frequencies used in 4G and 5G radio access technologies are aligned with their respective standard frequency ranges. The physical resource blocks (PRBs) for 4G and 5G are listed.
A line-of-sight (LOS) condition between the UE and the base station system was established in an indoor setting within a building. Potential interference signals from existing mobile network operators could not be avoided. The distance between the UE and the RAN was approximately 2 m and 5 m for the 4G and 5G SNPN configurations.
2.1.3. Core Network (CN)
The core network (CN) implementation used in this research for the operation of a COTS UE is Open5GS. Open5GS is an open-source software for the CN, written in C and C++ programming languages.
It is based on 3GPP specifications, supporting features such as IPv6, the capability to handle multiple PDU sessions, handover functionality, and the integration of Voice over LTE and Voice over 5G New Radio. The choice of software is based on its features and capabilities. A comparison of OpenAirInterface (OAI), Free5gc, Open5GS, and Aether is presented in
Table 3.
Open5GS is selected due to its compliance with 3GPP Release 17 specifications, making it well-suited for the deployment of a 5G standalone (SA) network solution in support of SNPNs. Additionally, it offers backward compatibility with earlier generations of cellular technologies.
2.1.4. Measurement Tools
The tools used to measure performance data in this study include Ookla Speedtest (
https://www.speedtest.net), Network Cell Info (
https://statics.teams.cdn.office.net/evergreen-assets/safelinks/2/atp-safelinks.html) accessed on 18 January 2025,
iperf3, and local round-trip time (RTT) measurements. Ookla Speedtest was used to assess end-user-perceived performance, including throughput, latency, and jitter, over Internet-based connections. However, since Internet-based measurements may be affected by external routing paths, server-side load, backbone congestion, and the selected test server, the Ookla results were treated as complementary indicators of user experience rather than as the sole characterization of SDR-based SNPN performance.
To obtain a more controlled evaluation of the deployed SNPN, local iperf3 measurements were conducted between the commercial off-the-shelf user equipment (COTS UE) and a local edge/UPF-side server. The iperf3 tool was used to measure uplink and downlink throughput within the SNPN user plane, thereby minimizing the influence of external Internet paths. In addition, local RTT measurements were performed toward the same edge/UPF-side server to evaluate internal network latency under controlled testbed conditions.
Network Cell Info was utilized to monitor radio parameters such as signal strength and signal-to-interference-plus-noise ratio (SINR), providing insight into cellular signal quality, coverage, and radio conditions. Furthermore, RAN and core network logs from srsRAN and Open5GS were examined to support the interpretation of radio access and core network behavior. Therefore, the performance metrics measured in this study include SINR, uplink and downlink throughput, latency, jitter, and local RTT. This combination enables the evaluation to capture both end-user-perceived service quality and controlled SNPN testbed performance.
4. Fuzzy Logic-Based Evaluation Layer
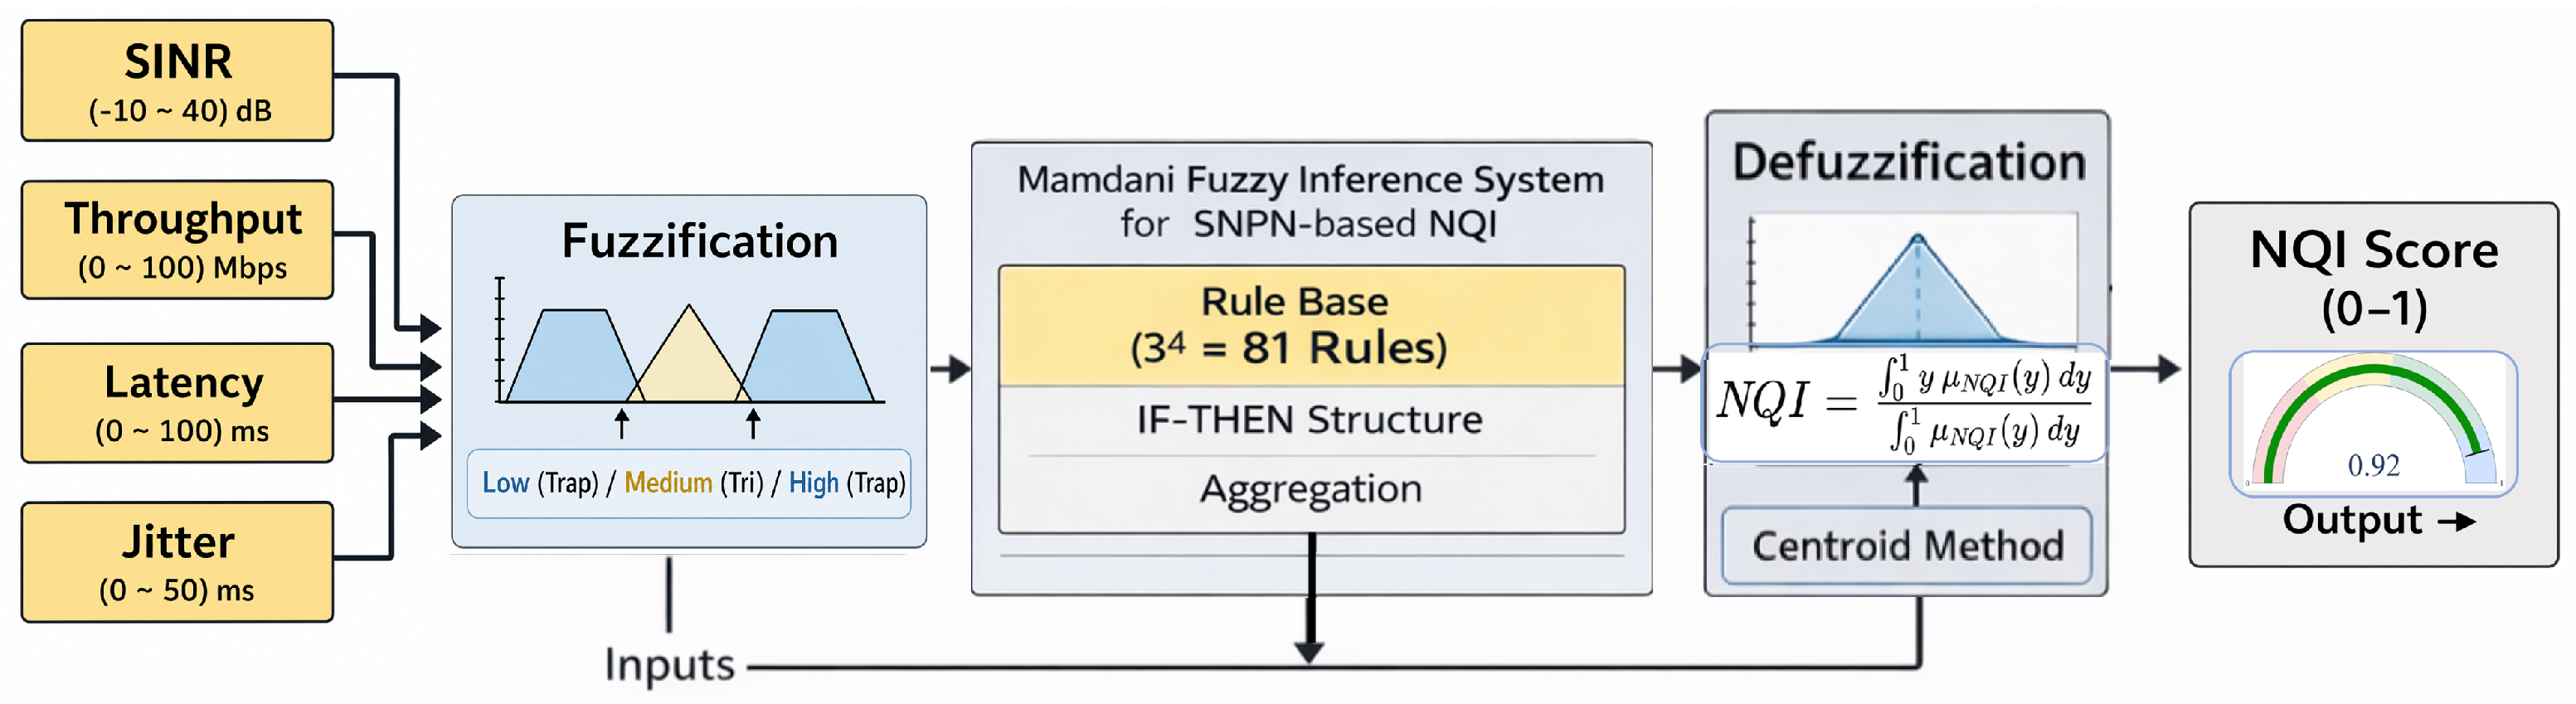
Fuzzy logic is employed to evaluate the NQI based on multiple performance indicators. As shown in
Figure 4, SINR, throughput, latency, and jitter are used as input variables to a Mamdani-based FIS. These inputs are first fuzzified into linguistic variables, then processed using a rule-based inference mechanism, and finally defuzzified to obtain a crisp NQI value.
Each input variable is first fuzzified into three linguistic membership functions, namely Low, Medium, and High, resulting in a total of IF–THEN inference rules. The inference engine applies a standard Mamdani min–max inference mechanism without additional rule weighting, where the logical AND operation is implemented using the minimum operator and rule aggregation is performed using the maximum operator. Subsequently, the aggregated fuzzy outputs are converted into a crisp NQI value through centroid-based defuzzification. This process enables heterogeneous KPIs with different numerical ranges and characteristics to be integrated into a unified and interpretable network quality metric. The proposed framework therefore provides practical support for network operators to monitor overall SNPN performance and identify network conditions that require optimization or corrective actions.
Furthermore, the fuzzy logic-based evaluation framework enables more adaptive interpretation of network conditions compared with conventional threshold-based KPI analysis. Individual KPI values alone may not adequately represent overall network quality because high throughput does not always imply low latency or stable jitter performance. By jointly evaluating SINR, throughput, latency, and jitter through the Mamdani inference mechanism, the proposed NQI framework provides a more comprehensive assessment of practical network behavior in SDR-based SNPN deployments.
The Python dashboard is created to evaluate the NQI in real time. Furthermore, the use of NQI as a performance indicator is crucial for network operators, as it provides a practical applied science solution for comprehensively monitoring, analyzing, and optimizing network performance in complex 5G environments.
4.1. Variable Definition
The fuzzy logic-based NQI model considers four input variables representing key network performance indicators. These inputs consist of the SINR dB, throughput Mbps, latency ms, and jitter ms. The output variable is the NQI , which represents the overall network quality.
Each input variable is represented by three fuzzy linguistic sets, namely Low, Medium, and High. The output variable (NQI) is defined by four linguistic levels: Poor, Fair, Good, and Excellent. This fuzzy representation enables the aggregation of heterogeneous network performance indicators and provides an interpretable mapping from quantitative measurements to overall network quality levels.
The SINR, throughput, latency, and jitter are selected based on established telecommunications standards. Packet-level performance thresholds for latency are derived from ITU-R Recommendation M.2410 and 3GPP TR 38.913. The Jitter threshold is derived from ITU-T Recommendations G.1010 [
24,
25,
26]. Minimum SINR requirements for radio performance in LTE and NR systems follow the specifications defined in 3GPP TS 36.213 and TS 38.214 [
27,
28]. Furthermore, service-level KPIs for throughput are taken from referenced 3GPP TS 38.913 and ITU IMT-2020, which outlines the service requirements for 5G systems [
24,
25]. The recommendations used in this research are shown in
Table 5.
4.2. Membership Functions
The fuzzy membership functions are redesigned according to the updated parameter ranges derived from practical 4G/5G performance considerations. This adjustment ensures that the universes of discourse and the fuzzy partitions remain consistent, interpretable, and suitable for network quality inference under heterogeneous service conditions. Each fuzzy variable is represented by either triangular or trapezoidal membership functions. The trapezoidal function
and the triangular function
are defined in (
1) and (
2):
where the parameters satisfy
For the degenerate cases:
if , the rising edge is omitted, producing a left-shoulder membership function;
if , the falling edge is omitted, producing a right-shoulder membership function.
The membership value remains mathematically well-defined because the corresponding linear segment is excluded whenever its denominator becomes zero.
This formulation is adopted to represent boundary linguistic terms (e.g., Low and High), where the membership degree saturates over a semi-infinite interval. The parameters
define the transition points of the fuzzy set, where
denotes the region of full membership, while
and
correspond to the rising and falling edges, respectively.
In contrast, the triangular membership function is defined by three parameters, where a and c denote the lower and upper bounds with zero membership, and b represents the peak point at which the membership degree reaches unity. The intervals and correspond to the increasing and decreasing transitions, respectively, enabling an efficient representation of intermediate or transitional states.
Together, trapezoidal and triangular membership functions provide a flexible and interpretable framework for partitioning the universe of discourse into overlapping linguistic regions (e.g., Low, Medium, High), thereby ensuring smooth inference and avoiding abrupt decision boundaries in the fuzzy logic-based NQI model.
The trapezoidal function is primarily employed to model boundary conditions (e.g., Poor and Excellent), where the membership degree remains constant over a range of values, representing stable extreme states. In contrast, the triangular function is used for intermediate categories (e.g., Fair), effectively capturing gradual transitions in network quality. This combination allows for a more realistic and continuous representation of quality variations in heterogeneous network environments.
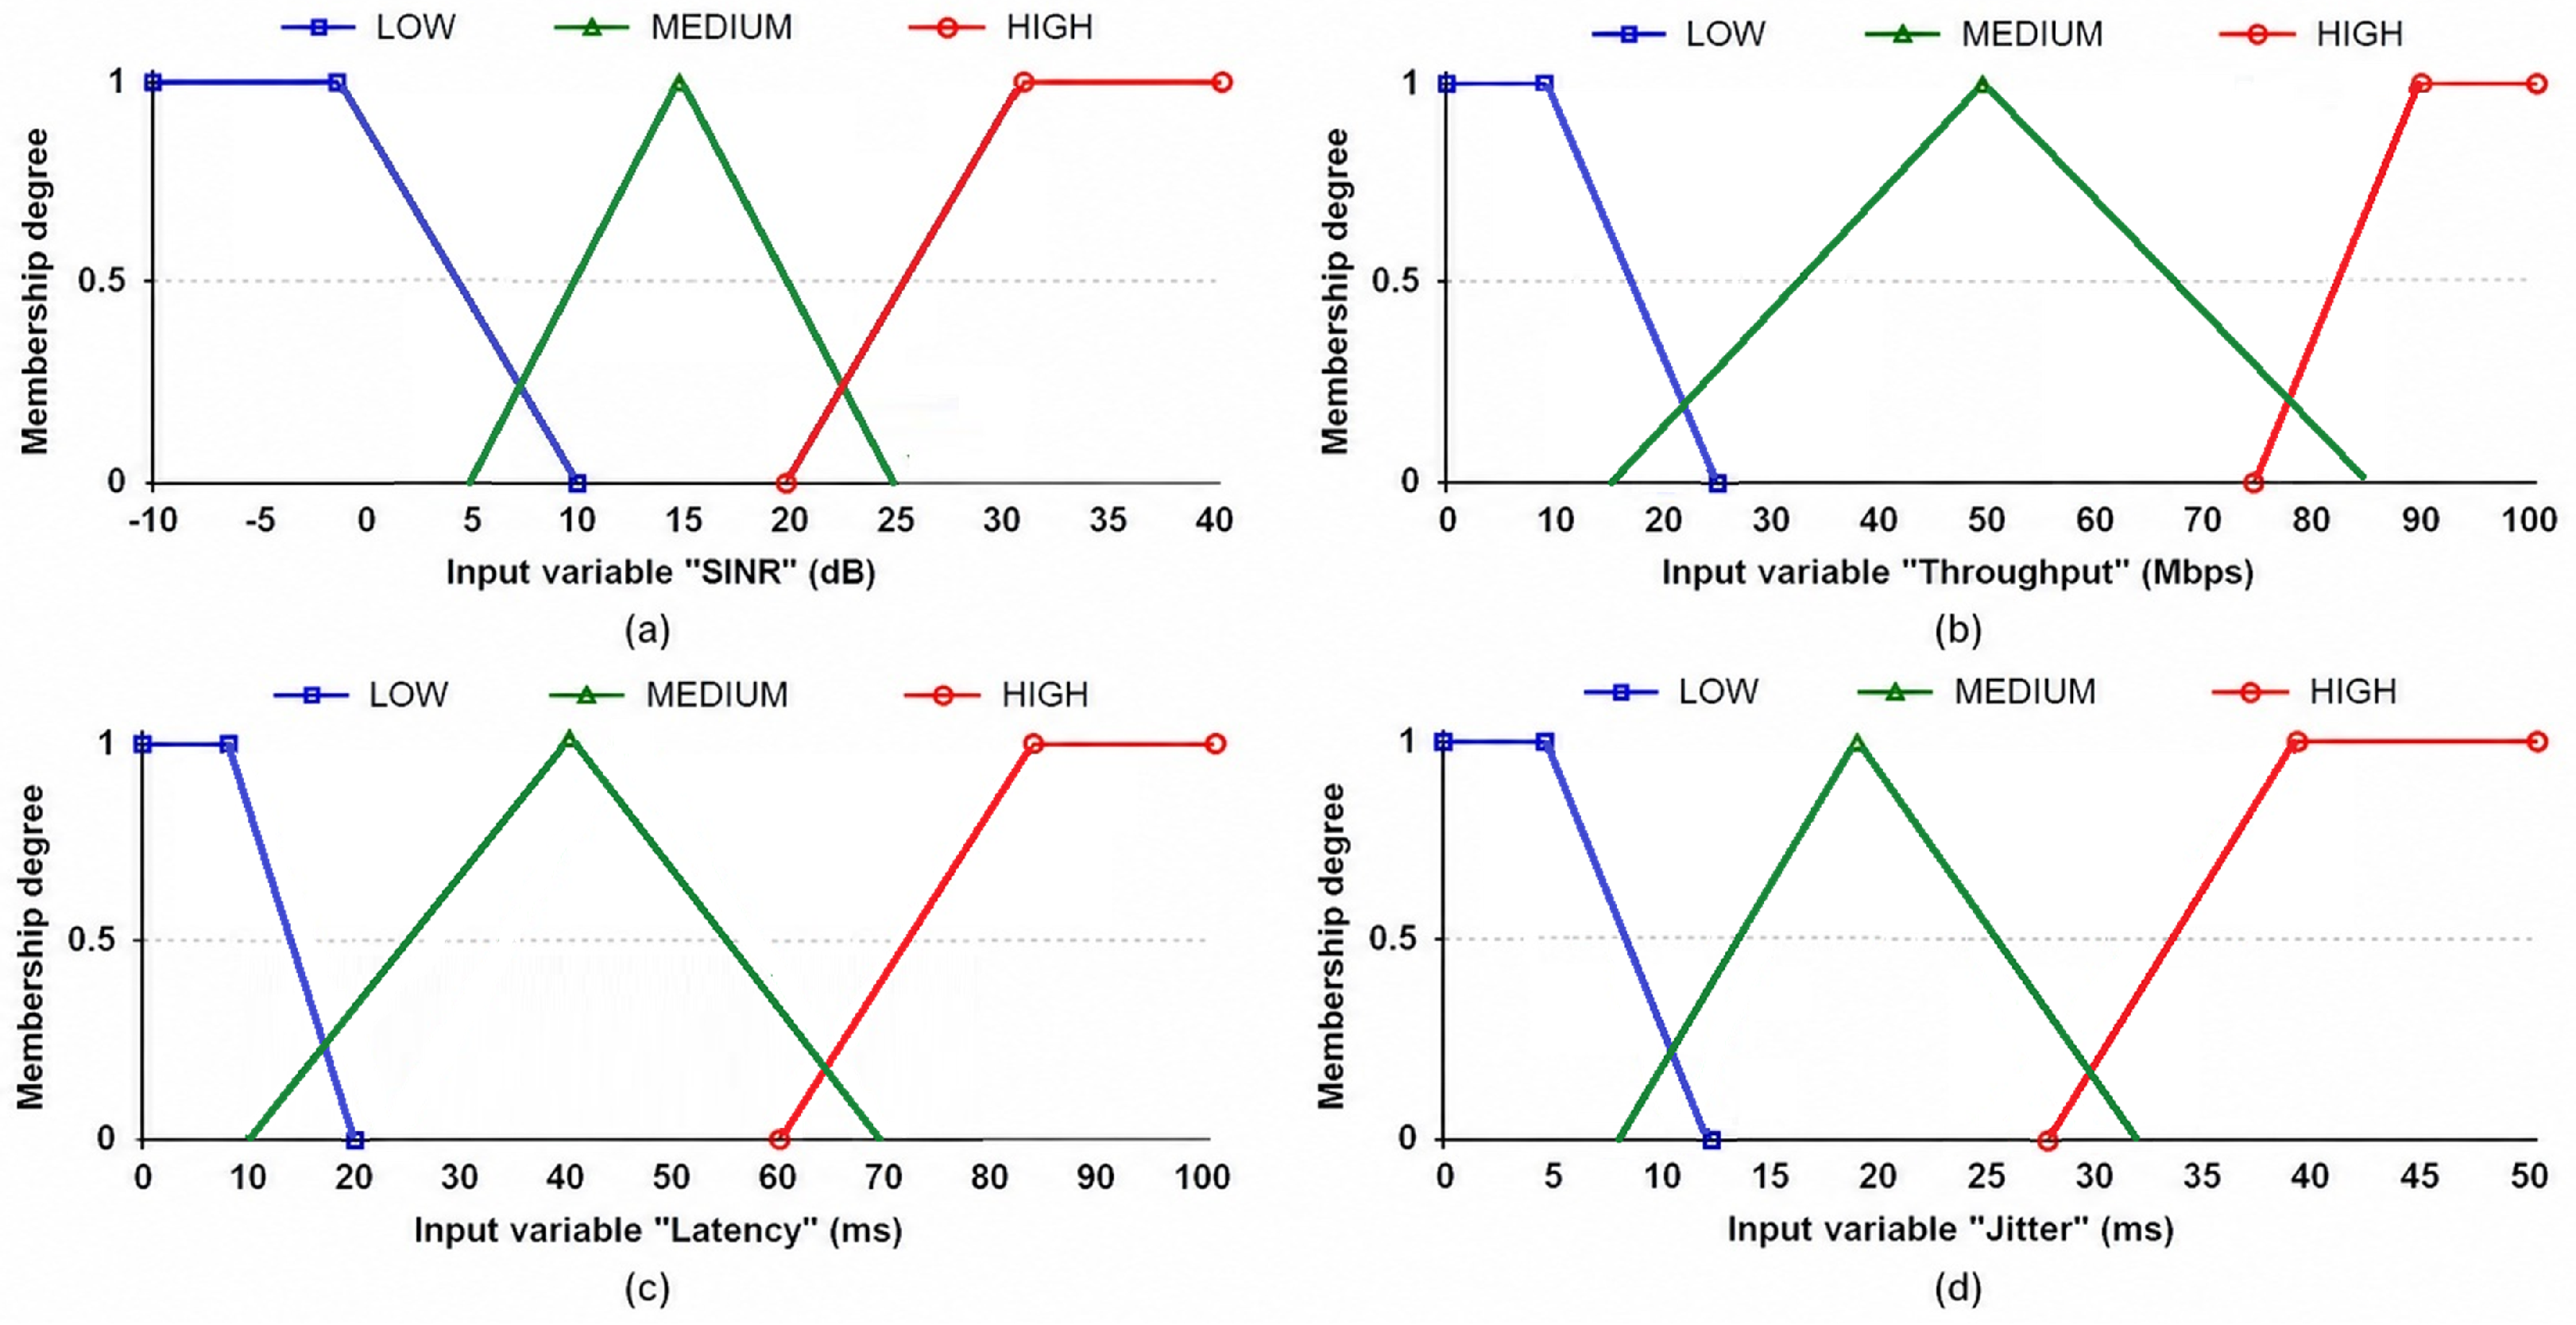
For each input variable, three linguistic terms Low, Med, and High are defined over its corresponding universe of discourse.
Figure 5a shows the membership functions for the SINR variable (
dB), and it can be specified as:
Figure 5b shows the fuzzy membership functions for the throughput variable
, and are defined by three linguistic terms, namely Low, Med, and High, as in (
4):
Figure 5c shows the latency membership functions
, and are described by three fuzzy sets, Low, Med, and High, where trapezoidal functions capture extreme latency conditions, and a triangular function models the transitional latency region as shown in (
5):
Figure 5d shows the jitter variable
, where three fuzzy linguistic terms Low, Med, and High are employed, with trapezoidal functions representing stable and highly unstable jitter conditions and a triangular function characterizing the intermediate region as in (
6):
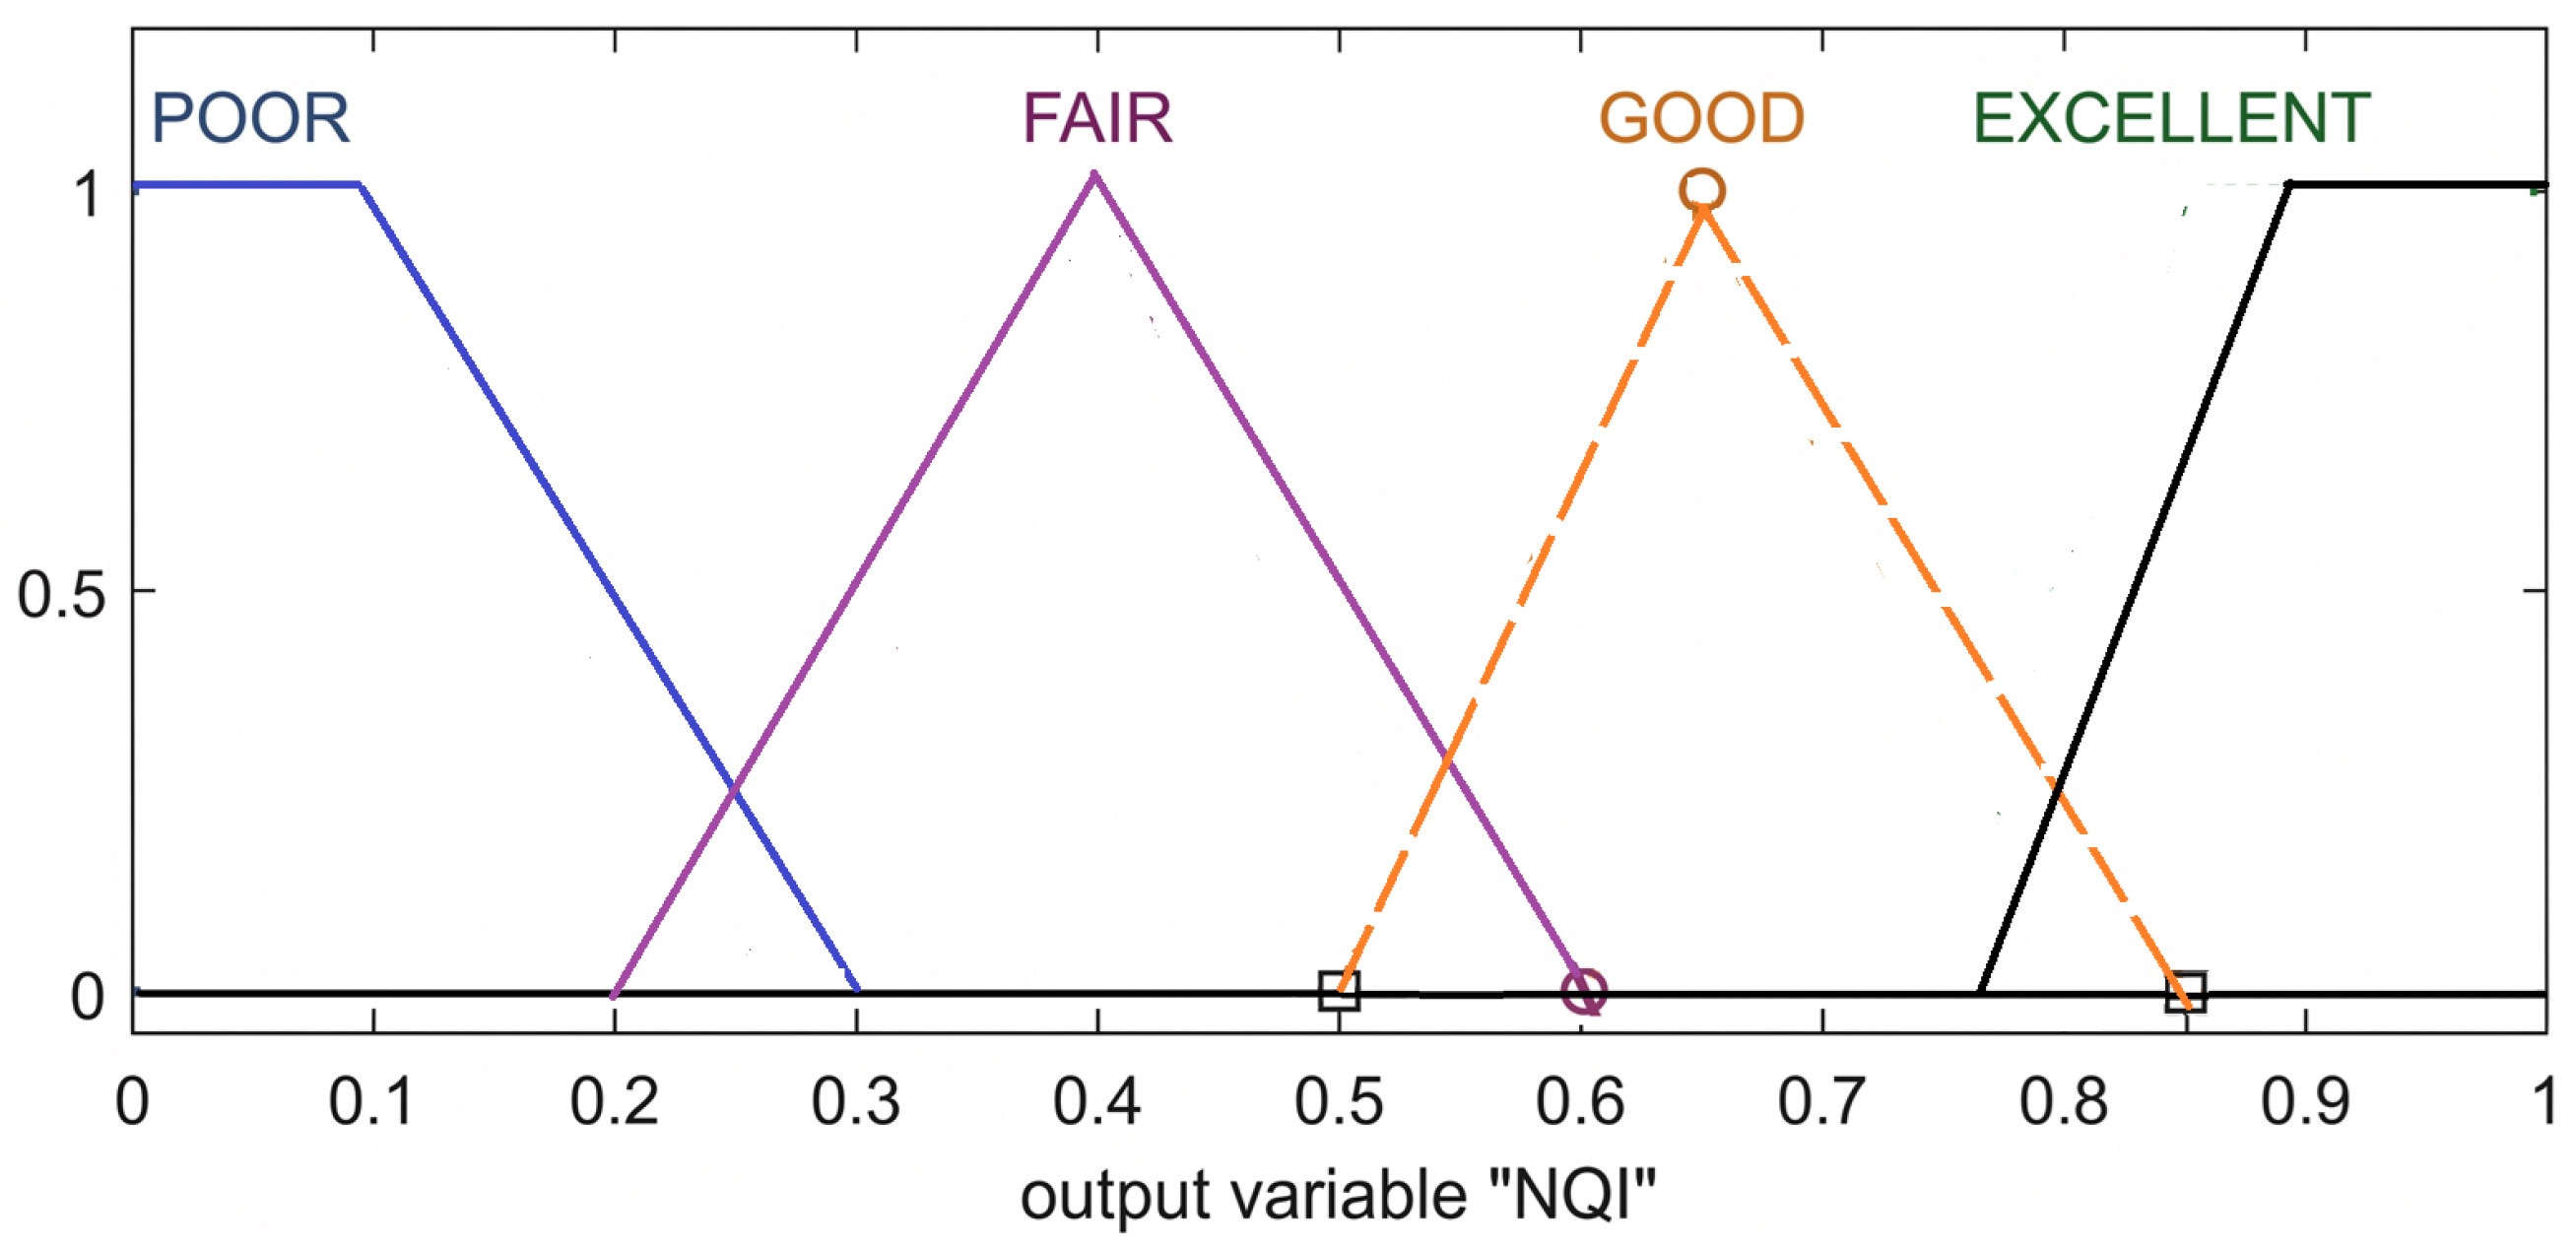
The output variable NQI (
) is described by four fuzzy sets Poor, Fair, Good, and Excellent as in (
7) and is shown in
Figure 6:
The design of the output membership functions is closely integrated with the FIS to ensure accurate and interpretable decision making. In this study, triangular membership functions are assigned to intermediate linguistic levels to facilitate smooth transitions between adjacent fuzzy sets, which is essential to capture gradual variations in network quality. Meanwhile, trapezoidal membership functions are adopted for extreme conditions to model saturation regions where the FIS rules produce consistent and high-confidence outputs. This configuration enhances the stability of the defuzzification process, particularly under boundary conditions where multiple rules may be activated simultaneously. Furthermore, the overlap between adjacent membership functions enables effective rule aggregation in the FIS, ensuring that the inferred NQI reflects a balanced contribution from multiple fuzzy rules. Consequently, this hybrid membership function design improves both the robustness and interpretability of the FIS-based evaluation framework.
The sensitivity and monotonicity of the NQI output are influenced by the shape and domain boundaries of the input membership functions. In this study, the input membership domains are defined based on the measured KPI ranges to preserve monotonic quality behavior. Higher SINR and throughput values increase the NQI, whereas higher latency and jitter values decrease the NQI. Triangular and trapezoidal membership functions are adopted because they provide interpretable and stable transitions between adjacent linguistic quality levels. Although Gaussian membership functions can provide smoother transitions, they require additional parameter tuning and may reduce the interpretability of the rule-based NQI evaluation.
The final linguistic classification of the NQI is determined using a dominant-membership rule. After centroid-based defuzzification produces a crisp NQI value
, the membership degrees of
are evaluated for all output linguistic sets, namely Poor, Fair, Good, and Excellent. The assigned linguistic class is selected as the class with the maximum membership degree, as expressed by
In the case where two adjacent linguistic classes have equal membership degrees, a conservative tie-breaking rule is applied by selecting the lower-quality class. This rule is adopted to avoid overestimating network quality in borderline conditions and to support more reliable operational decision making for SNPN monitoring.
The stability of the centroid-based NQI calculation is influenced by the overlap degree of the output membership functions and the discrete sampling resolution used in the defuzzification process. A moderate overlap between adjacent output linguistic levels, such as Poor–Fair, Fair–Good, and Good–Excellent, enables smooth transitions and reduces abrupt changes in the crisp NQI value near class boundaries. If the overlap is too small, minor KPI variations may cause sudden changes in the final linguistic class, whereas excessive overlap may reduce the separability between adjacent quality levels. In addition, increasing the number of discrete sampling points improves the numerical approximation of the centroid and reduces discretization error. Therefore, the output membership design and centroid sampling resolution are selected to balance stability, sensitivity, and interpretability in the proposed NQI framework.
4.3. Fuzzification
Given a crisp input vector
, the fuzzification stage computes the degree of membership of each input to all corresponding fuzzy sets. For the
k-th input variable and its linguistic term
, the membership value is as in (
9):
4.4. Rule Base
The fuzzy inference system adopts a Mamdani-type rule base. Each rule has the following general form as in (
10):
where
denotes the antecedent fuzzy set for the
k-th input in rule
j, and
is the consequent fuzzy set associated with the NQI output. In this work, eighty-one rules are defined to capture the relationship between SINR, throughput, latency, jitter, and perceived network quality. There are rule bases used in the fuzzy logic-based NQI framework.
In this study, fuzzy rules are constructed using the logical AND operator to combine multiple input conditions. The fuzzy inference system employs a complete rule base consisting of
rules, derived from four input variables (SINR, throughput, latency, and jitter), each defined by three linguistic terms (Low, Medium, High).
Table 6 lists 27 rules with high SINR value.
Table 7 lists 27 rules with medium SINR value, and
Table 8 lists 27 rules with low SINR value, so in total 81 rules are presented.
This full combinatorial formulation ensures that all possible input conditions are explicitly represented, thereby providing comprehensive coverage of the fuzzy input space. Unlike reduced rule-based approaches, the proposed Mamdani FIS employs the complete set of 81 inference rules, allowing every possible combination of SINR, throughput, latency, and jitter conditions to be directly mapped into a corresponding NQI output. This exhaustive rule representation reduces inference ambiguity and improves the consistency and robustness of the proposed network quality evaluation model, particularly under heterogeneous and dynamically changing SNPN environments.
For presentation clarity, the 81 rules are grouped into three separate tables according to the SINR linguistic condition, namely High-SINR, Medium-SINR, and Low-SINR, each containing 27 rules. SINR is selected as the primary grouping parameter because it represents the fundamental physical-layer indicator that strongly influences overall radio link quality. It directly affects throughput, retransmission probability, latency, and jitter behavior. By organizing the rule base around SINR conditions, the relationship between radio signal quality and higher-layer QoS performance becomes more interpretable for network operators. This structure also simplifies the analysis of how identical throughput and delay conditions may produce different NQI outcomes under different radio propagation environments.
Table 6 presents the complete Mamdani fuzzy inference rule subset corresponding to the High-SINR condition. In this subset, the SINR input variable is fixed at the High linguistic level, while throughput, latency, and jitter vary across Low, Medium, and High conditions, resulting in a total of
IF–THEN rules. The rule structure demonstrates how the proposed fuzzy inference system evaluates overall network quality end-to-end performance indicators related to throughput and delay characteristics.
The presented rules indicate that high SINR alone does not always guarantee excellent network quality. For example, rules R1 and R2 produce an Excellent NQI because high SINR and high throughput are combined with low latency and low-to-medium jitter conditions. However, when latency and jitter increase, the resulting NQI gradually decreases from Excellent to Good and eventually to Fair, despite the SINR remaining at the High level. Similarly, rules R24–R27 demonstrate that even under favorable radio conditions, low throughput combined with medium-to-high latency and jitter results in Poor network quality assessment. These observations confirm that the practical user experience cannot be represented solely by physical-layer signal quality metrics.
Table 7 presents the Mamdani fuzzy inference rule subset for the Medium-SINR condition, where the radio signal quality is considered moderate while throughput, latency, and jitter vary between different linguistic levels. The rule base demonstrates that medium SINR conditions can still achieve Good network quality when combined with high throughput and low delay-related KPIs, as observed in rules R28–R32 and R37–R38. However, the resulting NQI progressively decreases to Fair or Poor when latency and jitter increase or when throughput degrades to the Low category. These observations indicate that medium radio quality does not necessarily imply poor network performance, since overall user experience is strongly influenced by the interaction among throughput, latency, and jitter. The proposed Mamdani inference mechanism therefore provides a more adaptive and interpretable network quality evaluation compared with conventional single-KPI assessment methods.
Table 8 presents the Mamdani fuzzy inference rule subset corresponding to the Low-SINR condition. In this scenario, the radio signal quality is fixed at the Low linguistic level, while throughput, latency, and jitter vary across different operating conditions.
The rule base demonstrates that low SINR significantly limits the achievable network quality, even when throughput remains relatively high. For example, rules R55–R59 still produce a Fair NQI because favorable throughput and low delay conditions partially compensate for poor radio quality. However, as latency and jitter increase or throughput decreases, the resulting NQI rapidly degrades to the Poor category, as observed in rules R60–R81. These results indicate that weak radio conditions strongly affect overall network stability and user experience.
The proposed Mamdani FIS therefore enables adaptive quality assessment by jointly evaluating radio and QoS-related KPIs rather than relying solely on individual performance metrics. The fuzzy rule design therefore enables a more adaptive and interpretable evaluation mechanism compared with conventional threshold-based KPI analysis. Instead of relying on rigid numerical boundaries, the Mamdani inference framework captures the interaction among heterogeneous KPIs and translates them into linguistic quality levels that better represent practical SNPN operating conditions. This approach is particularly beneficial for private network operators because network optimization decisions often require simultaneous consideration of radio quality, traffic performance, and delay-sensitive service behavior. Consequently, the proposed rule base provides a practical foundation for unified KPI monitoring and intelligent network quality assessment in SDR-based 4G and 5G SNPN deployments. Furthermore, the fuzzy-based evaluation mechanism provides smoother transitions between network quality states, avoiding abrupt classification changes commonly observed in fixed-threshold approaches. This characteristic is important for real-time network monitoring because it enables operators to identify gradual performance degradation and apply corrective actions before severe service deterioration occurs.
4.5. Defuzzification
To obtain a crisp estimate of the NQI, the centroid (or center-of-gravity) defuzzification method is applied to the aggregated output set
as in (
11):
In the numerical implementation, the integrals are approximated by a discrete sum over a uniformly sampled set of points in the interval .
The fuzzification of each KPI was used in the evaluation of the performance. These functions were implemented in MATLAB R2021a using trimf and trapmf and in Python 3.10 using equivalent definitions.
The NQI output is normalized within the interval [0, 1] and represented using four overlapping fuzzy linguistic levels, namely Poor, Fair, Good, and Excellent. These linguistic terms are defined by trapezoidal and triangular membership functions.
Unlike crisp partitioning, fuzzy sets are intentionally designed with overlapping support regions to enable smooth transitions between adjacent quality levels. This formulation avoids rigid decision boundaries and allows the model to capture gradual variations in network performance with more accuracy.
It should be noted that the intervals associated with each linguistic level represent the approximate support of the corresponding membership functions rather than strict classification thresholds. Consequently, the final SLA interpretation is determined based on the degree of dominant membership of the defuzzified NQI value, ensuring consistency with the Mamdani fuzzy inference framework.
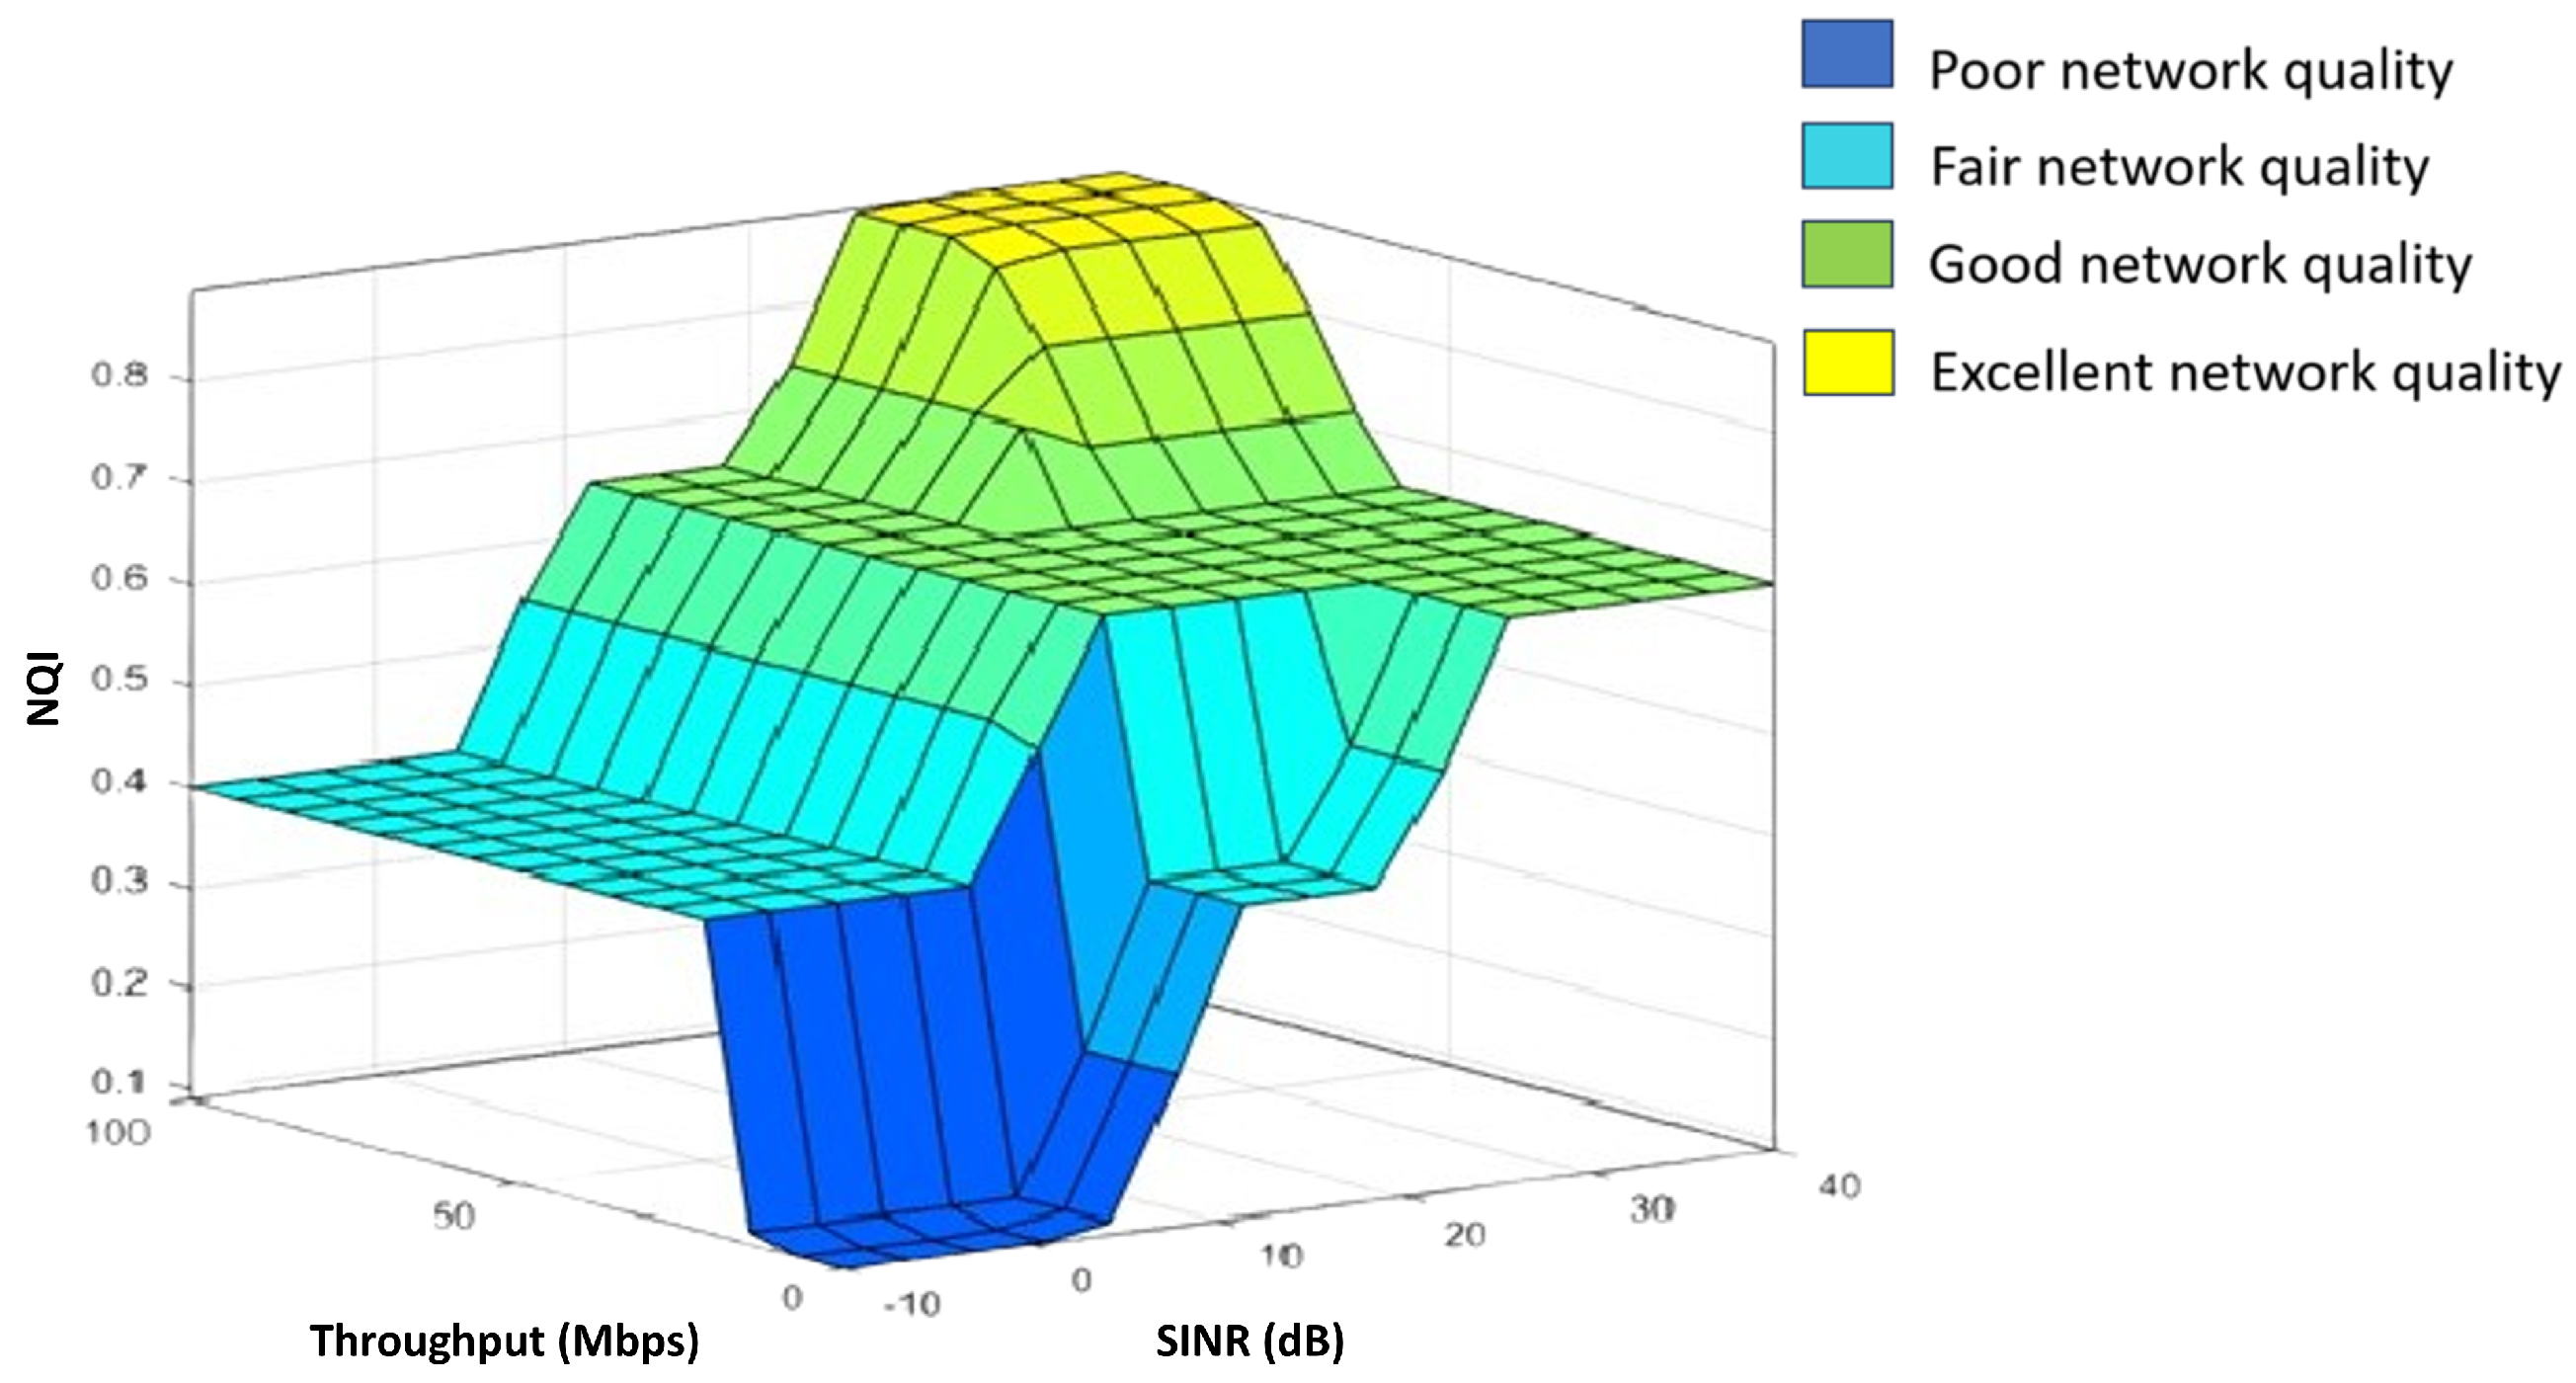
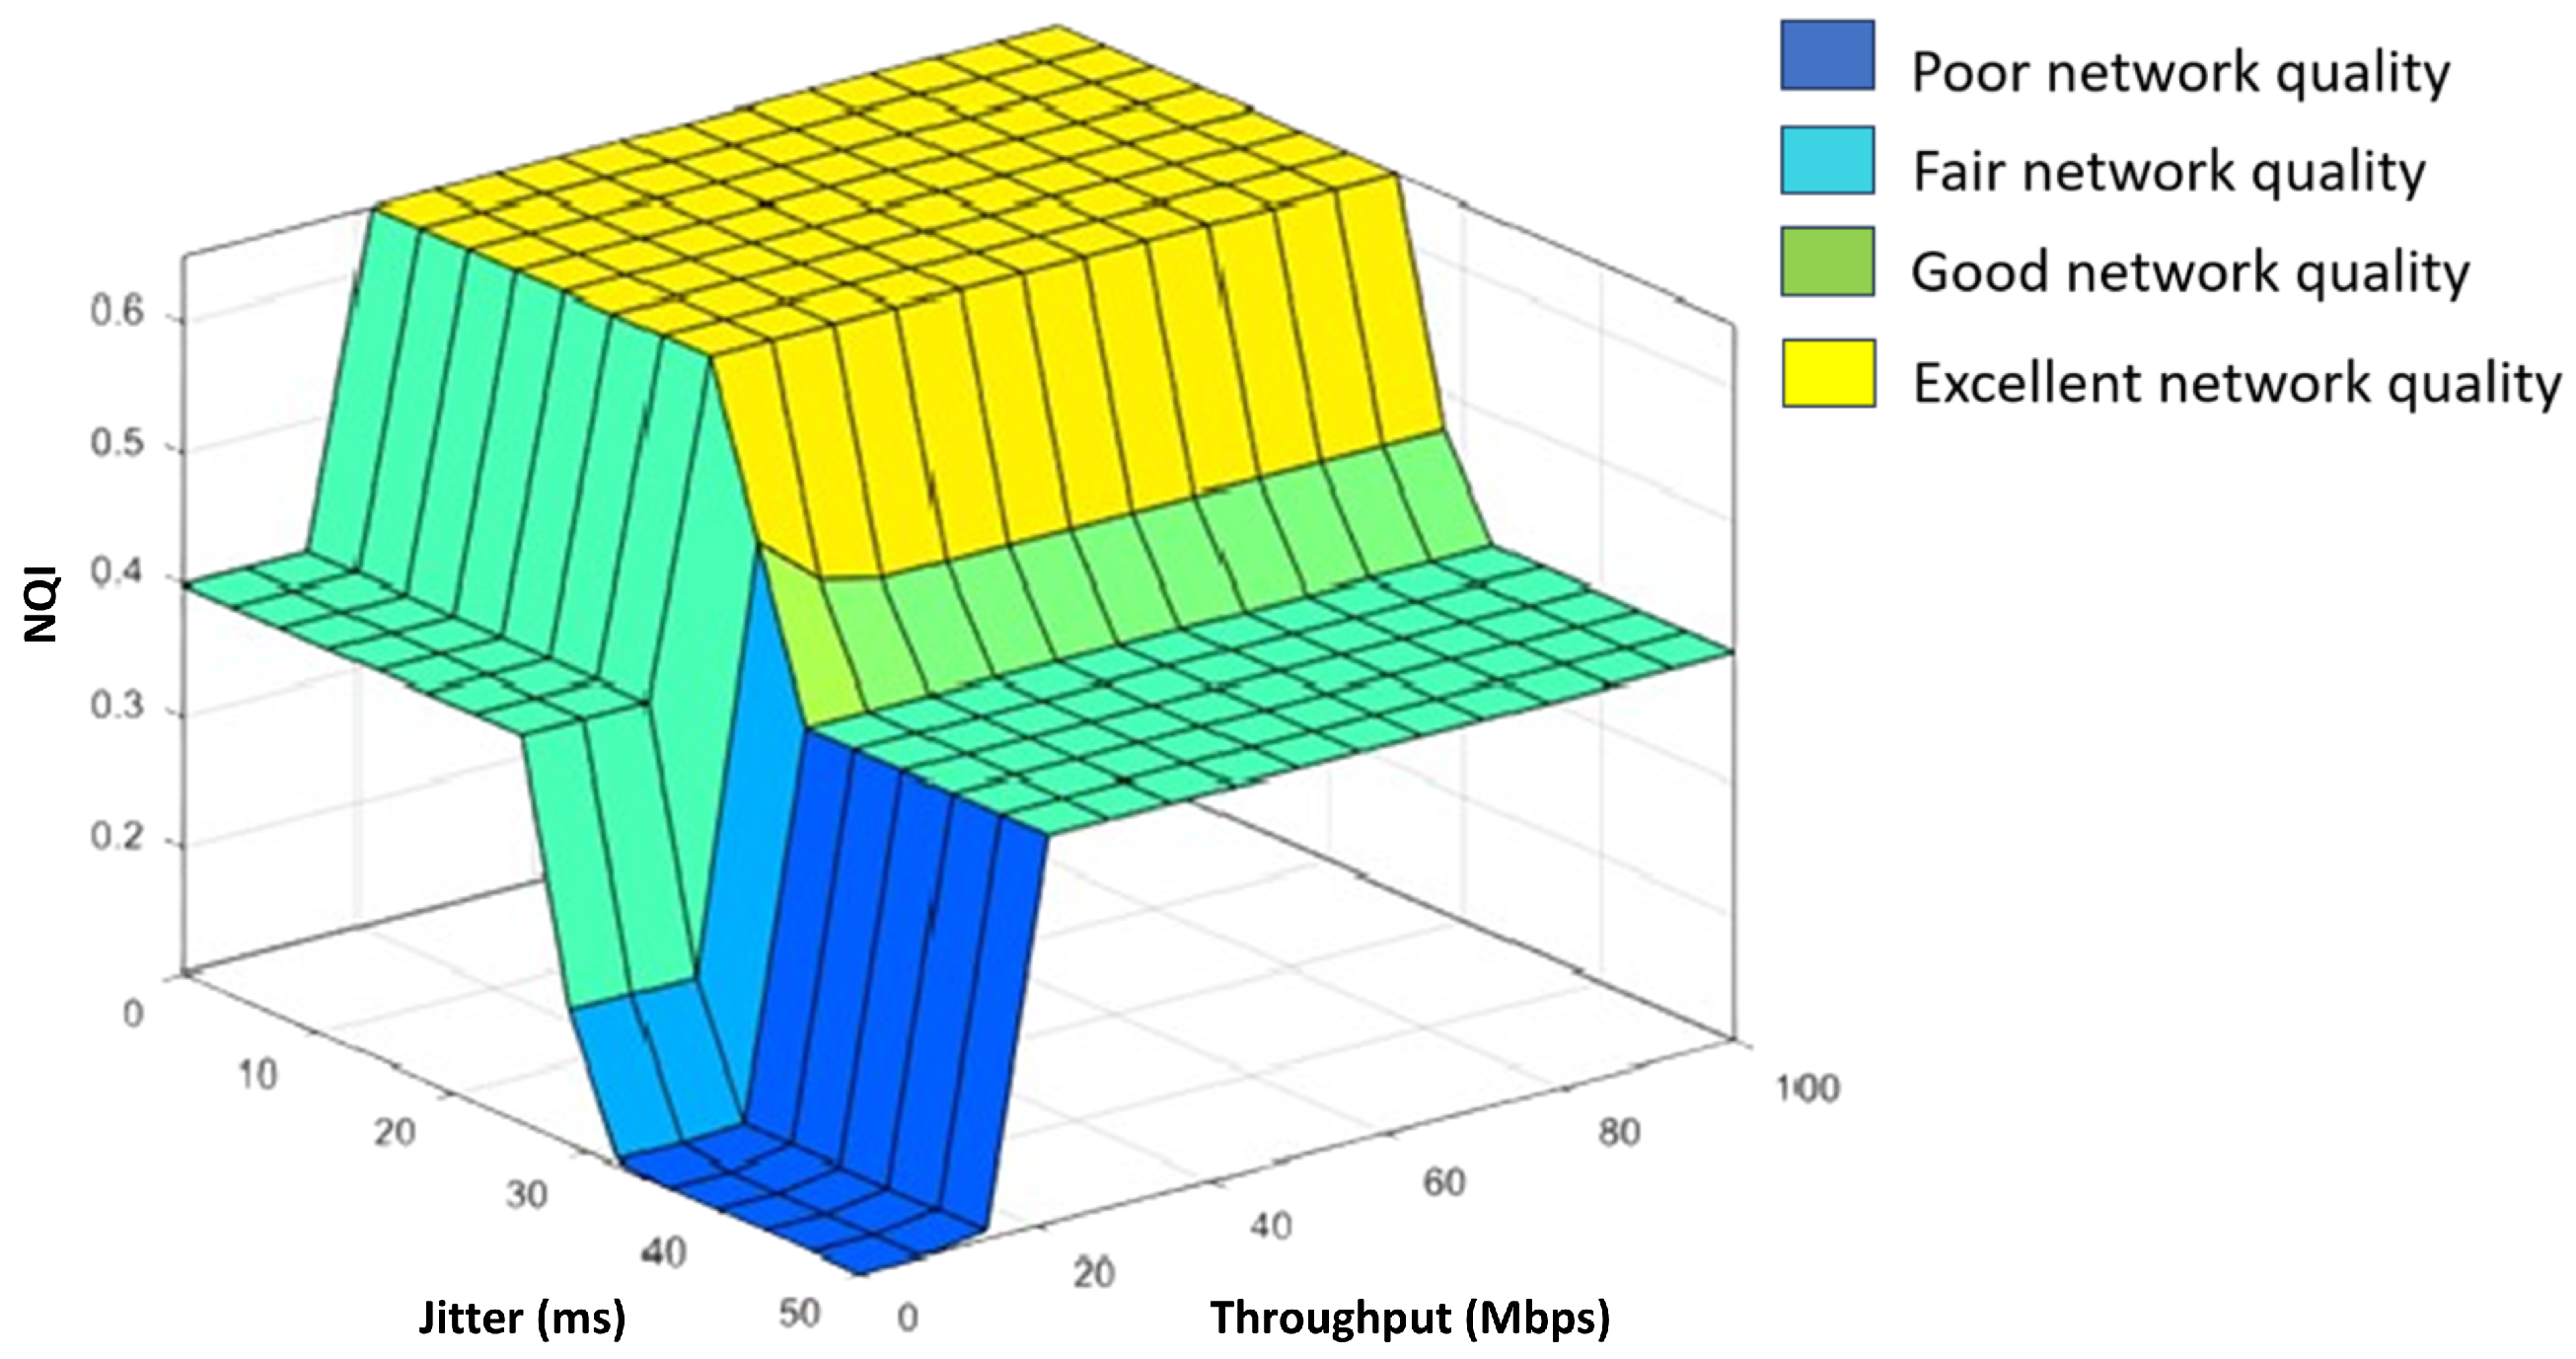
The fuzzy surface plot depicts the defuzzified NQI output over the combined SINR–throughput domain. A pronounced nonlinear behavior is observed: the NQI remains suppressed at low SINR values regardless of throughput, confirming that radio-link quality is the dominant factor in overall user-perceived network performance. As SINR transitions into medium and high linguistic regions, the contribution of throughput becomes more significant, leading to a gradual rise in NQI. The upper plateau corresponds to the Excellent or Good fuzzy output classes, where both SINR and throughput jointly satisfy the high-membership criteria. This illustrates the capability of the Mamdani FIS to capture multidimensional KPI interactions that are not represented in linear or threshold-based evaluation methods as illustrated in
Figure 7.
Figure 7,
Figure 8 and
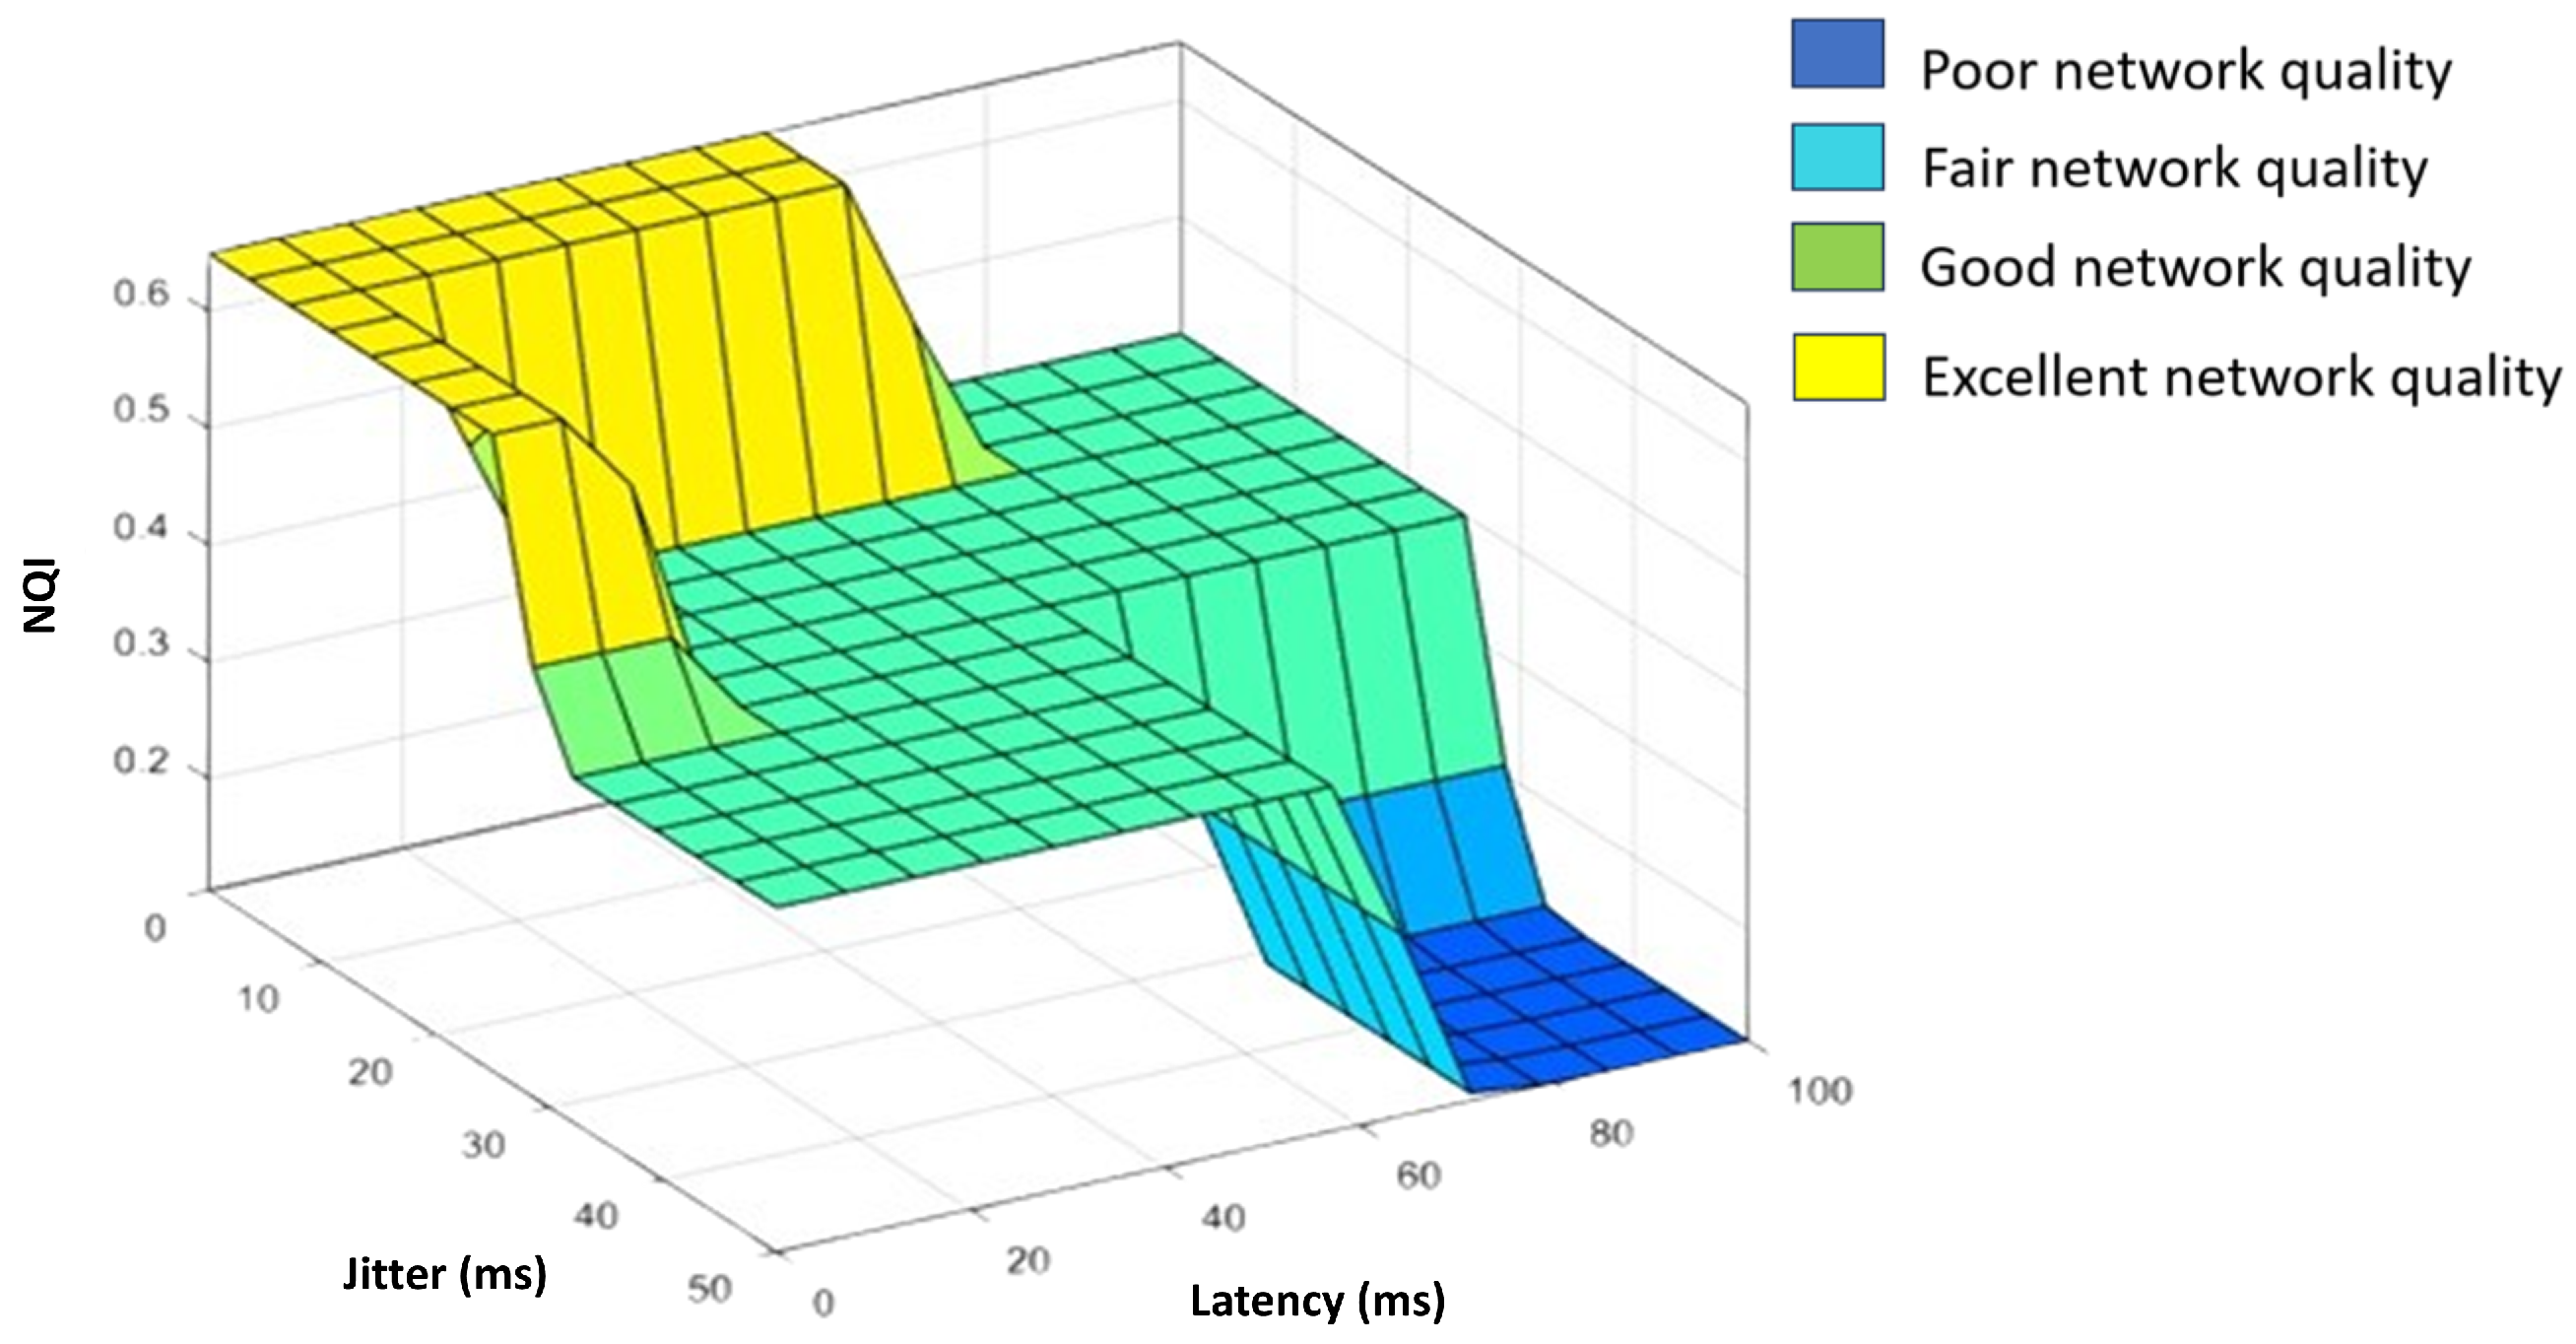
Figure 9 illustrate the Mamdani fuzzy surface representations that characterize the nonlinear relationships among KPIs in determining the NQI. In
Figure 7, the interaction between SINR and throughput demonstrates a nonlinear surface with a distinct saturation region. As SINR increases beyond approximately 10–15 dB, the NQI improves significantly, particularly when combined with higher throughput. At high SINR and throughput levels, the surface converges to a plateau in the Excellent region, indicating that further improvements in these parameters provide only marginal gains in perceived network quality. This behavior suggests that SINR acts as a primary enabling factor, while throughput enhances performance once reliable signal conditions are established.
In contrast,
Figure 8 present the relationship between throughput and jitter, highlighting the impact of temporal instability on network quality. While increasing throughput leads to improved NQI under low jitter conditions, the surface shows a pronounced degradation as jitter increases. Even at high throughput levels, elevated jitter causes the NQI to decrease from Excellent to Fair or Poor, indicating that delay variation cannot be compensated by higher data rates. This result emphasizes the importance of jitter as a critical factor affecting service quality, particularly for applications requiring stable and continuous data delivery.
Figure 9 further examines the combined effect of latency and jitter, showing a consistent decline in NQI as both parameters increase. The surface reveals that low latency and low jitter correspond to Excellent network quality, while higher values of either parameter result in rapid degradation. Unlike the SINR–throughput relationship, no compensatory effect is observed, as both latency and jitter jointly contribute to performance degradation. This indicates that delay and its variability are dominant factors in determining overall network quality, especially in delay-sensitive use cases.
Overall, the analysis of
Figure 8,
Figure 9 and
Figure 10 demonstrates that the relationship between KPIs and network quality is inherently nonlinear and cannot be accurately represented using independent or linear evaluation methods. The Mamdani fuzzy-based NQI framework effectively captures these interactions by integrating multiple KPIs into a unified and interpretable metric, enabling a more comprehensive assessment of network performance in 4G and 5G SNPN environments.
5. Results and Discussion
This section presents the experimental results obtained from the deployment and performance evaluation of SDR-based SNPNs supporting both 4G LTE and 5G NR technologies. The measurements were conducted in an indoor environment under 2 m and 5 m deployment scenarios using SDR-based infrastructure and COTS user equipment. The evaluation includes SINR, downlink throughput, uplink throughput, latency, and jitter as key performance indicators. Rather than focusing solely on proving the superiority of one radio access technology over another, this study uses the measured 4G and 5G SNPN performance values as multi-metric inputs for fuzzy-logic-based network quality visualization.
The results show that network performance varies across radio access technology, deployment distance, and propagation condition. In general, shorter deployment distance and LOS conditions provide more favorable signal quality and throughput performance, whereas increased distance and NLOS conditions introduce higher attenuation, lower throughput, and larger latency or jitter variations. These findings indicate that SNPN quality cannot be sufficiently interpreted using a single metric such as throughput alone. Therefore, the proposed fuzzy logic framework integrates SINR, throughput, latency, and jitter to provide a more comprehensive and intuitive linguistic classification of network quality.
By mapping the measured performance indicators into fuzzy membership functions, the proposed approach enables the SDR-based SNPN condition to be visualized as linguistic quality levels, such as Poor, Fair, Good, and Excellent. This interpretation is useful for network monitoring because it converts heterogeneous numerical measurements into an operationally meaningful quality representation, particularly for indoor SNPN environments where performance may fluctuate due to propagation distance and obstruction.
5.1. System Demonstration
The successful deployment of both 4G and 5G SNPNs using USRP hardware, Open5GS core network, srsRAN base station software, and COTS UE represents a significant validation milestone beyond simple proof-of-concept. This achievement demonstrates three critical capabilities for private network operators and researchers.
First, the successful attachment of COTS UE to SDR-based infrastructure confirms protocol-level interoperability between open-source software stacks (Open5GS, srsRAN) and commercial devices across two radio access technology generations [
19,
21]. Unlike simulation-based studies or closed-loop testbeds using software-defined UE emulators, this deployment validates the complete 3GPP protocol stacks’ implementation from physical layer synchronization and random access procedures through radio resource control (RRC) connection establishment, authentication, and bearer setup. This interoperability is non-trivial: commercial UE firmware implements vendor-specific optimizations and strict 3GPP conformance checks that often expose subtle implementation gaps in open-source base stations.
Second, the dual-generation deployment using hardware platform USRP B210 demonstrates the flexibility and cost-efficiency potential of SDR-based private networks [
18]. Traditional private network deployments require separate hardware for 4G and 5G, increasing capital expenditure and operational complexity. The ability to reconfigure the same radio hardware for different RAT generations through software updates provides operators with technology migration paths and multi-RAT coexistence strategies without hardware replacement. This is particularly valuable for industrial environments where gradual technology migration is preferred over disruptive upgrades.
Third, the deployment validates the feasibility of standalone operation (SNPN mode) without dependency on public network infrastructure. Both 4G and 5G networks operated with dedicated spectrum allocations (LTE Band 3 and new radio (NR) n3), independent core networks, and isolated authentication databases. This standalone capability is essential for mission-critical industrial applications that require guaranteed availability, security isolation, and immunity from public network congestion [
1,
2].
The 4G SNPN testing also began with the activation of the USRP, the network, and the powering on of the UE. The frequency band used was 1800 MHz. In the network configuration, the downlink (DL) frequency was set to 1820 MHz and the uplink (UL) to 1725 MHz. The COTS UE successfully attached to the 4G SNPN.
However, it is important to acknowledge that this deployment represents a controlled indoor, single-cell, single-user scenario. The successful COTS UE attachment validates protocol correctness and basic functionality but does not yet stress-test the system under realistic operational conditions such as multi-user interference, mobility handovers, or outdoor propagation challenges.
The 5G SNPN testing began with the activation of the USRP, the network, and the switching on of the UE. The frequency band used was n3, with 1765 MHz UL and 1860 MHz DL. The selection of the frequency band in 5G varies depending on the available resources and the regulatory framework in each country. Bartolin-Arnau et al. [
29] conducted research on private 5G network frequency usage in Europe. The implementation of specific frequency ranges has a direct impact on coverage and industrial bandwidth requirements. Meanwhile, Luo et al. [
30] evaluated the use of the FR2 band for private 5G networks. Karstensen et al. [
31] investigated potential frequency usage based on Danish regulations. In this research to measure the KPIs the same frequency range as LTE is implemented. The COTS UE successfully attached to the 5G SNPN.
5.2. Performance Evaluation
The measured results show different performance characteristics between the SDR-based 4G LTE SNPN and the SDR-based 5G NR SNPN under the tested indoor environment. Since both systems operate in a comparable 1800 MHz frequency range, namely LTE Band 3 and NR n3, the observed differences should not be interpreted as a general propagation advantage of one system over another. Instead, they reflect the specific behavior of the implemented SDR-based SNPN configurations, including radio access technology, PRB allocation, scheduler operation, interference condition, link adaptation, and indoor propagation characteristics. Therefore, the reported results represent the tested experimental setup and should not be generalized as universal 4G or 5G performance.
In this study, SINR, DL throughput, UL throughput, latency, and jitter are analyzed as multi-metric indicators of SDR-based SNPN quality. The purpose of the comparison is not merely to prove that 5G outperforms 4G, but to provide structured measurement inputs for fuzzy-logic-based network quality visualization. By mapping these heterogeneous metrics into linguistic membership functions, the proposed approach enables the measured SNPN condition to be interpreted more intuitively in terms of Poor, Fair, Good, and Excellent quality levels.
Compared with modem-based COTS UE evaluation, the proposed real deployment provides additional insight into practical network behavior, including radio propagation effects, internet routing conditions, and commercial UE interoperability, which are difficult to fully capture in simulation environments.
Table 9 presents the statistical comparison of 4G LTE and 5G SNPN performance under 2 m and 5 m indoor deployment scenarios using Ookla measurement tools to identify user experiences. The results show that the SDR-based 5G SNPN consistently achieves higher SINR and throughput performance than the SDR-based 4G LTE deployment. In the 2 m scenario, the SDR-based 5G SNPN achieves an average SINR of 9.12 dB and a downlink throughput of 53.84 Mbps, compared with 4.96 dB and 37.82 Mbps for the 4G, corresponding to approximately 42.4% improvement in downlink throughput. The 5G deployment also achieves substantially higher uplink throughput, reaching 53.27 Mbps compared with 10.58 Mbps for LTE. Furthermore, both latency and jitter measurements remain relatively stable, with the SDR-based 5G SNPN achieving average values of 21.32 ms and 4.86 ms, respectively. The statistical results further indicate that increasing deployment distance from 2 m to 5 m generally degrades SINR and throughput performance, particularly for the LTE deployment, due to increased propagation loss and indoor interference effects. Overall, the improved performance of the SDR-based 5G SNPN can be attributed to the enhanced spectral efficiency, adaptive resource allocation, and more efficient radio access mechanisms provided by the 5G NR standalone architecture.
Table 10 summarizes the statistical performance of SDR-based 4G and 5G SNPN under LOS conditions at 2 m and 5 m indoor deployment distances. The iPerf3-based results show that 5G SNPN generally outperforms SDR-based 4G LTE in both downlink and uplink throughput, particularly at 2 m. The SDR-based 5G achieves 55.00 Mbps downlink throughput and 40.50 Mbps uplink throughput. Although the performance decreases at 5 m due to increased propagation distance, SDR-based 5G SNPN still maintains higher throughput than 4G. In addition, 5G SNPN shows lower latency at both distances, indicating better responsiveness under LOS conditions.
In contrast to the LOS result in
Table 10, the NLOS scenario in
Table 11 reflects a more challenging propagation environment due to obstruction and reduced direct signal paths between the COTS UE and the SDR-based SNPN system. This condition leads to lower SINR, reduced DL and UL throughput, and higher latency and jitter variations, particularly at the 5 m distance. The comparison between LOS and NLOS conditions shows that network quality is strongly affected by the propagation environment and deployment distance.
Rather than aiming to simply prove that 5G outperforms 4G SDR-based SNPN, this evaluation provides quantitative input features for the proposed fuzzy-logic-based network quality interpretation. The differences in SINR, throughput, latency, and jitter under 2 m and 5 m LOS and NLOS conditions demonstrate that each metric contributes differently to the overall perceived network quality. Therefore the statistical values in
Table 10 and
Table 11 are used as the basis for fuzzy membership mapping and linguistic classification, enabling the SDR-based SNPN performance to be visualized and interpreted more as Poor, Fair, Good, or Excellent.
Moreover, the lower standard deviation values observed in the 5G measurements indicate improved network stability and reliability compared to 4G. This performance gain can be attributed to the enhanced spectral efficiency, flexible numerology, and standalone architecture of 5G NR.
Table 12 presents the comparative performance evaluation of the 4G LTE and 5G SNPN deployments using COTS UE under the same indoor experimental environment. The results show that the 5G SNPN generally achieves better radio and throughput performance, including higher SINR, higher downlink throughput, and significantly improved uplink throughput. In contrast, the latency and jitter differences between both technologies remain relatively small, indicating that the end-to-end delay performance is influenced not only by radio access technology but also by SDR processing overhead, core network behavior, Internet routing, and application-layer measurement mechanisms. Furthermore, although the 5G deployment demonstrates overall superior performance, the raw KPI values do not always provide a straightforward indication of whether the network condition should be classified as good, fair, or poor from an operational perspective. For example, a network may achieve high throughput while simultaneously experiencing unstable latency or fluctuating SINR conditions. Similarly, lower latency alone does not necessarily indicate better overall user experience when throughput capacity remains limited. This demonstrates that evaluating KPIs independently can lead to fragmented interpretation and may not accurately reflect the actual quality perceived by users or network operators.
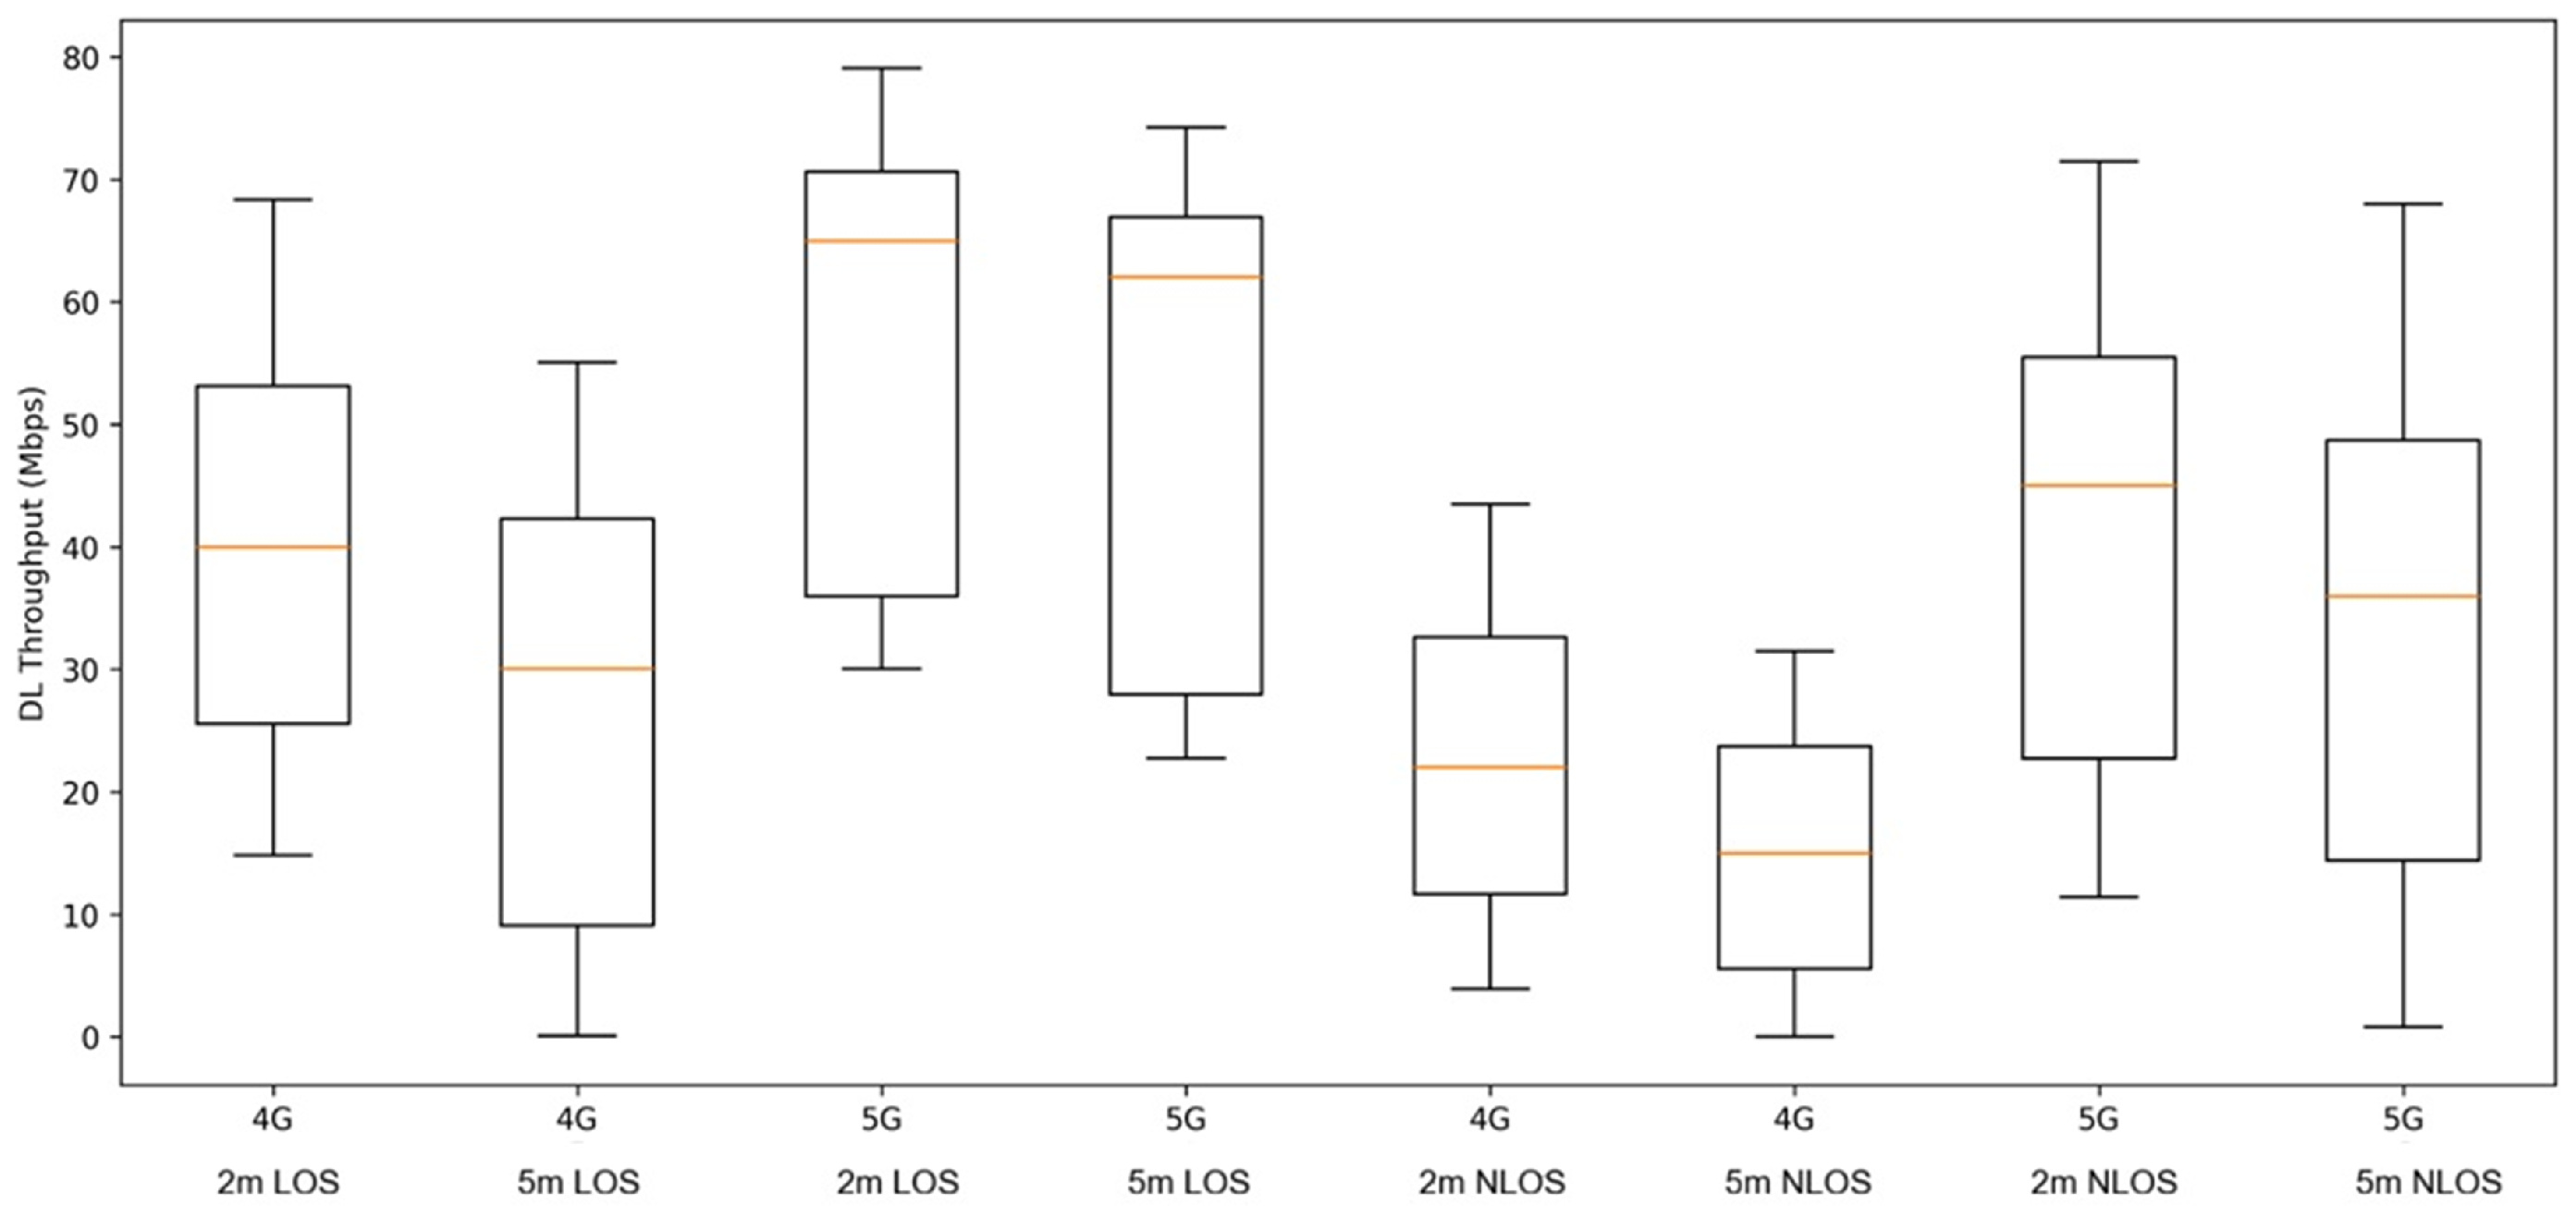
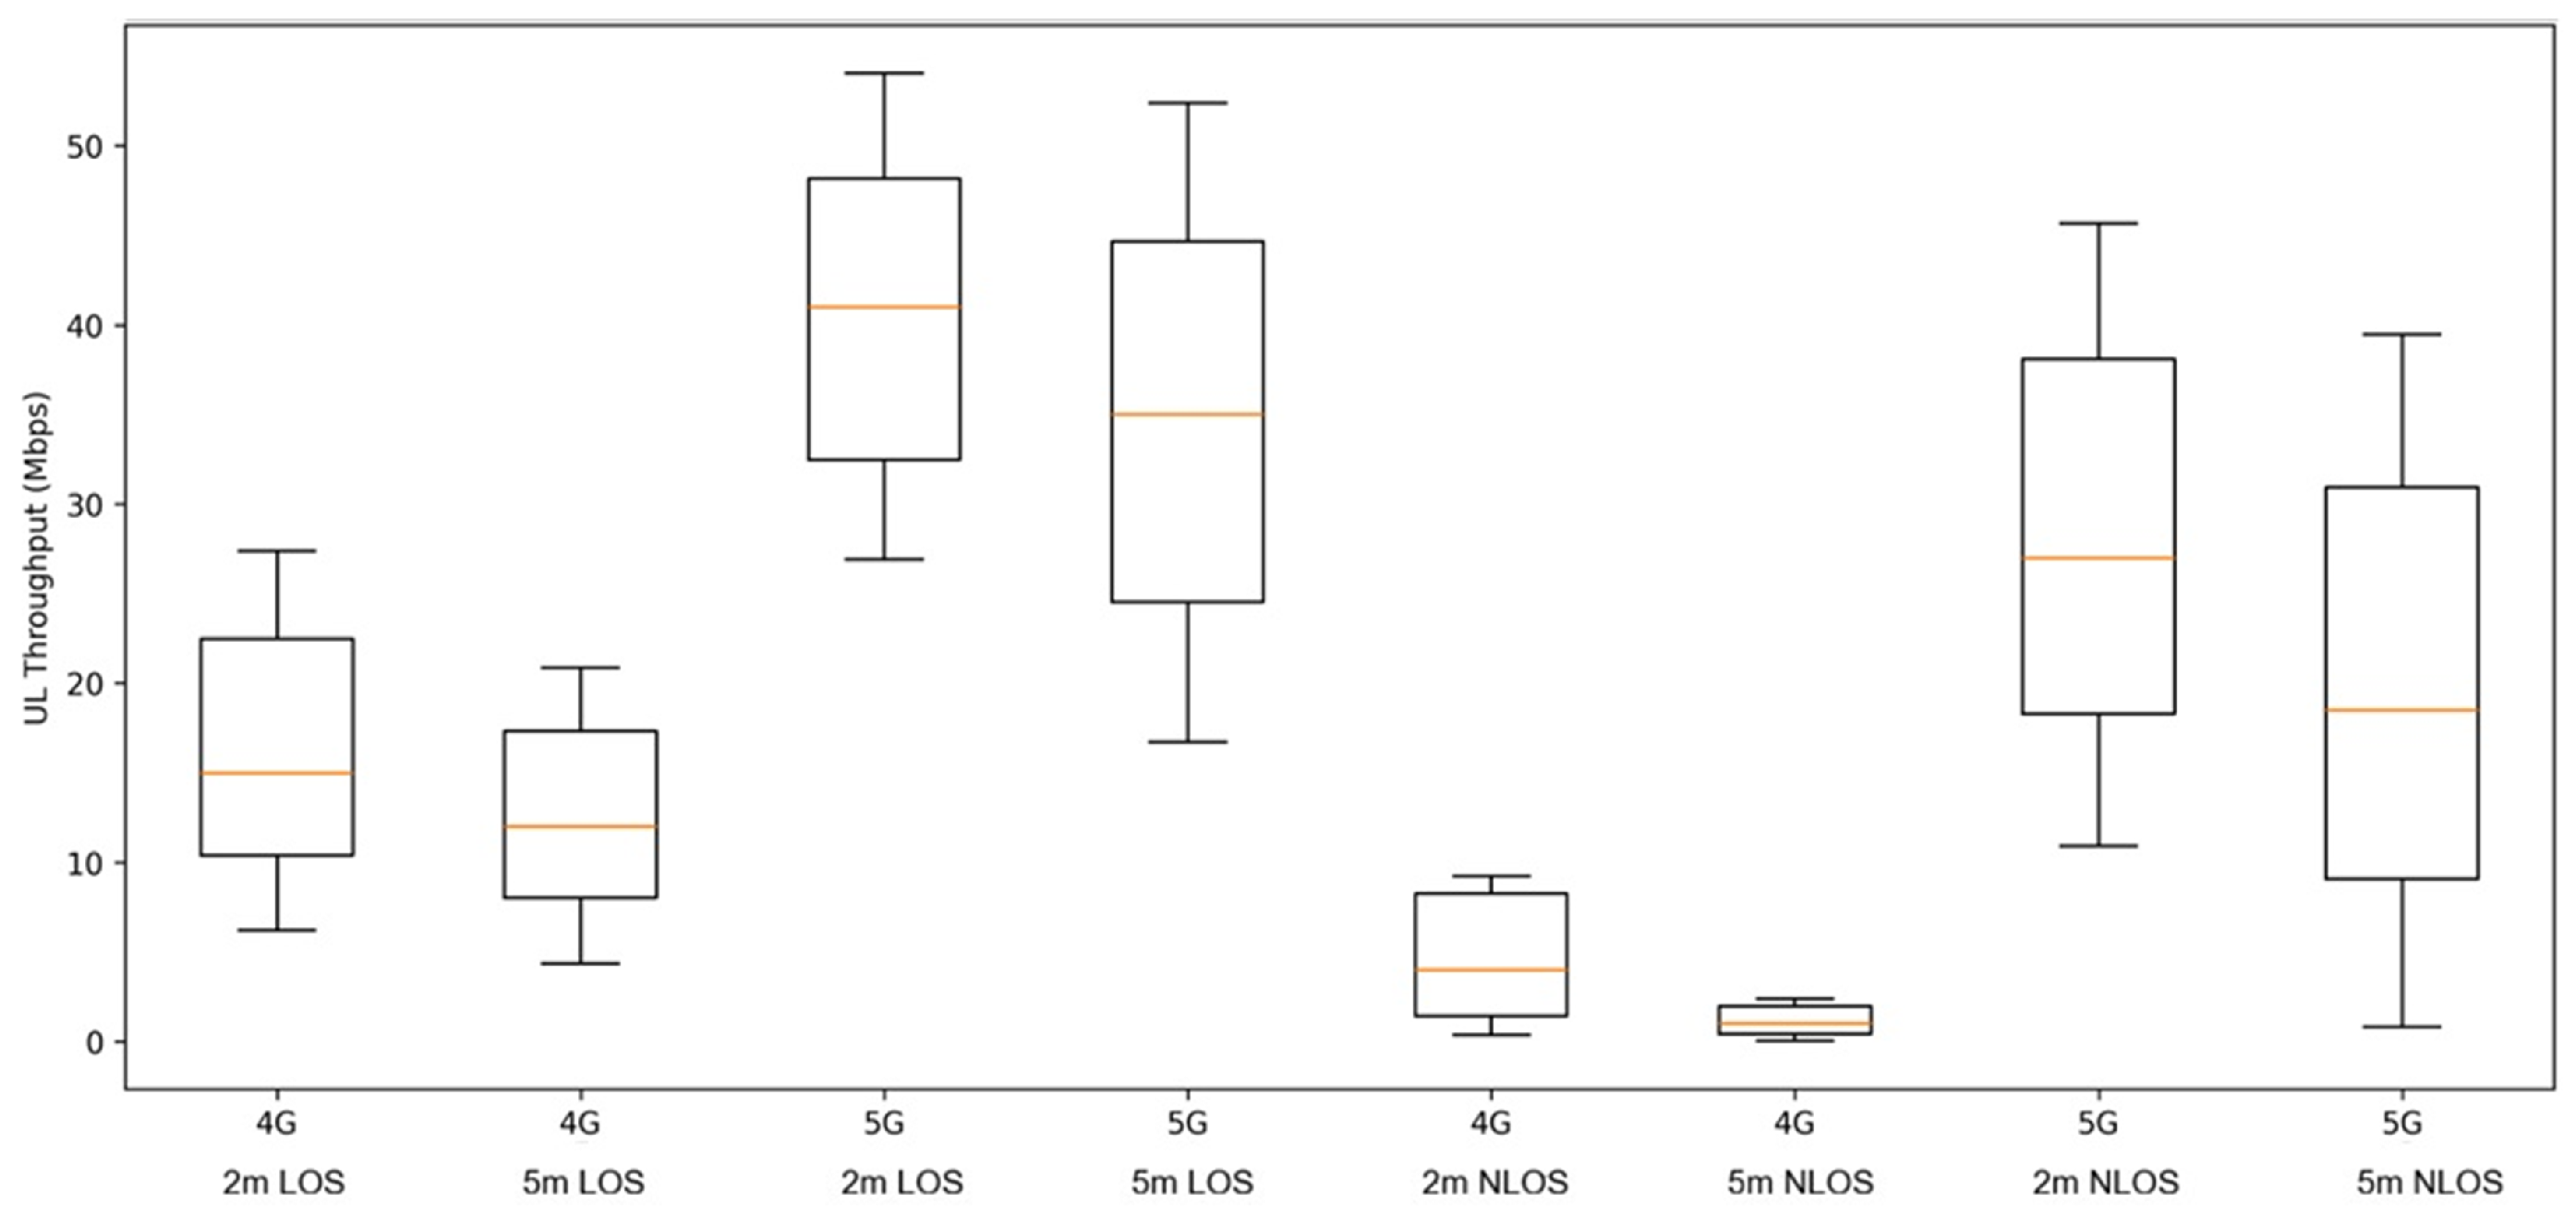
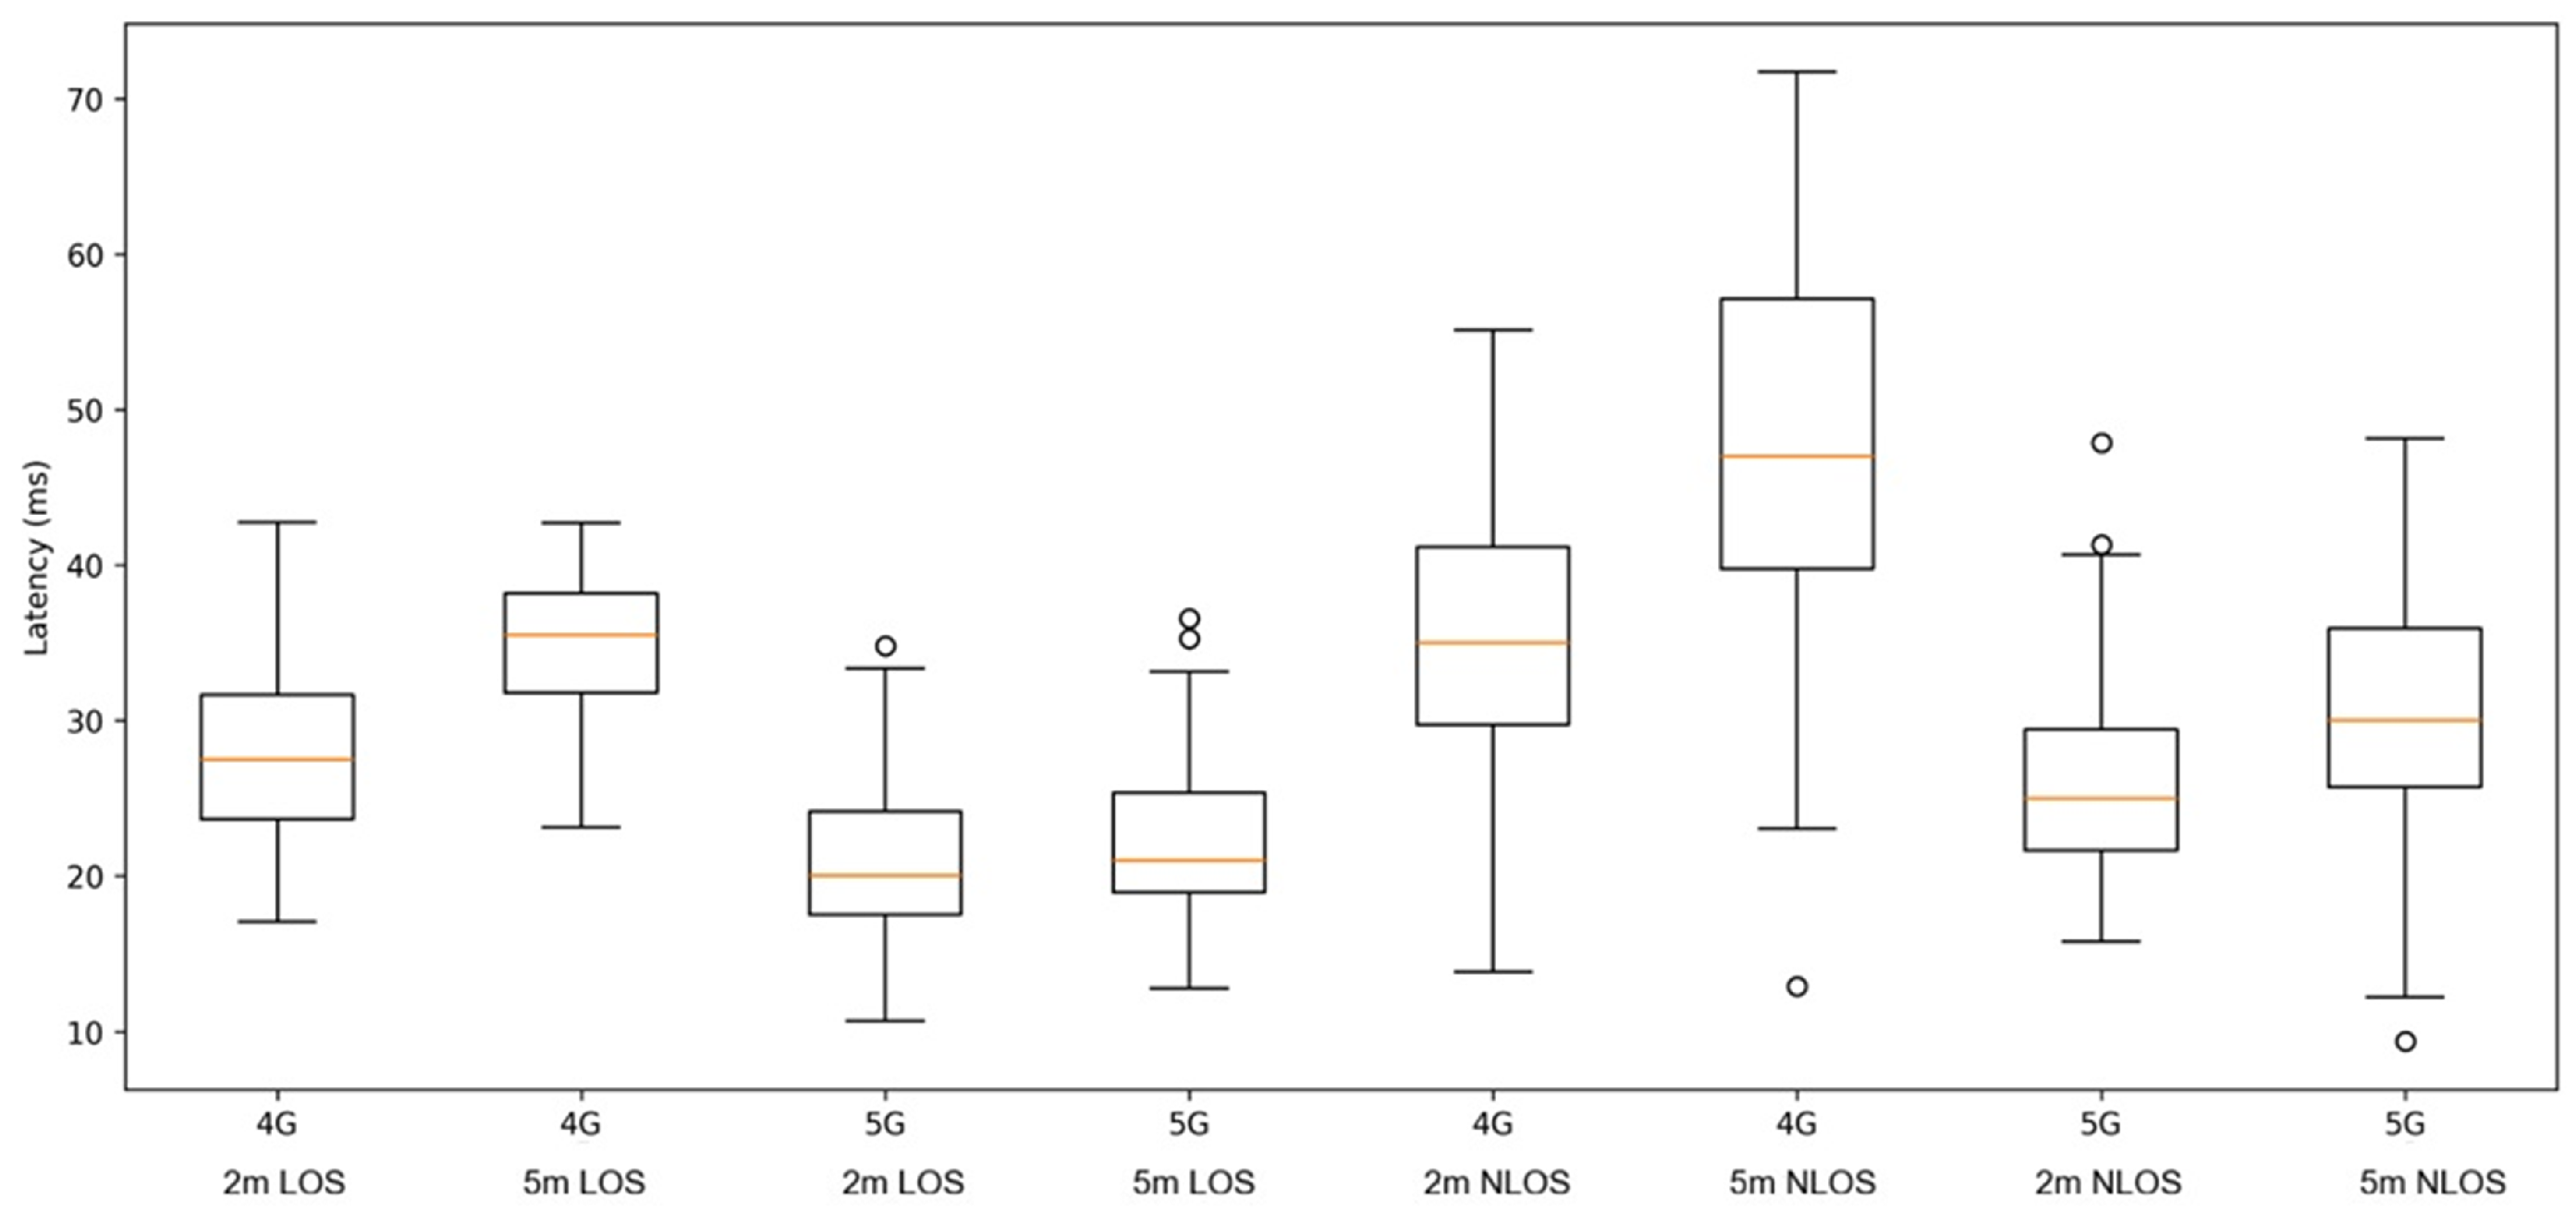
To complement the statistical summaries reported in
Table 10 and
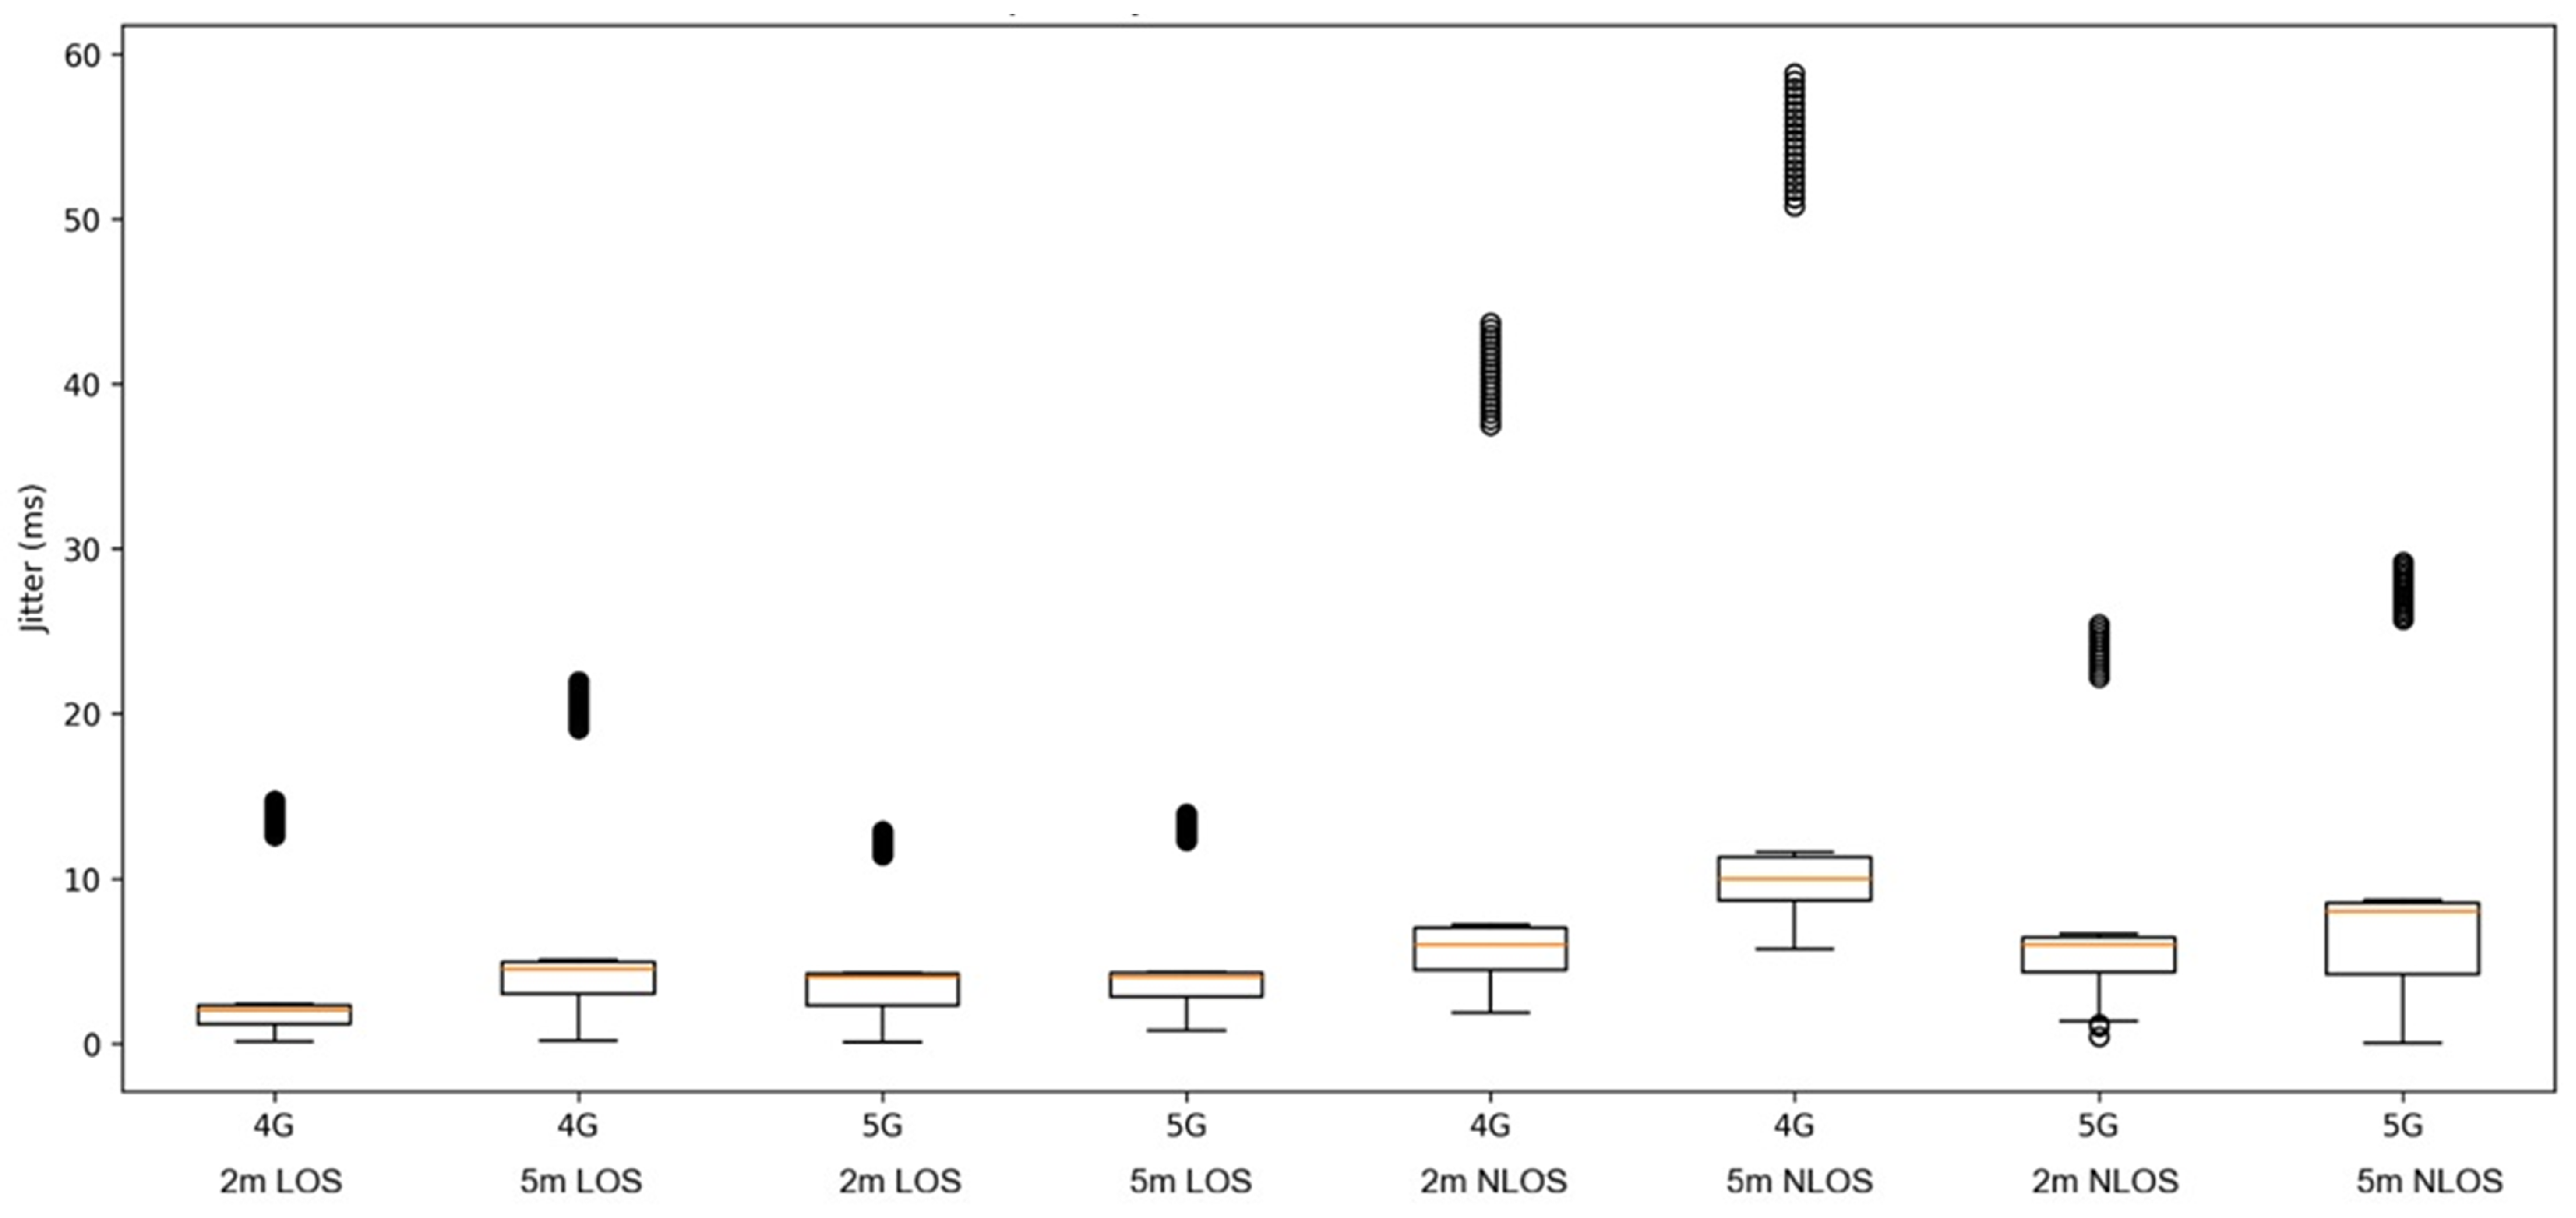
Table 11, boxplot visualizations are provided to illustrate the distribution, median, interquartile range, variability, and potential outliers of DL throughput, UL throughput, latency, and jitter across 4G and 5G SNPN deployments under LOS and NLOS conditions. These visualizations strengthen the statistical interpretation by showing that the performance differences are not only reflected in the mean values but also in the overall distribution and stability of the measured samples as shown in
Figure 10,
Figure 11,
Figure 12 and
Figure 13.
Figure 10.
Boxplot of DL throughput for 4G and 5G SNPN at 2 m and 5 m under LOS and NLOS conditions.
Figure 10.
Boxplot of DL throughput for 4G and 5G SNPN at 2 m and 5 m under LOS and NLOS conditions.
Boxplot of downlink (DL) throughput for 4G and 5G SNPN at 2 m and 5 m under LOS and NLOS conditions. The boxplots illustrate the distribution of the measured data, where the central line represents the median, the box denotes the interquartile range (IQR), the whiskers indicate the spread of the data, and the points beyond the whiskers represent outliers. It highlights the variation and comparative performance of DL throughput across radio generations, deployment distances, and propagation conditions.
Figure 11 shows the boxplot of uplink (UL) throughput for 4G and 5G SNPN at 2 m and 5 m under LOS and NLOS conditions. The boxplots present the median, interquartile range, overall spread, and outliers of the measured throughput values. It provides a visual comparison of uplink performance variability between 4G and 5G under different distance and propagation scenarios.
Figure 11.
Boxplot of UL throughput for 4G and 5G SNPN at 2 m and 5 m under LOS and NLOS conditions.
Figure 11.
Boxplot of UL throughput for 4G and 5G SNPN at 2 m and 5 m under LOS and NLOS conditions.
Figure 12.
Boxplot of latency for 4G and 5G SNPN at 2 m and 5 m under LOS and NLOS conditions.
Figure 12.
Boxplot of latency for 4G and 5G SNPN at 2 m and 5 m under LOS and NLOS conditions.
Figure 12 shows the boxplot of latency for 4G and 5G SNPN at 2 m and 5 m under LOS and NLOS conditions. The distribution of latency values is shown in terms of median, interquartile range, whiskers, and outliers. It demonstrates the comparative delay characteristics and the stability of the network response across different radio generations and channel conditions.
Figure 13.
Boxplot of jitter for 4G and 5G SNPN at 2 m and 5 m under LOS and NLOS conditions.
Figure 13.
Boxplot of jitter for 4G and 5G SNPN at 2 m and 5 m under LOS and NLOS conditions.
Figure 13 shows the boxplot of jitter for 4G and 5G SNPN at 2 m and 5 m under LOS and NLOS conditions. The boxplots depict the median, interquartile range, data spread, and outliers, thereby illustrating the variation in packet delay fluctuation under different deployment scenarios. It is useful for evaluating transmission stability and service consistency in SDR-based SNPN performance.
5.3. Fuzzy Logic-Based NQI Evaluation Dashboard
The NQI framework enables automated service-level agreement (SLA) compliance monitoring by defining quality thresholds and triggering alerts when performance degrades.
Table 13 proposes an NQI-based SLA monitoring framework. The table can be used to monitor the quality of networks. The proposed NQI is implemented as a real-time KPI-driven fuzzy evaluation mechanism. The Python-based FIS continuously receives updated SINR, throughput, latency, and jitter values from the measurement process. Any variation in these KPIs changes the membership degrees of the input variables and modifies the activation strength of the fuzzy rules. Consequently, the centroid defuzzification process produces an updated NQI value that reflects the current network condition. This allows the NQI to dynamically respond to interference fluctuations and traffic load variations without requiring manual modification of the rule base.
In the current implementation, the Python-based FIS dynamically processes actual measurement data, including SINR, throughput, latency, and jitter. When these KPI values change, the corresponding membership degrees and rule activation strengths are automatically recalculated, resulting in an updated NQI value. The membership function domains are identified from the observed KPI ranges, while further adaptive adjustment of membership boundaries or rule weights can be implemented using moving-window KPI statistics to better reflect dynamic network conditions.
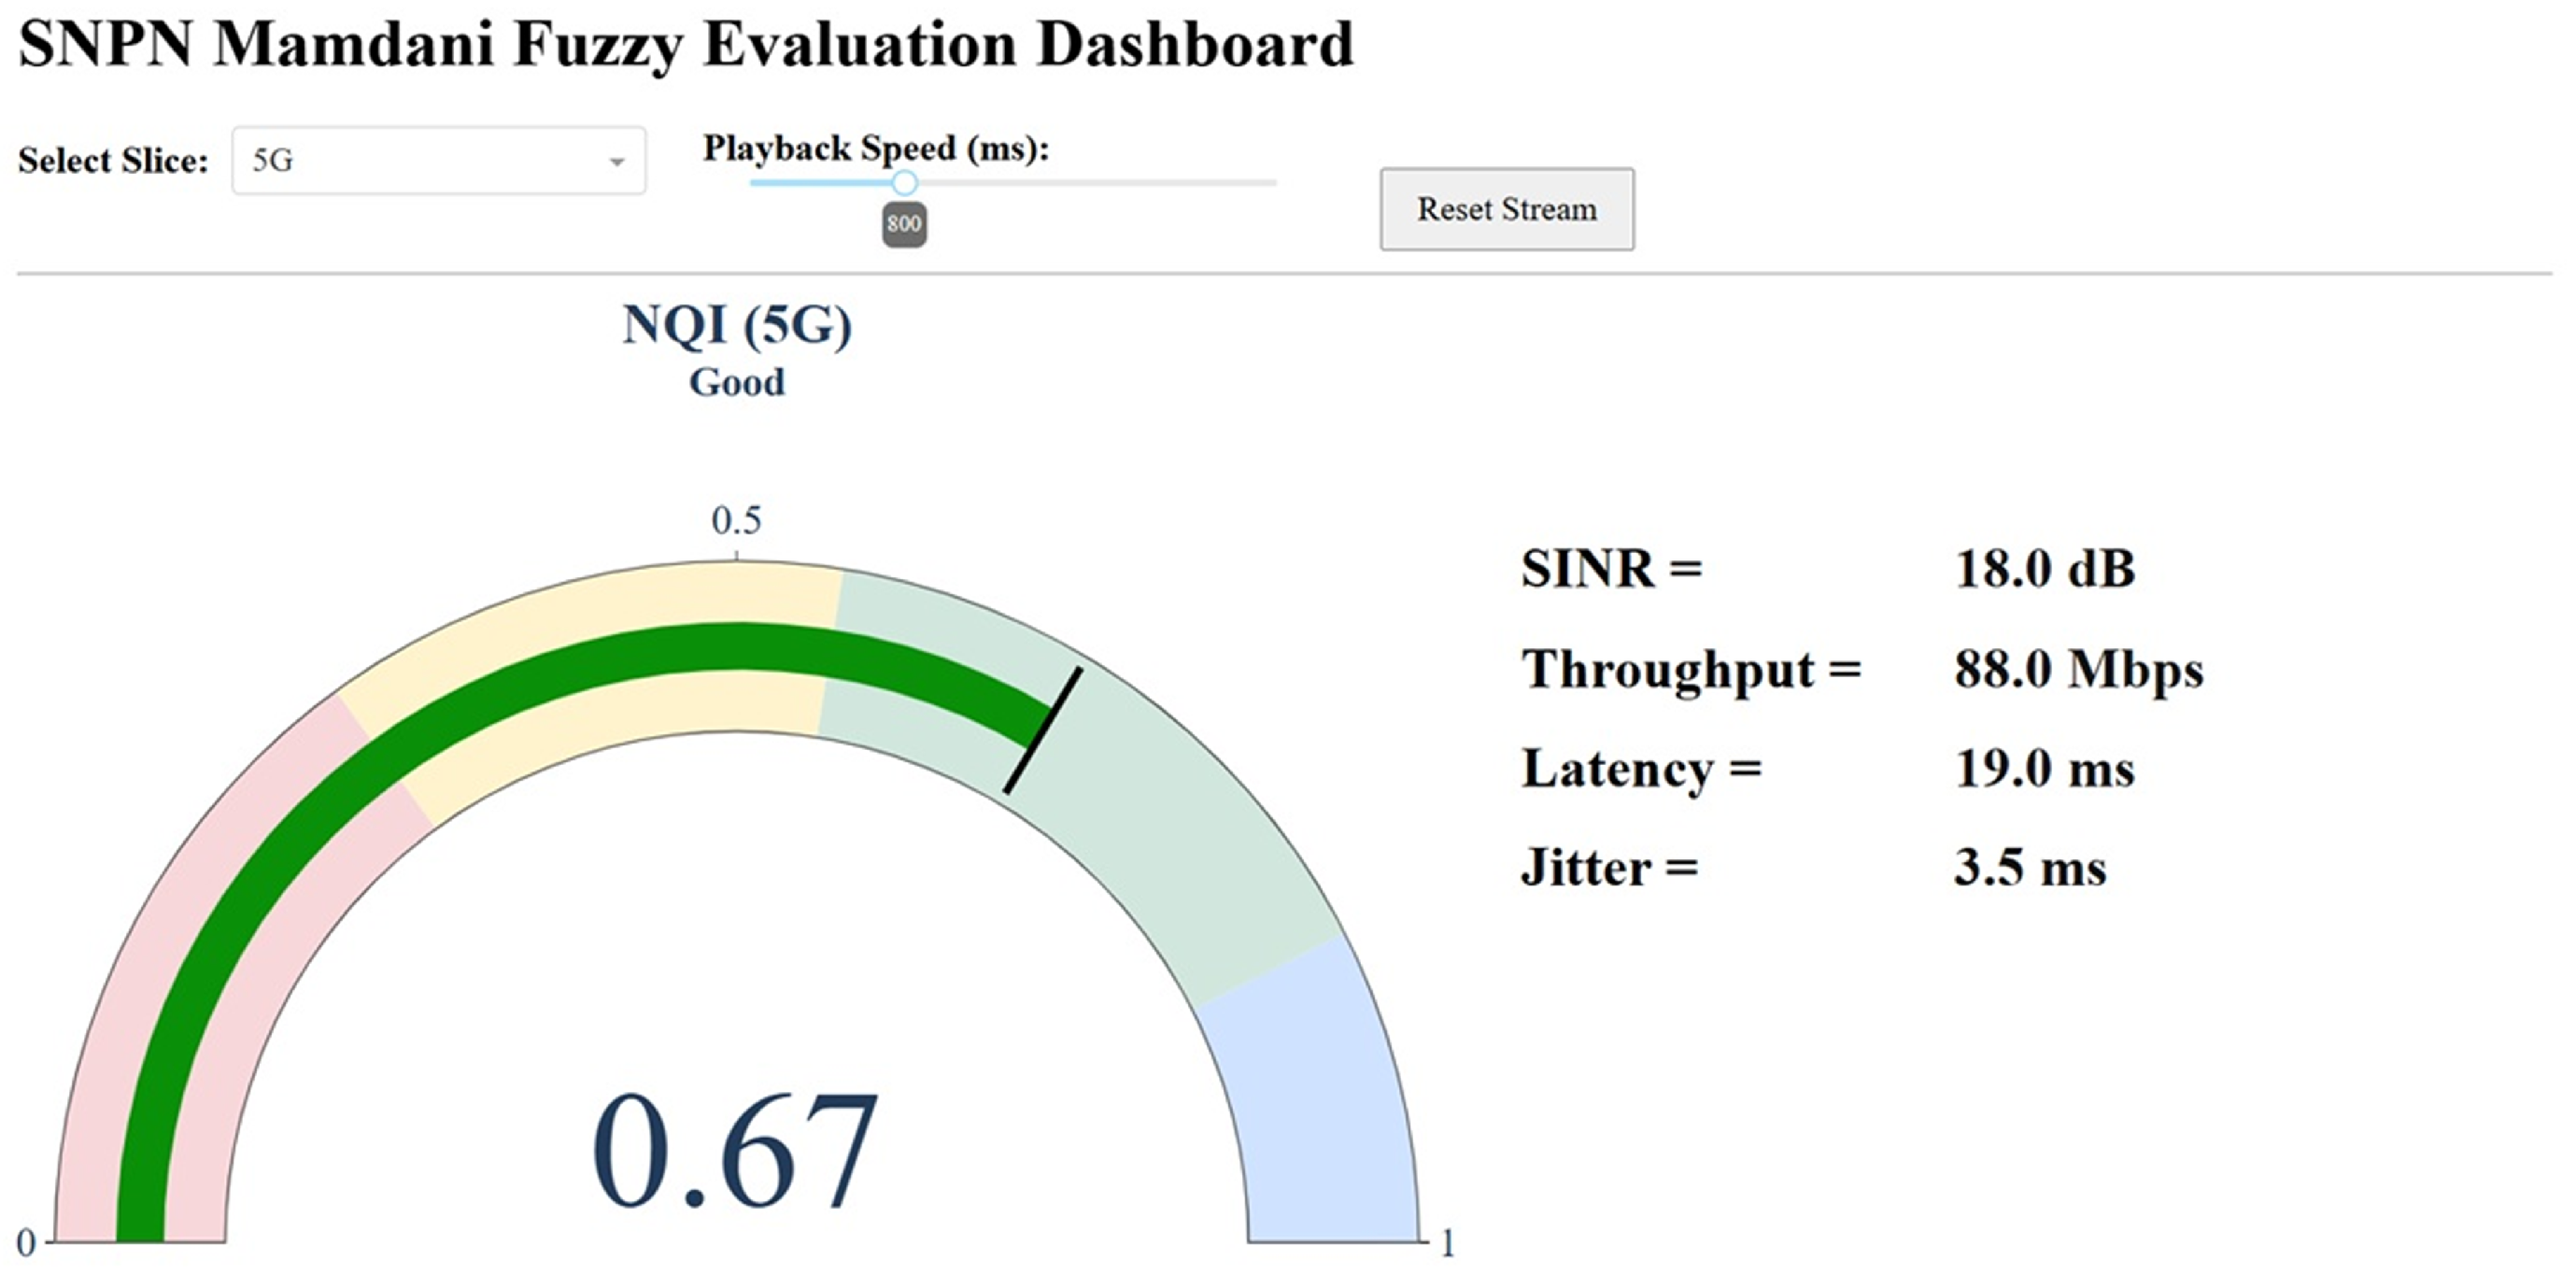
The Mamdani fuzzy evaluation dashboard classifies the 5G SNPN condition as Good with an NQI value of 0.67, as shown in
Figure 14. This result is primarily associated with rule R31, which corresponds to a Medium SINR condition combined with High throughput, Medium latency, and Low jitter. The measured SINR of 18 dB indicates relatively stable radio quality within the Medium membership region, while the achieved throughput of 88 Mbps falls into the High throughput category, demonstrating efficient data delivery capability. In addition, the latency of 19 ms is interpreted within the Medium region due to the overlapping membership functions, whereas the jitter value of 3.5 ms remains in the Low category, indicating stable packet arrival behavior. Collectively, these KPI conditions produce a balanced network performance profile suitable for high-capacity and moderately delay-sensitive applications. The resulting NQI demonstrates that strong throughput and low jitter can compensate for moderate radio and latency conditions, allowing the network to maintain a Good overall quality classification.
An essential requirement for enhanced Mobile Broadband (eMBB), real-time video, and industrial IoT applications. The network needs to support demanding applications including high definition (HD) video streaming (requires >5 Mbps, <50 ms latency), augmented reality (requires >25 Mbps, <30 ms latency), and real-time industrial IoT (requires <50 ms latency, <10 ms jitter) [
32]. SLA compliance needs to be ensured as the 5G SNPN satisfies the minimum quality thresholds defined in the agreements while maintaining sufficient margin under multi-user load and interference [
33,
34,
35,
36,
37,
38,
39].
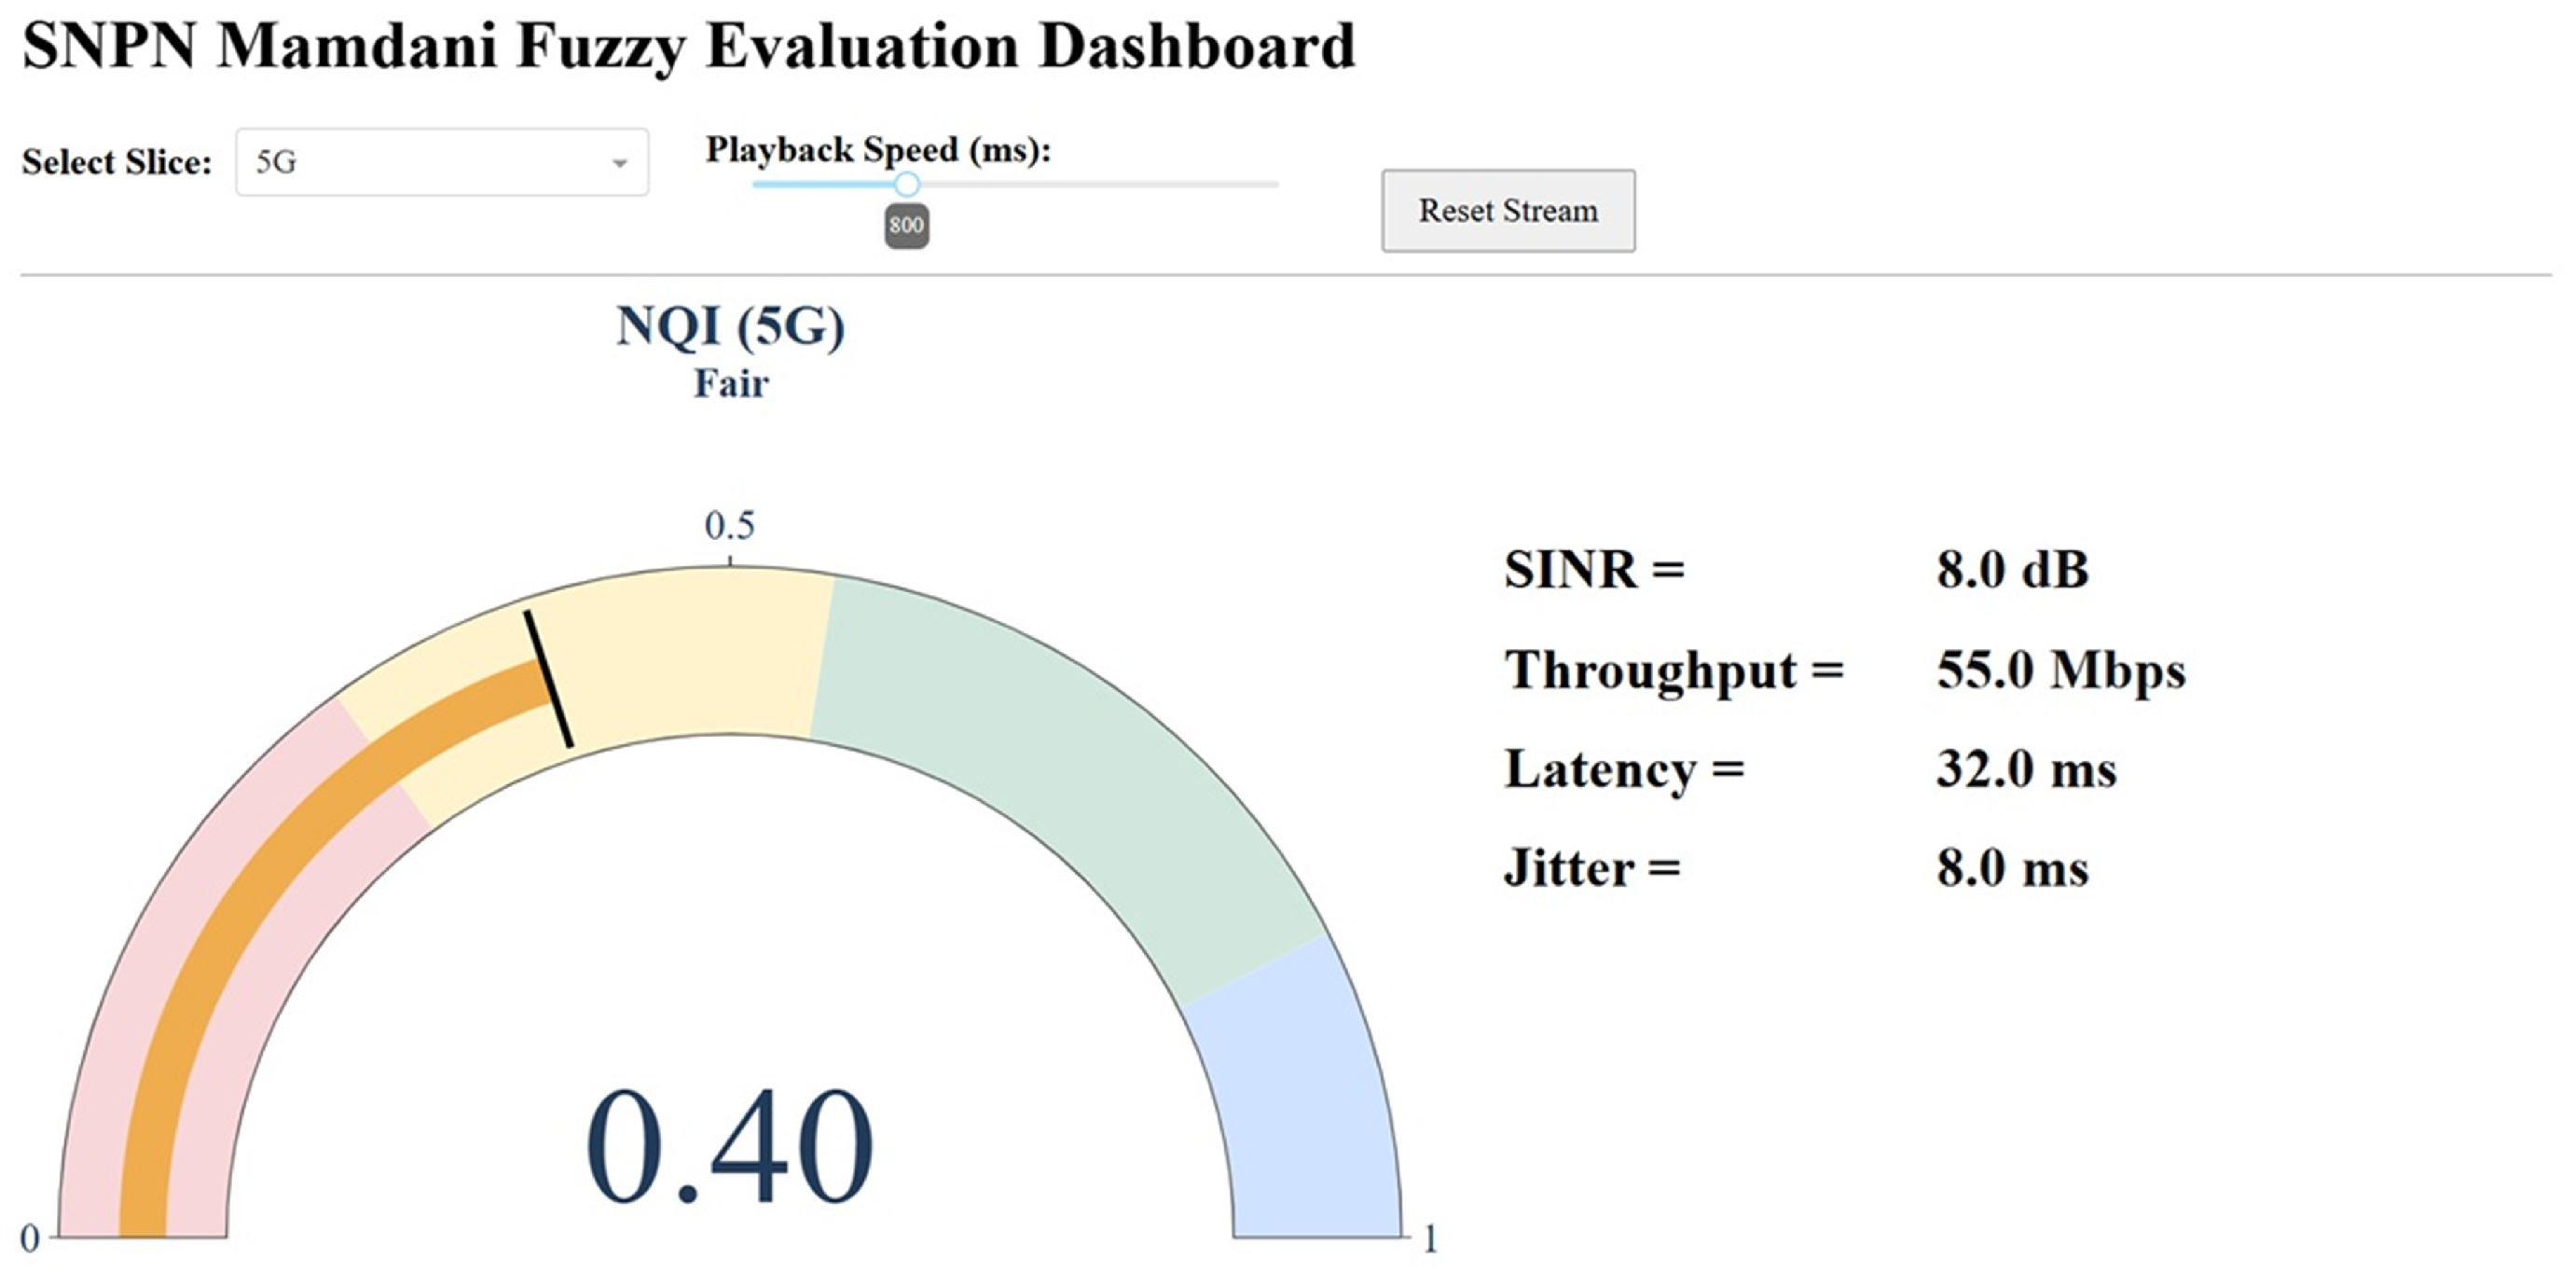
Figure 15 presents the 5G SNPN condition classified as Fair with an NQI value of 0.40. This condition corresponds to rule R40, where all KPI variables are evaluated within the Medium linguistic category. The measured SINR of 8 dB represents moderate radio link quality, while the throughput of 55 Mbps indicates medium network capacity under the defined fuzzy membership functions. Furthermore, the latency of 32 ms is categorized as Medium and jitter of 8 ms is categorized as Low, reflecting moderate delay performance and packet timing variation. Although the network remains operational and capable of supporting common communication services, the simultaneous presence of medium conditions in all KPIs reduces the resulting NQI compared to the Good scenario. This result demonstrates that moderate performance across multiple KPIs does not necessarily translate into high user experience quality, emphasizing the importance of unified KPI evaluation through fuzzy inference rather than relying on a single dominant metric.
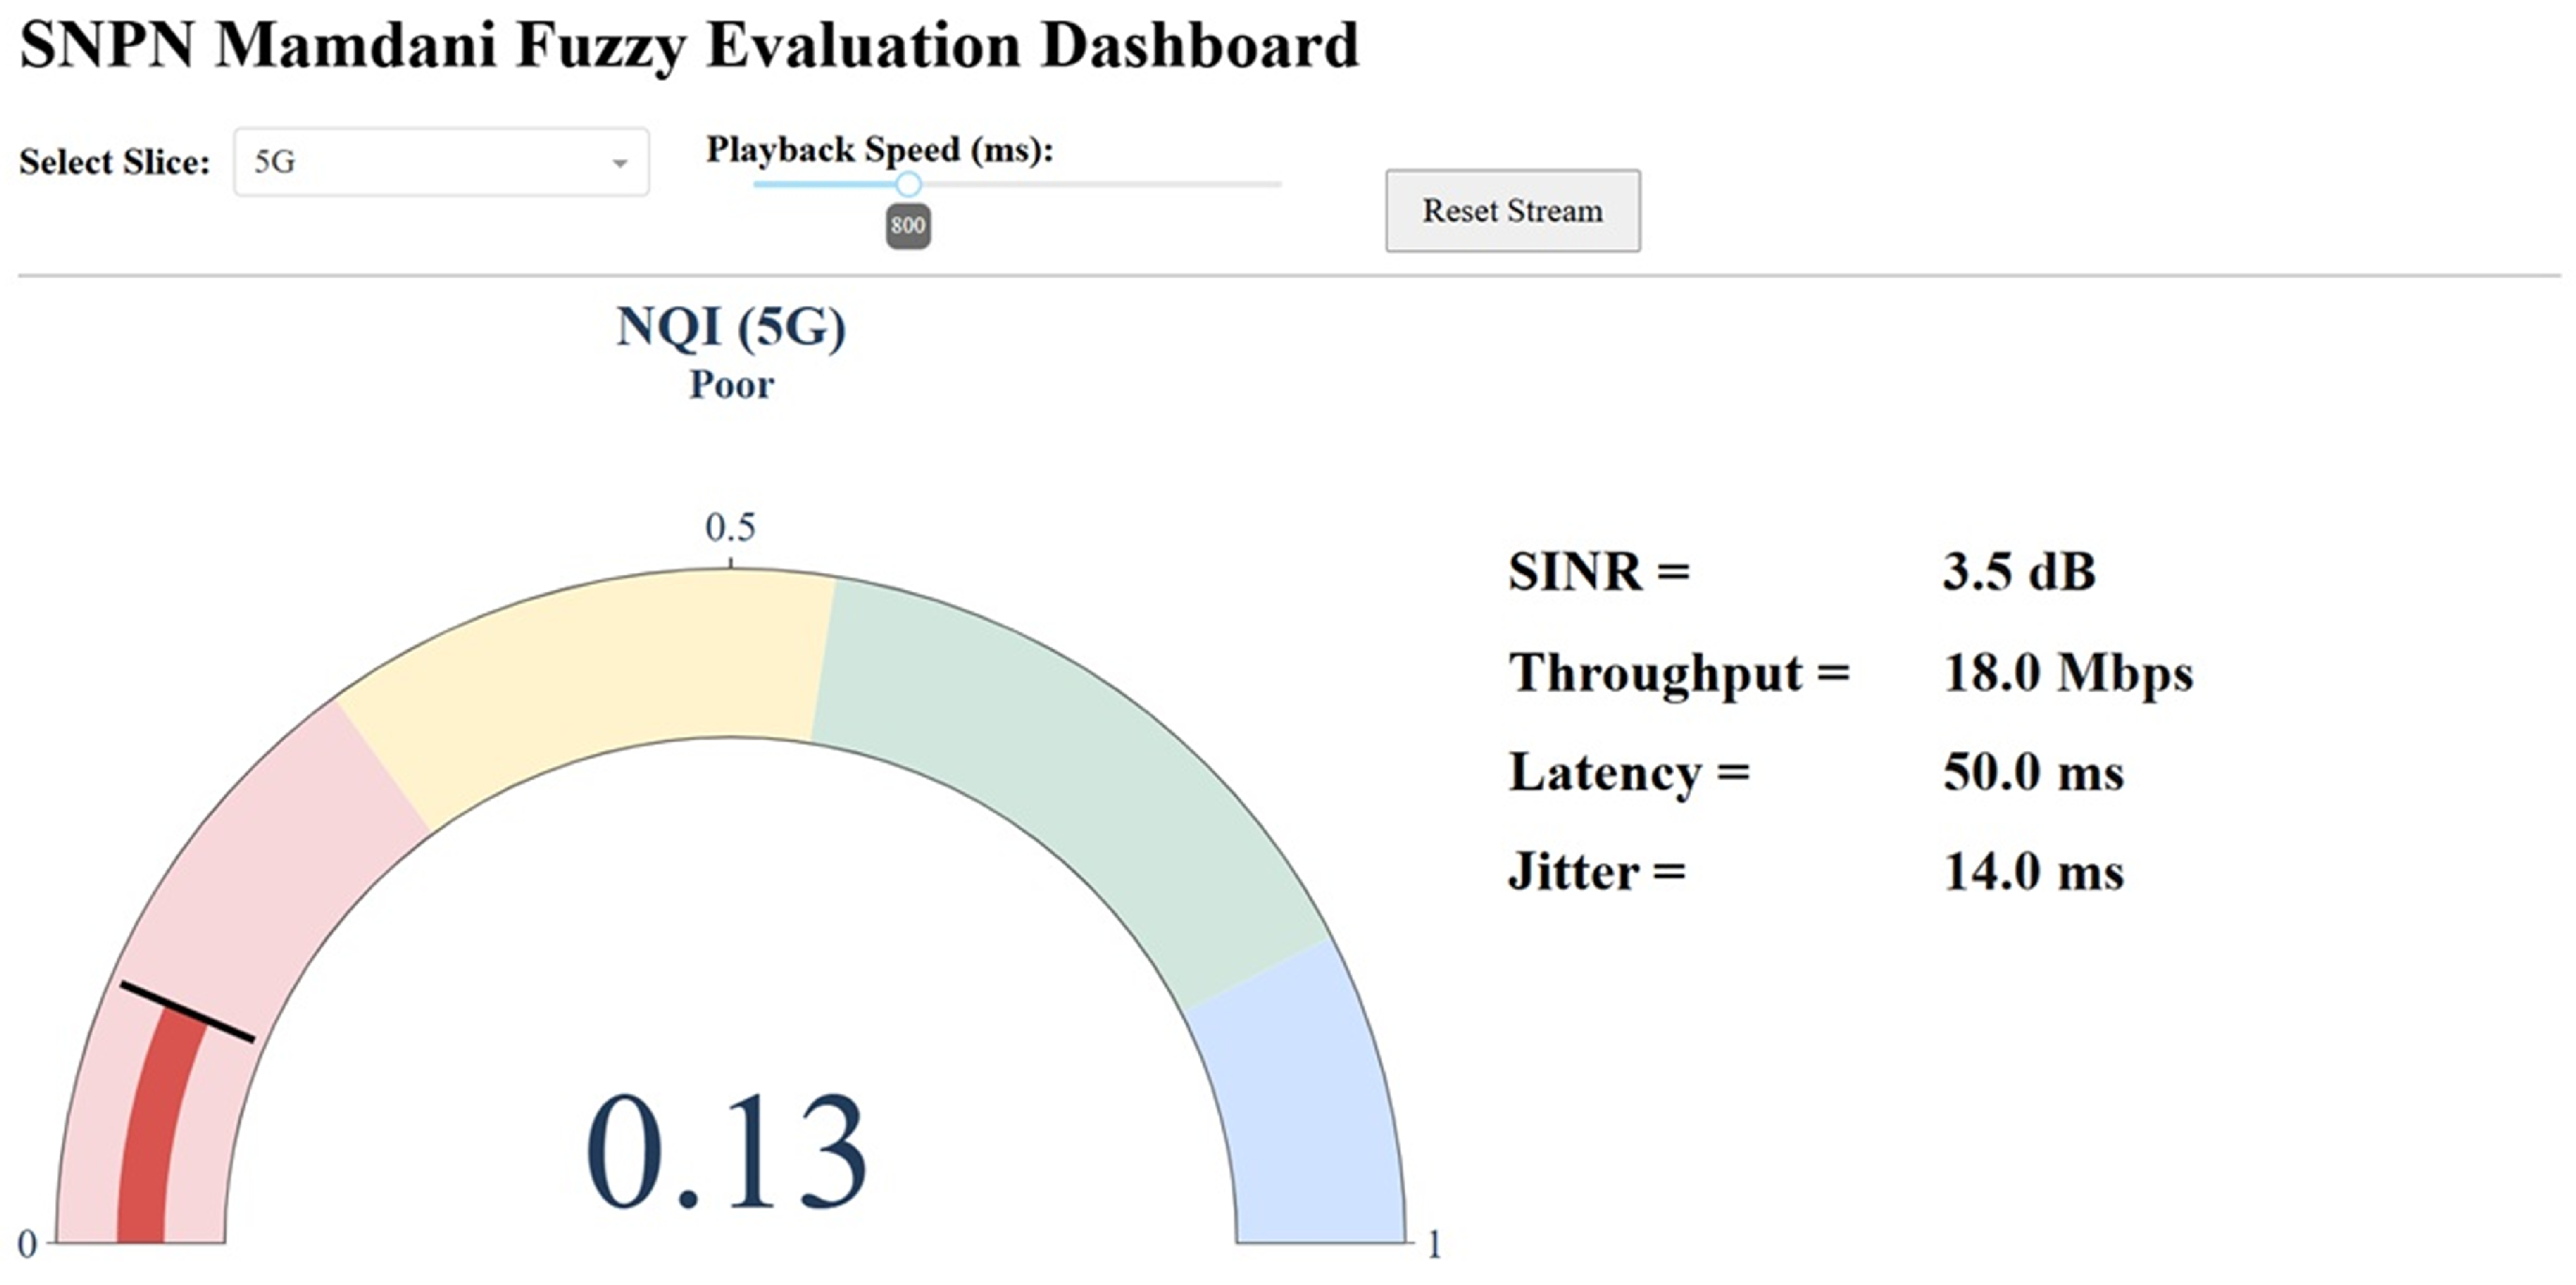
The Mamdani fuzzy evaluation dashboard classifies the 5G SNPN condition in
Figure 16 as
Poor with an NQI value of 0.13. This result corresponds to rule R77, which represents the worst-case combination of Low SINR, Low throughput, Medium latency, and Medium jitter. The measured SINR of 3.5 dB indicates weak radio signal quality and limited link reliability, while the throughput of 18 Mbps falls into the Low throughput category, reflecting constrained network capacity. In addition, the latency of 50 ms and jitter of 14 ms are categorized within the medium region, indicating substantial transmission delay and unstable packet arrival intervals. These combined impairments significantly degrade the overall network quality assessment, resulting in a very low NQI value. The Poor classification highlights the inability of the network to reliably support bandwidth-intensive or delay-sensitive applications under degraded radio and QoS conditions. This scenario further demonstrates the effectiveness of the proposed Mamdani FIS in capturing compound network degradation effects through multi-KPI aggregation.
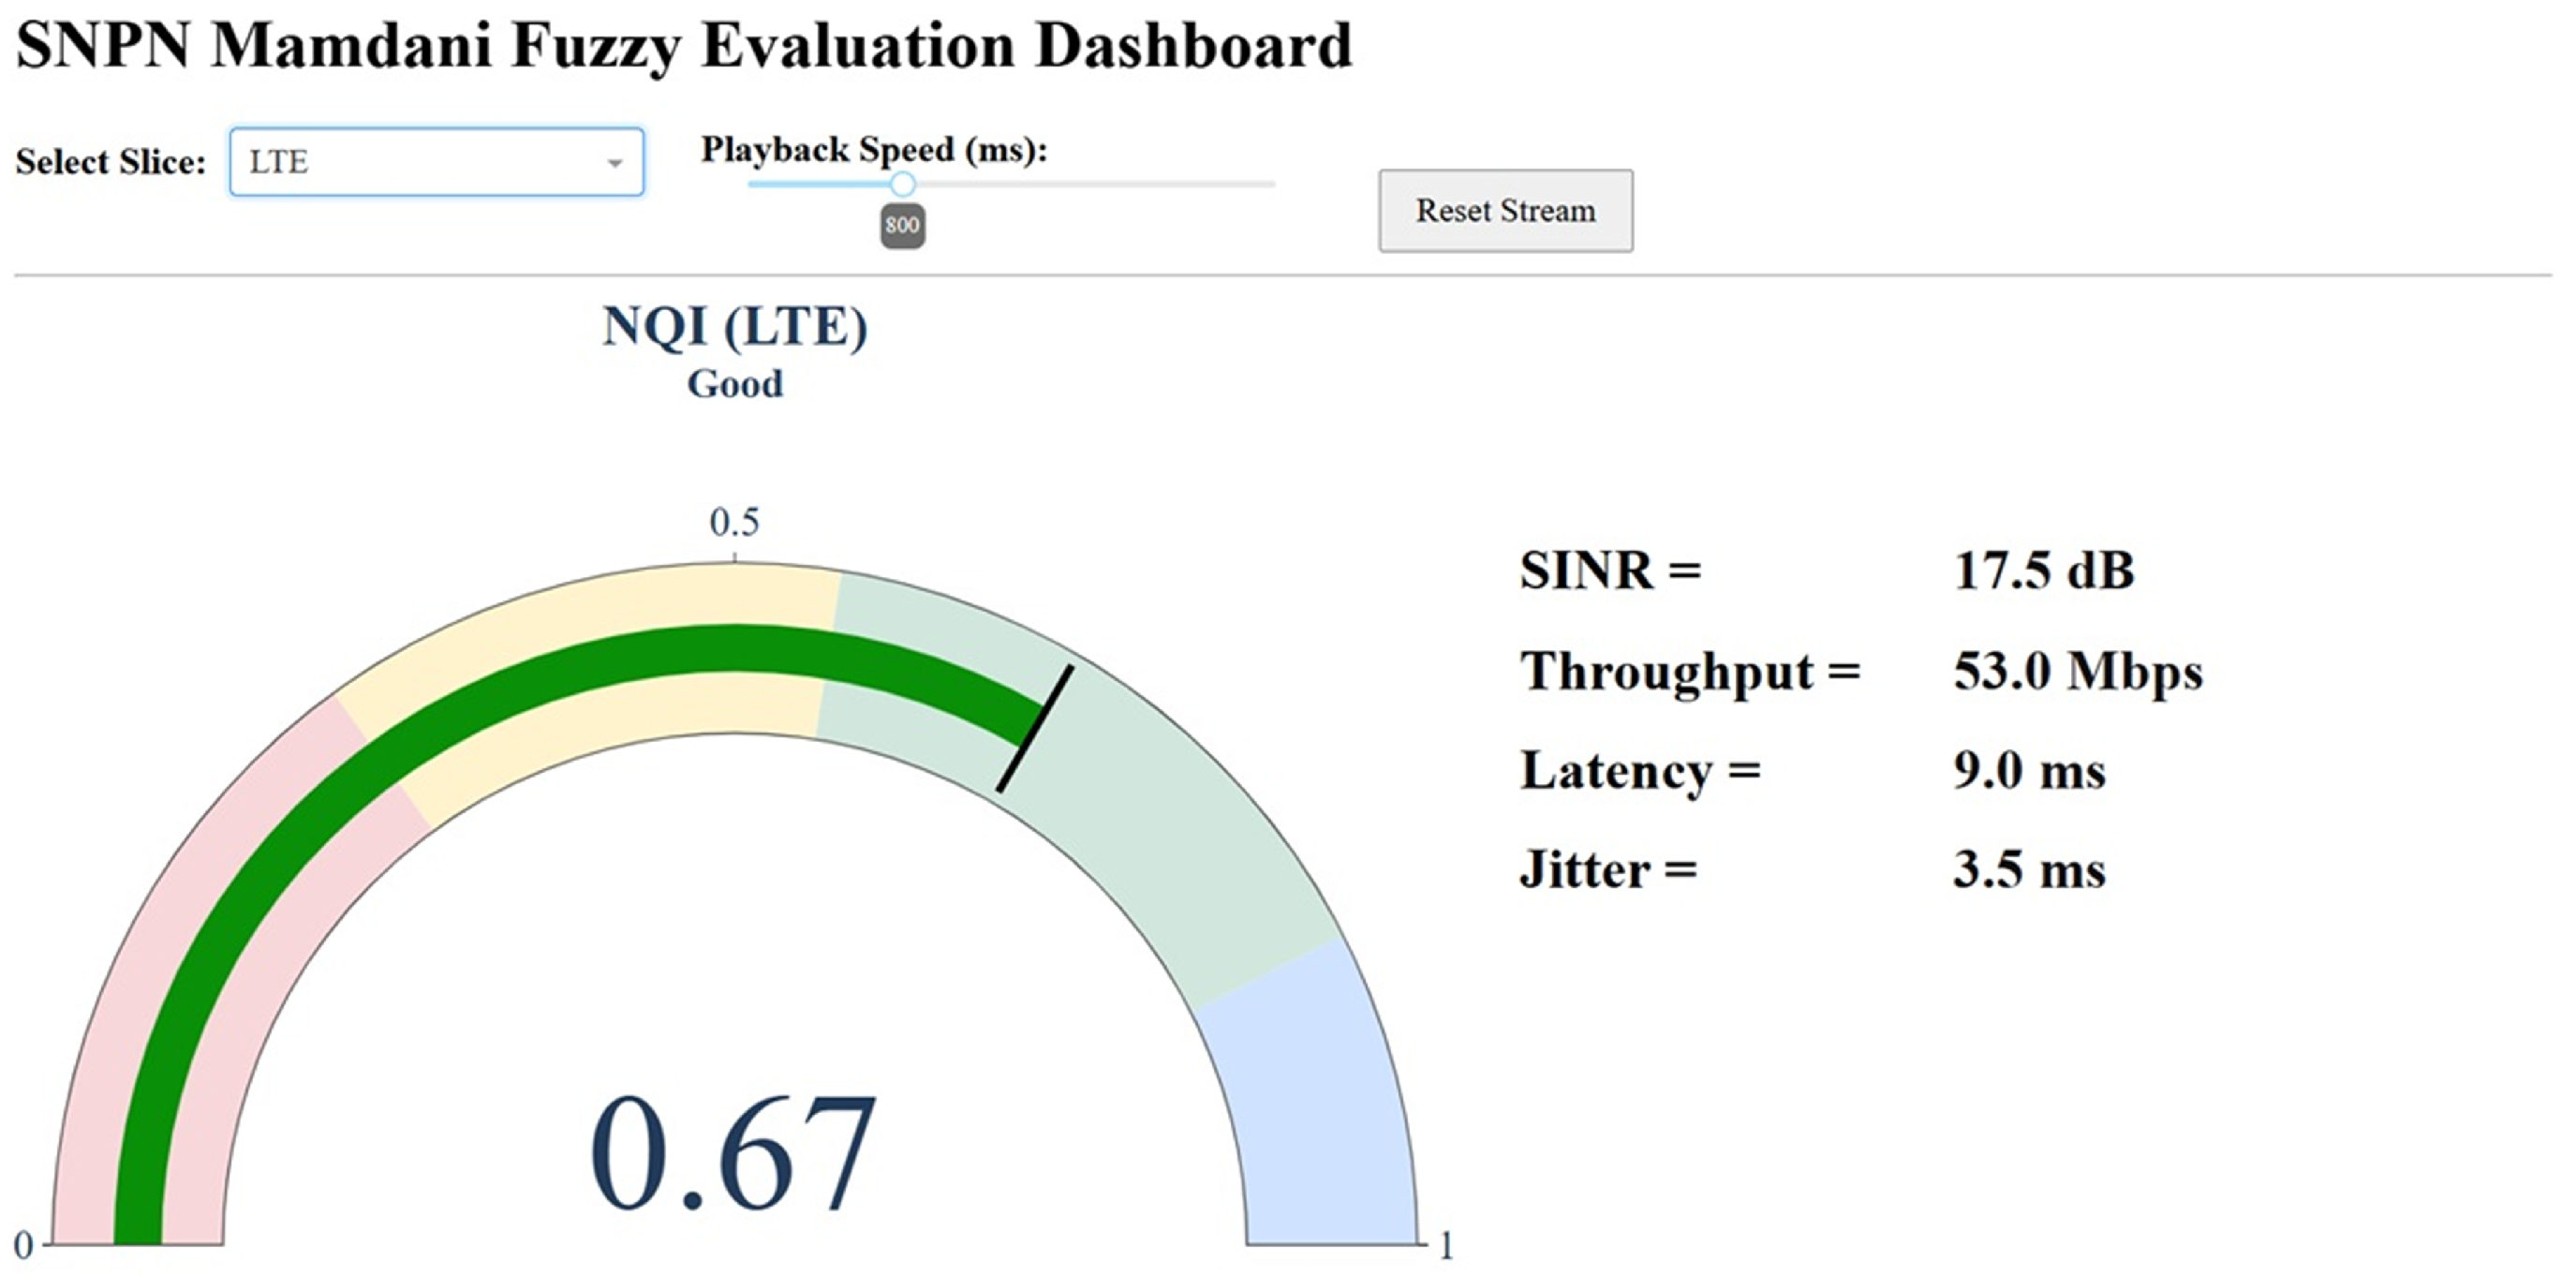
The Mamdani fuzzy evaluation dashboard classifies the 4G LTE SNPN condition as Good with an NQI value of 0.67, as illustrated in
Figure 17. This condition corresponds to rule R37, where the KPI combination consists of Medium SINR, Medium throughput, Low latency, and Low jitter. The measured SINR of 17.5 dB indicates relatively stable radio quality within the medium membership region, while the throughput of 53 Mbps reflects sufficient network capacity for typical enterprise and multimedia services. Furthermore, the latency of 9 ms and jitter of 3.5 ms are both categorized within the Low region, indicating a fast response time and stable packet delivery. Although the throughput is not categorized as High, the low delay-related KPIs significantly improve the overall network quality assessment. As a result, the Mamdani FIS produces a Good NQI classification, demonstrating that balanced radio performance combined with low latency and jitter can provide satisfactory user experience in LTE-based private networks.
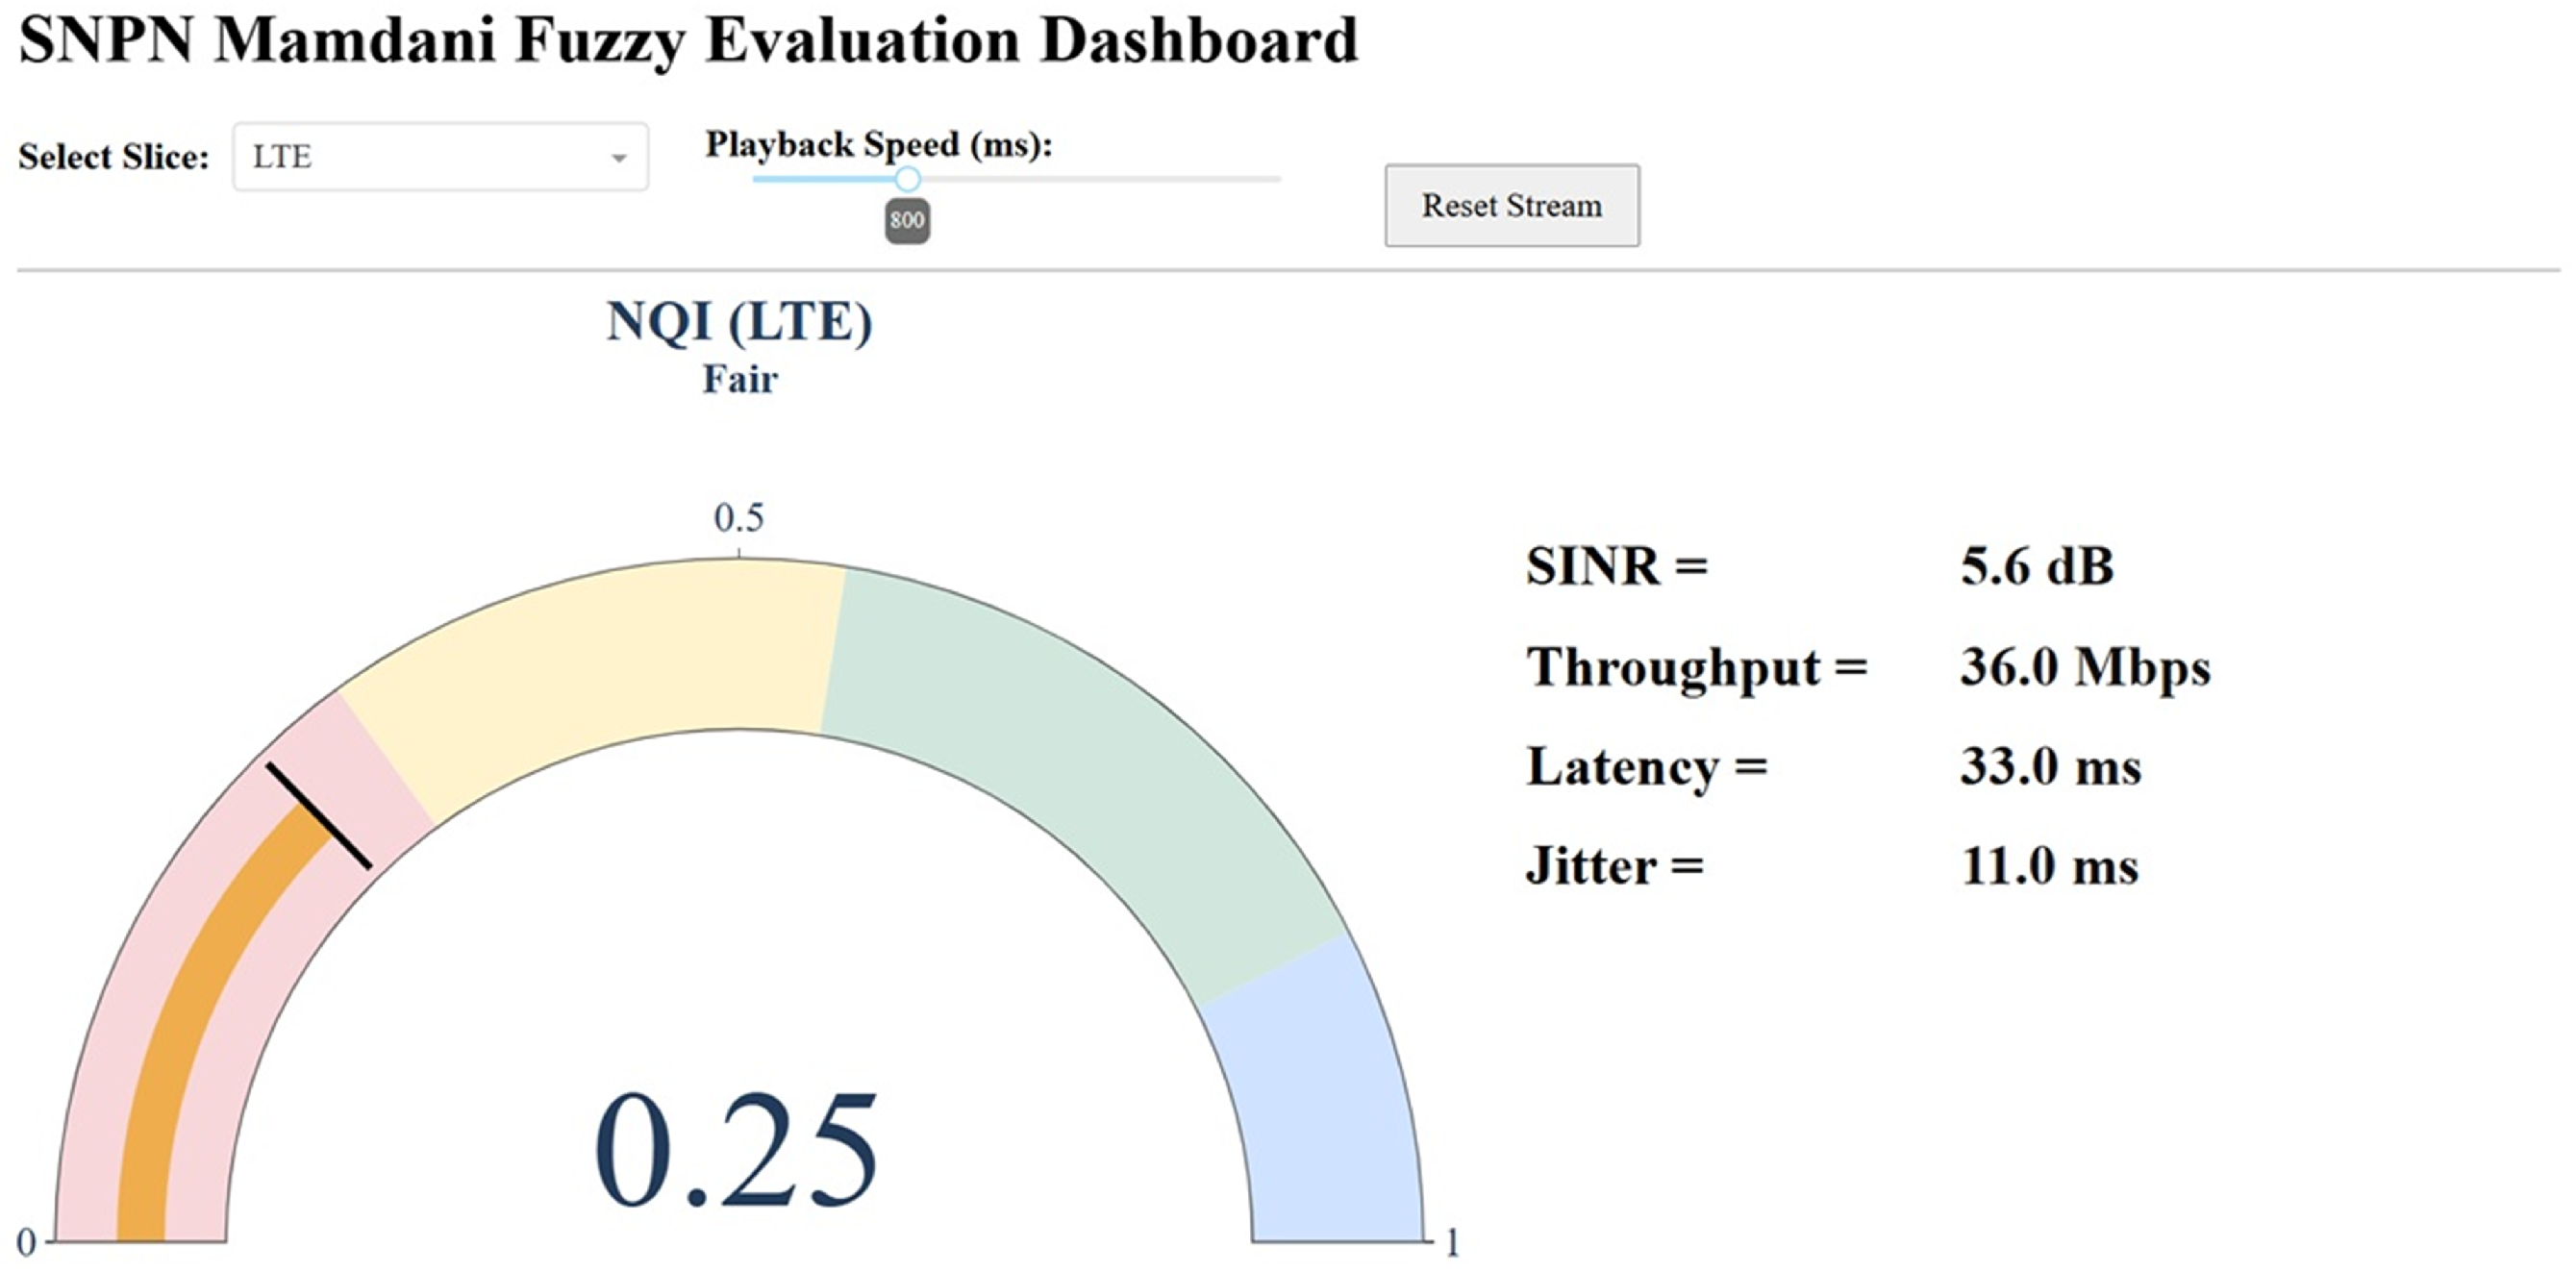
Figure 18 presents the 4G LTE SNPN operating condition classified as Poor with an NQI value of 0.25. This result corresponds to rule R68, which consists of Low SINR, Medium throughput, Medium latency, and Medium jitter conditions. The measured SINR of 5.6 dB indicates low radio quality, while the throughput of 36 Mbps remains within the Medium category. In addition, the latency of 33 ms and jitter of 11 ms are categorized as Medium. These KPI conditions collectively produce a Poor quality assessment because the network performance is low.
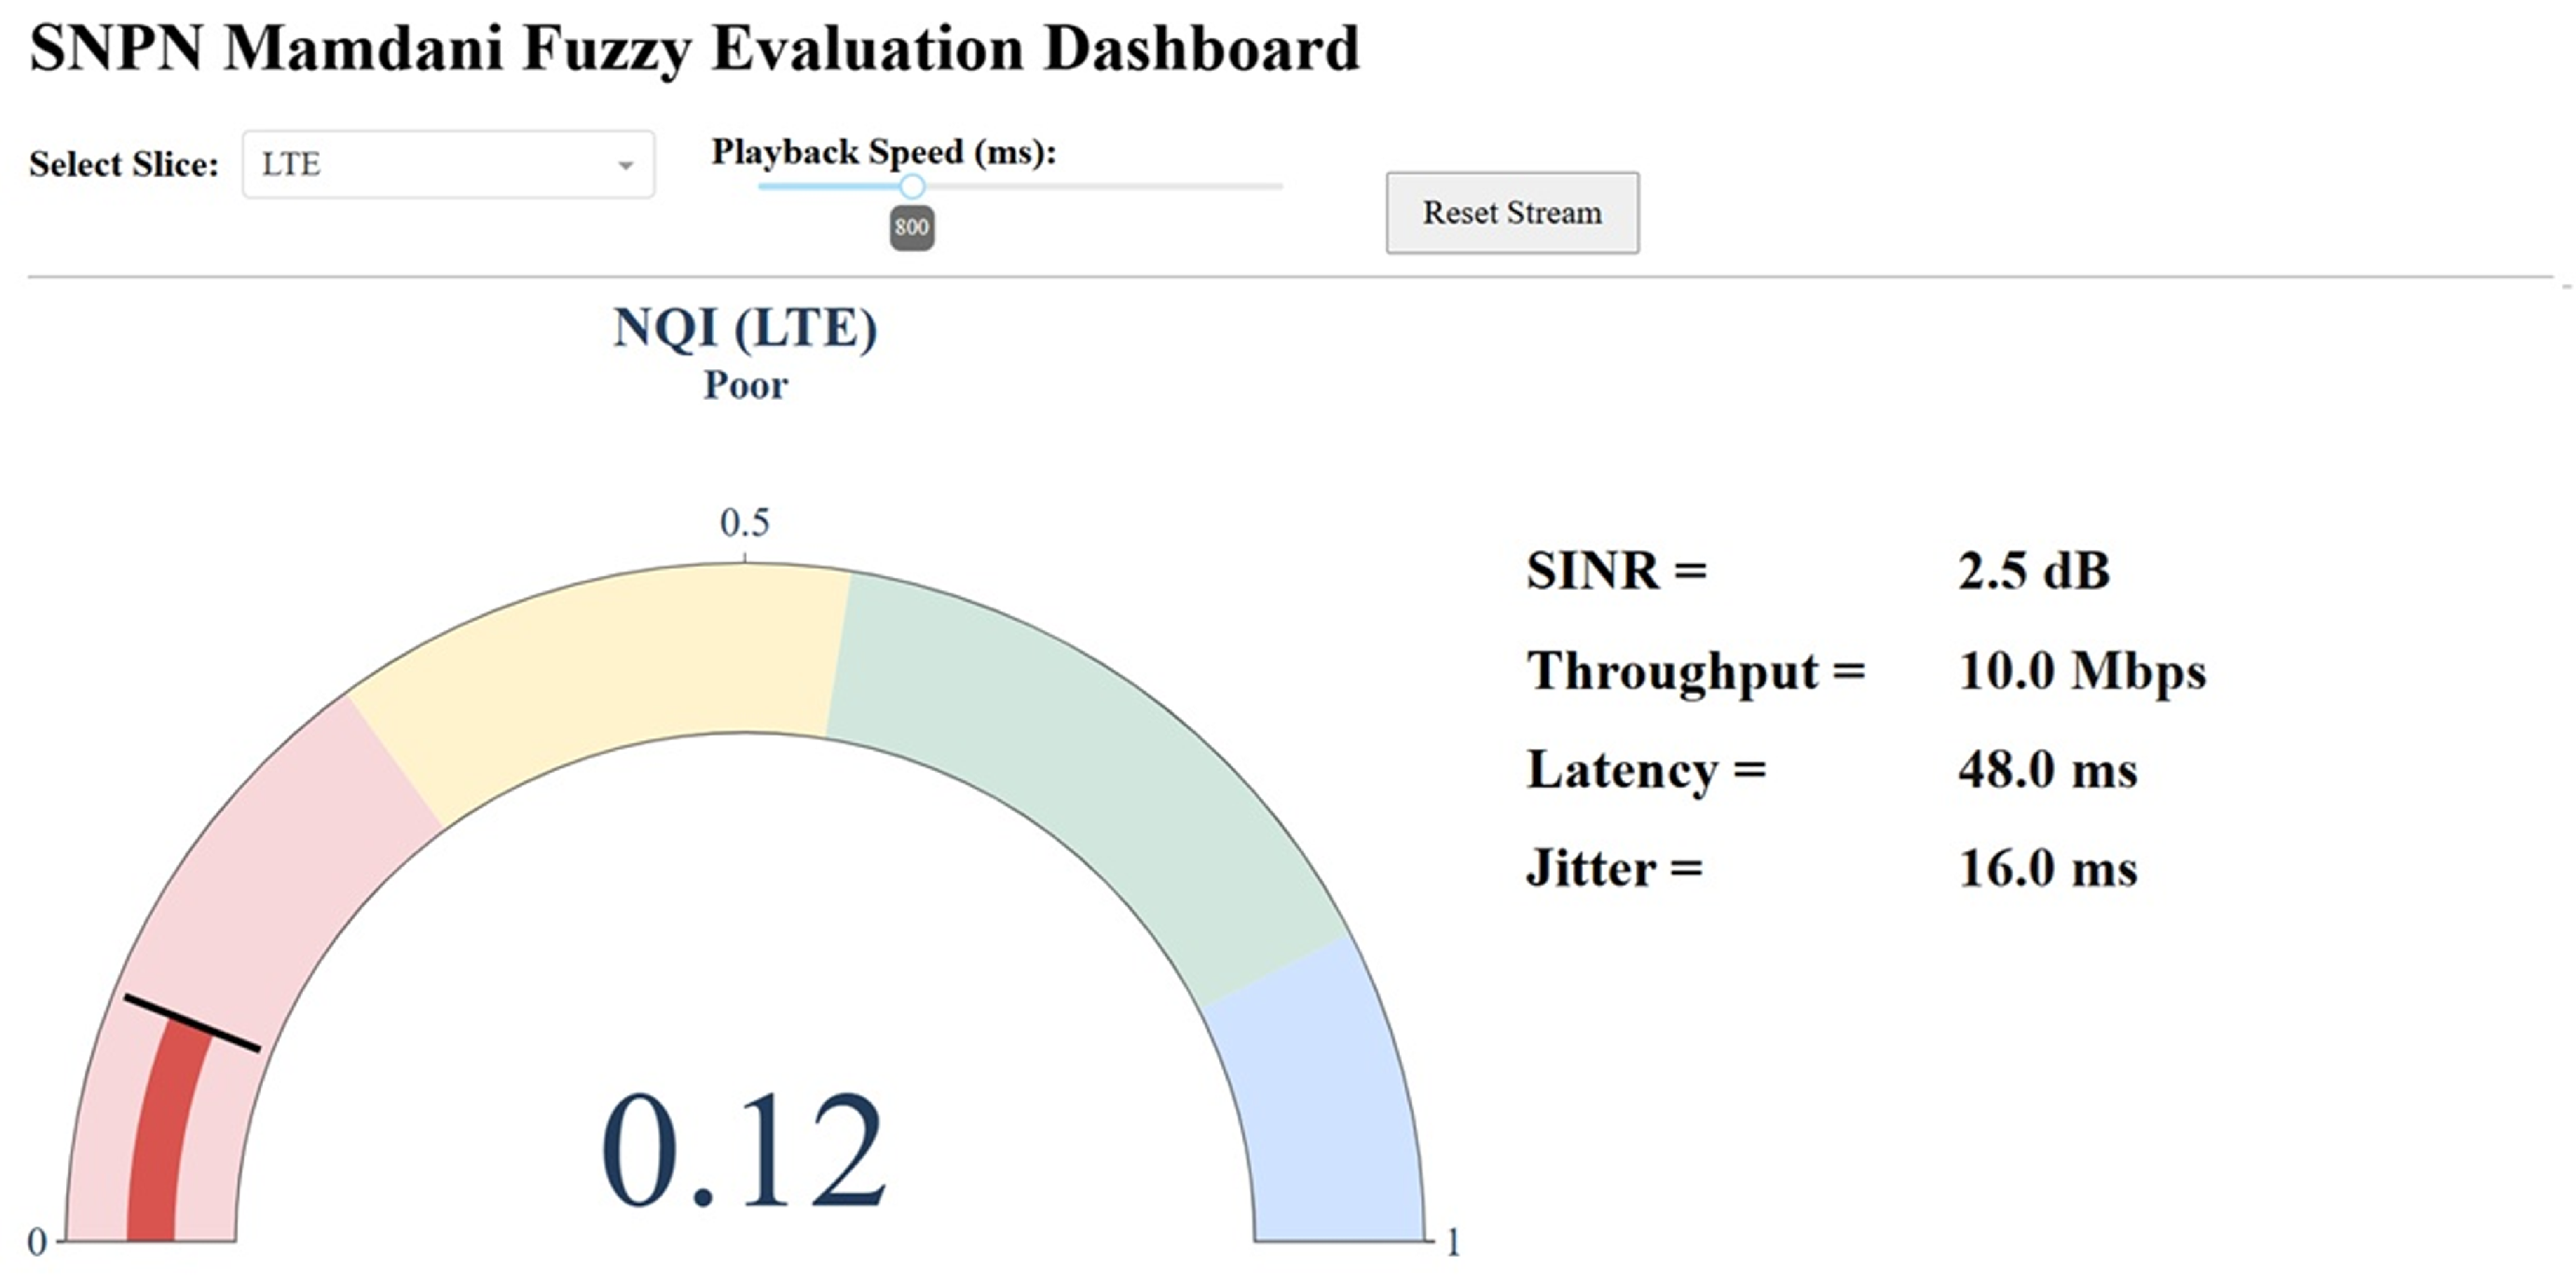
The Mamdani fuzzy evaluation dashboard in
Figure 19 classifies the SDR-based 4G LTE SNPN condition as
Poor with an NQI value of 0.12. This condition corresponds to rule R77, which represents the worst-case combination of Low SINR, Low throughput, Medium latency, and Medium jitter. The measured SINR of 2.5 dB indicates weak radio signal quality and unstable communication conditions, while the throughput of 10 Mbps falls into the Low throughput category, limiting the capability to support bandwidth-intensive services. Moreover, the latency of 48 ms and jitter of 16 ms are categorized as medium, reflecting substantial delay and packet arrival instability. These combined impairments significantly reduce the overall network quality, resulting in a very low NQI value. The Poor classification indicates that the LTE-based SNPN under these conditions would struggle to support real-time applications, high-quality multimedia communication, or reliable industrial services. This result further confirms that the proposed Mamdani FIS can effectively capture compound degradation effects by jointly evaluating radio quality and QoS-related KPIs.
These KPI conditions collectively trigger fuzzy inference rules associated with values of SINR, throughput, latency, and jitter, resulting in a defuzzified NQI score. The results demonstrate that although the network maintains stable connectivity and acceptable throughput performance, the higher latency and jitter reduce the overall network quality evaluation. This observation further highlights that raw KPI values evaluated independently may not accurately represent the actual operational condition of the network. For example, the achieved throughput remains relatively acceptable, yet the overall NQI classification is limited to the Poor category due to the combined influence of delay-related KPIs and radio quality. Therefore, the proposed fuzzy logic-based NQI framework provides a more comprehensive and interpretable mechanism for network operators to evaluate practical SNPN performance and identify network conditions requiring optimization or technology upgrades.
6. Conclusions
This study evaluated the deployment and performance of SDR-based 4G LTE and 5G SNPNs using USRP B210, Open5GS, srsRAN, and COTS user equipment under controlled indoor scenarios. The evaluation considered multiple performance indicators, including SINR, downlink throughput, uplink throughput, latency, and jitter at 2 m and 5 m deployment distances. The results show that the measured performance varies across radio access technology, distance, and propagation conditions. However, these findings should be interpreted within the context of the implemented SDR-based testbed and should not be generalized as a universal comparison between 4G and 5G systems. Therefore, the reported results should be regarded as an experimental baseline for SDR-based SNPN deployment rather than as a generalized benchmark of commercial 4G and 5G network performance.
To support a more comprehensive interpretation of network quality, this study proposed a Mamdani fuzzy-logic-based Network Quality Index (NQI) framework. The framework integrates heterogeneous KPIs, namely SINR, throughput, latency, and jitter, into a unified linguistic representation. By mapping numerical measurements into fuzzy membership functions, the proposed approach enables SDR-based SNPN conditions to be classified into interpretable quality levels, such as Poor, Fair, Good, and Excellent.
The results indicate that fuzzy logic can effectively support multi-KPI interpretation by considering the combined influence of radio quality, throughput, delay, and packet delay variation. This approach provides a more meaningful representation than isolated KPI-based assessment, particularly when network conditions fluctuate across distance and propagation scenarios. Therefore, the proposed fuzzy-based visualization can assist network monitoring and decision making by translating raw performance measurements into actionable network quality status.
Future work will extend the evaluation to more deployment scenarios, additional UE types, larger measurement datasets, and real-time fuzzy-based monitoring for SDR-based private cellular networks.