Article

Negative Trend of Regularity of Locomotion in an Endurance Walking Task: Experimental Data from Healthy Adult Recreational Athletes in an Unsupervised 100 km March

by
Marco Rabuffetti
1,
Ilaria Carpinella
1,*,
Stefan Mendt
2,
Giampiero Merati
1,3,
Mathias Steinach
2,† and
Martina Anna Maggioni
2,4,5,†
1
IRCCS Fondazione Don Carlo Gnocchi ETS, 20148 Milano, Italy
2
Center for Space Medicine and Extreme Environments Berlin, Institute of Physiology, Charité-Universitätsmedizin Berlin, 10117 Berlin, Germany
3
Department of Biotechnology and Life Sciences, Università degli Studi dell’Insubria, 21100 Varese, Italy
4
Charité Center for Global Health, Charité-Universitätsmedizin Berlin, 10117 Berlin, Germany
5
Department of Biomedical Sciences for Health, Università degli Studi di Milano, 20126 Milano, Italy
*
Author to whom correspondence should be addressed.
These authors contributed equally to this work.
Appl. Sci. 2026, 16(12), 6203; https://doi.org/10.3390/app16126203
Submission received: 13 May 2026 / Revised: 16 June 2026 / Accepted: 17 June 2026 / Published: 19 June 2026

Featured Application

Among the recent advances in motion analysis, the quantification of locomotor pattern regularity, based on wearable sensors’ measurements, provides an index potentially modulated by a prolonged effort, thus possibly considered as an objective proxy of accumulating fatigue.

Abstract

(1) Background: Physical fatigue, either in short anaerobic exercises or in aerobic ones, affects locomotion patterns. Those effects, if consistently observed, may function as fatigue proxies. The present study focuses on the regularity of the pseudo-periodic acceleration patterns measured by a wearable sensor. Studies during laboratory anaerobic tasks on healthy subjects and on persons with multiple sclerosis during 6 min walking tests demonstrated that regularity decreases with fatigue. This study’s objective is to verify if the gait regularity during an unsupervised endurance aerobic walking task progressively decreases in healthy subjects. (2) Methods: Ten healthy male adults, not competitive recreational athletes, equipped with an accelerometer, participated in a non-competitive 100 km walk in about 24 h. (3) Results: Eight participants took from about 22 to 25 h to complete the task. Two did not finish. The trend of locomotion regularity (on average −6.3%, p < 0.001, effect size 1.41) was negative for all the participants. The gait speed decrease, in all the participants, explained less than 20% of the regularity decrease. Other outcome indices, such as that related to cadence, did not provide unique trends. (4) Conclusions: Regularity decrease is associated with fatigue in submaximal locomotor efforts; due to the experimental group limitations in size and composition, further studies should extend regularity assessments to women, and to persons with neuromuscular disabilities or attending walking rehabilitation.

1. Introduction

Physical activities can result in fatigue through a combination of peripheral muscles’ metabolic phenomena [1], cardiovascular strain [2], central nervous system limitations and psychological factors [3,4]. Particularly, fatigue can result from short-term high-intensity physical exercises characterized by anaerobic mechanisms or by prolonged low-intensity physical exercises engaging the aerobic metabolism [5,6]. Physical fatigue, in return, affects aspects of the human posture and movement [7,8,9] either as a direct effect and/or as compensation motor strategies [10,11]. Interestingly, fatigue phenomena are exacerbated by aging [12] and/or by pathologies, becoming significant symptoms [13]. In the present study we focus on fatigue associated with prolonged locomotion tasks, and particularly on walking performed in unsupervised real-life conditions.
Observed effects of fatigue on gait in healthy athletes [14] and in selected groups of neurological patients [15,16] include a decreased velocity, generally associated with decreasing stride length and cadence. Nonetheless, other studies showed opposite results—an increased velocity, stride length and cadence [17,18,19]—or mixed results [20,21,22]. In a study with persons with multiple sclerosis the authors stated that “somewhat surprisingly” [sic] gait speed did not change with increasing locomotor fatigue [23]. Another study reported both positive and negative fatigue effects on gait speed [24].
To identify proxies of fatigue, a promising field of research is the variability of gait patterns: several studies have reported that fatigue can result in an increased variability of gait patterns [4,25] and can decrease local stability [26], though controversial results are reported [27]. This approach is challenged in real-life endurance tasks in which conditions are not fully controlled like in laboratory settings. Indeed, multiple confounding factors (among others, both exogenous factors such as varied gait speed, pacing synchronization, environmental conditions, and terrain variability, and endogenous factors such as motivation, psychological state, and adaptive movement behavior) cannot be ruled out and thus may cause gait variability.
A reliable fatigue-related index concerns the regularity of patterns of gait variables: its definition is based on the application of the autocorrelation analysis to the pseudo-periodic patterns of gait variables. These variables generally consist of the acceleration measured by a wearable sensor [28], though other variables, such as the measure of a gyroscope, can be considered [29]. The regularity index ranges from 0 for completely aperiodical, i.e., irregular, signals to 1 for perfectly periodic signals. The robustness of the regularity index was proved considering wearable sensors positioned at several anatomical landmarks [30]. A comparative study showed that regularity could be quantified by a sensor positioned on anatomical landmarks other than the commonly considered sacrum bone, away from the sagittal plane, for example at the wrist [29]. Moreover, it has been shown that regularity increases with increasing speed of locomotion [30]. The regularity assessment proved to be sensitive to aging [31,32,33], gender [33,34], the occurrences of scoliosis [35], stroke [36,37], cardiovascular diseases [38], osteoarthritis [39] or transfemoral amputation [40], always showing a decreased regularity in these pathological conditions.
The regularity assessment has been applied to detect its association with increasing fatigue. In a cohort of young healthy individuals, performance under the Bruce test [41,42], a locomotor test involving an incremental effort and speed, was assessed by means of wrist accelerometry and by the time profile of regularity [43]. The results showed that regularity, when walking at lower speeds (aerobic mechanisms) and with no fatigue onset yet, initially increased with increasing speed. It then decreased when the test was entering its anaerobic phase and becoming more and more fatiguing with higher speeds involving running. This decrement of regularity with increasing fatigue was observed without exceptions in all 45 participants, thus providing a very robust indication about regularity being a proxy of locomotor fatigue in a maximal anaerobic locomotor effort. Another study concerned the regularity of acceleration patterns as measured in athletes running to exhaustion (time to exhaustion: about 7 min) at their maximal aerobic speed (about 17 km/h), resulting in a significant decrease (about 10%) of regularity [44]. The regularity assessment was considered also in the study of fatigue effects in the 6-Minute Walking Test in groups of persons with multiple sclerosis, who are known to get fatigued with such a test, which usually is not demanding for healthy subjects [23,45]. These articles documented a progressive decrease in regularity in this population, highlighting that gait regularity is an important aspect to be addressed during rehabilitation aimed at increasing walking endurance. All the cited studies were based on strict laboratory protocols which maximized the fatiguing condition and controlled or at least minimized the effect of potentially confounding factors. These included endogenous factors (such as, for example, varied gait speed, intermittent mental stamina, motor control), as well as exogenous factors resulting from co-performers or by the environmental conditions (such as, for example, ongoing modulation of pacing strategies, weather and terrain variability).
The present study is intended to fill the gap in the literature about the possible association of gait regularity decrease in an unsupervised real-life (or real-life-like) context. In this setting, the individual is subject to multiple exogenous and endogenous confounding factors, yet retains relative freedom in deciding how to cope with demanding and enduring motor tasks. Its novelty is in possibly demonstrating that regularity may be a valid proxy of fatigue even in submaximal real-life conditions with the presence of confounding factors, an overall picture particularly significant for daily life. The study fulfills this objective by answering the research question as to whether there is a relation between gait regularity variations and fatigue in an unsupervised, submaximal aerobic endurance walking task in adult healthy subjects. Such a study complements the condition involving anaerobic maximal effort assessed in [43], to test the hypothesis that fatigue involved in the submaximal aerobic endurance walking task may lead to a progressive decrease in gait regularity. The significance of this potential finding for the rehabilitation community is that a real-time assessment of walking regularity may support bio-feedback-based home treatments [46,47,48,49] aimed at increasing endurance. More broadly, it may provide quantitative indices capable of certifying the translation of restored motor capacity as obtained in a rehabilitation center into improved real-life motor performances.

2. Materials and Methods

2.1. Motor Task

The data collection phase occurred during a non-competitive sport event, the Mammutmarsch 2018 in Berlin, Germany [50]. This event consisted of a 100 km path winding through the south-west outskirts of Berlin, which the participants had to walk at their preferred speed without ever running, and they were allowed to stop and to restart any time they felt so. The target duration of the task to be classified was 24 h, even though the participants were allowed/required to finish the task beyond the 24 h limit. The whole path was divided in 5 stages of similar lengths (the stages were sequentially 17, 21, 18, 23 and 21 km long), and checkpoints were set up at each stage end, to allow the participants to eat, rest and receive medical support. In general, the participants were experienced leisure hikers and the rate of success in similar events was approximately 75% (authors’ guess).

2.2. Event Conditions

The Mammutmarsch 2018 took place on 26–27 May 2018; about 1600 adult recreational athletes participated in the event, and the march start, due to the large number of participants, was staggered between 15:00 and 16:00. The weather was dry; the daytime temperature was 25 °C on average, while the night temperature dropped down to 14 °C; sunset was at about 21:15 and sunrise at about 5:00; the walking path surfaces were natural/unpaved (35%), gravel (15%), paved (16%), asphalt (26%) and unknown (8%); the path was mainly flat with a total elevation range of 520 m. Participants were not required to present a health certificate. However, medical staff were present throughout the event at the various checkpoints to provide medical assistance when required.

2.3. Participants and Measuring Equipment

Any adult already enrolled in the 2018 Berlin Mammutmarsch was considered eligible for the non-invasive physiological monitoring protocol of this study. There were no other inclusion/exclusion criteria to partake in the study, similarly to a previous study carried out by this research group in other editions of the Mammutmarsch [50].
Ten participants, all adult males, in the 2018 Mammutmarsch were recruited for the study. The limited size of the experimental group was determined by the number of available wearable sensors and the need to perform the experiment at once, during the same sport event. The composition of the experimental group was determined by the random enrollment of subjects which did not balance the sex factor; the resulting skewed sex distribution is a limitation of this study. The participants all gave their informed written consent to partake in the study.
The anthropometric and demographic data of the participants, along with a yes/no value concerning previous experience in endurance events (other Mammutmarsch and/or marathon events, though all of them were used to walking in their leisure time), are reported in Table 1. Additional details about the previous experiences in endurance sport events of the 10 participants are available as Supplementary Materials S1.
The ten participants were equipped with a wearable accelerometer/ECG device fixed on the usual placement zone for Holter monitors (upper chest, right hemithorax, few cm below the clavicle, between the sternum and the midclavicular line, on the infraclavicular fossa), to provide one-channel electrocardiography (ECG) and recording of triaxial acceleration. Nine devices were Bittium Faros 180 (Bittium Corporation, Oulu, Finland), and one device (on subject #10), equivalent in its characteristics, was an Equivital (Hidalgo Ltd, Swavesey, UK). The only metrological difference was in the bit-depth of the measured values, respectively 12 and 14 bits, which affects only quasi-static measurements and not gait data. The accelerometry sampling rate was set at 100 Hz. The choice to adopt sensors that were different in brand but equivalent in metrological features and in positioning was dictated by the will to maximize the number of monitored participants in the same event, thus maximizing the statistical power of the observed results. Since the two accelerometer brands were considered for measuring raw acceleration only (vector norm of triaxial acceleration), and derived indices were computed by a unique analysis pipeline, no potential impact on data consistency or comparability is expected from the choice to adopt different sensors. The ECG data will not be addressed in the present study, which focuses on the acceleration data only. The measured acceleration was stored on-board the wearable device and downloaded offline.

2.4. Data Analysis

The locomotion regularity was assessed by a method based on the autocorrelation analysis, first described in [28], in the version implemented in [30].
The pipeline for data analysis and presentation was implemented in MATLAB (version R2016a; The Mathworks, Natick, MA, USA).
The pipeline initiated with a first batch, described in detail in [30], comprising the following steps:
  • Low-pass filtering (low-pass Butterworth filter, 9-th order, zero phase, cut-off frequency 10 Hz) of the three components of raw acceleration recordings;
  • Computation of the acceleration modulus, alternatively named vector norm, as the root of the sum of squared acceleration components;
  • On a shifting data window (subscript “i” pointing to the window absolute timing) lasting 4 s, assumed to include at least three full strides [30], the following indented analysis steps were performed:
    • Computation of the autocorrelation function (“xcorr” MATLAB function, “unbiased” function mode) on the window vector norm data, previously normalized and standardized, by removing the mean value and then dividing by the standard deviation, i.e., transforming into a time series with null mean and unitary standard deviation;
    • Identification on the previously computed autocorrelation function of a peak with abscissa T and ordinate Y;
    • Time T of the autocorrelation peak corresponds to the main period duration of the pseudo-periodic signal presented in the window, i.e., the stride duration;
    • The window value T allows us to compute the stride (per minute) frequency as 60/T and, finally, the cadence index (steps per minute), remembering that two steps corresponds to a stride, defined for the current i-th window as CIi = 2 × (60/T) = 120/T;
    • Autocorrelation peak Y corresponds to the regularity of the pseudo-periodic signal presented in the window; therefore, we defined the regularity index RIi = Y (the closer the value is to one, the closer to a periodic function it means) for the current i-th window; noticeably other peaks of the autocorrelation function were present in the correspondence of multiple harmonics of the stride and step durations but were not relevant for the present analysis;
    • In the same shifting window, computation of an index of activity level was computed, the MAi, defined as the standard deviation of the acceleration modulus [51].
  • Repeating the previous indented analysis steps for any data window provides the time series of autocorrelation coefficients, assumed as performance variables, RI and CI.
The pipeline’s second batch performed identification of bouts of steady walking (walking phases) and, in a complementary manner, of resting phases.
The first step of the classification algorithm started on the much-fragmented classification based on the 4 s window granularity of the computed RI and CI time series. The initial classification of phases of walking and resting, without constraints to their durations, was performed by a clustering algorithm (“k-means” MATLAB function) working on the time series of RI and MA values; in other words, walking phases were initially identified having relatively high RI, close to 1, along with high motor activity MA, and resting phases were just complementary to the walking phases. The classification produced by this first step was extremely fragmented, alternating walk bouts and rest phases of minimal durations, down to 4 s, thus requiring further merging steps.
The second step of the classification algorithm aimed at reducing fragmentation resulting from the previous elaboration step (defragmenting algorithm). For this purpose, a specific algorithm was developed, which iteratively merged triplets of adjacent subphases (walk–rest–walk or rest–walk–rest), by classifying the middle subphases according the two external ones. The only algorithm parameter was the minimal duration for a subphase not to be merged in the adjacent subphases. This parameter was set to 300 s after a trial-and-error procedure, having the objective of uniform subphases, spent at the checkpoints, where no walking was classified. Details of the algorithm and a discussion on the robustness of the resulting defragmentation of the recording on outcome indices are presented in Supplementary Materials S2.
Once the phase classification was completed, the resting phases (and related RIi and CIi) were discarded and, considering only the identified gait bouts, a first-order regression line fitting the time series of the walking RIi regularity index was computed. Thus, the computation of the regression line is performed on the walking phases only of the RI profile and of the CI profile. The fitted regression line, based on a time series spanning the whole duration of the Mammutmarsch, is uniquely defined by few coefficients: the slope coefficient (mRI), i.e., the trend change in the value of RI fitting line per hour; the value at the start time (RI0); and the value at the finish time (RIend). These three values derived from the regression line were considered as outcome variables. Analogously the slope coefficient (mCI) and the value at the start time (CI0) and finish time (CIend) of the cadence index CI were computed.
In summary, the primary outcome indices are, for each participant, the following ones:
  • mRI, the main outcome index, quantifying the rate of change in the regularity index RI per unit of time (hour);
  • RI0, the regularity at the start time;
  • RIend, the regularity at the finish time (it is defined also as RIend = RI0 + mRI × TotalDuration);
  • mCI, the rate of change in cadence (steps/min) per unit of time (hour);
  • CI0, the walking cadence (steps/min) at the start time;
  • Ciend, the walking cadence at the finish time (it is defined also as CIend = CI0 + mCI × TotalDuration).
Additional outcome indices were (a) Total walked distance (km); (b) Total Duration (hours) from the start time to finish time including resting phases; (c) Walking Duration (hours), from the start time to finish time excluding resting phases; (d) Resting Duration (hours); (e) Number of Walking Bouts (N); (f) duration of the Longest Walking Bout (hours); (g) duration of the Longest Resting (hours).
The hypothesis tested in the study, i.e., that task progression in time is associated with decreasing regularity, is analytically described by regression lines with negative slope, i.e., a negative coefficient mRI.
Furthermore, to discuss possible data redundancy, a cross-correlation analysis (computation of the Pearson correlation coefficient) was performed among all major outcome indices. For each considered index, the dataset consisted of one value per participant. Therefore across-subject tests were performed, not requiring repeated measure tests. Proper correction (Bonferroni–Holm) was applied in all multi-test analyses.

3. Results

The data acquisition phase had no drawbacks. No sensor failure or missing transient data were experienced. No data clipping affected the raw accelerometric measurements.
The participants certified that the performance was characterized by extreme fatigue by providing a subjective Borg RPE (Rating of Perceived Exertion, max value = 20) which ranged from 16 to 17 (six participants) to 18–19 (four participants) (see Supplementary Materials S1 for individual values).
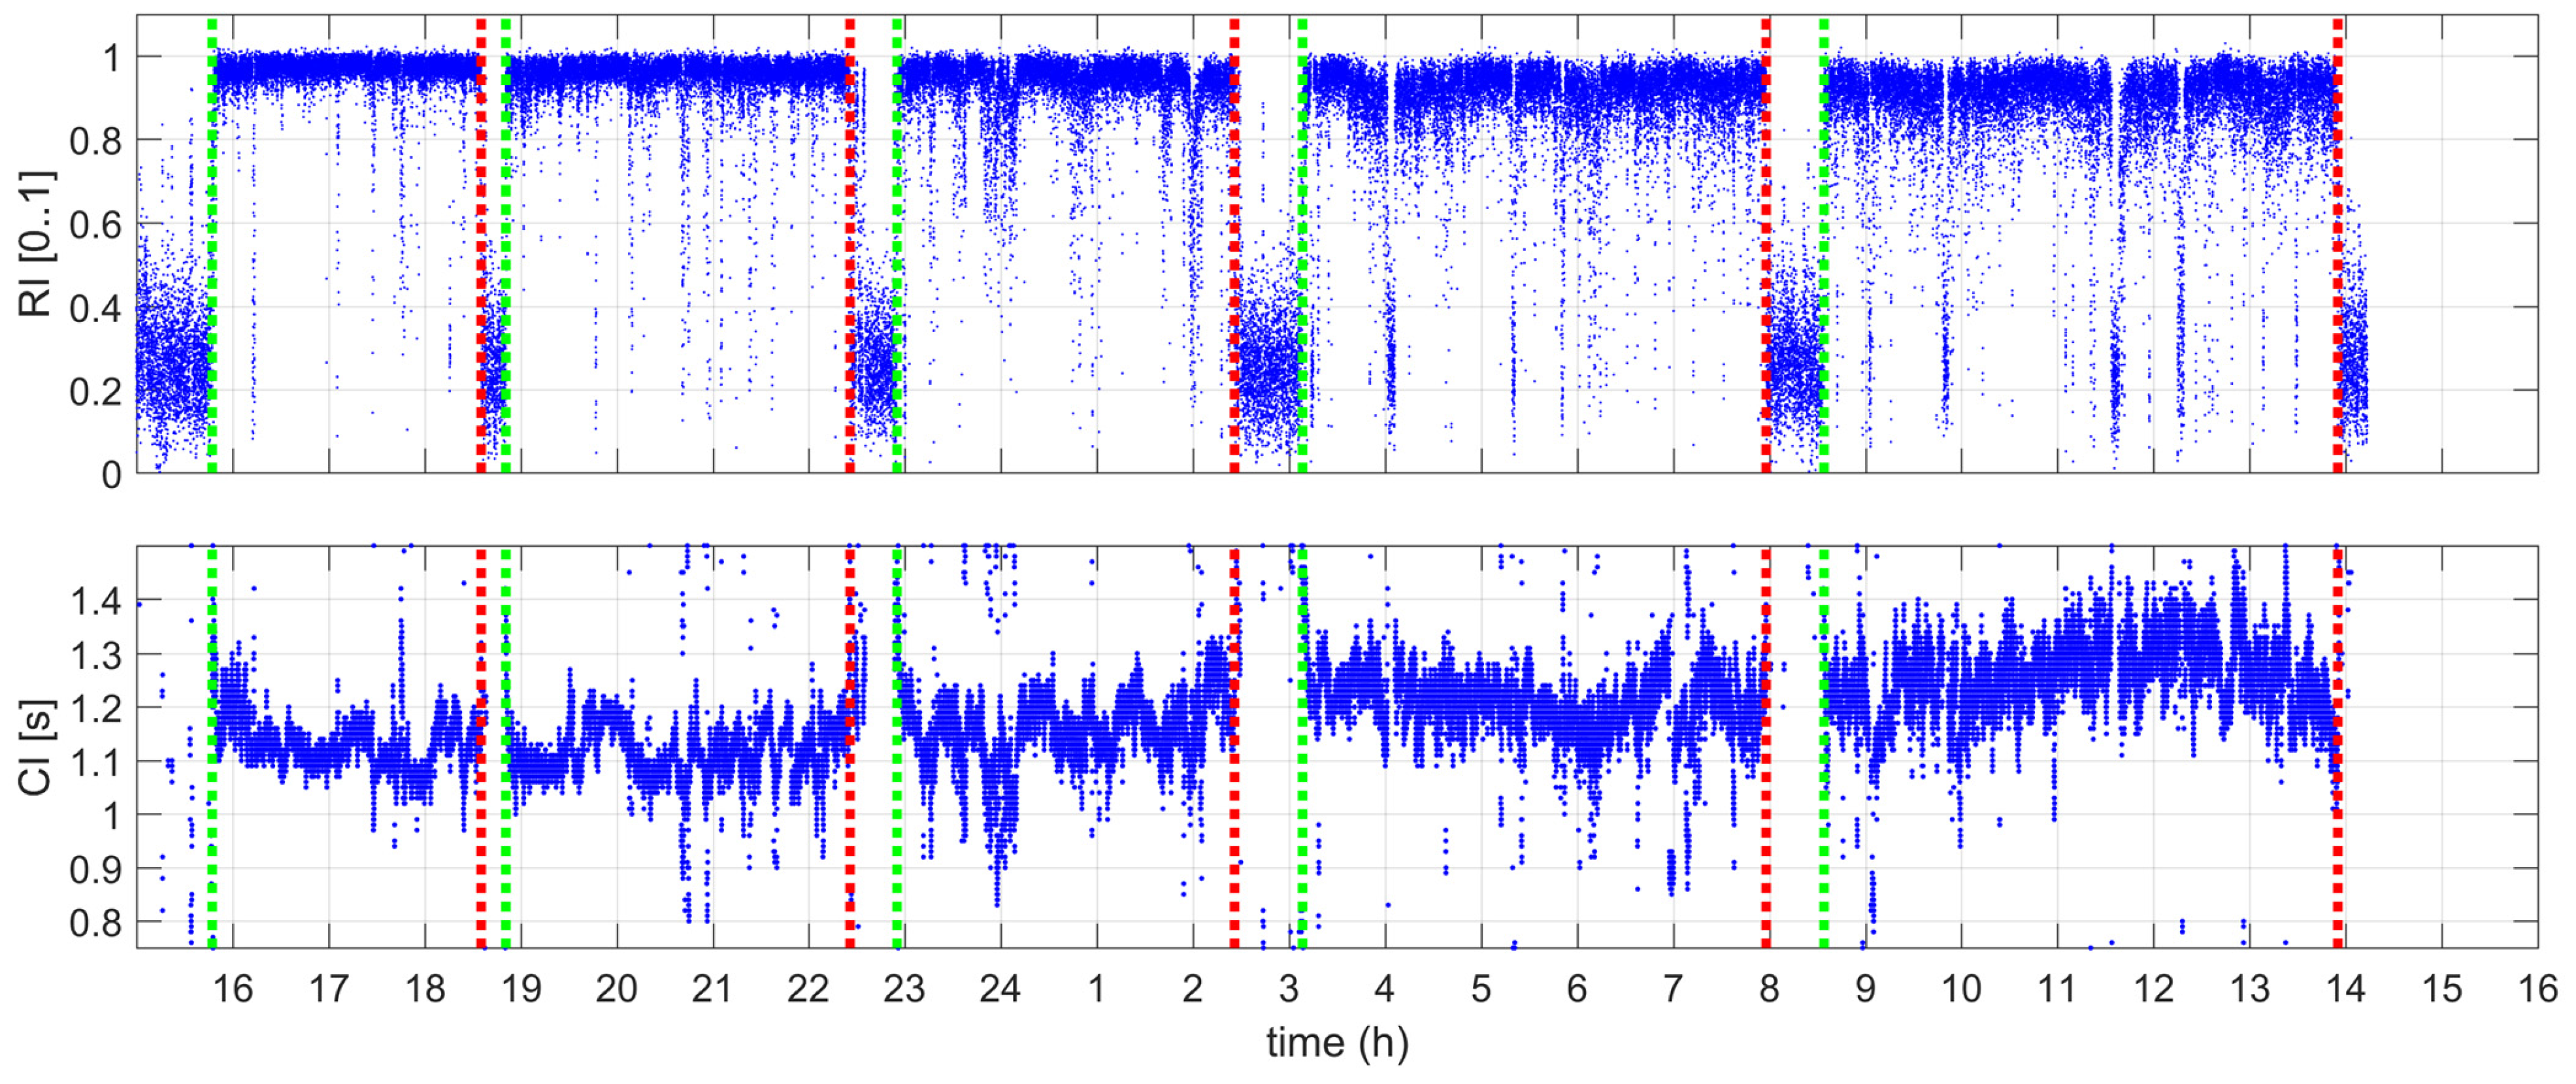
An example of an RI (regularity index) time profile and related CI (cadence index) time profile, with evidenced walking and resting phases, computed from an accelerometric recording is presented in Figure 1.
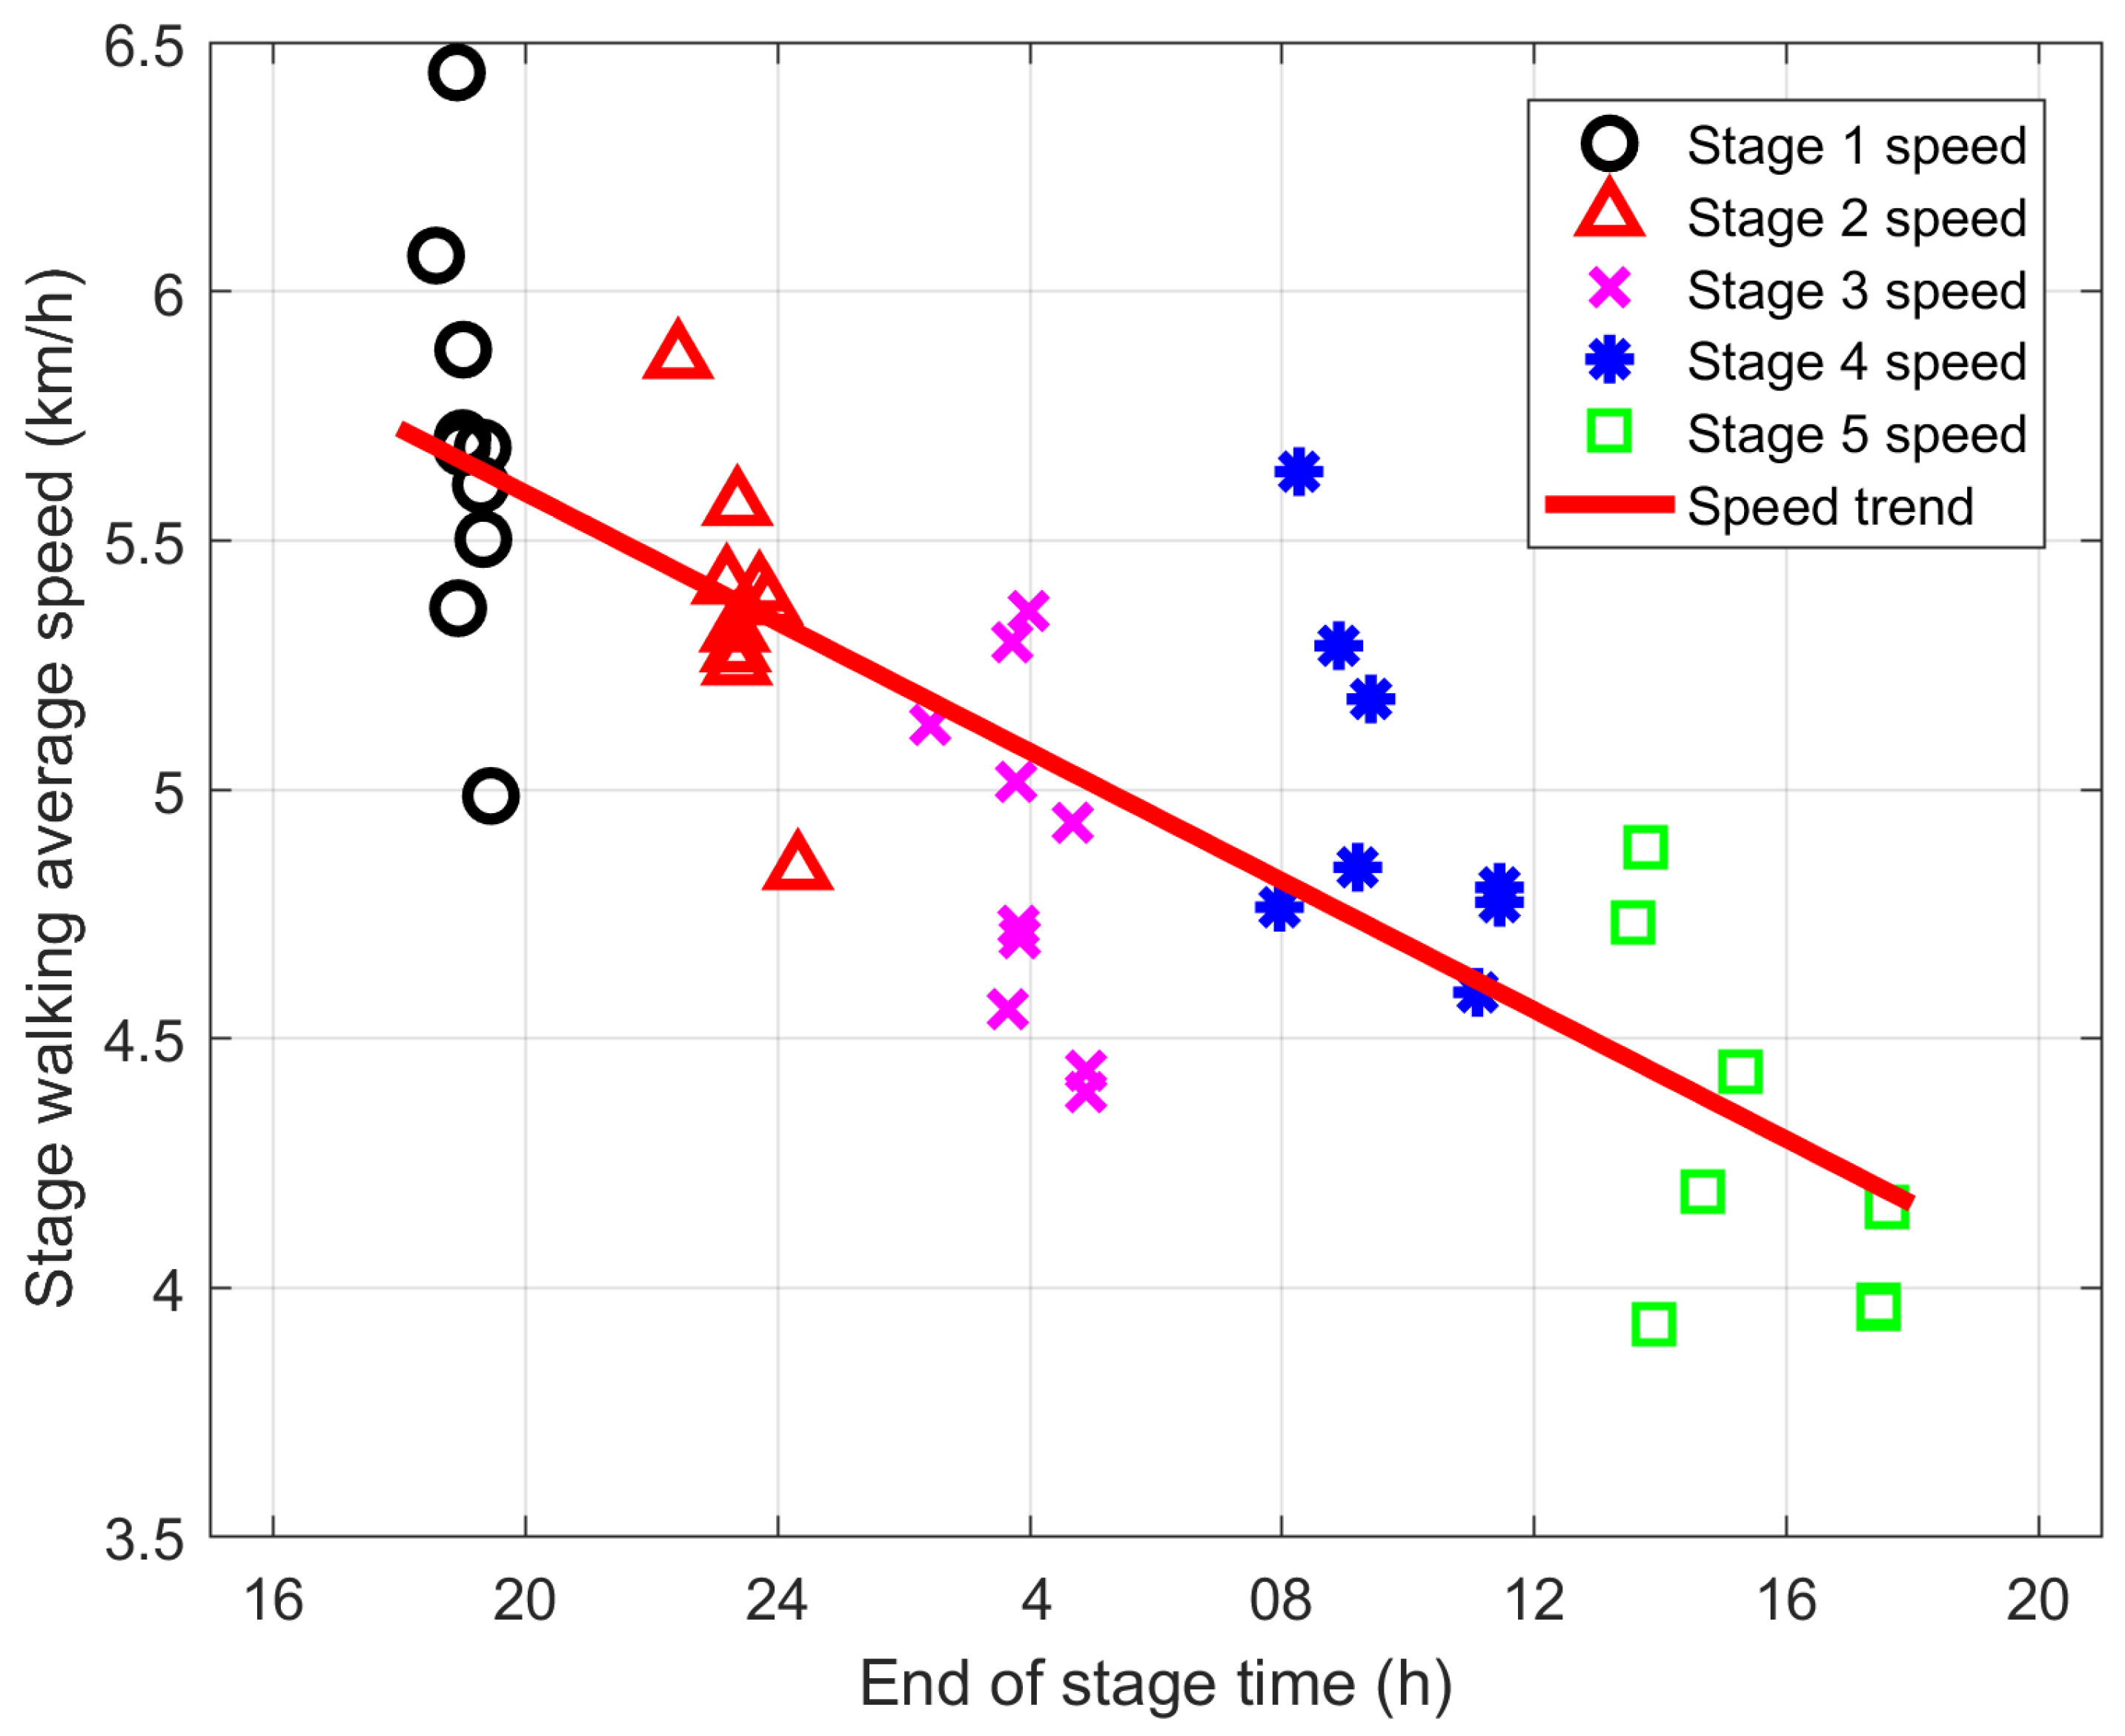
Given the known length in km of each of the five march stages and associating each identified individual walking bout to the corresponding march stage (all the participants stopped at each checkpoint, therefore a single bout can be associated with a specific stage; noticeably, with few exceptions, several walking bouts were associated with the same march stage; these analytical data are available as Supplementary Materials S3), the individual average gait speed per each stage was computed. The resulting cloud of individual average speed per stage allowed us to perform a linear regression on the whole march timing, and resulted in the decrement of the group average gait speed from the initial value of 5.7 km/h to the final value of 4.2 km/h (see Figure 2).
The computed outcome indices are reported analytically per participant in Table 2 (the participants are sorted for increasing whole duration of the trial; noticeably the last two individuals, #10 and #5 did not conclude the 100 km trial).
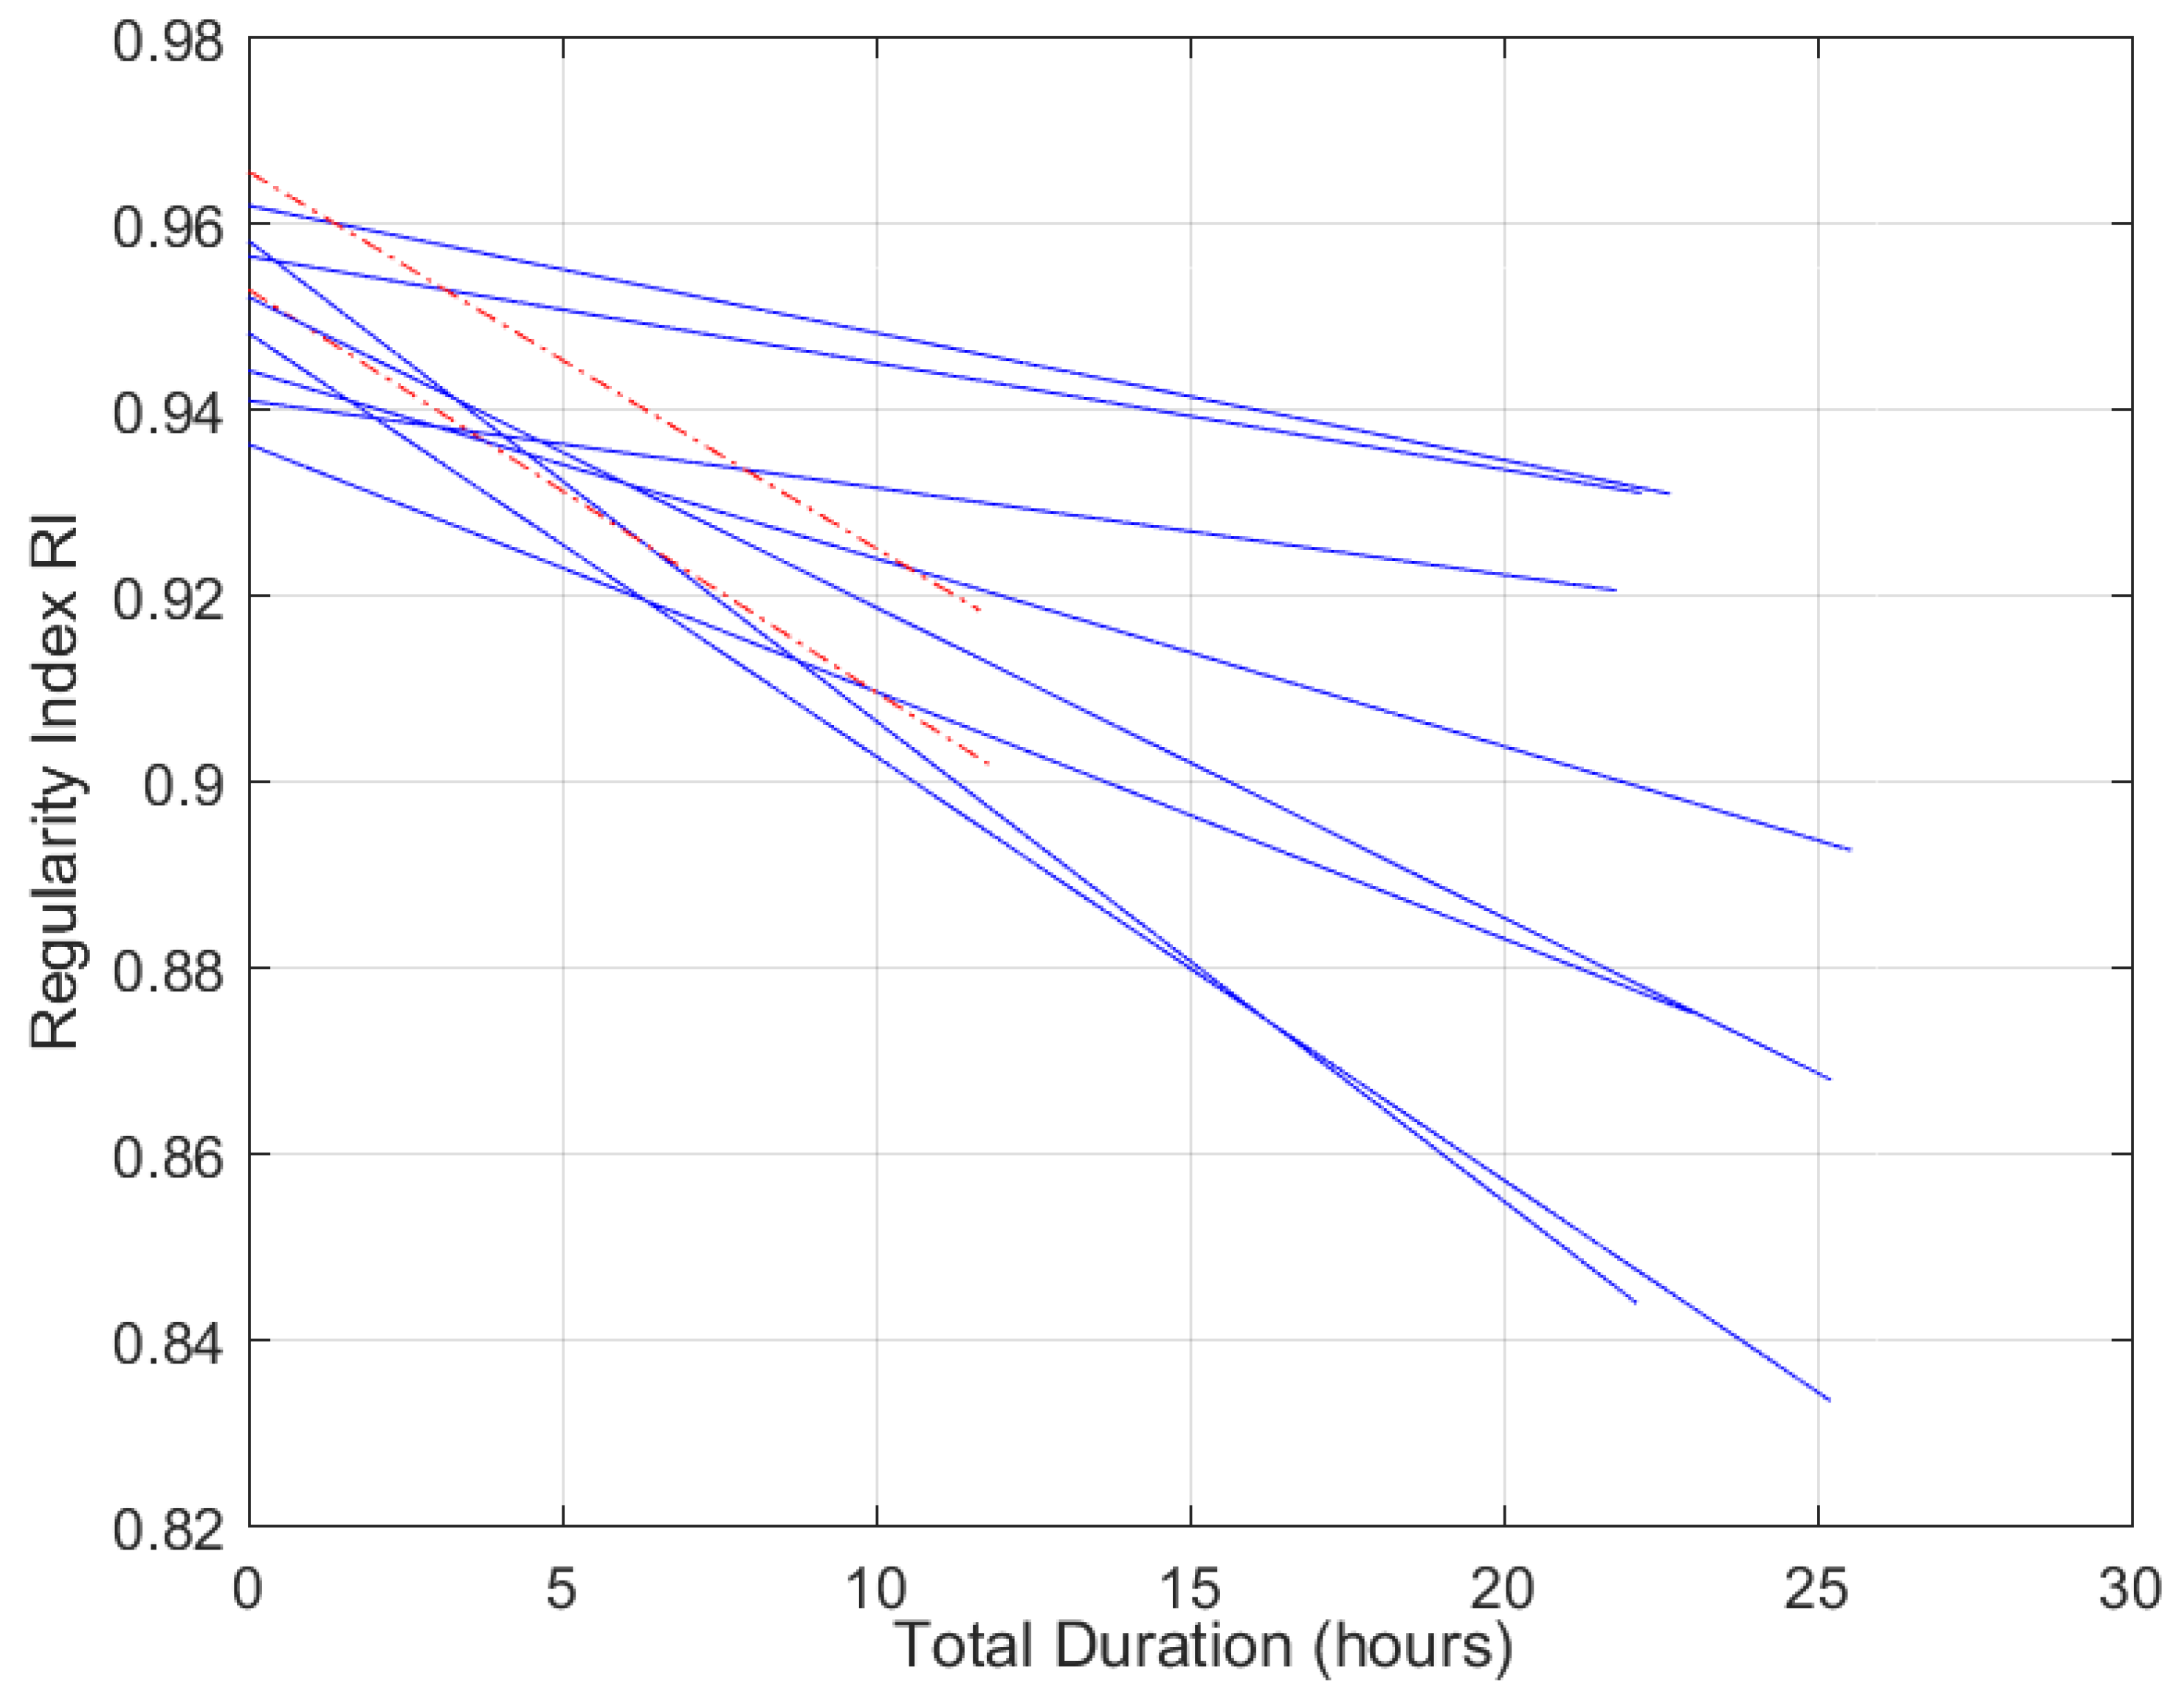
In order to support the discussion about trend indices mRI and mCI but not overcrowd Table 2, the individual 95% confidence intervals for those two indices are reported in a table available as Supplementary Materials S4. Further, the value indices related to RI are presented as individual lines in the spaghetti plot shown in Figure 3.
Once it was verified that the regularity indices (RI0, RIend, mRI) were normally distributed (Shapiro–Wilk’s W test, respectively, p = 0.969, p = 0.333, p = 0.424), a parametric paired t-test between RI0 and RIend was performed to test the study main hypothesis, and the results were significant (average difference RIend − RI0 = −0.060, −6.3%, p < 0.001, Cohen’s dRM for repeated measure effect size 1.41, 95% confidence interval of Cohen’s dRM 0.42 to 3.24). The previous statistical analyses have been applied also to the subgroup of eight participants who completed the task. The data were confirmed to be normally distributed. The paired t-test between RI0 and RIend resulted in a significant difference (average difference RIend − RI0 = −0.063, −6.6%, p = 0.002, Cohen’s dRM for repeated measure effect size 2.55, 95% confidence interval of Cohen’s dRM 0.81 to 3.23).
The major observation in Table 2 is that the hypothesis of the study, i.e., that regularity worsens over the course of the performance, is proved true in all the participants, even in the two who did not finish the trial. In fact, the index mRI (the slope coefficient of the RI profile fitting line) is negative for all ten participants. A one-sample t-test has been applied to mRI to verify if it is strictly negative, significantly different from the null value (p < 0.001, Cohen’s d effect size −1.891, 95% confidence interval of Cohen’s d −2.934 to −0.815).
Secondly, the other index quantifying a rate of change in cadence along time, mCI (the slope coefficient of the CI profile fitting line), does not provide a unique picture; in fact the first participant at the finish line, subject #1, showed a positive value, that is an increase in cadence along the trial, while all the other subjects showed a negative value.
Some additional indications about the performances of the ten participants can be derived from Table 2: (a) Walking Duration is not rank-by-rank associated with the Total Duration, and subject #3, third on the finish line, was actually the one who took less time walking and therefore walked faster; (b) when considering complementary Durations in Walking and Resting, and particularly their ratio, it was apparent that the first five subjects were proportionally walking more (or, alternatively, resting less) than the last three subject to finish; the two subjects unable to finish are characterized by extreme ratios, comparatively walking more and resting less than the eight able to finish; and (c) the number of Walking Bouts showed that only one subject (#4, second to finish) out of eight fully walked without ever resting each of the five stages.
The correlation between any couple of outcome indices, available in full in Supplementary Materials S5, does not present any significant couple, with only two out of 15 comparisons producing a raw p-value lower than 0.05, though not significant due to Bonferroni–Holm correction.

4. Discussion

The present study is the first to consider the regularity of walking pattern, i.e., the repeatability of measured accelerometric waveforms stride after stride, in healthy adult subjects during an endurance 100 km walk task. The participants can be classified as experienced leisure hikers and six out of ten had previous experiences with endurance races (Mammutmarsch and/or marathons). The trial was unsupervised, and indications concerning speed, cadence or durations of walking bouts and resting phases were not given; the only rule was not to run. Notably, given the high number (about 1600) of the 2018 Mammutmarsch participants, it is possible and even likely that participants, including the ten enrolled in this study, were not alone, particularly in the first stages, and, therefore, an external gait pacing might not be excluded. The task is expected to be of aerobic nature and to provoke an increasing fatigue. This latter assumption is confirmed by the Borg-RPE (Rate of Perceived Exertion) fatigue ratings [52] given by the participants at the end of their performances (ranging 16–19 on a scale ranging from 6, no fatigue, to 20, extreme fatigue). As a further indirect confirmation of our assumption, during previous editions of the Mammutmarsch, we were able to show among the participants significant buildup in various compounds indicative of stress and fatigue [50]. More specifically, we found significant elevations in muscle and cardiac stress markers (C Reactive Protein, Creatine Kinase, Cortisol, and NT-pro-BNP) as well as decreasing markers of lipid metabolism (Triglycerides, Cholesterol, Low-Density Lipoprotein), despite the low intensity indicated by the relatively low mean hiking velocity of 4.17 km/h observed in that experimental sample. Relevantly for the present study, the fatigue markers in [50] were sampled at 0, 30, 70 and 100 km, indicating a progressive, somehow linear, increase in most of those fatigue markers. Such observation demonstrates that fatigue, during a 100 km march, increases with advancing distance/time. This is the basis for interpreting the linear regression of regularity (and cadence) vs. time, performed in the present study, as significant also for the association of regularity (and cadence) with increasing fatigue.
Therefore, the Mammutmarsch was assumed as a valid benchmark in real-life conditions to test the hypothesis that increasing aerobic fatigue is associated with decreasing regularity of walking, even with confounding factors likely to be active. The novelty of this real-life experimental setup complemented a previous study on the locomotor regularity of healthy subjects during a rapidly progressive locomotor task, the Bruce test [43], in a laboratory setting. The controlled conditions of the Bruce test had demonstrated the association between constantly accumulating fatigue, due to a rapidly increasing effort, and decrease in regularity. The present experiment differs in being unsupervised, real-life and potentially confounded by common daily life occurrences, with the participants able to modulate their efforts to improve endurance. It is therefore complementary to the Bruce test (a compelled performance design aimed at inducing a steady and fast build-up of fatigue during a locomotor act) or on the 6 min walk test (6MWT instructions: “… walk for six minutes as fast as you can …”).
The computation of regularity during unsupervised prolonged activities proved to be feasible and robust, and outcomes can be interpreted according to the body of knowledge already available in the gait-lab literature [28]. Particularly, the choice to derive the regularity value from the peak of the autocorrelation function in a sliding window of 4 s of the accelerometric recording is derived from [30] and is intended to build a regularity time profile. Longer windows [53] are particularly suited for laboratory testing when walking is performed in supervised conditions and tend to be stationary for longer durations, compared to real-life. Another operative choice, the 300 s inferior limit duration for the identification of the shortest walk/rest bout/subphase, is described in detail in Supplementary Materials S2. Particularly, the details include a sensitivity analysis for alternative values of the algorithm parameter, the 300 s threshold, to demonstrate the robustness of outcome indices related to RI and CI. Moreover, these latter indices related to RI and CI did not show cross-correlation in between, thus confirming that they describe, in a robust manner, a complex picture concerning the regularity of walking.
When considering the whole body of results, the analysis pipeline produced a well-defined picture concerning the participants’ performances, including spatiotemporal features of the walking bouts that characterized the performances. Particularly, the algorithm for classifying walking bouts, inspired by detection algorithms for the so-called sustained harmonic walking [54], produced meaningful classifications: the time phases spent during the race at the checkpoints were correctly and uniquely classified as “rest”; the time phases between two checkpoints were in general classified as “walk” with interspersed shorter resting subphases. It is relevant to note that the initial guess in the walk/rest classification, based on k-means clustering, even visually showed a gross bimodal distribution. Indeed, mean silhouette scores, reflecting the performance of the clustering algorithm on this bimodal distribution, were close to the ideal unitary value, ranging from 0.929 to 0.963.
The results confirmed the hypothesis of the study: the regularity of a pseudo-periodic aerobic fatiguing activity involving steady gait at free chosen speed and cadence, in unsupervised conditions, tends to decrease (strictly negative mRI, the slope coefficient of the regularity index profile fitting line) for all the participants, included those who did not conclude the trial due to anticipatedly reaching physical exhaustion. This was further confirmed by the all-negative 95% confidence intervals of individual mRI (see the table in Supplementary Materials S4). This result complements what had already been described in aerobic laboratory-controlled conditions for healthy subjects [43], and in persons with multiple sclerosis in the 6 min walking test [23,45]. As to the identification of the factors associated with fatigue, we can hypothesize that both fatigued peripheral muscle systems [5,6] and central mental fatigue [3,4] might be responsible for an overall accumulation of fatigue.
Interestingly, cadence, another locomotor feature associated with fatigue [18,20], did not show a significant correlation with regularity indices. In particular, the trend of cadence did not show a unique picture in all participants, with the majority showing a negative trend of cadence, i.e., negative values of mCI (the slope coefficient of the cadence index profile fitting line). In fact, the participant (subject #1) characterized by the least duration taken to conclude the 100 km trial showed a positive trend of cadence. This was further confirmed by an all-positive 95% confidence interval of individual mCI index only for the identified participant (see the table in Supplementary Materials S4). This can be hypothesized, only on a speculative basis, to be due to a better athletic condition and/or to a planned strategic choice of that participant, allowed also by the fact that walking, as performed in the present study, is a submaximal activity [55]. A similar dilemma was considered in a recent review about fatigue effects on running [56] which reported variations in cadence with increasing fatigue either negative, associated with a fatigue-caused velocity decrease [57], or positive, which were explained as an adaptive strategy to decrease or minimize the impact forces [58]. Since the literature on fatigue effects on cadence is related to maximal or quasi-maximal efforts such as those implied in running [59], the finding of a not-so-strong association between fatigue increase and cadence decrease in submaximal aerobic walking is a novel complement to the cited literature.
Notably, the observed association between increasing fatigue and decreasing regularity is to be discussed against other possible confounding factors, which are known to be associated with gait variability and, particularly, to gait regularity. In order to affect also trends of regularity, it is necessary that the factors progressively affect the performance; they themselves must show a trend, or a trend might be hypothesized.
In the gait-analysis literature, gait speed has been the most cited confounding factor, a major covariate, of almost any gait-related variable, from anatomical variables such as joint angles and moments [60], to variables with a more complex construct such as gait regularity [29,30]. According to the previous remark, in the present experiment, a trend of gait speed was observed and quantified in all the participants. Therefore, the observed average decrease in gait speed during the whole performance (−1.5 km/h, from 5.7 to 4.2 km/h) has a confounding bias effect on the observed average decrease in regularity (−0.060 or −6.3%, as derived from Table 2). To quantify the percentage share of regularity decrement reasonably associated with gait speed decrement, data from a previous study on the modulation of gait speed on regularity [29] were retrieved. For a decrease of −1.4 km/h (from 5.0 to 3.6 km/h), an average decrease in the regularity index of −0.009 was observed. Extrapolating from the previous published information, in the hypothesis that the effects of the concurrent factors (increasing fatigue and decreasing speed) linearly superpose, it can be derived that about one sixth, i.e., less than 20%, of the observed decrease in regularity in the present study is ascribable to a decreasing speed covariant effect.
The other potential endogenous and exogenous factors affecting gait variability and regularity (pacing strategies, mental stamina [61], pacing synchronization with other athletes [62], motor control, weather and terrain conditions) cannot be ruled out. Nor can these factors be fully identified, since registrations of their occurrences are not available or measurable in the adopted methodological approach. A reasonable hypothesis is that exogenous factors act intermittently and asynchronously, and that they do not show a trend during the task. On the contrary, it is not possible to exclude trends in the occurrence of endogenous factors. It would not be surprising if, along the overall performance duration, stamina and motivation decrease, if interspersed breaks become more frequent, and if mental fatigue increases. However, it is necessary to remember that we are considering a submaximal task, despite its temporal length, and those endogenous factors are particularly stressed by maximal efforts. Concluding this speculative discussion on confounding factors, other than gait speed, we can make some assumptions: (a) intermittent asynchronous factors do not affect regularity trends; (b) some endogenous factors may have a null or a little effect on regularity trends, given their low impact in submaximal tasks; and (c) some endogenous factors (mental fatigue, gait breaks and similar factors) are expected to have a trend and to affect the regularity trend; accordingly they can contribute to a broader construct of fatigue, initially focused on muscular and metabolic components.
Given the above discussion on confounding factors, we feel confident in confirming the major association of increasing fatigue with decreasing gait regularity.
The results of this study allowed us to focus also on individual performances in a tentative attempt to use regularity assessment in classifying the individual performance strategy. A perusal of the outcome table shows that the less negative trend of regularity (mRI) characterizes the participant who took less time to conclude the trial (subject #1). But also looking at the other participant with the least negative mRI (subject #3), we can detect the least duration of effective walking (i.e., the whole duration less the resting phases). Given the association of fatigue and the regularity trend, the previous observations would confirm, at the individual level, that better performances characterize less fatigued participants. But the second-ranked participant (subject #4) apparently negates the previous hypothesis since this participant shows the worst, the most negative, trend of decreasing regularity. A perusal of its data allowed us to advance a possible speculative explanation: this participant had the least duration of resting phases between the marching bouts.
The main limitation of the present study is in the unsupervised nature of the experiment. While the unsupervised setting is a unique feature of real-life conditions and ensures the ecology of the trial, it may introduce uncontrolled factors and, ultimately, variability masking the hypothesized effects. Specific concerns about the possible recovery from fatigue during the resting intervals or by means of a speed modulation/reduction during the walking bouts are well posed. The only way to overcome this limit would be to set up a never-stopping steady walking exercise to be carried out until exhaustion or for a predefined duration, an option which has been already considered for race walking [63] and for prolonged running [64,65,66]. In this sense the unsupervised condition applied here tends to possibly mask or reduce the hypothesized reduction in regularity, which is nonetheless still detectable. We consider this a demonstration of the high sensitivity of the considered outcome index, particularly valuable for its applicability in real-life monitoring. As to the significance of the results for the general population, the main limitations of this study are (a) the limited sample size of the experimental group, due to the limited availability of monitoring sensors and to the need to perform the study at once during a single sport event; (b) the experimental group homogeneity, all male young adult subjects, necessitating a warning against a straightforward generalization of the results to the female population, notwithstanding the sex factor is known to play a relevant role in fatigue perception with females demonstrating greater endurance [67]. Accordingly, future studies should address the hypothesis of a similar sex effect also on locomotor regularity during an endurance aerobic trial. Moreover, the results of the present study cannot be directly extended to populations of patients affected by neuromuscular diseases, though the clinical studies on regularity cited in the Introduction support future assessment of the relation between fatigue exerted by low-intensity locomotor tasks and decrease in regularity in these populations. Another limit of the present study is in considering just one parameter, the regularity trend, as related to increasing fatigue. Fatigue is associated with a multidimensional spectrum of factors [68] and broader studies could consider in future the identification of fatigue phenotypes, with the regularity trend being just one component. Such studies could include other numerical indices, extracted from regularity time series, such as those resulting from sample entropy analyses [69], and those concerning symmetry of locomotion [31,33,34]. Particularly, with reference to the last point, the sensor position outside the sagittal symmetry plane, justified by the recording of one ECG derivation, did not allow in the present study the computation of symmetry-related indices, but it still allowed for a correct assessment of the regularity of accelerometric patterns [29]. Finally, a source of signal noise on the measurement is in the varying nature of the 100 km path and the obviously uncontrolled weather conditions. Addressing these limitations with novel experiments and studies will justify and enforce the possible developments, described in the following paragraphs, which otherwise might be considered suggestions.
The evidenced phenomena—the association between fatigue and gait regularity—may be explored in various applications to specific populations. The monitoring of the regularity of motor patterns in athletes, but also in military personnel, performing in pseudo-periodic locomotor sport tasks (marching, running, cycling, swimming, cross-country skiing, riding, rowing, and others) may provide an objective insight of the progression of fatigue during the performance. It may also support and monitor training schedules, particularly in Endurance Enhancement Training [70]. Interestingly the regularity assessment of sport performances could support either anaerobic performances, as shown elsewhere [43], or aerobic ones as in the present study.
The assessment of walking regularity may be considered in the functional evaluation of age-related modifications of locomotor functionality, and in pathologies of the neuromuscular system. The latter hypothesis is relevant since some diseases cause persons to suffer anticipated fatiguing, such as in persons with multiple sclerosis [23,45], as well as in persons with progressive onset of pain, such as joint osteoarthritis [39] or in persons with lower limb external prosthesis suffering from a progressive pain at the leg stump [40].
Beyond functional assessment, the regularity assessment is to be considered when specific rehabilitation interventions are aimed at improving endurance, by reducing fatigability. The regularity trend, assessed in real time [49] during a rehab/training session might quantify its outcome. Furthermore, the real-time implementation of the method—possibly on a smartphone—might support a bio-feedback rehabilitation approach. Finally, a real-life verification of augmented endurance might provide the final demonstration of intervention success. Interestingly, an accurate monitoring of functions during assessments or rehabilitation might take advantage from a multisensory approach; in the present study we considered a single sensor setup, positioned on the chest, but as shown in another study [29] regularity may be assessed at different body locations and position-specific trends of regularity might give indications on the anatomical part responsible for locomotor disregularities.

5. Conclusions

In conclusion the present study on gait regularity during an unsupervised endurance task complements already published data about the association between progressive accumulation of fatigue and a decrease in the regularity of locomotion in controlled laboratory settings. The novelty of the present study consists of the non-maximal nature of the effort and the unsupervised real-life aerobic conditions of the locomotor performances, without full control of confounding factors. The main limitation is the small size of the experimental group and its homogeneity, with all the participants being healthy adult male subjects. Future applications should cope with the inclusion of a female experimental group, and can be considered in the assessment of functional deficits affecting endurance, rehabilitation of locomotion, or in supporting sport training and the definition of competition strategies.

Supplementary Materials

The following supporting information can be downloaded at https://www.mdpi.com/article/10.3390/app16126203/s1. Supporting information, included in five separate files, are available as Supplementary Materials: “Supplementary Materials S1—participants’ previous experiences and Borg-RPE.xlsx”, “Supplementary Materials S2—defragmenting algorithm.docx”, “Supplementary Materials S3—bout timings and stages.xlsx”, “Supplementary Materials S4—Table 2 Confidence Intervals.xlsx”, “Supplementary Materials S5—crosscorrelation coeffs between indexes.xlsx”.

Author Contributions

Conceptualization: M.R., M.S. and M.A.M.; data curation: M.R. and S.M.; formal analysis: M.R., I.C. and S.M.; funding acquisition: M.R., M.S. and M.A.M.; investigation: S.M., M.S. and M.A.M.; methodology: M.R., G.M. and M.A.M.; project administration: M.S. and M.A.M.; resources: G.M., M.S. and M.A.M.; software: M.R., I.C. and S.M.; supervision: M.S. and M.A.M.; validation: M.R., S.M. and M.A.M.; visualization: M.R., I.C. and S.M.; writing: M.R. and M.A.M. All authors have read and agreed to the published version of the manuscript.

Funding

Authors M.R., I.C. and G.M. acknowledge funding from the Italian Ministry of Health (“Ricerca Corrente 2025–2027”).

Institutional Review Board Statement

The study was conducted in accordance with the Declaration of Helsinki, and approved by the Charité Ethics Board, Berlin (review number EA1/163/14, approval date: 12 July 2018).

Informed Consent Statement

Informed consent was obtained from all subjects involved in the study.

Data Availability Statement

The datasets supporting the conclusions of this article are included within the article and its Supplementary Materials.

Acknowledgments

The authors acknowledge all the participants involved in the study. No AI tool was used in the study or in the manuscript preparation.

Conflicts of Interest

The authors declare no conflict of interest.

Abbreviation

The following abbreviation is used in this manuscript:
RPERate of Perceived Exertion

References

  1. Keyser, R.E. Peripheral Fatigue: High-Energy Phosphates and Hydrogen Ions. PM&R 2010, 2, 347–358. [Google Scholar] [CrossRef] [Scilit] [PubMed]
  2. Louhevaara, V.; Smolander, J.; Aminoff, T.; Korhonen, O.; Shen, N. Cardiorespiratory Responses to Fatiguing Dynamic and Isometric Hand-Grip Exercise. Eur. J. Appl. Physiol. 2000, 82, 340–344. [Google Scholar] [CrossRef] [Scilit] [PubMed]
  3. Van Cutsem, J.; Marcora, S.; De Pauw, K.; Bailey, S.; Meeusen, R.; Roelands, B. The Effects of Mental Fatigue on Physical Performance: A Systematic Review. Sports Med. 2017, 47, 1569–1588. [Google Scholar] [CrossRef] [Scilit] [PubMed]
  4. Behrens, M.; Mau-Moeller, A.; Lischke, A.; Katlun, F.; Gube, M.; Zschorlich, V.; Skripitz, R.; Weippert, M. Mental Fatigue Increases Gait Variability During Dual-Task Walking in Old Adults. J. Gerontol. A Biol. Sci. Med. Sci. 2018, 73, 792–797. [Google Scholar] [CrossRef] [Scilit] [PubMed]
  5. O’Leary, T.J.; Collett, J.; Howells, K.; Morris, M.G. Endurance Capacity and Neuromuscular Fatigue Following High- vs Moderate-Intensity Endurance Training: A Randomized Trial. Scand. J. Med. Sci. Sports 2017, 27, 1648–1661. [Google Scholar] [CrossRef] [Scilit] [PubMed]
  6. Schäfer, L.U.; Hayes, M.; Dekerle, J. The Magnitude of Neuromuscular Fatigue Is Not Intensity Dependent When Cycling above Critical Power but Relates to Aerobic and Anaerobic Capacities. Exp. Physiol. 2019, 104, 209–219. [Google Scholar] [CrossRef] [Scilit] [PubMed]
  7. Strang, A.J.; Berg, W.P. Fatigue-Induced Adaptive Changes of Anticipatory Postural Adjustments. Exp. Brain Res. 2007, 178, 49–61. [Google Scholar] [CrossRef] [Scilit] [PubMed]
  8. Vieira, M.F.; de Avelar, I.S.; Silva, M.S.; Soares, V.; Lobo da Costa, P.H. Effects of Four Days Hiking on Postural Control. PLoS ONE 2015, 10, e0123214. [Google Scholar] [CrossRef] [Scilit] [PubMed]
  9. Zhang, G.; Chen, T.L.; Wang, Y.; Tan, Q.; Hong, T.T.; Peng, Y.; Chen, S.F.; Zhang, M. Effects of Prolonged Brisk Walking Induced Lower Limb Muscle Fatigue on the Changes of Gait Parameters in Older Adults. Gait Posture 2023, 101, 145–153. [Google Scholar] [CrossRef] [Scilit] [PubMed]
  10. Stutzig, N.; Siebert, T. Muscle Force Compensation among Synergistic Muscles after Fatigue of a Single Muscle. Hum. Mov. Sci. 2015, 42, 273–287. [Google Scholar] [CrossRef] [Scilit] [PubMed]
  11. McDonald, A.C.; Mulla, D.M.; Keir, P.J. Muscular and Kinematic Adaptations to Fatiguing Repetitive Upper Extremity Work. Appl. Ergon. 2019, 75, 250–256. [Google Scholar] [CrossRef] [Scilit] [PubMed]
  12. Azzolino, D.; Coelho-Junior, H.J.; Proietti, M.; Manzini, V.M.; Cesari, M. Fatigue in Older Persons: The Role of Nutrition. Proc. Nutr. Soc. 2023, 82, 39–46. [Google Scholar] [CrossRef] [Scilit] [PubMed]
  13. Penner, I.K.; Paul, F. Fatigue as a Symptom or Comorbidity of Neurological Diseases. Nat. Rev. Neurol. 2017, 13, 662–675. [Google Scholar] [CrossRef] [Scilit] [PubMed]
  14. Hanley, B.; Bissas, A.; Drake, A. Kinematic Characteristics of Elite Men’s and Women’s 20 km Race Walking and Their Variation during the Race. Sports Biomech. 2011, 10, 110–124. [Google Scholar] [CrossRef] [Scilit] [PubMed]
  15. Sibley, K.M.; Tang, A.; Patterson, K.K.; Brooks, D.; McIlroy, W.E. Changes in Spatiotemporal Gait Variables over Time during a Test of Functional Capacity after Stroke. J. Neuroeng. Rehabil. 2009, 6, 27. [Google Scholar] [CrossRef] [Scilit] [PubMed]
  16. Escudero-Uribe, S.; Hochsprung, A.; Izquierdo-Ayuso, G. Gait Pattern Changes after Six-Minute Walk Test in Persons with Multiple Sclerosis. Physiother. Res. Int. 2019, 24, e1741. [Google Scholar] [CrossRef] [Scilit] [PubMed]
  17. Boudarham, J.; Roche, N.; Pradon, D.; Delouf, E.; Bensmail, D.; Zory, R. Effects of Quadriceps Muscle Fatigue on Stiff-Knee Gait in Patients with Hemiparesis. PLoS ONE 2014, 9, e94138. [Google Scholar] [CrossRef] [Scilit] [PubMed]
  18. Santos, P.C.R.D.; Barbieri, F.A.; Zijdewind, I.; Gobbi, L.T.B.; Lamoth, C.; Hortobágyi, T. Effects of Experimentally Induced Fatigue on Healthy Older Adults’ Gait: A Systematic Review. PLoS ONE 2019, 14, e0226939. [Google Scholar] [CrossRef] [Scilit] [PubMed]
  19. Ghani, H.A.; Alghwiri, A.A.; Hisham, H.; Manaf, H. Lower Limb Muscle Fatigue Alters Spatiotemporal Gait Parameters and Turning Difficulty Characteristics in Parkinson’s Disease. Ann. Rehabil. Med. 2023, 47, 282–290. [Google Scholar] [CrossRef] [Scilit] [PubMed]
  20. Ghani, H.A.; Justine, M.; Manaf, H. Effects of Lower Limb Muscle Fatigue on Gait Performance and Postural Control among Individuals with Parkinson’s Disease: A Review of Literature. Phys. Ther. Rev. 2019, 24, 274–279. [Google Scholar] [CrossRef] [Scilit]
  21. Chardon, M.; Barbieri, F.A.; Penedo, T.; Santos, P.C.R.; Vuillerme, N. The Effects of Experimentally-Induced Fatigue on Gait Parameters during Obstacle Crossing: A Systematic Review. Neurosci. Biobehav. Rev. 2022, 142, 104854. [Google Scholar] [CrossRef] [Scilit] [PubMed]
  22. Chen, S.H.; Chou, L.S. Gait Balance Control after Fatigue: Effects of Age and Cognitive Demand. Gait Posture 2022, 95, 129–134. [Google Scholar] [CrossRef] [Scilit] [PubMed]
  23. Shema-Shiratzky, S.; Gazit, E.; Sun, R.; Regev, K.; Karni, A.; Sosnoff, J.J.; Herman, T.; Mirelman, A.; Hausdorff, J.M. Deterioration of Specific Aspects of Gait during the Instrumented 6-min Walk Test among People with Multiple Sclerosis. J. Neurol. 2019, 266, 3022–3030. [Google Scholar] [CrossRef] [Scilit] [PubMed]
  24. Granacher, U.; Wolf, I.; Wehrle, A.; Bridenbaugh, S.; Kressig, R.W. Effects of Muscle Fatigue on Gait Characteristics under Single and Dual-Task Conditions in Young and Older Adults. J. Neuroeng. Rehabil. 2010, 7, 56. [Google Scholar] [CrossRef] [Scilit] [PubMed]
  25. Kowalski, K.L.; Boolani, A.; Christie, A.D. Sex Differences in the Impact of State and Trait Fatigue on Gait Variability. Hum. Mov. Sci. 2021, 80, 102884. [Google Scholar] [CrossRef] [Scilit] [PubMed]
  26. Hamacher, D.; Hamacher, D.; Hohnbaum, M.; Gerth, K.; Schega, L.; Zech, A. Effects of Physical Exhaustion on Local Dynamic Stability and Automaticity of Walking. Gait Posture 2018, 66, 135–138. [Google Scholar] [CrossRef] [Scilit] [PubMed]
  27. Hamacher, D.; Törpel, A.; Hamacher, D.; Schega, L. The Effect of Physical Exhaustion on Gait Stability in Young and Older Individuals. Gait Posture 2016, 48, 137–139. [Google Scholar] [CrossRef] [Scilit] [PubMed]
  28. Moe-Nilssen, R.; Helbostad, J.L. Estimation of Gait Cycle Characteristics by Trunk Accelerometry. J. Biomech. 2004, 37, 121–126. [Google Scholar] [CrossRef] [Scilit] [PubMed]
  29. Scalera, G.M.; Ferrarin, M.; Rabuffetti, M. Gait Regularity Assessed by Wearable Sensors: Comparison between Accelerometer and Gyroscope Data for Different Sensor Locations and Walking Speeds in Healthy Subjects. J. Biomech. 2020, 113, 110115. [Google Scholar] [CrossRef] [Scilit] [PubMed]
  30. Rabuffetti, M.; Scalera, G.M.; Ferrarin, M. Effects of Gait Strategy and Speed on Regularity of Locomotion Assessed in Healthy Subjects Using a Multi-Sensor Method. Sensors 2019, 19, 513. [Google Scholar] [CrossRef] [Scilit] [PubMed]
  31. Kobsar, D.; Olson, C.; Paranjape, R.; Hadjistavropoulos, T.; Barden, J.M. Evaluation of Age-Related Differences in the Stride-to-Stride Fluctuations, Regularity and Symmetry of Gait Using a Waist-Mounted Tri-Axial Accelerometer. Gait Posture 2014, 39, 553–557. [Google Scholar] [CrossRef] [Scilit] [PubMed]
  32. Gillain, S.; Boutaayamou, M.; Dardenne, N.; Schwartz, C.; Demonceau, M.; Gerontitis, C.; Depierreux, F.; Salmon, E.; Garraux, G.; Bruyère, O.; et al. Data Set of Healthy Old People Assessed for Three Walking Conditions Using Accelerometric and Opto-Electronic Methods. Aging Clin. Exp. Res. 2017, 29, 1201–1209. [Google Scholar] [CrossRef] [Scilit] [PubMed]
  33. Kobayashi, H.; Kakihana, W.; Kimura, T. Combined Effects of Age and Gender on Gait Symmetry and Regularity Assessed by Autocorrelation of Trunk Acceleration. J. Neuroeng. Rehabil. 2014, 11, 109. [Google Scholar] [CrossRef] [Scilit] [PubMed]
  34. Kobsar, D.; Barden, J.M.; Clermont, C.; Wilson, J.L.A.; Ferber, R. Sex Differences in the Regularity and Symmetry of Gait in Older Adults with and without Knee Osteoarthritis. Gait Posture 2022, 95, 192–197. [Google Scholar] [CrossRef] [Scilit] [PubMed]
  35. Gan, X.; Liu, X.; Cai, D.; Zhang, R.; Li, F.; Fang, H.; Huang, J.; Qiu, C.; Zhan, H. Wearable Accelerometers Reveal Objective Assessment of Walking Symmetry and Regularity in Idiopathic Scoliosis Patients. PeerJ 2024, 12, e17739. [Google Scholar] [CrossRef] [Scilit] [PubMed]
  36. Araki, S.; Matsuura, H.; Miyazaki, T.; Matsuzawa, Y.; Nakai, Y.; Kawada, M.; Takeshita, Y.; Takamura, M.; Kiyama, R. Longitudinal Changes in Vertical Stride Regularity, Hip Flexion, and Knee Flexion Contribute to the Alteration in Gait Speed during Hospitalization for Stroke. Hum. Mov. Sci. 2024, 95, 103227. [Google Scholar] [CrossRef] [Scilit] [PubMed]
  37. Igarashi, T.; Tani, Y.; Takeda, R.; Asakura, T. Accelerometer-Based Gait Characteristics and Their Discrimination of Gait Independence in Inpatients with Subacute Stroke. Gait Posture 2024, 110, 138–143. [Google Scholar] [CrossRef] [Scilit] [PubMed]
  38. Barden, J.M.; Hoffert, L.; Ruf, S.; McCarville, D.; Kopriva, D. The Effect of Peripheral Arterial Disease and Intermittent Claudication on Gait Regularity and Symmetry. J. Biomech. 2022, 141, 111205. [Google Scholar] [CrossRef] [Scilit] [PubMed]
  39. Barden, J.M.; Clermont, C.A.; Kobsar, D.; Beauchet, O. Accelerometer-Based Step Regularity Is Lower in Older Adults with Bilateral Knee Osteoarthritis. Front. Hum. Neurosci. 2016, 10, 625. [Google Scholar] [CrossRef] [Scilit] [PubMed]
  40. Tura, A.; Raggi, M.; Rocchi, L.; Cutti, A.G.; Chiari, L. Gait Symmetry and Regularity in Transfemoral Amputees Assessed by Trunk Accelerations. J. Neuroeng. Rehabil. 2010, 7, 4. [Google Scholar] [CrossRef] [Scilit] [PubMed]
  41. Bruce, R.A.; Blackmon, J.R.; Jones, J.W.; Strait, G. Exercising Testing in Adult Normal Subjects and Cardiac Patients. Pediatrics 1963, 32, 742–756. Available online: http://www.ncbi.nlm.nih.gov/pubmed/14070531 (accessed on 3 March 2021). [CrossRef] [Scilit]
  42. Bruce, R.A.; Blackmon, J.R.; Jones, J.W.; Strait, G. Exercising Testing in Adult Normal Subjects and Cardiac Patients. Ann. Noninvasive Electrocardiol. 2004, 9, 291–303. [Google Scholar] [CrossRef] [Scilit] [PubMed]
  43. Rabuffetti, M.; Steinach, M.; Lichti, J.; Gunga, H.C.; Balcerek, B.; Becker, P.N.; Fähling, M.; Merati, G.; Maggioni, M.A. The Association of Fatigue with Decreasing Regularity of Locomotion during an Incremental Test in Trained and Untrained Healthy Adults. Front. Bioeng. Biotechnol. 2021, 9, 724791. [Google Scholar] [CrossRef] [Scilit] [PubMed]
  44. Le Bris, R.; Billat, V.; Auvinet, B.; Chaleil, D.; Hamard, L.; Barrey, E. Effect of Fatigue on Stride Pattern Continuously Measured by an Accelerometric Gait Recorder in Middle Distance Runners. J. Sports Med. Phys. Fit. 2006, 46, 227–231. [Google Scholar] [PubMed]
  45. Carpinella, I.; Bertoni, R.; Anastasi, D.; Cardini, R.; Lencioni, T.; Ferrarin, M.; Cattaneo, D.; Gervasoni, E. Walk Longer! Using Wearable Inertial Sensors to Uncover Which Gait Aspects Should Be Treated to Increase Walking Endurance in People with Multiple Sclerosis. Sensors 2024, 24, 7284. [Google Scholar] [CrossRef] [Scilit] [PubMed]
  46. Jonsdottir, J.; Cattaneo, D.; Recalcati, M.; Regola, A.; Rabuffetti, M.; Ferrarin, M.; Casiraghi, A. Task-Oriented Biofeedback to Improve Gait in Individuals with Chronic Stroke: Motor Learning Approach. Neurorehabil. Neural Repair 2010, 24, 478–485. [Google Scholar] [CrossRef] [Scilit] [PubMed]
  47. Hinton, E.H.; Buffum, R.; Kingston, D.; Stergiou, N.; Kesar, T.; Bierner, S.; Knarr, B.A. Real-Time Visual Kinematic Feedback during Overground Walking Improves Gait Biomechanics in Individuals Post-Stroke. Ann. Biomed. Eng. 2024, 52, 355–363. [Google Scholar] [CrossRef] [Scilit] [PubMed]
  48. Baudendistel, S.T.; Franz, J.R.; Schmitt, A.C.; Wade, F.E.; Pappas, M.C.; Au, K.L.K.; Hass, C.J. Visual Feedback Improves Propulsive Force Generation during Treadmill Walking in People with Parkinson Disease. J. Biomech. 2024, 167, 112073. [Google Scholar] [CrossRef] [Scilit] [PubMed]
  49. Zhang, G.; Hong, T.T.; Li, L.; Zhang, M. Automatic Detection of Fatigued Gait Patterns in Older Adults: An Intelligent Portable Device Integrating Force and Inertial Measurements with Machine Learning. Ann. Biomed. Eng. 2025, 53, 48–58. [Google Scholar] [CrossRef] [Scilit] [PubMed]
  50. Jörres, M.; Gunga, H.C.; Steinach, M. Physiological Changes, Activity, and Stress during a 100-km-24-h Walking-March. Front. Physiol. 2021, 12, 640710. [Google Scholar] [CrossRef] [Scilit] [PubMed]
  51. Rabuffetti, M.; Meriggi, P.; Pagliari, C.; Bartolomeo, P.; Ferrarin, M. Differential Actigraphy for Monitoring Asymmetry in Upper Limb Motor Activities. Physiol. Meas. 2016, 37, 1798–1812. [Google Scholar] [CrossRef] [Scilit] [PubMed]
  52. Borg, G.A. Psychophysical Bases of Perceived Exertion. Med. Sci. Sports Exerc. 1982, 14, 377–381. [Google Scholar] [CrossRef] [Scilit] [PubMed]
  53. Tura, A.; Rocchi, L.; Raggi, M.; Cutti, A.G.; Chiari, L. Recommended Number of Strides for Automatic Assessment of Gait Symmetry and Regularity in Above-Knee Amputees by Means of Accelerometry and Autocorrelation Analysis. J. Neuroeng. Rehabil. 2012, 9, 11. [Google Scholar] [CrossRef] [Scilit] [PubMed]
  54. Urbanek, J.K.; Zipunnikov, V.; Harris, T.; Fadel, W.; Glynn, N.; Koster, A.; Caserotti, P.; Crainiceanu, C.; Harezlak, J. Prediction of Sustained Harmonic Walking in the Free-Living Environment Using Raw Accelerometry Data. Physiol. Meas. 2018, 39, 02NT02. [Google Scholar] [CrossRef] [Scilit] [PubMed]
  55. Yang, H.I.; Cho, W.; Lee, D.H.; Suh, S.H.; Jeon, J.Y. Development of a New Submaximal Walk Test to Predict Maximal Oxygen Consumption in Healthy Adults. Sensors 2021, 21, 5726. [Google Scholar] [CrossRef] [Scilit] [PubMed]
  56. Olaya-Cuartero, J.; Lopez-Arbues, B.; Jimenezolmedo, J.M.; Villalon-Gasch, L. Influence of Fatigue on the Modification of Biomechanical Parameters in Endurance Running: A Systematic Review. Int. J. Exerc. Sci. 2024, 17, 1377–1391. [Google Scholar] [CrossRef] [Scilit] [PubMed]
  57. Hanley, B.; Bissas, A.; Merlino, S. Men’s and Women’s World Championship Marathon Performances and Changes with Fatigue Are Not Explained by Kinematic Differences between Footstrike Patterns. Front. Sports Act. Living 2020, 2, 102. [Google Scholar] [CrossRef] [Scilit] [PubMed]
  58. Reenalda, J.; Maartens, E.; Homan, L.; Buurke, J.H.J. Continuous Three Dimensional Analysis of Running Mechanics during a Marathon by Means of Inertial Magnetic Measurement Units to Objectify Changes in Running Mechanics. J. Biomech. 2016, 49, 3362–3367. [Google Scholar] [CrossRef] [Scilit] [PubMed]
  59. Winter, S.; Gordon, S.; Watt, K. Effects of Fatigue on Kinematics and Kinetics during Over Ground Running: A Systematic Review. J. Sports Med. Phys. Fit. 2017, 57, 887–899. [Google Scholar] [CrossRef] [Scilit] [PubMed]
  60. Lencioni, T.; Carpinella, I.; Rabuffetti, M.; Marzegan, A.; Ferrarin, M. Human kinematic, kinetic and EMG data during different walking and stair ascending and descending tasks. Sci. Data 2019, 6, 309. [Google Scholar] [CrossRef] [Scilit] [PubMed]
  61. Sun, H.; Soh, K.G.; Mohammadi, A.; Toumi, Z.; Zhang, L.; Ding, C.; Gao, X.; Tian, J. Counteracting Mental Fatigue for Athletes: A Systematic Review of the Interventions. BMC Psychol. 2024, 12, 67. [Google Scholar] [CrossRef] [Scilit] [PubMed]
  62. Harman, B.; Kosirnik, C.; Antonini Philippe, R. From Social Interactions to Interpersonal Relationships: Influences on Ultra-Runners’ Race Experience. PLoS ONE 2019, 14, e0225195. [Google Scholar] [CrossRef] [Scilit] [PubMed]
  63. Hanley, B.; Bissas, A.; Drake, A. Kinematic Characteristics of Elite Men’s 50 km Race Walking. Eur. J. Sport Sci. 2013, 13, 272–279. [Google Scholar] [CrossRef] [Scilit] [PubMed]
  64. Giovanelli, N.; Taboga, P.; Lazzer, S. Changes in Running Mechanics during a 6-Hour Running Race. Int. J. Sports Physiol. Perform. 2017, 12, 642–647. [Google Scholar] [CrossRef] [Scilit] [PubMed]
  65. Clermont, C.A.; Benson, L.C.; Edwards, W.B.; Hettinga, B.A.; Ferber, R. New Considerations for Wearable Technology Data: Changes in Running Biomechanics during a Marathon. J. Appl. Biomech. 2019, 35, 401–409. [Google Scholar] [CrossRef] [Scilit] [PubMed]
  66. Cartón-Llorente, A.; Roche-Seruendo, L.E.; Mainer-Pardos, E.; Nobari, H.; Rubio-Peirotén, A.; Jaén-Carrillo, D.; García-Pinillos, F. Acute effects of a 60-min time trial on power-related parameters in trained endurance runners. BMC Sports Sci. Med. Rehabil. 2022, 14, 142. [Google Scholar] [CrossRef] [Scilit] [PubMed]
  67. Pons, M.S.; Hunter, S.K.; Ansdell, P. Sex Differences in Fatigability and Recovery Following a 5 km Running Time Trial in Recreationally Active Adults. Eur. J. Sport Sci. 2023, 23, 2349–2356. [Google Scholar] [CrossRef] [Scilit] [PubMed]
  68. Smets, E.M.; Garssen, B.; Bonke, B.; De Haes, J.C. The Multidimensional Fatigue Inventory (MFI) Psychometric Qualities of an Instrument to Assess Fatigue. J. Psychosom. Res. 1995, 39, 315–325. [Google Scholar] [CrossRef] [Scilit] [PubMed]
  69. Palacin, F.; Poinsard, L.; Billat, V. Multidimensional Analysis of Physiological Entropy during Self-Paced Marathon Running. Sports 2024, 12, 252. [Google Scholar] [CrossRef] [Scilit] [PubMed]
  70. Joyner, M.J.; Coyle, E.F. Endurance exercise performance: The physiology of champions. J. Physiol. 2008, 586, 35–44. [Google Scholar] [CrossRef] [Scilit] [PubMed]
Figure 1. Time profile of regularity index RI (upper panel) and cadence index CI (lower panel) for subject #4. Abscissa reports actual time in 24h format. On the presented data, five walking bouts (each one beginning at a vertical green dotted line and ending at a vertical red dotted line) were identified which coincide with the five stages of the Mammutmarsch path.
Applsci 16 06203 g001
Figure 2. The individual average walking speed per stage and fitted linear profile of overall walking speed trend during the Mammutmarsch.
Applsci 16 06203 g002
Figure 3. Spaghetti plot of individual trends of regularity index. Each individual line is characterized by initial Y-value corresponding to RI0, final Y-value corresponding to RIend, range of X-values corresponding to Total Duration and slope corresponding to mRI.
Applsci 16 06203 g003
Table 1. The demographic data of the study participants.
IdSexAge (years)Body Height (cm)Body Mass (kg)BMI (kg/m2)Experienced
1m2919491.6524.4No
2m3017172.2524.6Yes
3m45177.578.324.6Yes
4m4419181.4522.2No
5m3018178.223.8No
6m42176.565.820.8Yes
7m2217670.7522.9No
8m2318988.824.9Yes
9m3617878.225.9Yes
10m37184.580.823.7Yes
Table 2. The performance indices of the study participants.
IdWalked Distance
(km)
RPE
[6,7,8,9,10,11,12,13,14,15,16,17,18,19,20]
Total Duration
(hours)
Walking Duration
(hours)
Resting Duration
(hours)
Walking Bouts
(N)
Longest Walking Bout
(hours)
Longest Resting
(hours)
RI0
[0..1]
mRI
(1/hour)
RIend
(0..1)
CI0
(steps/min)
mCI
(CI/hours)
CIend
(steps/min)
11001821.8018.952.8574.080.860.941−0.00090.920108.10.13111.0
41001722.1320.072.0655.350.710.958−0.00520.844108.7−0.5297.1
31001922.2018.763.4383.590.820.956−0.00110.931119.1−0.14116.0
61001822.6620.552.1083.990.560.962−0.00140.931115.2−0.27109.1
21001923.0019.493.51103.910.780.936−0.00270.875115.2−0.20110.6
71001625.2221.064.16113.890.930.948−0.00460.833114.0−0.10111.6
81001725.2221.174.05103.890.920.952−0.00330.868110.7−0.11108.0
91001725.5521.434.12124.330.880.944−0.00200.892113.2−0.28106.0
10561711.6610.790.8643.960.380.965−0.00410.918109.7−0.30106.2
5561711.8210.791.0343.980.560.953−0.00430.902117.5−0.51111.5
Disclaimer/Publisher’s Note: The statements, opinions and data contained in all publications are solely those of the individual author(s) and contributor(s) and not of MDPI and/or the editor(s). MDPI and/or the editor(s) disclaim responsibility for any injury to people or property resulting from any ideas, methods, instructions or products referred to in the content.