1. Introduction
Grading open-ended student work consistently and fairly remains a persistent challenge in higher education. Analytic rubrics can improve transparency, promote alignment between learning outcomes and assessment, and make feedback more actionable. Even so, inter-rater variability is common, particularly when criteria involve holistic judgment, creativity, or perceived quality. Reliability research therefore recommends explicit model choice and careful interpretation when intraclass correlation coefficients (ICCs) are used to support claims about scoring consistency [
1,
2,
3].
Automated essay scoring (AES) systems predate large language models (LLMs) by decades. Classical systems such as e-rater demonstrated meaningful human–machine associations under constrained prompts and operationally standardized settings, while also highlighting persistent issues of construct coverage, transparency, and governance [
4,
5]. The recent rise of LLMs has renewed interest in rubric-guided scoring because models can respond directly to natural-language criteria rather than only to hand-engineered features. Early evidence suggests that LLMs can align reasonably well with human raters when rubrics are explicit and prompt structure is stable, but published studies also warn that agreement may deteriorate without calibration and that case-level substitution often remains difficult [
6,
7,
8,
9,
10].
For this reason, agreement-oriented evaluation is more informative than correlation alone. Correlation indicates whether higher human scores tend to correspond to higher AI scores, but it does not show whether the two methods are close enough to be operationally interchangeable. ICC provides a reliability-oriented summary of agreement under a specified rater design, whereas Bland–Altman analysis makes systematic bias and the likely range of pairwise differences visible on the original score scale [
1,
11]. In studies of AI-assisted grading, design fairness is also critical: agreement with the mean of two human raters can appear stronger than agreement with a single human because averaging reduces random error.
The present study investigates whether a rubric-guided LLM can approximate human scoring of text-based responses collected in three university courses at one institution, rather than whether an LLM can generally replace grading in higher education. This distinction is important because the dataset includes written answers about Photoshop workflows, prompt-design principles, and AI-video tools rather than the students’ final design or multimedia artifacts. The paper should therefore be read as a study of agreement on rubric scoring of written responses under a fixed scoring prompt.
Four research questions are addressed. RQ1: How do AI–H1, AI–H2, and AI–HC agreement compare with the observed human–human baseline across rubric traits and the Total score? RQ2: How strongly are AI and human scores associated overall and by course? RQ3: What kinds of systematic bias, individual-level disagreement, and threshold-adjacent error remain after aggregate agreement is taken into account? RQ4: How much can simple course-specific held-out calibration improve operational fit, and what conservative recommendations for human–AI co-grading follow from these results?
The contributions of the study are fourfold. First, a multi-metric evaluation of rubric-guided LLM scoring is provided using agreement statistics that are directly relevant to educational deployment: ICC, Pearson association, MAE, and Bland–Altman bias and limits of agreement. Second, AI performance is interpreted against the observed human–human baseline using not only AI–HC but also AI–H1 and AI–H2 comparisons, thereby making the averaging effect of HC explicit. Third, threshold-oriented operational checks and a held-out course-specific calibration analysis are reported rather than leaving calibration as a purely future concern. Fourth, the empirical findings are translated into a conservative workflow proposal for calibrated human–AI co-grading in text-response settings, emphasizing oversight for low-stability traits and decision-critical cases. The remainder of the paper reviews related work, summarizes the study design and analysis strategy, reports the empirical results, and discusses implications, limitations, ethics, and data availability.
3. Materials and Methods
3.1. Study Context and Dataset
The dataset comprised 930 student assessment records from three university courses: Photoshop Design (), Prompt Engineering (), and AI Video Production (). The integrated score structure was formed by matching student records across two human-scoring spreadsheets and one AI-scoring spreadsheet by course sheet and student identifier. Each matched record included five rubric scores and a Total score from each scorer.
The three courses involved different text-response contexts. Prompt Engineering responses asked students to explain principles or design strategies for generative-AI prompting. Photoshop Design responses required students to describe production workflows, technical decisions, and design-quality considerations for visual tasks. AI Video Production responses focused on features, uses, and workflow reasoning related to AI-assisted video creation tools. The broader curricular context of these courses is described in Kim et al. [
15].
A common analytic rubric was used across the dataset. The rubric dimensions were Accuracy, Logical Flow, Specificity, Quality, and Originality, each scored from 0.0 to 3.0 with one-decimal precision. The Total score ranged from 0 to 15. A crucial boundary condition is that the evaluated input for the present study was the student’s written response. In the Photoshop Design and AI Video Production courses, the AI grader did not inspect the students’ final visual or multimedia artifacts. The findings should therefore be interpreted as evidence about text-response scoring, not as validation of AI grading for authentic multimedia products.
For reproducible case matching, the unit of analysis was one unique course-by-student case. Records were matched across the two human workbooks and the AI workbook by course identifier and student identifier. When duplicate rows existed within a course, the submitted row was retained; if no submitted row existed, the non-submission row was retained as a zero-score case according to the workbook convention. In the AI workbook, four non-submission rows with blank rubric scores were set to zero, and one malformed Total entry was reconstructed from the five component scores. After cleaning, the final matched dataset contained 930 cases with no missing analytic score cells.
As an additional integrity check, the recorded AI Total score was compared with the arithmetic sum of the five AI rubric traits. In 74 of 930 cases (8.0%), the recorded AI Total did not equal the sum of the component scores. A sensitivity analysis using recomputed Totals produced nearly identical Total-score conclusions (AI–HC ICC = 0.763 using the recorded Total versus 0.760 using the recomputed Total), so the substantive interpretation of the study was unchanged.
3.2. Human and AI Scoring Procedure
Two teaching assistants for the relevant courses, who were not authors of this study, independently scored each response using the same rubric. Both raters had completed master’s-level coursework in the corresponding subject area and had prior experience in rubric-based grading of student coursework. The two raters applied the rubric independently and were not informed of the AI scores. Because rater characteristics such as disciplinary background, grading experience, and individual interpretation of subjective criteria can influence scoring, the two raters were retained as separate references (H1 and H2) throughout the analysis rather than being collapsed into a single human score at the outset; the implications of rater-specific interpretation are examined further in the Discussion.
For analysis, human consensus (HC) was defined as the arithmetic mean of the two human scores for each trait and for the Total score. HC was treated as a pragmatic reference rather than a gold-standard label. This distinction matters because averaging two human raters reduces random error and can make AI agreement appear stronger than comparison with a single rater would suggest.
To make the scoring procedure concrete,
Table 1 illustrates how a single response is processed. For each case, H1 and H2 independently assign the five rubric traits and the Total, the AI assigns the same fields under the fixed prompt, and HC is computed as the trait-wise and Total mean of H1 and H2. The agreement metrics reported later are then computed across all 930 such cases. Because the underlying responses are part of protected educational records, the values shown are a representative, illustrative case used only to clarify the workflow rather than a disclosed student record.
The AI scorer was ChatGPT (o4-mini-high), used with a fixed prompt template and stable inference settings. A single model was used deliberately and for reasons of internal validity rather than convenience: the research question concerns whether one fixed, deterministically configured rubric-guided scorer can approximate a specific local human grading practice, not which commercial LLM scores best. Holding the model, prompt, and inference settings constant isolates the agreement question from confounds introduced by cross-model variation, and it reflects the realistic deployment case in which an institution standardizes on one model. Scoring was conducted under deterministic settings, including a temperature of zero, and the model was instructed to output numeric rubric scores aligned with the common analytic rubric. The scoring protocol did not report subject-specific few-shot exemplars or fine-tuning procedures. The fixed-prompt, single-model design improved procedural consistency, but a direct consequence is that the present study does not establish robustness to prompt edits, model changes, or alternative output constraints; multi-model replication is identified as a priority for future work (
Section 5).
3.3. Analysis Framework
The analysis centered on four complementary metrics: ICC, Pearson correlation, MAE, and Bland–Altman mean bias with 95% limits of agreement (LoA). Human–human agreement (H1–H2) served as the local baseline, and AI–HC performance was evaluated using the same framework. Course-level Total-score analyses were used to identify domain-dependent changes in agreement.
Agreement and error were defined on the observed score scale. MAE was computed as
and Bland–Altman summaries were reported using
In Equations (1) and (2), N is the number of matched cases ( for the pooled analysis, or the corresponding subset size for course- or trait-level analyses); and are the AI score and the human-consensus score for case i on the field being analyzed (a rubric trait or the Total); is the mean bias (the average signed AI − HC difference); and is the standard deviation of the per-case AI − HC differences. Here, positive bias () indicates that the AI scored higher than HC on average, and negative bias indicates lower AI scores. Pearson correlations are reported as supporting descriptors of association rather than as substitutes for agreement. Confidence intervals for the Pearson coefficients in the main tables were computed using Fisher’s z-transformation.
The ICC results are interpreted as agreement-oriented summary indices following standard reporting guidance [
1,
2,
3]. In the revised analysis, four pairings were evaluated on the observed score scale: H1–H2, AI–H1, AI–H2, and AI–HC. For each pairing, ICC(3,1) with 95% confidence intervals, Pearson correlation, MAE, mean bias, and 95% Bland–Altman limits of agreement are reported.
Bland–Altman analysis was chosen as the central agreement tool for a specific methodological reason. Correlation and ICC summarize whether two scorers rank or covary together, but they do not express, on the original score scale, how far an individual AI score is likely to fall from the human reference. The Bland–Altman framework reports exactly this: the mean bias makes systematic over- or under-scoring visible, and the 95% LoA bound the range within which most case-level differences fall, which is the quantity that matters for deciding whether an AI score is operationally interchangeable with a human score [
1,
11]. The method does carry assumptions: the standard LoA presume that the AI–HC differences are approximately normally distributed and that bias is roughly constant across the score range (i.e., no strong proportional bias), an assumption that can weaken as the number of courses, raters, and score distributions grows. These assumptions were therefore checked rather than assumed. The difference distributions were inspected visually, and proportional bias was tested explicitly through the difference–mean relationship reported in
Section 4; the detected positive proportional-bias pattern on the Total score is precisely what motivated the subsequent course-specific calibration analysis rather than reliance on fixed LoA alone.
Because aggregate agreement does not guarantee operational interchangeability, threshold-level consistency was additionally evaluated on the Total score at 9.0 and 12.0 points using overall agreement and adjacent-zone agreement, with the adjacent zone defined as cases within points of the HC threshold. To examine whether simple post hoc correction could reduce systematic course-dependent bias, a locked hold-out calibration analysis was also conducted. Within each course, cases were split into 70% development and 30% test subsets, a linear calibration model of the form was estimated on the development subset, and the fixed parameters were then applied unchanged to the hold-out test subset.
3.4. Interpretive Guardrails
Three interpretive guardrails are important for this study. First, AI–HC agreement is not equivalent to agreement with an external gold standard. Second, the study concerns written responses only and does not validate AI grading of final creative artifacts. Third, even when aggregate agreement appears strong, individual-level interchangeability must still be evaluated against the observed error range. These guardrails shape how the results are interpreted in the following sections.
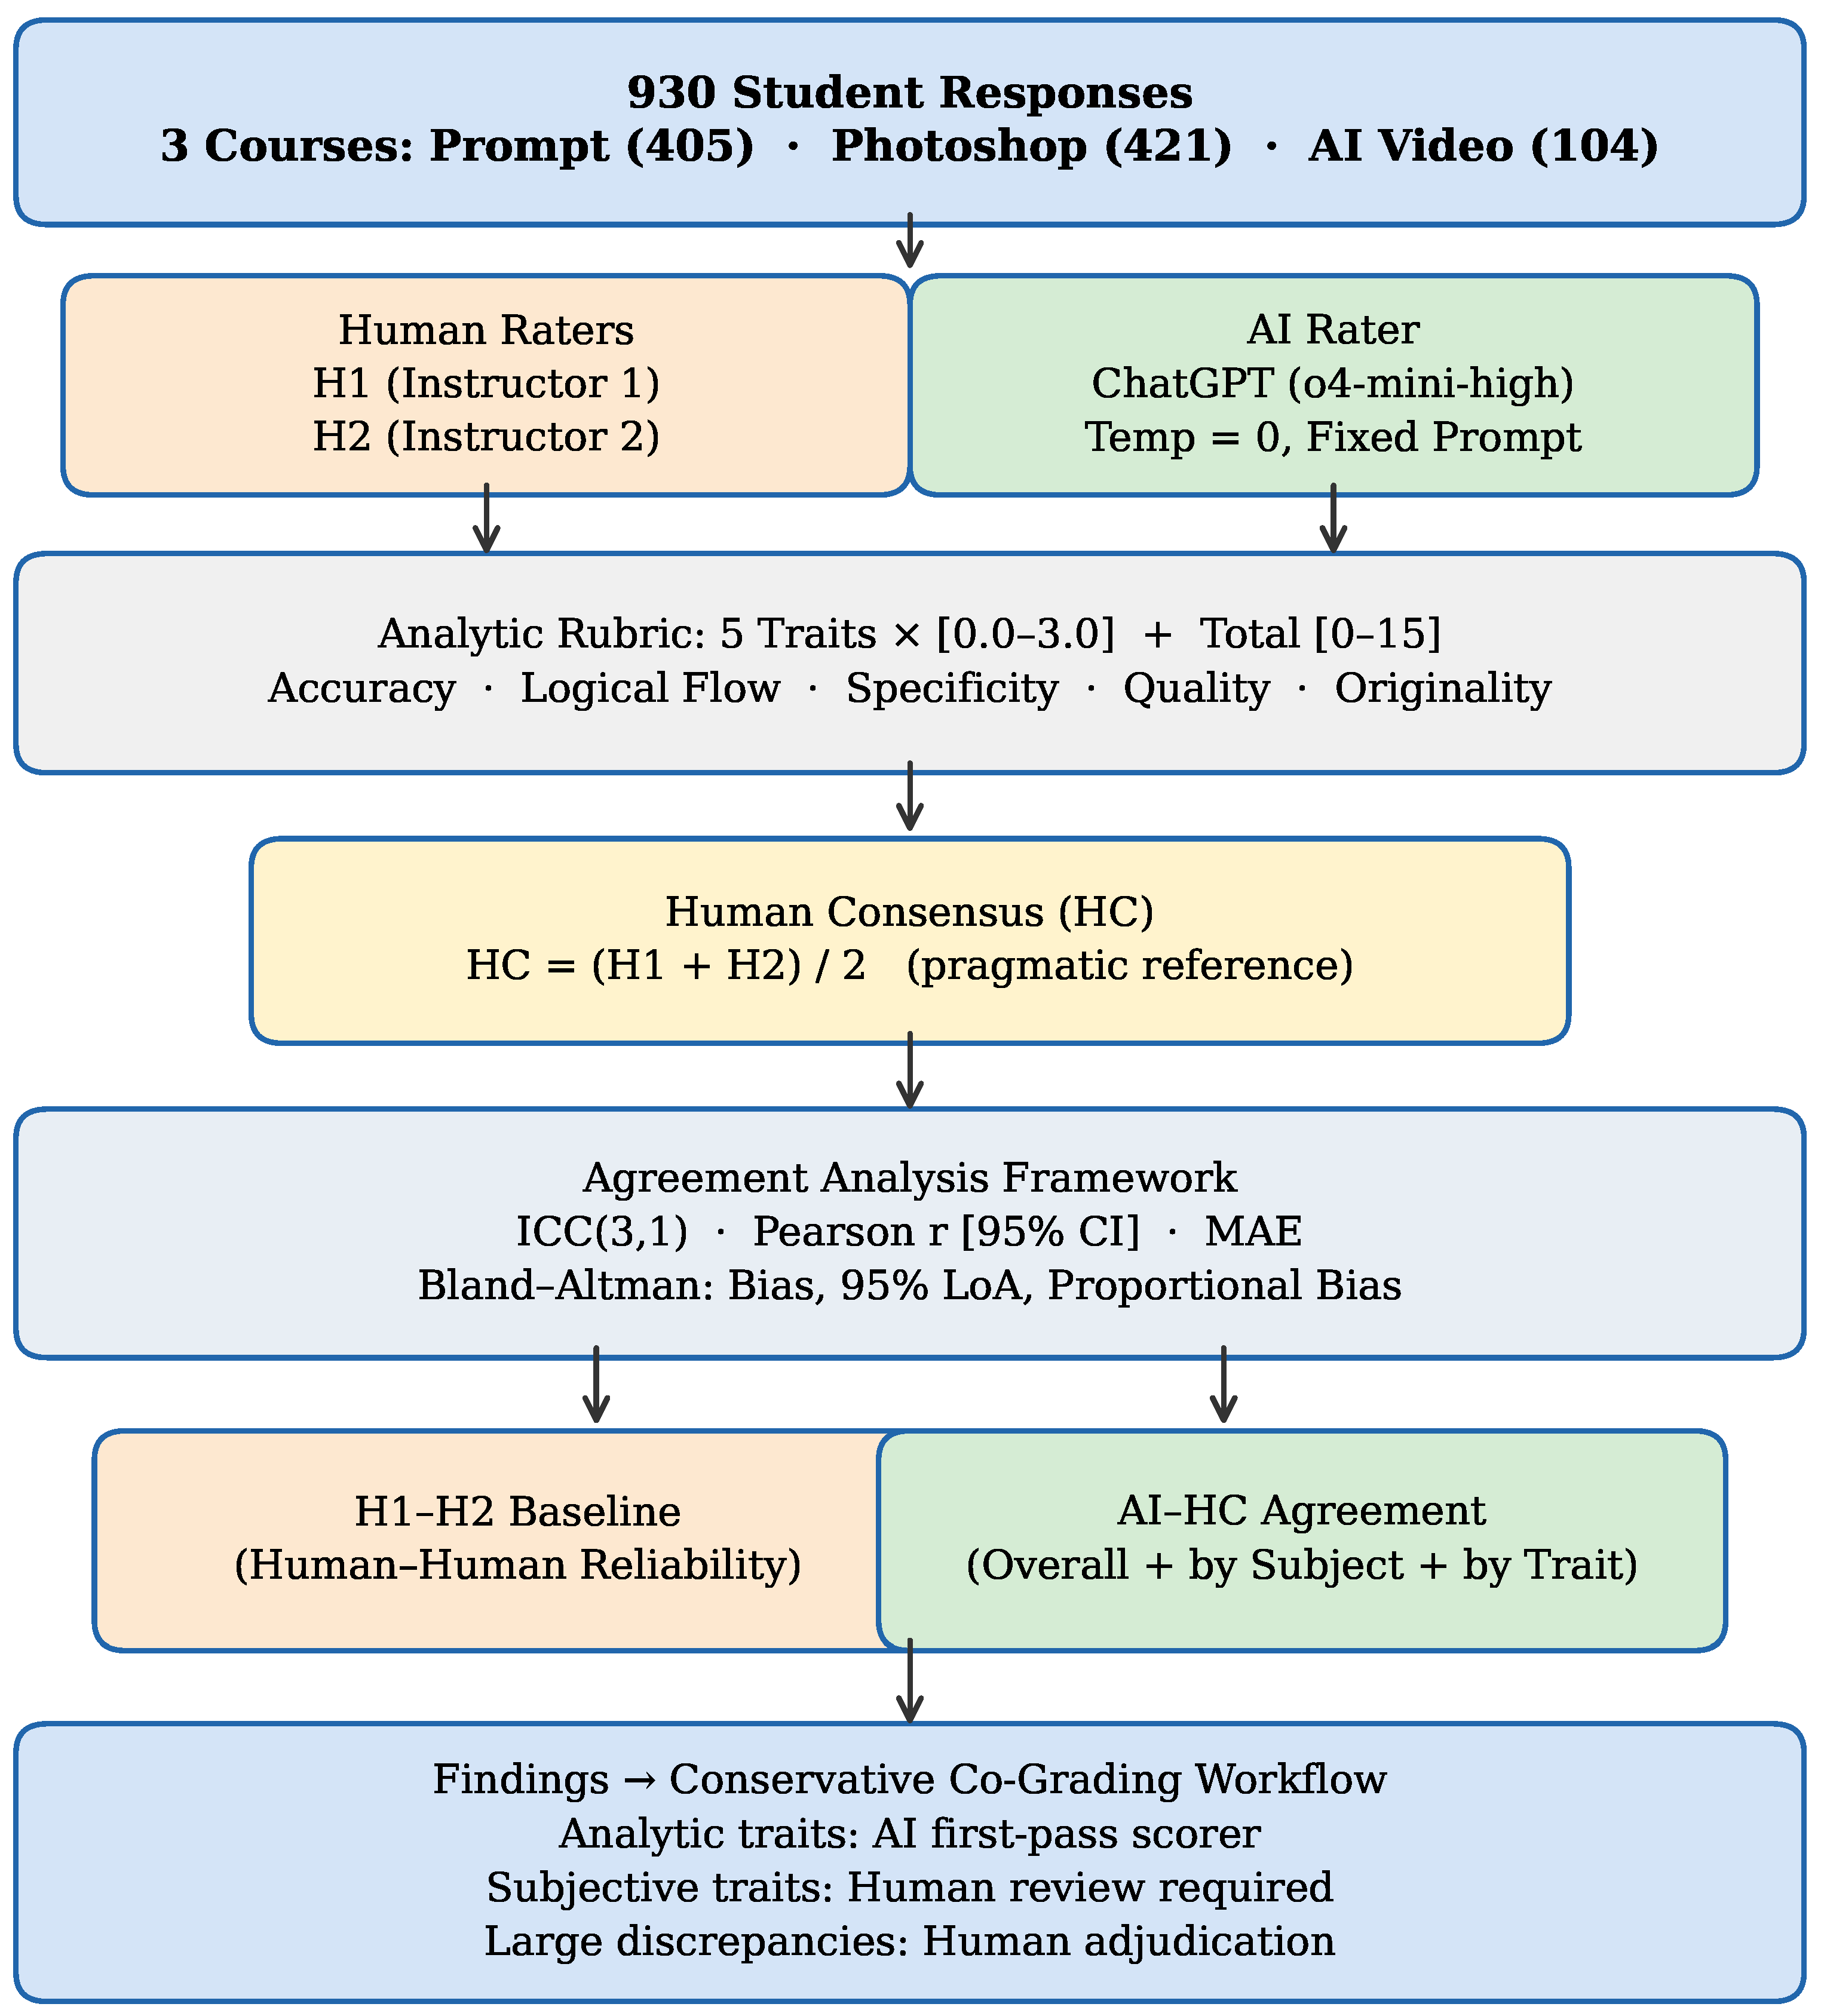
Figure 1 summarizes the overall study design, including data sources, raters, the analytic rubric, and the agreement-oriented analysis framework.
4. Results
4.1. Human–Human Reliability Baseline
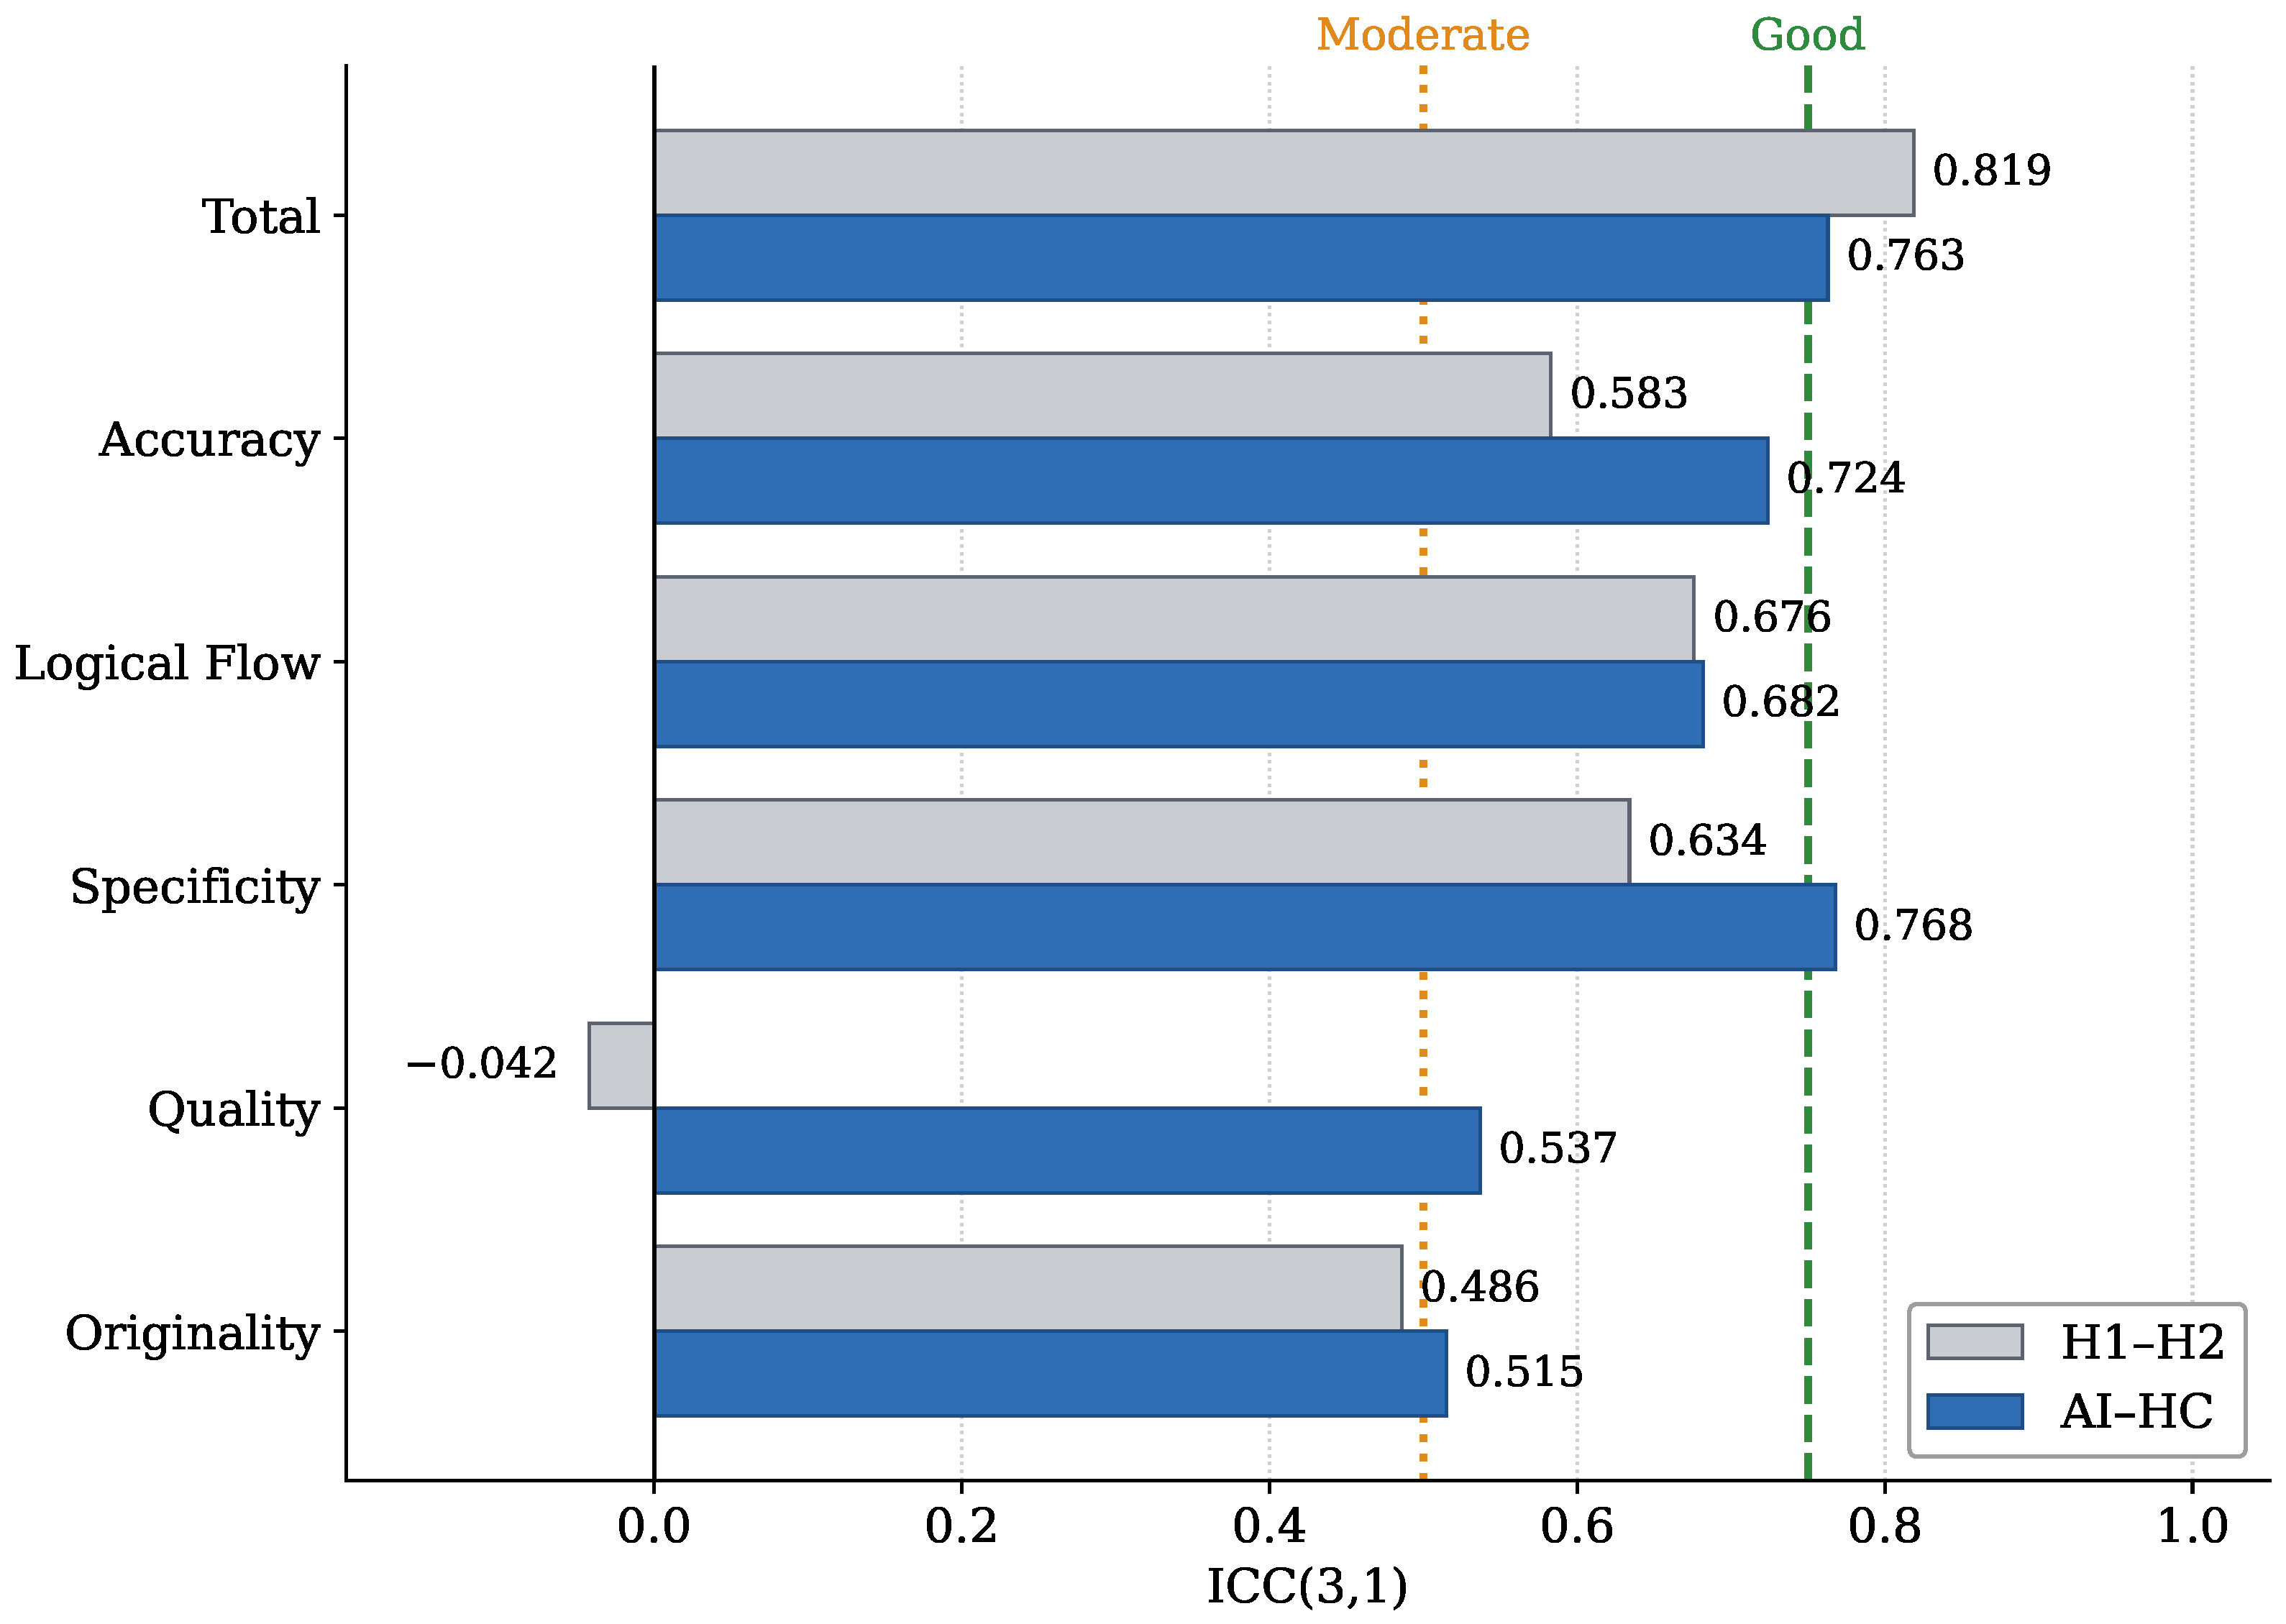
The two human raters showed strong agreement on the Total score (ICC = 0.819 [0.797, 0.839], , MAE = 1.353), indicating that the aggregate score was comparatively stable in the local grading process. At the trait level, human–human agreement was strongest for Logical Flow (ICC = 0.676), followed by Specificity (0.634), Accuracy (0.583), and Originality (0.486), whereas Quality remained effectively unreliable (ICC = −0.042). This revised pattern indicates that the local human baseline was stable for the Total score and several analytic traits, but not for Quality.
In practical terms, the human baseline now supports a more differentiated interpretation than in the earlier draft. The Total score remains the most defensible aggregate outcome, and several rubric traits show moderate agreement between human raters, but Quality remains too weakly constrained to support strong interchangeability claims.
4.2. Overall Pairwise Agreement and Association
Relative to the two individual human raters, the AI showed asymmetrical agreement on the Total score (
Table 2). AI–H1 agreement was ICC = 0.700 [0.666, 0.732] with MAE = 1.815, whereas AI–H2 agreement was higher at ICC = 0.767 [0.739, 0.792] with MAE = 1.642. Against the averaged human reference, AI–HC Total-score agreement was ICC = 0.763 [0.735, 0.789],
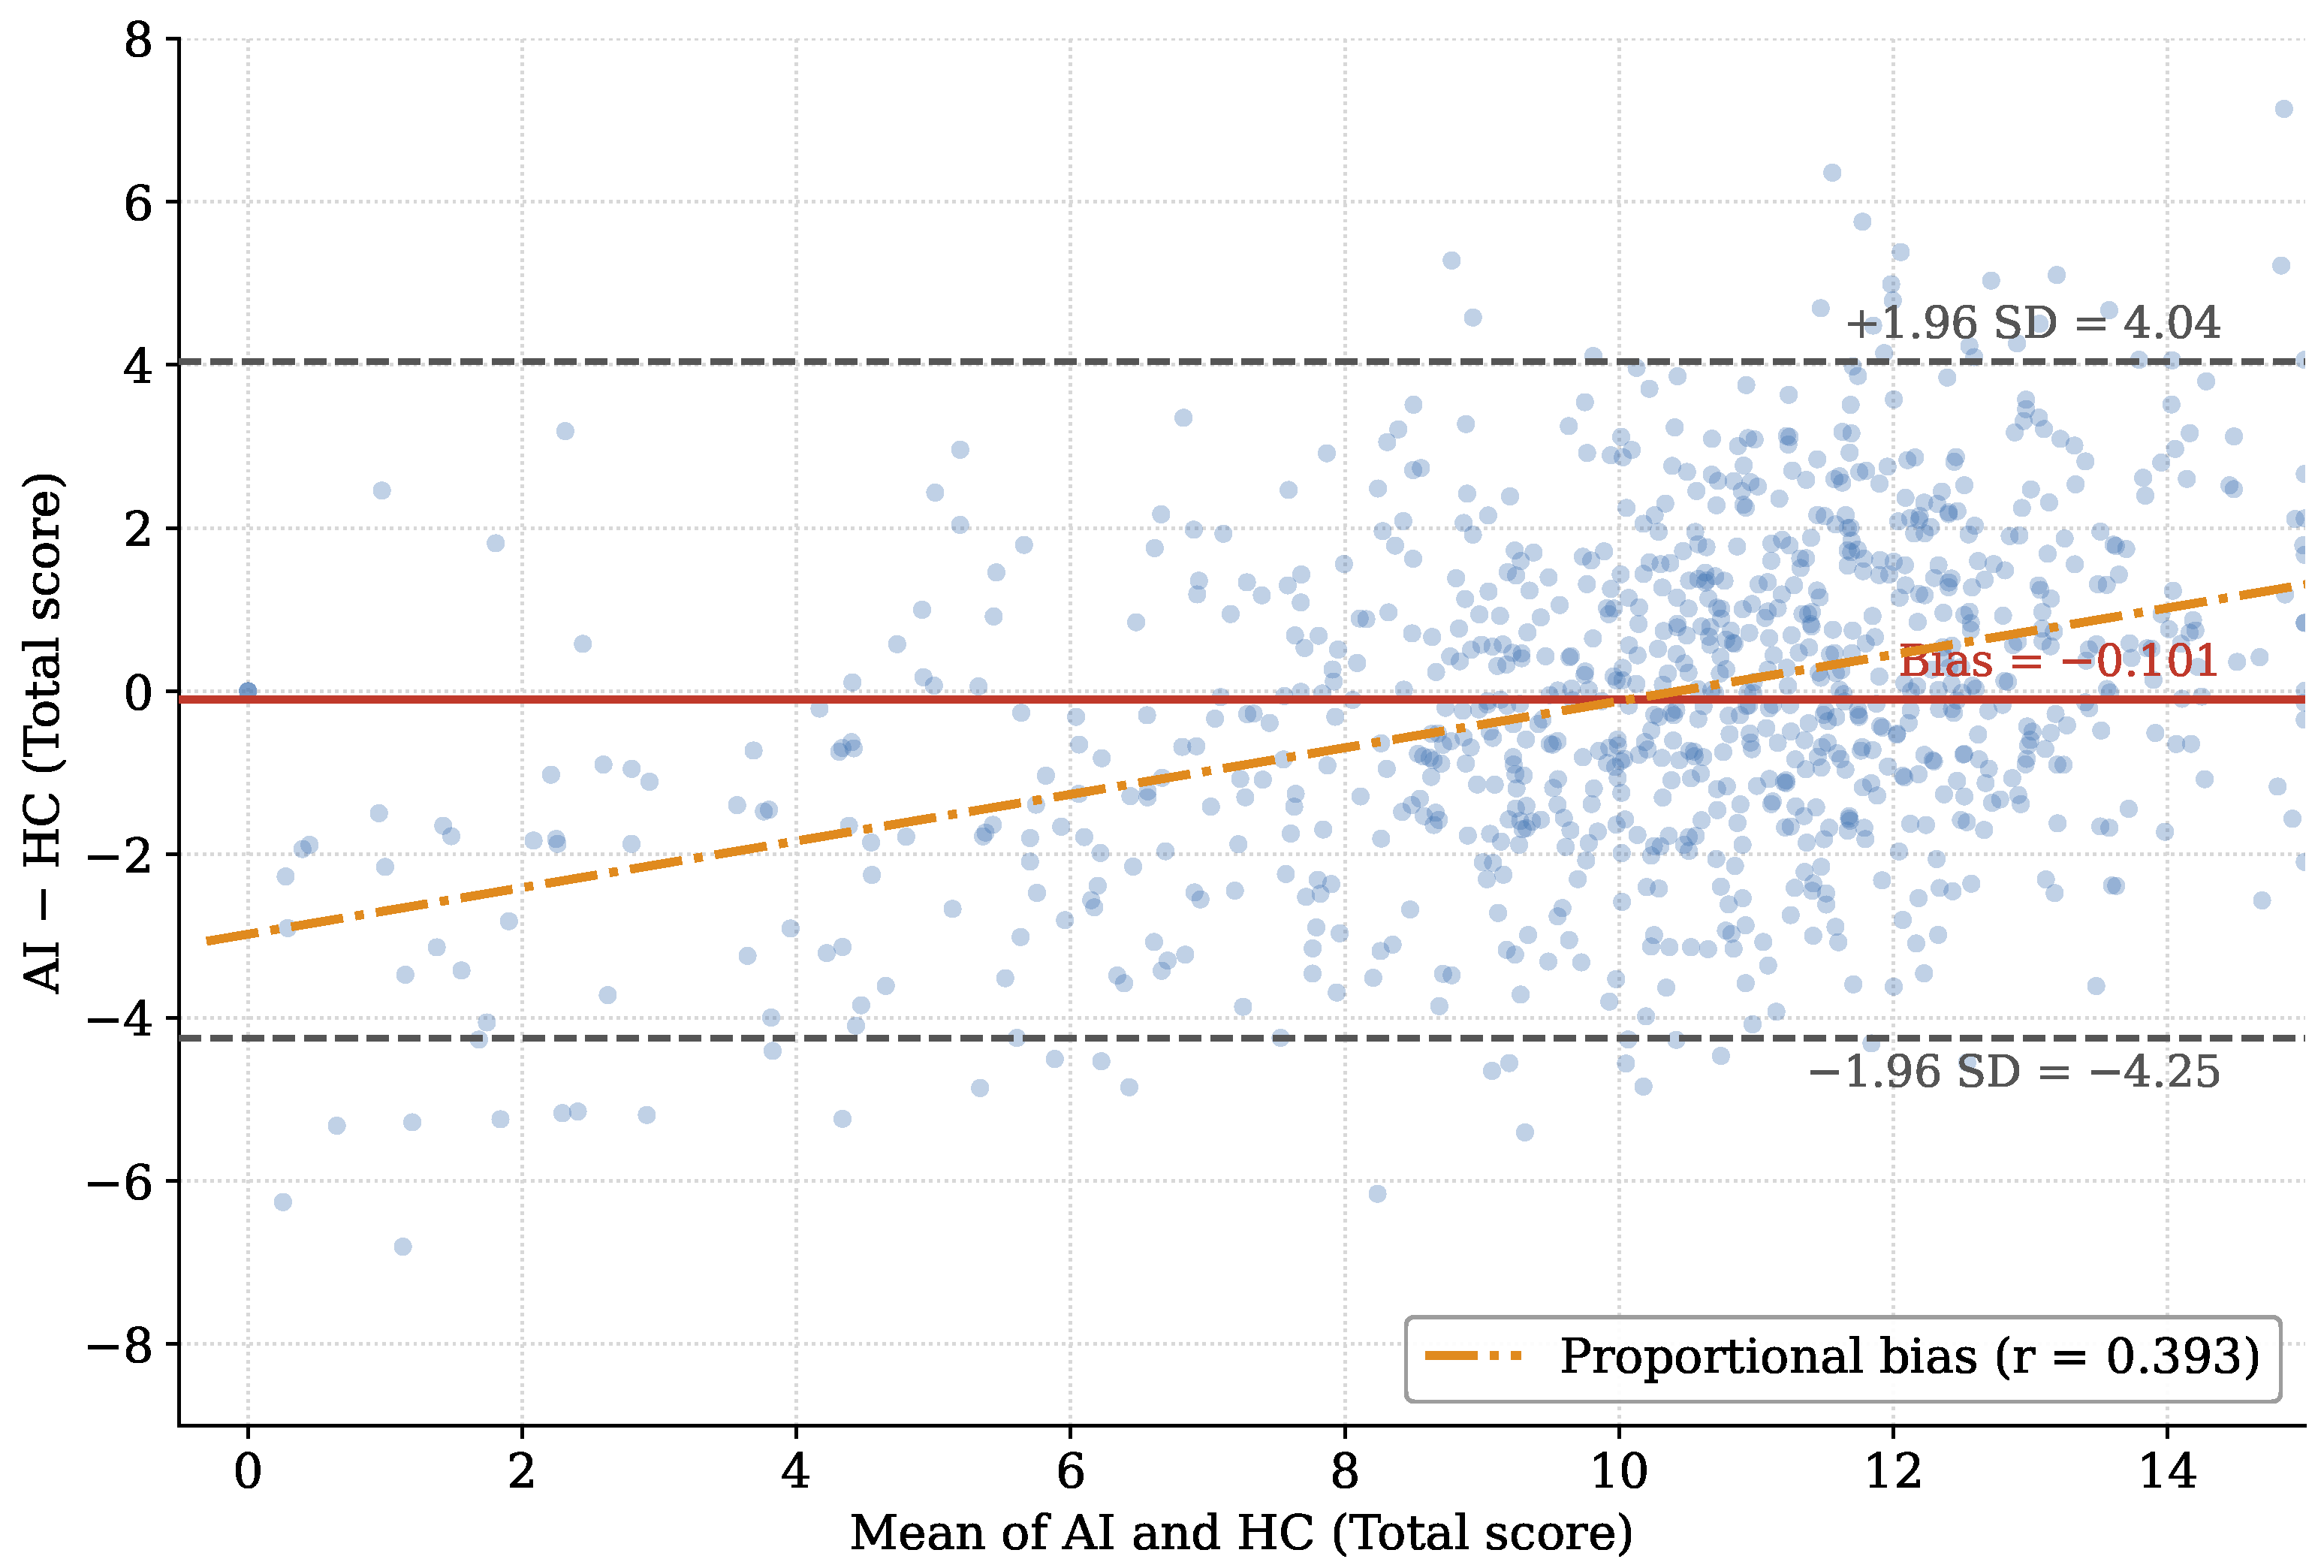
, MAE = 1.603, mean bias = −0.101, and 95% LoA = [−4.246, 4.045]. This pattern indicates that the AI was closer to one human rater than the other and that part of the apparent AI–HC agreement reflects the variance-reducing effect of score averaging in HC.
At the trait level, AI–HC ICCs exceeded the corresponding H1–H2 ICCs for all five rubric dimensions (
Table 3;
Figure 2): Accuracy (0.724 vs. 0.583), Logical Flow (0.682 vs. 0.676), Specificity (0.768 vs. 0.634), Quality (0.537 vs. −0.042), and Originality (0.515 vs. 0.486). Pearson correlations told a similar but not identical story: alignment was strongest for the Total score (
), followed by Specificity (
) and Accuracy (
). Logical Flow was somewhat lower (
), while Quality (
) and Originality (
) remained the weakest dimensions. Trait-level pairwise analyses also showed that the AI was generally closer to H2 than H1 for Accuracy, Logical Flow, Specificity, Originality, and the Total score, whereas Quality showed the reverse pattern. These results reinforce the need to report AI–H1 and AI–H2 separately rather than relying on AI–HC alone.
4.3. Bias, Error Magnitude, and Individual-Level Disagreement
Table 2 shows that good aggregate agreement did not eliminate case-level disagreement. On the 0–15 Total scale, AI–HC MAE was 1.603 and the 95% LoA were [−4.246, 4.045]. This means that although the AI tracked the overall human scoring pattern, the AI and HC could still differ by approximately four points in either direction for individual responses. If an institution were to treat a discrepancy of roughly
points as an acceptable operational band on the 15-point scale, the observed Total-score LoA would still substantially exceed that tolerance.
Figure 3 visualizes this Total-score Bland–Altman pattern, with the dashed lines indicating the 95% LoA and the dash-dot line indicating the proportional- bias regression.
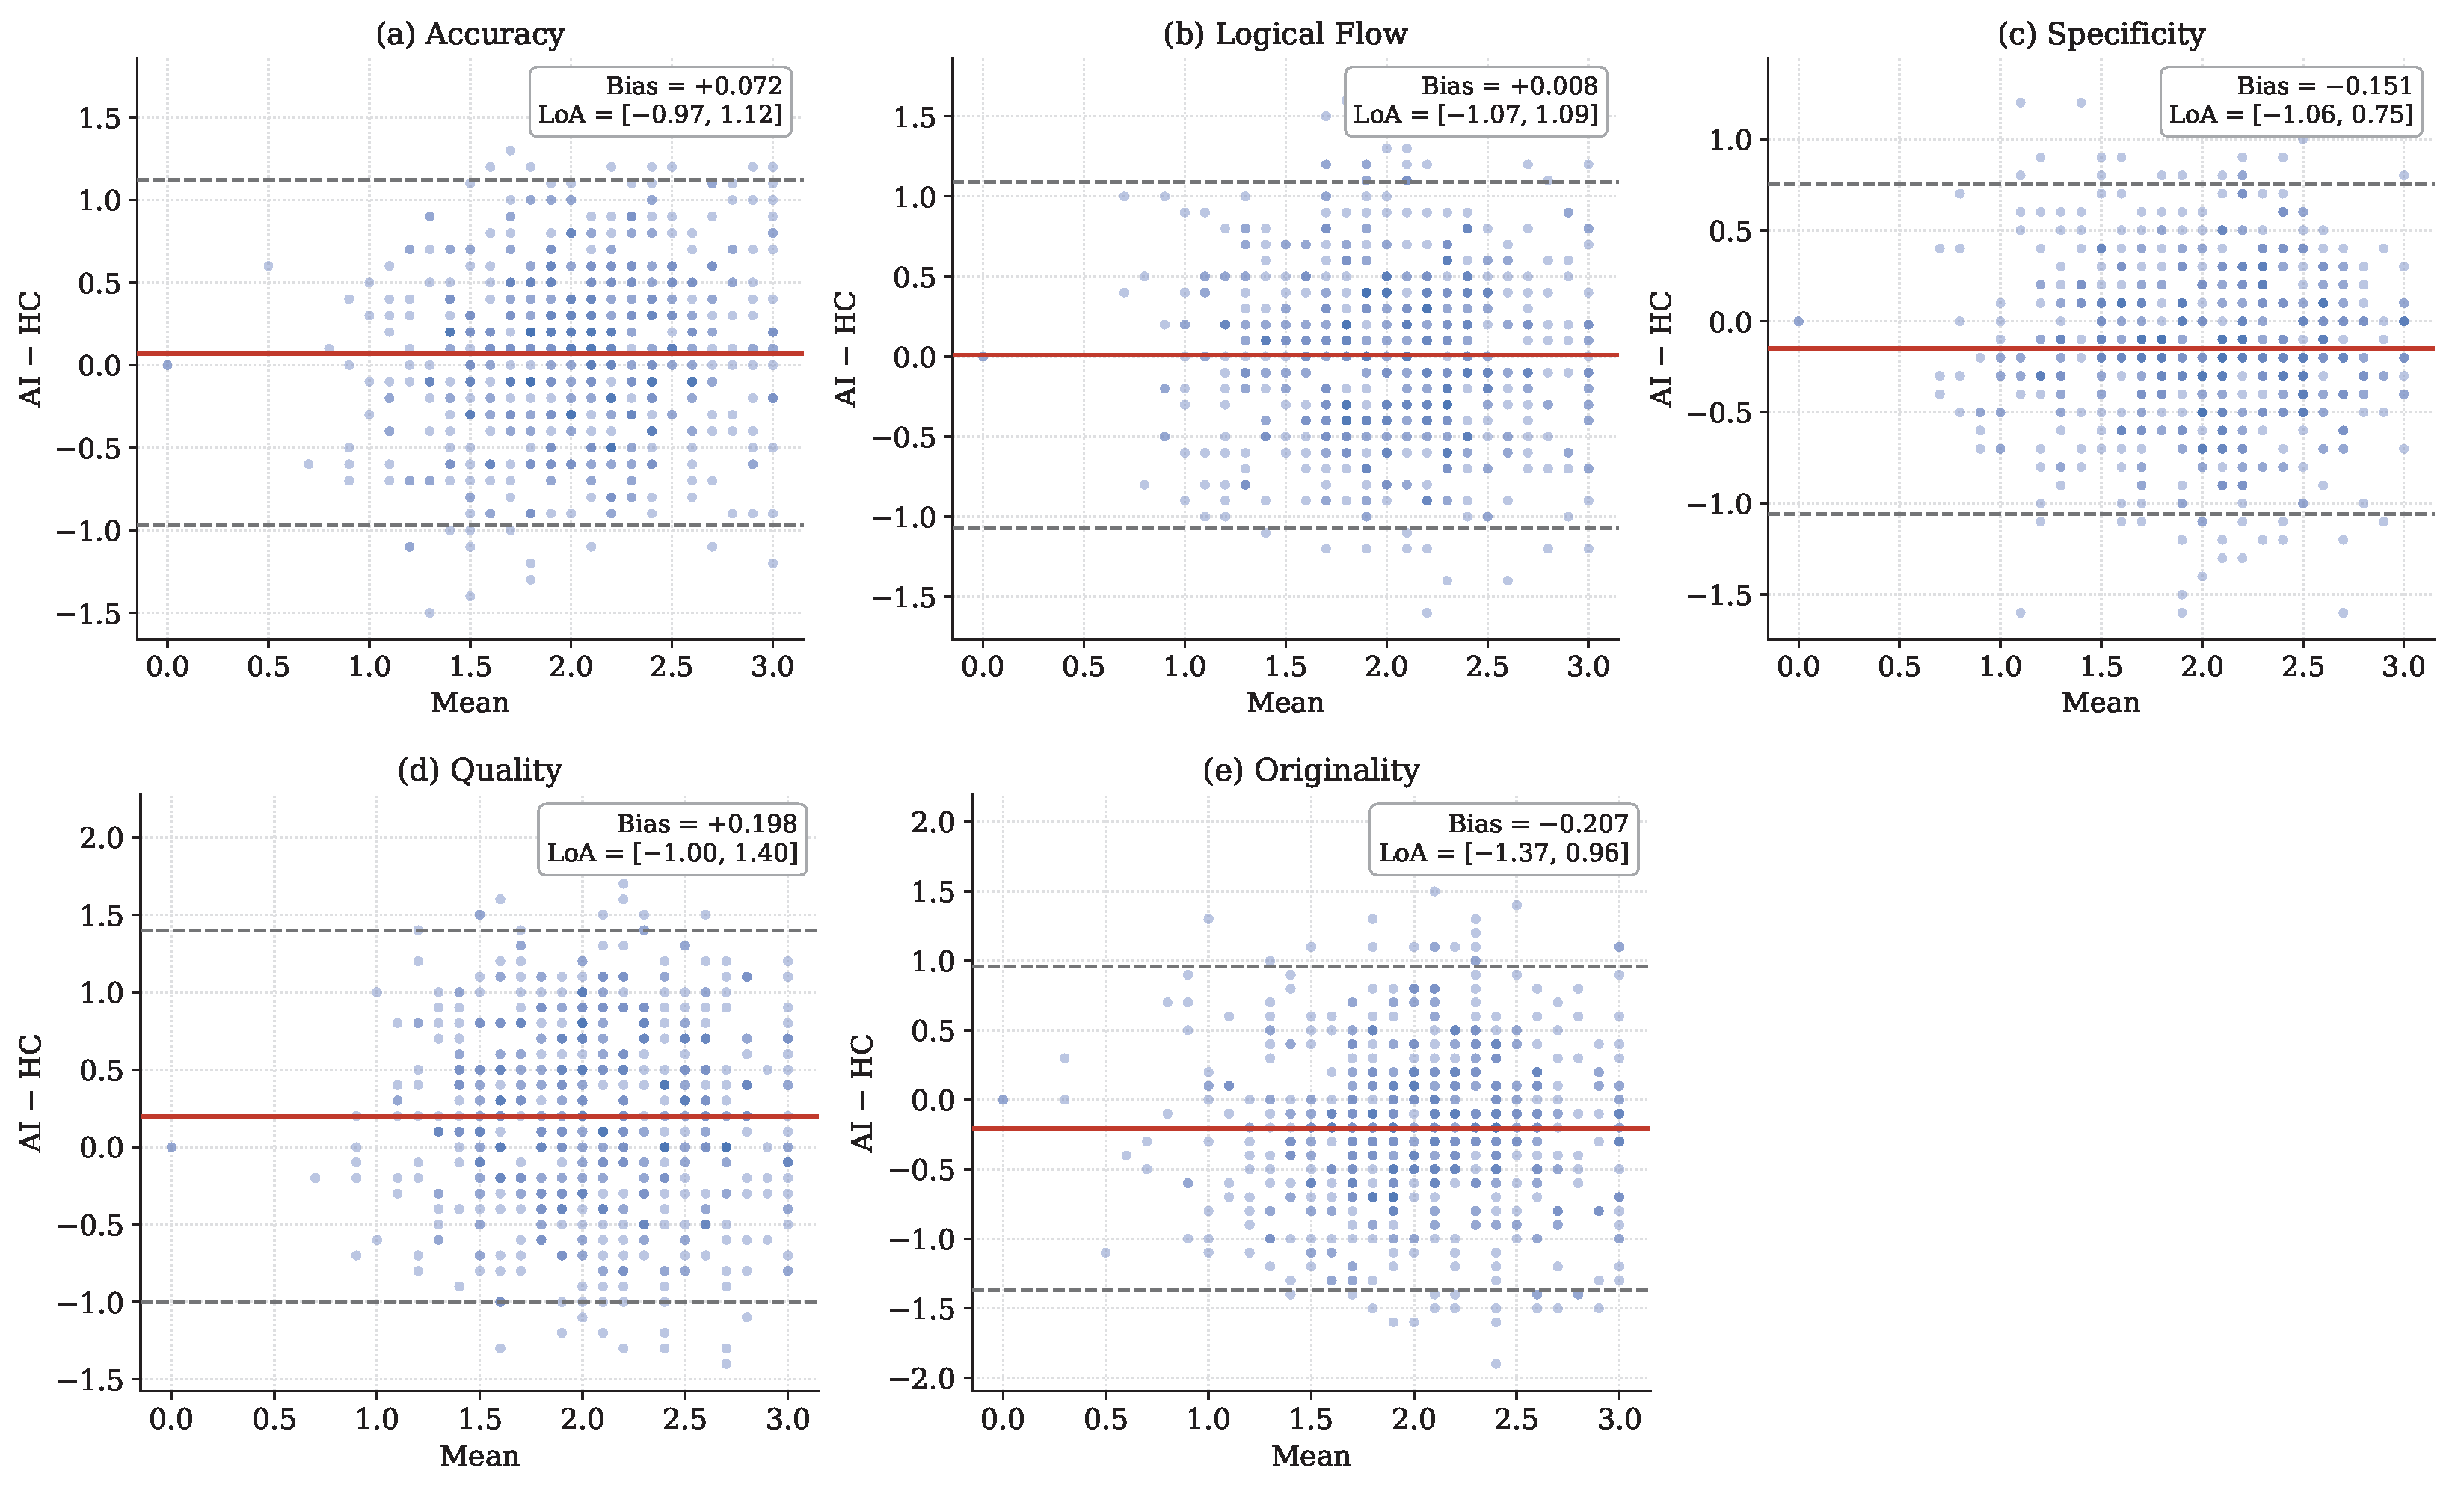
Trait-level disagreement was narrower but still meaningful. Accuracy showed only a small positive bias (+0.072), Logical Flow was essentially unbiased (+0.008), Specificity showed a modest negative bias (−0.151), Quality a modest positive bias (+0.198), and Originality the largest negative bias among the rubric traits (−0.207). The LoA for rubric traits were roughly on the order of one point in each direction on a 0–3 scale. In other words, the AI’s average bias by trait was small, but the potential difference for an individual response could still represent a substantial proportion of the rubric range.
Figure 4 presents the trait-level Bland–Altman plots that correspond to these biases and LoA values.
An additional descriptive analysis indicated a moderate positive proportional-bias pattern for the Total score (difference–mean correlation ≈ 0.393). Interpreted conservatively, this suggests that the AI tended to be relatively harsher at the lower end of the Total scale and relatively more generous at the higher end. Because
Table 2 emphasizes the primary agreement metrics, this pattern is treated as descriptive support for prospective calibration rather than as a stand-alone central claim.
4.4. Held-Out Calibration and Threshold Agreement
Because the Bland–Altman results indicated operationally meaningful case-level error, whether simple post hoc calibration could improve out-of-sample performance was tested.
Table 4 summarizes the three calibration models evaluated on the hold-out test set. In the pooled hold-out test set, uncalibrated AI–HC Total-score agreement was ICC = 0.774 [0.722, 0.817],
, MAE = 1.624, mean bias = −0.051, and 95% LoA = [−4.290, 4.188]. A course-specific linear calibration modestly improved ICC to 0.782 [0.732, 0.823], reduced MAE to 1.215, and narrowed the LoA to [−3.157, 3.329]. A simpler bias-only correction produced only a small MAE reduction (1.591) and did not narrow the upper LoA. In practical terms, the linear calibration improved aggregate fit out of sample, but it did not eliminate threshold-sensitive error.
Threshold-level analyses led to the same conclusion. On the hold-out test set at the 9.0-point threshold, overall agreement improved from 0.879 to 0.900 after course-specific linear calibration, but adjacent-zone agreement for cases within points of the HC threshold remained 0.810. At the 12.0-point threshold, overall agreement improved from 0.683 to 0.762 and adjacent-zone agreement improved from 0.608 to 0.688. These results support calibration as a useful error-reduction step while still favoring a triage-oriented co-grading workflow for threshold-adjacent cases.
4.5. Course-Level Total-Score Performance
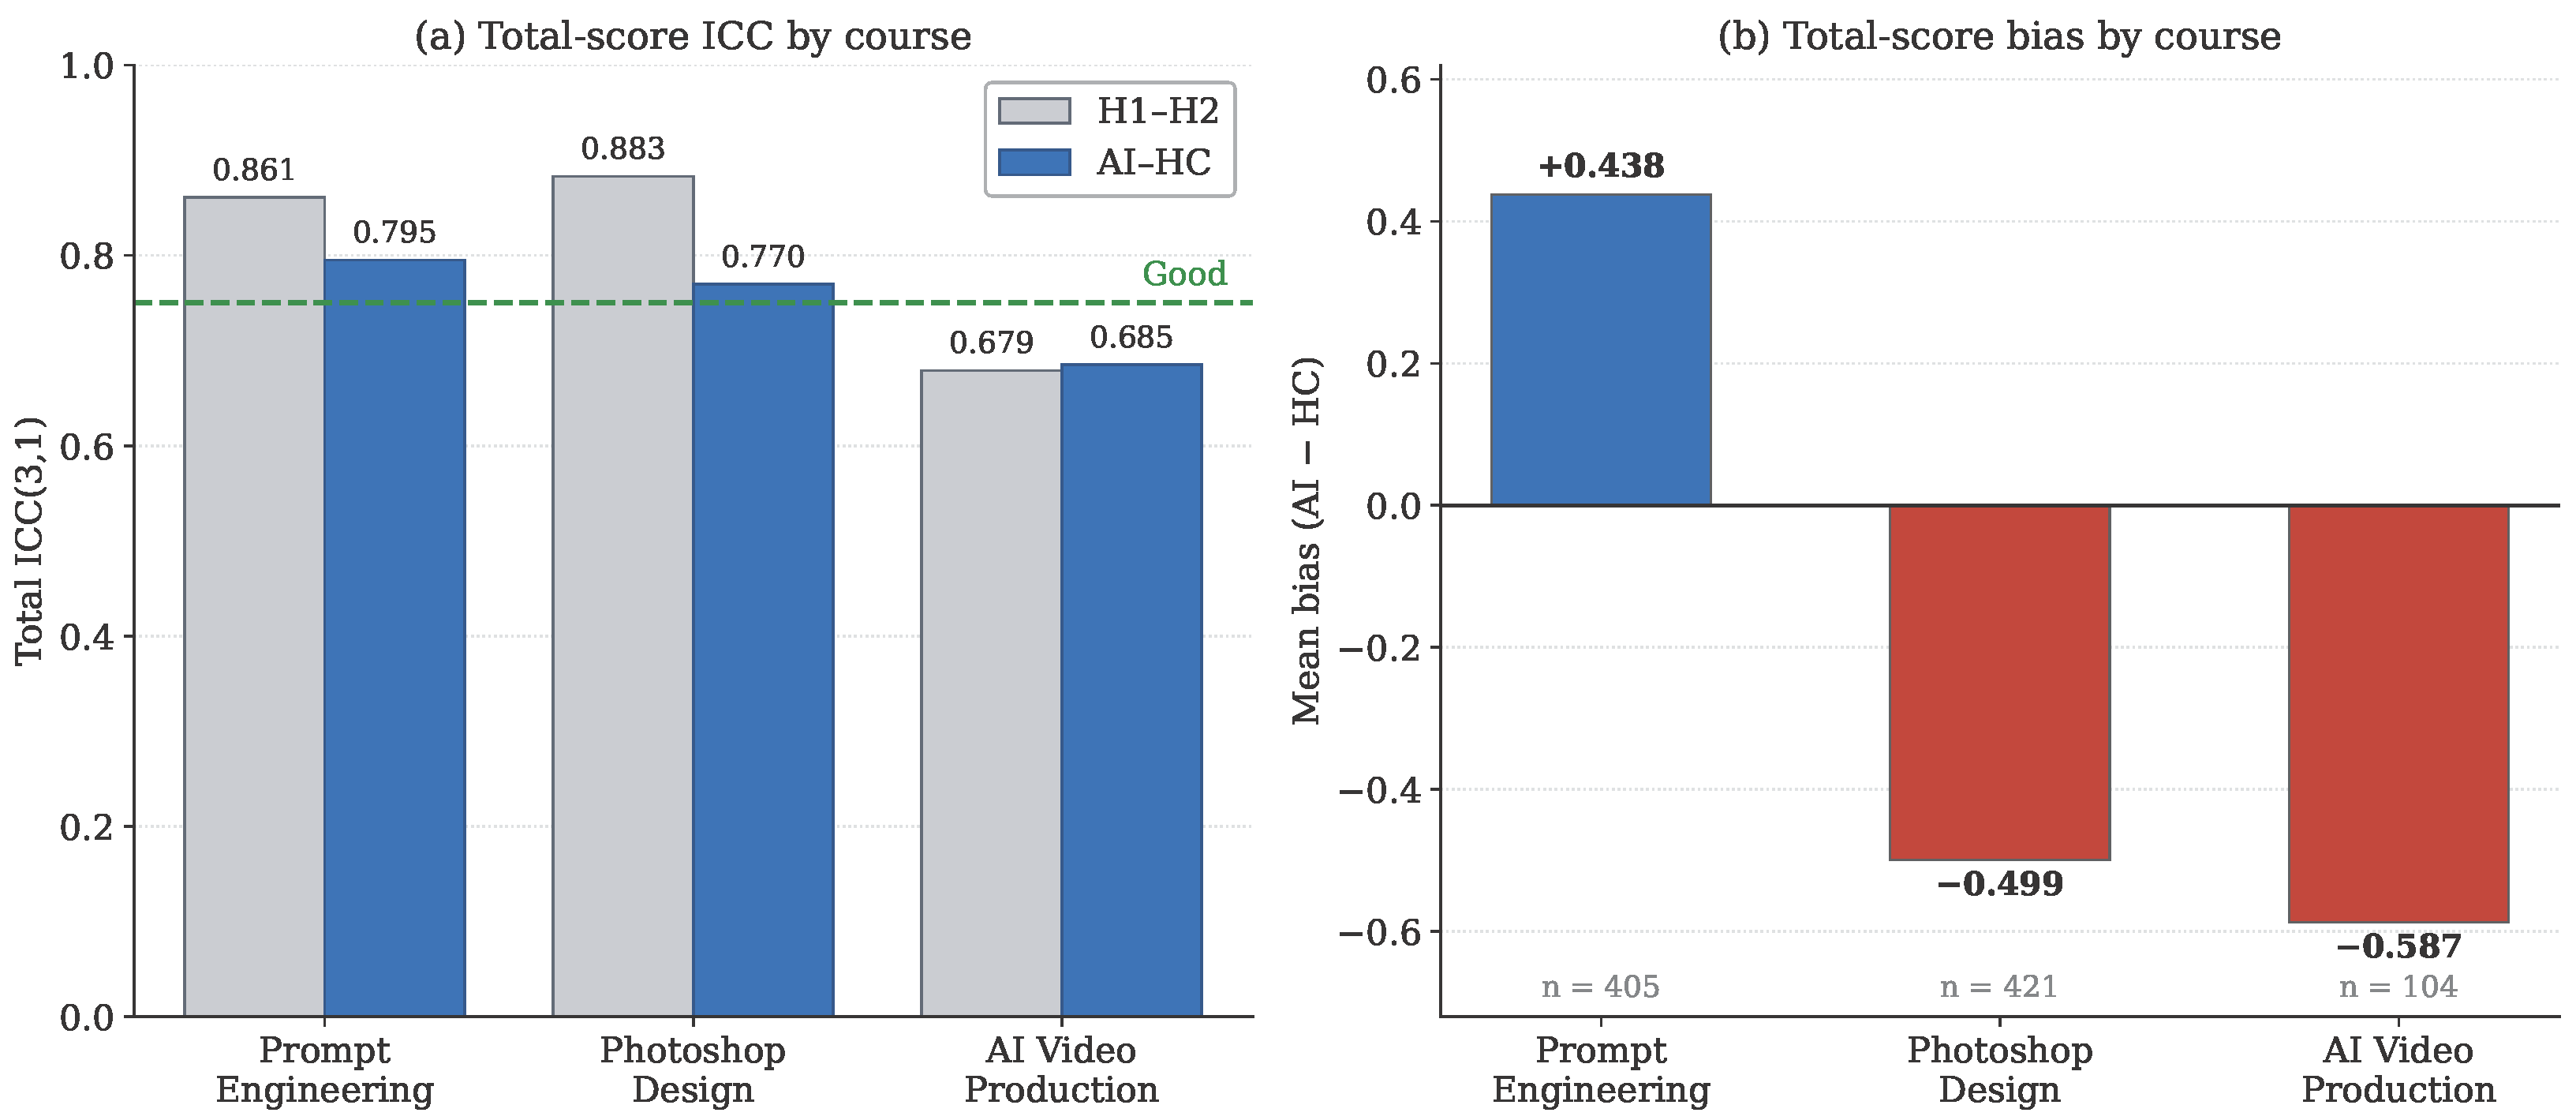
Agreement varied across courses (
Table 5;
Figure 5). AI–HC Pearson correlations on the Total score were highest in Prompt Engineering (
), followed by Photoshop Design (
), and lower in AI Video Production (
). The corresponding AI–HC Total ICCs were 0.795, 0.770, and 0.685, respectively. The corresponding human–human Total ICCs were 0.861 [0.834, 0.884], 0.883 [0.860, 0.902], and 0.679 [0.561, 0.771], respectively, indicating the strongest local human baseline in Photoshop Design rather than Prompt Engineering.
Pairwise comparisons showed that the AI was closer to H2 than H1 across all three courses on the Total score. AI–H1 Total ICCs were 0.737 in Prompt Engineering, 0.690 in Photoshop Design, and 0.552 in AI Video Production, whereas AI–H2 Total ICCs were 0.809, 0.805, and 0.708, respectively. Bias direction remained course-dependent: AI–HC bias was positive in Prompt Engineering (+0.438) but negative in Photoshop Design (−0.499) and AI Video Production (−0.587). These results reinforce the conclusion that deployment assumptions should be made at the course or task level, not at the abstract level of “AI grading” in general.
The weaker and more divergent results for AI Video Production should, however, be interpreted in light of its sample size. With
, this course contributed roughly one-quarter as many cases as Prompt Engineering (
) or Photoshop Design (
), and the consequence is directly visible in the precision of its estimates: the AI Video Production confidence intervals are substantially wider (e.g., H1–H2 Total ICC = 0.679 [0.561, 0.771], a span of about 0.21) than those of the larger courses (spans near 0.05). Two observations follow. First, the lower AI–HC ICC in this course (0.685) coincides with a markedly weaker human–human baseline (0.679), so part of the apparent degradation reflects reduced reliability of the local reference itself rather than a unique failure of the AI scorer. Second, because the confidence intervals for this course overlap considerably with those of the larger courses, the present data cannot cleanly separate a genuine domain effect from sampling variability and lower estimation stability at
. The course is therefore reported transparently, but its results are treated as the least certain of the three, and a larger replication in AI Video Production is noted as a priority in
Section 5.
5. Discussion
5.1. What the Results Support—And What They Do Not
In this study, the phrase “human-level” should be interpreted narrowly and locally. The revised pairwise analysis shows that AI–HC Total-score agreement (ICC = 0.763) was close to AI–H2 agreement (0.767), lower than the human–human baseline (0.819), and higher than AI–H1 agreement (0.700). This pattern indicates that the model approximated one human rater more closely than the other and that agreement with HC partly reflects the variance-reducing effect of score averaging.
Accordingly, the strongest defensible claim is one of constrained aggregate proximity to local scoring practice under a fixed rubric and fixed prompt, not equivalence to human raters in general and not agreement with an external gold standard. The Bland–Altman results and threshold analyses further show that individual-level and threshold-adjacent disagreements remain operationally meaningful. The present evidence therefore supports a calibrated co-grading model rather than unsupervised replacement.
5.2. Trait Differences and Construct Clarity
The revised trait pattern is informative because it shifts the construct interpretation. Under transparent preprocessing, Quality remained the only trait with effectively absent human–human reliability, whereas Originality showed moderate human agreement rather than near-zero agreement. This means that the main construct-instability problem in the current rubric is concentrated in Quality, not uniformly across all subjectively framed traits.
The AI–H1 and AI–H2 asymmetries further support this interpretation. For Originality, AI–H2 agreement was much stronger than AI–H1 agreement, suggesting that part of the observed variation reflects rater-specific interpretation rather than a single stable latent construct. By contrast, Quality remained unstable across human and AI comparisons, so agreement results involving Quality should be treated cautiously and not as evidence of strong construct validity.
5.3. Scope Boundary and Construct Validity
An important interpretive issue in this study is construct validity, especially for courses that are naturally associated with creative or multimedia outputs. To address this issue, the scope boundary is defined explicitly: the study evaluates written responses only. In Photoshop Design and AI Video Production, the AI did not evaluate actual posters, edited images, or final video products. It evaluated students’ explanatory descriptions of design reasoning, workflow steps, or tool knowledge.
This boundary does not make the study unimportant, but it materially changes what the findings mean. The results are relevant to text-based assessment tasks embedded within design-related courses. They should not be generalized as evidence that an LLM can evaluate authentic creative products in those domains without additional multimodal validation.
5.4. Implications for Human–AI Co-Grading
The most useful practical implication of the study is still a conservative co-grading model rather than a replacement model, but the revised results now allow this recommendation to be stated more concretely. First, the pairwise results show that AI agreement depends on which human rater is used as the reference, so operational systems should not be validated against an averaged benchmark alone. Second, the held-out calibration analysis shows that simple local calibration can reduce absolute error and narrow the disagreement range. Third, the threshold analysis shows that even calibrated systems remain vulnerable in threshold-adjacent cases.
A defensible deployment pattern is therefore a calibrated triage workflow. AI can be used for first-pass scoring, batch standardization, and feedback drafting on relatively well-anchored dimensions, while cases near grade boundaries, cases involving Quality, and cases with policy-sensitive consequences should be routed to human adjudication. The threshold evidence is particularly important here: even after calibration, adjacent-zone agreement remained at 0.810 at the 9-point threshold and reached only 0.688 (up from 0.608) at the 12-point threshold.
Table 6 outlines the corresponding deployment patterns. This aligns with prior human–AI collaborative assessment work and with broader guidance on educational AI governance [
12,
13,
14].
Translated into a concrete implementation, this workflow maps onto existing learning-management and grading systems with modest engineering effort. At the start of a term, a small development sample from each course (analogous to the 70% development split used here) is used to estimate the course-specific linear calibration parameters
a and
b; these are then frozen for the remainder of the term and applied to incoming AI scores. The calibrated AI score is written into the grading interface as a pre-filled draft rather than a final grade, so the instructor’s default action is to confirm or adjust rather than to score from scratch, which is where most of the time saving accrues. A routing rule then automatically flags two case types for mandatory human review before release: responses whose calibrated Total falls within the adjacent zone of a grade boundary (here
points of the 9- or 12-point cutoffs), and responses scored on low-stability dimensions, especially Quality. Well-anchored traits such as Accuracy and Specificity can instead be released under periodic batch auditing rather than case-by-case review, concentrating limited instructor attention where the evidence shows agreement is weakest. Finally, operating such a system responsibly requires governance measures that are independent of the statistics: students should be informed that an AI tool contributes to scoring, an appeal or human-recheck path should remain available, and calibration should be re-estimated whenever the course content, rubric wording, or underlying model changes (
Table 6). These steps keep the human instructor as the accountable decision-maker while using the AI to standardize and accelerate the well-defined portion of the workload.
5.5. Relation to Prior LLM-Scoring Studies
The present findings are broadly consistent with recent studies reporting that rubric-guided LLM scoring can approximate human ratings under controlled conditions [
6,
7,
8]. They are also consistent with the cautionary side of the literature: agreement is stronger for well-anchored, text-based criteria than for subjective or construct-ambiguous judgments, and aggregate alignment does not guarantee case-level interchangeability [
9,
10]. What this study adds is a clearer comparison against the local human–human baseline and an explicit narrowing of claims to text-response scoring in three courses at one institution.
5.6. Limitations and Future Work
Several limitations remain. First, the study is based on one institution and three courses only, so external validity across institutions, grading cultures, and disciplines remains untested; the three courses were also unequal in size, and the smallest (AI Video Production, ) yielded the least precise course-level estimates, so its results in particular require larger-sample replication. Second, the evaluated inputs were written responses rather than the students’ final multimedia artifacts. Third, only a single LLM under a single fixed prompt was evaluated, by design, so the findings do not establish whether the observed agreement generalizes to other models or prompt formulations; multi-model and multi-prompt replication is a priority for future work. Fourth, the hold-out calibration analysis was conducted within one random split and one linear correction family; future work should test repeated resampling, alternative calibration strategies, and robustness across model updates and prompt perturbations.
Fifth, a source-data integrity issue was identified in the AI workbook: in 74 of 930 cases, the recorded AI Total did not equal the sum of the five AI rubric traits. Sensitivity analysis suggested that this inconsistency had little effect on the main Total-score conclusion, but future pipelines should enforce deterministic score aggregation at generation time. Sixth, the threshold analyses were operational checks using illustrative 9-point and 12-point cutoffs on the 15-point scale; these should not be treated as universal policy thresholds. Seventh, subgroup fairness analyses were not possible because demographic variables were unavailable in the de-identified dataset.
Future work should therefore extend the present held-out calibration analysis through repeated resampling, robustness checks across prompt and model changes, and validation in settings where actual creative artifacts—not only written explanations—are part of the assessment target. It would also be valuable to distinguish whether AI agreement improves because the model better captures the intended construct or because it more strongly regresses toward the center of the local scoring distribution.
6. Conclusions
This study shows that rubric-guided LLM scoring can approximate local human grading practice for text-based university responses, especially on the Total score and on relatively concrete analytic traits. The evidence is encouraging enough to support calibrated human–AI co-grading in narrowly defined settings, but not strong enough to justify fully automated replacement of human graders. The Total-score limits of agreement remain too wide for confident case-level substitution, and Quality remained unstable even for human raters.
The most defensible conclusion is therefore modest but useful: under a shared rubric and fixed scoring prompt, an LLM can serve as a structured support tool for text-response assessment across selected university courses. Its role is best understood as assisting, standardizing, calibrating, and triaging parts of the scoring workflow rather than replacing human judgment. The principal directions for future work—multi-model replication, repeated-resampling calibration, and validation on authentic creative artifacts rather than written explanations alone—are detailed in
Section 5.