Article

Development of a Blockchain-Based Information Protection System with Hybrid R-Snowball Algorithm in a Biofuel Supply Chain


Department of Industrial and Systems Engineering, Dongguk University, Seoul 04620, Republic of Korea
*
Author to whom correspondence should be addressed.
Appl. Sci. 2026, 16(12), 5860; https://doi.org/10.3390/app16125860
Submission received: 8 May 2026 / Revised: 6 June 2026 / Accepted: 8 June 2026 / Published: 10 June 2026

Abstract

The biofuel supply chain is a complex value chain spanning from production to consumption. Manipulating information such as geographical origin, raw material type, and quantity at the production stage can disrupt refinery production plans and cause supply–demand imbalances. Therefore, a transparent traceability system is essential. The existing centralized database architecture poses a high risk of supply chain service suspension due to even a temporary fault in the central server, and it lacks resilience. Furthermore, it is vulnerable to data forgery, making it urgent to secure information integrity. To resolve these issues, this study proposes a blockchain-based biofuel supply chain information protection system. This system utilizes Shamir’s Secret Sharing algorithm to distribute data location information across all nodes and introduces the R-snowball consensus algorithm, which combines the reputation score of nodes with the random sampling of Snowball. The system aims to secure resilience in the event of a failure, achieve reputation-based security, and provide preliminary evidence of robustness against internal and external threats under the tested conditions. Experimental results demonstrated that the proposed system achieved an average recovery time of within 0.03 s, regardless of the load volume. Furthermore, preliminary evidence under the tested conditions suggests that the security and robustness of the system were supported through the exclusion of internal malicious nodes via a reputation-based penalty logic, the defense against main chain takeover attempts in external attack scenarios involving multiple fake nodes (Sybil nodes), and the maintenance of consistent consensus times.

1. Introduction

With the recent advancement of artificial intelligence and the increase in cyberattacks, blockchain security technology—a distributed ledger technology that enables decentralized data synchronization without a central authority—is being utilized to protect product information from potential online threat actors [1,2,3]. Blockchain was developed in the cryptocurrency community as a distributed ledger technology to enable decentralized transactions and verification without the need for third-party financial institutions [4]. However, numerous blockchain networks now exist, supporting various currencies and digital services worldwide. Blockchain is playing an increasingly essential role in our daily lives, spanning banking, healthcare, supply chains, and tracking [5].
Blockchain technology is being utilized in supply chain management because it can enhance visibility and transparency. By sharing information in real time with partners across the entire supply chain, logistics efficiency and stability can be dramatically improved [6]. Blockchain records enable access to information about manufacturers, raw materials, and other aspects of a product, enabling product history tracking at every point in the supply chain [7,8,9,10,11]. Wu et al. proposed a parallel search algorithm based on bipartite graph maximum matching, reducing product tracking time overhead by up to 85.1% in blockchain-based supply chain traceability systems [12].
Like supply chains in other industries, the biofuel supply chain is a complex value chain spanning feedstock production to final biofuel consumption. Due to the dispersed nature and seasonality of feedstocks, establishing a stable supply chain management system is a key operational challenge [13]. Typically, biofuel supply chain data includes the type and quantity of feedstock produced, the production location, the type and volume of fuel produced at refineries, and the raw materials used in production, as well as the type and volume of fuel used at demand sites [14]. Among these, traceability is becoming increasingly important to prevent environmental impacts, such as environmental destruction, caused by raw materials and raw material-based fuels. The EU RED II and RED III directives are strengthening regulations by mandating strict raw material traceability and the establishment of a Union Database to ensure sustainable production traceability [15,16]. These regulations require supply chain participants to report the quantity, geographical origin, and raw material type of biofuels, bioliquids, and biomass fuels to the EU database [16].
The biofuel supply chain considered in this study focuses on the tracking of biofuel feedstock, a key element in the biomass supply chain. Manipulation of feedstock data can lead to quality degradation during refinery refining, failure to execute production plans, and insufficient demand at demand centers. To resolve these issues, this study develops a blockchain-based security system that enables supply chain participants to proactively manage data, ensures resilience by moving away from existing centralized database methods, and establishes data transparency while guaranteeing traceability. The proposed blockchain-based biofuel supply chain consists of the farm registration module for approving and managing farm (node) participation in the blockchain, the data and blockchain composition module for storing Radio Frequency Identification (RFID) data in InterPlanetary File System (IPFS) storage and the blockchain, the data import module for restoring and reading data stored in the blockchain, and the security validation module for verifying the synchronization of the distributed blockchain with the member database. Furthermore, this study develops and integrates a novel consensus algorithm known as R-snowball into the framework, which utilizes the calculated reputation scores of individual nodes during the system consensus process. Finally, experiments are conducted to verify the resilience, security, and robustness of the proposed system. Specifically, the average recovery time under various traffic loads during node failure situations is measured, and the trends in reputation score changes alongside the final success rate of excluding internal malicious nodes—which attempt to take over the internal network with manipulated blockchains—are analyzed. Additionally, the robustness of the system against external threats involving multiple fake nodes (Sybil nodes) is comprehensively evaluated. The contributions of this study are as follows: (1) A system is proposed that prevents unauthorized participants from participating in the blockchain by developing an R-snowball algorithm that calculates the reputation scores of blockchain members; (2) RFID input data is immediately distributed and stored to prevent third parties other than authorized supply chain participants from viewing or modifying the information; (3) Alongside the evaluation of resilience in response to node failures, the security and robustness of the proposed system are quantitatively evaluated through experiments simulating internal threats—assuming the hijacking of refinery node control—and external threat scenarios involving the mobilization of multiple Sybil (fake) nodes.
This study is structured as follows. Section 2 describes the characteristics of the biofuel supply chain and proposes a blockchain-based supply chain security technology. Section 3 presents the experiments conducted to verify the resilience, security, and robustness of the proposed R-snowball-based supply chain system. Section 4 and Section 5 discuss the research results and address the conclusions.

2. Materials and Methods

2.1. Biofuel Supply Chain and Information Protection

The biofuel supply chain is a complex value chain spanning raw material production to final consumption, consisting of biomass production, biomass logistics, biofuel production, biofuel distribution, and biofuel end-users [17]. Figure 1 provides an overview of the general biofuel supply chain. The biomass (or feedstock) production stage aims to minimize supply uncertainty by diversifying raw materials, ranging from agricultural and forestry by-products with distinct geographical and seasonal constraints to dedicated energy crops and aquatic resources that can be mass-produced [18]. The second stage, the biomass logistics system, integrates and manages the collection, preprocessing, storage, and transportation processes, and is key to overcoming the low energy density of raw materials and geographical and seasonal uncertainties [19]. The third stage, the biofuel production system, is the core process of converting raw materials into liquid fuel through physical and chemical processes at a biorefinery facility [20]. The produced fuel is delivered to consumers through the fourth stage, the biofuel distribution system, which varies depending on the characteristics of the fuel. Ethanol and other fuels have limited use in existing oil pipelines due to issues such as corrosiveness and stress corrosion cracking (SCC) [21]. Drop-in fuels, on the other hand, can utilize existing oil infrastructure (pipelines, storage tanks, etc.) without modification [22]. Finally, the final end-user stage for biofuels is where the fuel is actually consumed, such as in aviation, shipping, and road transport [23].
Looking at the data generated in the biofuel supply chain, biomass production involves factors such as raw material type (such as rice straw, corn, or cornstalks), regional availability, and seasonal harvest times. Biomass logistics requires the management of data on capacity constraints for each transportation mode, changes in raw material density through preprocessing, and conversion rates. Biofuel production involves refinery conversion yields and process parameters, inventory holding costs, and byproduct sales costs. Biofuel distribution considers infrastructure compatibility, such as corrosiveness in existing pipelines, and legal mixing restrictions. Finally, biofuel final destinations utilize data on regional demand density, price volatility, and local job creation impacts [17,24].
Biofuel supply chain data is used in a complex manner across multiple facilities, and if this data is compromised, such as through hacking, the entire supply chain could be threatened. Colonial Pipeline, the largest pipeline operator in the United States, suffered a ransomware attack on its central database in May 2021 [25]. While the operating equipment remained intact, the operator was forced to halt pipeline operations due to the loss of information used to record who took how much oil and bill for it. This led to a fuel shortage and an emergency across the eastern United States. This is a prime example of the vulnerability of a supply chain with a centralized database.
Furthermore, the controversy surrounding fake used cooking oil (UCO) is further compromising transparency in the biofuel supply chain. Since the mid-2020s, the US and EU countries have raised suspicions that used cooking oil imported from China may be blended with vegetable oils such as palm oil [26]. The US Congress, in particular, believes China is exploiting this practice to exploit US tax incentives and Renewable Identification Number (RIN) fraud under the Renewable Fuel Standard (RFS). Given these concerns, it is crucial to maintain data transparency and immutability in the supply chain.
As such, securing components within the biofuel supply chain is essential. This also applies to agricultural products, which are the raw materials for biofuels. Hasan et al. [27] argued that if the agricultural supply chain is not properly secured, transparency and data traceability, which allow verification of product origin and authenticity of food labels, are lacking, leaving consumers at risk of greenwashing and deceptive labeling. To address this, the authors utilized an Ethereum-based blockchain network combining real-time IoT sensor monitoring, smart contracts, and IPFS distributed storage. This framework supports transparent and reliable decision-making regarding food authentication from farm to consumer through smart contracts and tamper-proof logs.

2.2. Blockchain-Based Crop Byproduct Information Security System

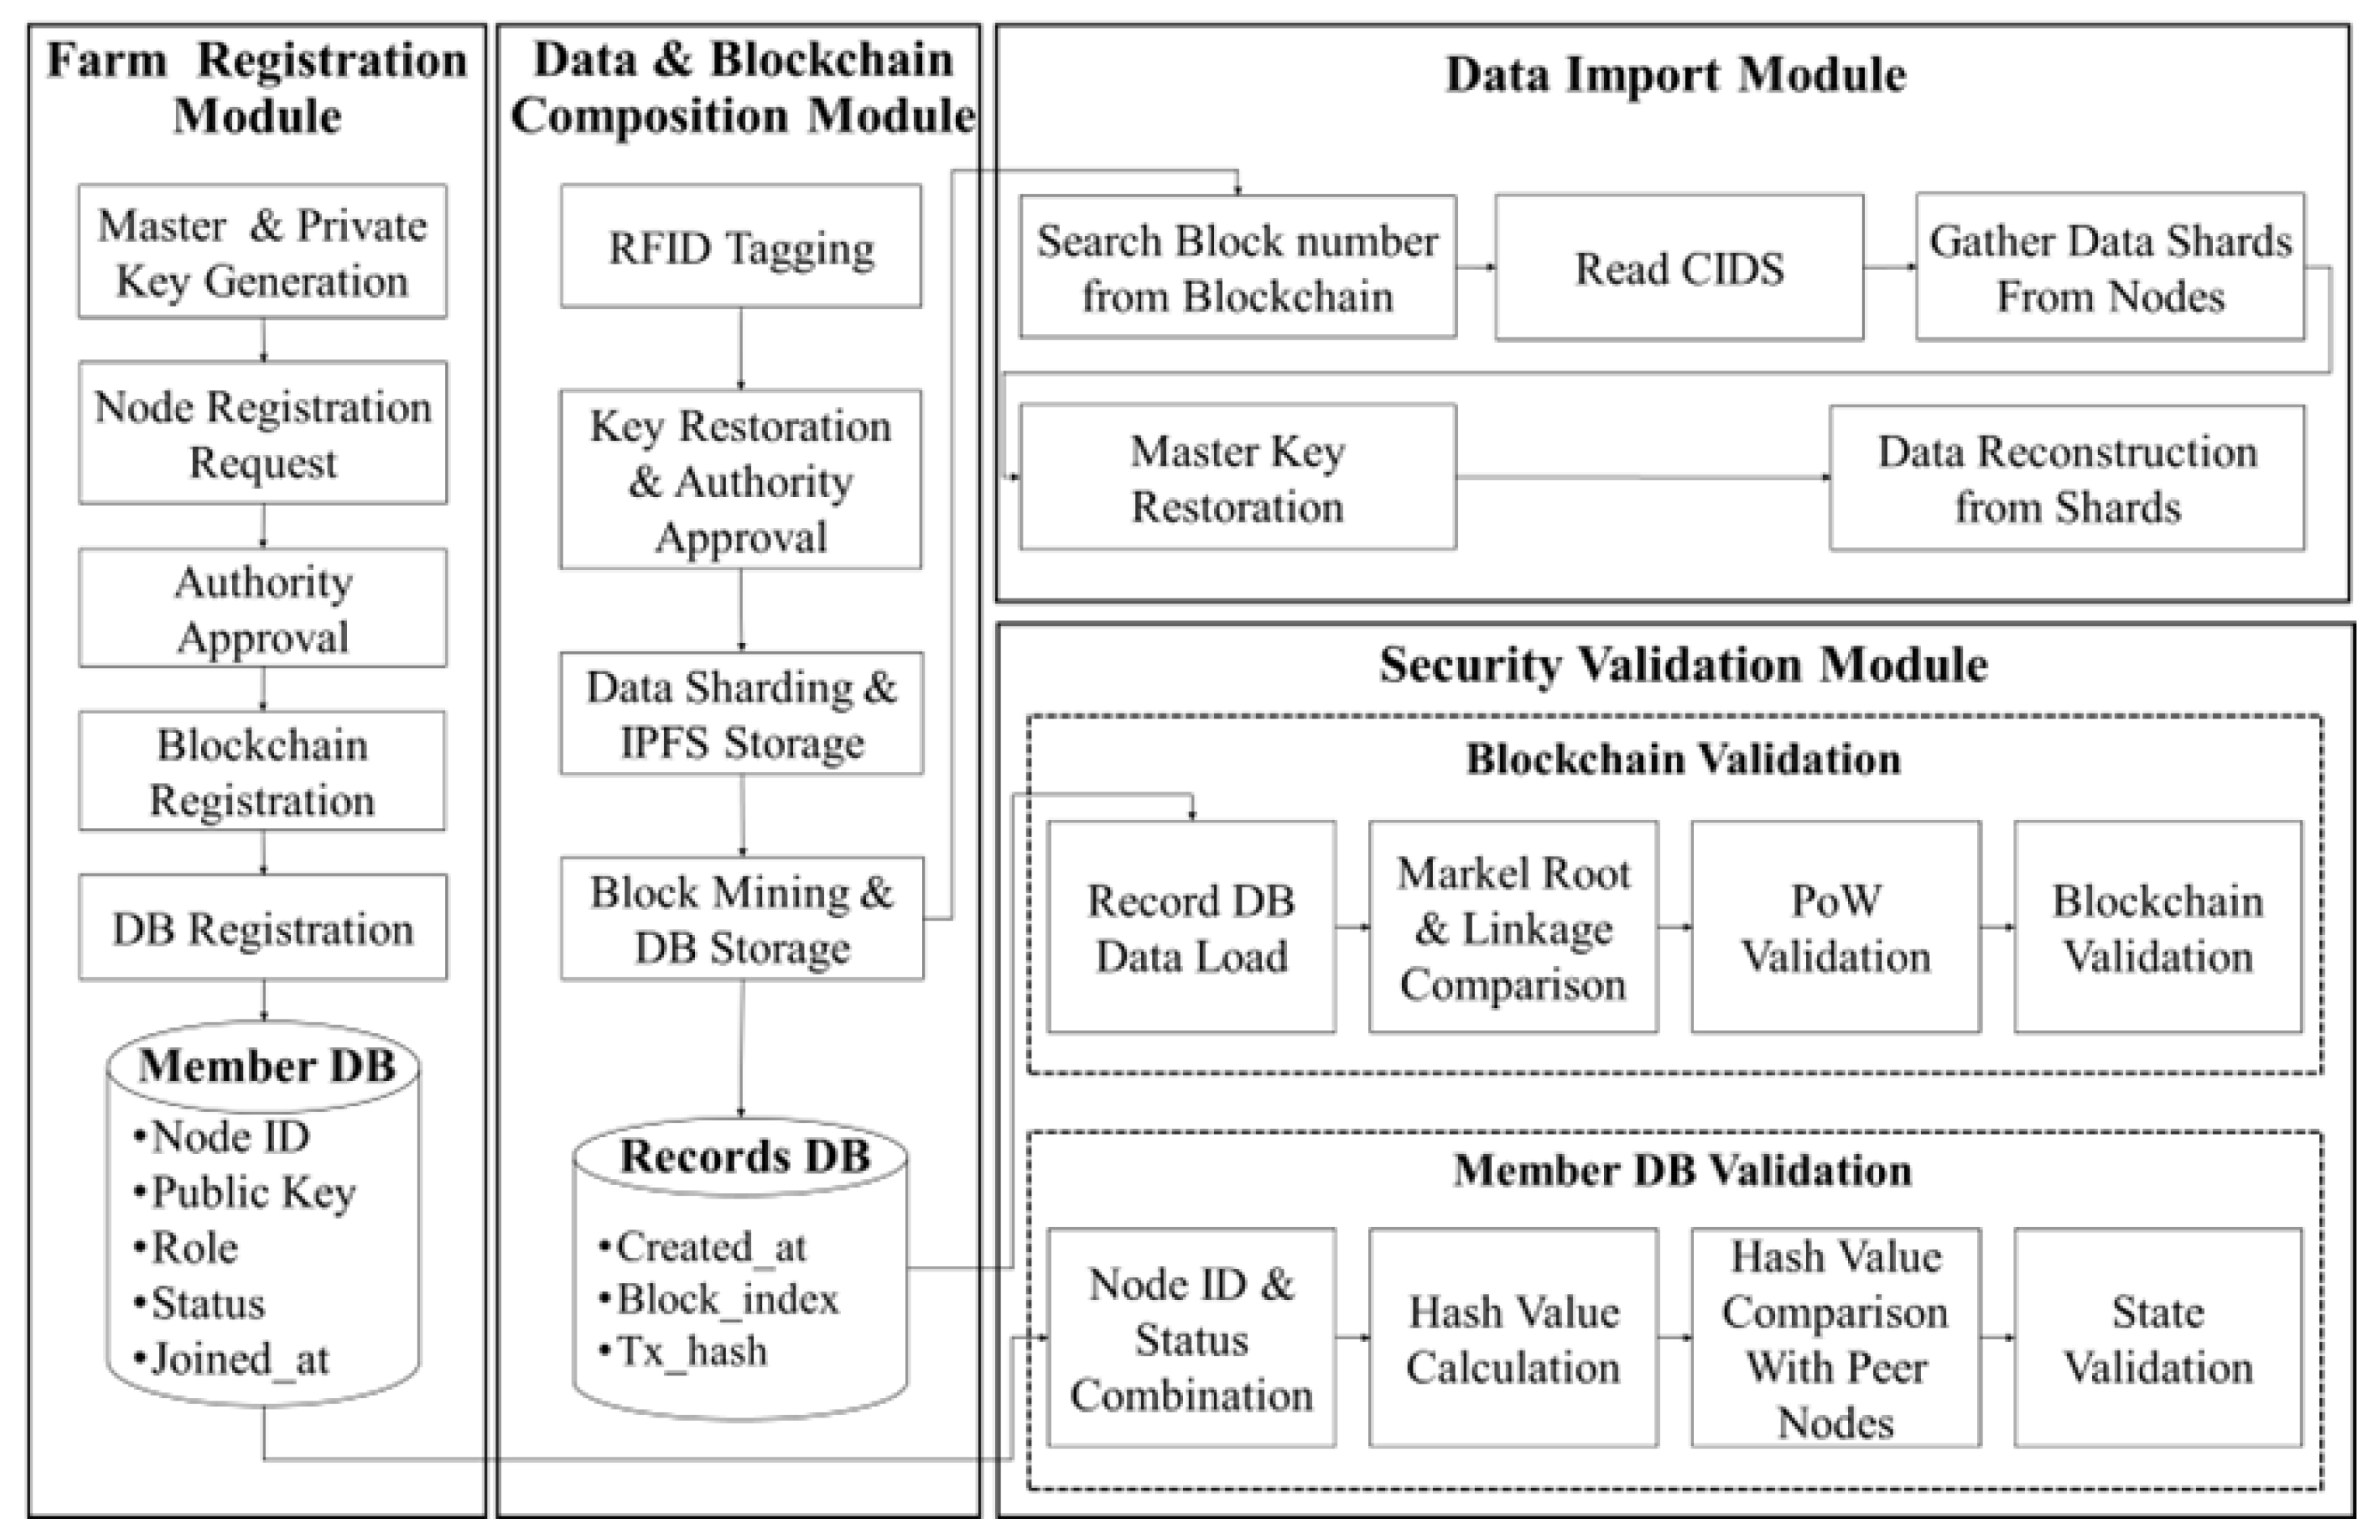
This study proposes a blockchain-based security system to secure the biofuel supply chain. Specifically, it implements a blockchain-based traceability system for crop byproducts, which are the raw materials for biofuels. Fraudulent claims or data manipulation during the supply of crop byproducts, which are the raw materials for biofuels, can lead to system interruptions and other supply chain disruptions. To prevent malicious intent against data, blockchain technology is introduced. The proposed blockchain-based biofuel supply chain consists of four modules. The farm registration module approves and manages farm (node) participation in the blockchain. The data and blockchain composition module reads RFID data and stores it in IPFS storage and the blockchain. The data import module restores and reads data stored in the blockchain. Finally, the security validation module verifies the synchronization between the distributed blockchain and the member database. Figure 2 shows the overall framework for this, and detailed descriptions of each module are provided in the following sections.

2.2.1. Farm Registration Module

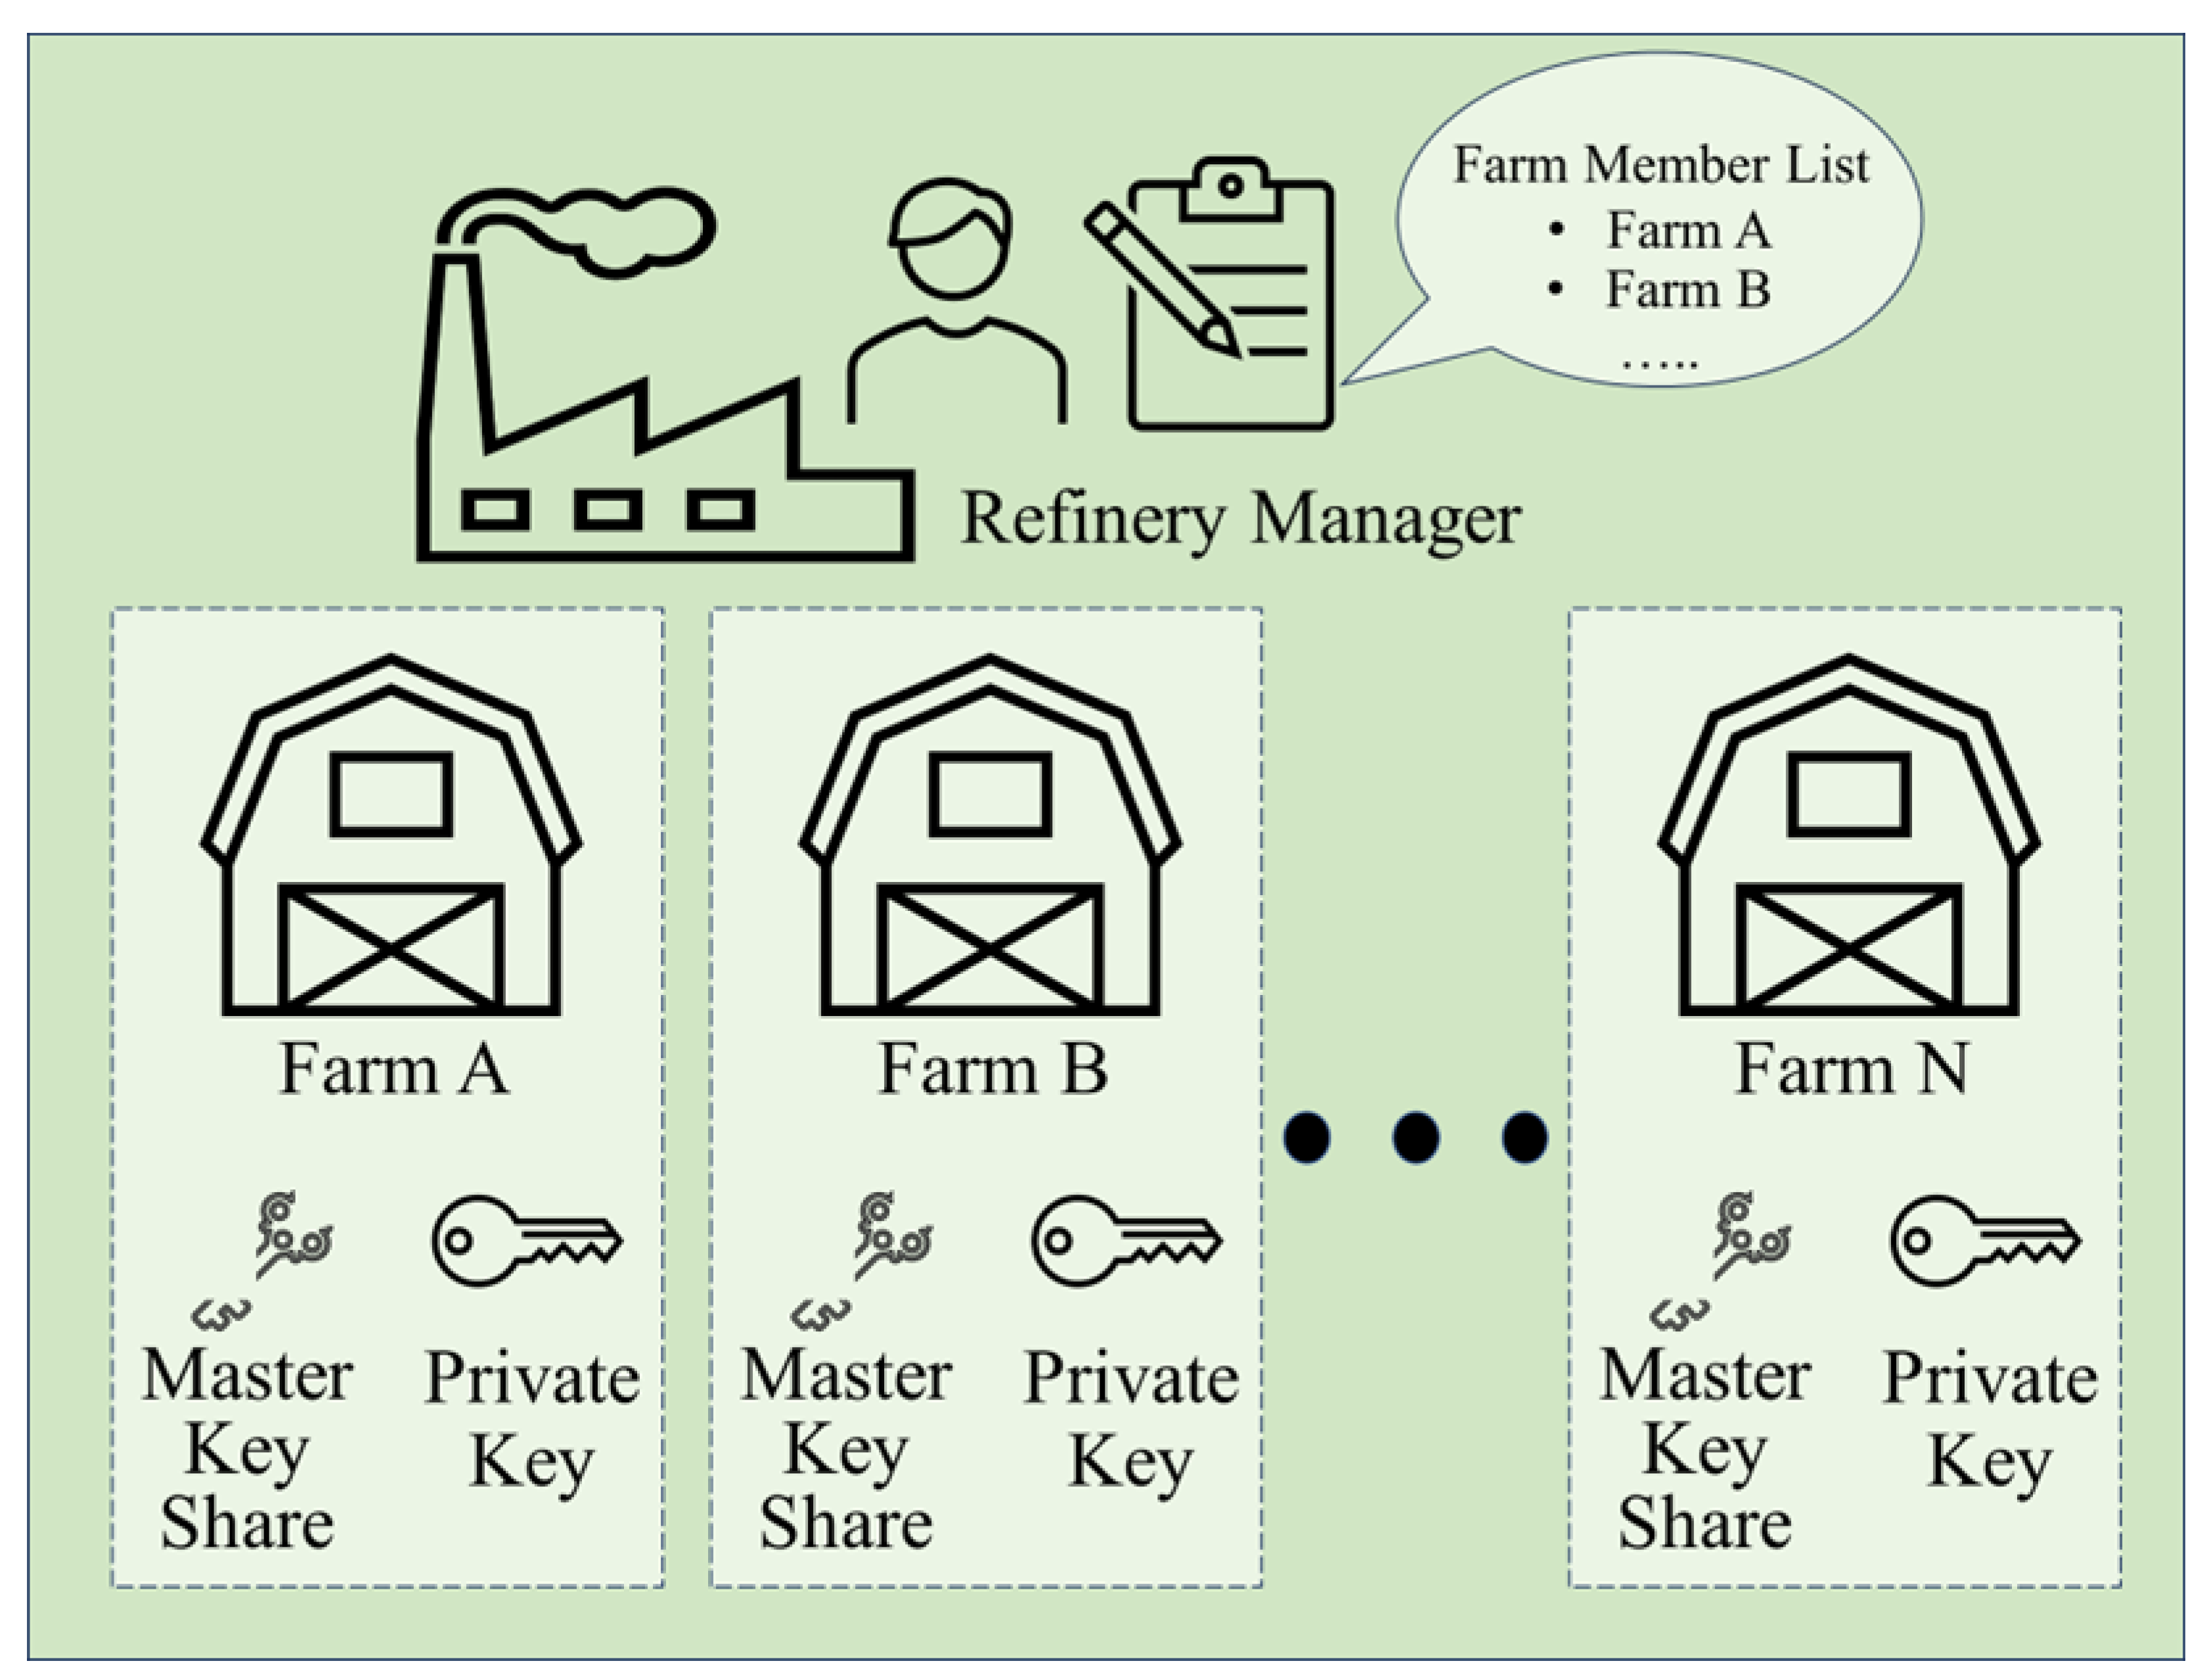
The farm registration module registers and approves new farms on the blockchain for their participation in the supply chain network. For a new farm, a feedstock producer, to join the supply chain network, each farm requires a private key for electronic transaction signatures and a master key share for data access in their local storage [28,29]. Once key generation is complete at the master and private key generation stage, the node derives a corresponding public key from the private key and transmits it to the refinery node, initiating the identity registration process at the node registration request stage. At the authority approval stage, the refinery node manager compares the pre-registration information of a farm with the applicant’s information to approve node registration and sends a verification request to the blockchain registration stage. The request of the refinery is verified through four steps: timestamp verification, hash value comparison, digital signature validity, and role authorization verification. Once access to the farm is approved, the blockchain registration stage mines a block to officially register the new farm on the blockchain. This information is synchronized to each node’s local database, making it verifiable by all users. Information stored in the local database is used later in the member verification process. The registration and authority approval function of the refinery node is activated only upon a new farm registration request and is not continuously operational. In all other functions, including data storage, blockchain composition, and consensus participation, the refinery node operates identically to farm nodes. Figure 3 schematically illustrates the actual farm registration process for refinery managers.

2.2.2. Data and Blockchain Composition Module

The data and blockchain composition module stores actual raw material data stored on RFID in the IPFS repository and distributes related information across the entire blockchain. In the meantime, this module processes raw data collected from RFID tags into a transaction format suitable for blockchain recording and stores it in a local database. RFID configuration information is broadly divided into physical identifiers (unique identifier (UID)), logistics dynamic information (time, quantity, type), and stakeholder information (worker name). In particular, it is combined with the unique identification number (Edge Node ID) of the device that reads data on-site and transmits it to the server to clarify the basis of data generation, and all time data is converted and stored according to the ISO 8601 standard [30].
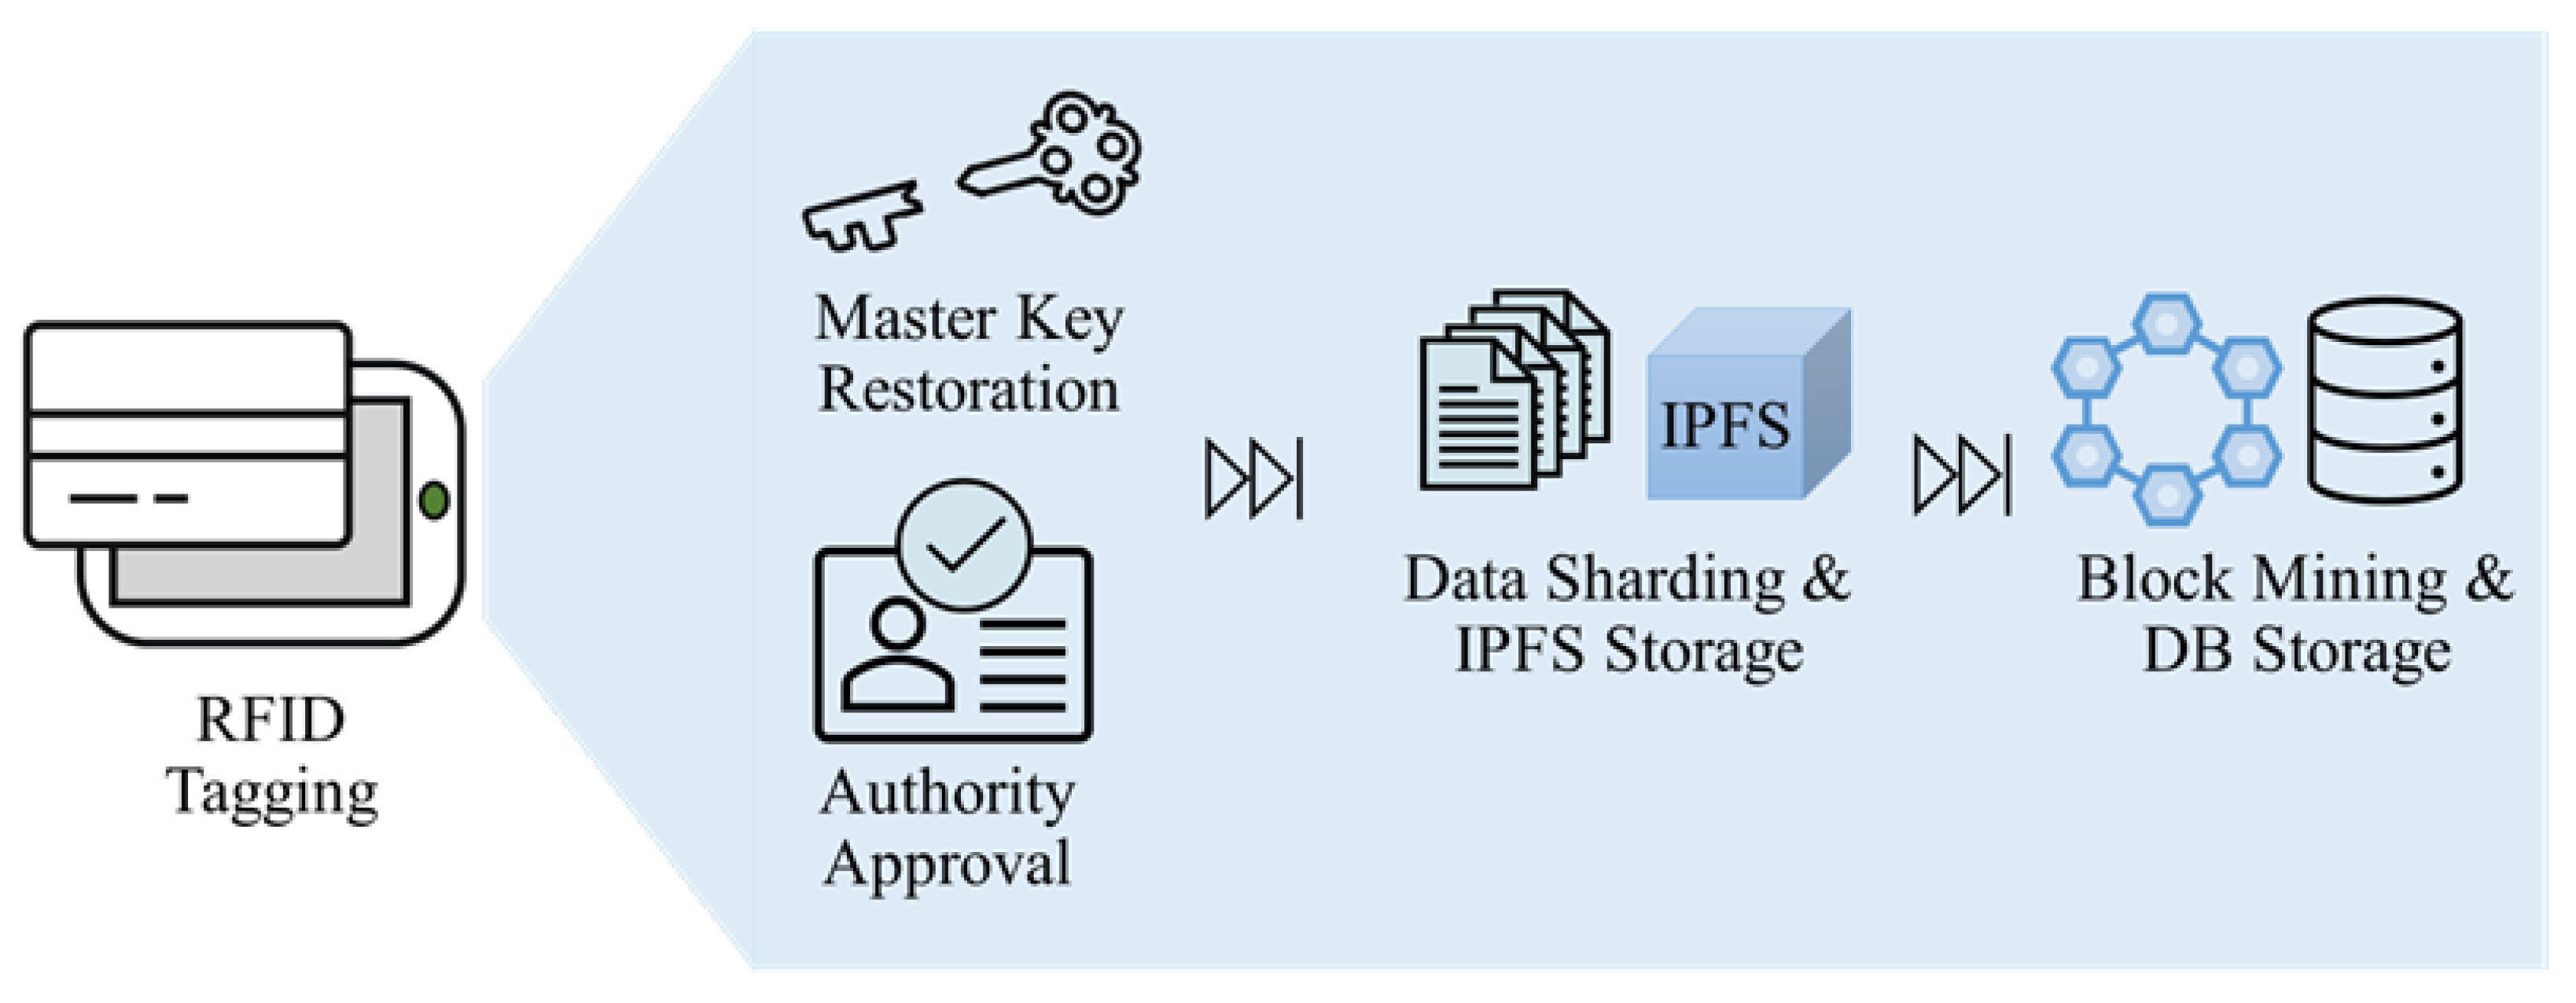
In the RFID tagging stage, when an RFID tag is tagged to a reader, the key restoration and authority approval stage begins. This stage consists of the master key restoration process and the authority approval process on the refinery node. If the process passes, the data moves to the data sharding and IPFS storage stage, where data is entered into the refinery node. If the process fails, data storage is rejected. The data sharding and IPFS storage stage divides the data into P shards using Shamir’s secret sharing algorithm [28]. The divided shards are stored in the IPFS network storage of each farm and refinery node [31].
In the block mining and data storage stage, the location information values (content identifier (CID) values) of all shards are mined in the blockchain in the form of transactions. The proposed methodology utilizes a hybrid consensus mechanism combining Proof-of-Work (PoW) and reputation-based snowball (R-snowball) during this stage (see Section 2.2.5 for more information). In order to prevent indiscriminate block generation and spam data input, the first operation is to perform a Hashcash-based PoW calculation that requires computation to change the Nonce value and find a valid hash value. The Nonce value increases from 0 to find a valid hash value. If a valid hash value is found (e.g., when the difficulty is d = 4 and the upper 16 bits are 0), the block generation is completed, and the node’s blockchain is updated. If the hash value is invalid, the block is not generated [32]. The next operation is for the node that created the block to broadcast the updated blockchain to other nodes. At this time, the receiving nodes derive a final consensus by calculating the final reputation score of the blockchain received through the R-snowball. Based on this consensus, each node updates its own blockchain and local database. Figure 4 shows the operation process of the module after RFID tagging.

2.2.3. Data Import Module

The data import module is for retrieving stored data. This module displays data recorded on the RFID when a specific farm is retrieved from the monitoring system. First, the block number of the required data is retrieved from the blockchain. The data shards are retrieved from nodes using the content identifier (CID) values (location information values) of the distributed shards corresponding to the block number. To verify retrieval authority, the master key share for the entire network is retrieved from each node and the master key is restored. If the master key is successfully restored, the data is restored using the data shards. If the restoration is successful, the data is displayed; if the restoration fails, the retrieval is rejected.

2.2.4. Security Validation Module

The security validation module verifies the integrity of the blockchain and member database in real time. First, the blockchain validation begins by retrieving the block index and the corresponding block’s tx_hash from the Records DB in Figure 2. Nodes then recalculate the Merkle root of each block to check for transaction falsification. The Merkle root is the final, top-level hash value obtained by encrypting all transaction data within a block, pairing them in a tree structure, and hashing them. It then uses the hash value of the previous block to verify the connection to the current block. This verifies the continuity of the chain. This verification prevents block tampering by storing the hash value of the previous block in the next block. The PoW is then re-executed for each block from the genesis block (the first block) to the latest block, and the recorded values are compared to verify the mathematical validity of the entire chain. Finally, the tx_hash value stored in the Records DB is compared with the corresponding blockchain transaction hash value. If they match, the integrity of the current block is confirmed. Afterwards, real-time cross-validation with peer nodes indicates that the locally stored blockchains match. If a discrepancy is found, a fork or discrepancy warning is issued through the UI.
The member DB validation checks the synchronization of the member DB to manage network participant permissions. Each node combines the node identifier (Node ID) and Status information obtained from the member DB to produce a unique status hash value. This hash value is compared with the values produced by peer nodes. If a match is found, the node’s member information is considered valid. If a match is not found, the member information is invalid.

2.2.5. R-Snowball Algorithm

Blockchain technology, which protects information in supply chain networks, relies on a consensus algorithm for updating new blocks when new data is entered during the data recording process. This study proposes a hybrid R-snowball algorithm that combines the probabilistic random subsampling technique of the Snowball protocol proposed by Rocket et al. [33] with a behavior-based reputation model unique to the biofuel supply chain [34,35]. This algorithm achieves the lightweight required for computationally constrained environments, such as RFID tags and IoT devices, while also solidifying finality led by authenticated internal nodes using a mathematical reputation system. The pseudocode of the R-snowball algorithm is presented in Algorithm 1. The algorithm consists of four stages: (1) reputation score calculation, in which the final reputation score for each node is determined by the sum of the identity-verified base score and the accumulated reputation score up to the calculation time; (2) random partial sampling, in which k nodes are randomly selected from the active peer set using a probabilistic subsampling technique to collect and validate candidate chains; (3) consensus weight calculation and chain confirmation, in which the consensus weight for each candidate chain is calculated as the sum of the reputation scores of its supporting nodes, and the canonical ledger is determined based on maliciousness verification results and predefined criteria; and (4) reputation update based on contribution, in which each node’s accumulated reputation score is updated by adding reward or punishment values according to the node’s role in the consensus process.
Algorithm 1. R-snowball consensus algorithm
Input :   Local   chain   C l o c a l ;   active   peer   set   Ω ;   trigger   node   n t r i g g e r   ( optional ) ;   sub - sampling   size   K ;   finality   depth   d f ;   participation   threshold   W P C
Output: Updated canonical chain; updated reputation scores
Precondition: Proof-of-Work is completed before this algorithm is invoked in every consensus round.
   ▷ Stage 1: Reputation Score Calculation
1:
for   each   node   n i   Ω  do
2:
     if   n i   MemberDB   then   a i     W m e m b e r
3:
     else   a i     W g u e s t
4:
     P i , l     a i   +   R i , l
5:
     if   n i MemberDB   then   P i , l     m i n ( P i , l ,   W g u e s t   m a x )
6:
     P i , l     c l a m p ( P i , l ,    P i , l m i n ,    P i , l m a x )
7:
end for
   ▷ Stage 2: Random Partial Sampling
8:
S     { n t r i g g e r }   if   n t r i g g e r ;   else   S    
9:
S     S     RandomSample ( Ω \ S ,   K | S | )
10:
Votes [ Hash ( C l o c a l . last ) ]     P s e l f , l ;   ChainStore     { C l o c a l } ;   VerifiedPeers    
11:
for   each   n j S  do
12:
   Fetch   C j   from   n j ;   if   C j =     P i , l < W P C  then continue
13:
   if   ¬   ValidChain ( C j )   then   P j , l + 1     P j , l 5 ; continue
14:
   δ     FindDivergenceIndex ( C l o c a l , C j )
15:
   if   ( | C l o c a l |   δ ) >   d f   then   result   Reject ,   P j , l + 1     P j , l + β p u n i s h ; continue
16:
   Votes [ Hash ( C j . last ) ]     Votes [ Hash ( C j . last ) ]   +   P j , l ;   Chainstore    Chainstore { C j } ;   VerifiedPeers    VerifiedPeers { n j } ;
17:
end for
   ▷ Stage 3: Consensus Weight Calculation and Chain Confirmation
18:
for   each   candidate   chain   c m     ChainStore :   S c m     Votes [ c m ] =   i I N i , c m   ×   P i , l  
19:
c f i n a l     a r g m a x c m ( l e n g t h ( c m ) ,   S c m ,   H a s h ( c m ) )
20:
if   length ( c f i n a l )   >   | C l o c a l |   C f i n a l is not history rewriting then result ← Simple Extension
21:
else   if   length ( c f i n a l )   >   | C l o c a l |     Hash ( C f i n a l . last )     Hash ( C f i n a l . last )     C f i n a l is not a history rewriting then result ← Fork resolution
22:
if   result   =   Simple   Extension result   =   Fork   Resolution   then   C l o c a l     c f i n a l ;   SyncDB ( C l o c a l )
   ▷ Stage 4: Reputation Update Based on Contribution
23:
for   each   n i   VerifiedPeers   where   n i     self do
24:
   if   n i   voted   for   c f i n a l     result = Simple   Extension   then   β     β f o r k
25:
   else   if   n i   voted   for   c f i n a l     result = Fork   Resolution   then   β     β e x t
26:
   else   if   n i   participated   then   β     β p c
27:
   else   if   result   =   Reject     n i   is   Proposer   then   β     β p u n i s h
28:
   R i , l + 1      R i , l   +   β
29:
end for
30:
return   C l o c a l , updated BehaviorDB
In the reputation score calculation stage, the final reputation score P i , l for each node ( n i ) in each consensus round ( l ) is determined by the sum of the base score ( a i ) based on identity verification and the accumulated reputation score ( R i , l ) up to the calculation time (see Equation (1)).
P i , l = a i + R i , l   ( P i , l m i n     P i , l     P i , l m a x )
where P i , l m i n is the lower bound of the final reputation score that a node can have, and P i , l m a x is the upper bound of the final reputation score that a node can have.
The base score ( a i ) represents the difference between the scores of member nodes and guest nodes. This serves to reduce guest nodes’ influence in the consensus process by assigning a lower reputation score to guest nodes, thereby encouraging regular members to lead the consensus. For a sample size k of nodes selected from all nodes, a guest score cap is applied to ensure that a guest node’s score does not exceed the base reputation score of regular member nodes. The score cap W g u e s t m a x represents the maximum final reputation score a guest can have. It is calculated as shown in Equation (2).
W g u e s t   m a x = W m e m b e r / k
In the consensus weight calculation and chain confirmation stage, the consensus weight for a specific chain is calculated by multiplying the voting power score by the number of supporters, as shown in Equation (3).
S ( c m ) = i I N i , c m × P i , l
where c m is the chain m used for consensus, and S ( c m ) is a function that calculates the sum of the reputation scores supported by nodes for the chain as a consensus weight. N i , c m is a binary variable that takes the value 1 if node i supports the c m and 0 otherwise. P i , l is the final reputation score of node i in round l .
After selecting the chain with the highest consensus weight ( c f i n a l ), a maliciousness verification is performed to confirm that it satisfies the criteria. The Canonical ledger is determined based on the verification results and criteria. The criteria for determining the Canonical ledger are described in Table 1.
In the reputation update based on contribution, each node updates the reputation scores of consensus nodes other than itself at each consensus round using Equation (4).
R i , l + 1 = R i , l + β
where R i , l is the accumulated reputation score up to round l , and β represents the reward and punishment values according to the node’s role in the consensus process. Nodes that arrive at a correct consensus are given high rewards, while simple participants are given basic rewards. Conversely, nodes that attempt falsification are penalized, preventing them from participating in the consensus process. At this time, the node’s accumulated reputation score is updated by adding the reward and punishment values ( β ) according to the node’s role, to the accumulated reputation score up to round l . β is determined based on Equation (5).
β = { β e x t   i f   n i   v o t e d   f o r   c f i n a l     F i n a l _ c h a i n = S i m p l e   E x t e n s i o n β f o r k   i f   n i   v o t e d   f o r   c f i n a l     F i n a l _ c h a i n = F o r k   R e s o l u t i o n β p c   i f   n i   p a r t i c i p a t e d       β p u n i s h   i f   F i n a l _ c h a i n = R e j e c t       n i   i s   P r o p o s e r
where β e x t is the reward received by node n i if the chain proposed by node n i is selected as a Simple Extension. β f o r k is the reward received by node n i if the chain proposed by node n i is selected as Fork Resolution. β p c is the reward received if the proposed chain is not selected despite participating in consensus. β p u n i s h is the punishment received by node n i if the proposed chain is rejected.
R-snowball must be performed after the Proof-of-Work (PoW) process in every round of blockchain consensus. This is significant in that it enhances reliability by rewarding nodes that consistently participate in a clear biofuel supply chain, and it punishes malicious behavior by nodes that are unidentified or defective, thereby ensuring blockchain stability.

2.2.6. Statistical Hypothesis Testing

In this study, Welch’s t-test [36] and Mann–Whitney U test [37] are used to ensure statistical significance of the results in the experiment and discussion. To test the difference in mean recovery time between two independent groups, Welch’s t-test is applied, which is robust even in situations where the variances between groups are unequal and the sample sizes differ. The t-statistic for this test is calculated as shown in the following Equation (6).
t = x 1 ¯ x 2 ¯ s 1 2 n 1 + s 2 2 n 2
where x i ¯ , s i 2 , and n i represent the mean, variance, and sample size of the groups, respectively. Here, the degrees of freedom ( ν ) are approximated by the Welch–Satterthwaite equation, as shown in Equation (7).
ν ( s 1 2 n 1 + s 2 2 n 2 ) 2 ( s 1 2 / n 1 ) 2 n 1 1 + ( s 2 2 / n 2 ) 2 n 2 1
The calculated t-statistic and degrees of freedom ( ν ) are ultimately used to determine statistical significance. The ν defines the shape of Student’s t-distribution followed by the test statistic t, and by deriving the p-value corresponding to the observed t-statistic on this distribution, the acceptance or rejection of the hypothesis is determined under the set significance level ( α = 0.05 ).
In addition, to compensate for the limitations of the normality assumption due to the small sample size of the control group, a rank-based Mann–Whitney U test is performed in parallel. After combining the observations of the two groups and ranking them, the statistic U is calculated as follows using Equation (8):
U = n 1 n 2 + n 1 ( n 1 + 1 ) 2 R 1
where R 1 is the sum of the ranks of the first group observations. Under the null hypothesis, the expected value of U and its variance are given by the following Equations (9) and (10).
E [ U ] = n 1 n 2 2
V a r [ U ] = n 1 n 2 ( n 1 + n 2 + 1 ) 12
The normal distribution Z-score is calculated by Equation (11). The Z-score is converted into a probability on the standard normal distribution to derive the p-value, and the decision to accept the hypothesis is made under a set significance level ( α = 0.05 ).
Z = U E [ U ] V a r [ U ]
Furthermore, to quantify the practical magnitude of the observed difference beyond statistical significance, Cohen’s d is employed as a measure of effect size. Cohen’s d is calculated as the standardized mean difference between two groups, as shown in Equation (12) [38]:
d = | x ¯ 1 x ¯ 2 | S p o o l e d
where S p o o l e d is the pooled standard deviation of the two groups, calculated as shown in Equation (13).
S p o o l e d = ( n 1 1 ) s 1 2 + ( n 2 1 ) s 2 2 n 1 + n 2 2
Here, s i 2 and n i represent the variance and sample size of each group, respectively. The resulting d value is interpreted according to the conventional benchmarks proposed by Cohen, where values below 0.2 are considered negligible, values between 0.2 and 0.5 indicate a small effect, values between 0.5 and 0.8 indicate a medium effect, and values of 0.8 or above indicate a large effect. This allows for a complementary assessment of whether a statistically significant result also carries practical significance.

3. Experiments

3.1. Scenario

To evaluate the effectiveness of the proposed R-snowball-based supply chain system, experiments are conducted in terms of two key aspects: (1) system resilience, and (2) security and robustness. The six-node configuration adopted in this study reflects the realistic operational scale of the biofuel supply chain. As demonstrated in an empirical supply chain case study by Kim et al. [20], under the current 4% bioethanol blending policy, only five farms are actively selected as corn stover suppliers based on geographic and transportation cost efficiency, resulting in an effective network of five farms and one centralized facility. Therefore, the experimental environment consisted of a total of six nodes, and the sub-sampling size ( K ) required to reach a consensus is set to 3. Specific experimental parameters are detailed in Table 2. The PoW difficulty of the blockchain is set to 1, the minimum level, to focus on the logical verification of the R-snowball algorithm by reducing the resources consumed during the PoW computation process. Additionally, the finality depth for the last blocks is designated as 3 to prevent history rewriting attacks. Regarding the reputation scores, the initial member score ( W m e m b e r ) and initial guest score ( W g u e s t ) are set to 80 and 20, respectively. By setting the reputation cap for guests ( W g u e s t m a x ) to 26.6 as defined in Equation (2), the system ensures that when the sub-sampling size ( K ) is 3, the sum of guest node scores does not exceed 80, thereby maintaining the existing blockchain. Finally, the penalty score ( β p u n i s h ) is set to −100 to ensure that participation eligibility is not revoked at once, based on the scores accumulated between the maximum reputation score ( P m a x ) of 120 and the participation cap ( W P C ) of 10 for all nodes.
First, the experiments evaluate node failure scenarios that may occur during operation to verify system resilience. The evaluation is divided into two categories: (1) failures of farm nodes (general participant nodes) and (2) failures of the refinery node (the network’s core administrator node). To analyze how quickly the system ensures data availability in such failure events, the system’s stable resilience is examined by generating incremental traffic loads upon failure for each node type and quantitatively measuring the recovery speed.
Second, the system’s state is evaluated regarding internal and external attacks to verify security and robustness. Specifically, this experiment focused on evaluating whether the proposed reputation-based R-snowball algorithm blocks an attacker’s influence and successfully defends the blockchain against attacks. The evaluation considers Byzantine faults, where control of the refinery node—serving as the network’s trust anchor—is hijacked, leading to malicious data manipulation. In this scenario, one refinery node is designated as the malicious node with no prior knowledge of the reputation mechanism, injecting a modified blockchain and repeatedly broadcasting manipulated consensus messages to overwrite the legitimate ledger, and the attack is considered successful if the manipulated blockchain replaces the existing legitimate ledger. In this experiment, the security success rate in defending against and punishing malicious consensus propagated by the hijacked node is assessed, along with the mathematical rigor of the reputation-based penalty logic. Furthermore, a Sybil attack scenario is established, where an attacker generates multiple fake nodes (Sybil nodes) to join the network and propagate malicious consensus [39]. The number of Sybil nodes is incrementally increased from 1 to 40, and each Sybil node is configured to broadcast a manipulated blockchain with a forged transaction history, collectively attempting to accumulate sufficient consensus weight to replace the legitimate chain. Through this, the security success rate of blocking the manipulated blockchain from taking over the existing ledger is calculated, and the system’s robustness is confirmed by measuring changes in consensus duration as the number of nodes increases.
Additionally, the experimental configuration for evaluating the performance of the proposed R-snowball-based blockchain information protection system is detailed in Table 3. The experiments are conducted on a system equipped with an Intel Core i7-13700 processor and 16 GB of memory, running the Windows 11 operating system. The network communication environment is configured based on a 1 Gbps Ethernet connection. The entire blockchain network setup, the implementation of the consensus logic, and the experimental simulations are all developed and executed using Python 3.11.0 and IPFS version 0.38.1.

3.2. Results

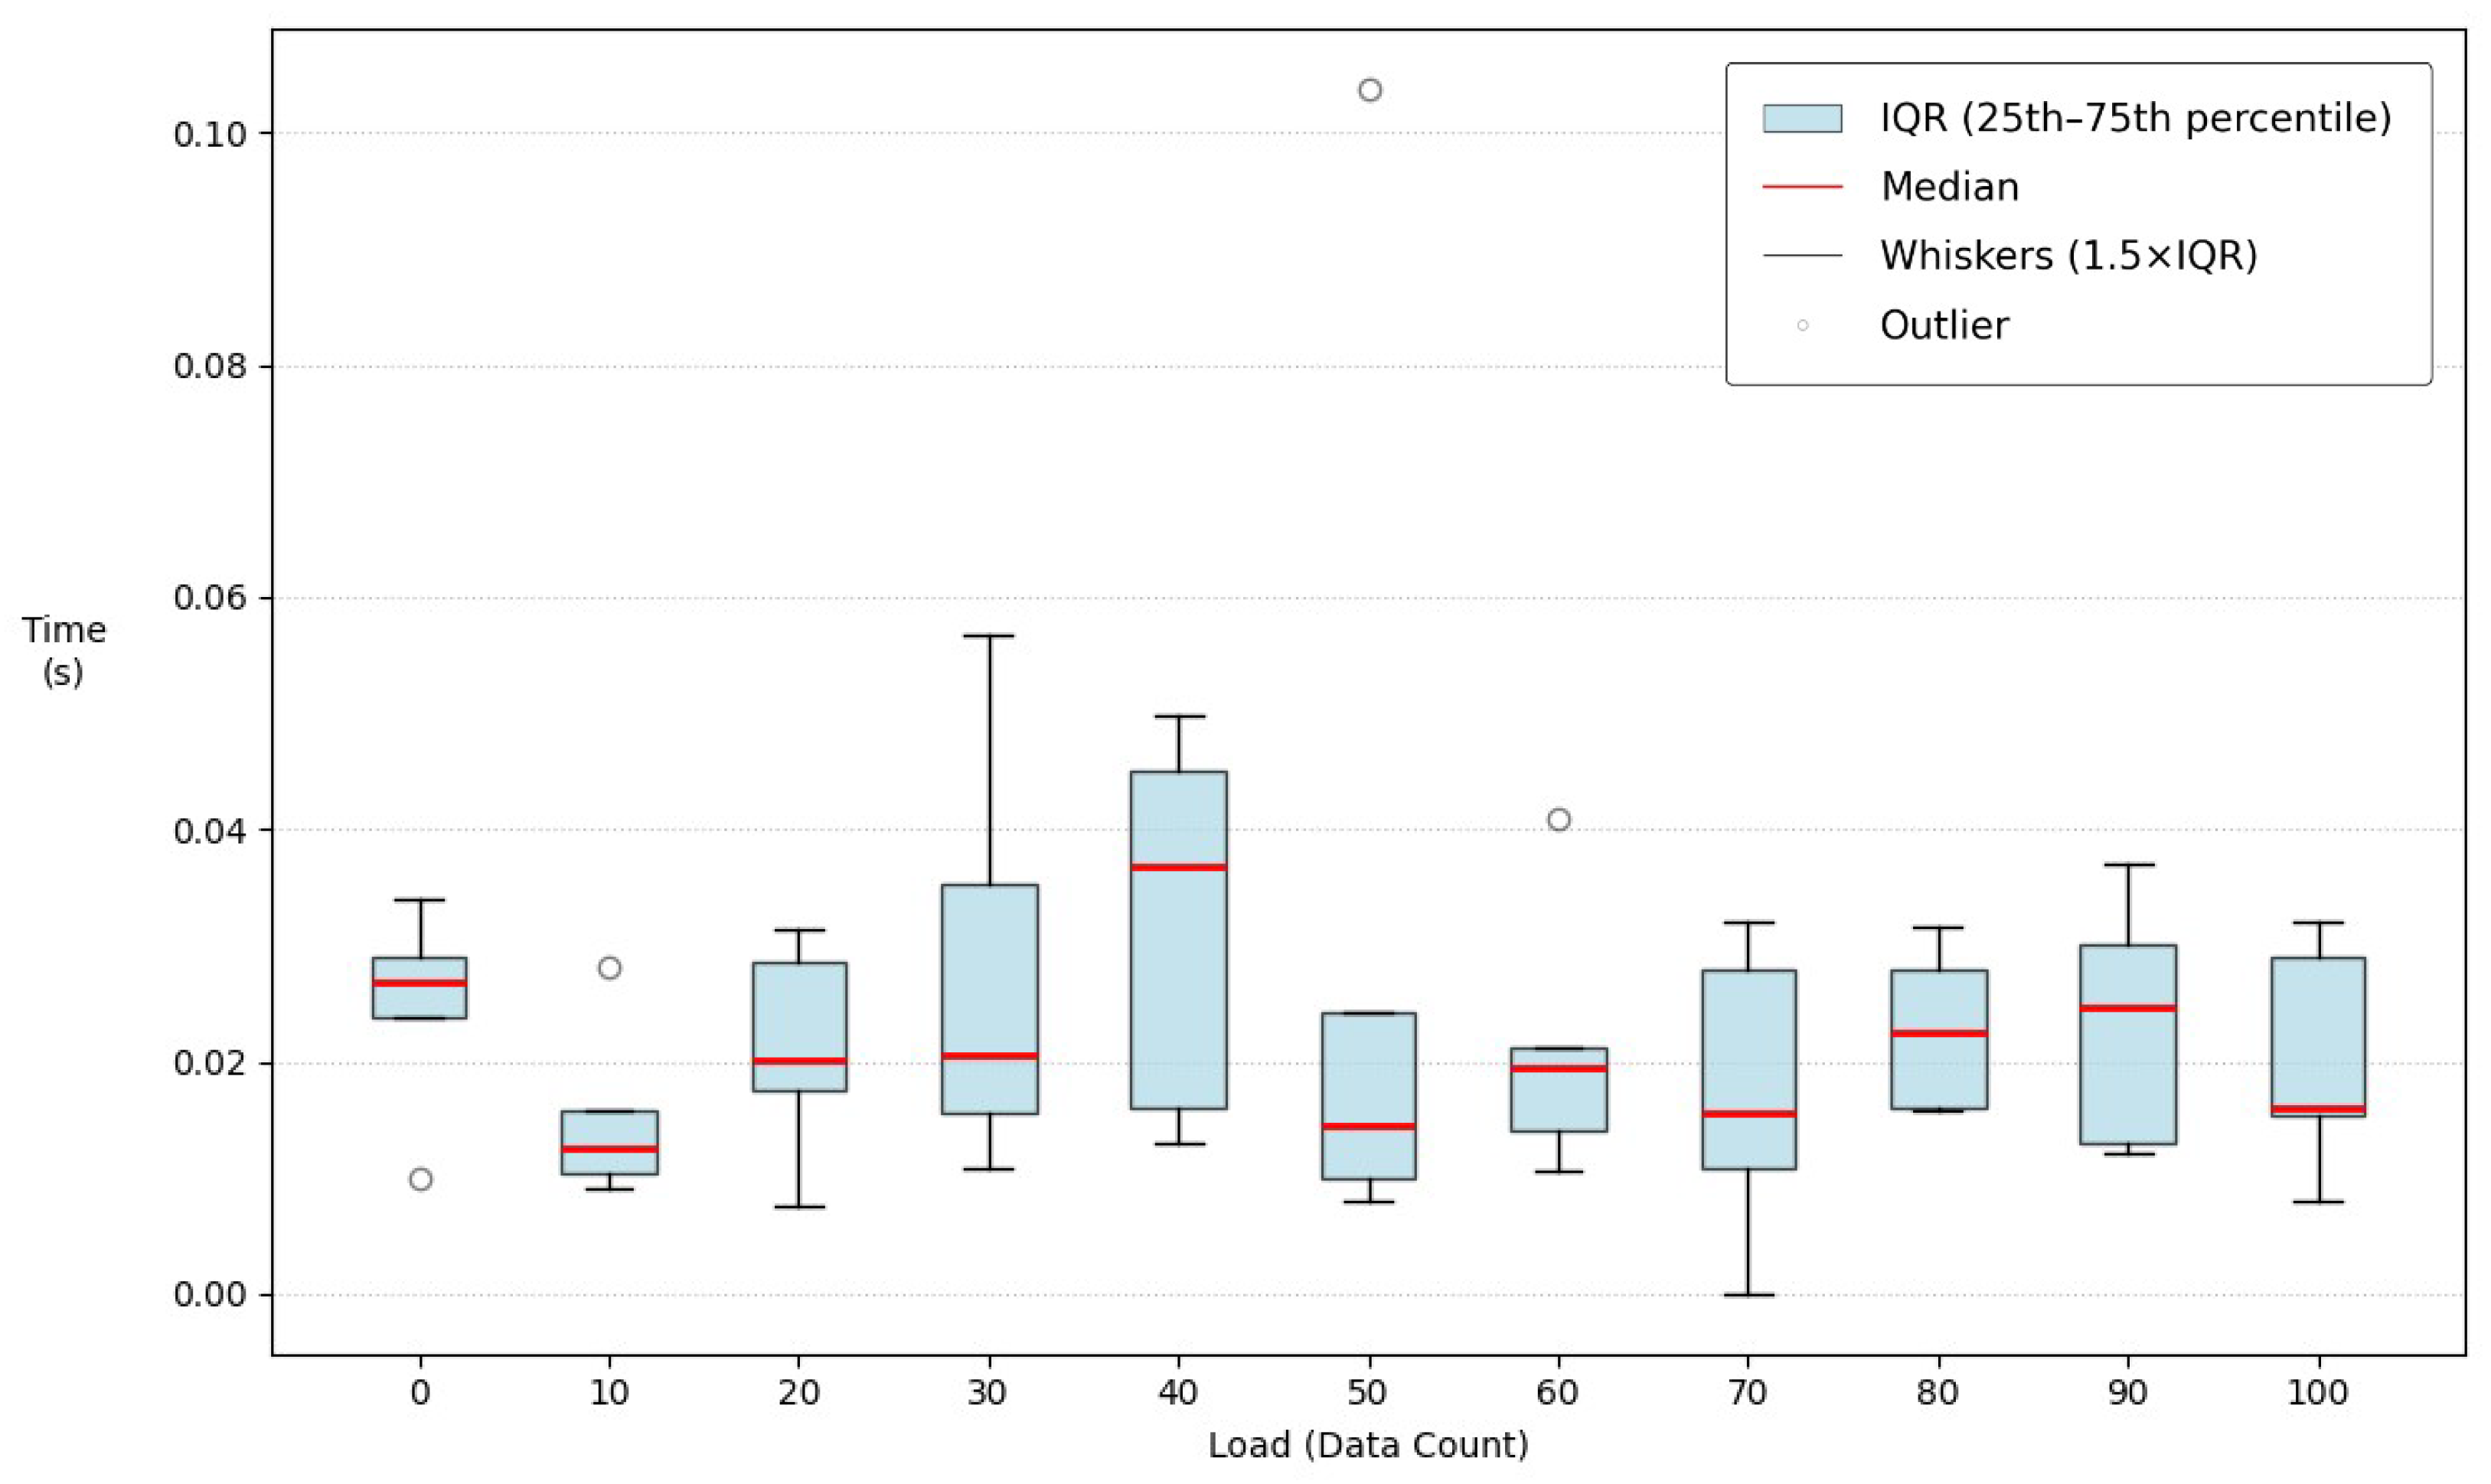
Based on the experimental scenarios described in Section 3.1, this section evaluates node failure scenarios that may occur during operation to verify the resilience of the proposed system, and assess the system’s state against internal and external attacks to verify security and robustness. Figure 5 shows the recovery time distribution using a box plot when a failure occurs in a Farm node under various transaction load conditions (Load 0–100).
In Figure 5, examining the overall trend, the system operates stably, with the median recovery time (solid red line) maintaining a range between a minimum of 0.0125 s (Load 10) and a maximum of 0.0367 s (Load 40) across most load intervals. In particular, at Load 30 (IQR of 0.0198 s) and Load 40 (IQR of 0.0292 s), the lengths of the boxes representing the interquartile range (IQR) become significantly longer compared to other intervals, indicating a temporary increase in the variance of recovery times. However, as the load further intensifies in the maximum load intervals of Load 80–100, the medians paradoxically stabilize downward to a range of 0.0159 to 0.0247 s, and the variance also decreases. This demonstrates that even under extreme increases in transaction load, the system’s recovery performance does not continuously degrade within the designed consensus algorithm.
Meanwhile, outliers are observed in several intervals. The most notable examples are a single delayed measurement of 0.1038 s at Load 50 and a recorded value of 0 s at Load 70. However, considering that the overall distribution maintains a normal trajectory (i.e., median 0.0144 s at Load 50, median 0.0155 s at Load 70) and that such extreme values do not occur at the maximum load condition of Load 100, it is clear that this is not due to a structural bottleneck. That is, these outliers are analyzed as exceptional cases resulting from momentary communication delays inherent to distributed network environments or temporary verification errors within individual nodes.
Consequently, this distribution demonstrates that even under the highest transaction load environment (i.e., median 0.0159 s at Load 100), the Farm nodes consistently exhibit recovery speeds comparable to, or even faster than, those in the optimal, no-load state (i.e., median 0.0268 s at Load 0). This indicates a robust system architecture capable of immediately rectifying unexpected faults in certain nodes and maintaining the network without interruption.
Table 4 presents the results of measuring the recovery time when a farm node failed. The results were obtained by randomly shutting down farm nodes for 30 min and measuring the recovery time five times based on transactions (Load 0–100) that occurred during that time. For Load 0, 50 data points were collected from farm nodes operating under no-load conditions across the network. For Load 10–100, measurements across 10 load conditions yielded 49 data points in total, with one measurement error at Load 70 excluded. In Table 4, the average recovery time for Load 0 is 0.0285 s, and for Loads 10–100, the average recovery time is 0.0242 s. In Welch’s t-test, considering the difference in sample size and variance between the two groups, the difference in recovery time between the two groups is not statistically significant (p = 0.1820 > 0.05). In addition, as a non-parametric robustness check, there is no significant difference in the Mann–Whitney U test (p = 0.0715 > 0.05). Furthermore, Cohen’s d (=0.2704) indicates a small effect size, confirming that the practical difference between the two groups is negligible. Therefore, it is statistically confirmed that the proposed blockchain maintains the same level of data recovery speed as the optimal state with no load (Load 0), even in a situation with extreme traffic load (Load 100).
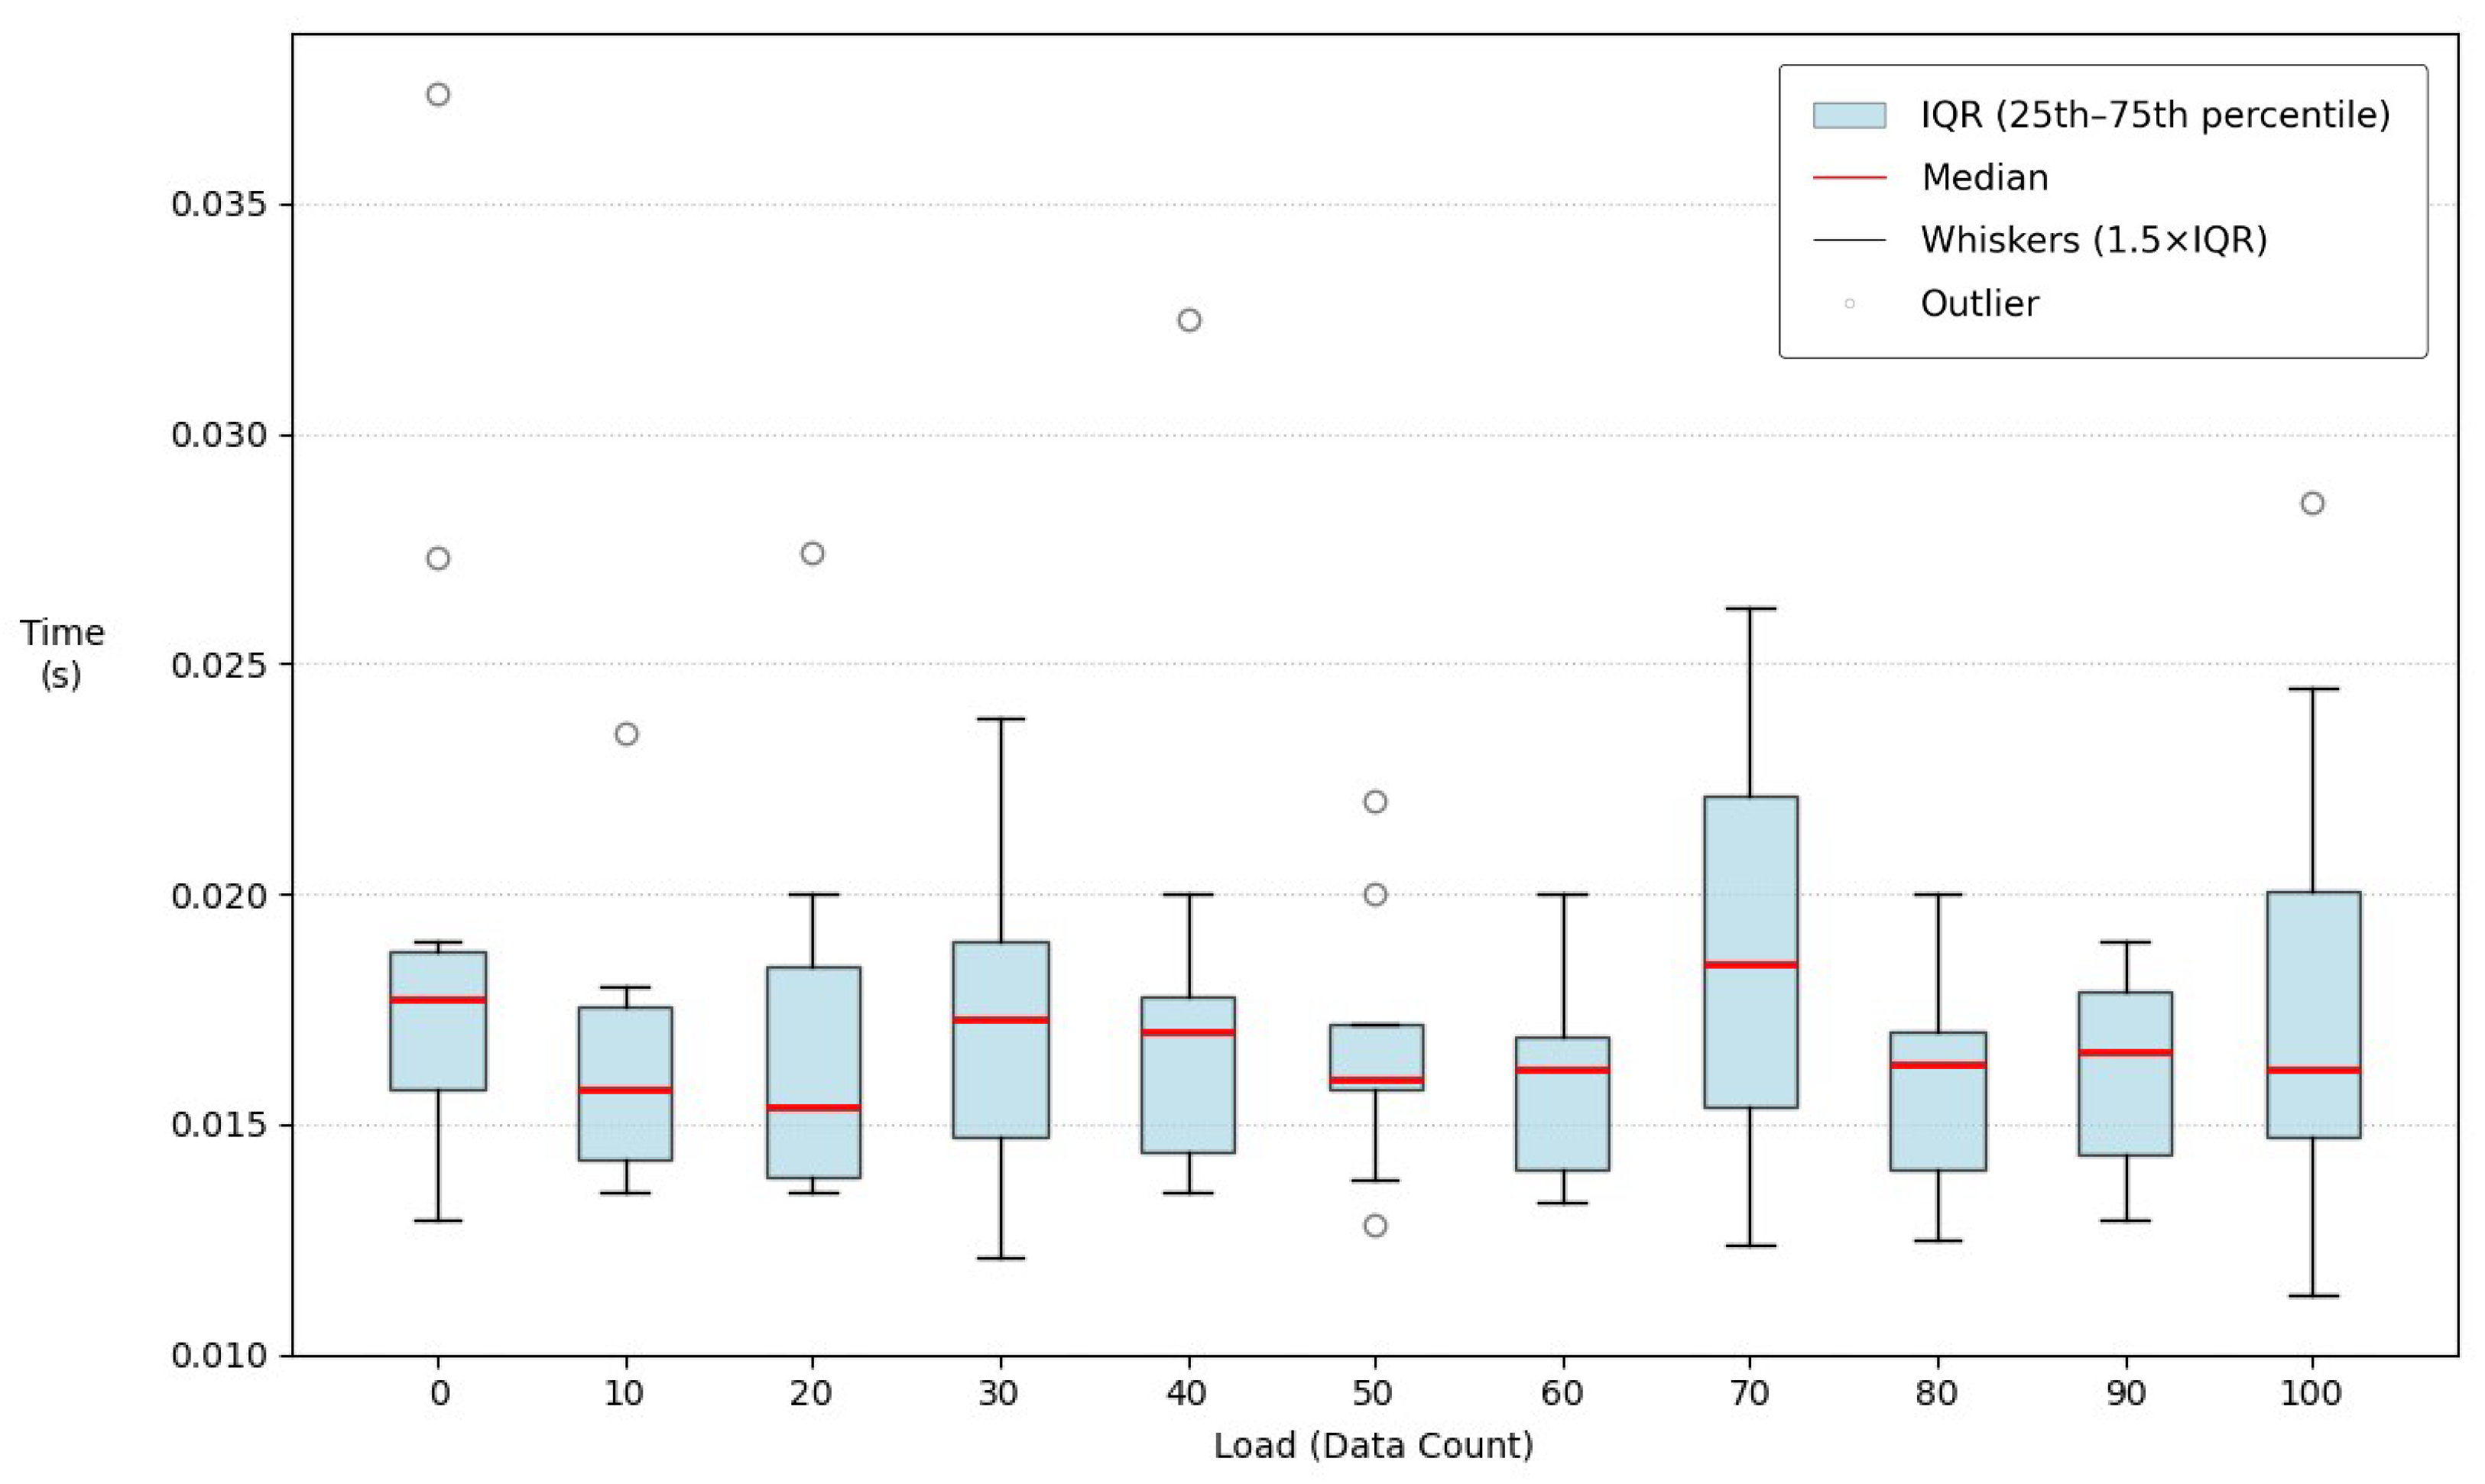
Figure 6 shows the recovery time distribution using a box plot when a failure occurs in the Refinery node under various transaction load conditions (Load 0–100). The most prominent feature of this graph is that, regardless of the continuous increase in data load, the median recovery time (solid red line) remains stable within a very narrow range between 0.0154 s and 0.0185 s. In particular, the median for the optimal, no-load state (Load 0) is 0.0177 s, and the median for the maximum transaction load state (Load 100) is 0.0162 s, recording comparable levels. This demonstrates that even during heavy load processing, a failure in some nodes does not disrupt the entire system, and the recovery speed is consistently maintained without degradation.
Furthermore, the variance in the data recovery process is also very low. Excluding the vicinity of Load 70 (IQR of 0.0067 s), the lengths of the boxes representing the interquartile range (IQR) are formed thinly and uniformly around 0.001 to 0.005 s across most load levels. The maximum and minimum distribution of the data, indicated by the top and bottom whiskers, is also mostly concentrated within a narrow boundary of 0.011 to 0.026 s, indicating that the recovery process is not swayed by specific factors.
While the overall distribution shows high stability, minor outliers are observed in certain intervals. The most notable outlier is a measurement of 0.0374 s at Load 40, followed by measurements of 0.0325 s at Load 40 and 0.0285 s at Load 100, which is somewhat higher compared to the median of that interval. However, considering that 50% of the total data at Load 0 is densely concentrated between 0.0158 s and 0.0187 s (the IQR box range), it is evident that, similar to the situation in Figure 5, this is not a performance degradation due to structural bottlenecks or system defects. That is, these outliers are also analyzed as exceptional single cases resulting from momentary communication delays inherent to distributed network environments or temporary computational loads within individual nodes.
Consequently, this distribution demonstrates that even under the highest transaction load environment (Load 100), the Refinery node consistently exhibits recovery speeds comparable to those in the optimal, no-load state (Load 0).
Table 5 evaluates the recovery time at the refinery node, which serves as the administrator node. The average recovery time was measured by randomly stopping operations for 30 min and varying the transaction input volume (Load 0–100). The average recovery time at Load 0 is 0.0196 s, and at Loads 10–100, it is 0.017 s. Welch’s t-test shows that the difference in recovery time between the two groups is not statistically significant (p = 0.2879 > 0.05). Additionally, the Mann–Whitney U test also indicates no significant difference in the distribution between the two groups (p = 0.2335 > 0.05). Cohen’s d is 0.6383 (medium), indicating that the effect size is medium with no significant practical difference. In other words, it can be concluded that there is no statistically significant difference in data recovery speed according to load, including the administrator node.
Table 6 shows the measurement results for reputation scores and consensus time when the proposed R-snowball punishment logic is applied at different blockchain lengths. To accurately observe the dynamic range of reputation score fluctuations, the experiment was designed with maximum and minimum reputation score limits. Blockchain lengths were set between 10 and 100, and the experiment was conducted 10 times for each length by manipulating the top 5 blocks of the chain to replace them with malicious blocks.
When the blockchain length is 10 or 30, the reputation score drops below the consensus threshold (10 points), and the attack is blocked by the first punishment logic alone. However, as the blockchain length increases, nodes with an initial reputation score exceeding 10 points begin to appear. When the blockchain length is 50, there are cases where the reputation score is below the consensus threshold, but there are also cases where it exceeds 10 points. When the blockchain length is 70 and 100, the consensus threshold is found to exceed 10 points in both cases. For blockchains that exceed the consensus threshold, R-snowball’s punishment logic is executed twice, and the final reputation score drops to 10 points or less, which is below the consensus threshold. Additionally, the consensus time does not show a special correlation with the blockchain length.
That is, if a node that has propagated malicious data maintains a reputation score above the consensus participation threshold of 10 even after the initial application of the penalty logic, it retains the right to participate in the subsequent consensus round, thereby triggering the penalty logic a second time. This demonstrates that even if an attacker attempts continuous attacks by exploiting a high reputation accumulated in the past, the system can robustly defend itself by cumulatively deducting points whenever malicious behavior is detected, in accordance with the R-snowball algorithm’s unique behavior-based evaluation design. Furthermore, the penalty logic demonstrates a 100% defense success rate against the introduction of manipulated blockchains across all chain lengths.
Welch’s t-test shows that the difference in resolution time between the one-punishment and two-punishment situations is not statistically significant (p = 0.3638 > 0.05). The average resolution time for the group punished once is 0.5363 s, and the average resolution time for the group punished twice is 0.7118 s.
Table 7 presents the sensitivity analysis for β p u n i s h and P m a x under a fixed transaction load of 50, with all other parameters identical to those in Table 2.
The β p u n i s h analysis is conducted without minimum and maximum reputation bounds, consistent with the condition of Table 6. In the 50 ( 1 ) case, the reputation score of 56.955 drops to 6.9655 following the second penalty, falling below the W P C threshold and resulting in exclusion. In the 50 ( 2 ) case, the reputation score of 62.35 drops to 12.46 following the second penalty, remaining above the W P C threshold and surviving, and further drops to −37.4375 after the third penalty, falling below the W P C threshold and resulting in exclusion. While this renders the configuration vulnerable to persistent attackers, the gradual score reduction offers a lenient policy that allows penalized nodes to remain active and recover. When β p u n i s h = −100, in the 50 ( 1 ) case, a penalty applied at a reputation score of 7.079 upon the first detection results in immediate exclusion. In the 50 ( 2 ) case, the reputation score of 13.57 at the first detection drops to −84.49 following the penalty, falling below the W P C threshold and resulting in exclusion. This configuration satisfies the design condition P m a x (120) − | β p u n i s h | (100) > W P C (10), implementing a graduated response while maintaining security. When β p u n i s h = −120, exclusion is enforced upon the first detection, as the reputation score immediately falls below the W P C threshold, offering the strongest attack resistance.
For the P m a x , the minimum and maximum reputation bounds are applied. When P m a x = 100, the attacker’s maximum achievable reputation score equals the penalty magnitude, resulting in immediate exclusion with no opportunity for recovery. When P m a x = 120, the attacker retains a residual reputation score of 12.68 after the first penalty in the 50 ( 2 ) , exceeding the W P C threshold and granting one additional chance before final exclusion. This indicates that P m a x directly controls how many times an attacker can be punished before exclusion, and the value of 120 is established to balance security with a single-chance graduated response.
Table 8 presents the performance evaluation results of the R-snowball algorithm according to the variation in the number of fake nodes (Sybil nodes) and their consensus propagation under a Sybil attack scenario. The experiments were repeated 10 times for each case, increasing the number of fake nodes from 1 to 40 in increments of 10. Key indicators include the consensus time per Sybil node measured by legitimate nodes (Refinery and Farm nodes) and the success rate of defending against the propagation of manipulated blockchains by Sybil nodes.
In Table 8, even if the number of fake nodes disrupting the network increases, the average consensus time of all system nodes remains less than 0.1 s. This means that an increase in malicious forgery nodes did not lead to consensus delays. The system has a 100% defense success rate in all situations, which implies that the consensus logic based on the R-snowball algorithm sampling maintains a constant consensus time regardless of the number of Sybil nodes. Furthermore, even if a fake node intrudes from the outside and propagates a manipulated blockchain, the reputation score of that node does not exceed the preset W m e m b e r score, so it can be confirmed that the blockchain defense rate of the normal node has reached 100%.
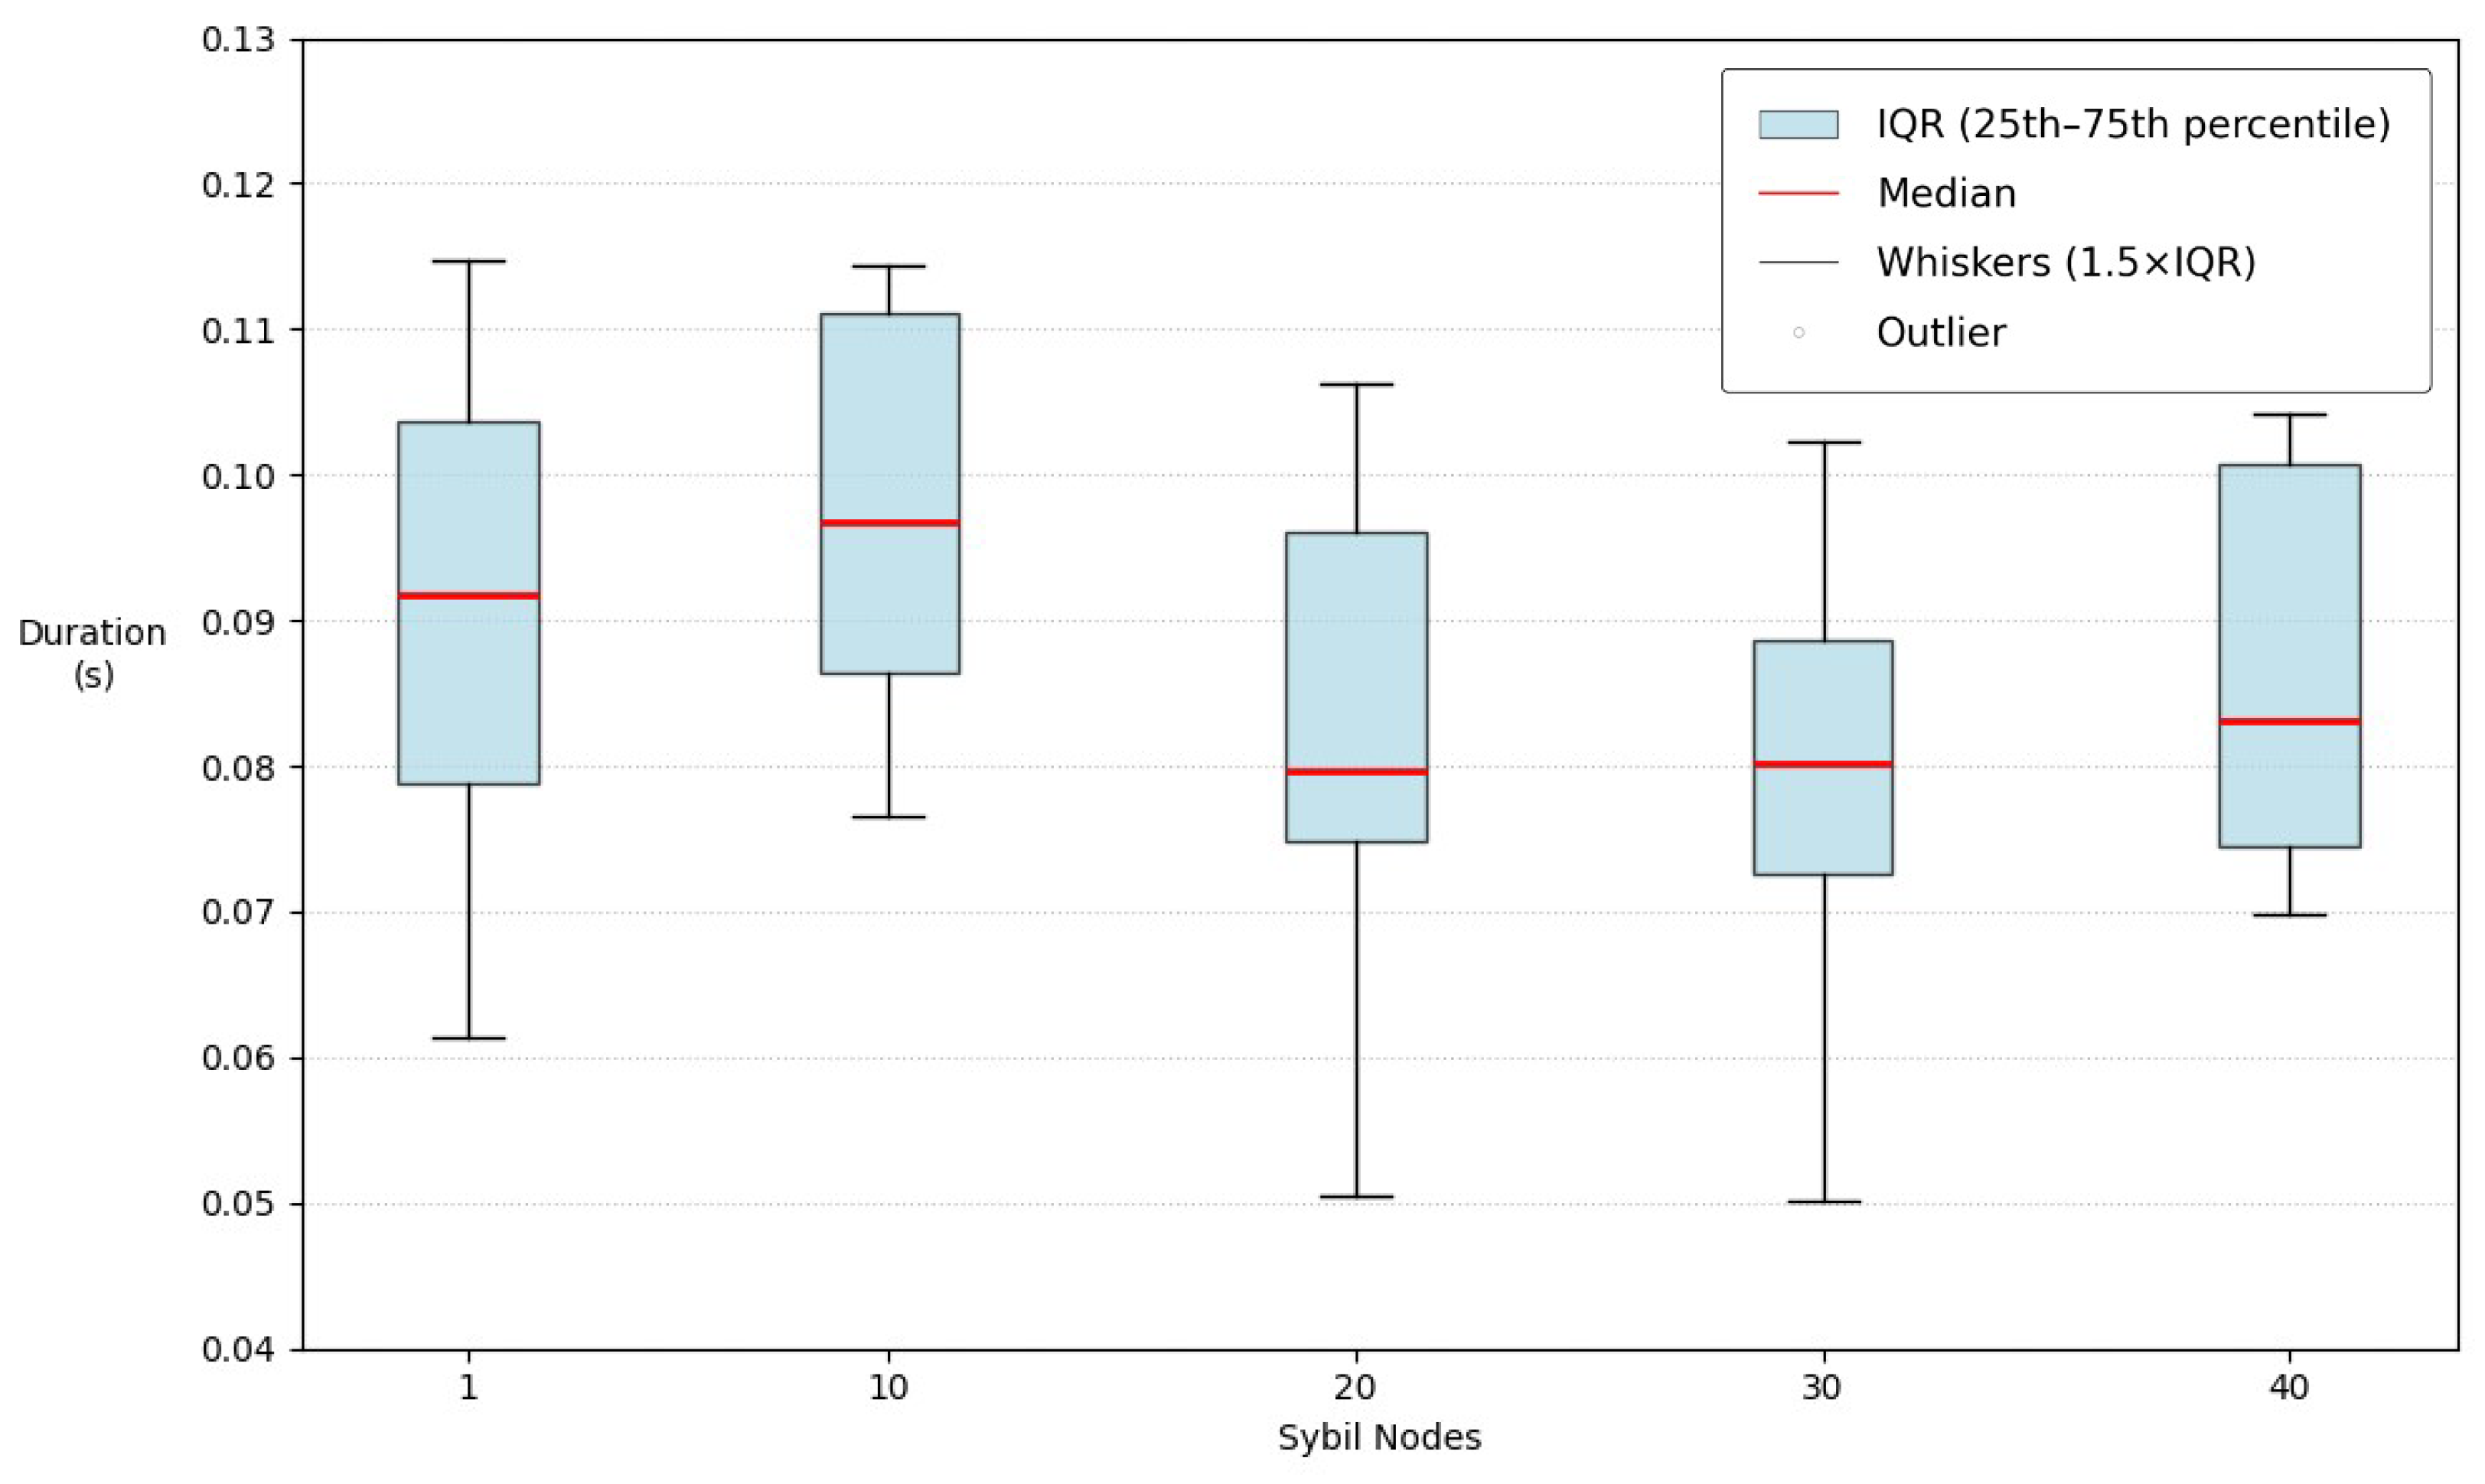
Figure 7 shows the distribution changes in the overall consensus duration using a box plot as the number of malicious Sybil nodes (1, 10, 20, 30, and 40) within the network increases. To analyze the trend of the primary data distribution, outliers have been excluded from this graph.
The most notable aspect of this graph is that even under an extreme Sybil attack scenario where the number of attack nodes continuously increases up to 40, the median consensus duration (solid red line) is maintained within a very narrow range of 0.079 to 0.097 s. When a single Sybil node is injected, the median is 0.091 s, and it exhibits a slight upward trend to 0.097 s when 10 nodes are present. However, in the subsequent intervals where a large number of fake nodes (20–40) are added, the system demonstrates resilience as the median paradoxically stabilizes downward to a level of 0.080 to 0.083 s.
Furthermore, the interquartile range (IQR), which indicates data variability, remains very narrow at 0.015 to 0.025 s across most intervals. The maximum and minimum distribution of the overall data, represented by the top and bottom whiskers, also stably converges within a boundary of 0.05 to 0.115 s. That is, despite a 40-fold increase in attack nodes, the variance in data processing is controlled at a level comparable to the initial state.
Consequently, this distribution demonstrates that the proposed consensus algorithm not only prevents consensus delays and system performance degradation in a Sybil attack environment involving multiple fake nodes but also effectively defends against malicious network disruption attempts, thereby maintaining fast and uniform data processing speeds without system paralysis.

4. Discussion

Through the experiments in Section 3, it can be seen that the proposed blockchain-based security system possesses the capability to defend against anomalies caused by internal and external threats. In particular, the proposed R-snowball algorithm prevents unauthorized modification of data recorded on the blockchain through reputation scores. While existing snowball algorithms focused solely on rapid consensus and carried security risks, the R-snowball algorithm solves this problem by imposing reputation score penalties on nodes attempting to distribute modified data. The biofuel industry faces ongoing risks such as strict environmental regulations (e.g., EU RED II/III), duplicate payments of subsidies and credits, and origin laundering [40], but utilizing the proposed algorithm can prevent data modification within the supply chain.
Furthermore, the proposed blockchain enables recovery through a distributed network even if some blockchain nodes fail. The proposed system can recover data in 0.03 s, even if some nodes are destroyed or disconnected. This means that system recovery does not take a significant amount of time, even if the systems of nodes affected by IT infrastructure failures or ransomware attacks are replaced. Therefore, it is effective to adopt blockchain technology to reduce security threats when establishing a biofuel supply chain.
These contributions are best understood in the context of security threats unique to the biofuel supply chain. Colonial Pipeline suffered a ransomware attack in May 2021 and was forced to halt operations despite intact equipment, which is a prime example of the vulnerability of a centralized database architecture, and the ongoing controversy over fraudulent UCO imports further illustrates that origin data manipulation is an active and financially motivated threat in this domain [25,26]. The original Snowball protocol provides light-weight probabilistic sub-sampling but offers no identity management or defense against internal Byzantine behavior, whereas R-snowball addresses these limitations by introducing identity-differentiated base scoring with a mathematically defined guest score cap, behavior-based cumulative reputation updates that progressively exclude malicious nodes, and a finality depth mechanism that protects confirmed blocks from history-rewriting attempts, constituting an algorithmic advance over existing Snowball-family and general-purpose blockchain traceability frameworks.
The proposed system addressed the data management challenges inherent to the biofuel supply chain, where feedstock data is generated across geographically dispersed farms and must satisfy strict origin traceability requirements. Unlike general supply chain traceability systems, which primarily focus on transparency and immutability, the biofuel supply chain requires identity-based access control to distinguish authenticated feedstock suppliers from unauthorized participants, and tamper-proof distributed storage to ensure that origin data remains verifiable throughout the farm-to-refinery segment. These requirements directly motivate the proposed combination of R-snowball consensus and IPFS-based sharded storage, which together provide a data management framework tailored to the operational and regulatory constraints of the biofuel domain.

5. Conclusions

This study proposes a blockchain-based information protection system designed to ensure data transparency and block security threats within the complex value chains of the biofuel supply chain. In particular, considering the characteristics of real-world agricultural supply chains where the number of participating nodes can rapidly increase due to raw material collection, the R-snowball algorithm was devised and applied to the system. The algorithm is designed so that only sampled nodes participate in the consensus process. A reputation score is defined for each node to numerically assign participation over time, utilizing it for bonus points for consensus participation, equilibrium situations, and defense against malicious consensus propagation. Experimental results showed that the proposed system demonstrated rapid data synchronization and ledger recovery capabilities within 0.03 s, even when some nodes were destroyed or disconnected. The R-snowball consensus algorithm, combined with punishment logic, identified malicious manipulation attempts during Byzantine faults and continuously penalized reputation scores by keeping them below the threshold for consensus participation, thereby suggesting that the integrity of supply chain governance can potentially be maintained under the tested conditions. This implies that the proposed system goes beyond simple data storage functions, providing preliminary evidence of its potential to protect the biofuel supply chain from internal and external security breach attempts through a reputation-based autonomous defense mechanism under the tested conditions. In conclusion, this study provides preliminary proof-of-concept evidence for the feasibility of enabling farms that face difficulties in establishing expensive IT infrastructure to participate in a blockchain network using only standard PCs. This suggests the potential of a blockchain-based traceability system across the entire biofuel supply chain, involving multiple farms serving as raw material suppliers.
However, this study has several limitations that should be addressed in future work. The experiments were conducted under controlled conditions that may not fully reflect real-world deployment environments, and the scope of the security evaluation remains bounded by the experimental design. The proposed system is expected to work effectively in permissioned biofuel supply chain networks comprising a small number of authenticated participants, and future work should address broader validation scenarios, real-world deployment and cost analysis. Furthermore, research should continue to establish a more sophisticated and flexible security response system by introducing a machine learning-based intelligent reputation management model.

Author Contributions

Conceptualization, J.L., Y.K. and S.K.; methodology, J.L., Y.K. and S.K.; software, J.L. and Y.K.; validation, J.L. and Y.K.; formal Analysis, J.L., Y.K. and S.K.; investigation, J.L., Y.K. and S.K.; data curation, J.L. and Y.K.; writing—original draft preparation, J.L., Y.K. and S.K.; writing—review and editing, J.L., Y.K. and S.K.; visualization, J.L. and Y.K.; funding acquisition, S.K.; supervision, S.K. All authors have read and agreed to the published version of the manuscript.

Funding

This work was supported by the Basic Science Research Program through the National Research Foundation of Korea (NRF), funded by the Ministry of Education (No. RS-2023-00239448).

Institutional Review Board Statement

Not applicable.

Informed Consent Statement

Not applicable.

Data Availability Statement

The data is contained within the article.

Acknowledgments

The authors gratefully acknowledge the support of the NRF of Korea, which is funded by the Ministry of Education.

Conflicts of Interest

The funding sponsor (the Ministry of Education in South Korea) has no role in the design of this study; in the collection, analyses, or interpretation of data; in the writing of the manuscript, or in the decision to publish the results. The authors declare no conflicts of interest.

References

  1. Casino, F.; Dasaklis, T.K.; Patsakis, C. A systematic literature review of blockchain-based applications: Current status, classification and open issues. Telemat. Inform. 2019, 36, 55–81. [Google Scholar] [CrossRef]
  2. Natarajan, H.; Krause, S.; Gradstein, H. Distributed Ledger Technology and Blockchain. 2017. Available online: https://openknowledge.worldbank.org/server/api/core/bitstreams/5166f335-35db-57d7-9c7e-110f7d018f79/content (accessed on 30 April 2026).
  3. Kshetri, N. Can blockchain strengthen the internet of things? IT Prof. 2017, 19, 68–72. [Google Scholar] [CrossRef]
  4. Nakamoto, S.; Bitcoin, A. A peer-to-peer electronic cash system. Bitcoin–URL 2008, 4, 15. [Google Scholar]
  5. Zheng, Z.; Xie, S.; Dai, H.; Chen, X.; Wang, H. An overview of Blockchain technology: Architecture, consensus, and future trends. In Proceedings of the 2017 IEEE International Congress on Big Data (BigData Congress), Honolulu, HI, USA, 25–30 June 2017; pp. 557–564. [Google Scholar]
  6. Saberi, S.; Kouhizadeh, M.; Sarkis, J.; Shen, L. Blockchain technology and its relationships to sustainable supply chain management. Int. J. Prod. Res. 2019, 57, 2117–2135. [Google Scholar] [CrossRef]
  7. Kshetri, N. 1 Blockchain’s roles in meeting key supply chain management objectives. Int. J. Inf. Manag. 2018, 39, 80–89. [Google Scholar] [CrossRef]
  8. UPS. UPS Joins Blockchain In Transport Alliance. In Supply Chain Dive; TechTarget, Inc.: Newton, MA, USA, 2017; Available online: https://www.supplychaindive.com/news/blockchain-UPS-Oracle-3PL-alliance-customs-brokerage-trucking/510390/ (accessed on 30 April 2026).
  9. Park, D.; Kang, M. Blockchain, Logistics/Distribution Innovation, and Digital Trade. Samjung KPMG Issue Monit. 2018, 85, 3–16. [Google Scholar]
  10. Famous, M.S.; Sayed, S.; Mazumder, R.; Khan, R.T.; Kaiser, M.S.; Hossain, M.S.; Andersson, K.; Khondoker, R. Secure and efficient drug supply chain management system: Leveraging polymorphic encryption, blockchain, and cloud storage integration. Cyber Secur. Appl. 2025, 3, 100103. [Google Scholar] [CrossRef]
  11. Zhang, X.; Feng, X.; Jiang, Z.; Gong, Q.; Wang, Y. A blockchain-enabled framework for reverse supply chain management of power batteries. J. Clean. Prod. 2023, 415, 137823. [Google Scholar] [CrossRef]
  12. Wu, H.; Jiang, S.; Cao, J. High-efficiency blockchain-based supply chain traceability. IEEE Trans. Intell. Transp. Syst. 2023, 24, 3748–3758. [Google Scholar] [CrossRef]
  13. Kim, S.; Kim, S. Hybrid simulation framework for the production management of an ethanol biorefinery. Renew. Sustain. Energy Rev. 2022, 155, 111911. [Google Scholar] [CrossRef]
  14. Kim, Y.; Kim, S. Optimization and simulation in biofuel supply chain. Energies 2025, 18, 1194. [Google Scholar] [CrossRef]
  15. European Union. Directive (EU) 2018/2001 of the European Parliament and of the Council of 11 December 2018 on the promotion of the use of energy from renewable sources. Off. J. Eur. Union 2018, L328, 82–209. [Google Scholar]
  16. European Union. Directive (EU) 2023/2413 of the European Parliament and of the Council of 18 October 2023 amending Directive (EU) 2018/2001, Regulation (EU) 2018/1999 and Directive 98/70/EC as regards the promotion of energy from renewable sources. Off. J. Eur. Union 2023, L2023/2413. Available online: https://eur-lex.europa.eu/eli/dir/2023/2413/oj (accessed on 1 May 2026).
  17. Yue, D.; You, F.; Snyder, S.W. Biomass-to-bioenergy and biofuel supply chain optimization: Overview, key issues and challenges. Comput. Chem. Eng. 2014, 66, 36–56. [Google Scholar] [CrossRef]
  18. Li, Q.; Hu, G. Supply chain design under uncertainty for advanced biofuel production based on bio-oil gasification. Energy 2014, 74, 576–584. [Google Scholar] [CrossRef]
  19. Nunes, L.J.; Silva, S. Optimization of the Residual Biomass Supply Chain: Process Characterization and Cost Analysis. Logistics 2023, 7, 48. [Google Scholar] [CrossRef]
  20. Kim, Y.; Seo, J.; Kim, S. Location Allocation of Corn Stover Pretreatment Facilities in South Korea Under an Agent-Based Simulation Framework. Appl. Sci. 2025, 15, 9488. [Google Scholar] [CrossRef]
  21. dos Santos, E.A.; Giorgetti, V.; Júnior, C.A.d.S.; Marcomini, J.B.; Sordi, V.L.; Rovere, C.A. Stress corrosion cracking and corrosion fatigue analysis of API X70 steel exposed to a circulating ethanol environment. Int. J. Press. Vessels Pip. 2022, 200, 104846. [Google Scholar] [CrossRef]
  22. IEA Bioenergy. Drop-in Biofuels: The Key Role That Co-Processing Will Play in Its Production; IEA Bioenergy: Paris, France, 2019; Available online: https://www.ieabioenergy.com/wp-content/uploads/2019/09/Task-39-Drop-in-Biofuels-Full-Report-January-2019.pdf (accessed on 30 April 2026).
  23. Kim, S.; Choi, Y.; Kim, S. Simulation Modeling in Supply Chain Management Research of Ethanol: A Review. Energies 2023, 16, 7429. [Google Scholar] [CrossRef]
  24. Ba, B.H.; Prins, C.; Prodhon, C. Models for optimization and performance evaluation of biomass supply chains: An Operations Research perspective. Renew. Energy 2016, 87, 977–989. [Google Scholar] [CrossRef]
  25. U.S. Senate Committee on Homeland Security and Governmental Affairs (HSGAC). Testimony of Joseph Blount, President and CEO, Colonial Pipeline Company. 2021. Available online: https://www.hsgac.senate.gov/wp-content/uploads/imo/media/doc/Testimony-Blount-2021-06-08.pdf (accessed on 30 April 2026).
  26. Office of Senator Roger Marshall. Senator Marshall Leads Letter Addressing Concerns on Used Cooking Oil Imports from China. 2024. Available online: https://www.marshall.senate.gov/newsroom/press-releases/senator-marshall-leads-letter-addressing-concerns-on-used-cooking-oil-imports-from-china/ (accessed on 30 April 2026).
  27. Hasan, H.R.; Musamih, A.; Salah, K.; Jayaraman, R.; Omar, M.; Arshad, J.; Boscovic, D. Smart agriculture assurance: IoT and blockchain for trusted sustainable produce. Comput. Electron. Agric. 2024, 224, 109184. [Google Scholar] [CrossRef]
  28. Shamir, A. How to share a secret. Commun. ACM 1979, 22, 612–613. [Google Scholar] [CrossRef]
  29. Johnson, D.; Menezes, A.; Vanstone, S. The Elliptic Curve Digital Signature Algorithm (ECDSA). Int. J. Inf. Secur. 2001, 1, 36–63. [Google Scholar] [CrossRef]
  30. ISO 8601-1; Date and Time—Representations for Information Interchange—Part 1: Basic Rules. ISO: Geneva, Switzerland, 2019.
  31. Sun, J.; Yao, X.; Wang, S.; Wu, Y. Blockchain-based secure storage and access scheme for electronic medical records in IPFS. IEEE Access 2020, 8, 59389–59401. [Google Scholar] [CrossRef]
  32. Back, A. Hashcash—A Denial of Service Counter-Measure. 2002. Available online: http://www.hashcash.org/papers/hashcash.pdf (accessed on 30 April 2026).
  33. Rocket, T.; Yin, M.; Sekniqi, K.; van Renesse, R.; Sirer, E.G. Scalable and Probabilistic Leaderless BFT Consensus through Metastability. arXiv 2019, arXiv:1906.08936. [Google Scholar]
  34. Kamvar, S.D.; Schlosser, M.T.; Garcia-Molina, H. The EigenTrust algorithm for reputation management in P2P networks. In Proceedings of the 12th International Conference on World Wide Web, Budapest, Hungary, 20–24 May 2003; pp. 640–651. [Google Scholar]
  35. Biryukov, A.; Feher, D. ReCon: Sybil-resistant consensus from reputation. Pervasive Mob. Comput. 2020, 61, 101109. [Google Scholar] [CrossRef]
  36. Welch, B.L. The generalization of ‘Student’s’ problem when several different population variances are involved. Biometrika 1947, 34, 28–35. [Google Scholar] [CrossRef] [PubMed]
  37. Mann, H.B.; Whitney, D.R. On a Test of Whether One of Two Random Variables is Stochastically Larger than the Other. Ann. Math. Stat. 1947, 18, 50–60. [Google Scholar] [CrossRef]
  38. Cohen, J. Statistical Power Analysis for the Behavioral Sciences, 2nd ed.; Routledge: New York, NY, USA, 2013. [Google Scholar]
  39. Wang, Y.; Tan, M. Defense against Sybil attack in blockchain based on improved consensus algorithm. In Proceedings of the 2023 IEEE International Conference on Control, Electronics and Computer Technology (ICCECT), Changchun, China, 21–23 April 2023; pp. 986–989. [Google Scholar]
  40. Baldino, C.; Mulholland, E.; Pavlenko, N. Assessing the Risk of Crediting Alternative Fuels in Europe’s CO2 Standards for Trucks and Buses; International Council on Clean Transportation: Washington, DC, USA, 2023; Available online: https://theicct.org/publication/crediting-alternative-fuels-europe-co2-standards-trucks-buses-oct23/ (accessed on 30 April 2026).

Figure 1. Biofuel supply chain flow.
Applsci 16 05860 g001
Figure 2. System framework.
Applsci 16 05860 g002
Figure 3. Management of farm registration.
Applsci 16 05860 g003
Figure 4. Consequential process of data reading and storing.
Applsci 16 05860 g004
Figure 5. Recovery time distribution among farms at different load levels.
Applsci 16 05860 g005
Figure 6. Recovery time distribution of refinery at different load levels.
Applsci 16 05860 g006
Figure 7. Consensus duration distribution by number of Sybil nodes.
Applsci 16 05860 g007
Table 1. Criteria for determining the final ledger.
ResultCriteria
RejectIf the blockchain, except for the most recent n blocks, has been modified, reject a history rewriting.
Fork ResolutionIf the length of c f i n a l is the same as that of the existing chain and c f i n a l is not a history rewriting, update to c f i n a l .
Simple ExtensionIf the length of c f i n a l is longer than the length of the existing chain and it is not a history rewriting, the existing chain is updated to c f i n a l .
Table 2. Parameters for experiments.
CategoryParameter DescriptionSymbol/VariableValue
NetworkTotal number of nodes N 6 (1 Refinery, 5 Farms)
Data StorageTotal Data Shards P ( o r   N s t o r e ) 5
Data Recovery Threshold Q 3
Master KeyMaster Key Shares-6
Master Key Threshold T 4
BlockchainSub-sampling size K 3
PoW Difficulty d 1
Finality Depth for history check-3 Blocks
Reputation (Score)Maximum Reputation Score P m a x 120
Minimum Reputation Score P m i n 0
Initial Score (Member) W m e m b e r 80
Initial Score (Guest) W g u e s t 20
Reputation Cap (Guest) W g u e s t   m a x 26.6
Participation Cap(All) W P C 10
Reputation
(Update)
Reward for Simple Extension β e x t 1
Reward for Fork Resolution β f o r k 1
Reward for Participation (Non-leader) β p c 0.1
Penalty for Malicious Act β p u n i s h −100
Table 3. Experimental configuration.
ComponentSpecification
CPUIntel Core i7-13700 @ 2.10 GHz
Memory16 GB DDR4
OSWindows 11
Network1 Gbps Ethernet
Table 4. Statistical values for end-to-end recovery time of farm nodes.
CriteriaData
Count
Average
(s)
Standard
Deviation (s)
95% Confidence
Interval (s)
Welch’s
t-Test
MWU TestCohen’s d
Group
Load 0500.02850.0154[0.0241, 0.0329]p =
0.1820
p =
0.0715
0.2704
Load 10 to 100490.02420.0164[0.0194, 0.0289]
Table 5. End-to-end recovery time of refinery nodes.
Load
(Data Count)
0102030405060708090100
Round 10.01720.01380.01350.01330.01380.01720.0140.0150.01320.01290.0131
Round 20.01530.01390.01460.01760.03250.01570.0140.01360.01350.01720.0146
Round 30.01750.01520.01360.01460.01350.01280.01390.01240.01250.01390.017
Round 40.01290.01350.01350.01210.01380.01380.01630.02620.020.01410.0169
Round 50.0140.01550.01480.01510.01610.0160.01330.0190.01550.01890.0113
Round 60.0180.02350.020.02380.020.0170.0190.01660.0170.01750.0245
Round 70.03740.01760.01640.0190.01750.020.020.0230.0160.0180.0211
Round 80.01790.0180.02740.0190.01790.0220.01650.02450.0190.0190.0285
Round 90.0190.0160.01910.0210.0170.0160.01610.0180.0170.0150.0151
Round 100.02730.01750.0160.0170.0170.0160.0170.01950.01660.0160.0155
Average0.01960.01650.01690.01720.01790.01670.0160.01880.0160.01630.0178
0.017 (s)
Table 6. Outcome of malicious consensus for 5 nodes.
Chain LengthFirst Reputation ScoreFinal Reputation ScoreLength per Consensus
Duration (s)
2-Group
Consensus
Duration (s)
Success Rate
10−13.37-0.08260.5363100%
30−2.2126-0.4584100%
50 ( 1 ) 7.079-1.1269100%
50 ( 2 ) 13.57−84.490.51070.7118100%
7019.948−79.9240.3851100%
10038.454−61.43981.2193100%
Table 7. Sensitivity analysis with penalty score for malicious and maximum reputation score.
ParameterChain
Length
First
Reputation Score
Second Reputation ScoreFinal
Reputation Score
Consensus
Duration (s)
Success
Rate
β p u n i s h −50 50 ( 1 ) 56.9556.9655-0.3493100%
50 ( 2 ) 62.3512.46−37.43751.0095
−100 50 ( 1 ) 7.079- 1.1269100%
50 ( 2 ) 13.57−84.49-0.5107
−12050−41.58--0.8217100%
P m a x 100500--0.7808100%
120 50 ( 1 ) 7.067--0.5229100%
50 ( 2 ) 12.680-0.9526
Table 8. Consensus duration and success rate with various Sybil nodes.
Sybil NodesConsensus Duration (s)Success
Rate (%)
RefineryFarm AFarm BFarm CFarm DFarm EAverage
10.081510.11480.1020.06140.0780.10420.0909100%
100.07660.11380.10290.09070.08490.11430.0989100%
200.07550.10620.10010.05040.07460.08390.0818100%
300.090.10220.08460.05010.07160.07580.079100%
400.07570.10410.09040.49110.07400.06990.0772100%
Disclaimer/Publisher’s Note: The statements, opinions and data contained in all publications are solely those of the individual author(s) and contributor(s) and not of MDPI and/or the editor(s). MDPI and/or the editor(s) disclaim responsibility for any injury to people or property resulting from any ideas, methods, instructions or products referred to in the content.