Article

Evaluation of Impact Performance via FEM Modelling and Experimental Testing of 3D-Printed Honeycomb Energy-Absorbing Crush-Type Structures

by
Andrei Nenciu
1,2,
Dragos Alexandru Apostol
2,
Melania Andreea Munteanu
2,
Oana Andreea Maerean
2 and
Dan Mihai Constantinescu
2,3,4,*
1
INCAS—National Institute for Aerospace Research “Elie Carafoli”, Bulevardul Iuliu Maniu 220, 061136 Bucharest, Romania
2
Department of Strength of Materials, National University of Science and Technology POLITEHNICA Bucharest, Splaiul Independenţei 313, 060042 Bucharest, Romania
3
Institute of Solid Mechanics of the Romanian Academy, Str. Constantin Mille 15, 010141 Bucharest, Romania
4
Technical Sciences Academy of Romania, Bulevardul Dacia 26, 030167 Bucharest, Romania
*
Author to whom correspondence should be addressed.
Appl. Sci. 2026, 16(12), 5858; https://doi.org/10.3390/app16125858
Submission received: 23 May 2026 / Revised: 8 June 2026 / Accepted: 9 June 2026 / Published: 10 June 2026
(This article belongs to the Special Issue Advanced Polymer-Matrix Composite and 3D Printed Materials)

Abstract

This study investigates the energy absorption capacity of large three-honeycomb cell cores of different geometrical configurations, focusing on the influence of the constructive parameters on their impact response. The analyzed sandwich structures were additively manufactured using Onyx (a nylon-based composite) for the core cells and integrated into an assembly consisting of 6060-aluminum face sheets and encapsulated within a 6060-aluminum tube. These configurations represent a realistic engineering solution for lightweight structures designed for energy absorption. The analyses were conducted for two impact energy levels, 20 J and 50 J, enabling the evaluation of the structural sensitivity to different dynamic loading conditions. The results indicate a significant reduction in peak force with an increasing number of cells along the height. Compared to the single-cell configuration, the peak force decreases by approximately 15% for the two-cell configuration and 22.5% for the three-cell configuration, corresponding to a reduction of roughly 9% between the two- and three-cell cases. These findings highlight the critical role of geometry in optimizing the impact performance of honeycomb structures and provide relevant insights for the design of additively manufactured energy-absorbing crush-type components in engineering applications.

1. Introduction

Energy-absorbing structures, or crush-type structures, are passive components designed to dissipate the kinetic energy generated during frontal collisions in automotive, railway, and aerospace applications [1]. Their operating principle relies on progressive, controlled plastic deformation, as impact energy is converted into mechanical deformation work, thereby reducing the forces transmitted to the primary structure [2]. The assessment of the performance of crush-type structures depends on a range of recognized crashworthiness metrics commonly used in the literature, such as energy absorption, peak crushing force, mean crushing force, and specific energy absorption [3]. The primary difficulty in creating energy-absorbing systems is to attain a high specific energy absorption while keeping a low and stable crushing force profile, making sure that the deceleration faced by the protected structure stays within acceptable limits [4,5]. Thin-walled structures are recognized as the most commonly used type of energy absorbers because of their advantageous mass–performance ratio, manufacturing adaptability, and clearly understood failure mechanics [6]. Dynamic drop-weight impact tests are usually used for experimental assessment of these parameters, while validated explicit finite element models are utilized for numerical evaluation.
A significant evolution in the field has been prompted by the growing adoption of additive manufacturing techniques, which remove the geometric constraints inherent in conventional forming processes and enable the fabrication of impact absorbers with unprecedented structural complexity.
Onyx, a composite made of nylon and short carbon fibers, provides enhanced stiffness and surface quality. Moreover, the integration of continuous carbon fiber further enhances the load-bearing capability and rigidity of the printed components. The impact of the carbon fiber reinforcement direction on the mechanical properties of Onyx FR-A composites, produced with a Markforged FX20 printer [7], was examined via mechanical testing, such as tensile, compressive, open-hole tension, and interlaminar shear stress assessments. The results show that fiber alignment is essential in influencing material performance. The bending behavior of 3D-printed continuous fiber-reinforced composites was used to examine the effects of fiber types, alignment, and temperature [8]. Evidently, the printing procedure is prone to various defects resulting from the fabrication process parameters, including porosity, inadequate fiber impregnation with the polymer, and disorientation of the fibers. All characteristics rely on particular printing settings and environmental factors. The effect of two printing parameters, specifically the orientation and placement of the components on the printing platform, as well as the effect of humidity on the mechanical properties of the components, was examined on samples produced with Onyx utilizing a Markforged X7 printer [9].
Sun et al. [10] examined, using both experimental and numerical approaches, the effects of face sheet and core thickness, along with honeycomb cell size and wall thickness, on the performance of sandwich panels featuring a honeycomb core subjected to impact loads. They discovered that the thickness of the core has minimal impact on the failure mechanism, whereas a rise in face sheet thickness significantly enhances perforation resistance and energy absorption capability. The same team of researchers examined the dynamic reaction of uniform and stepwise graded aluminum foam cores when exposed to low-velocity impact. They discovered that the density gradient of the graded foam greatly affects the damage pattern of the upper face sheet. Moreover, they found that enhancing the efficiency of sandwich panels can be achieved by raising the front-to-back thickness ratio while keeping the overall thickness unchanged [11]. Yang et al. [12] examined how temperature influences the deformation and failure characteristics of composite sandwich panels featuring polymeric foam cores subjected to low-velocity impacts. For many years, additive manufacturing (AM), often referred to as 3D printing or rapid prototyping, has emerged as a relatively novel fabrication technique that utilizes a geometrical model designed by a 3D computer to deposit material layer by layer, thereby producing objects with intricate 3D architectural designs and reduced waste while achieving satisfactory geometric precision. Thorough evaluations offer substantial perspectives on possible engineering uses and upcoming obstacles [13,14]. AM provides enhanced flexibility in creating innovative structures, enabling materials to be strategically placed to enhance or tailor their mechanical characteristics.
In a recent extensive analysis, Wu et al. [15] underscored advancements in AM, focusing on the mechanical properties of materials and structures, particularly related to energy absorption applications. The examination also investigated design optimization methods, such as parametric, topology, and nondeterministic optimization, which address the uncertainties that emerge from the manufacturing process. Furthermore, approaches that employ data-driven strategies and machine learning were highlighted for their considerable effectiveness in managing process–property connections and enabling real-time supervision throughout manufacturing.
This research article focuses on the design and testing of crush-type structural components made from a honeycomb Onyx core encapsulated in an aluminum shell. This lightweight configuration ensures an effective damping and energy-absorbing system to be used in space applications. The novelty of this work consists in the combined experimental and numerical investigation of the impact response of additively manufactured sandwich cores, together with a comparative assessment of multiple geometric configurations under identical impact energy levels. In addition, the study addresses in-plane impact loading of large cell honeycomb configurations rather than the conventional out-of-plane compression typically reported in the literature. Section 2 presents the procedures by which the sandwich honeycomb and reentrant structures were realized using the Onyx material as a core with one, two, or three large cells. SEM analyses reveal the morphology of the material used, and impact testing is performed with an Instron CEAST 9340 drop weight tower. The results obtained are presented in Section 3 for impact tests done at two energy levels by evaluating the structural sensitivity under different dynamic loading conditions. Finite element simulations of the impact behavior for all three configurations closely reproduced the crush behavior observed during the experimental testing. Section 4 discusses the overall structural response of the two variants and three geometrical configurations at 20 J and 50 J impact energy levels in terms of maximum force and absorbed energy. Brief conclusions are presented to summarize the advantages of using such structural configurations in crush space applications.

2. Materials and Methods

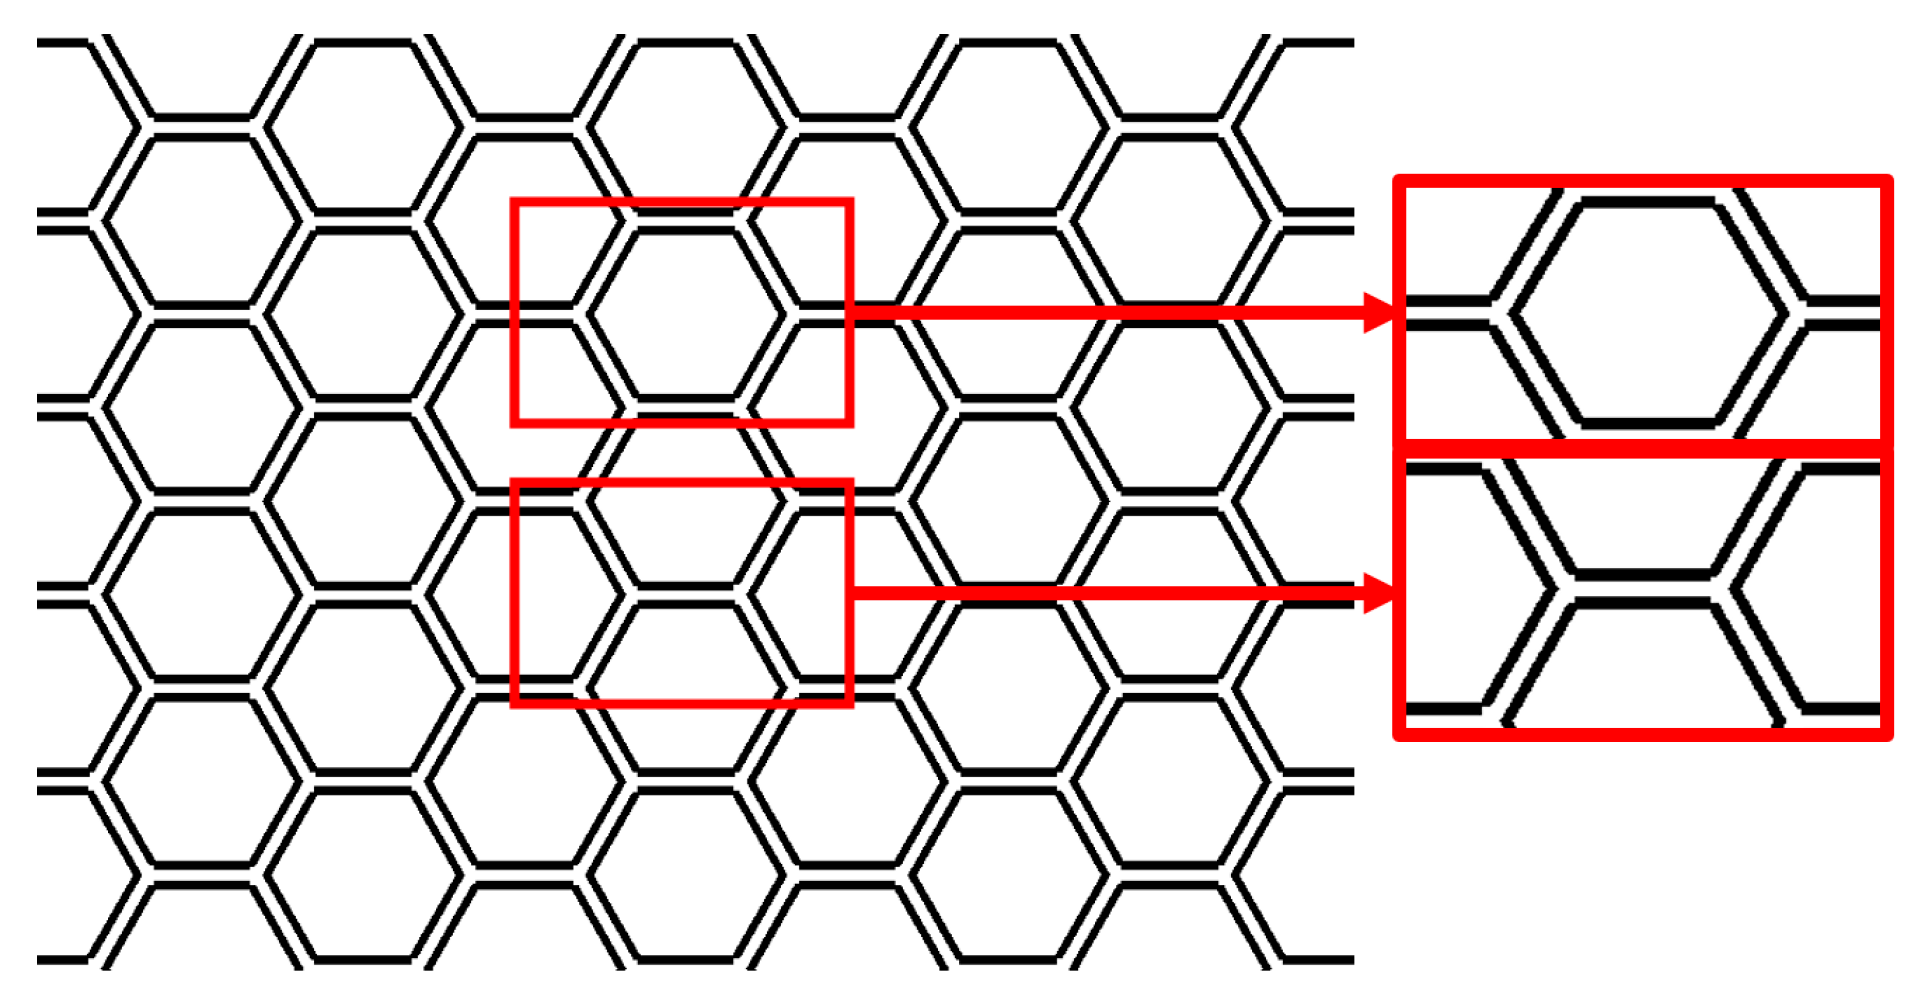
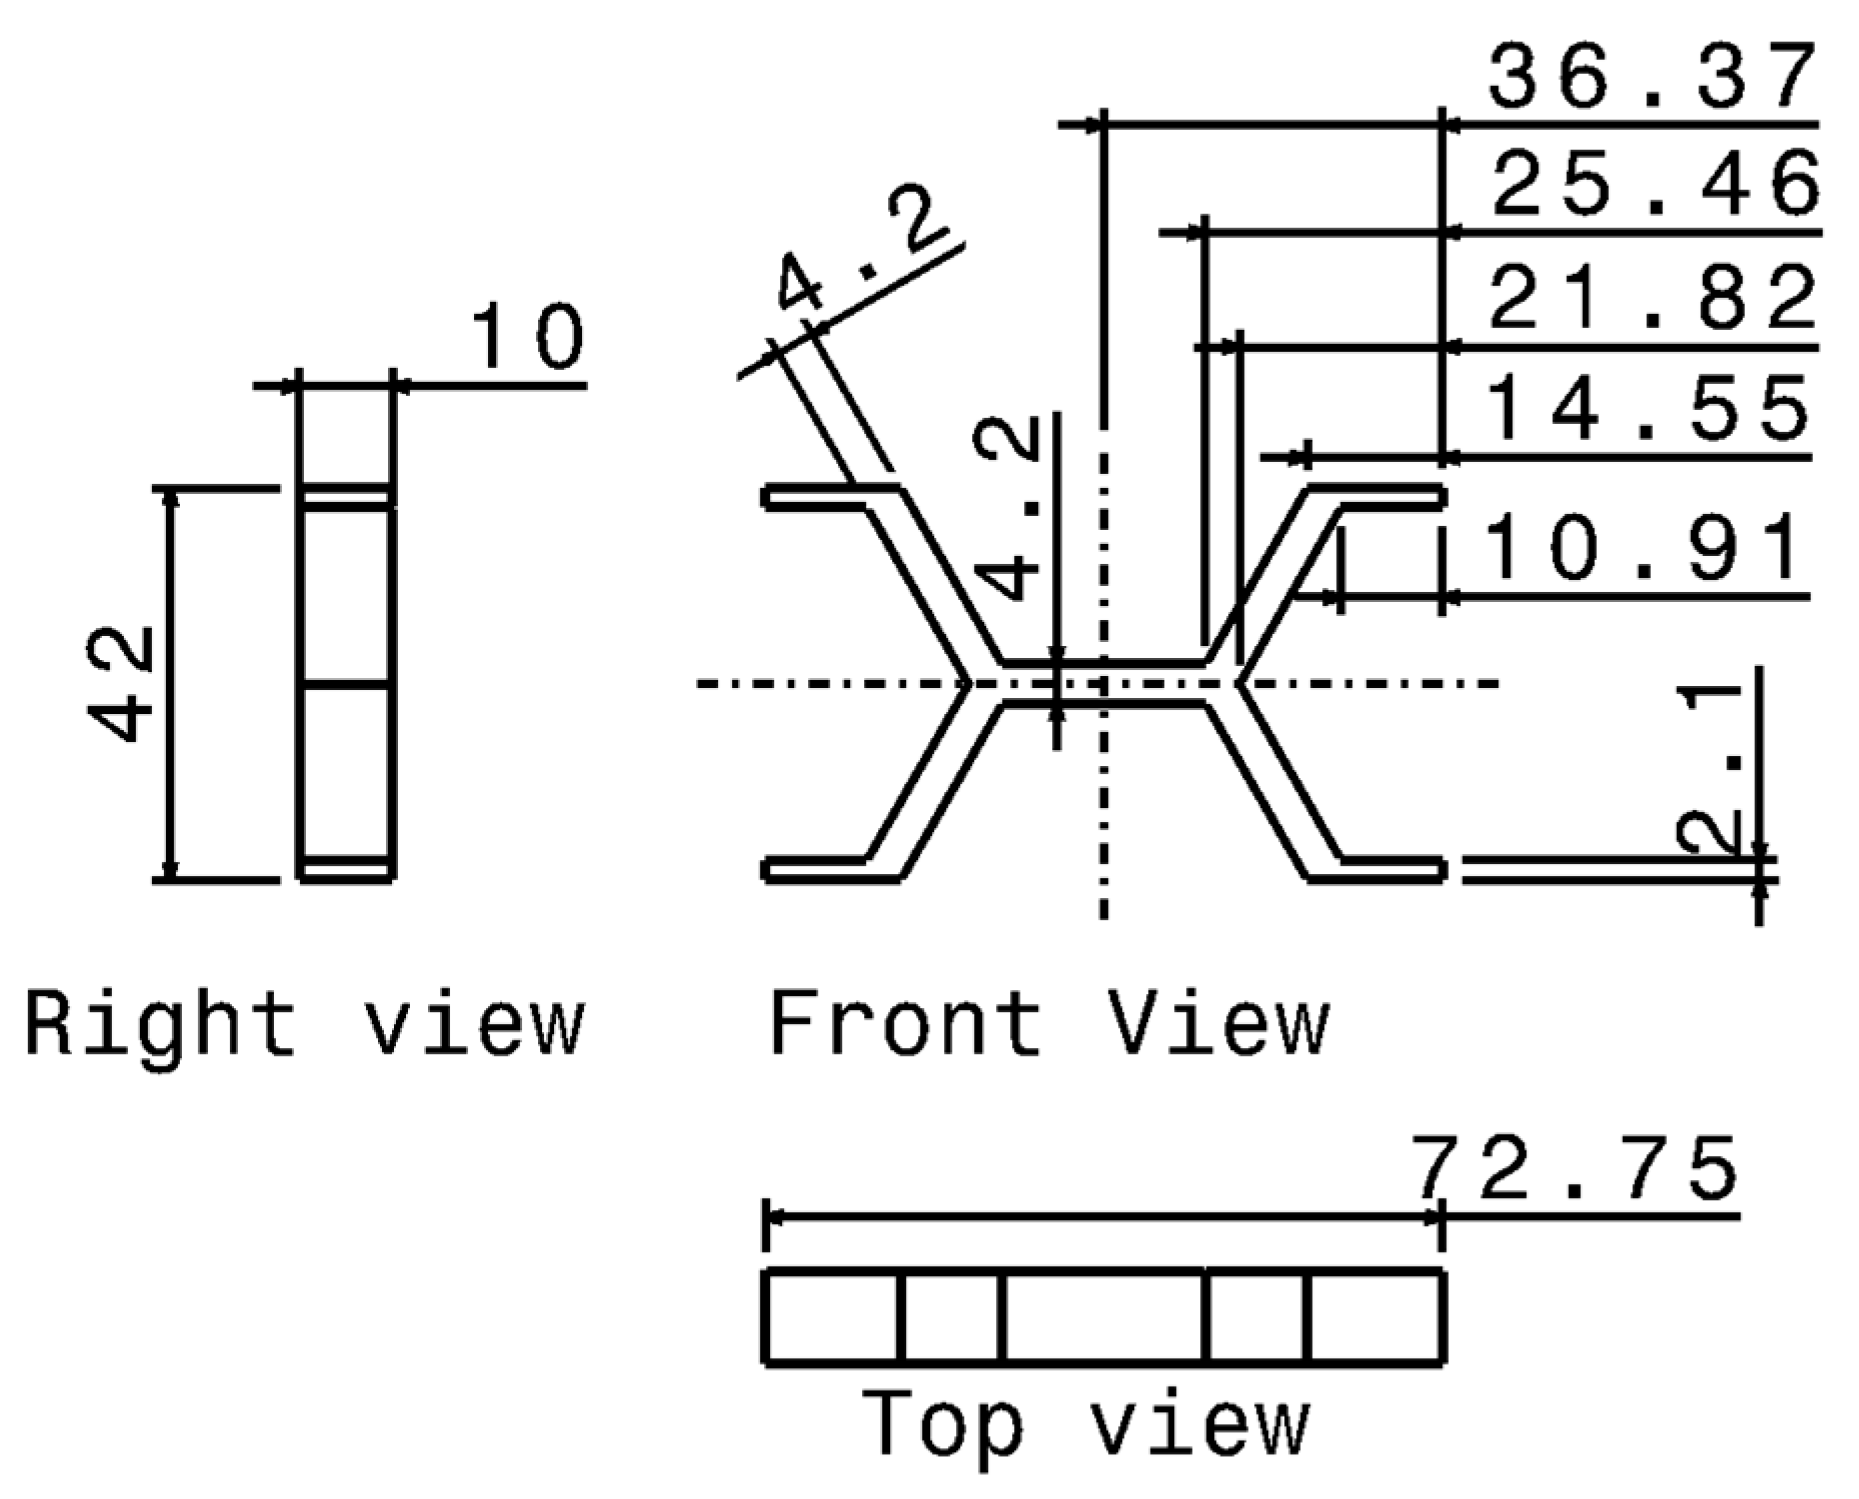
2.1. Material for 3D Printing and Configuration of Tested Sandwich Structures

Since the core of the experimental energy-absorption components was manufactured from Onyx [16], a characterization of this material was also required. Onyx is a nylon-based composite material reinforced with chopped carbon fibers, specifically developed for additive manufacturing applications, offering improved stiffness, dimensional stability, and surface quality compared to conventional nylon materials.
In order to obtain the required material properties for the manufactured specimens, the ASTM D638-22 standard [17] was used. This testing standard enabled the determination of the mechanical properties of the tested specimens. The tensile testing specimen geometry selected was the “Type I” configuration, having the geometrical characteristics shown in Figure 1.
All components manufactured through additive manufacturing within this study were produced using identical processing parameters in order to ensure consistency and repeatability of the fabricated parts. The selected printing configuration consisted of a layer height of 0.125 mm, a solid infill corresponding to 100% fill density, and two perimeter wall layers.
For the development of the core part of the crush-type energy-absorption elements, the representative honeycomb volume with hexagonal cells can exhibit two planes of symmetry, as shown in Figure 2. In order to evaluate whether one configuration provides structural advantages over the other, both variants were designed and analyzed. Furthermore, to investigate whether the effects of the representative volume scale linearly, the models were manufactured with one, two, and three cells along the height direction.
Additionally, Figure 3 also presents the dimensions of the honeycomb unit cell used for generating the panel geometry and manufacturing the cores of the components.
Following the selection of the hexagonal geometry and its division into the two possible configurations, Figure 4 illustrates a crash box type test specimen corresponding to a model containing a single unit cell along its height. The outer faces and cylindrical shell were manufactured from 6060-aluminum alloy, both having a thickness of 2 mm, such that the metallic components do not significantly stiffen the structure.
The aluminum face sheets were manufactured by CNC machining from a 2 mm thick plate, ensuring high dimensional accuracy and good geometric repeatability. The cutting process enabled the final part contours to be obtained according to the engineering drawings, with controlled tolerances and clean edges, without significant manufacturing-induced defects, as illustrated in Figure 5.
The bonding between the EN AW-6060 aluminum face sheets and the Onyx components was achieved using Everbond 3001 [19] structural adhesive, following a controlled surface preparation and application procedure to ensure optimal and reproducible adhesion. The surfaces of both materials were mechanically abraded using 180-grit sandpaper to remove the superficial oxide layer in the case of aluminum and to increase surface roughness, thereby enhancing mechanical interlocking of the adhesive.
After sanding, the surfaces were cleaned and degreased using technical-grade alcohol to remove contaminants such as oils, dust, and abrasive residues that could compromise adhesion performance. The adhesive was then applied in a uniform layer with a thickness of approximately 0.1 mm, after which the components were assembled and maintained under constant pressure using a clamping device for 24 h. The application of sustained pressure during curing ensured effective contact between the bonded surfaces and minimized the risk of voids or discontinuities within the adhesive layer.
It can be observed that for each configuration, three specimens were manufactured, corresponding to one, two, and three cells, respectively. Since both variants are based on the same unit cell geometry but differ with respect to the applied plane of symmetry of the cell, the negligible mass variation is attributed to the circular adaptation of the cores required to fit within the cylindrical enclosure.
For ease of identification, the specimens are designated based on the unit cell configuration, with Figure 6A corresponding to variant 1 (V1) honeycomb and Figure 6B corresponding to variant 2 (V2) reentrant.
The insertion of the panel into a cylindrical shell provides lateral constraint to the structure. This constraint limits the radial deformation of the core and stabilizes the collapse mechanisms of the cells, promoting a more uniform and progressive deformation along the impact direction, as shown in Figure 7.
At the same time, Table 1 shows that the mass differences between the two configurations for the same number of cells are negligible. From this comparison, it can also be observed that additive manufacturing enables a reduction in both production time and cost for smaller-scale components.
The difference between the estimated slicer values and the obtained masses is approximately 5.27%, as seen in Table 2. Based on previous assessments of additively manufactured structures, this deviation is consistently observed for components produced on a Markforged X7 device using Markforged Onyx and is therefore considered characteristic for the manufacturing process.

2.2. Methods Used for Experimental Analyses

For the SEM (Scanning Electron Microscope) analysis of the tensile specimens made of Onyx (nylon), we used an SEM-QUANTA FEG-250 microscope (Thermo Fisher Scientific Inc., Waltham, MA, USA), and the application of a thin gold coating was necessary, as nylon is an electrically insulating material and, without such a coating, electrostatic charging effects would occur and interfere with image quality; as can be seen in Figure 8, an attempt was made to analyze the surface without coating.
The coating was applied using a Quorum SC7620 Mini Sputter Coater (Quorum Technologies, Sussex, UK) [20], a device operating under vacuum conditions to prevent oxidation and uncontrolled dispersion of metallic particles. During the process (Figure 9) solid gold is ionized and released in the form of atoms or ions, which are uniformly deposited onto the specimen surface, providing electrical conductivity and preparing the sample for electron beam scanning. The sputtering process therefore ensures a thin, uniform, and controlled coating without affecting the fine morphology of the analyzed material.
For the traction testing according to the indications provided by the specific standard [17], the recommended deformation rate for such specimens is 5 mm/min ± 25%. The mechanical tests on the tensile specimens were carried out by using a ZwickRoell (ZwickRoell Group, Ulm, Germany) Z010 universal testing machine [18].
The impact tests were conducted using an Instron CEAST 9340 (Illinois Tool Works, Inc., Glenview, IL, USA) drop-weight impact tower, as shown in Figure 10. The C-7529-313 impactor insert, featuring a spherical geometry with a 20 mm diameter, was used as the tup of the impactor.
For each geometry, only a single specimen was tested under identical experimental conditions. This approach was considered sufficient for the scope of the study, which focuses on comparative evaluation of global structural response under consistent testing conditions rather than statistical characterization of variability.
To achieve the required energy levels, additional masses of varying values were mounted onto the impact system. The specimens were positioned inside the aluminum tubes and subsequently fixed at both ends, ensuring that the test conditions closely replicated the configuration and constraints of real applications.
In order to comprehensively evaluate the impact response of the specimens and their energy absorption capability, the experimental tests were conducted at two distinct impact energy levels, namely 20 J and 50 J. The selected energy levels enabled the assessment of the structural behavior under different loading severities, allowing for the identification of the deformation and energy dissipation mechanisms developed during impact.
The raw data obtained from the experimental tests were further processed to extract additional information using a custom MATLAB R2025b code.

2.3. FEM Impact Simulation

A finite element analysis was performed using MSC Patran version 2017.0.2 2 and MSC Nastran version 2017.0 for the characterization of the impact behavior of the structures. The transient dynamic response is solved using explicit time integration based on the discretized form of the nonlinear dynamic equilibrium equation
M u ¨ = f e x t t f i n t u f c ( u , u ¨ )
where M is the mass matrix, u is the nodal displacement vector, fext is the external load vector, fint represents the nonlinear internal forces and fc is the contact force contribution.
To conduct the numerical investigation, three distinct databases were generated, corresponding to each of the analyzed configurations.
The numerical models (Figure 11) were made using 8-node hexahedral solid elements and 6-node tetrahedral elements. The model consists of a rigid support surface (ground) and an impactor with a diameter of 20 mm; both were defined as perfectly rigid bodies. The tube enclosing the panels, the face sheets, and the core were modelled as elasto-plastic structures in order to accurately capture the nonlinear mechanical response of the system under impact loading conditions.
In order to reduce model complexity and computational cost, the bonded region between the panel face sheets and the core was idealized, with the two regions being equivalently treated as a continuous medium, without the explicit modelling of the adhesive layer. This simplification was adopted due to the very small thickness of the adhesive layer, the limited availability of its impact-related mechanical properties, and its negligible influence on the overall structural behavior of the specimens. It is considered valid by means of finite element simulations, as no evidence of delamination was identified in any of these configurations (the V1 configurations) when experimentally tested.
In order to obtain the desired impact energy, the head was assigned an initial velocity of 3 m/s and a mass of 4.4 kg, corresponding to an impact energy of 20 J. For the 50 J impact case, the head mass was increased to 11 kg, while the initial velocity remained unchanged. The initial velocity applied in the FEM model is shown in Figure 12A. The boundary conditions used to constrain the support surface beneath the specimen are presented in Figure 12B.
Contact interaction between the tup and the structure is modelled using a surface-to-surface contact definition, allowing for separation and compression without penetration. Frictional behavior is included through a Coulomb friction formulation with a constant friction coefficient of 0.45.
Table 3 presents the number of nodes and elements corresponding to each of the three numerical databases which model the hexagonal configuration.
The material distribution follows the exact assembly configuration: the tube and the face sheets are manufactured from 6060-aluminum, while the core is made of Onyx. The mechanical properties of the employed materials are presented in Table 4. The adopted values for Onyx correspond to the tensile test results obtained from specimens exposed to environmental conditions for the same duration as the core structures.
The materials within the numerical model were defined using an elasto-plastic constitutive formulation based on a bilinear stress–strain curve. Strain rate effects were incorporated using the Cowper–Symonds constitutive model. The Cowper–Symonds constitutive model is a strain-rate-dependent formulation commonly used in explicit dynamic finite element analyses to account for the increase in material strength under rapid loading conditions such as impact, crash and drop tests.
σ y d = σ y 1 + ε ˙ p C 1 p
where σ y d is the dynamic yield stress, σ y is the quasi-static yield stress, ε ˙ p is the equivalent plastic strain rate, C is the strain rate coefficient and p is the strain rate exponent.
The Johnson–Cook model is generally considered more advanced than the Cowper–Symonds formulation, as it can simultaneously account for strain hardening, strain rate sensitivity, and thermal softening within a unified constitutive framework. However, the Cowper–Symonds approach is sufficient for the present impact analysis since the loading conditions are dominated by strain rate effects, making it an adequate and computationally efficient approximation for capturing the material response.
The obtained results provide a basis for comparing the performance of the analyzed configurations in terms of deformation mechanisms, stress distribution, and energy absorption efficiency.

3. Results

3.1. SEM Analysis of Tensile-Tested Specimens

3.1.1. Analysis of the Onyx Filament Cross-Section

For a comprehensive SEM evaluation, the raw Onyx filament was analyzed in addition to the manufactured specimens. Since the manual sectioning of the filament inevitably introduces surface deformations and irregularities, the resulting cross-section is not perfectly flat or uniform. Nevertheless, the obtained section, Figure 13A, provides sufficient information for evaluating the distribution of the carbon microfibers within the material, the material homogeneity, and the overall quality of the filament prior to the additive manufacturing process.
In Figure 13B, a detailed view of an individual carbon microfiber can be observed. Furthermore, the cross-sectional morphology appears uniform and free from significant voids or internal defects, while the carbon microfibers are consistently distributed throughout the entire filament section, indicating a homogeneous material structure and good filament manufacturing quality.

3.1.2. Analysis of the Cut Cross-Section Surface

The section obtained from the tensile specimen was produced by mechanical cutting. The cutting blade induced localized melting of the material, an effect that is visible in the SEM surface analysis. Despite this phenomenon, the surface exhibits a porous microstructure, with evident voids observable in Figure 14A and more clearly defined in Figure 14B.
Additionally, a relevant observation is the presence of carbon microfibers within the material, which are non-uniformly distributed but fully embedded within the polymer matrix.

3.1.3. Analysis of the Prepared and Resin-Embedded Surface

The preparation of this cross-sectional specimen involved embedding the sample in a cold-curing resin within a cylindrical mold. Subsequently, the embedded sample was progressively ground using abrasive papers of increasing grit size under a continuous water jet until a flat, smooth surface finish was obtained. Since both Onyx and the embedding resin are non-conductive materials, the specimen was finally coated with a thin gold layer, Figure 15A, in order to prevent electrostatic charging during SEM analysis.
Although the preparation process alters the original microstructure of the cross-section, it does not allow for the evaluation of interlayer adhesion, layer thickness, or the distribution and orientation of the microfibers within the material. Nevertheless, manufacturing defects, namely material voids, Figure 15B, are clearly visible. It can be observed that voids are present throughout the outer region of the section in a relatively periodic distribution. These defects are associated with the manufacturing process, with the pores exhibiting irregular morphologies and sizes ranging between approximately 10 and 50 μm, Figure 15C.

3.1.4. Analysis of the Fracture Surface

Analyzing the fracture cross-section of the tensile specimen, it can be observed that the surface exhibits a symmetric, layered morphology, Figure 16A, with a well-defined interface between successive layers, Figure 16B. The fracture surface presents a fibrous appearance, characteristic of a ductile failure mode, Figure 16C, typical of polyamide-based materials.
Carbon microfibers are also visible within the section, occurring in localized agglomerations. Furthermore, the presence of interlayer porosity suggests potential interfacial defects, which may act as stress concentration sites and possible crack initiation points.

3.2. Impact Behavior of Honeycomb-Based Crash Energy Absorbers

3.2.1. Experimental Evaluation of the 20 J Impact Energy Case

It can be observed that for the tested parts from configuration V1, following impact, Figure 17, the damaged region is primarily localized in the central area of the upper face sheet. Furthermore, configuration V1C1 exhibits the highest damage level, whereas configuration V1C3 is the least affected. This behavior indicates an increase in load-bearing capability and energy absorption capacity with the increase in the number of cells.
Configuration V2 did not exhibit a satisfactory structural response under impact conditions at 20 J; its behavior showed high deformation. All three variants corresponding to configuration V2 showed a consistent failure mode, Figure 18, characterized by rapid and abrupt delamination of the aluminum face sheets, followed by their bending under the action of the impactor.
As a consequence of this failure mechanism, the contribution of the core to load-bearing was negligible, with the impact being sustained almost entirely by the upper metallic face sheet.
The V1C1 configuration recorded a peak impact force of 5.952 N (Figure 19A) with an impact duration of approximately 6 ms, while the energy absorbed by the specimen was around 15.57 J, Figure 19B. For the V1C2 configuration, the peak impact force decreased to 5.212 N, Figure 19C, indicating an improved energy absorption capability as a result of doubling the number of cells. The impact duration increased to approximately 7 ms, while the absorbed energy remained comparable to that of V1C1, at 14.63 J, Figure 19D. The V1C3 configuration exhibited the lowest peak impact force, approximately 4.723 N, Figure 19E. At the same time, it showed the longest impact duration, reaching about 8 ms, while the absorbed energy was slightly lower compared to the previous configurations, with a value of approximately 13.79 J, Figure 19F.
The comparative evaluation of the structural performance of configuration V2 could not be carried out in a relevant way, as the failure mechanism masked the influence of the core geometric parameters. Nevertheless, all three tests indicated similar results as presented in Figure 20, namely a peak impact force of approximately 3.750 N, an impact duration of around 10 ms, and an absorbed energy of approximately 18 J.
Therefore, it can be concluded that configuration V2 is not suitable for impact loading applications due to its high susceptibility to delamination and its limited ability to transfer load between the face sheets and the core.

3.2.2. Experimental Evaluation of the 50 J Impact Energy Case

By increasing the impact energy from 20 J to 50 J, the V1 configurations continued to have an adequate structural response, with minimal damage, as shown in Figure 21.
However, it should be noted that, due to the use of a load cell with a maximum capacity of 10 kN, the V1C1 configuration exceeded this limit, resulting in the inability to record the actual peak force value.
For the V1C1 configuration, although the peak force could not be accurately determined, as the maximum possible acquired force was limited, as seen in Figure 22A, due to equipment limitations, an increase in impact duration to 9 ms was observed, while the energy absorbed by the specimen reached 42.22 J, Figure 22B. The V1C2 configuration recorded a peak impact force of 8.461 N (Figure 22C), an impact duration of around 12 ms, and an absorbed energy of 38.13 J, Figure 22D. In the case of the V1C3 configuration, the peak force decreased to 7.767 N (Figure 22E) while the impact duration increased to about 13 ms, and the absorbed energy was 36.38 J, Figure 22F.
Comparatively, it can be observed that, with the increase in the number of cells, the peak impact force tends to decrease, while the impact duration increases, showing a more progressive structural response. Although the absorbed energy shows a slight reduction from V1C1 to V1C3, all configurations show a high energy dissipation capacity under the 50 J impact condition.

3.3. Finite Element Simulations of the Tested Honeycomb-Based Energy Absorbers

3.3.1. Finite Element Simulation of the 20 J Impact Energy Case

Under the 20 J impact energy scenario, the finite element models of all three configurations closely reproduced the loading behavior observed during the experimental tests, Figure 22. The force–displacement curves exhibit a strong correlation with the experimental responses, confirming the fidelity of the numerical models and supporting their validation. A similarly close agreement can also be observed in the energy–time responses, further demonstrating the capability of the FEM models to accurately capture the impact behavior of the structures.
The comparison between numerical and experimental results is performed using the relative error as the primary validation metric. This is used consistently throughout the validation procedure to assess the agreement between simulations and experiments, particularly for key response parameters such as impact force and absorbed energy. No statistical dispersion measurement, such as standard deviation, is applied in this context, as the study relies on single experimental reference curves rather than repeated datasets.
For the V1C1 configuration, Figure 23A, the difference between the experimental and numerical peak force values was 6.16%, with the experimental peak force reaching 5.952 N, compared to 5.597 N obtained from the FEM simulation. The V1C2 configuration, Figure 23C, exhibited the closest correlation between experimental and numerical results, with an error of only 2.41%, corresponding to an experimental peak force of 5.213 N and a simulated value of 5.088 N. The largest discrepancy was observed for the V1C3 configuration, Figure 23E, where the experimentally measured peak force was 4.723 N, while the FEM model predicted a value of 4.279 N, resulting in a difference of 9.84%. Nevertheless, all deviations remained below 10%, which is generally considered an acceptable range for impact-related numerical simulations.
The aforementioned differences do not affect the overall fidelity of the model, which accurately captures both the energy absorption mechanism and the mechanical response of the assembly.

3.3.2. Finite Element Simulation of the 50 J Impact Energy Case

Similarly to the observations made for the 20 J impact scenario, the numerical models corresponding to the 50 J impact condition also showed a strong correlation with the experimental results, confirming the capability of the FEM approach to accurately reproduce the structural response under higher energy loading conditions.
Since, for the 50 J impact energy scenario (Figure 24), the peak force corresponding to the V1C1 configuration could not be experimentally recorded, as can be seen in Figure 24A, due to exceeding the load cell capacity, an estimation can be made based on the FEM-predicted value of 11.631 N. Considering the correlation observed for the previously validated configurations, the actual peak force is most likely within an interval of approximately ±7% relative to the numerical prediction.
For the V1C2 configuration (Figure 24C), the experimental test recorded a peak force of 8.461 N, while the FEM simulation force was 8.486 N, corresponding to an error of only 0.3%. The final configuration, V1C3 (Figure 24E), exhibited an experimental peak force of 7.767 N, which is 3.05% higher than the FEM force value of 7.533 N.
Overall, the numerical simulations demonstrated a high level of agreement with the experimental results for both impact energy scenarios, confirming the validity and reliability of the developed FEM models in accurately predicting the impact response and energy absorption behavior of the investigated crash box configurations.

4. Discussion

Comparatively, between the 20 J and 50 J impact energy levels, the analyzed configurations exhibited the same overall structural response, with the differences manifesting primarily through the intensification of the already existing phenomena. At higher impact energy, the response becomes more pronounced, characterized by an increase in impact duration and more significant structural deformation. Consequently, the efficient configuration (V1) at low impact energy maintains favorable behavior under higher-energy loading conditions.
At 20 J, the absorbed energy (Figure 25B) was 15.58 J for V1C1, 14.64 J for V1C2, and 13.80 J for V1C3. Comparatively, the absorbed energy of V1C2 was approximately 6% lower than that of V1C1, while V1C3 showed a reduction of nearly 12% relative to C1, indicating a gradual decrease in absorbed energy from C1 to C3, a trend associated with a more efficient energy dissipation mechanism for the configurations containing a higher number of cells.
In terms of peak force (Figure 25A), V1C1 reached 5.953 N, V1C2 reached 5.213 N, and V1C3 reached 4.723 N, corresponding to a reduction of approximately 13% between C1 and C2 and approximately 23% between C1 and C3. This decrease in peak force shows a more efficient impact response for the configurations with a higher number of cells.
At 50 J, as shown in Figure 26, the absorbed energy was 43.23 J for V1C1, 38.13 J for V1C2, and 36.39 J for V1C3. Compared to V1C1, the absorbed energy of V1C2 was approximately 13% lower, while V1C3 exhibited a reduction of approximately 17%, indicating a more pronounced decrease between configurations than that observed under the 20 J impact condition.
The peak forces (Figure 26A) were 10,000 N for C1 (limited by the testing equipment), 8.461 N for C2, and 7.767 N for C3, corresponding to a reduction of approximately 17% between C1 and C2 and approximately 24% between C1 and C3.
Although the overall distribution trend remains consistent, the variations become more significant as the impact energy increases.
To facilitate a clearer and more efficient comparison of the response of the three V1 configurations and to evaluate the effect of the number of cells on the impact behavior, Table 5 summarizes the main structural performance indicators, namely peak force, absorbed energy, and specific energy absorption (SEA). SEA is considered sufficient for comparison since it is mass-normalized and therefore directly reflects energy absorption efficiency across different configurations, whereas mean crushing force is not normalized and is less suitable for cross configuration comparison.
In Table 6 the reported values represent percentage reductions observed when increasing the number of cells from the C1 to C2 and C3 configurations. For the 20 J impact case, the force decreases by 13% from C1 to C2 and by a further 10% from C2 to C3, resulting in a total reduction of 23% from C1 to C3. The absorbed energy follows a similar trend, with reductions of 6% for both configurations and a total decrease of 12% between C1 and C3. In contrast, SEA shows the most pronounced sensitivity to the cellular configuration, decreasing by 44% from C1 to C2, a further 33% from C2 to C3, and reaching an overall reduction of 75% from C1 to C3. This strong reduction is expected, since SEA is mass-normalized and the structural mass increases with each additional cell, from C1 to C3.
For the 50 J impact case, the peak force is reduced by 24% and 9% in the successive transitions, corresponding to a total reduction of 33% between C1 and C3, while energy absorption decreases by 13% and 5%, giving a total reduction of 17%. SEA again exhibits the highest sensitivity, with reductions of 50%, 33%, and 79% respectively. Overall, the results indicate that increasing the number of cells consistently reduces force, absorbed energy, and especially SEA, with the latter being the most strongly affected performance metric across both impact levels.
The analysis of the impact test results indicates that increasing the number of cells leads to a reduction in peak impact force and an increase in impact duration, suggesting a more efficient stress distribution and lower overall structural stiffness under both the 20 J and 50 J impact conditions. The absorbed energy remains relatively constant between the V1C1 and V1C2 configurations, with a slight decrease observed for V1C3; however, all V1 configurations maintain a high energy dissipation capability. In contrast, the V2 configurations exhibit a high susceptibility to delamination and reduced load transfer between the face sheets and the core, rendering them unsuitable for impact loading applications. Overall, structures containing a higher number of cells provide a more favorable global response by reducing the peak load and extending the impact duration.

5. Conclusions

Sandwich crush-type honeycomb and reentrant structures were additively manufactured using Onyx as core cells encapsulated within a 6060-aluminum tube with top and bottom face sheets. These configurations represent a realistic engineering solution for lightweight structures designed for energy absorption. Impact experimental and FEM simulation analyses were conducted for impact energy levels of 20 J and 50 J. The results indicate a significant reduction in the maximum force with an increase in the number of cells along the height. Compared to the single-cell configuration, the peak force decreases by approximately 15% for the two-cell configuration and 22.5% for the three-cell configuration, corresponding to a reduction of roughly 9% between the two- and three-cell cases.
The absorbed energy is higher for the reentrant core than for the honeycomb core. However, the honeycomb core is more rigid and can withstand higher impact forces. In contrast, the reentrant configurations exhibit a high susceptibility to delamination and reduced load transfer between the face sheets and the core, making them unsuitable for high-energy impact loading applications.
These findings highlight the critical role of geometry in optimizing the impact performance of honeycomb-type structures and provide relevant insights for the design of additively manufactured energy-absorbing crush-type components for engineering applications.

Author Contributions

Conceptualization, A.N. and D.M.C.; methodology, A.N., D.A.A. and D.M.C.; software, A.N.; validation, A.N., D.A.A. and M.A.M.; formal analysis, A.N.; investigation, A.N., D.A.A. and M.A.M.; resources, A.N.; data curation, M.A.M. and O.A.M.; writing—original draft preparation, A.N.; writing—review and editing, D.M.C.; visualization, M.A.M. and O.A.M.; supervision, D.A.A. and D.M.C.; project administration, A.N. and D.M.C.; funding acquisition, D.M.C. All authors have read and agreed to the published version of the manuscript.

Funding

Andrei Nenciu acknowledges the grant awarded by the Ministry of Education from Romania for completing his Ph.D. studies under contract no. 06.41/04.10.2021.

Institutional Review Board Statement

Not applicable.

Informed Consent Statement

Not applicable.

Data Availability Statement

The data presented in this study are available from the corresponding author upon request. The data are part of an unfinished Ph.D. thesis.

Acknowledgments

The authors acknowledge the contributions given by Alina Dragomirescu from INCAS for assistance with SEM imaging and access to the microscopy facilities and Mihai Costea from National University of Science and Technology POLITEHNICA Bucharest for helping with the impact testing and technical support during the experimental work.

Conflicts of Interest

The authors declare no conflicts of interest.

References

  1. Wei, W.; Zhang, F.; Xing, Y.; Wang, H.; Liu, R. Research on mechanical properties of origami aluminum honeycomb for automobile energy absorbing box. Materials 2022, 16, 141. [Google Scholar] [CrossRef] [PubMed]
  2. Saber, A.; Amer, A.M.; Shehata, A.I.; El-Gamal, H.A.; Abd_Elsalam, A. Recent developments in additively manufactured crash boxes: Geometric design innovations, material behavior, and manufacturing techniques. Appl. Sci. 2025, 15, 7080. [Google Scholar] [CrossRef]
  3. Liu, Z.; Wang, Y.; Liang, X.; Yu, W. Crashworthiness study of functional gradient lattice-reinforced thin-walled tubes under impact loading. Materials 2024, 17, 2264. [Google Scholar] [CrossRef] [PubMed]
  4. Wang, W.; Wang, Y.; Zhao, Z.; Tong, Z.; Xu, X.; Lim, C.W. Numerical Simulation and experimental study on energy absorption of foam-filled local nanocrystallized thin-walled tubes under axial crushing. Materials 2022, 15, 5556. [Google Scholar] [CrossRef]
  5. Hidayat, D.; Istiyanto, J.; Sumarsono, D.A.; Kurniawan, F.; Ardiansyah, R.; Wandono, F.A.; Nugroho, A. Investigation on the crashworthiness performance of thin-walled multi-cell PLA 3D-printed tubes: A multi-parameter analysis. Designs 2023, 7, 108. [Google Scholar] [CrossRef]
  6. Chen, D.; Sun, X.; Li, B.; Liu, Y.; Zhu, T.; Xiao, S. On crashworthiness and energy-absorbing mechanisms of thick CFRP structures for railway vehicles. Polymers 2022, 14, 4795. [Google Scholar] [CrossRef] [PubMed]
  7. Tur, E.; Shokrani, A. Influence of fibre orientation on mechanical behaviour of Onyx-carbon fibre composites fabricated via additive manufacturing. Procedia CIRP 2025, 134, 67–72. [Google Scholar] [CrossRef]
  8. Kaushik, V.; Kurra, S.; Adusumalli, R. Structure–property relationships in 3D-printed onyx-based composites reinforced with continuous fibers: Role of temperature and fiber orientation. Compos. C Open Access 2025, 18, 100649. [Google Scholar] [CrossRef]
  9. Nikiema, D.; Balland, P.; Sergent, A. Study of the mechanical properties of 3d-printed onyx parts: Investigation on printing parameters and effect of humidity. Chin. J. Mech. Eng. Addit. Manuf. Front. 2023, 2, 100075. [Google Scholar] [CrossRef]
  10. Sun, G.; Huo, X.; Wang, H.; Hazell, P.J.; Li, Q. On the structural parameters of honeycomb-core sandwich panels against low-velocity impact. Compos. Part B-Eng. 2021, 216, 108881. [Google Scholar] [CrossRef]
  11. Sun, G.; Wang, E.; Wang, H.; Xiao, Z.; Li, Q. Low-velocity impact behavior of sandwich panels with homogeneous and stepwise graded foam cores. Mater. Des. 2018, 160, 1117–1136. [Google Scholar] [CrossRef]
  12. Yang, P.; Shams, S.S.; Slay, A.; Brokate, B.; Elhajjar, R. Evaluation of temperature effects on low velocity impact damage in composite sandwich panels with polymeric foam cores. Compos. Struct. 2015, 129, 213–223. [Google Scholar] [CrossRef]
  13. Ngo, T.D.; Kashani, A.; Imbalzano, G.; Nguyen, K.T.; Hui, D. Additive manufacturing (3D printing): A review of materials. methods. applications and challenges. Compos. Part B-Eng. 2018, 143, 172–196. [Google Scholar] [CrossRef]
  14. Wang, X.; Jiang, M.; Zhou, Z.; Gou, J.; Hui, D. 3D printing of polymer matrix composites: A review and prospective. Compos. Part B-Eng. 2017, 110, 442–458. [Google Scholar] [CrossRef]
  15. Wu, Y.; Fang, J.; Wu, C.; Li, C.; Sun, G.; Li, Q. Additively manufactured materials and structures: A state-of-the-art review on their mechanical characteristics and energy absorption. Int. J. Mech. Sci. 2023, 246, 108102. [Google Scholar] [CrossRef]
  16. Markforged Onyx—Composite 3D Printing Material. Available online: https://markforged.com/materials/plastics/onyx (accessed on 18 May 2026).
  17. ASTM D638-2022; Standard Test Method for Tensile Properties of Plastics. ASTM International: West Conshohocken, PA, USA, 2022.
  18. Nenciu, A.; Apostol, D.A.; Constantinescu, D.M. The effect of continuous carbon fiber reinforcement on 3d-printed honeycomb and re-entrant sandwich panels subjected to in-plane compression. Materials 2025, 18, 5594. [Google Scholar] [CrossRef] [PubMed]
  19. EVERGLUE—Everbond 3001|Your B2B Shop. Available online: https://big-difference.com/everglue-2k-mma-everbond-3001-50ml-double-cartridge-10-1 (accessed on 18 May 2026).
  20. EMS SC7620 Mini Sputter Coater. Available online: https://www.emsdiasum.com/mini-sputter-coater?srsltid=AfmBOorAfUaKVYdajhbs80Cv8cfQQMwv11iqY8YBT5UQ3F-spNe5LLFJ (accessed on 18 May 2026).
Figure 1. Dimensions of the Type I specimen according to ASTM D638-22.
Applsci 16 05858 g001
Figure 2. Section of a panel made of hexagonal unit cells.
Applsci 16 05858 g002
Figure 3. Honeycomb hexagonal unit cell [18].
Applsci 16 05858 g003
Figure 4. Crash box structure with Onyx honeycomb core and aluminum face sheets encapsulated in an aluminum cylinder: (A) complete configuration; (B) core diameter; (C) cylinder diameters.
Applsci 16 05858 g004
Figure 5. Aluminum face sheets fabricated by the CNC machining process.
Applsci 16 05858 g005
Figure 6. Additively manufactured parts: (A) V1 configuration technical drawing; (B) V2 configuration technical drawing; (C) V1 configuration additively manufactured; (D) V2 configuration additively manufactured; (E) V1 configuration with bonded face sheets; (F) V2 configuration with bonded face sheets.
Applsci 16 05858 g006
Figure 7. Cylindrical outer shells for each cell configuration.
Applsci 16 05858 g007
Figure 8. Sample from a tensile specimen, analyzed without gold coating.
Applsci 16 05858 g008
Figure 9. Gold coating process: (A) sputtering device; (B) samples before coating; (C) vacuum deposition process of the gold layer; (D) samples finished with conductive gold layer.
Applsci 16 05858 g009
Figure 10. Impact drop-weight Instron CEAST 9340 (left side) with specimen fixture (right side).
Applsci 16 05858 g010
Figure 11. Finite element model section of crash-box configuration V1C1.
Applsci 16 05858 g011
Figure 12. Model including loading and boundary conditions: (A) initial velocity applied; (B) all translational degrees of freedom fixed.
Applsci 16 05858 g012
Figure 13. Onyx filament: (A) section, 100×; (B) detail on carbon microfiber with 4000× magnification.
Applsci 16 05858 g013
Figure 14. Specimen cut cross-section: (A) overview, 100×; (B) detail on porous area, 500×.
Applsci 16 05858 g014
Figure 15. Embedded cross-section: (A) overview; (B) detail on cross-section, 100×; (C) detail on hollow areas, 500×.
Applsci 16 05858 g015
Figure 16. Fracture cross-section: (A) overview, 100×; (B) detail on layers, 150×; (C) detail of (B) on a fibrous aspect of the area, 500×.
Applsci 16 05858 g016
Figure 17. Configuration V1 after 20 J impact: (A) overall view; (B) top view.
Applsci 16 05858 g017
Figure 18. Configuration V2 after 20 J impact.
Applsci 16 05858 g018
Figure 19. Results for 20 J energy impact, configuration V1: (A) force–time curve V1C1; (B) energy–time curve V1C1; (C) force–time curve V1C2; (D) energy–time curve V1C2; (E) force–time curve V1C3; (F) energy–time curve V1C3.
Applsci 16 05858 g019
Figure 20. Results for 20 J energy impact, configuration V2: (A) force–time curve V2C1; (B) energy–time curve V2C1; (C) force–time curve V2C2; (D) energy–time curve V2C2; (E) force–time curve V2C3; (F) energy–time curve V2C3.
Applsci 16 05858 g020
Figure 21. Configuration V1 after 50 J impact: (A) overall view; (B) top view.
Applsci 16 05858 g021
Figure 22. Results for 50 J energy impact, configuration V1: (A) force–time curve V1C1; (B) energy–time curve V1C1; (C) force–time curve V1C2; (D) energy–time curve V1C2; (E) force–time curve V1C3; (F) energy–time curve V1C3.
Applsci 16 05858 g022
Figure 23. Experimental and FEM 20 J energy impact comparison, configuration V1: (A) force–time curve V1C1, (B) energy–time curve V1C1, (C) force–time curve V1C2, (D) energy–time curve V1C2, (E) force–time curve V1C3, (F) energy–time curve V1C3.
Applsci 16 05858 g023
Figure 24. Experimental and FEM 50 J energy impact comparison, configuration V1: (A) force–time curve V1C1: (B) energy–time curve V1C1: (C) force–time curve V1C2; (D) energy–time curve V1C2; (E) force–time curve V1C3; (F) energy–time curve V1C3.
Applsci 16 05858 g024
Figure 25. Impact energy of 20 J for honeycomb (V1) and reentrant (V2) core: (A) maximum force; (B) absorbed energy.
Applsci 16 05858 g025
Figure 26. Impact energy for honeycomb core at 50 J: (A) maximum force; (B) absorbed energy.
Applsci 16 05858 g026
Table 1. Information about additively manufactured parts obtained from the from slicer.
HeightV1V2
Mass
[g]
Volume
[cm3]
Print Duration
[h:min]
Material Price
[$]
Mass
[g]
Volume
[cm3]
Print Duration
[h:min]
Material Price
[$]
1 Cell (C1)41.4936.3309:088.6342.9537.5508:398.92
2 Cells (C2)84.3473.8216:4717.5385.7174.9516:1617.80
3 Cells (C3)127.14111.2524:0026.42128.48112.3723:5326.69
Table 2. Mass of the additively manufactured parts.
ConfigurationReal Mass [g]Slicer Mass [g]Error [%]
V1C139.741.494.41%
V1C280.084.345.28%
V1C3120.7127.145.20%
V2C140.842.955.13%
V2C280.885.715.90%
V2C3121.4128.485.67%
Table 3. Number of nodes and elements of each finite element model for configuration V1.
ConfigurationElementsNodes
C149,07417,963
C283,34530,223
C3117,61042,239
Table 4. Material properties used for material definition in numerical models.
MaterialPropertyValueMaterialPropertyValue
6060.T6Elastic Modulus70,000 MPaOnyxElastic Modulus800 MPa
Density2.7 g/cm3Density1.2 g/cm3
Poisson’s Coefficient0.33Poisson’s Coefficient0.4
Yield Stress160 MPaYield Stress20 MPa
Yield Strain0.2%Yield Strain4%
Ultimate Stress215 MPaUltimate Stress35 MPa
Ultimate Strain8%Ultimate Strain40%
Table 5. Summary of impact performance indicators for V1 configurations, experimental and FEM.
Impact EnergyMeasured ValueExperimentalFEM
V1C1V1C2V1C3V1C1V1C2V1C3
20 JForce [N]595352134723559750884279
Energy [J]15.5814.6413.815.5614.0512.32
SEA [J/g]0.1820.1160.0830.1820.1120.074
50 JForce [N]10,8178461776711,63184867533
Energy [J]43.2338.1336.3942.7436.9426.42
SEA [J/g]0.5040.3030.2180.4990.2930.158
Table 6. Percentage difference between configurations.
Impact EnergyMeasured ValueC1 to C2C2 to C3C1 to C3
20 JForce [N]13%10%23%
Energy [J]6%6%12%
SEA [J/g]44%33%75%
50 JForce [N]24%9%33%
Energy [J]13%5%18%
SEA [J/g]50%33%79%
Disclaimer/Publisher’s Note: The statements, opinions and data contained in all publications are solely those of the individual author(s) and contributor(s) and not of MDPI and/or the editor(s). MDPI and/or the editor(s) disclaim responsibility for any injury to people or property resulting from any ideas, methods, instructions or products referred to in the content.

