Article

Enhancing Geotechnical Engineering Education Through Case-Based Innovation: A Predictive Modeling Framework for Cemented Sand in Strength Theory Teaching


School of Civil Engineering and Architecture, Zhejiang University of Science and Technology, Hangzhou 310023, China
*
Author to whom correspondence should be addressed.
Appl. Sci. 2026, 16(12), 5776; https://doi.org/10.3390/app16125776
Submission received: 25 April 2026 / Revised: 2 June 2026 / Accepted: 4 June 2026 / Published: 8 June 2026
(This article belongs to the Section Civil Engineering)

Abstract

The shear strength–suction (here suction induced from unsaturation) relationship is inherently challenging, yet this difficulty is compounded for cemented crushable sands, whose behavior fundamentally diverges from classical clay-centric theories. This paper presents an innovative teaching case study focusing on colloidal-silica-cemented calcareous sand, based on direct shear tests across a full saturation range (0–100%). Our experimental findings reveal two unconventional characteristics that challenge textbook models: (1) suction strength exhibits a positive dependency on normal stress—an inverse trend to conventional expectations; and (2) strength near desiccation drops below saturated values, contradicting the monotonic increasing function typically observed in clays. A review of 20 existing models confirms that none of them can simultaneously capture both features, highlighting a clear gap in both theory and instruction. To address this gap pedagogically, the core novelty of this work lies in the development of a classroom-friendly predictive model that introduces two physical innovations: first, it incorporates normal-stress-dependent suction strength by modifying capillary condensation probability—departing from constant-angle assumptions; second, it accounts for desiccation-induced strength deterioration through a gel crack size effect, which is absent in conventional unsaturated strength formulations. The model retains clear physical interpretability and demonstrates strong agreement with experimental data. By integrating unconventional behavior, model limitations, and novel physically inspired formulations into a coherent case study, this work equips students not only to recognize deviations from classical unsaturated strength theory but also to construct their own mechanistic models in geotechnical engineering education.

1. Introduction: Why This Teaching Case Study Was Chosen

In unsaturated soil mechanics courses, the relationship between suction and shear strength is a core topic. Classical theory typically presents a monotonically increasing curve, i.e., the higher the suction, the higher the strength. This conclusion is documented in several mainstream textbooks and can easily lead students to develop a fixed mindset. However, for cemented materials, the drying process may induce gel shrinkage and micro-crack development, thereby causing strength deterioration and exhibiting a counterintuitive phenomenon of “weaker when drier.” This counterexample serves as an excellent teaching material to guide students toward a deeper understanding of the microscopic mechanisms of unsaturated strength.
Colloidal silica can be used to stabilize marine calcareous sand, thereby improving the stability of calcareous sand beneath foundations. Due to its low viscosity, colloidal silica can seep through sand over long distances and then turn into silica gel for cementing sand. A notable engineering application is the coastal Fukuoka International Airport, where colloidal silica was injected beneath the runway to stabilize the sand [1]. Extensive studies have been performed on the mechanical properties of colloidal-silica-cemented sand [2,3,4,5,6,7,8,9,10,11,12,13,14,15,16,17,18,19,20,21]. However, the existing literature focuses primarily on the saturated state of colloidal-silica-cemented sand, with very few studies on the unsaturated state. Previous studies analyzed the strength characteristics of cemented soils [22]. To date, only [23] have analyzed the permeability of unsaturated colloidal-silica-cemented sand, while its unsaturated shear strength remains unexplored. In practical engineering, colloidal silica-cemented calcareous sands can be applied in coastal reclamation projects, subgrade construction and shore protection works. These exposed fill materials are frequently subjected to complex natural environments, including seasonal drought, intense solar evaporation, fluctuating groundwater tables, and tidal variations. Such conditions easily cause water loss and desiccation inside the treated sand mass, leading to continuous changes in matric suction. Accordingly, investigating the relationship between suction and unsaturated strength is of great necessity for the long-term stability evaluation of colloidal silica-cemented calcareous sands.
For different types of unsaturated soils, extensive experimental studies have been conducted on stress–strain characteristics [24,25,26,27,28,29,30,31,32,33,34,35], and various formulas for unsaturated strength have been proposed [36,37,38,39,40,41,42,43,44,45,46,47,48,49,50,51,52,53,54]. Therefore, it is necessary to examine whether these existing models can be used to predict the shear strength of unsaturated colloidal-silica-cemented calcareous sand.
The teaching objective of this paper is to help students break their fixed mindset regarding the monotonic increase of unsaturated strength through a real counterintuitive experimental case study and to guide them in understanding how to develop physically inspired strength models from microscopic mechanisms. To this end, direct shear tests were performed on unsaturated colloidal-silica-cemented calcareous sand with degrees of saturation ranging from 0% to 100%. The experimental results reveal two characteristics: (1) the suction-induced component of shear strength is normal-stress-dependent; and (2) a new type of strength–suction relationship is observed, in which the strength near desiccation is lower than that at the saturated state. A review of 20 existing models shows that none of them can simulate the above two characteristics. Therefore, this paper establishes a new model capable of reflecting both characteristics: on the one hand, by modifying the capillary condensation probability, the effect of normal stress on the suction-induced strength component is incorporated; on the other hand, by introducing the crack size effect, the micro-mechanism of shrinkage-induced crack deterioration is accounted for, thereby enabling the prediction of this new type of strength–suction relationship. The following sections are organized according to the pedagogical logic of “experimental observations → model limitations → new model development → classroom application.”

2. Teaching-Oriented Experimental Design

2.1. Materials

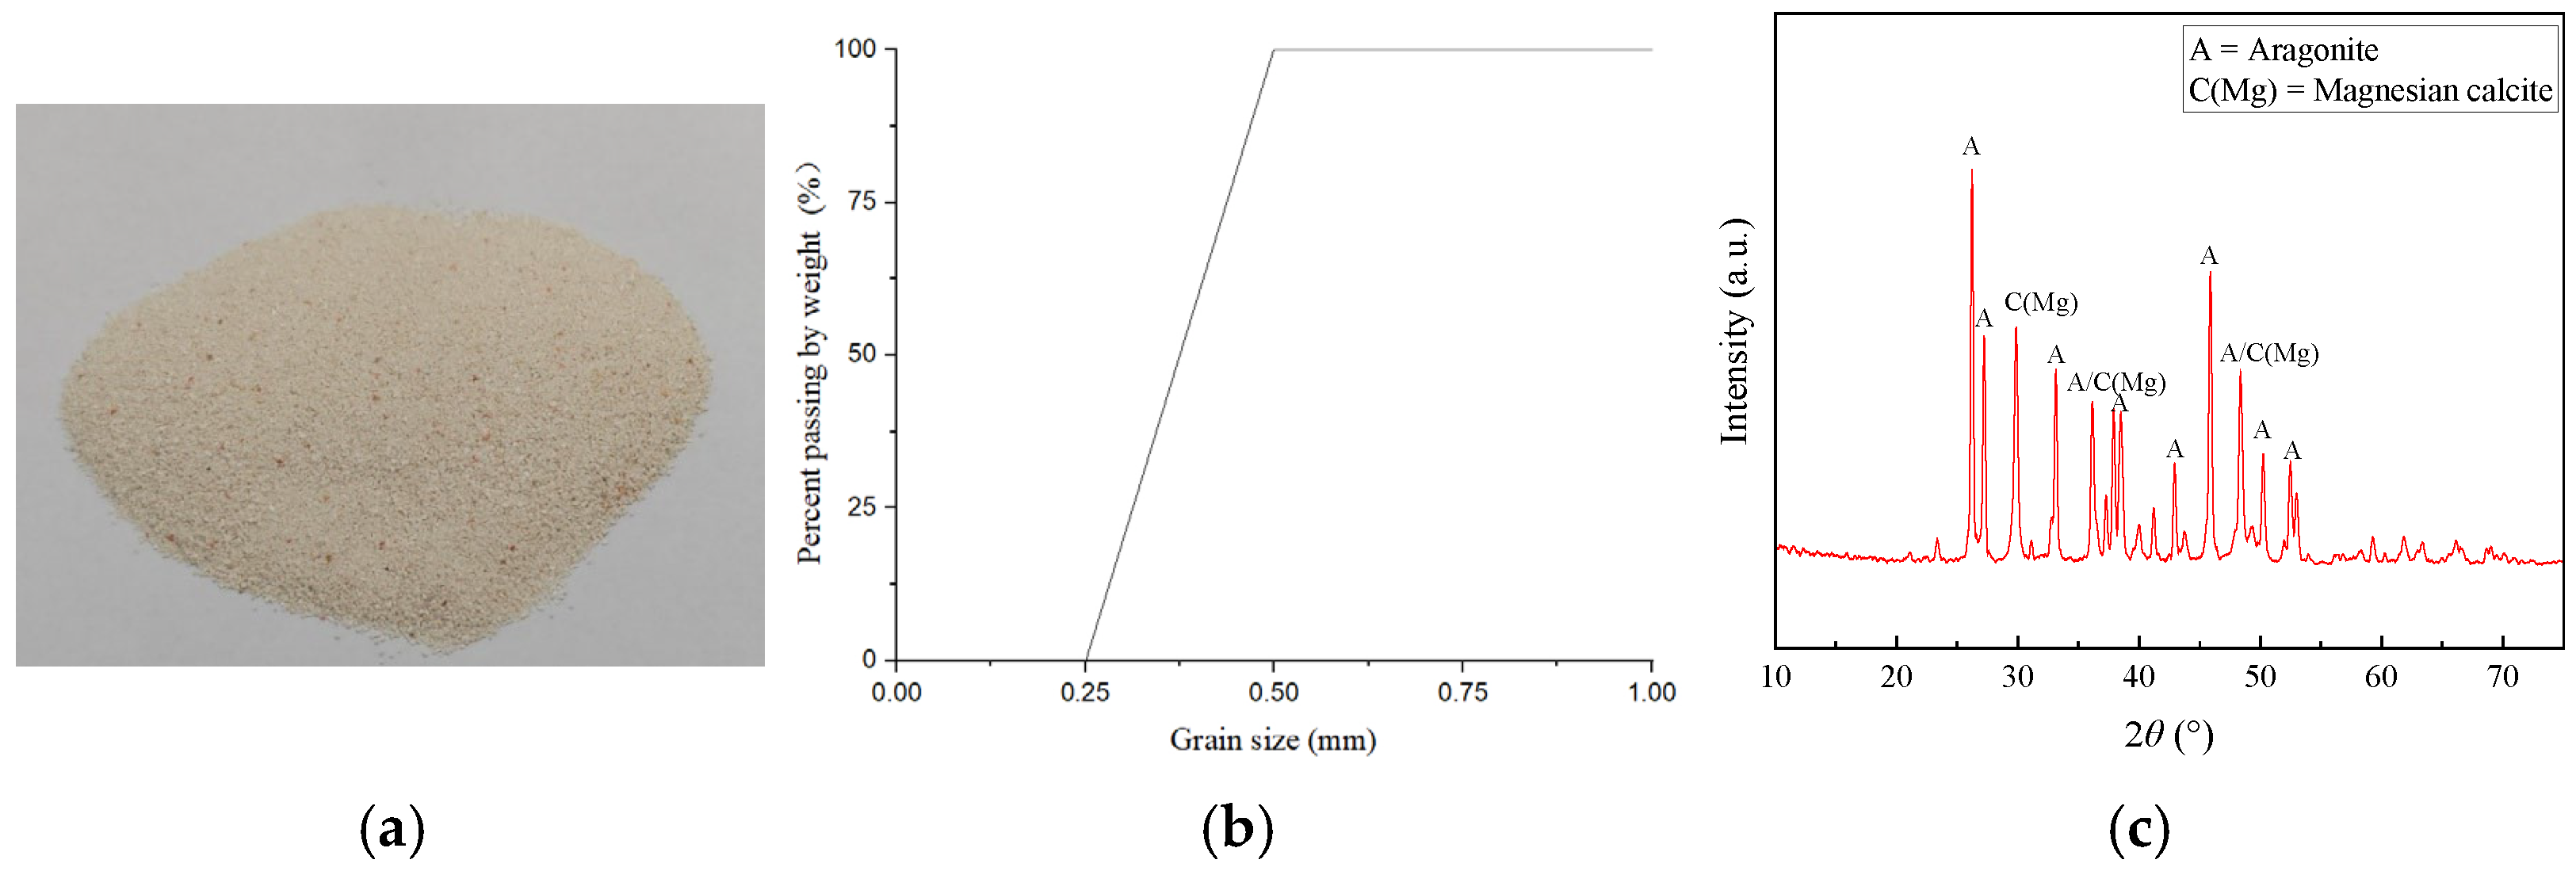
The calcareous sand used in this teaching case was sourced from the Philippines, and its particle size was controlled within the range of 0.25–0.5 mm after sieving. Figure 1 shows a photograph of the sand sample and its gradation curve, and Table 1 lists the basic physical properties of the sand. Instructors can guide students to calculate fundamental indices such as the relative density of this sand during classroom exercises. The dominant mineral component is aragonite, followed by magnesian calcite with a lower content. Both are typical minerals of marine calcareous sand, as shown in Figure 1c.
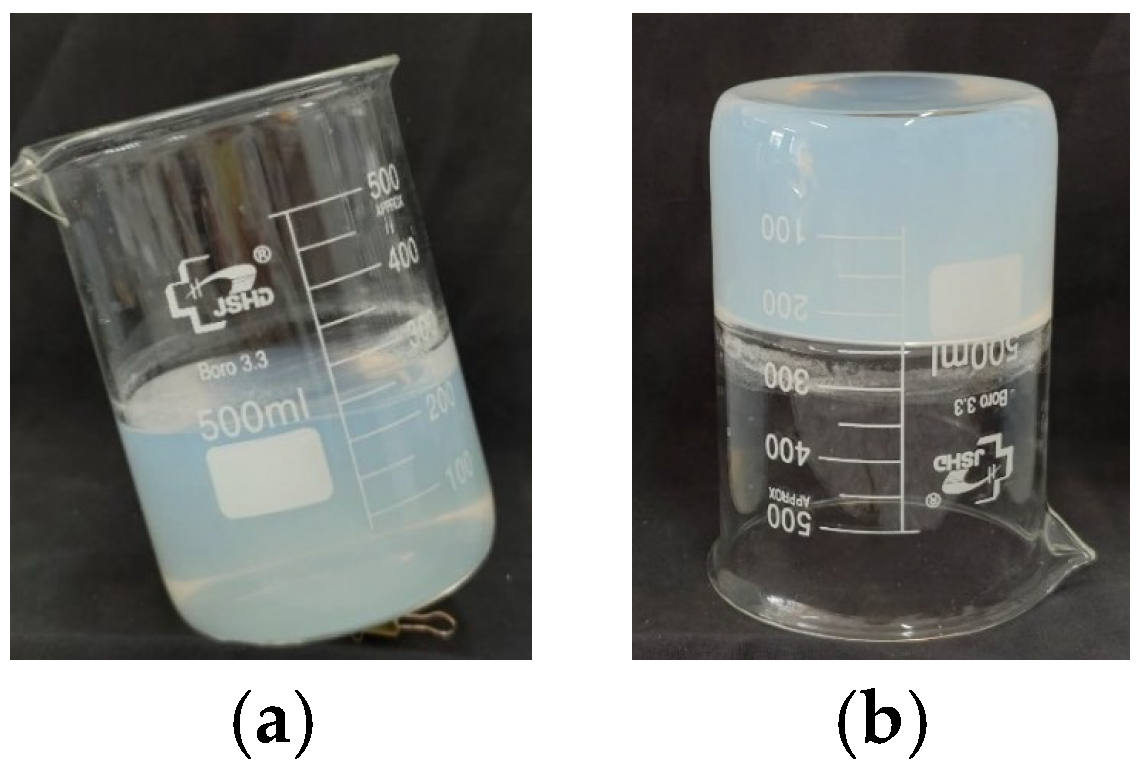
Colloidal silica was purchased from Qingdao Ronghai Jute Fine Chemical Co., Ltd. (Qingdao, Shandong, China). This material is a liquid with fluidity close to that of water. In colloidal silica, nano-silica particles exhibit a stable suspension due to repulsive forces between particles. Such repulsive forces result from the alkaline environment created by the addition of sodium hydroxide. When an acid or salt is added [2,4,5,7,9,11,12,13,15,16,17,19,20,21], the repulsive forces disappear, and the nano-silica particles connect to form a solid silica gel, which can cement sand particles. The concentration of colloidal silica used in this teaching case is 30%, the pH value ranges from 8.5 to 10.0, and the particle size of the nano-silica particles is 10–20 nm. Classroom demonstration experiment: after adding a sodium chloride solution (e.g., 1% NaCl) to the colloidal silica, the fluidity of the material decreases significantly after 3 h (see Figure 2a), and it transforms into a solid gel after 24 h (see Figure 2b). This transformation process is highly suitable for a live demonstration in the classroom, helping students intuitively understand the formation mechanism of cementitious material.

2.2. Specimen Preparation Method for Teaching (Operational Steps for Student Laboratory Work)

The specimen size of the colloidal-silica-cemented sand is 61.8 mm in diameter × 20 mm in height. The specimen preparation steps are as follows, which instructors can use as operational guidelines for laboratory sessions:
Step 1: Mix 10% NaCl solution and 30% colloidal silica together in a ratio of 1:9, and pour this mixture into the mold.
Step 2: Use the pluviation method [55] to deposit the sand into the mold.
Step 3: Wrap the entire mold with plastic film to prevent moisture evaporation, and place the mold in a curing box for 3 days to obtain saturated specimens of colloidal-silica-cemented sand.
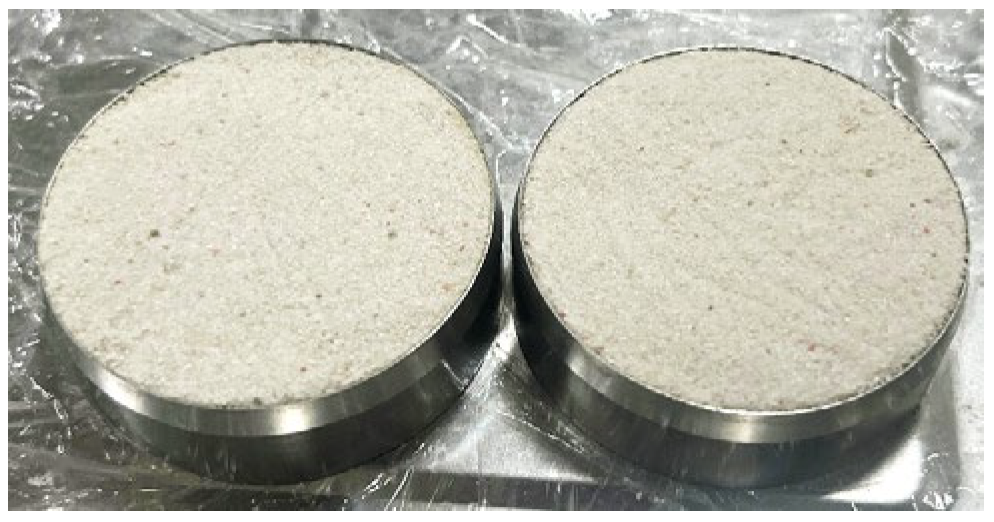
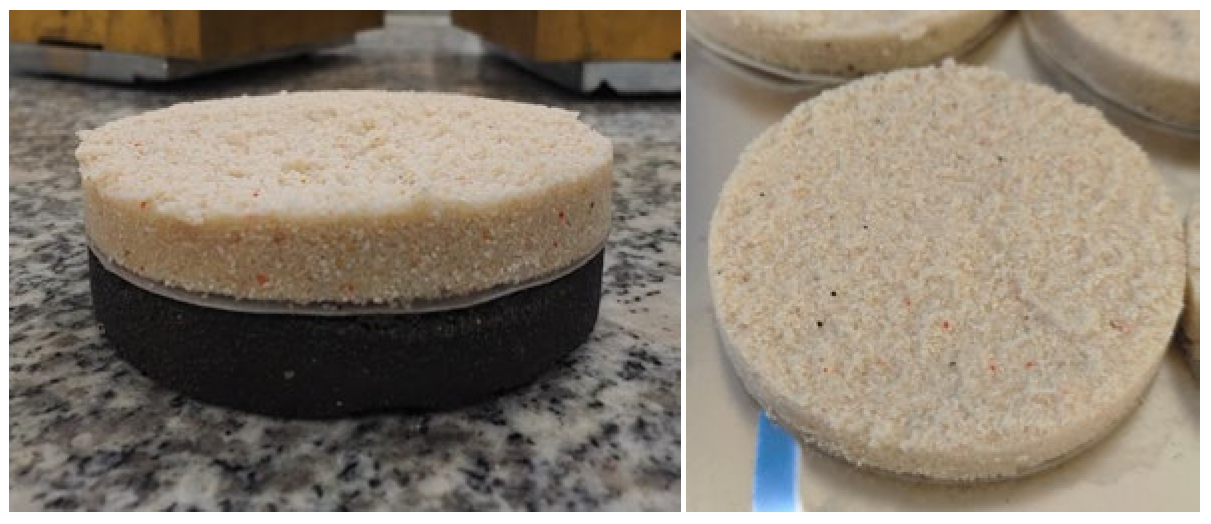
Figure 3 shows the stabilized specimen after curing, and Figure 4 shows the specimen after shearing.
For unsaturated specimen preparation, the saturated specimens are placed in an oven for different heating durations to control the degree of saturation and then wrapped in plastic film for 48 h to ensure uniformity of moisture distribution. The specimens in this study are only 20 mm thick, which allows uniform heat distribution during drying. Meanwhile, the oven temperature was set at 50 degrees Celsius, a moderate value consistent with the actual ambient temperature of calcareous sand in tropical island environments. Under such conditions, severe moisture gradients and premature microcracks caused by thermal shock can be effectively avoided. In addition, the oven drying method enables precise control of water content at designated levels (95%, 85%, 65%, 50%, 40%, 30%, 25%, and 15%). By contrast, the conventional suction equilibration via salt solution can cover this full range of water contents, but it fails to strictly match our pre-defined saturation values. Therefore, we adopted the accelerated drying approach for specimen preparation. Ref. [56] sealed the sample in a bag for a 48 h period to allow for suction equilibration. The underlying principle is that moisture migrates spontaneously from regions of higher water content to regions of lower water content within the closed system, driven by the water potential gradient, ultimately achieving uniform distribution. Therefore, this study followed this well-established protocol for reaching a uniform moisture distribution after the 48 h wrapping period. These unsaturated specimens in Figure 3 are used to determine the shear strength at different degrees of saturation.

2.3. Suction Measurement Method (Teaching Demonstration of the Filter Paper Method)

The filter paper method was used to determine the soil–water characteristic curve (SWCC). Ref. [57] demonstrated that the filter paper method can reliably measure suctions above 1000 kPa. For suctions up to approximately 100,000 kPa, the method remains applicable. In this study, the matric suction under the fully dried state (oven dryness) was not measured directly using the filter paper method. Instead, it was assigned a value of 106 kPa based on established theoretical findings in the literature. Ref. [58] demonstrated, through thermodynamic considerations, that oven dryness corresponds to a matric suction of 106 kPa. This theoretical value has been widely adopted in subsequent studies. For example, refs. [27,37] used a matric suction of approximately 106 kPa to represent oven-dry conditions in their analyses of unsaturated soil behavior. Ref. [57] also confirmed that a matric suction approaching 106 kPa is thermodynamically sound and consistent with experimental observations. Therefore, although the filter paper method in this study was not employed to measure suctions in the fully dried state, the assigned value of 106 kPa is well supported by existing thermodynamic theory and established practice in unsaturated soil mechanics. The specimen of colloidal-silica-cemented sand and the filter paper were sealed together in an aluminum can. When the specimen and the filter paper reached moisture equilibrium, the water content of the filter paper was measured to determine the matric suction. In this study, only matric suction was measured and discussed, while osmotic suction was not taken into account throughout the tests and data analysis. Our research focuses on the matric suction characteristics of colloidal silica-cemented calcareous sand. Accordingly, we adopted the original calibration equations provided by the manufacturer for Shuangquan filter paper. In this teaching case, Shuangquan No. 203 filter paper (Cytiva, Hangzhou, China) was used, and the following two equations provided by the manufacturer were used to relate water content to matric suction:
log ψ = 5.493 0.0767 ω ,       ω 47 %
log ψ = 2.470 0.0120 ω ,       ω > 47 %
where ψ is the suction, and ω is the water content of the filter paper. Instructors can guide students through this measurement process to understand the fundamental principles of suction measurement in unsaturated soils.

2.4. Direct Shear Test Plan

The direct shear apparatus was provided by Nanjing Ningxi Soil Instrument Factory (Nanjing, China), and a shearing rate of 0.8 mm/min was used. Direct shear tests were performed on colloidal-silica-cemented sand under four different vertical stresses (100 kPa, 200 kPa, 300 kPa, and 400 kPa), with degrees of saturation ranging from 0% to 100%. The detailed test plan is shown in Table 2. Instructors can use this as a design template for student group experiments.

2.5. Experimental Results and Their Pedagogical Interpretation

2.5.1. Teaching Analysis of the Soil–Water Characteristic Curve (SWCC)

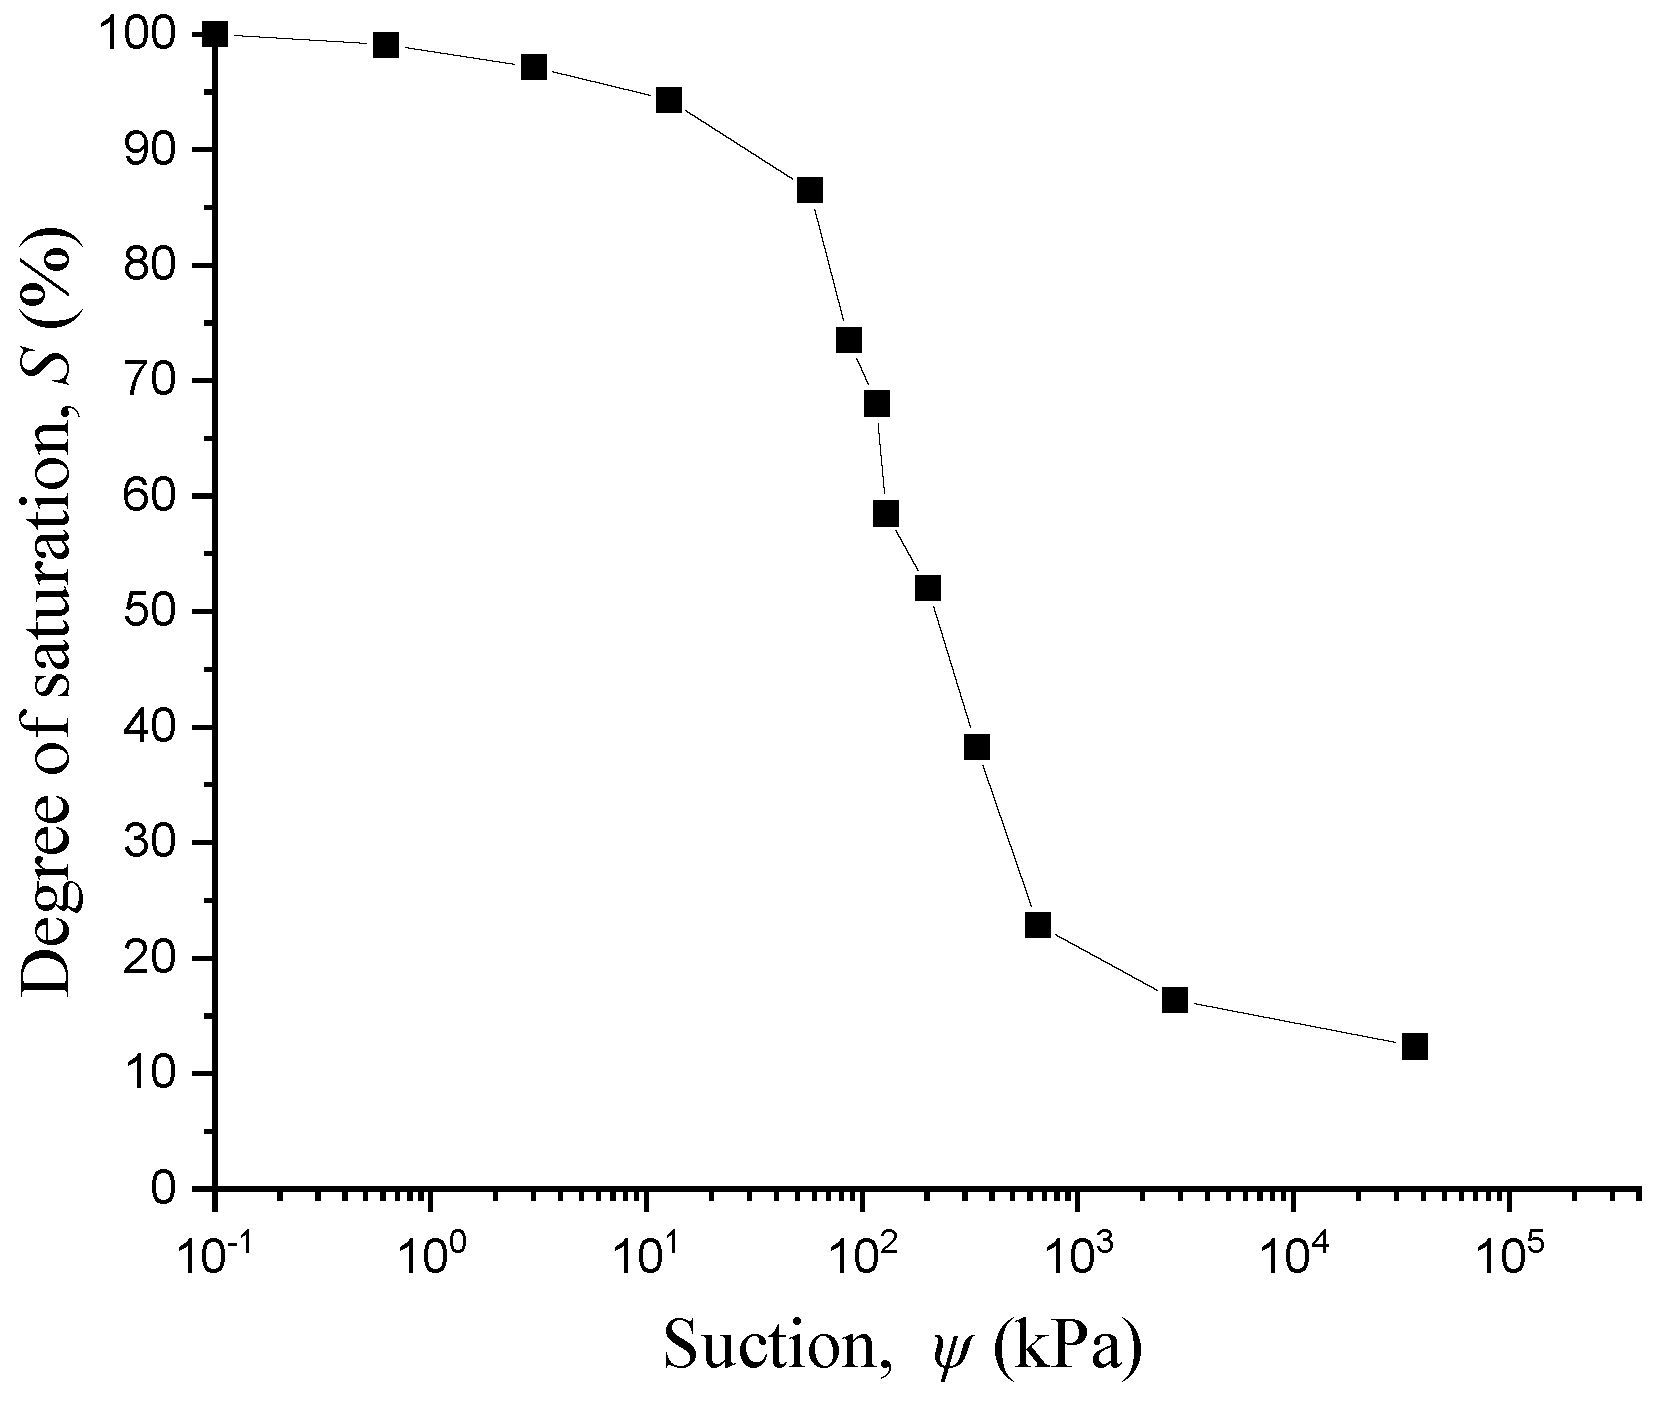
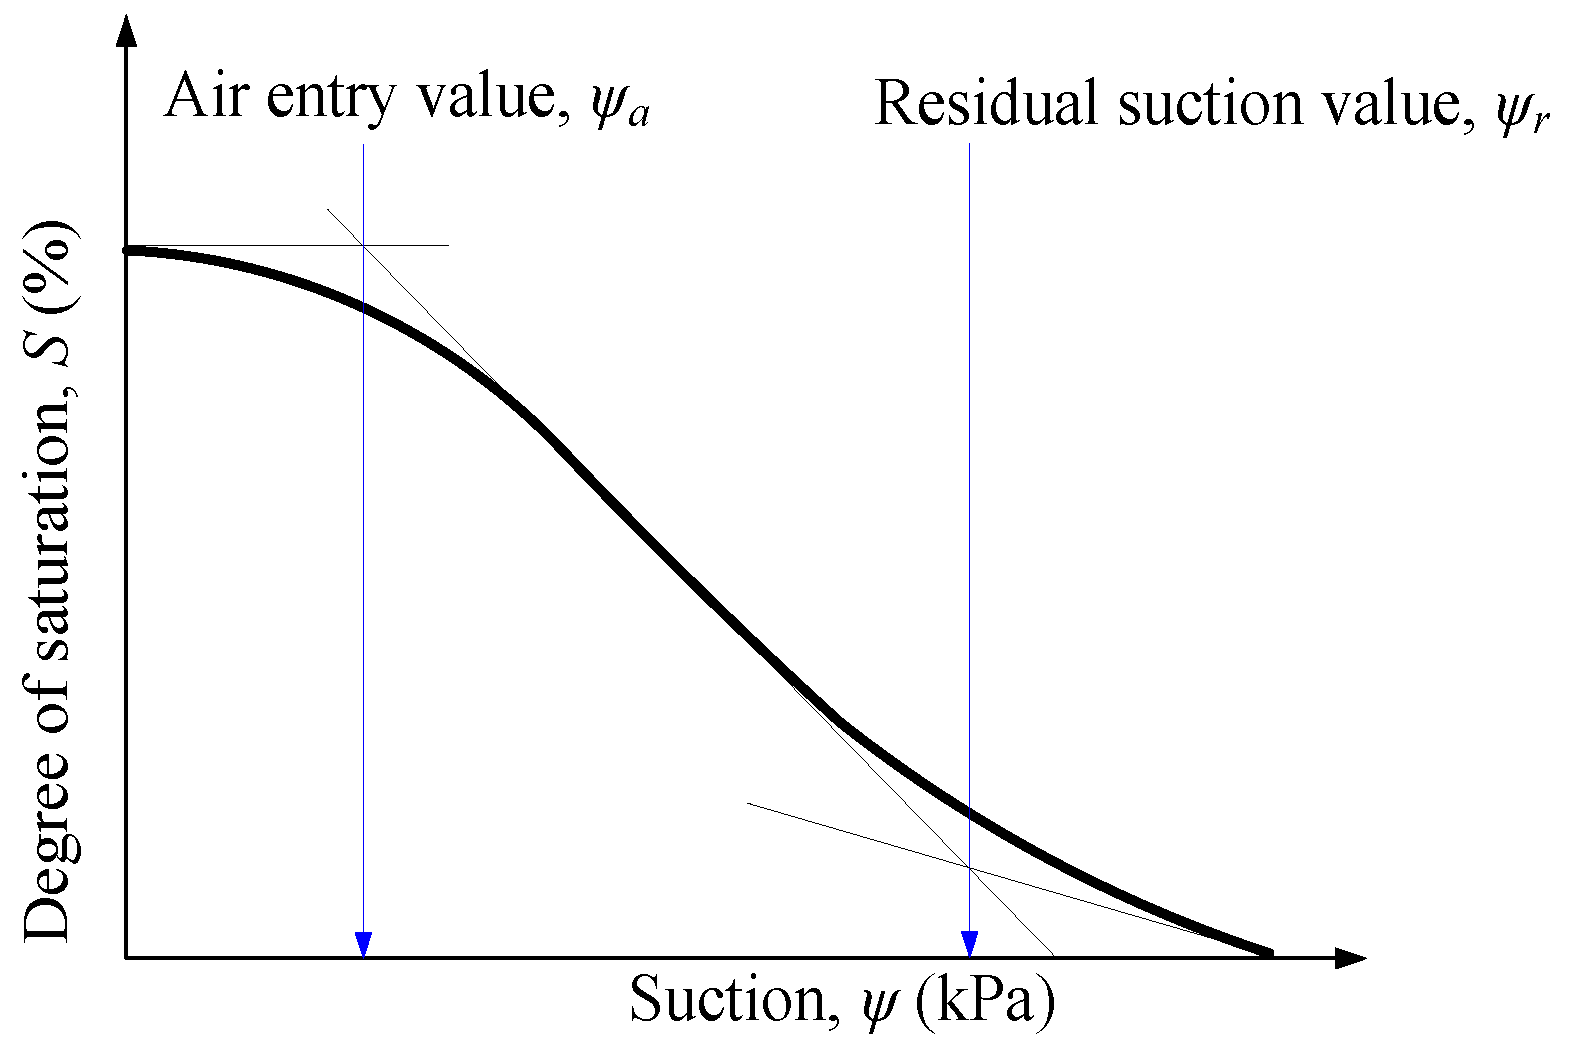
Figure 5 shows the soil–water characteristic curve (SWCC) of colloidal-silica-cemented sand. Several fitting formulas for the SWCC have been developed in the literature, among which the [59] formula is now widely used. Furthermore, based on microscale mechanisms, different types of SWCC models have been developed by distinguishing between the adsorption and capillary components of saturation [50,60,61,62,63,64]. Figure 6 shows a schematic view of obtaining the air-entry value ψa and the residual suction value ψr from the SWCC. For the colloidal-silica-cemented sand in this teaching case, ψa = 31 kPa and ψr = 691 kPa, and the degree of saturation corresponding to ψr is Sr = 18.6%. Instructors can guide students to read these key parameters from the SWCC curve and discuss their influence on unsaturated strength.

2.5.2. Two Major Teaching Highlights of Strength Characteristics

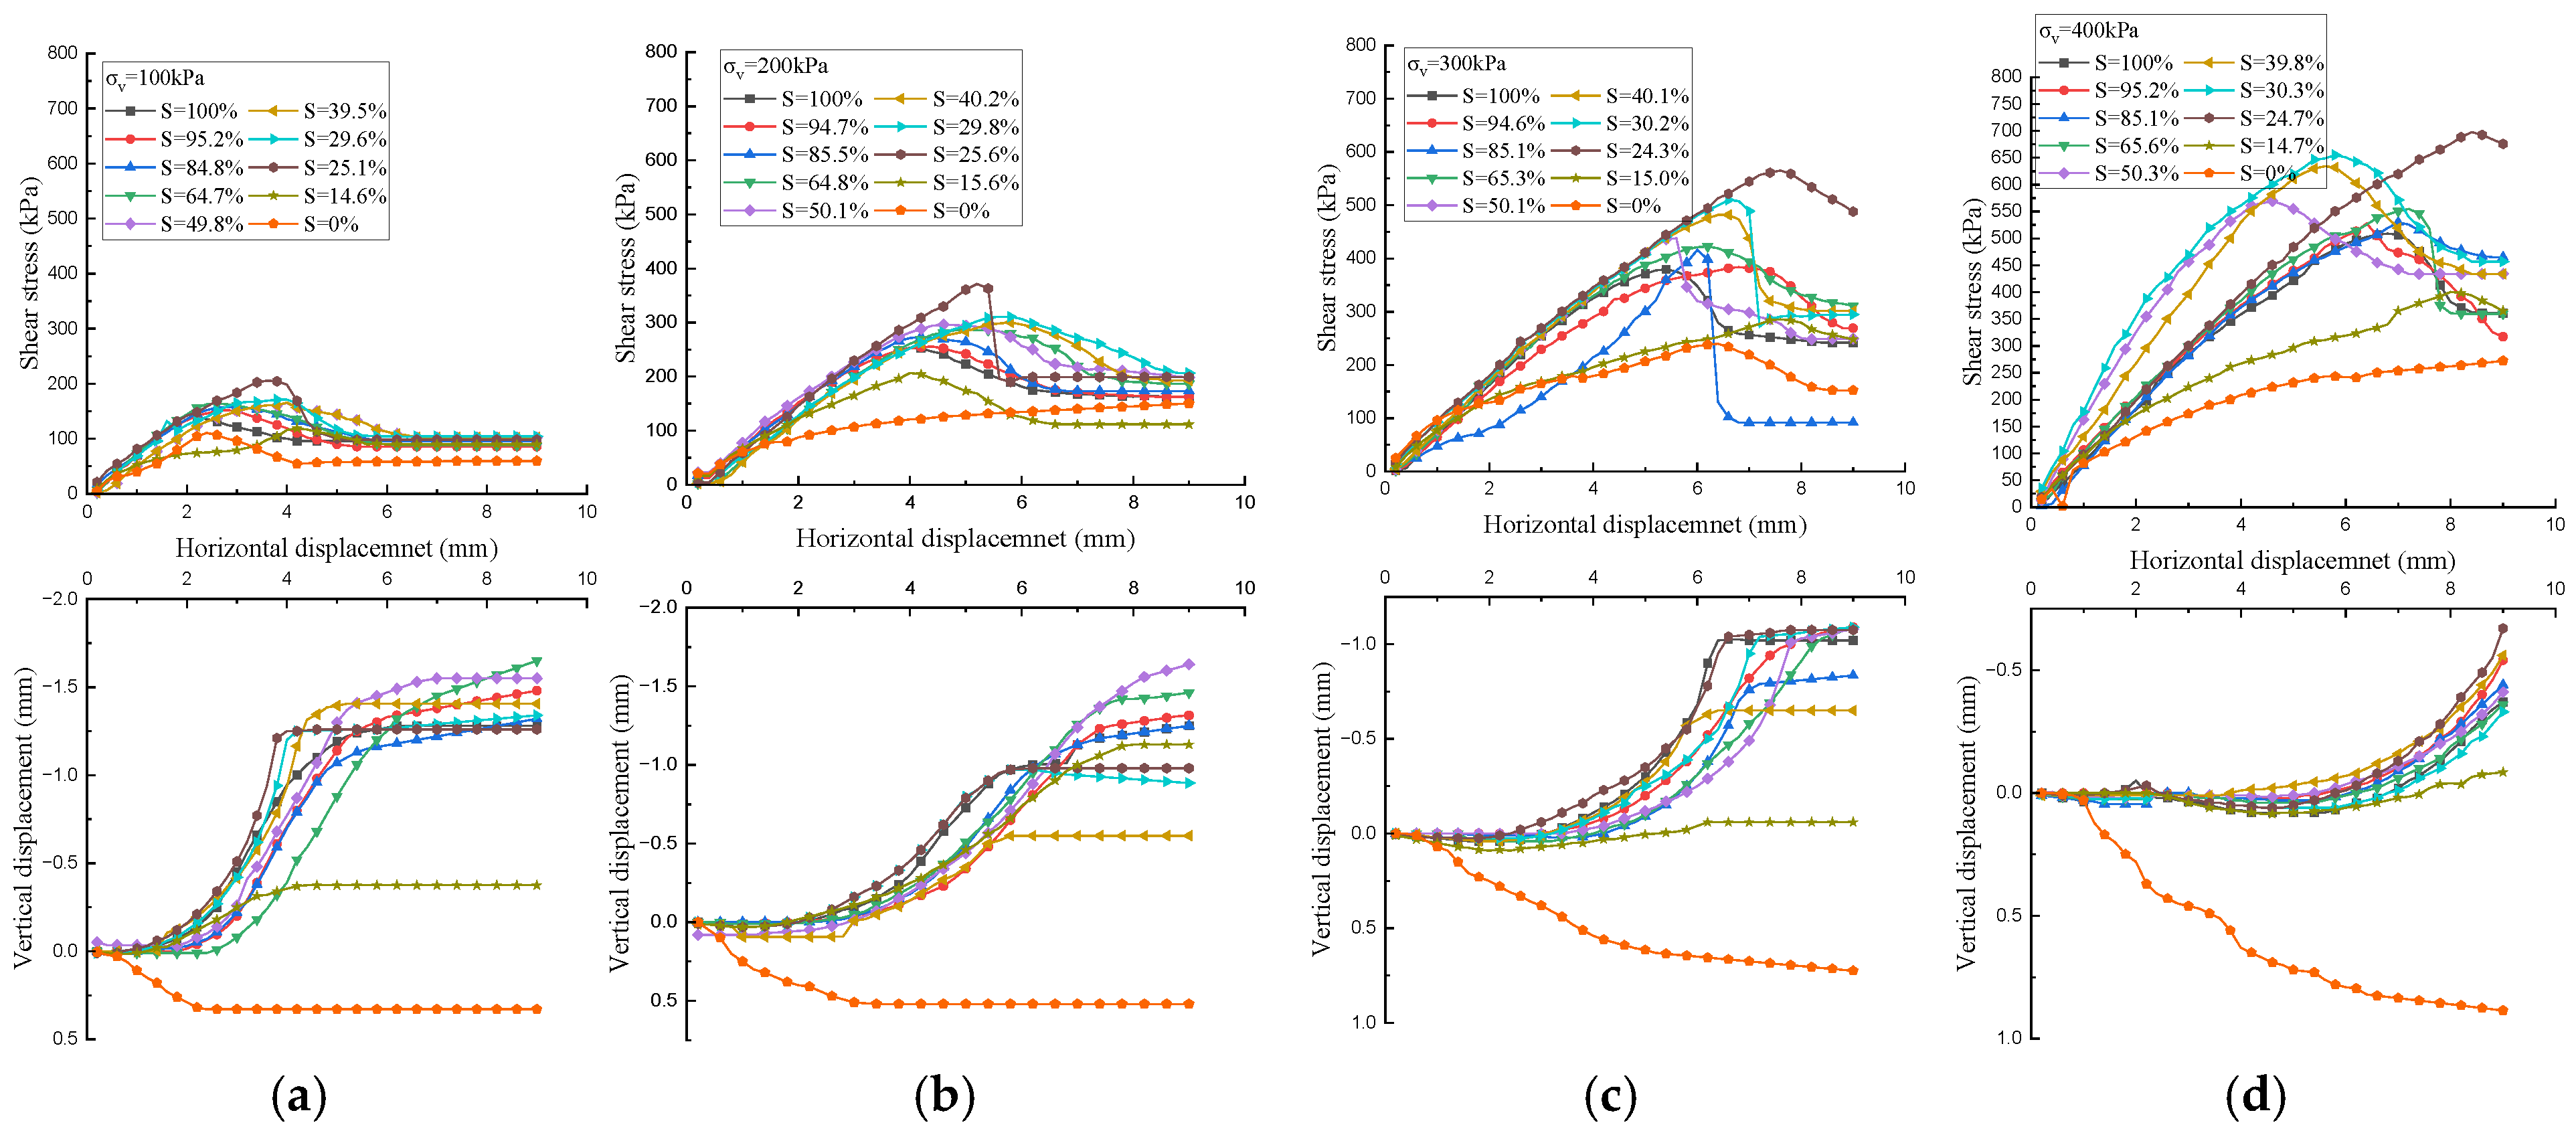
Figure 7 shows the curves of shear stress versus horizontal displacement at different degrees of saturation and under different vertical stresses. It can be observed that as the vertical stress increases, the shear stress increases; as the degree of saturation decreases, the shear stress first increases and then decreases. Figure 7 also shows the vertical displacement behavior: when the degree of saturation S > 0%, the specimens first contract and then dilate; however, when S = 0%, only contraction is observed. Instructors can guide students to discuss the mechanisms underlying this phenomenon.
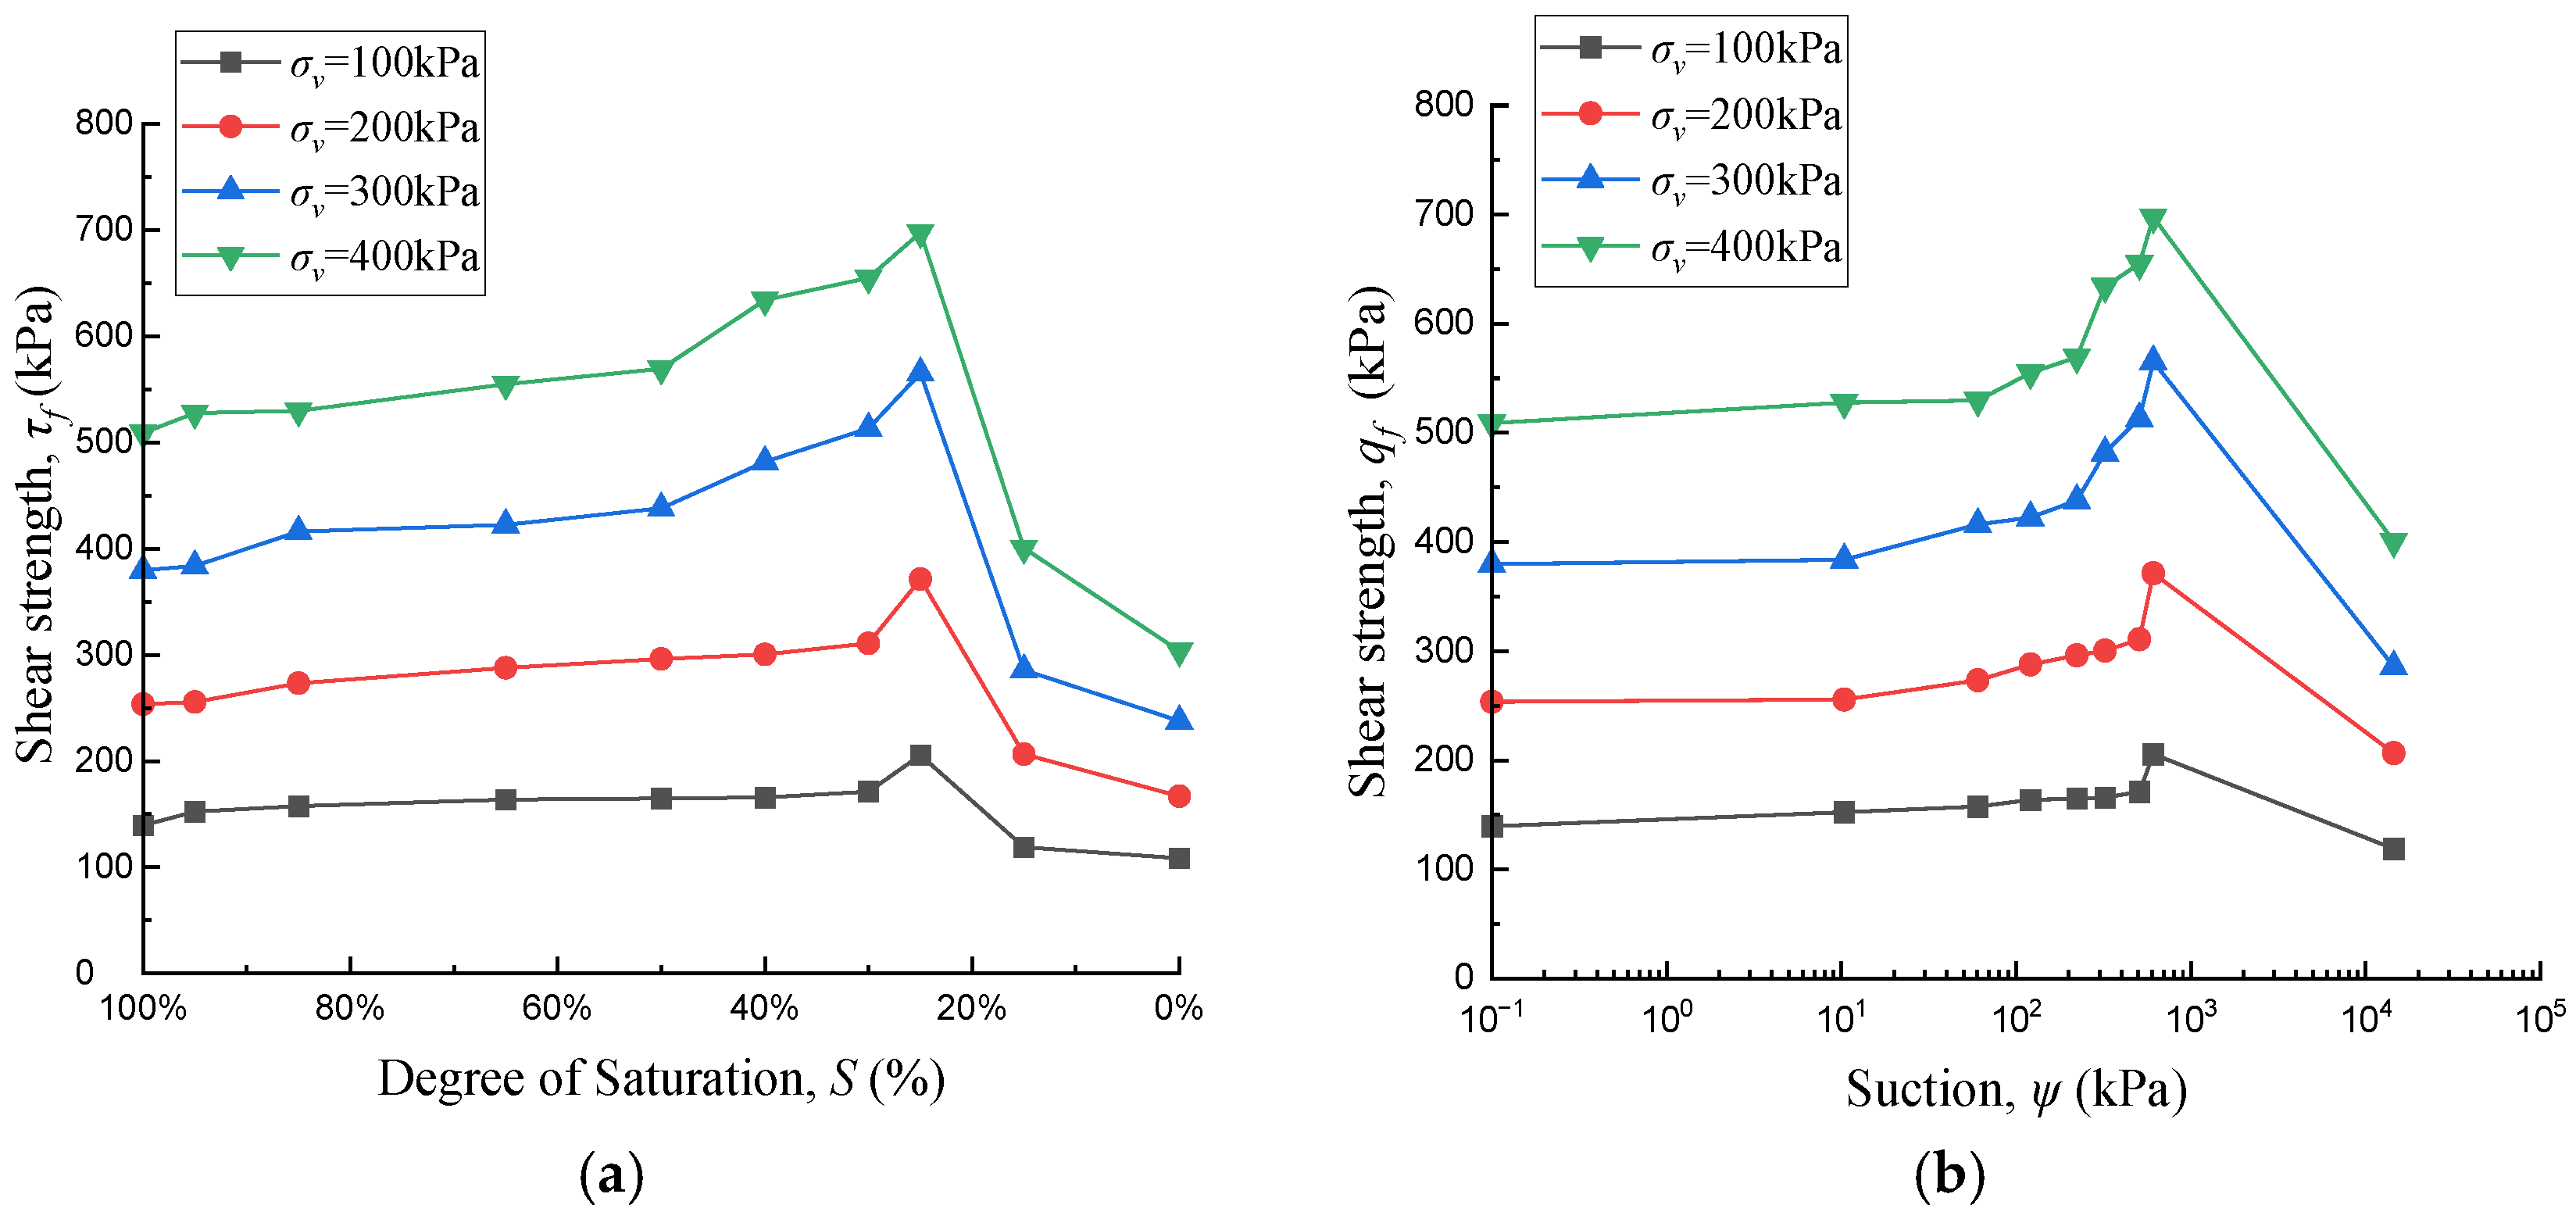
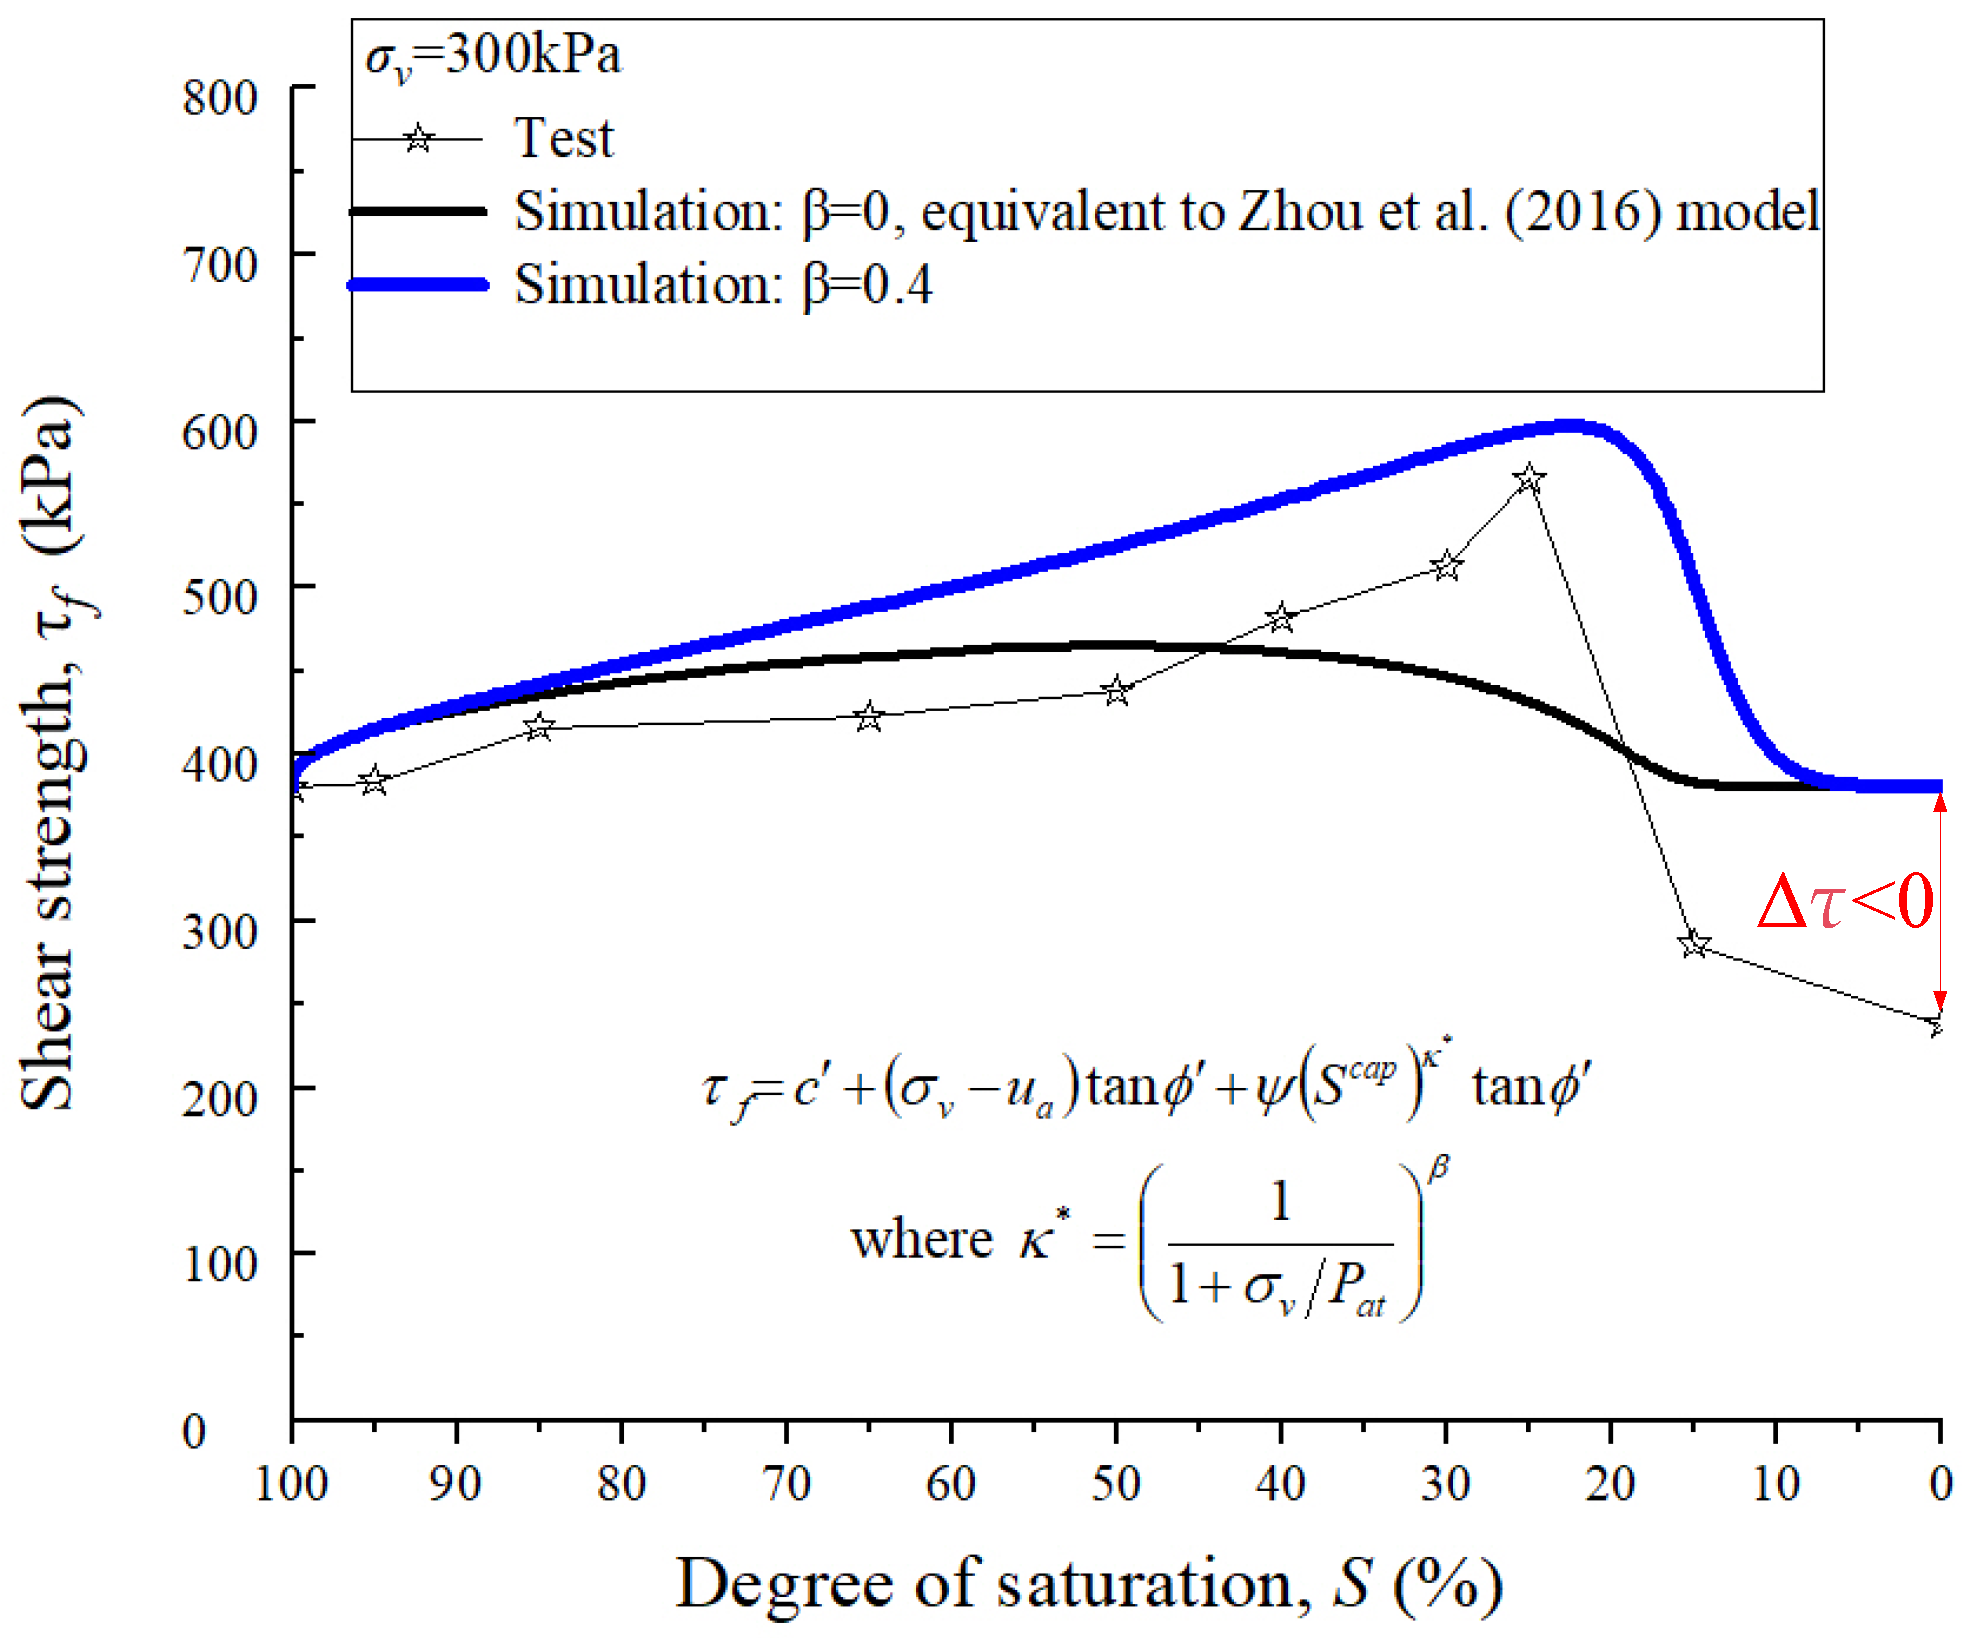
For the core teaching discovery, Figure 8a shows the curves of shear strength versus degree of saturation, and Figure 8b shows the curves of shear strength versus suction. As the degree of saturation decreases (Figure 8a) or as suction increases (Figure 8b), the shear strength first increases and then decreases. It is particularly noteworthy that at degrees of saturation of 15% and 0%, the shear strength is lower than that at the saturated state, a phenomenon that has not been reported in previous literature. In other words, assuming Δτ = shear strength near desiccation minus saturated strength, Δτ is always greater than 0 for unsaturated soils in the previous literature; however, for colloidal-silica-cemented sand, Δτ < 0 at degrees of saturation of 15% and 0%. The underlying mechanism is the shrinkage and cracking of the silica gel between sand particles near desiccation, as discussed in Section 4.2. This counterintuitive phenomenon represents the core value of this teaching case. Instructors can set up a classroom discussion question here: Why does drying lead to a reduction in strength?
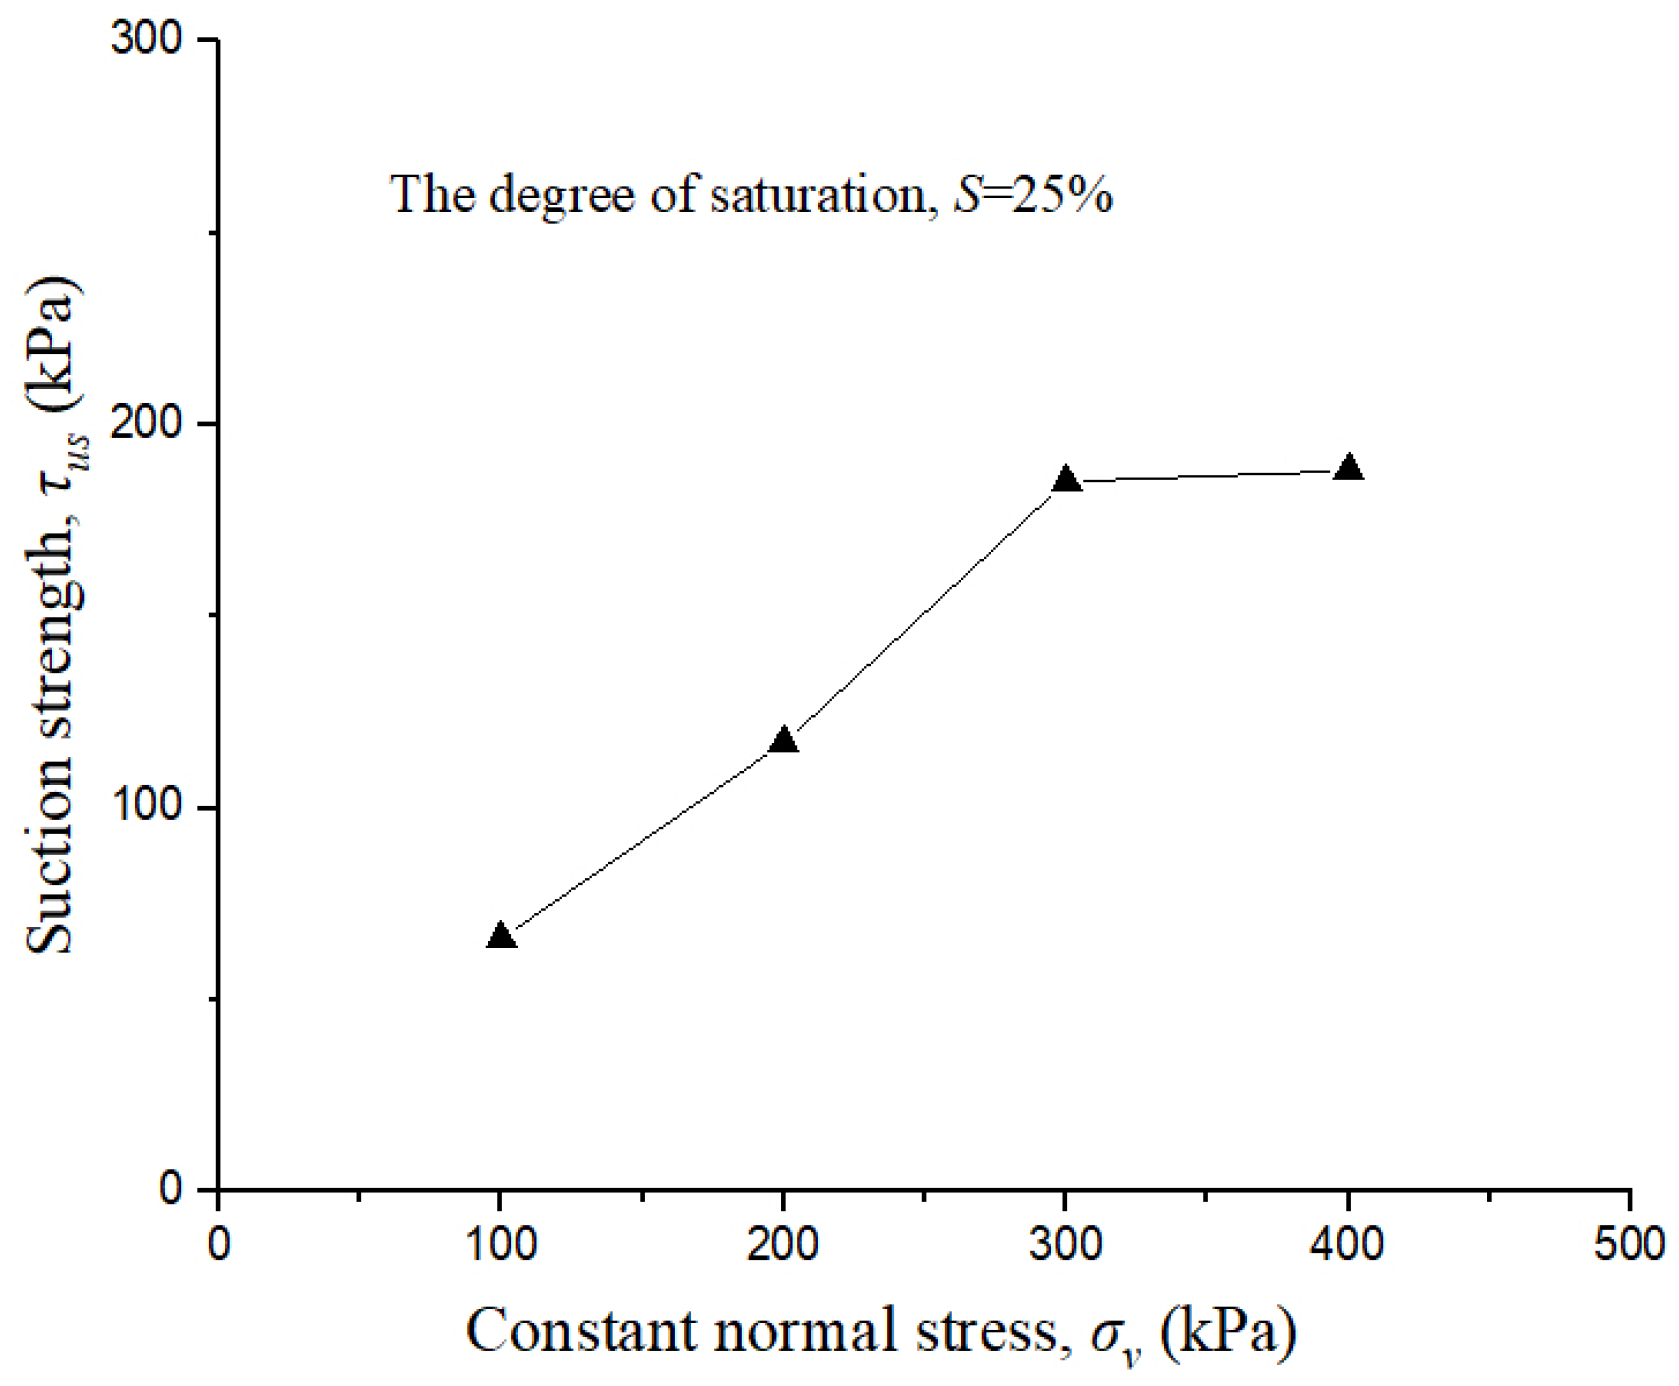
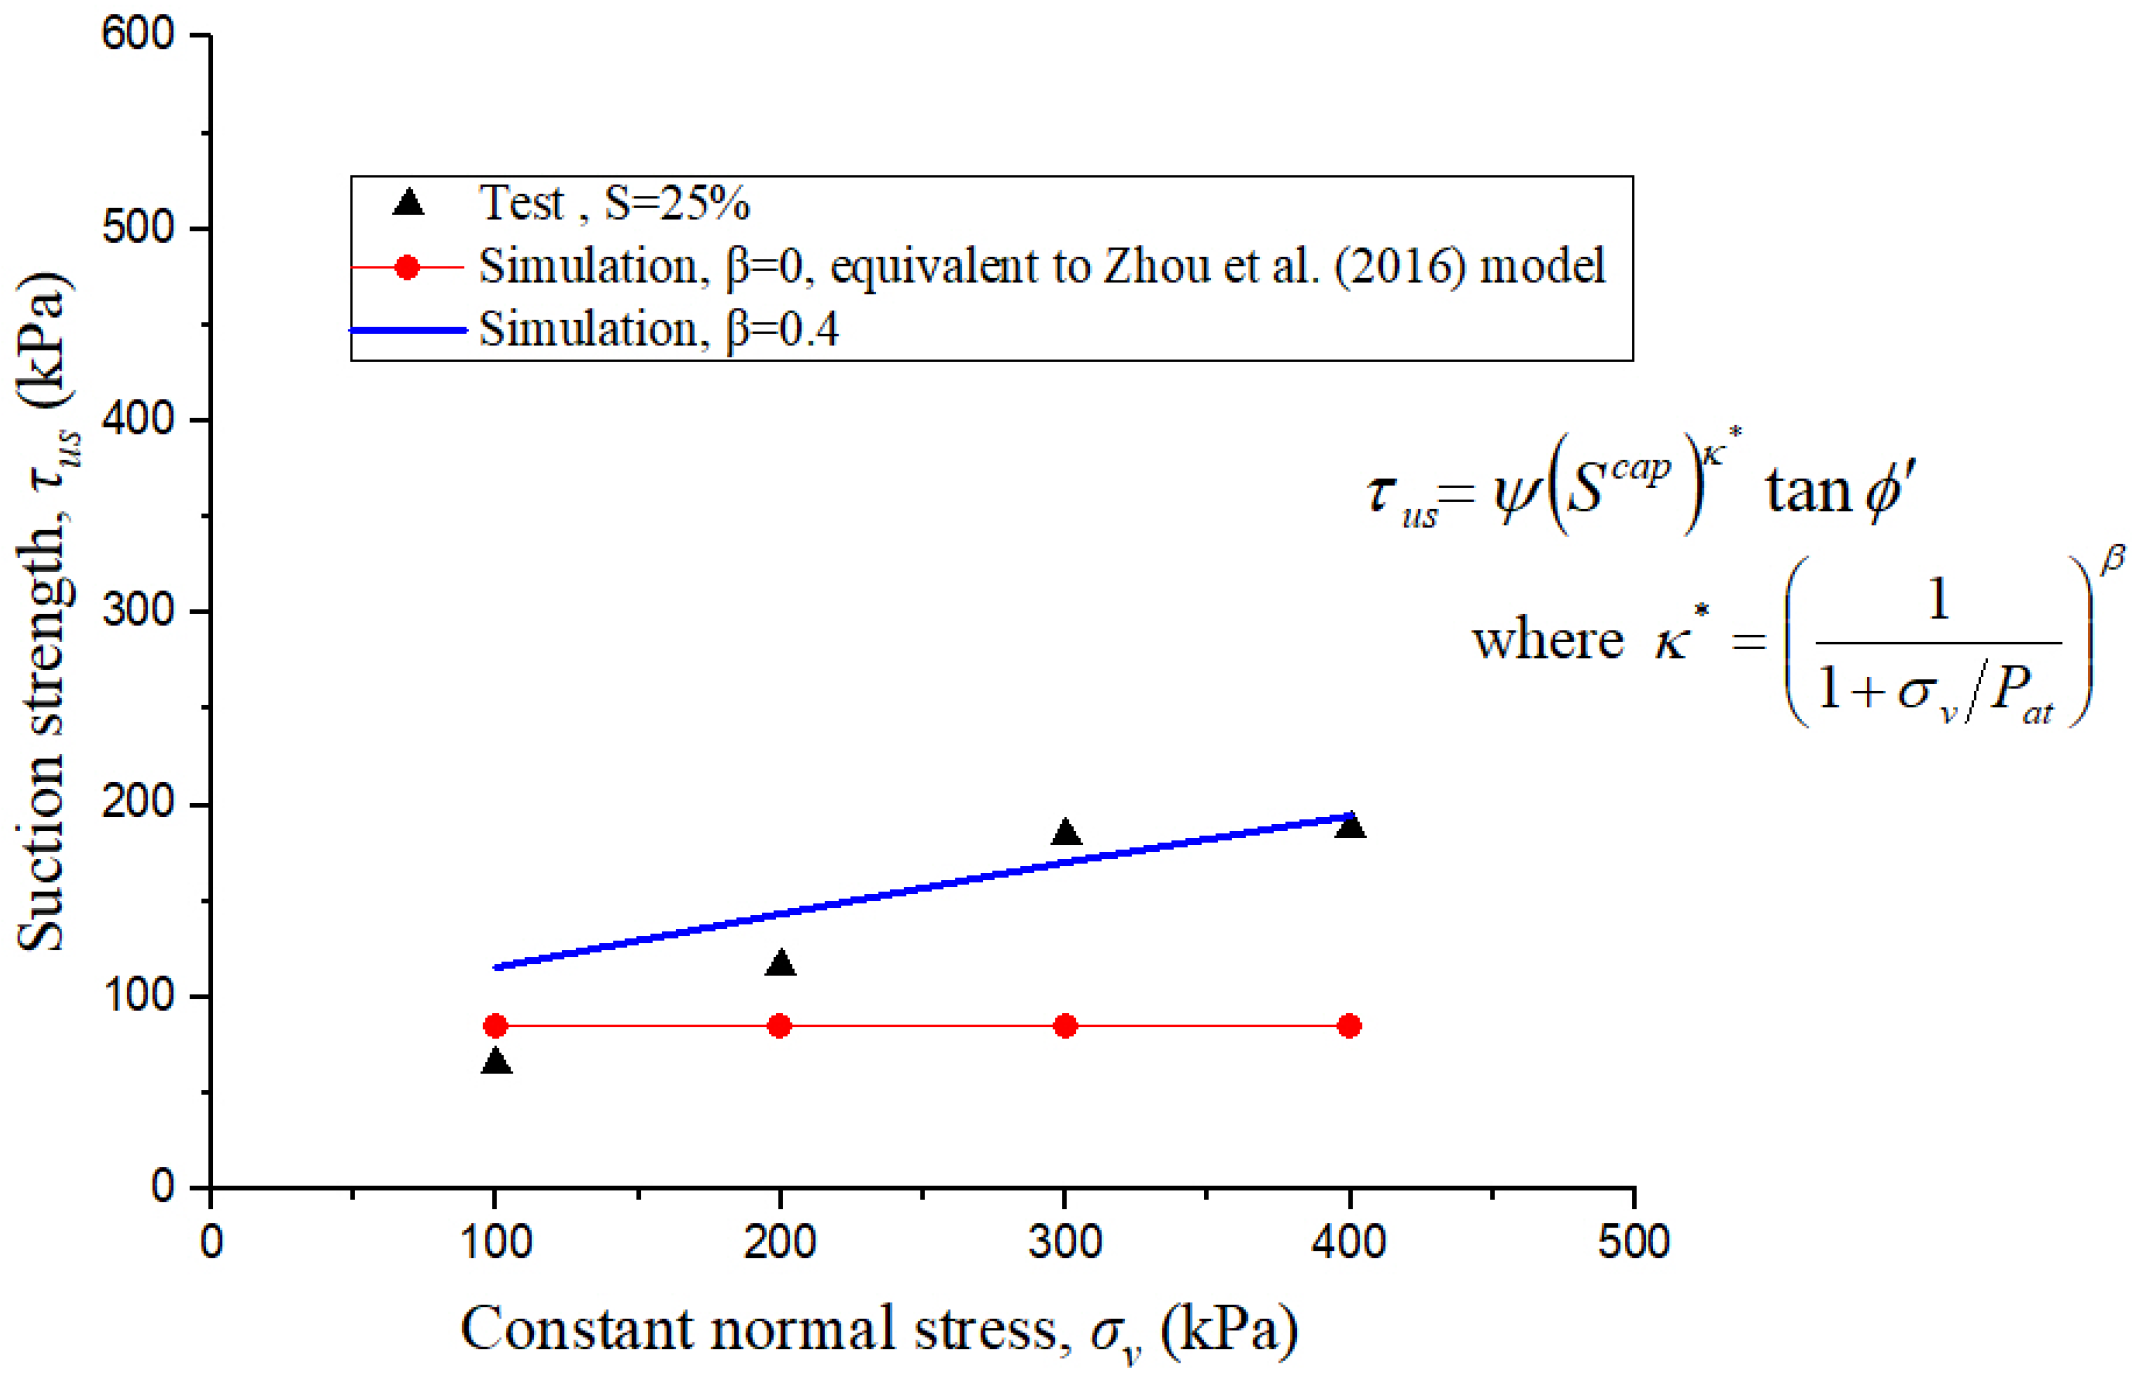
Suction strength is defined as the increment in shear strength from the saturated state to the unsaturated state. Figure 9 shows that the experimentally measured suction strength is normal-stress-dependent, meaning that the suction strength increases with increasing normal stress. This characteristic has not been fully captured by traditional unsaturated strength theories.
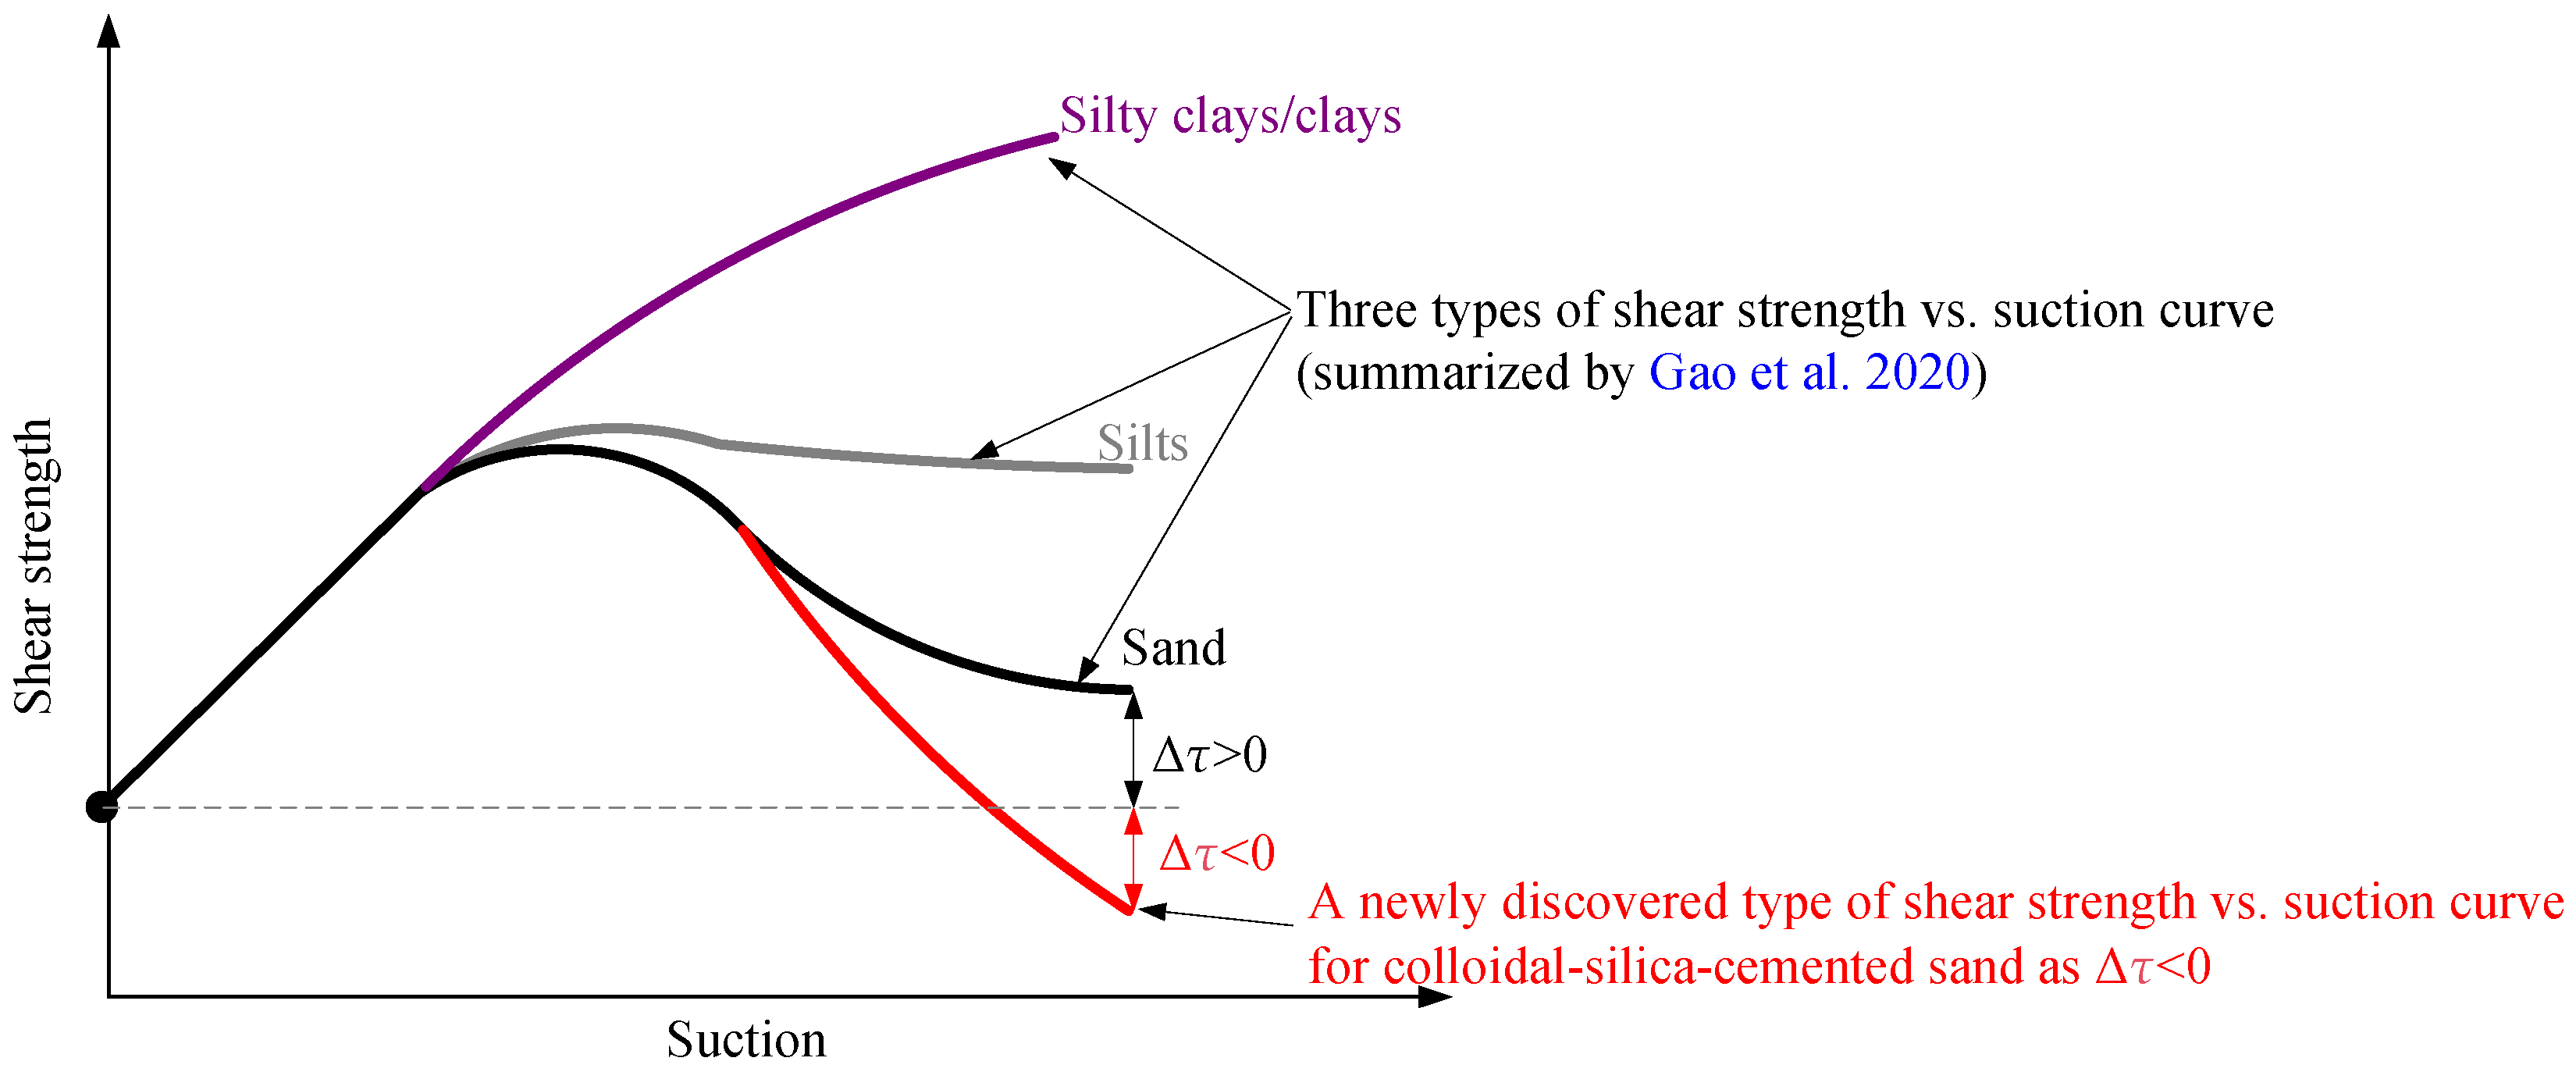
For unsaturated soils, ref. [53] summarized three types of shear strength versus suction curves for different soil types (see Figure 10). All of these curves show that the unsaturated strength is always greater than the saturated strength (i.e., Δτ > 0, see Figure 10). However, the colloidal-silica-cemented sand in this teaching case exhibits a fourth distinct type of shear strength versus suction (or degree of saturation) relationship. The next section attempts to use existing unsaturated models to explain this phenomenon and reveal the limitations of these models, thereby leading to the necessity of developing a new model.

3. Simulation by Previous Models: A Classroom Critical Evaluation

Ref. [65] provided a general expression for the strength of unsaturated soils, which is widely used in textbooks and classroom instruction, as shown in Equation (2):
τ f = c + σ v u a tan ϕ + u a u w tan ϕ b
where τf is the shear strength, c′ is the effective cohesion at saturation, σv is the normal stress, ua is the pore air pressure, uw is the pore water pressure, ϕ′ is the effective friction angle at saturation, and ϕb is the angle of shear strength with respect to suction.
The matric suction ψ and suction strength τus are shown in Equations (3) and (4), respectively:
ψ = u a u w
τ u s = ψ tan ϕ b
Substituting Equations (3) and (4) into Equation (2) yields the following:
τ f = c + σ v u a tan ϕ + τ u s
where c′ + (σnua)tan ϕ′ denotes the saturated component of strength, and τus denotes the suction strength.

3.1. Summary of Existing Suction Strength Formulas (For Classroom Reference)

We summarized 20 formulas of suction strength τus from the existing literature [36,37,38,39,40,41,42,43,44,45,47,48,49,50,52,53,54], as presented in Table 3 for classroom discussion.

3.2. Classroom Discussion: Limitations of Existing Models

It should be noted that all formulas in Table 3 do not incorporate the effect of normal stress on the suction-induced component of shear strength. Therefore, they cannot simulate the normal-stress-dependent characteristic of suction strength τus (e.g., see Figure 9 in Section 2.5.2). This is a critical observation that students should recognize: most classical models treat suction strength as being independent of vertical stress.
The formulas of suction strength τus can be divided into two categories based on their trend with increasing suction (see Table 3) as follows.
Category 1: Suction strength τus increases monotonically with matric suction.
Category 2: Suction strength τus increases first and then decreases with increasing suction.
Table 4 lists the common parameters of existing models, while several specific parameters of the models are presented in Table 5.
Since the suction strength of colloidal-silica-cemented sand increases first and then decreases with increasing suction (as shown in Figure 8b), the five formulas in Category 1 that exhibit monotonic increase (i.e., Khalili & Khabbaz 1998 [39]; Tekinsoy et al. 2004 [42]; Xu 2004 [43]; Gao et al. 2020 [53] Equation (I); Gao et al. 2020 Equation [53] (II)) are not considered suitable for simulation here and are thus excluded from the following comparison.
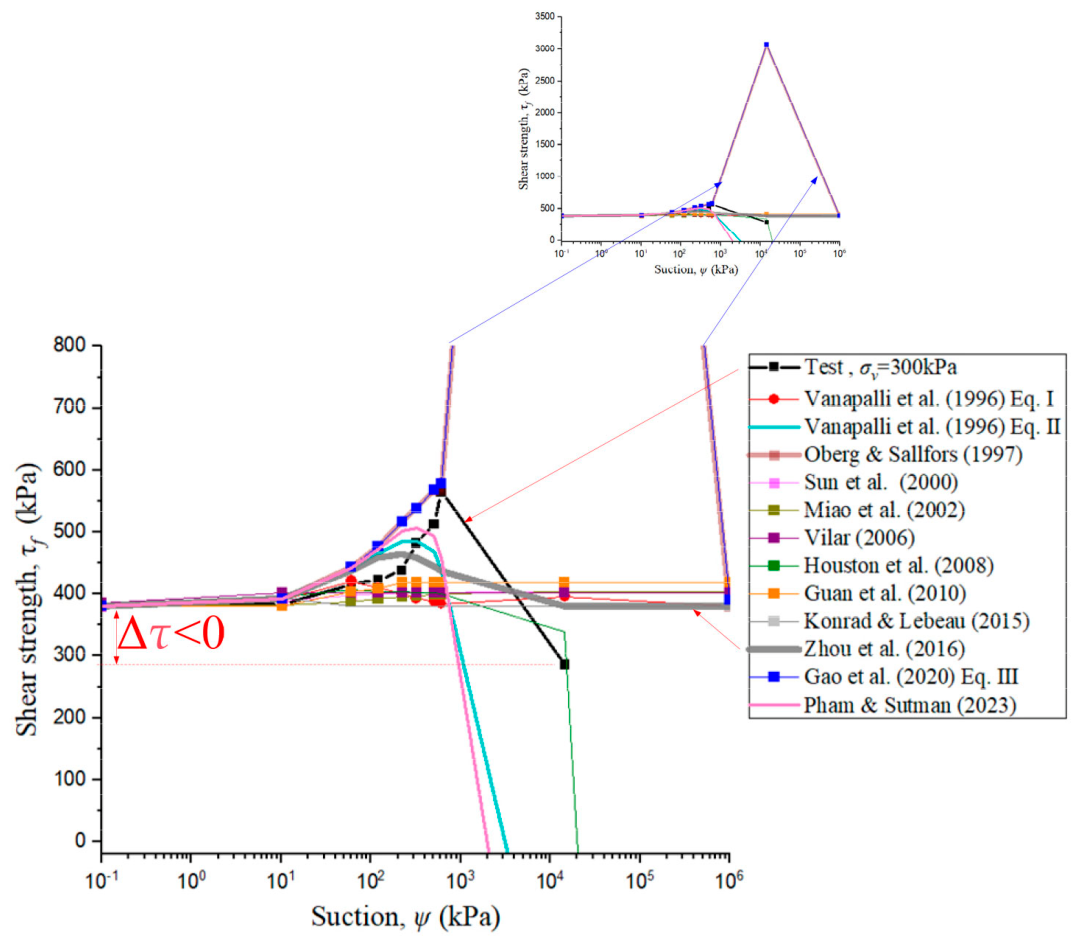
Furthermore, for colloidal-silica-cemented sand, the term (SSr)κ in the formula by [37] yields an imaginary number when S < Sr, making it mathematically invalid. The remaining model [48] was excluded because the calculated shear strength from its equation yields negative values, which are physically meaningless. Therefore, this model is not plotted in the figure. Ref. [52] model requires statistical analysis of micro contact angles in pores, which is beyond the scope of typical classroom exercises. Therefore, in Figure 11, the remaining 12 formulas are plotted for comparison.

3.3. Teaching Analysis: Comparison of Model Simulations

As shown in Figure 11, all models provide reasonably good simulations in the low suction stage (ψ < 100 kPa). This indicates that the fundamental mechanisms of suction strength are well captured by existing theories at low suction ranges. However, as the matric suction increases beyond 100 kPa, the errors become progressively larger, and the following four distinct types of deviation can be observed.
(1)
Underestimation in the high suction stage: Simulations from formulas by [36,40,41,44,47,49] tend to be much smaller than the experimental data in the high suction stage. These models fail to capture the sustained strength contribution at high suctions.
(2)
Unrealistic negative strength predictions: Some models predict that unsaturated strength can be lower than saturated strength, but the strength quickly becomes negative as suction increases, which is physically unrealistic. This occurs in [36,45,54] Vanapalli et al. (1996) Equation (II), Houston et al. (2008), and Pham & Sutman (2023). Students should recognize that negative strength is meaningless in this context.
(3)
Overestimation in the high suction stage: Formulas by [38,53] produce strength values that rise too steeply in the high suction stage. A sub-window in Figure 11 is used to show these deviations clearly.
(4)
Closest but still inadequate: The simulation by [50] is the closest to the experimental data among all models. However, when the degree of saturation approaches zero (complete desiccation), the predicted shear strength is not lower than that at the saturated state. This is inconsistent with the experimental data shown in Figure 8a where Δτ < 0 at S = 15% and 0%.

3.4. Classroom Summary: The Need for a New Model

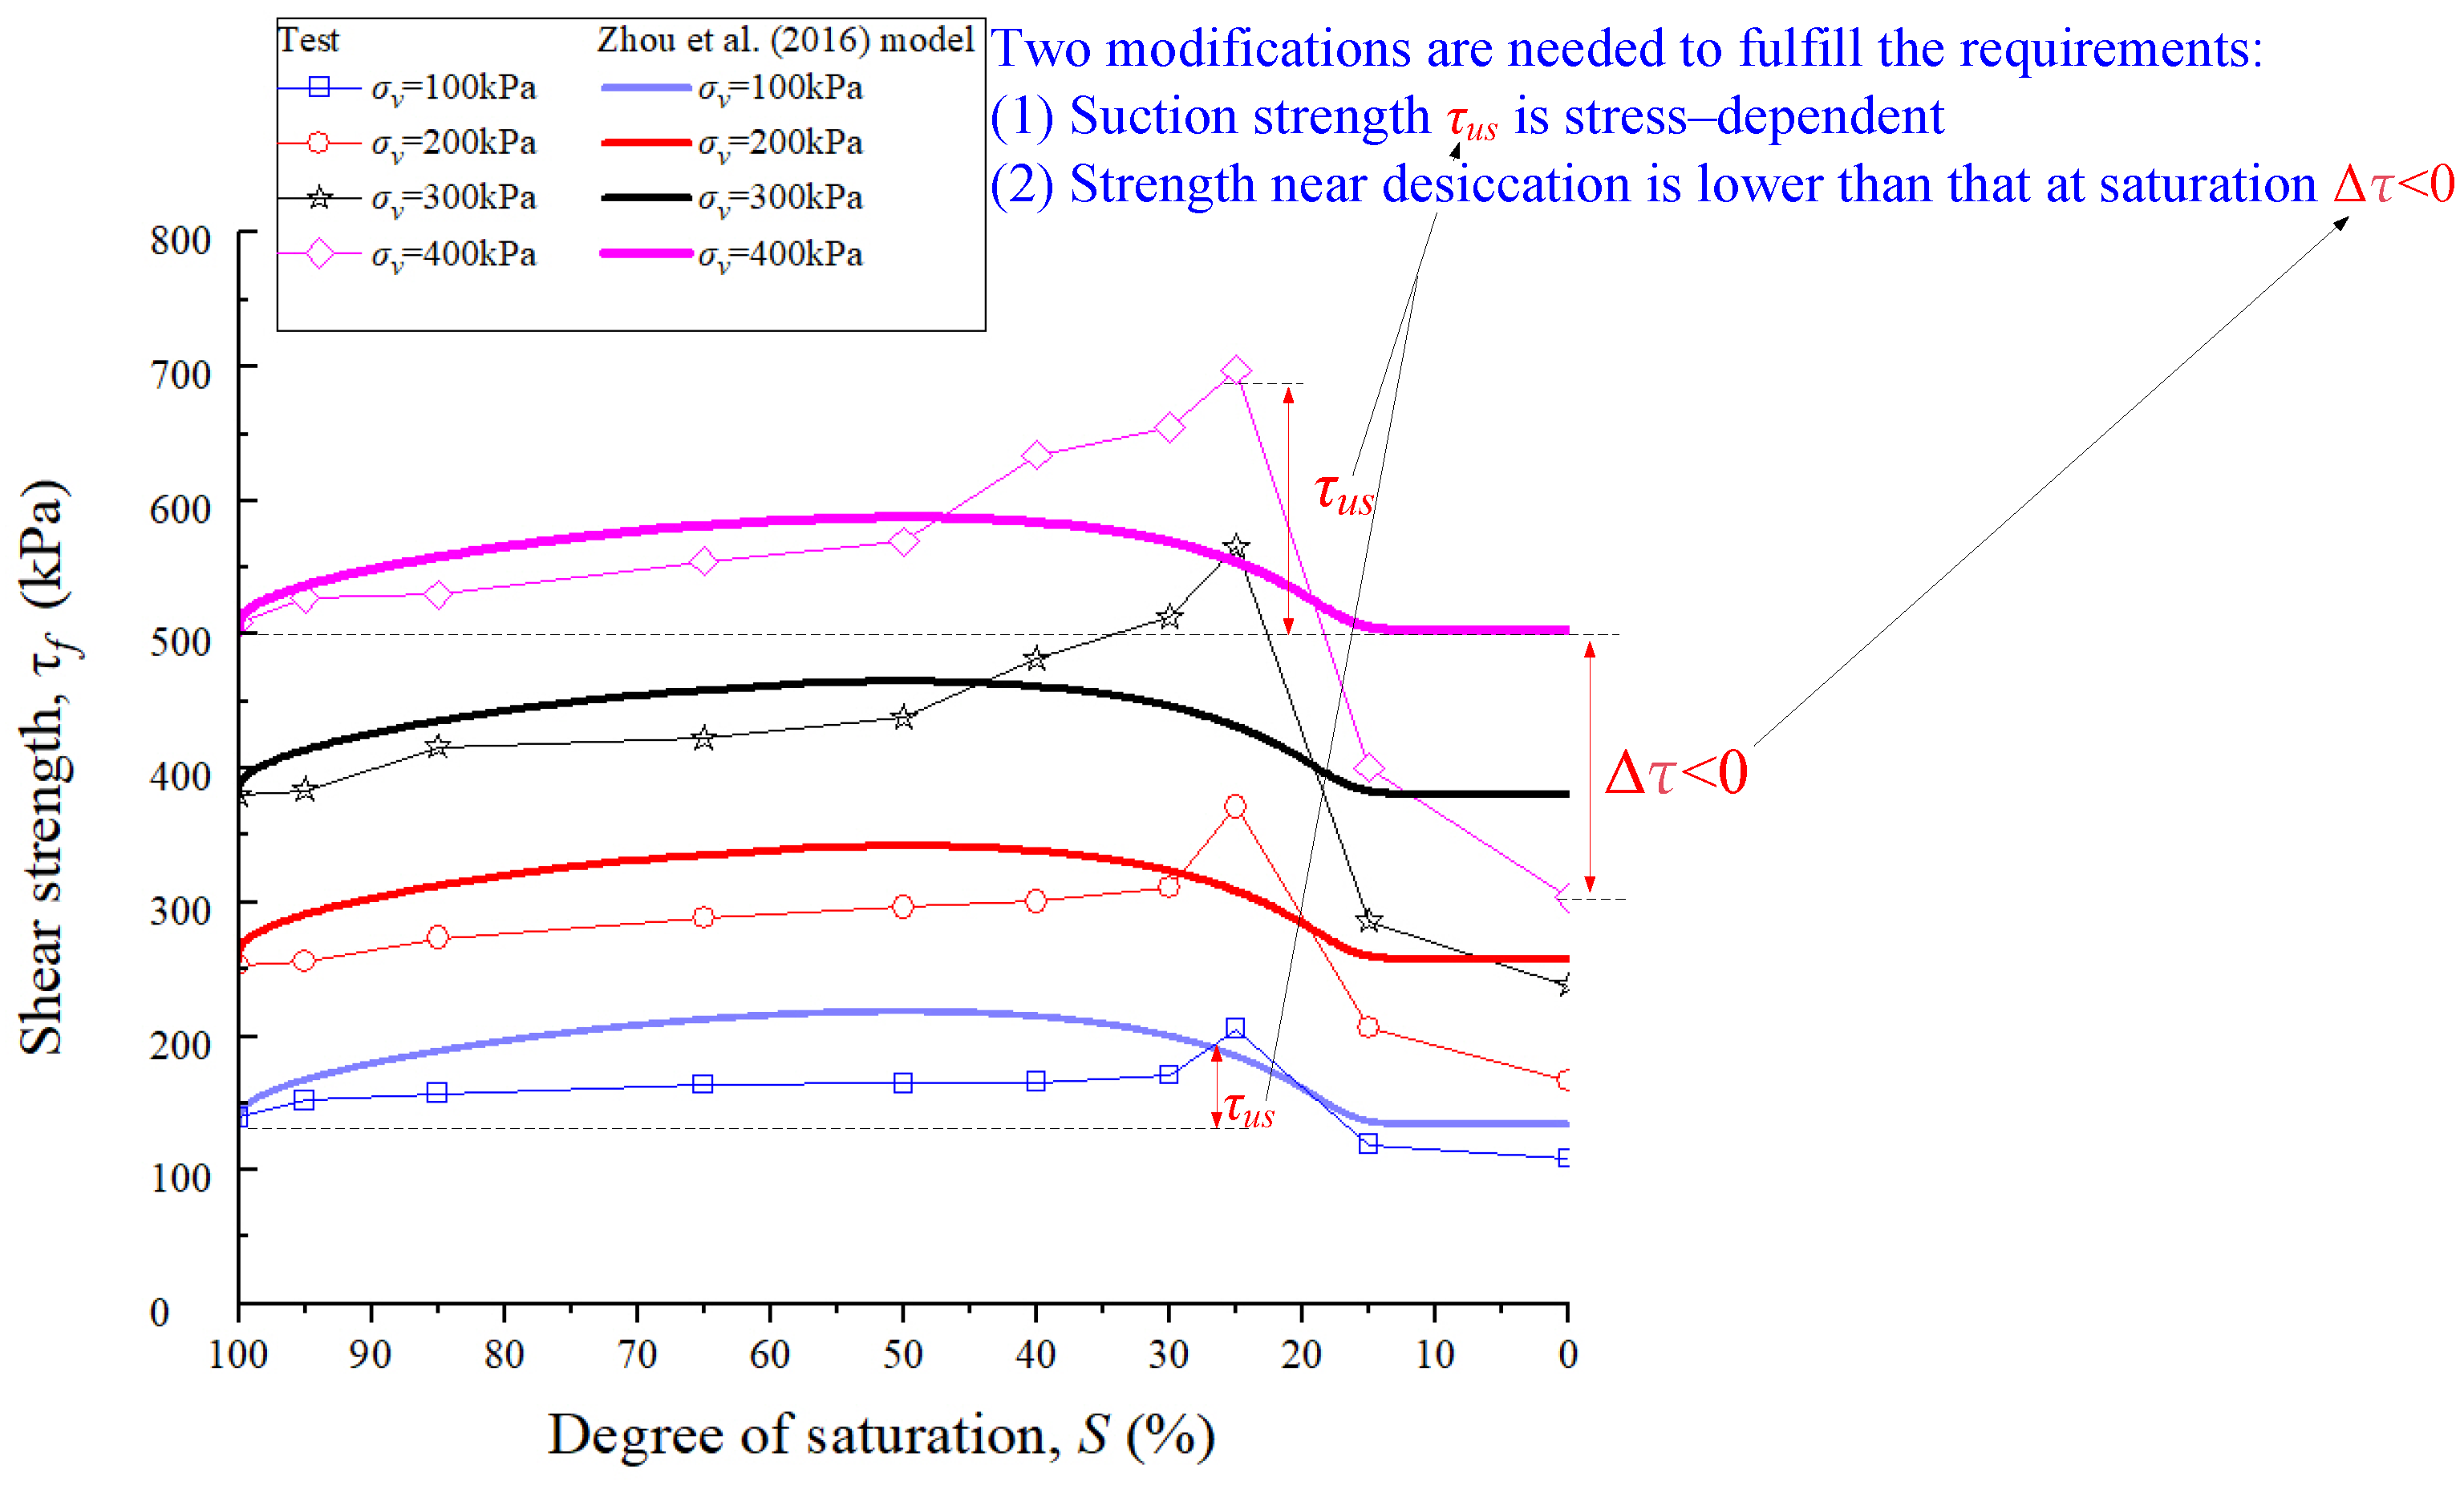
Let Δτ = strength near desiccation minus saturated strength (see Figure 11). For all 20 existing models reviewed, Δτ ≥ 0, meaning they cannot predict the phenomenon where strength near desiccation falls below the saturated strength. Therefore, in the next section, we aim to modify the [50] model—which provides the closest overall fit—to simulate the case when Δτ < 0, while also incorporating the normal-stress-dependent characteristic of suction strength that is missing from all existing models. This step-by-step modification process is presented as a classroom exercise in physically inspired model development.

4. Model Establishment: A Step-by-Step Classroom Development

In this section, we guide students through two necessary improvements to the [50] model. First, we identify the limitations of the existing model by comparing its predictions with the experimental data. Then, we modify the capillary condensation variable and introduce the crack size effect, enabling the model to capture the unsaturated shear strength behavior of colloidal-silica-cemented sand. This step-by-step approach helps students to understand how physical mechanisms translate into mathematical formulations.
Figure 12 presents a side-by-side comparison of the [50] model simulations with experimental data. This figure serves as a core teaching tool to help students visualize two critical discrepancies as follows.
(1)
Missing normal-stress dependence: The experimental data clearly show that suction strength τu increases with increasing normal stress σv (i.e., τu is normal-stress-dependent). However, as shown in Figure 12, the simulated τu from the [50] model does not change with σv. This indicates that the model fails to capture the coupling between suction strength and confining stress.
(2)
Inability to predict strength reversal near desiccation: The experimental data show that Δτ < 0 (where Δτ = strength near desiccation minus saturated strength) at degrees of saturation of 15% and 0%. In other words, the sand becomes weaker when completely dry than when saturated. However, the simulated Δτ from the [50] model remains ≥0 (see Figure 12), meaning it cannot predict this strength reversal.
The above two aspects can be improved from the perspectives of capillary condensation variable and crack size effect, as shown in the following sections.

4.1. Improvement 1: From Physical Mechanism (Capillary Condensation) to Model Modifications

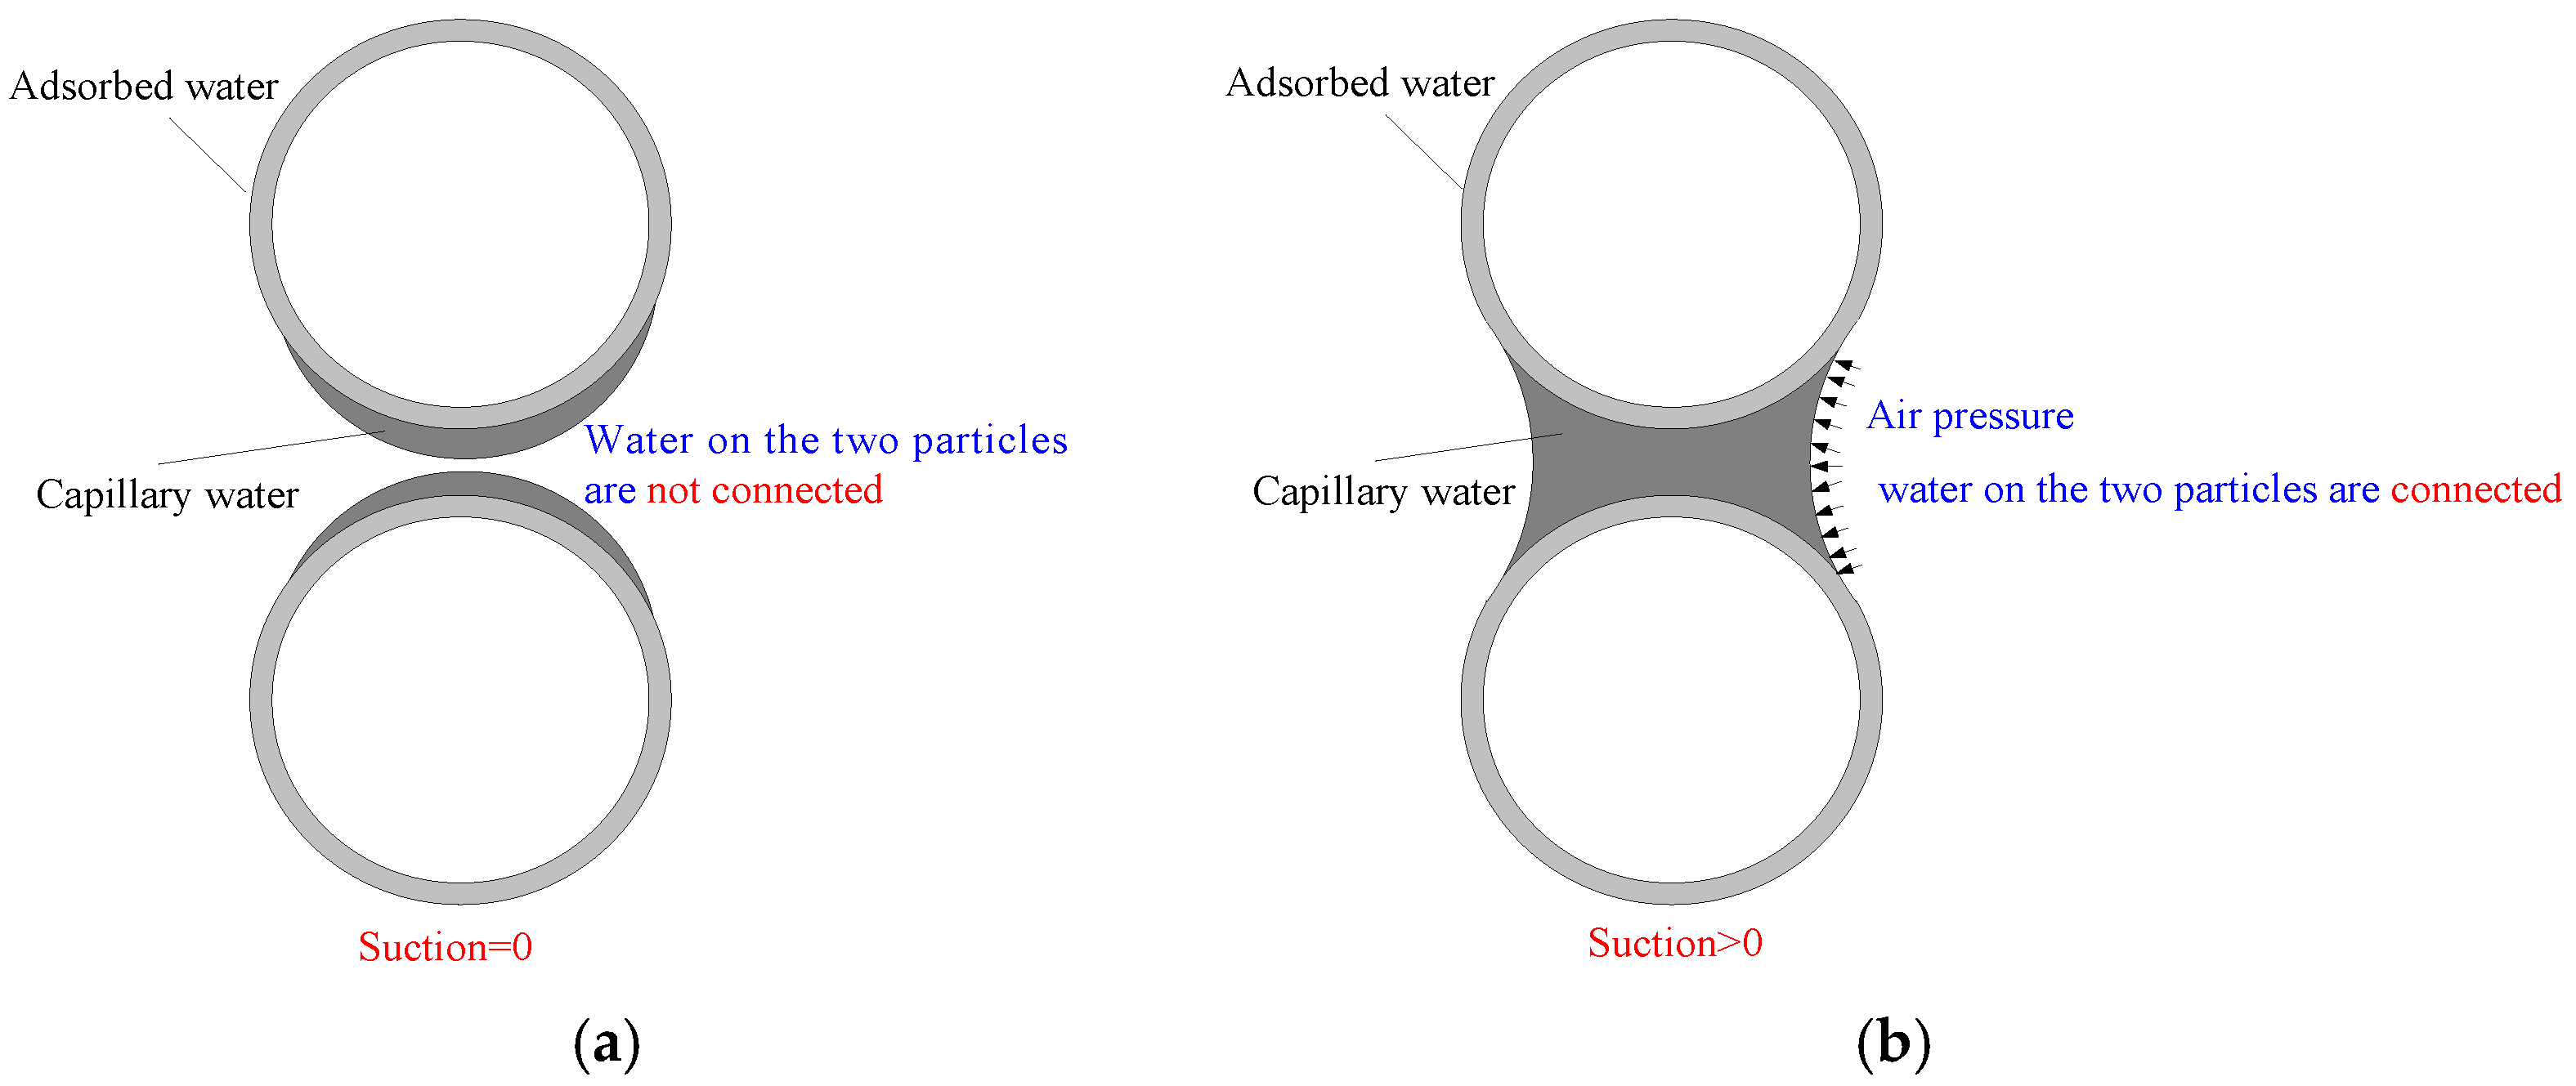
There are two types of water between solid particles [66], as shown in Figure 13: (1) one is the adsorbed water that adheres closely to particles—this adsorbed water is very thin and does not affect matric suction; (2) the other is capillary water, which is capable of generating matric suction. But it should be noted that if the capillary water on two particles is not joined together, as shown in Figure 13a, pore pressure and water surface tension cannot work together to generate suction. Only when the capillary water on two particles is connected, does suction exist (see Figure 13b). So, there is a probability variable Pcc (0 ≤ Pcc ≤ 1) introduced by [50]. This Pcc represents the proportion of capillary water which bridges two particles together to form suction. This Pcc can be considered as the capillary condensation probability. For the physical mechanism for the positive correlation between suction resistance and normal stress, with the increase of normal stress, the sand particles are pressed more tightly together, which notably enlarges the effective contact area between adjacent particles. Meanwhile, the geometry of the intergranular pores and water menisci is altered accordingly. Such structural change further affects the probability of capillary condensation within the pore menisci. Consequently, the overall suction resistance rises with increasing normal stress. From the microstructural perspective, the above mechanism accounts well for the increased probability of capillary condensation.
Let S be the degree of saturation, Scap be the capillary part of S, and let Sads be the adsorbed part of S—[50] proposed Equation (6) based on the work of [67,68]; they also used Equation (7) from [69] and proposed Equation (8).
S = S c a p + S a d s
S c a p = 1 S a d s C ψ
S a d s = α A ψ 1 P c c
where
A ψ = 1 In ψ / 1 In ψ d
C ψ = 1 2 erfc In ψ / ψ m 2 ζ
And where α, ζ, ψm are three parameters, ψd = 106 kPa, erfc() denotes the complementary error function.
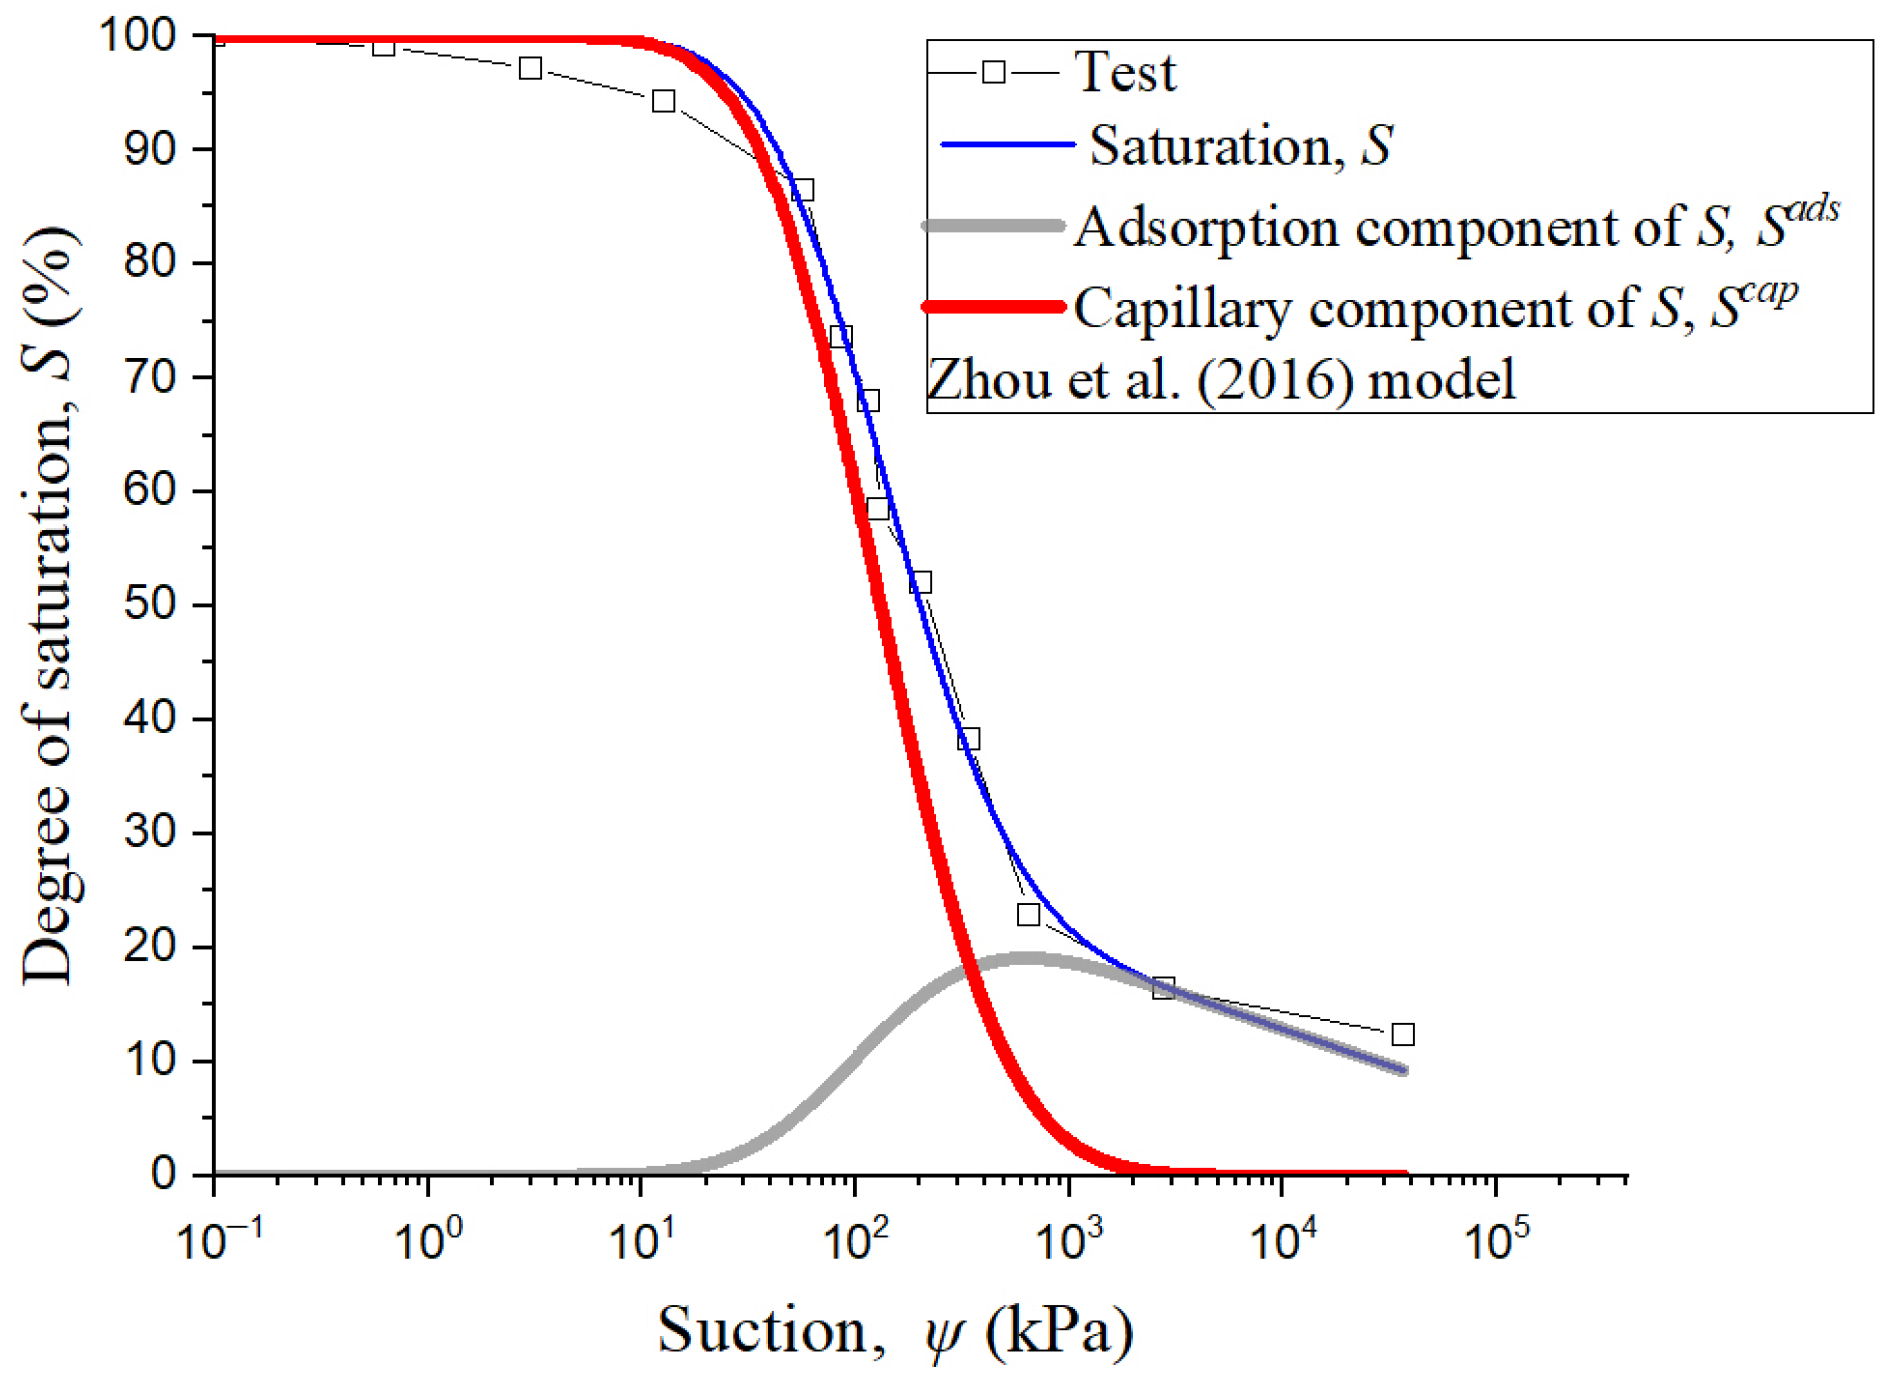
In Equations (6)–(8), the three equations have four unknown variables, i.e., S, Scap, Sads, and Pcc. It should be noted that the four unknown variables cannot be solved based on the three equations. For simplicity, ref. [50] proposed that Pcc = Scap, then using Equations (6)–(8), S, Scap, and Sads can be solved and plotted in Figure 14. The expression of Scap in the [50] model is shown in Equation (11). Then this Scap is used in Equation (12) to calculate the suction strength:
S c a p = C ψ α C ψ A ψ 1 α C ψ A ψ
τ u s = ψ S c a p tan ϕ
From the above process, it can be seen that the variable Pcc of capillary condensation probability can be modified to improve the simulation of suction strength τus. That is, Pcc affects the capillary part of saturation, and this capillary part of saturation affects the suction strength τus.
From the perspective of a physical mechanism, the distance between two particles may become smaller with increasing normal stress, which leads to a greater probability that the capillary water on the two particles bridge together to form suction. Therefore, there exists a physical mechanism that the capillary condensation probability, Pcc, can be normal-stress-dependent. But it is difficult to determine Pcc directly from a microscopic statistical perspective. So, we resort to the intermediate variable, the capillary part of saturation, to give the form of Pcc. Inspired by [36] Equation (I) in Table 3, using S to the power of κ can enhance the strength, so here we introduce a variable κ* to modify the capillary part of saturation. Letting the modified capillary part of saturation be Scap*, we propose Equation (13) to express Scap*:
S c a p * = S c a p κ *
Substituting Scap with Scap* in Equation (7), combined with Equations (8), (11) and (13), Pcc can be expressed by Equation (14):
P c c = 1 1 α A ψ 1 1 C ψ C ψ α C ψ A ψ 1 α C ψ A ψ κ *
Here, κ* is a normal-stress-dependent variable, which leads to the normal-stress-dependent characteristic of Pcc in Equation (14). Substituting Scap with Scap* in Equation (12) yields the modified suction strength τus, as shown in Equation (15):
τ u s = ψ S c a p * tan ϕ = ψ S c a p κ * tan ϕ
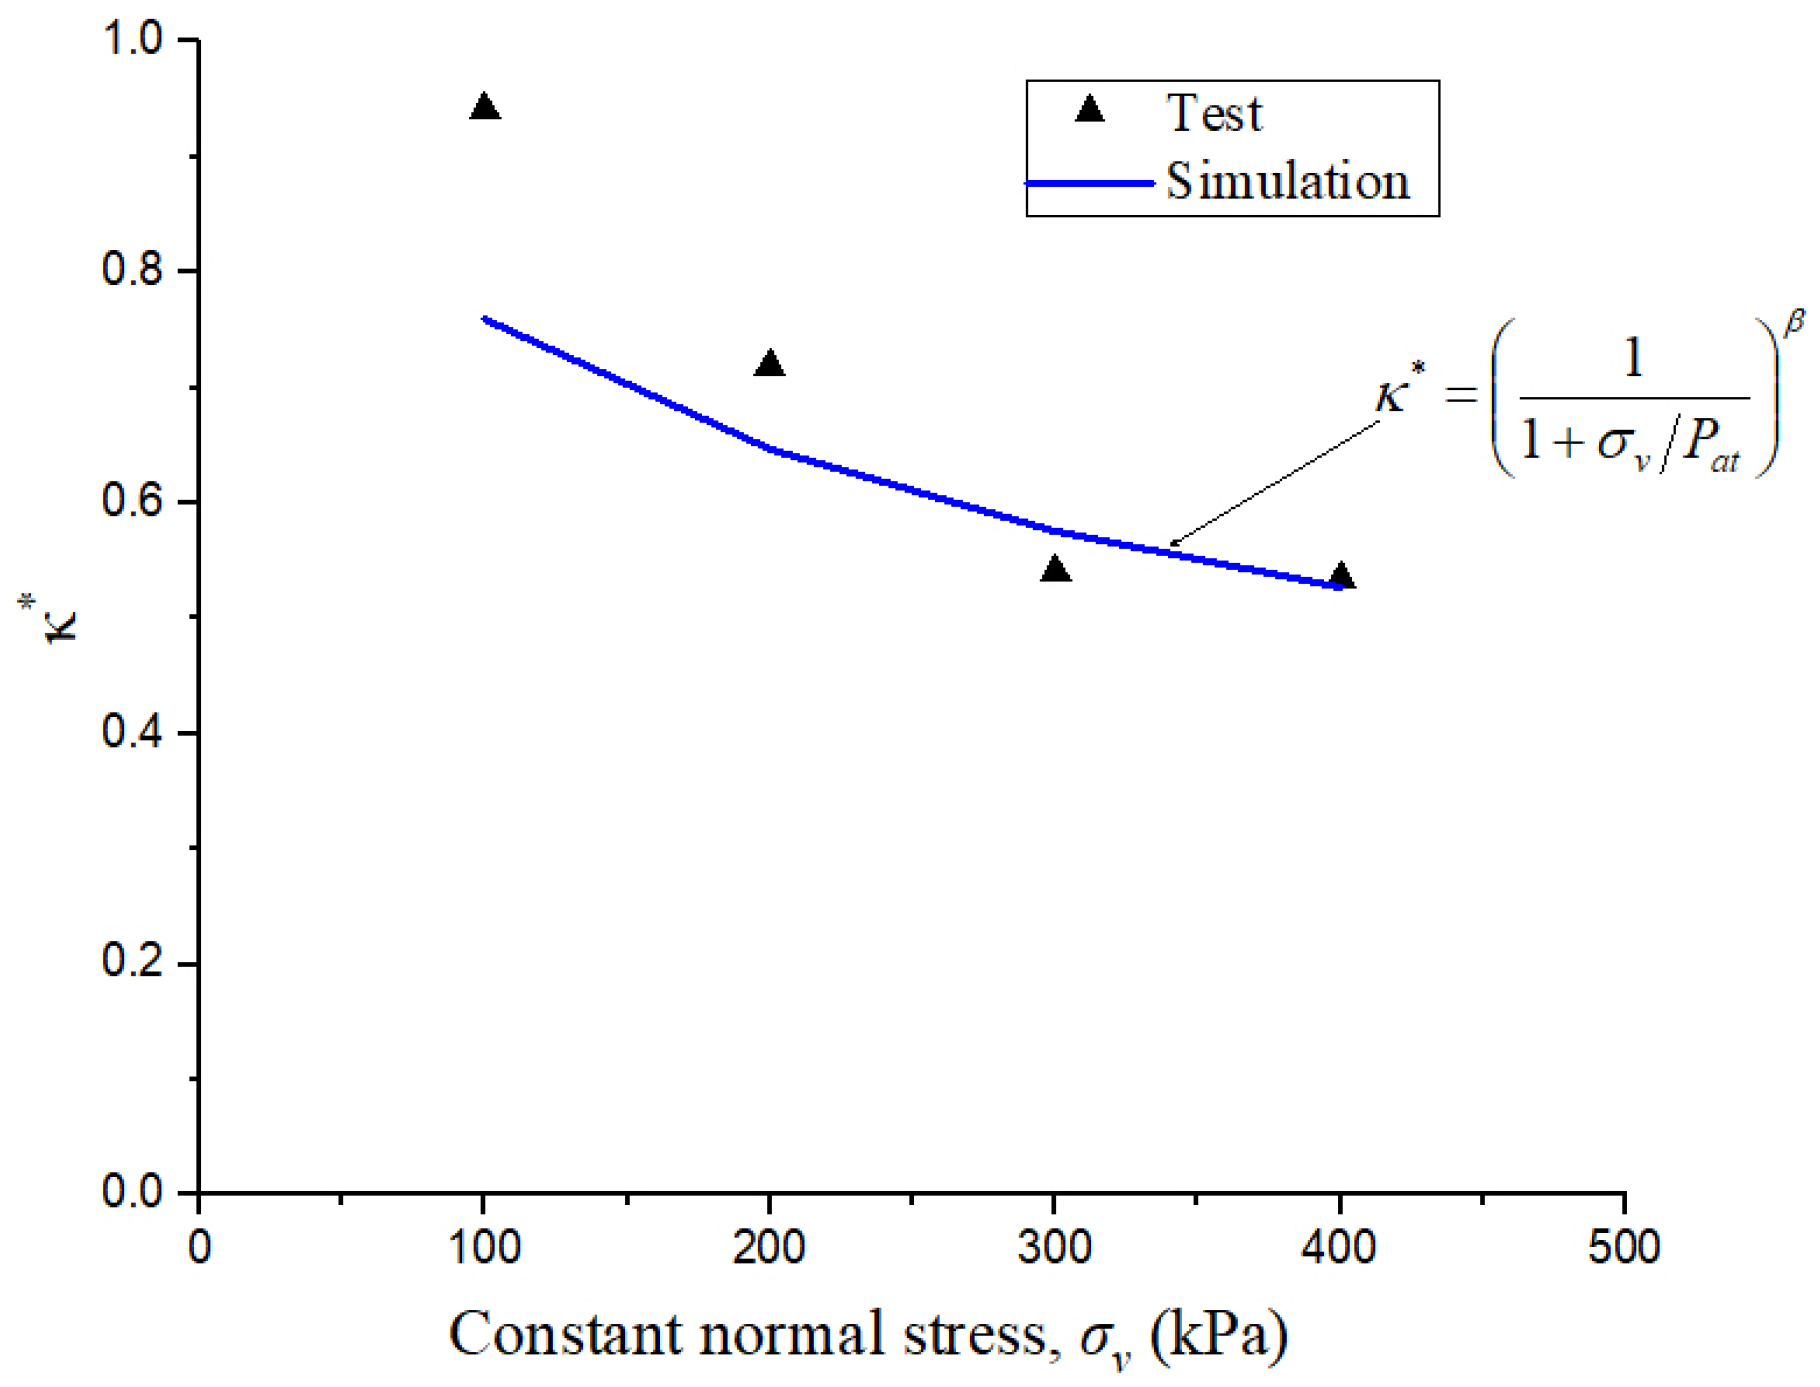
Based on Equation (15) and test data, the form of κ* can be proposed, as shown in Equation (16) and Figure 15:
κ * = 1 1 + σ v / P a t β
where β is a parameter, σv is the normal stress, and Pat is the atmospheric pressure. Here σv in Equation (16) makes κ* normal-stress-dependent.
Based on Equations (15) and (16), the prediction of suction strength τus is plotted in Figure 16 and it increases with increasing normal stress σv, i.e., τus is normal-stress-dependent, which is consistent with the test data. The prediction of suction strength τus by the [50] model is also plotted in Figure 16, but it does not change with normal stress σv. So, the modification by this paper can reflect the normal-stress-dependent characteristic of suction strength τus.
Substituting Equation (15) into Equation (5) yields a formula for the shear strength τf, as shown in Equation (17):
τ f = c + σ v u a tan ϕ + ψ S c a p κ * tan ϕ
Based on Equation (17), the shear strength τf is simulated, as shown in Figure 17. When β = 0, Equation (17) is equivalent to the [50] model. Figure 17 shows that, compared to β = 0 ([50] model), β = 0.4 yields a better prediction of the peak value of shear strength τf. However, when approaching desiccation (e.g., the degree of saturation S = 15% or 0%), it still cannot simulate Δτ < 0, where Δτ = strength near desiccation minus saturated strength (see Figure 17). So, Equation (17) for the shear strength still needs to be improved.

4.2. Improvement 2: From Physical Mechanism (Shrink and Crack) to Model Modifications

In this section, based on the experimental phenomenon of silica gel cracks between sand particles, the size effect in fracture mechanics is introduced to improve the formula of shear strength.
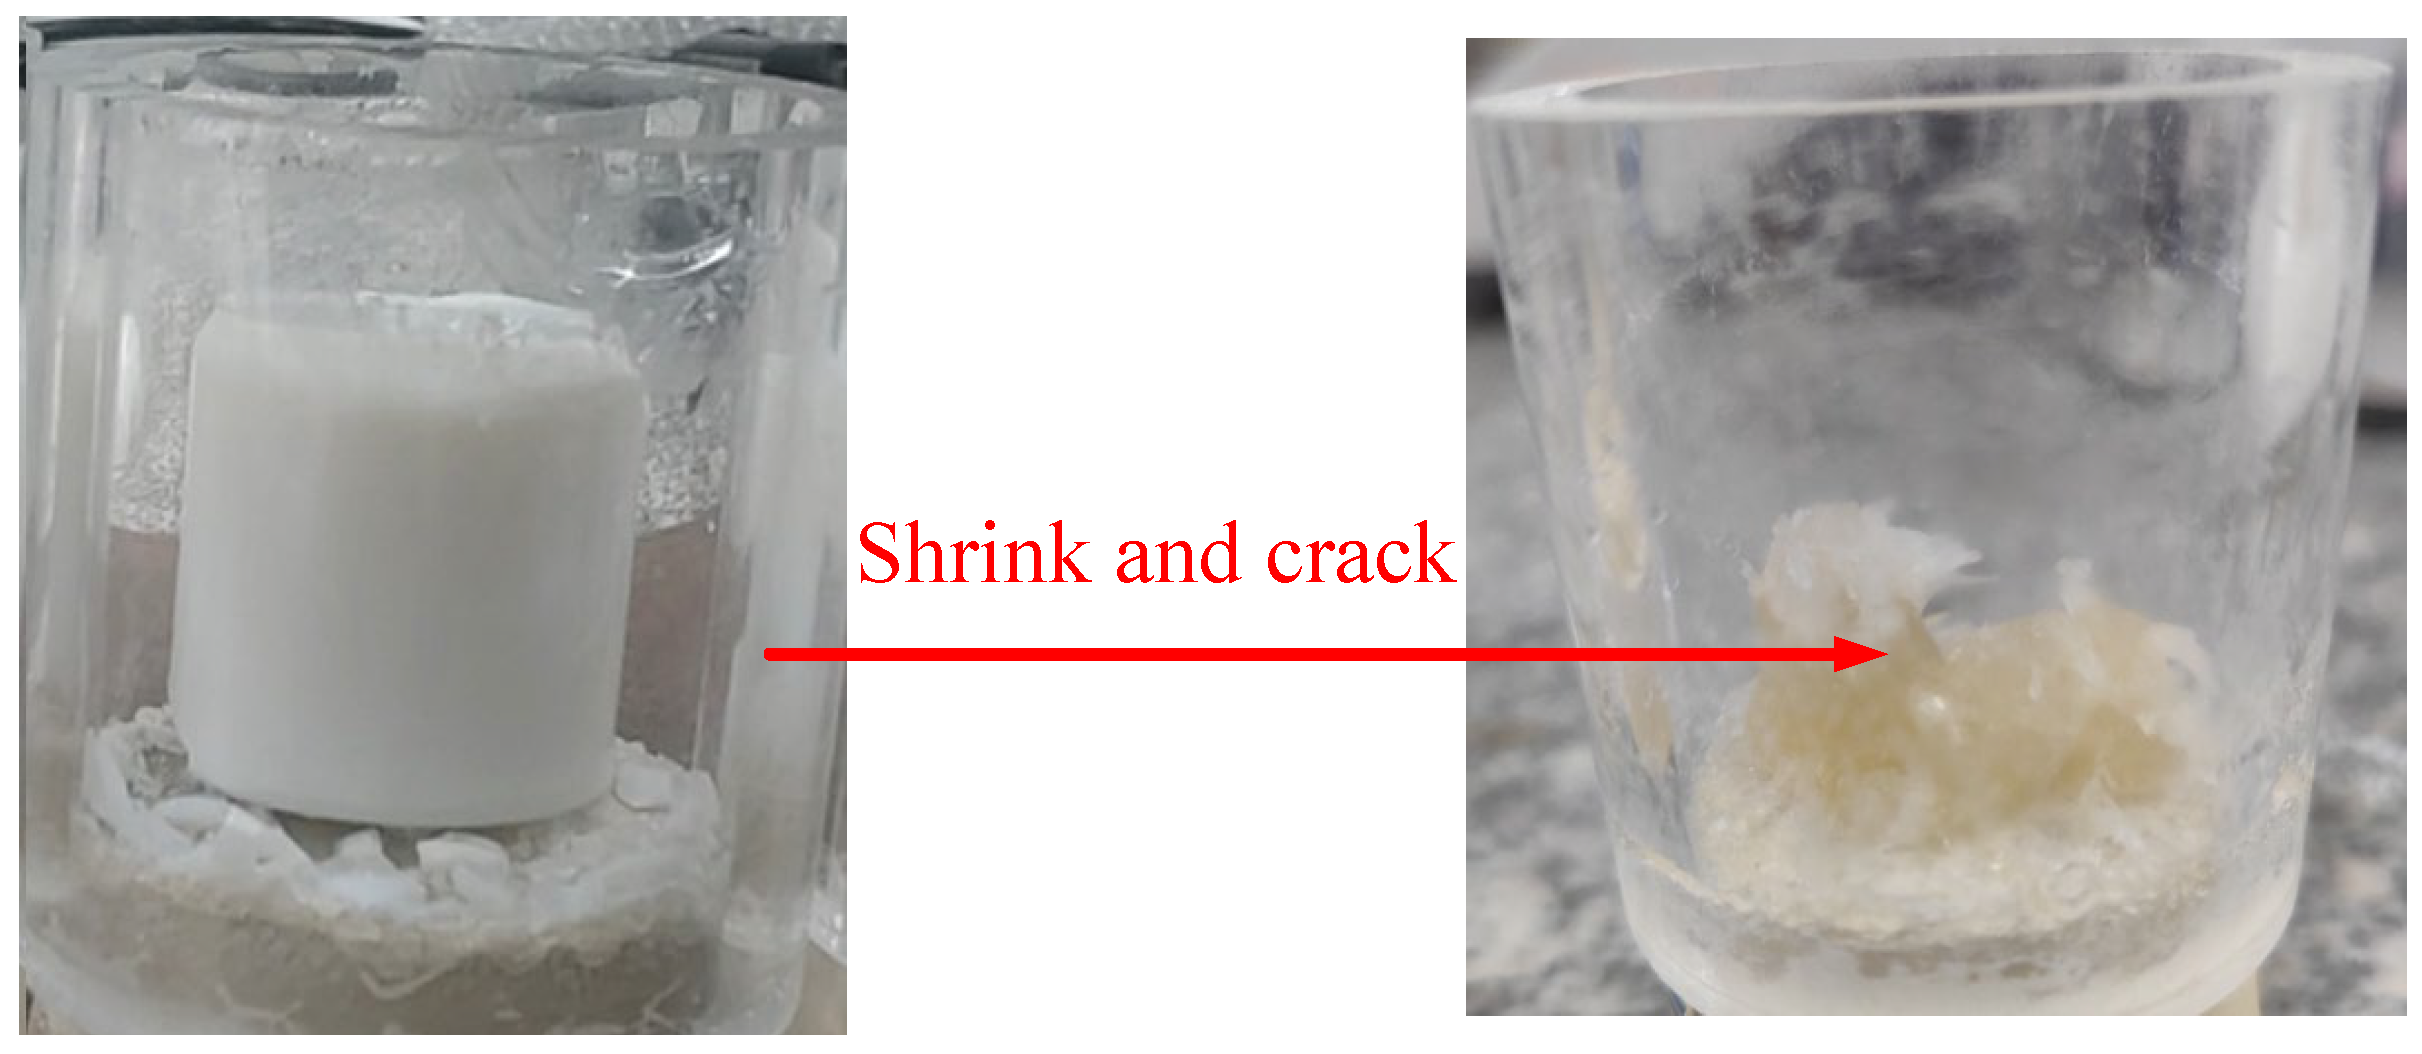
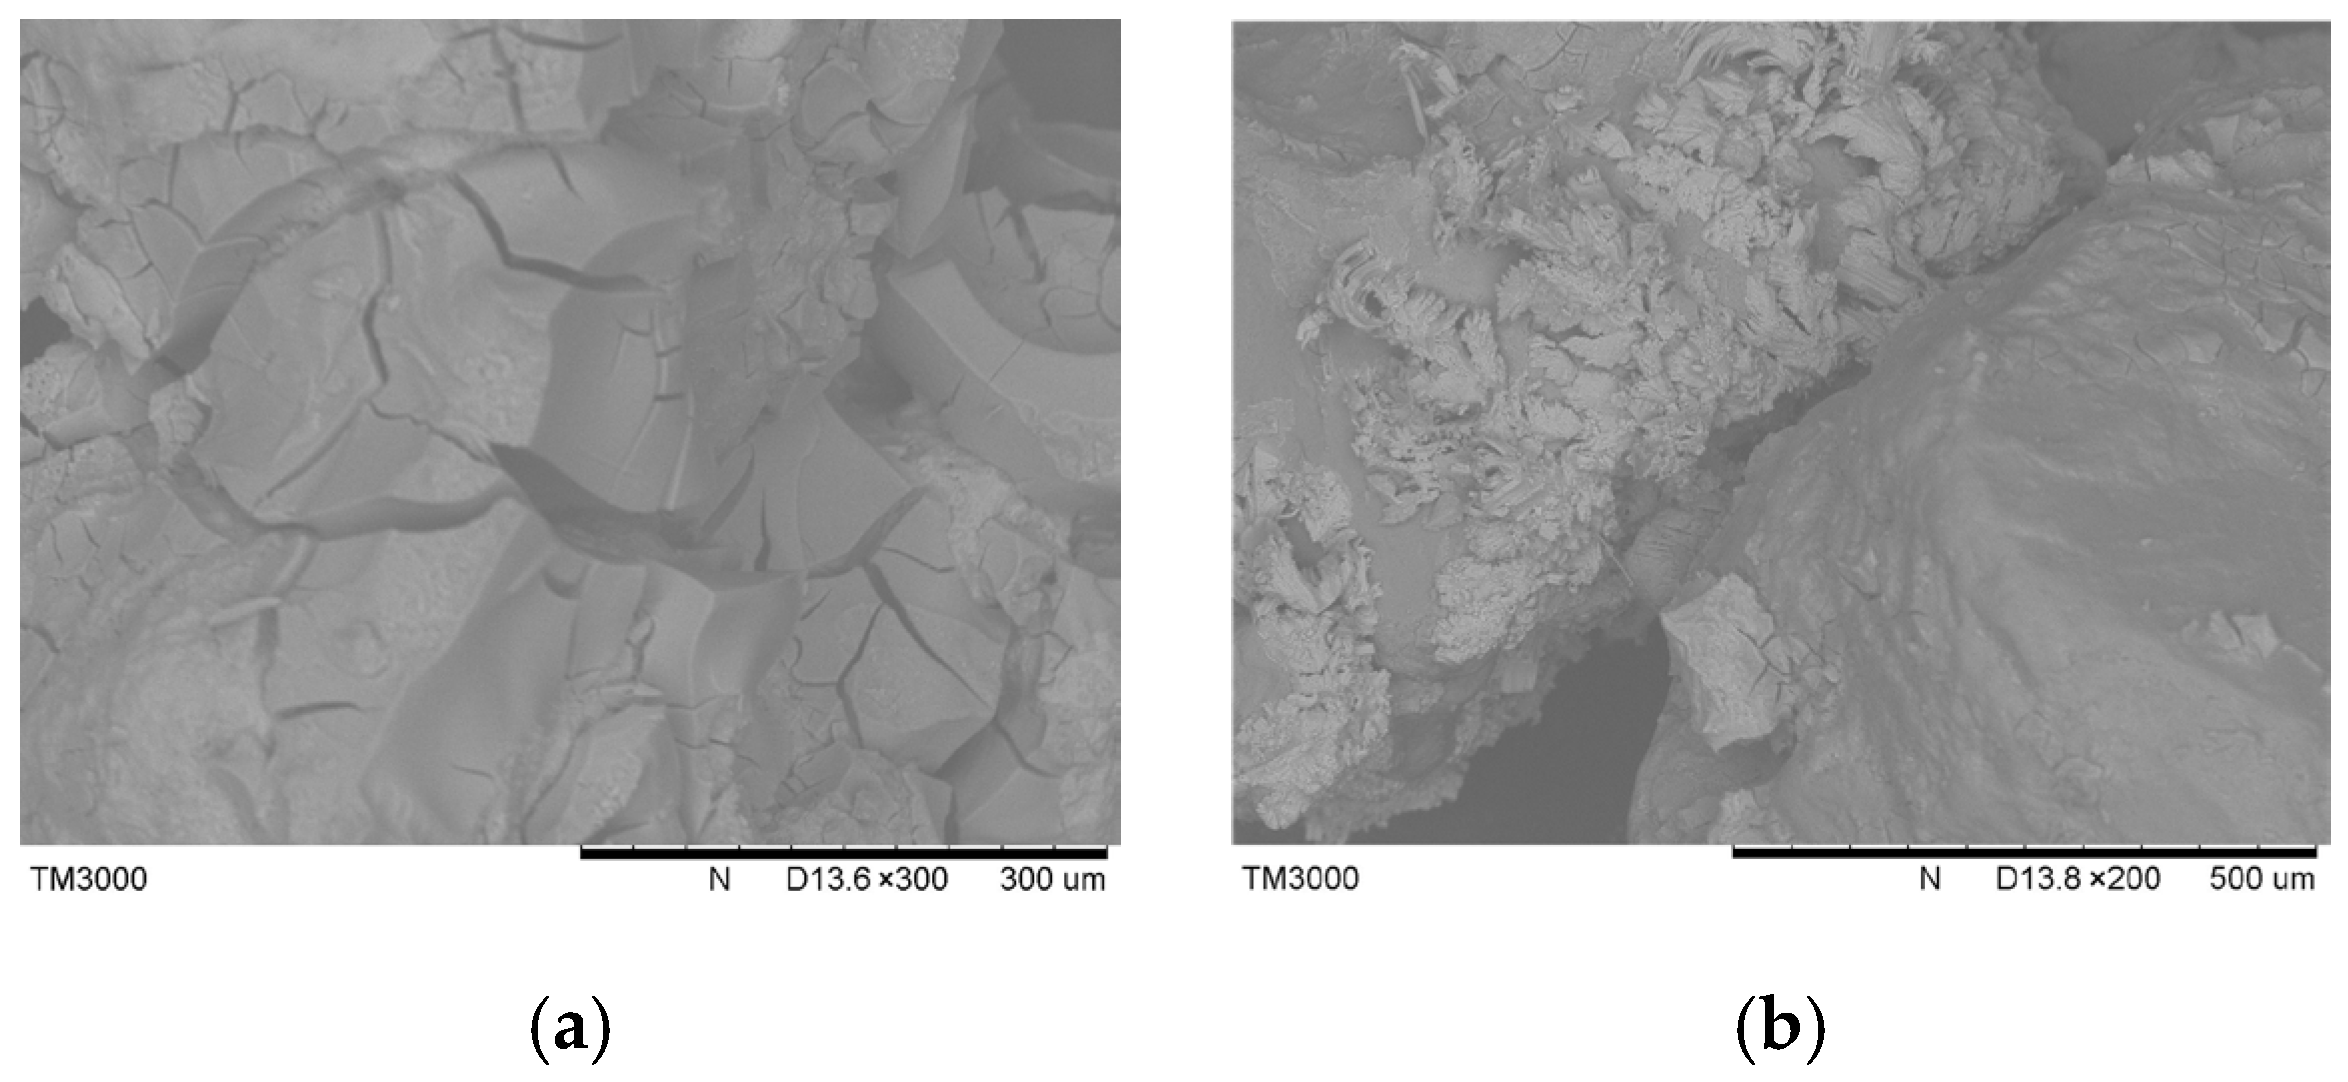
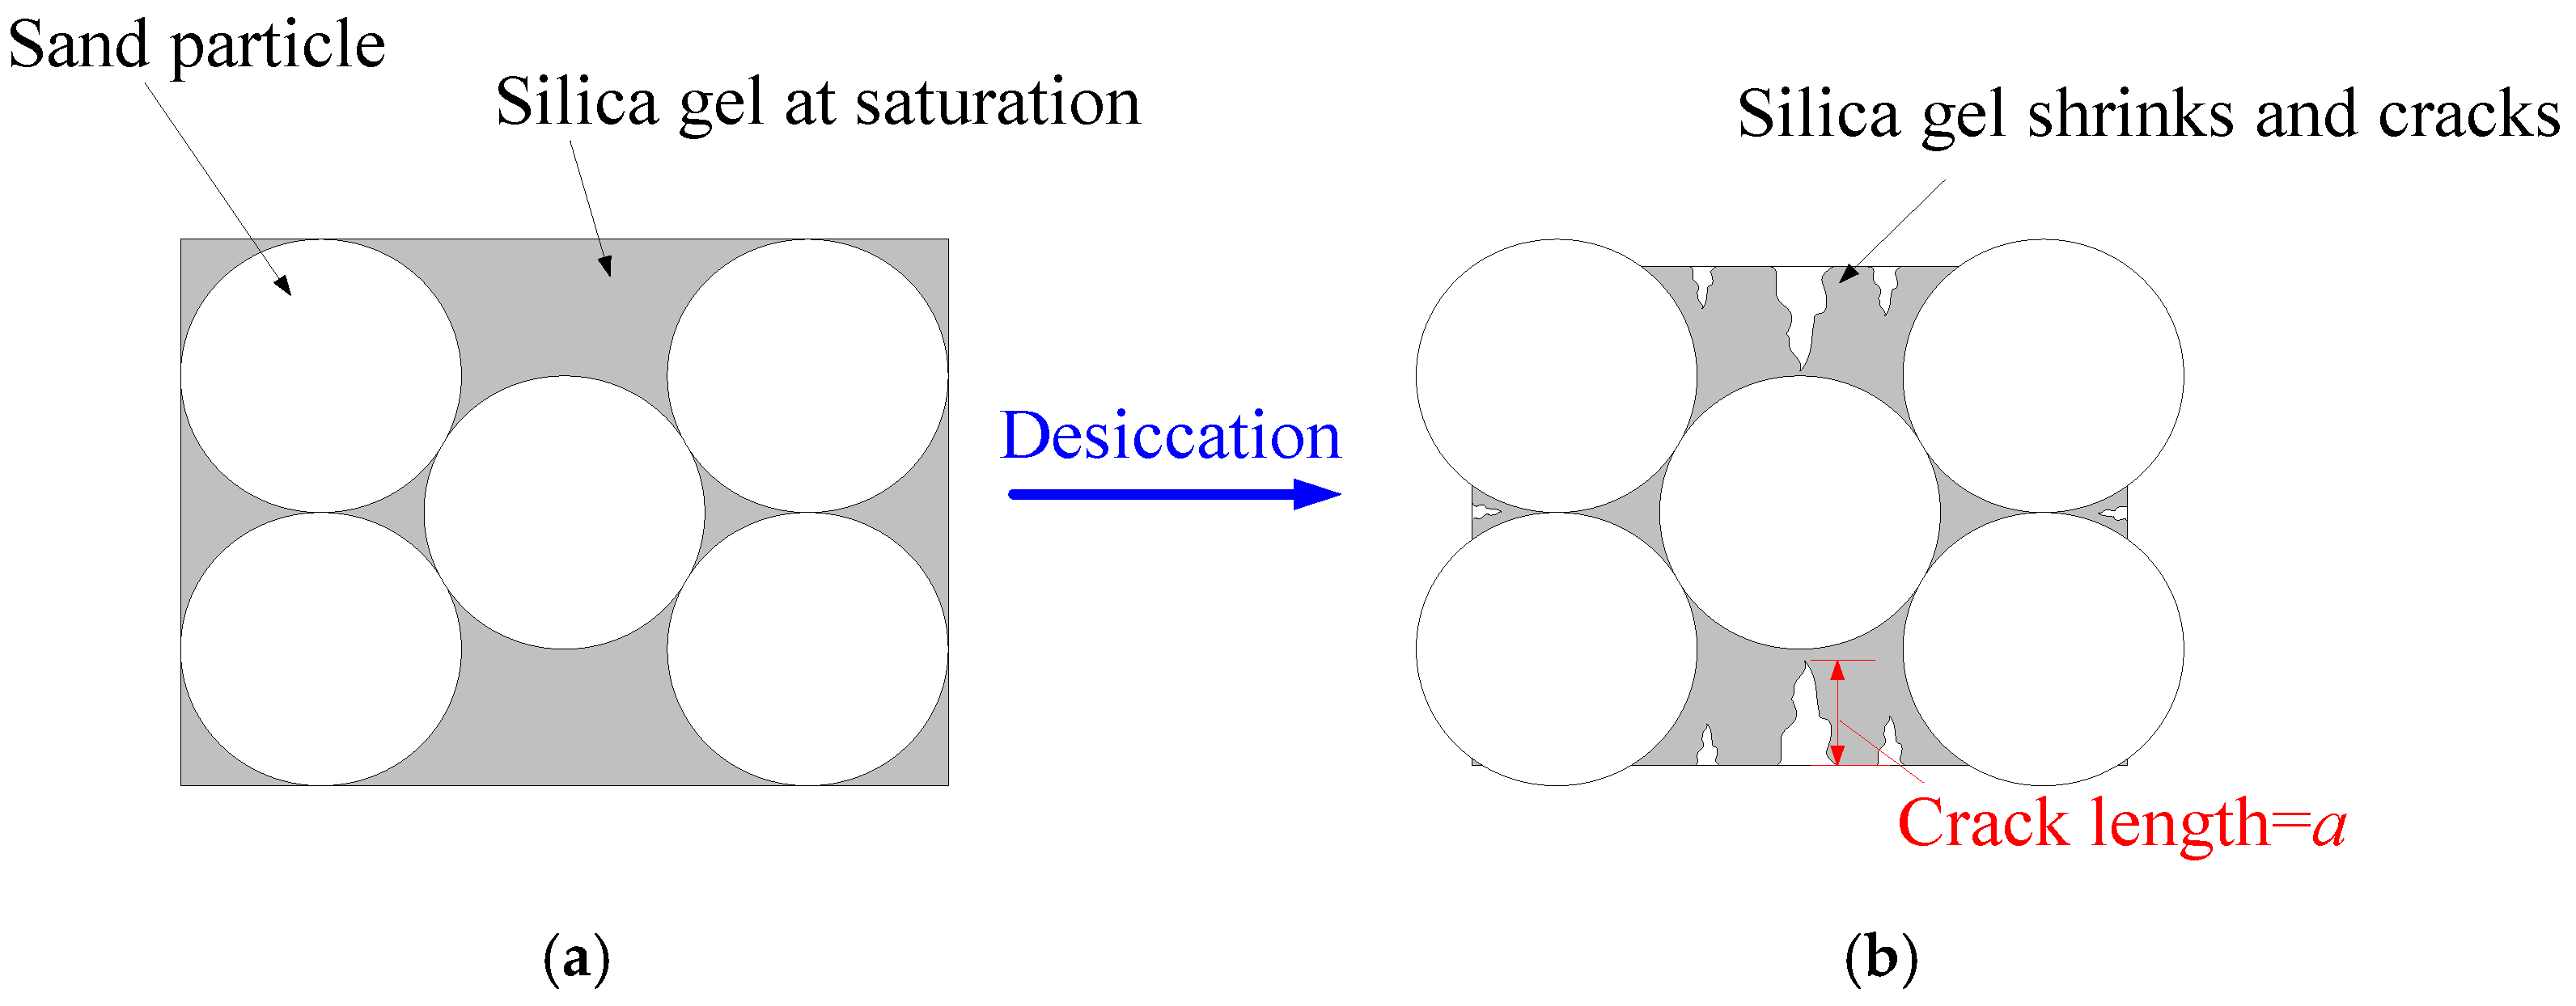
Figure 18 shows the severe shrinkage of pure silica gel due to desiccation, and this shrinkage also results in fragmentation. Figure 19 shows the cracks of silica gel between particles due to desiccation. So, a schematic view of the cracks in colloidal-silica-cemented sand is plotted in Figure 20. The saturated state of colloidal-silica-cemented sand is shown in Figure 20a. When approaching desiccation, the silica gel between sand particles shrinks and cracks (see Figure 20b). Note that suction has little effect on these large cracks, since there is almost no water in such large cracks (see Figure 19). Now we resort to the size effect of the crack in fracture mechanics to consider the weakening effect of these cracks on the strength from the saturated state to the desiccation state.
Ref. [70] proposed a concise and effective strength formula that reflects the size effect, taking into account the influence of crack length a (see Figure 20b) on strength, as shown in Equation (18):
σ f = σ Y 1 + a / a *
where σf is the strength affected by the crack, σY is the strength of the specimen without defects, a is the length of the crack (see Figure 20b), a* is a constant and is called the reference crack length depending on the fracture toughness and σY.
Note that the reference crack length a* is a constant in Equation (18), so when the crack length a = 0, we have σf = σY, while when a > 0, we have σf < σY, and as the crack length a increases, the strength σf decreases. So, the core idea of [70] is the size effect term a/a*. Here, we introduce this size effect term a/a* to Equation (17) to reflect the weakening effect of the desiccation-induced crack on the saturated strength, as shown in Equation (19):
τ f = c + σ v u a tan ϕ 1 + a / a * + ψ S c a p κ * tan ϕ
Since the crack length a is a microscopic statistical variable, it is very difficult to determine the size effect term a/a* in Equation (19) from the micro scale. So, we use a function of the capillary part of saturation to represent a/a*, because when approaching desiccation, the crack length a increases, while correspondingly the capillary part of the saturation decreases. The function proposed is 1 − (Scap)κb, where b is a parameter. When at the saturation state, the crack length a = 0, and correspondingly 1 − (Scap)κb = 0; while during the transition from saturation to desiccation, the crack length a increases, and correspondingly the function 1 − (Scap)κb also increases. So, by replacing a/a* with 1 − (Scap)κb in Equation (19), we have the formula for shear strength τf, as shown in Equation (20):
τ f = c + σ v u a tan ϕ 1 + 1 S c a p κ * × b + ψ S c a p κ * tan ϕ
where κ* is a normal-stress-dependent variable and includes the parameter β (see Equation (16)), and b is the crack size effect parameter.
Table 6 shows values of the parameters. Here, α, ζ, and ψm were proposed by [50] and can be obtained by fitting the soil water characteristic curve (SWCC). β is the parameter related to capillary condensation, which can be fitted by Equations (15) and (16) and the test data. b can be obtained by substituting the values of the desiccation point into Equation (20).
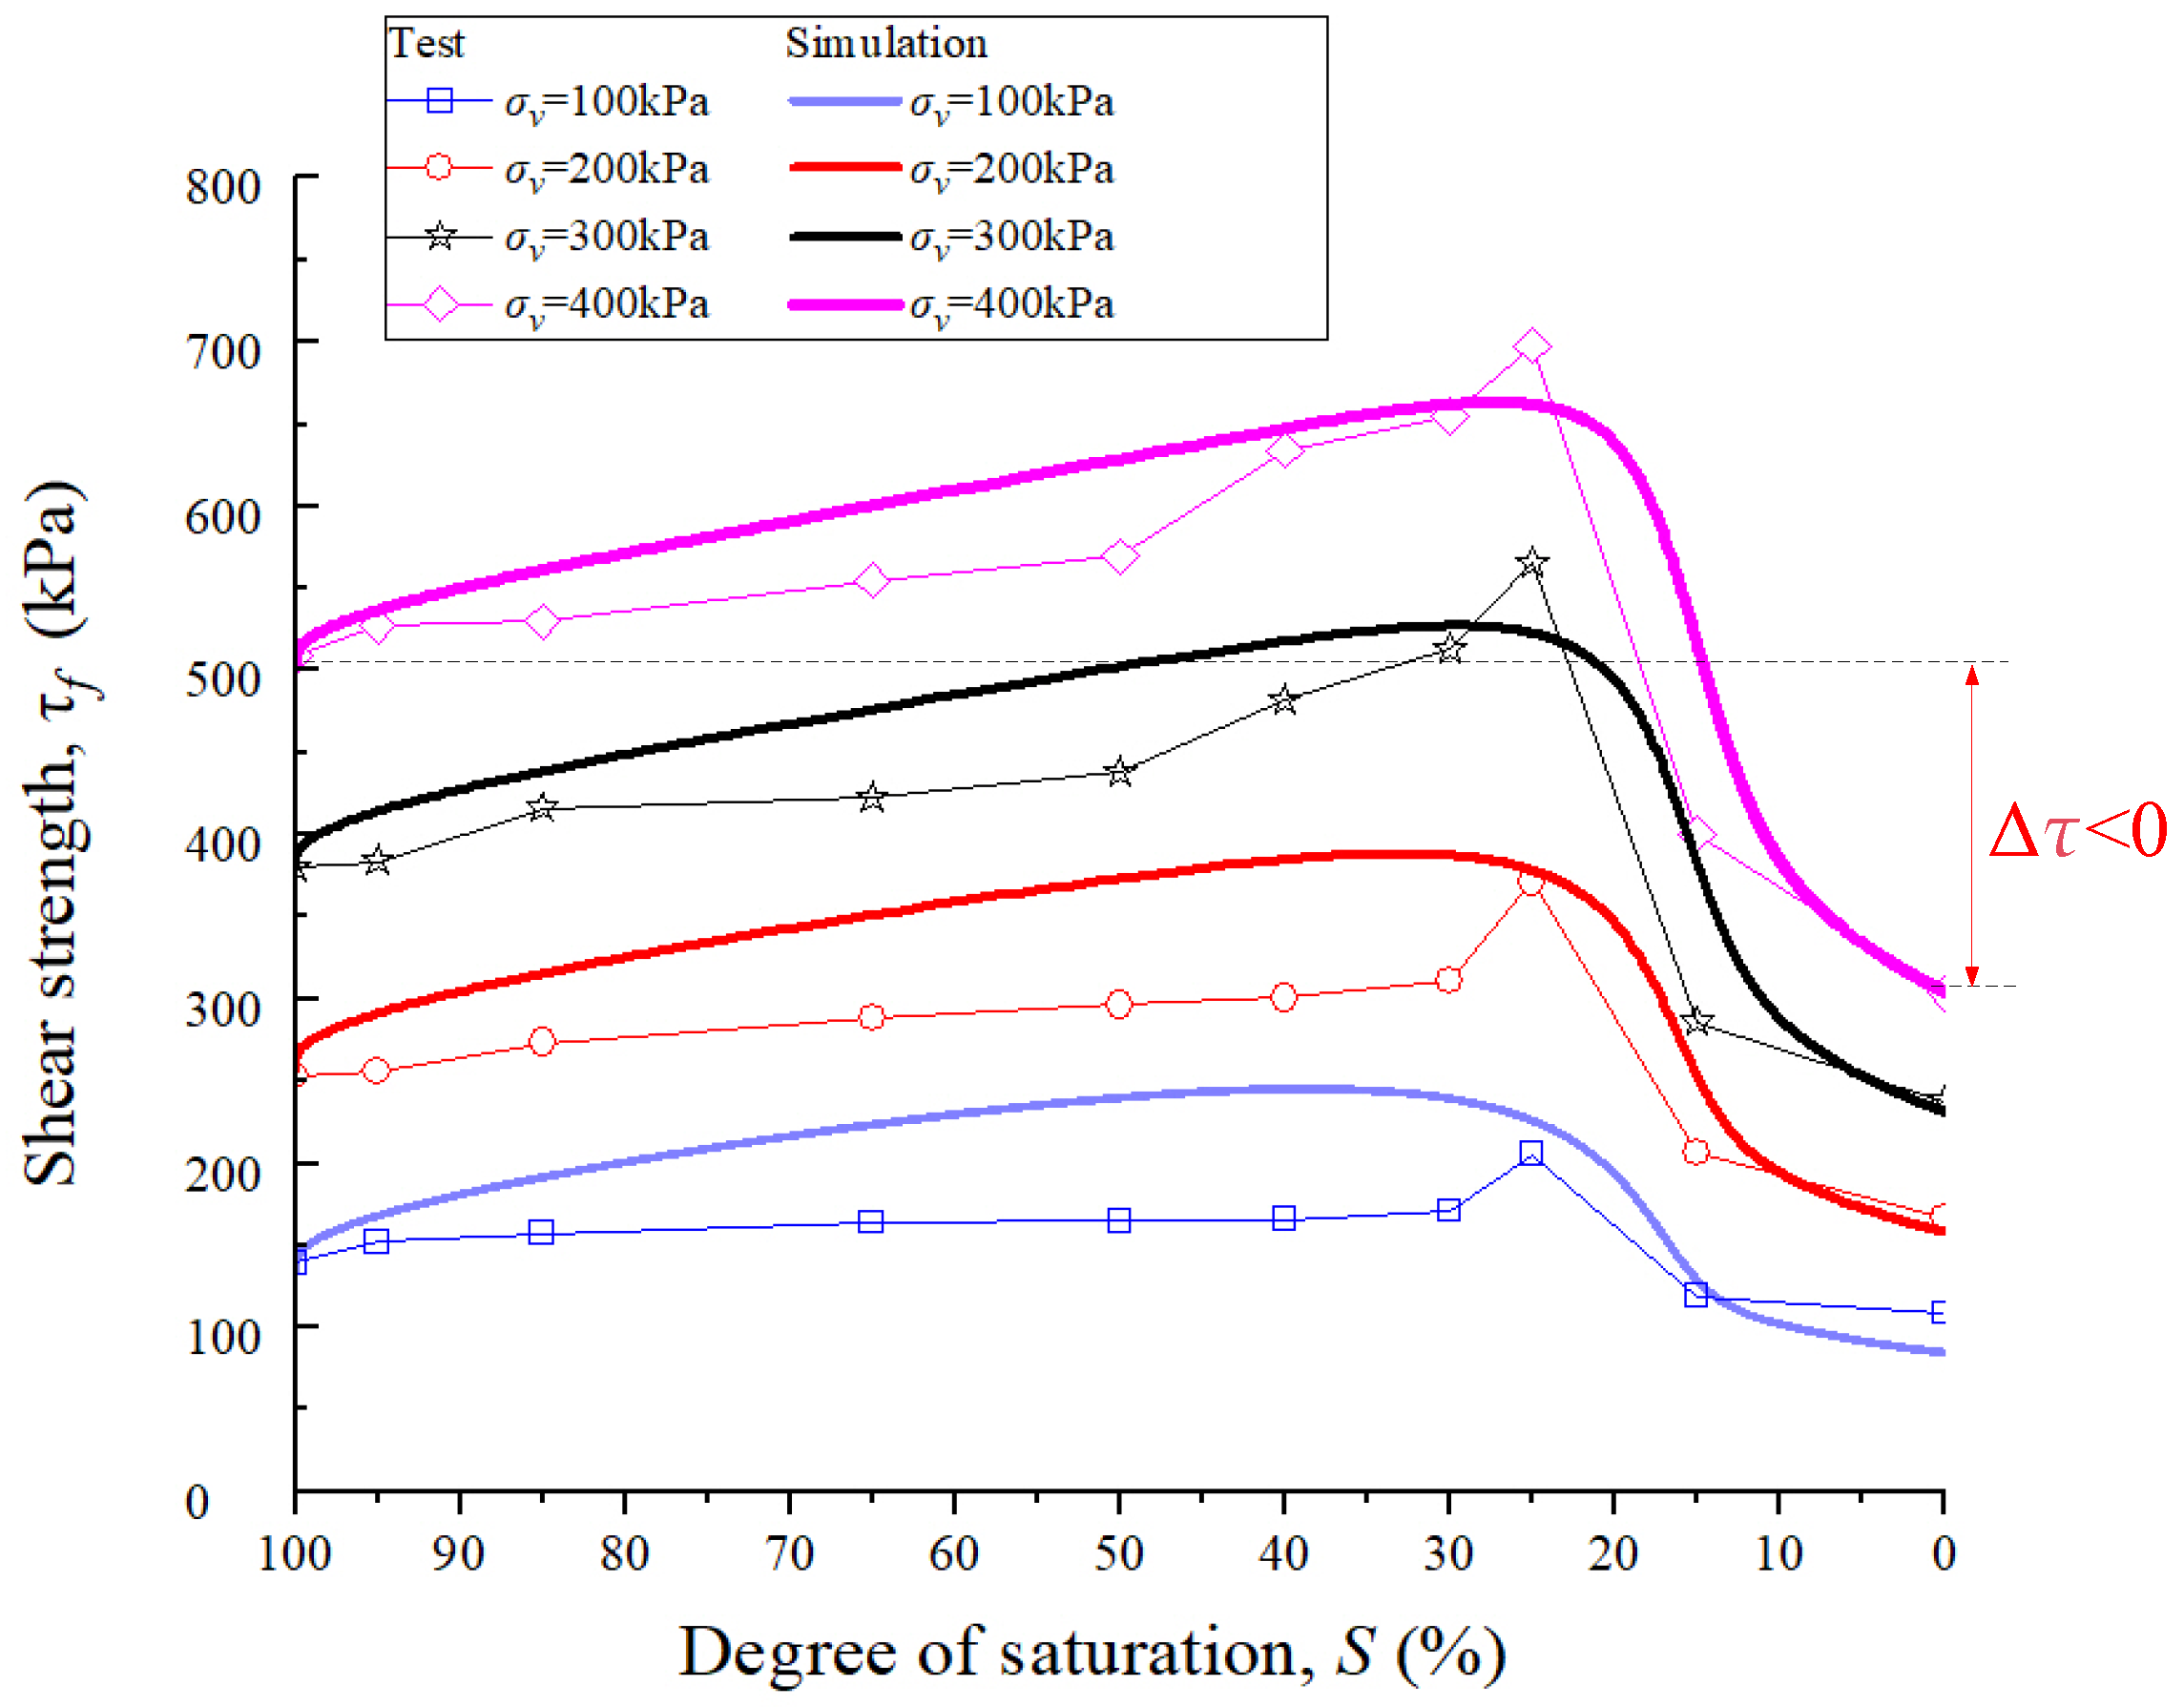
Figure 21 shows the simulation of shear strength τf by Equation (20). The following can be seen: (1) the peak suction strength τus (τus = the increment of τf from the saturated state to a partially saturated state, as shown in Figure 12) is normal-stress-dependent, i.e., suction strength τus increases with increasing normal stress σv; our simulation can match this characteristic, which is owing to the introduction of a normal-stress-dependent characteristic into the capillary condensation probability; (2) near desiccation (e.g., the degree of saturation is 15% or 0%), the shear strength τf is less than that at the saturated state (i.e., Δτ < 0 as shown in Figure 21); our formula can describe this characteristic, due to the addition of the crack size effect in the formula. We adopt two quantitative indicators, namely root mean square error (RMSE) and mean absolute percentage error (MAPE), which are defined in Equations (21) and (22). Smaller values of these two metrics represent superior fitting performance:
M A P E = 1 n i = 1 n y i f i f i
R M S E = 1 n i = 1 n y i f i 2
where fi denotes the i-th measured data, yi represents the corresponding predicted value, and n stands for the total number of sample points.
The model proposed by [50] exhibits the optimal simulation performance among existing models. Our approach is developed on the basis of the [50] model, so we only conduct comparative analysis between the two methods. For the [50] model, the MAPE and RMSE reach 0.163 and 64.75, respectively. By contrast, our model yields an MAPE of 0.123 and an RMSE of 42.09. Both metrics are evidently lower, demonstrating that the proposed model achieves more accurate simulation results. The experimental method proposed in this study is currently applicable only to calcareous sand solidified with colloidal silica at a concentration of 30%. If specimens prepared with other cemented sands, varied colloidal silica contents, alternative activators or different curing conditions exhibit comparable strength characteristics, the presented method can also be applied accordingly. Nevertheless, the relevant strength laws under these conditions still need to be further verified through laboratory tests.
Classroom takeaway: By comparing Figure 21 with Figure 12 (which showed the limitations of the existing [50] model), students can clearly see how the two proposed modifications—normal-stress-dependent capillary condensation and crack size effect—jointly enable the model to reproduce the unconventional strength behavior observed in the experiments.

5. Discussion and Parameter Analysis: A Classroom Guide to Model Behavior

In this section, we examine how the two newly introduced parameters, β and b, influence the shear strength predicted by our model. Understanding the role of each parameter is essential for students to grasp the physical meaning behind the mathematical formulation.

5.1. Overview of the Two New Parameters

Our model introduces two parameters into the [50] framework, each targeting a specific strength characteristic observed in colloidal-silica-cemented sand:
β (beta): This parameter accounts for the stress-dependent characteristic of the capillary condensation probability. It captures the experimentally observed phenomenon that suction strength increases with increasing normal stress (see Section 2.5.2, Figure 9).
b (b): This parameter accounts for the size effect of cracks that develop near desiccation. It captures the strength deterioration caused by shrinkage and cracking of the silica gel between sand particles when the material becomes sufficiently dry (see Section 2.5.2, Figure 8a).

5.2. Relationship to the Baseline Model [50]

It is important to note that when β = 0 and b = 0, our model degenerates exactly into the [50] model. This baseline model is a well-established and robust framework, as it predicts unsaturated strength using parameters derived directly from the soil–water characteristic curve (SWCC). Moreover, it has been validated across several major soil types [50]. The applicable scope and limitations are discussed as follows. The proposed model (Equation (20)) is an extension of the theoretical framework developed by [50]. In their work, the original model was validated against multiple independent datasets covering reconstituted silty clay, Madrid gray clay, red silty clay, Madrid clay sand, and Nanyang expansive soil. The present model can be mathematically reduced back to [50]’s. original formulation, so it inherently inherits the validated applicability to all these soils. For cemented geomaterials, however, the proposed model is specifically calibrated and limited to colloidal-silica-cemented calcareous sand. Therefore, our modifications should be understood as targeted extensions to address the specific unconventional behaviors of cemented sand, rather than a complete replacement of the existing theory.

5.3. Parameter Effects: A Visual Classroom Comparison

Taking b = 0.075 and β = 0.4 as the baseline values, we separately vary each of the two parameters to calculate RMSE and MAPE. The resulting variations are summarized in Table 7 for quantitative evaluation of model parameter sensitivity.
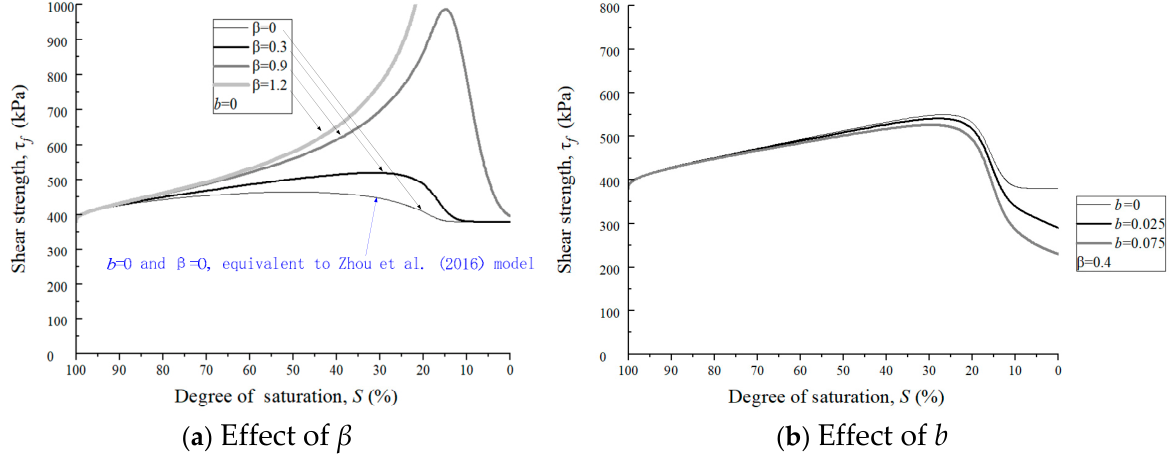
Figure 22 provides a side-by-side visual comparison of how β and b affect the predicted shear strength. This figure is designed to help students connect each parameter to its underlying physical mechanism.
(a)
Effect of β (Figure 22a): As β increases, the predicted shear strength increases. The underlying mechanism is that a larger β increases the capillary condensation probability between the sand particles. A higher condensation probability means more extensive formation of capillary water bridges, which in turn increases the suction-induced contribution to the shear strength. In classroom terms: stronger stress-sensitivity of capillary condensation leads to higher strength.
(b)
Effect of b (Figure 22b): As b increases, the predicted shear strength decreases. The mechanism is that b is related to the crack size of the silica gel between the sand particles. A larger b corresponds to larger cracks (or more severe cracking) near desiccation. As the crack size increases, the cementation bridges between particles become more fragmented, leading to a reduction in shear strength. In classroom terms: more extensive drying-induced cracking leads to lower strength.

5.4. Classroom Summary

This parameter analysis serves as a useful classroom exercise: students can be asked to predict how the shear strength curve would change if the cemented sand had a higher gel concentration (which might increase β) or if it were subjected to faster drying (which might increase b). Such thinking experiments reinforce the connection between physical mechanisms and model parameters. Table 8 presents the physical meaning and underlying mechanism of the parameters.

6. Conclusions

Through direct shear tests on colloidal-silica-cemented calcareous sand across a full range of saturations (0–100%), this paper identified two unconventional strength characteristics: (1) a new type of shear strength versus suction relationship in which the strength near desiccation is lower than that at the saturated state; and (2) the normal-stress-dependent nature of suction strength, i.e., suction strength increases with increasing normal stress. A critical review of the existing models revealed that none of them can simultaneously simulate these two characteristics. Therefore, based on the [50] model, a new model was developed by modifying the capillary condensation probability variable and introducing the crack size effect. The key conclusions, presented as teaching points, are summarized below.
(1)
Normal-stress-dependent suction strength: Experimental results show that suction strength increases with increasing normal stress. However, previous models do not incorporate the effect of normal stress into the suction-induced component of shear strength. Consequently, they cannot simulate this characteristic. This highlights an important lesson for students: classical unsaturated strength models often assume the suction strength is independent of the confining stress, but this assumption may not hold for cemented materials.
(2)
New type of strength versus suction relationship: Experimental results reveal that near desiccation, the shear strength drops below the saturated strength. This phenomenon was not observed in previous tests on other soil types and cannot be simulated by the existing models. This serves as a powerful classroom demonstration that not all unsaturated soils follow the conventional “drier is stronger” rule.
A new model was established to simulate the above two characteristics of colloidal-silica-cemented calcareous sand. The model modifications are directly linked to physical mechanisms, making them suitable for classroom explanation as follows.
(1)
For normal-stress-dependent suction strength: From the perspective of micro-scale capillary condensation, the variable of capillary condensation probability was modified to incorporate the effect of normal stress. This modification enables the new model to simulate the observed, normal-stress-dependent characteristic. The key insight for students is that capillary condensation between particles is not solely a function of suction—it is also influenced by how tightly particles are pressed together.
(2)
For the new type of strength versus suction relationship: By introducing the size effect of gel cracks between sand particles, the model can simulate the phenomenon where strength near desiccation is lower than strength at the saturated state. This modification teaches students that drying can induce not only beneficial suction but also detrimental cracking, and the net effect on strength depends on which mechanism dominates.
Final classroom takeaway: This case study demonstrates that when experimental evidence contradicts existing theories, new physical mechanisms must be identified and incorporated into models. Students learn that model building requires understanding of the underlying physics, such as how capillary condensation couples with stress and how drying-induced cracking can reverse the expected strength trend.

Author Contributions

Conceptualization, W.J. and P.G.; methodology, W.J.; software, W.J.; validation, W.J., P.G. and Y.L.; formal analysis, W.J.; investigation, W.J.; resources, P.G.; data curation, Y.L.; writing—original draft preparation, W.J.; writing—review and editing, P.G.; visualization, W.J.; supervision, W.J.; project administration, W.J.; funding acquisition, W.J. All authors have read and agreed to the published version of the manuscript.

Funding

This research was supported by National Natural Science Foundation of China under Grant No. 51408547.

Data Availability Statement

The data used in this paper are available from the corresponding author upon reasonable request.

Conflicts of Interest

The authors declare no conflicts of interest.

Nomenclature

bsize effect parameter
c′effective cohesion at saturation
Patatmospheric pressure
Sdegree of saturation
Sadegree of saturation corresponds to air-entry value
Sadsadsorption component of saturation
Scapcapillary component of saturation
Srdegree of saturation corresponds to residual degree of saturation
uapore air pressure
uwpore water pressure
α, ζ, ψmparameters of SWCC model by Zhou et al. (2016) [50]
βa parameter for κ*, see Equation (16)
κ*a normal-stress-dependent variable for suction strength, see Equation (16)
σvnormal stress
τfshear strength
τussuction strength
ϕ′effective friction angle at saturation
ϕbangle of shear strength with respect to suction
ψsuction
ψaair-entry value
ψrresidual suction
ψdψd = 106 kPa
ωwater content

References

  1. Rasouli, R.; Hayashi, K.; Zen, K. Controlled permeation grouting method for mitigation of liquefaction. J. Geotech. Geoenviron. Eng. 2016, 142, 04016052. [Google Scholar] [CrossRef]
  2. Gallagher, P.M.; Mitchellb, J.K. Influence of colloidal silica grout on liquefaction potential and cyclic undrained behavior of loose sand. Soil Dyn. Earthq. Eng. 2002, 22, 1017–1026. [Google Scholar] [CrossRef]
  3. Pamuk, A.; Gallagher, P.M.; Zimmie, T. Remediation of pile foundations against lateral spreading by passive site stabilization technique. Soil Dyn. Earthq. Eng. 2007, 27, 864–874. [Google Scholar] [CrossRef]
  4. Díaz-Rodríguez, J.A.; Antonio-Izarraras, V.M.; Bandini, P.; López-Molina, J.A. Cyclic strength of a natural liquefiable sand stabilized with colloidal silica grout. Can. Geotech. J. 2008, 45, 1345–1355. [Google Scholar] [CrossRef]
  5. Gallagher, P.M.; Lin, Y. Colloidal silica transport through liquefiable porous media. J. Geotech. Geoenviron. Eng. 2009, 135, 1702–1712. [Google Scholar] [CrossRef]
  6. Mollamahmutoglu, M.; Yilmaz, Y. Pre- and post-cyclic loading strength of silica-grouted sand. Geotech. Eng. 2010, 163, 343–348. [Google Scholar] [CrossRef]
  7. Hamderi, M.; Gallagher, P.M. An optimization study on the delivery distance of colloidal silica. Sci. Res. Essays 2013, 8, 1314–1323. [Google Scholar] [CrossRef]
  8. Wong, C.; Pedrotti, M.; El Mountassir, G.; Lunn, R.J. A study on the mechanical interaction between soil and colloidal silica gel for ground improvement. Eng. Geol. 2018, 243, 84–100. [Google Scholar] [CrossRef]
  9. Zhao, M.Z.; Liu, G.; Zhang, C.; Guo, W.B.; Luo, Q. State-of-the-art of colloidal silica-based soil liquefaction mitigation: An emerging technique for ground improvement. Appl. Sci. 2020, 10, 15. [Google Scholar] [CrossRef]
  10. Pavlopoulou, E.E.; Georgiannou, V.N. Effect of colloidal silica aqueous gel on the monotonic and cyclic response of sands. J. Geotech. Geoenviron. Eng. 2021, 147, 04021122. [Google Scholar] [CrossRef]
  11. Vranna, A.; Tika, T.; Papadimitriou, A. Laboratory investigation into the monotonic and cyclic behaviour of a clean sand stabilised with colloidal silica. Géotechnique 2022, 72, 377–390. [Google Scholar] [CrossRef]
  12. Jin, W.F.; Tao, Y.; Chen, R.Z. Capturing the turning hook of stress-dilatancy curve of crushable calcareous sand. J. Mar. Sci. Eng. 2022, 10, 1269. [Google Scholar] [CrossRef]
  13. Triantafyllos, P.K.; Georgiannou, V.N.; Pavlopoulou, E.; Dafalias, Y.F. Strength and dilatancy of sand before and after stabilisation with colloidal-silica gel. Géotechnique 2022, 72, 471–485. [Google Scholar] [CrossRef]
  14. Liu, G.; Zhao, M.; Wang, T.; Connolly, D.P.; Cai, Y. Permeation grouting of low-permeability silty sands with colloidal silica. Case Stud. Constr. Mat. 2023, 19, e02327. [Google Scholar] [CrossRef]
  15. Spagnoli, G.; Collico, S. Multivariate analysis of a grouted sand with colloidal silica at different dilution stages. Transp. Geotech. 2023, 40, 100987. [Google Scholar] [CrossRef]
  16. Agapoulaki, G.I.; Papadimitriou, A.G. Rheological properties of colloidal silica grout for passive stabilization against liquefaction. J. Mater. Civ. Eng. 2018, 30, 04018251. [Google Scholar] [CrossRef]
  17. Manav, Y.; Toprak, S.; Karakaplan, E.; Inel, M. Soil improvement to counter liquefaction using colloidal silica grout injection. J. Environ. Prot. Ecol. 2019, 20, 135–145. [Google Scholar]
  18. Ciardi, G.; Madiai, C. Effects of initial static shear stress on cyclic behaviour of sand stabilised with colloidal silica. Acta Geotech. 2023, 18, 2389–2409. [Google Scholar] [CrossRef]
  19. Jin, W.; Liao, X.; Tao, Y. Self–sensing, anti–liquefaction, and long–term settlement characteristics of calcareous sand seeped by high-concentration colloidal silica. Constr. Build. Mater. 2024, 422, 135864. [Google Scholar] [CrossRef]
  20. Jin, W.; Li, Y. Cementation state of sand judged by the stress−dilatancy relationship from a single drained triaxial test. J. Geotech. Geoenviron. Eng. 2025, 151, 04025027. [Google Scholar] [CrossRef]
  21. Imoh, U.U.; Apata, A.C.; Bolorunduro, A.M.; Movahedi Rad, M. Mechanistic and comparative laboratory assessment of lime dosage and uniaxial geogrid on the strength and durability of classified lateritic subgrade. Sci. Rep. 2025, 15, 42901. [Google Scholar] [CrossRef]
  22. Pedrotti, M.; Wong, C.; Mountassir, G.E.; Renshaw, J.C.; Lunn, R.J. Desiccation behaviour of colloidal silica grouted sand: A new material for the creation of near surface hydraulic barriers. Eng. Geol. 2020, 270, 105579. [Google Scholar] [CrossRef]
  23. Escario, V.; Sáez, J. The shear strength of partly saturated soils. Géotechnique 1986, 36, 453–456. [Google Scholar] [CrossRef]
  24. Al Aqtash, U.; Bandini, P. Prediction of unsaturated shear strength of an adobe soil from the soil–water characteristic curve. Constr. Build. Mater. 2015, 98, 892–899. [Google Scholar] [CrossRef]
  25. Alonso, E.E.; Gens, A.; Josa, A. A constitutive model for partially saturated soils. Géotechnique 1990, 40, 405–430. [Google Scholar] [CrossRef]
  26. Toll, D.G.; Ong, B.H. Critical-state parameters for an unsaturated residual sandy clay. Géotechnique 2003, 53, 93–103. [Google Scholar] [CrossRef]
  27. Lee, I.M.; Sung, S.G.; Cho, G.C. Effect of stress state on the unsaturated shear strength of a weathered granite. Can. Geotech. J. 2005, 42, 624–631. [Google Scholar] [CrossRef]
  28. Likos, W.J.; Wayllace, A.; Godt, J.; Lu, N. Modified direct shear apparatus for unsaturated sands at low suction and stress. Geotech. Test. J. 2010, 33, 102927. [Google Scholar] [CrossRef]
  29. Fern, E.J.; Robert, D.J.; Soga, K. Modeling the stress-dilatancy relationship of unsaturated silica sand in triaxial compression tests. J. Geotech. Geoenviron. Eng. 2016, 142, 04016055. [Google Scholar] [CrossRef]
  30. Zhao, H.F.; Zhang, L.M.; Fredlund, D.G. Bimodal shear-strength behavior of unsaturated coarse-grained soils. J. Geotech. Geoenviron. Eng. 2013, 139, 2070–2081. [Google Scholar] [CrossRef]
  31. Zhao, H.F.; Zhang, L.M. Effect of coarse content on shear behavior of unsaturated coarse granular soils. Can. Geotech. J. 2014, 51, 1371–1383. [Google Scholar] [CrossRef]
  32. Zhang, J.R.; Sun, D.A.; Zhou, A.N.; Jiang, T. Hydromechanical behaviour of expansive soils with different suctions and suction histories. Can. Geotech. J. 2016, 53, 1–13. [Google Scholar] [CrossRef]
  33. Ng, C.W.W.; Sadeghi, H.; Jafarzadeh, F. Compression and shear strength characteristics of compacted loess at high suctions. Can. Geotech. J. 2017, 54, 690–699. [Google Scholar] [CrossRef]
  34. Gao, Y.; Sun, D.A.; Zhu, Z.C.; Xu, Y.F. Hydromechanical behavior of unsaturated soil with different initial densities over a wide suction range. Acta Geotech. 2019, 14, 417–428. [Google Scholar] [CrossRef]
  35. Zhang, J.R.; Niu, G.; Li, X.C.; Sun, D.A. Hydro-mechanical behavior of expansive soils with different dry densities over a wide suction range. Acta Geotech. 2020, 15, 265–278. [Google Scholar] [CrossRef]
  36. Vanapalli, S.K.; Fredlund, D.G.; Pufahl, D.E.; Clifton, A.W. Model for the prediction of shear strength with respect to soil suction. Can. Geotech. J. 1996, 33, 379–392. [Google Scholar] [CrossRef]
  37. Fredlund, D.G.; Xing, A.; Fredlund, M.D.; Barbour, S.L. The relationship of the unsaturated soil shear strength to the soil-water characteristic curve. Can. Geotech. J. 1996, 33, 440–448. [Google Scholar] [CrossRef]
  38. Oberg, A.; Sallfors, G. Determination of shear strength parameters of unsaturated silts and sands based on the water retention curve. Geotech. Test. J. 1997, 20, 40–48. [Google Scholar] [CrossRef]
  39. Khalili, N.; Khabbaz, M.H. A unique relationship for χ for the determination of the shear strength of unsaturated soils. Géotechnique 1998, 48, 681–687. [Google Scholar] [CrossRef]
  40. Sun, D.A.; Matsuoka, H.; Yao, Y.P.; Ichihara, W. An elasto plastic model for unsaturated soil in three-dimensional stresses. Soils Found. 2000, 40, 17–28. [Google Scholar] [CrossRef] [PubMed]
  41. Miao, L.; Liu, S.; Lai, Y. Research of soil-water characteristics and shear strength features of Nanyang expansive soil. Eng. Geol. 2002, 65, 261–267. [Google Scholar] [CrossRef]
  42. Tekinsoy, M.A.; Kayadelan, C.; Keskin, M.S.; Soylemaz, M. An equation for predicting shear strength envelope with respect to matric suction. Comput. Geotech. 2004, 31, 589–593. [Google Scholar] [CrossRef]
  43. Xu, Y.F. Fractal approach to unsaturated shear strength. J. Geotech. Geoenviron. Eng. 2004, 130, 264–273. [Google Scholar] [CrossRef]
  44. Vilar, O.M. A simplified procedure to estimate the shear strength envelope of unsaturated soil. Can. Geotech. J. 2006, 43, 1088–1095. [Google Scholar] [CrossRef]
  45. Houston, S.L.; Perez-Garcia, N.; Houston, W.N. Shear strength and shear-induced volume change behaviour of unsaturated soils from a triaxial test program. J. Geotech. Geoenviron. Eng. 2008, 134, 1619–1632. [Google Scholar] [CrossRef]
  46. Sheng, D.; Fredlund, D.G.; Gens, A. A new modelling approach for unsaturated soils using independent stress variables. Can. Geotech. J. 2008, 45, 511–534. [Google Scholar] [CrossRef]
  47. Guan, G.S.; Rahardjo, H.; Choon, L.E. Shear strength equations for unsaturated soil under drying and wetting. J. Geotech. Geoenviron. Eng. 2010, 136, 594–606. [Google Scholar] [CrossRef]
  48. Hossain, M.A.; Yin, J.H. Behavior of a compacted completely decomposed granite soil from suction controlled direct shear tests. J. Geotech. Geoenviron. Eng. 2010, 136, 189–198. [Google Scholar] [CrossRef]
  49. Konrad, J.M.; Lebeau, M. Capillary-based effective stress formulation for predicting shear strength of unsaturated soils. Can. Geotech. J. 2015, 52, 2067–2076. [Google Scholar] [CrossRef]
  50. Zhou, A.N.; Huang, R.Q.; Sheng, D.C. Capillary water retention curve and shear strength of unsaturated soils. Can. Geotech. J. 2016, 53, 974–987. [Google Scholar] [CrossRef]
  51. Patil, U.D.; Puppala, A.J.; Hoyos, L.R.; Pedarla, A. Modeling critical-state shear strength behavior of compacted silty sand via suction-controlled triaxial testing. Eng. Geol. 2017, 231, 21–33. [Google Scholar] [CrossRef]
  52. Zhai, Q.; Rahardjo, H.; Satyanaga, A.; Dai, G. Estimation of unsaturated shear strength from soil–water characteristic curve. Acta Geotech. 2019, 14, 1977–1990. [Google Scholar] [CrossRef]
  53. Gao, Y.; Sun, D.A.; Zhou, A.N.; Li, J. Predicting shear strength of unsaturated soils over wide suction range. Int. J. Geomech. 2020, 20, 04019175. [Google Scholar] [CrossRef]
  54. Pham, T.A.; Sutman, M. Ananalytical model for predicting the shear strength of unsaturated soils. Proc. Inst. Civ. Eng.-Geotech. Eng. 2023, 176, 369–387. [Google Scholar] [CrossRef]
  55. Vaid, Y.P.; Sivathayalan, S.; Stedman, D. Influence of specimen reconstituting method on the undrained response of sand. Geotech. Test. J. 1999, 22, 187–195. [Google Scholar] [CrossRef]
  56. Gopakumar, V.; Tadikonda, B.V. Feedback on the discussion of “assessment of an amended soil as a climate adaptive barrier: Element testing and physical modelling”. Geomech. Energy Environ. 2026, 45, 100784. [Google Scholar]
  57. Leong, E.C.; He, L.; Rahardjo, H. Factors affecting the filter paper method for total and matric suction measurements. Geotech. Test. J. 2002, 25, 322–333. [Google Scholar] [CrossRef]
  58. Richards, B.G. Measurement of the free energy of soil moisture by the psychrometric technique using thermistors. In Moisture Equilibria and Moisture Changes in Soils Beneath Covered Areas; Aitchison, G.D., Ed.; A Symposium in Print, Sydney, Australia; Butterworths & Co., Ltd.: London, UK, 1965; pp. 35–46. [Google Scholar]
  59. Fredlund, D.G.; Xing, A. Equations for the soil-water characteristic curve. Can. Geotech. J. 1994, 31, 521–532. [Google Scholar] [CrossRef]
  60. Lu, N. Generalized soil water retention equation for adsorption and capillarity. J. Geotech. Geoenviron. Eng. 2016, 142, 04016051. [Google Scholar] [CrossRef]
  61. Dieudonne, A.C.; Della Vecchia, G.; Charlier, R. Water retention model for compacted bentonites. Can. Geotech. J. 2017, 54, 915–925. [Google Scholar] [CrossRef]
  62. Cai, G.Q.; Liu, Y.; Li, J.; Yang, R.; Zhao, C.G. Water retention curve with different void ratios over a wide suction range and its application to shear Strength. Int. J. Geomech. 2022, 22, 04022120. [Google Scholar] [CrossRef]
  63. Song, Z.Y.; Zhang, Z.H.; Du, X.L. A generalized water retention model in a wide suction range considering the initial void ratio and its verification. Comput. Geotech. 2024, 166, 106000. [Google Scholar] [CrossRef]
  64. Liu, Z.-R.; Ye, W.-M.; Cui, Y.-J.; Zhu, H.-H.; Chen, Y.-G.; Wang, Q. A soil–water retention model with differentiated adsorptive and capillary regimes. Comput. Geotech. 2025, 183, 107188. [Google Scholar] [CrossRef]
  65. Fredlund, D.G.; Morgenstern Widger, R.A. The shear strength of unsaturated soils. Can. Geotech. J. 1978, 15, 313–321. [Google Scholar] [CrossRef]
  66. Philip, J.R. Unitary approach to capillary condensation and adsorption. J. Chem. Phys. 1977, 66, 5069–5075. [Google Scholar] [CrossRef]
  67. Or, D.; Tuller, M. Liquid retention and interfacial area in variably saturated porous media: Upscaling from single-pore to sample-scale model. Water Resour. Res. 1999, 35, 3591–3605. [Google Scholar] [CrossRef]
  68. Khlosi, M.; Cornelis, W.M.; Douaik, A.; van Genuchten, M.T.; Gabriels, D. Performance evaluation of models that describe the soil water reten tion curve between saturation and oven dryness. Vadose Zone J. 2008, 7, 87–96. [Google Scholar] [CrossRef]
  69. Kosugi, K. Lognormal distribution model for unsaturated soil hydraulic properties. Water Resour. Res. 1996, 32, 2697–2703. [Google Scholar] [CrossRef]
  70. Hu, X.; Wittmann, F. Size effect on toughness induced by crack close to free surface. Eng. Fract. Mech. 2000, 65, 209–221. [Google Scholar] [CrossRef]
Figure 1. Teaching calcareous sand and its grain size distribution: (a) photograph of calcareous sand; (b) grain size distribution curve; (c) XRD analysis of carbonate minerals in calcareous sand.
Applsci 16 05776 g001
Figure 2. Teaching demonstration: transformation of colloidal silica from liquid to solid gel: (a) 3 h after salt addition; (b) 24 h later.
Applsci 16 05776 g002
Figure 3. Specimens of colloidal-silica-cemented sand (for classroom display).
Applsci 16 05776 g003
Figure 4. Specimen after shearing (students can be guided to observe failure characteristics).
Applsci 16 05776 g004
Figure 5. Soil–water characteristic curve (SWCC) of colloidal-silica-cemented sand.
Applsci 16 05776 g005
Figure 6. Reading the air-entry value ψa and residual suction value ψr from the SWCC curve (training in graph interpretation for teaching).
Applsci 16 05776 g006
Figure 7. Shear stress vs. horizontal displacement curves and vertical displacement vs. horizontal displacement curves: (a) σv = 100 kPa; (b) σv = 200 kPa; (c) σv = 300 kPa; (d) σv = 400 kPa.
Applsci 16 05776 g007
Figure 8. Teaching presentation of shear strength τf: (a) shear strength τf vs. degree of saturation S; (b) shear strength τf vs. suction ψ. Note that the strength points of completely desiccated specimens (S = 0%) are not plotted in Figure 8b, because the matric suction of colloidal-silica-cemented sand at S = 0% is unknown. Although theoretical proof and experiments demonstrate that oven-dried sand has an upper suction limit of 106 kPa at S = 0% [36,37,50], please refer to Figure 8a for the strength points of fully desiccated specimens (S = 0%).
Applsci 16 05776 g008
Figure 9. Teaching highlight 1: Suction strength is normal-stress-dependent (i.e., suction strength increases with increasing normal stress).
Applsci 16 05776 g009
Figure 10. Teaching highlight 2: Four types of shear strength versus suction curves (three types summarized by [53], and the fourth type newly discovered in this paper).
Applsci 16 05776 g010
Figure 11. Comparison of simulations by 12 existing models with experimental data (classroom core comparison figure) [36,38,40,41,44,45,47,49,50,53,54].
Applsci 16 05776 g011
Figure 12. Two improvements are needed for [50] model to simulate colloidal-silica-cemented sand.
Applsci 16 05776 g012
Figure 13. Relationship between capillary water and suction: (a) suction = 0; (b) suction > 0.
Applsci 16 05776 g013
Figure 14. Capillary part and adsorption part of saturation by [50] model.
Applsci 16 05776 g014
Figure 15. κ vs. constant normal stress σv (β = 0.4).
Applsci 16 05776 g015
Figure 16. Suction strength τus vs. constant normal stress σv (β = 0.4) [50].
Applsci 16 05776 g016
Figure 17. Shear strength τf vs. degree of saturation S [50].
Applsci 16 05776 g017
Figure 18. Desiccation of silica gel induces severe shrinkage and fragmentation.
Applsci 16 05776 g018
Figure 19. Observations in colloidal silica cemented calcareous sand: (a) cracks in silica gel; (b) silica gel shrinks and cracks between sand particles.
Applsci 16 05776 g019
Figure 20. Desiccation induced cracks in silica gel between sand particles. (a) Intact silica gel in the pores of sand particles; (b) Shrunken and cracked silica gel in the pores of sand particles.
Applsci 16 05776 g020
Figure 21. Simulation of shear strength vs. degree of saturation.
Applsci 16 05776 g021
Figure 22. Classroom demonstration of parameter effects: (a) influence of β on shear strength [50]; (b) influence of b on shear strength.
Applsci 16 05776 g022
Table 1. Properties of calcareous sand.
Specific Gravity
Gs
Max. Void Ratio
edmax
Min. Void Ratio
edmin
Particle Size
d (mm)
2.651.150.810.25–0.5
Table 2. Plan of direct shear tests (for student group work reference).
MaterialDegree of Saturation, S (%)Normal Stress, σv (kPa)
colloidal-silica-cemented sand100, 95, 85, 65, 50, 40, 30, 25, 15, 0100, 200, 300, and 400
Table 3. Existing models for predicting shear strength of unsaturated soil.
Type of the EquationAuthorsShear Strength with Respect to Suction (τus)Parameters
Increase monotonically 1. Khalili & Khabbaz (1998) [39] τ u s = ψ ψ / ψ a 0.55 tan ϕ
2. Tekinsoy et al. (2004) [42] τ u s = ψ a + p a t In ψ / ψ a + 1 tan ϕ
3. Xu (2004) [43] τ u s = ψ a 1 ς ψ ς tan ϕ 0 ≤ ζ ≤ 1
4. Gao et al. (2020) Equation (I) [53] τ u s = ψ ψ / η × ψ a 0.55 tan ϕ η
5. Gao et al. (2020) Equation (II) [53] τ u s = η ψ a + p a t In ψ / ψ a + 1 tan ϕ η
First increase then decrease6. Vanapalli et al. (1996) Equation (I) [36] τ u s = ψ S κ tan ϕ κ
7. Vanapalli et al. (1996) Equation (II) [36] τ u s = ψ S S r / 1 S r tan ϕ
8. Oberg & Sallfors (1997) [38] τ u s = ψ S tan ϕ
9. Fredlund et al. (1996) [37] τ u s = ψ S S r 1 S r ψ κ tan ϕ κ
10. Sun et al. (2000) [40] τ u s = ψ 1 + ψ / a tan ϕ a
11. Miao et al. (2002) [41] τ u s = a ψ 1 + 1 a ψ / p a t a
12. Vilar (2006) [44] τ u s = ψ a + b ψ a, b
13. Houston et al. (2008) [45] τ u s = ψ tan ϕ ψ ψ a a + b ψ ψ a a, b
14. Guan et al. (2010) [47] τ u s = ψ tan ϕ , ψ < ψ a ψ a + b ψ ψ a S κ tan ϕ , ψ ψ a
where κ = In ψ In ψ a y
b, y
15. Hossain & Yin (2010) [48] τ u s = σ n u a tan ϕ + ψ D + ψ S κ tan ϕ + ψ D σ n u a tan ϕ
where ψD is the dilation angle
κ
16. Konrad & Lebeau (2015) [49] τ u s = ψ S r , c tan ϕ
where S r , c = 1 ψ < ψ a 1 1 e ψ α ψ > ψ a
, α
17. Zhou et al. (2016) [50] τ u s ψ S c a p tan ϕ
where S c a p = C ψ α C ψ A ψ 1 α C ψ A ψ
A ψ = 1 In ψ / 1 In ψ d
C ψ = 0.5 × erfc In ψ / ψ m / 2 ζ ψd = 106 kPa
α, ζ, ψm
18. Zhai et al. (2019) [52] τ u s = ψ S tan ϕ + c s
where cs can be obtained from the SWCC curve and micro contact angle α
19. Gao et al. (2020) Equation (III) [53] τ u s = ψ S tan ϕ , ψ ψ max τ = τ max + ψ S ψ max S max tan ϕ , ψ > ψ max
where ‘max’ = maximum skeleton stress
20. Pham & Sutman (2023) [54] τ u s = ψ 1 S e n S e tan ϕ , where n = porosity and S e = S 2 / 3 S r 2 / 3 / 1 S r 2 / 3
Note: ψ = suction, ψa = air-entry value, ψr = residual suction, S = degree of saturation, Sr = degree of saturation corresponding to residual degree of saturation, Pat = atmospheric pressure.
Table 4. Common parameters of colloidal-silica-cemented sand.
Previous Models (Can Increase First Then Decrease)Values of Parameters
Air-entry suction, ψa (kPa)31
Residual suction, ψr (kPa)691
Degree of saturation at residual suction, Sr (%)18.6
Effective friction angle at saturation, ϕ′ (degrees)50.97
Effective cohesion at saturation, c′ (kPa)11.2
Table 5. Parameters of previous models.
Previous Models (Can Increase First Then Decrease)Values of Parameters
Vanapalli et al. (1996) Equation (I) [36]κ = 3.71
Sun et al. (2000) [40]a = 18.8
Miao et al. (2002) [41]a = 0.19
Vilar (2006) [44]a = 0.016, b = 0.45
Houston et al. (2008) [45]a = 29.5, b = 1.12
Guan et al. (2010) [47]b = −0.42, y = 4.44
Hossain & Yin (2010) [48]κ = 4.4 × 10⁴
Konrad & Lebeau (2015) [49]∧ = 1.41, α = 1.0
Zhou et al. (2016) [50]α = 0.386, ζ = 1.03, ψm = 157
Table 6. Parameters for predicting shear strength of unsaturated colloidal-silica-cemented sand.
Parameter DescriptionParameterUnsaturated Colloidal-Silica-Cemented Sand
Soil water characteristic curve (SWCC) [50]α0.386
ζ1.03
ψm157
Capillary condensationβ0.4
Size effectb0.075
Table 7. Effects of b and β on the goodness-of-fit metric.
ParameterEffect of bEffect of β
b = 0b = 0.025b = 0.05b = 0.075β = 0.1β = 0.2β = 0.3β = 0.4
MAPE0.3190.1630.06600.0270.0230.0140
RMSE98.06249.65620.030027.01920.39611.7410
Table 8. Physical meaning and underlying mechanism of parameters.
ParameterPhysical MeaningStrength EffectUnderlying Mechanism
βStress sensitivity of capillary condensationIncreasesHigher capillary condensation probability enhances suction strength
bCrack size effect near desiccationDecreasesShrink and crack weaken cementation between sand particles
Disclaimer/Publisher’s Note: The statements, opinions and data contained in all publications are solely those of the individual author(s) and contributor(s) and not of MDPI and/or the editor(s). MDPI and/or the editor(s) disclaim responsibility for any injury to people or property resulting from any ideas, methods, instructions or products referred to in the content.