Article

Prediction of Transient NOx Emissions from a Non-Road Heavy-Duty Diesel Engine Based on the PSO-XGBoost Algorithm

by
Zhilong Zhang
,
Pan Wang
* and
Zhenkai Tang
School of Automotive and Traffic Engineering, Jiangsu University, Zhenjiang 212013, China
*
Author to whom correspondence should be addressed.
Appl. Sci. 2026, 16(11), 5632; https://doi.org/10.3390/app16115632
Submission received: 3 May 2026 / Revised: 31 May 2026 / Accepted: 2 June 2026 / Published: 4 June 2026

Abstract

This paper proposes a machine learning-based framework for predicting transient nitrogen oxide (NOx) emissions from non-road heavy-duty diesel engines under NRTC conditions. The model combines the PSO and XGBoost algorithms to predict transient NOx emissions from non-road heavy-duty diesel engines. Experimental results were obtained through engine bench tests. Pearson’s correlation coefficient (PCC), Spearman’s correlation coefficient (SCC), and SHAP analysis were used to evaluate the relationship between engine operating parameters and NOx emissions, thereby improving the interpretability of features and the reliability of input parameter selection. The hyperparameters of the XGBoost model were optimized using the PSO algorithm. The optimized model exhibits good predictive performance. On the training set, the model’s R2 coefficient reached 0.9989, MAE was 1.16 ppm, and RMSE was 1.57 ppm. On the test set, the R2 value was 0.9662, and the MAE and RMSE were 6.33 ppm and 8.97 ppm, respectively. Furthermore, the PSO-XGBoost model was compared and analyzed with six traditional models. Finally, the generalization of the PSO-XGBoost model and its underlying mechanisms were discussed. The results indicate that the proposed PSO-XGBoost framework can effectively capture nonlinear relationships among diesel engine operating parameters and achieve accurate transient NOx prediction for non-road heavy-duty diesel engines.

1. Introduction

Diesel engines are widely used in various sectors, such as vehicles on the road and non-road construction equipment, as well as power-generation systems; they have high thermal efficiency, strong power output, excellent fuel economy and good reliability [1]. However, they also produce a large amount of NOx in their operation; thus, serious health risks to the lungs of people and problems in the environment are likely to occur, such as photochemical smog, acid rain and ground-level ozone formation [2,3,4]. Such transient operating conditions are generally characterized by frequent acceleration and deceleration, rapid load variations, and prolonged high-load operation. Consequently, NOx emissions from these engines exhibit significant fluctuations and highly nonlinear characteristics due to complex multi-parameter coupling effects [5]. Accurately predicting the emission of transient NOx under these conditions is still a major issue, and it is now required to improve the optimization of emission monitoring and control and intelligent calibration for heavy-duty non-road diesel engines [6].
Due to the high NOx emissions of diesel engines, considerable research has focused on both emission reduction and emission measurement technologies [7]. Although NOx sensors are commonly used for emission monitoring, their signals may be affected by response delay, measurement uncertainty, and cross-sensitivity to interfering species such as NH3 in urea-SCR systems [8,9,10,11,12]. To alleviate these problems, sensor correction methods, frequency-domain analysis, Kalman-filter-based estimation, and observer-based approaches have been proposed to improve measurement accuracy and signal reliability [13]. Nevertheless, these methods still depend strongly on sensor calibration, aftertreatment conditions, and the representativeness of experimental data. In addition, bench tests and real-driving emission tests are usually time-consuming and costly, and it is difficult to cover all transient operating conditions only through direct measurement [10]. Therefore, developing reliable data-driven virtual sensing models for transient NOx prediction is necessary to complement experimental measurement and support emission-control optimization. In addition to conventional measurement and correction methods, alternative modelling approaches have also been developed for NOx and pollutant prediction. Deep neural networks have been used as virtual sensors for diesel-engine NOx prediction, showing good capability in learning nonlinear relationships between operating parameters and emissions [14]. Long Short-Term Memory (LSTM) based models have also been applied to transient NOx prediction because they can capture time-dependent emission characteristics [15]. Beyond engine systems, agent-based modelling has been used to simulate interactions between air pollutants and urban greenery, including the diffusion and absorption of NOx, CO2, and particulate matter by trees and green infrastructure [16]. These studies indicate that data-driven, deep-learning, reinforcement-learning, and agent-based modelling methods provide useful references for the dynamic prediction and control of harmful emissions.
Given the rise in stringency for emission standards, more high-tech control devices have been developed in recent years to meet the new requirements of low-emission, high-efficiency diesel engines. Owing to their good predictive performance and relatively simple implementation, machine learning methods have attracted increasing attention in NOx emission research [17,18,19]. Machine learning methods have been widely applied to NOx prediction because of their ability to model nonlinear relationships between engine operating parameters and emissions. For example, mutual-information-based feature selection combined with BP neural networks has been used to identify important input variables and improve NOx prediction accuracy [20]. Machine-learning-based NOx models have also shown potential for virtual sensing and engine model-based control applications [21]. In addition, OLS-RBF models, tree-based ensemble models, and recurrent neural networks have been investigated for NOx prediction in diesel engines, gas turbines, boilers, and non-road engines [22,23,24,25,26]. These studies demonstrate that data-driven models can reduce the dependence on repeated emission tests and provide useful support for emission monitoring and control. However, neural-network-based models are often sensitive to model structure, training data quality, and parameter settings, while ensemble models such as RF, CatBoost, LightGBM, and XGBoost require careful hyperparameter tuning to achieve stable prediction performance. Therefore, optimization algorithms are needed to improve model robustness and reduce the uncertainty caused by manual parameter selection.
Intelligent optimization algorithms have been increasingly combined with machine learning models for emission prediction and control. For instance, NSGA-II, Bayesian optimization, swarm intelligence strategies, reinforcement learning, and artificial neural networks have been used for operating-parameter optimization, model calibration, and fuel-economy/emission co-optimization [27,28,29]. Among these methods, PSO has attracted attention because of its simple structure, fast convergence, and strong global search capability. Nevertheless, conventional PSO may suffer from premature convergence and entrapment in local optima, especially when solving complex nonlinear optimization problems. To overcome these limitations, many improved PSO variants have been proposed, including hybrid multi-swarm PSO, adaptive PSO, RCGA-PSO, and PSO algorithms combined with crossover or mutation operators. Akopov et al. [30] proposed a Hybrid Multi-Swarm Particle Swarm Optimization algorithm that combines parallel multi-swarm search with real-coded genetic operators, including crossover and mutation, thereby improving time efficiency and solution accuracy in simulation-based optimization problems. Zhang et al. [31] developed a segmented mutation PSO algorithm, in which global mutation is used in the early stage to enhance global exploration, while constrained and small-scale mutation operations are applied in the later stage to avoid local optima and improve convergence speed. These studies indicate that PSO-based optimization can improve the search capability and robustness of machine learning models. Therefore, in this study, PSO is introduced to optimize key XGBoost hyperparameters for transient NOx emission prediction from a non-road heavy-duty diesel engine.
To address the limitations of existing transient NOx prediction studies under highly dynamic operating conditions, this study develops a PSO-XGBoost framework for transient NOx prediction of a non-road heavy-duty diesel engine under NRTC conditions. PCC, SCC, and SHAP analyses are combined to improve nonlinear feature interpretation and input parameter selection reliability. In addition, PSO is employed to optimize the key hyperparameters of the XGBoost model to improve prediction robustness and generalization capability under transient operating conditions. Comparative analyses and cross-validation studies are further conducted to systematically evaluate the effectiveness of the proposed framework.

2. Methods

2.1. Engine Parameters

Table 1 shows the specifications of the engine chosen for this study. The engine of the test car is a 9-litre six-cylinder diesel engine that uses commercial diesel fuel.

2.2. Experimental Protocol

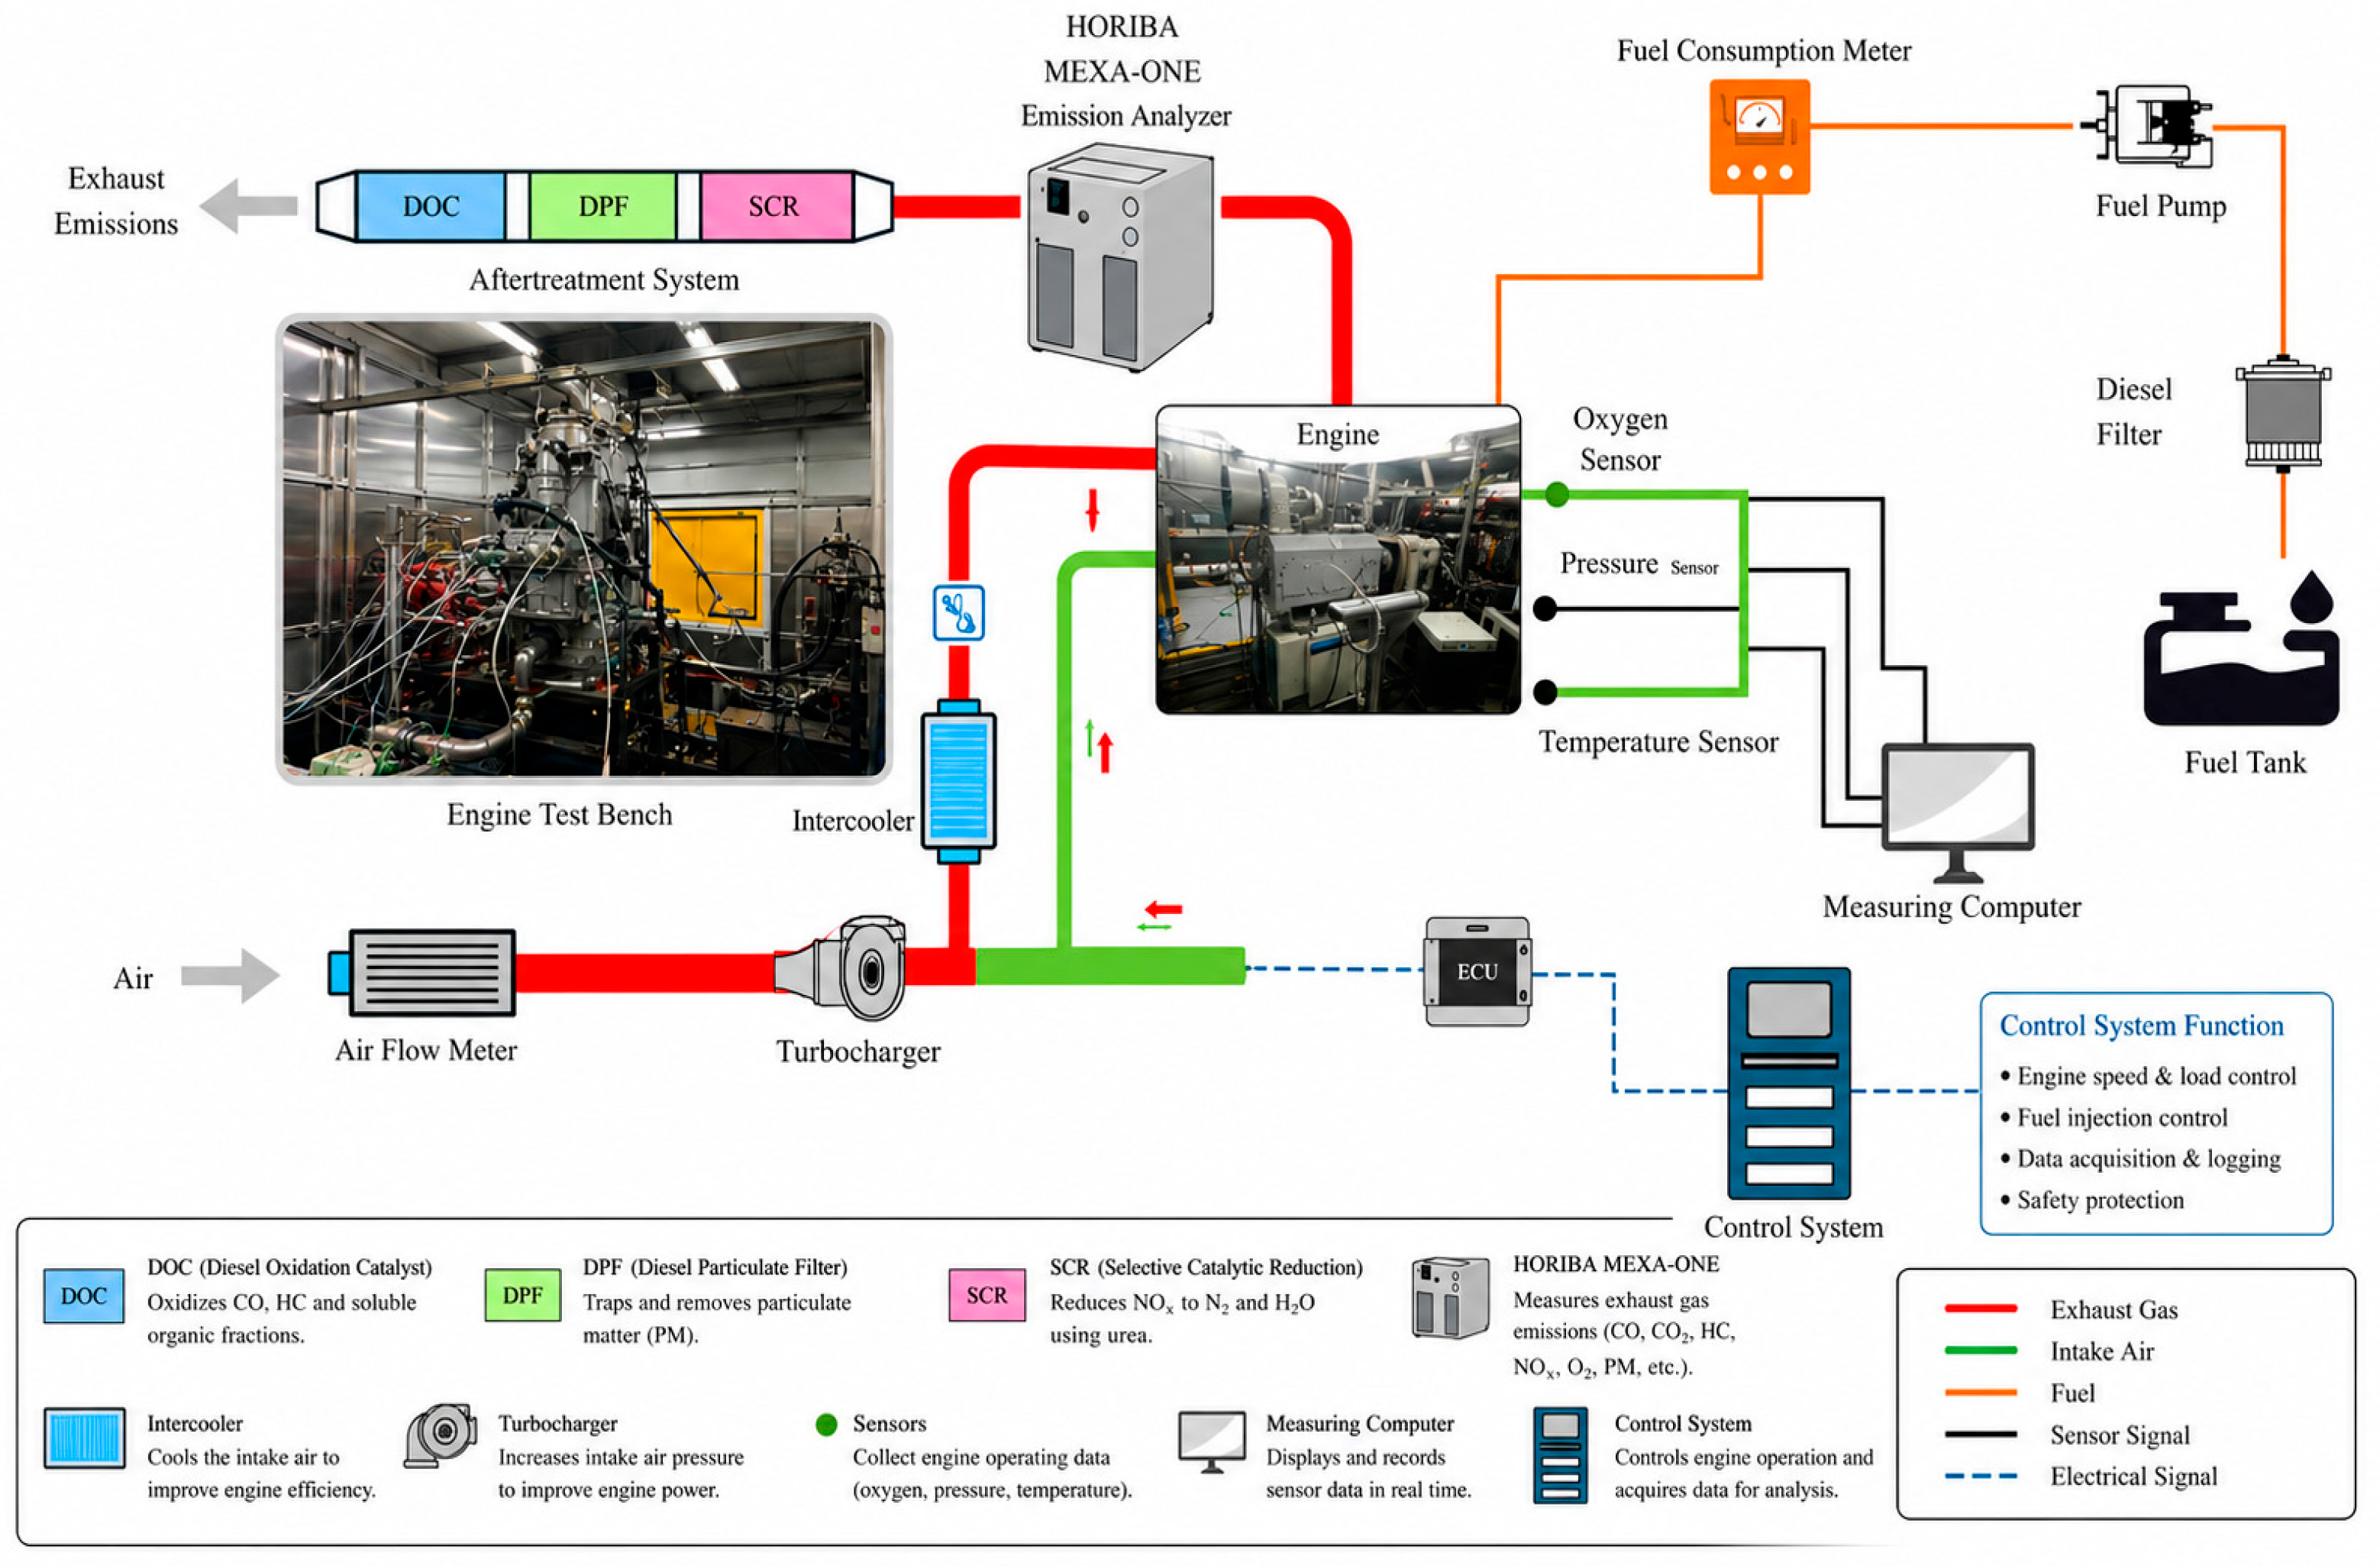
The configuration of the diesel engine test bench is shown in Figure 1. The test system consisted of a non-road heavy-duty diesel engine, a high-pressure common-rail fuel system, a dynamometer, an electronic control unit (ECU), an AVL472 control system, a fuel supply unit, control software, and a set of sensors. Colored arrows indicate the different flow paths within the engine test setup: red = exhaust gas, green = intake air, orange = fuel, black = sensor signals, and blue dashed = electrical/control signals. Arrowheads show the direction of flow or signal transmission. The dynamometer was used to control the engine load and measure the engine speed (r/min) and torque (N·m). Multiple sensors were installed to collect operating parameters. The NOx concentration was measured using an AVL472 exhaust gas analyzer. According to the manufacturer’s specifications, the analyzer accuracy was within ±2 ppm or ±1% of the measured value. Before each experiment, the analyzer was calibrated using certified standard gases to minimize systematic measurement errors. The reported accuracy refers only to the analyzer specification and should not be interpreted as the overall uncertainty of the transient NOx measurement system. Potential influences arising from analyzer response time, sampling system delay, and transient exhaust gas fluctuations were mitigated through signal synchronization and unified data acquisition procedures. During data acquisition, all measured parameters were sampled at 1-s intervals. Engine speed, torque, intake and exhaust flow rates, fuel injection parameters, exhaust temperature, urea injection quantity, and nitrogen oxide concentration were recorded synchronously using INCA 7.2 software. All sensor signals were aligned using a unified time sequence to ensure data consistency. Outliers caused by transient fluctuations and exceeding the normal operating range were removed from the dataset. Missing values were interpolated using adjacent time-series data. Finally, 1120 valid samples were obtained and divided into training and test sets at a ratio of 4:1 for model construction and performance evaluation. The test dataset was excluded from model training and hyperparameter optimization and was used only for independent model evaluation. Before model training, the input variables were normalized to reduce the influence of differences in units and magnitudes among the measured parameters.

2.3. Introduction to the Experiment

Due to the highly transient operating characteristics of non-road diesel engines, steady-state test cycles cannot adequately represent real operating conditions. Therefore, this study uses data collected under the Non-Road Transient Cycle (NRTC). The NRTC was developed by the U.S. Environmental Protection Agency (EPA) in cooperation with authorities in the European Union and is widely used for emission certification and type approval of non-road engines. The cycle is designed to simulate typical operating conditions of non-road vehicles on an engine test bench and is used to evaluate pollutant emissions. The total duration of the NRTC is 1200 s. The emission regulations for non-road mobile machinery in China also adopt the NRTC. Therefore, research based on NRTC is crucial for evaluating emission control performance under transient conditions.

2.4. Data Processing

During the experiments, 12 parameters were recorded, including engine speed (RC), output torque (TQ), intake flow (IF), exhaust flow (EF), cycle fuel injection quantity (CQ), rail pressure (RP), high-pressure fuel pump duty cycle (MI), high-pressure fuel pump drive current (MP), inlet NOx concentration (IN), exhaust temperature (ET), urea injection quantity (UQ) and NOx emissions(EN). Among these parameters, EN was selected as the target variable, while the remaining parameters were used as input features.
However, not all input features are suitable for model construction. Some features may be redundant, increasing computational cost without improving accuracy. Therefore, it is necessary to preprocess the collected data and select the optimal subset of features as model input. Common correlation analysis methods include PCC and SCC [32,33]. The PCC is used to evaluate linear relationships. The definition of the PCC is calculated as follows:
p = M i M ¯ N i N ¯ M i M ¯ 2 N i N ¯ 2 ,
Here, M i and N i represent the true values of the two parameters, while M ¯ and N ¯ represent their mean values.
The SCC is calculated as follows:
s = 1 6 d i 2 n n 2 1 ,
In this context, d i denote the rank difference between the parameters, and n denotes the sample size.
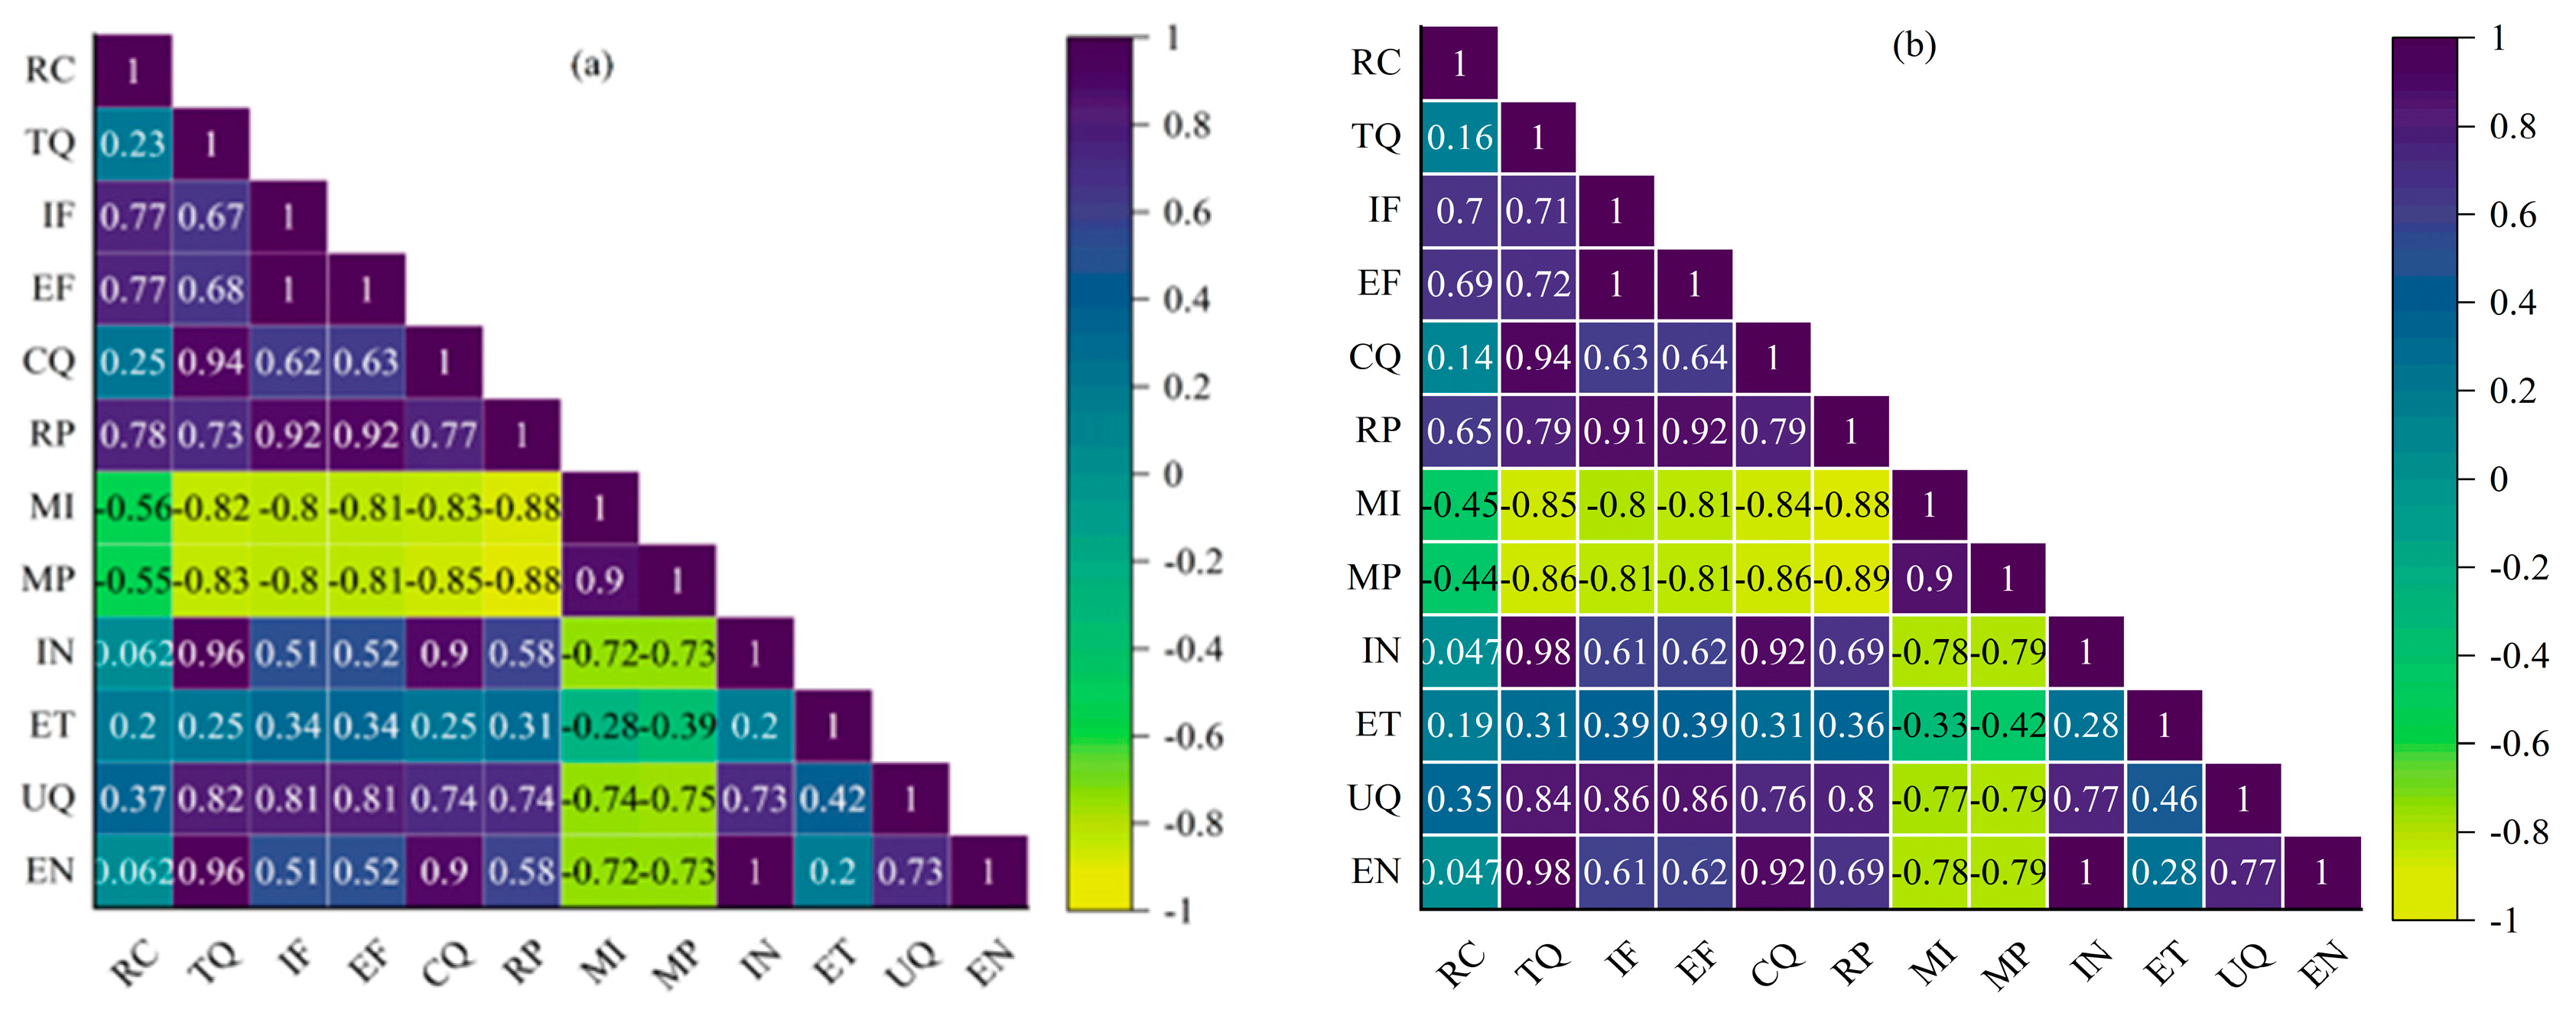
Figure 2 is the correlation matrix of the input features and the output. Figure 2a and Figure 2b display the results of PCC and SCC analysis, respectively. It is generally known that a correlation coefficient of 0.3 or more shows that the variables are related to some extent and thus can be used as a criterion to select input features for a model [34]. As displayed in Figure 2a, the correlation coefficients among TQ, CQ and UQ with EN are high at 0.96 0.90 and 0.73. MI and MP are also negatively correlated with most of the variables, and the coefficients are around −0.7. This inverse relationship also has analytical value, and the change patterns of this feature are quite different from those of the others. Figure 2b displays the SCC analysis results. Overall, the SCC results are generally consistent with those obtained from PCC analysis, with only slight differences in the correlation coefficients. The two methods identified almost the same highly correlated variables, indicating that the monotonic linear relationships between the variables are relatively consistent.
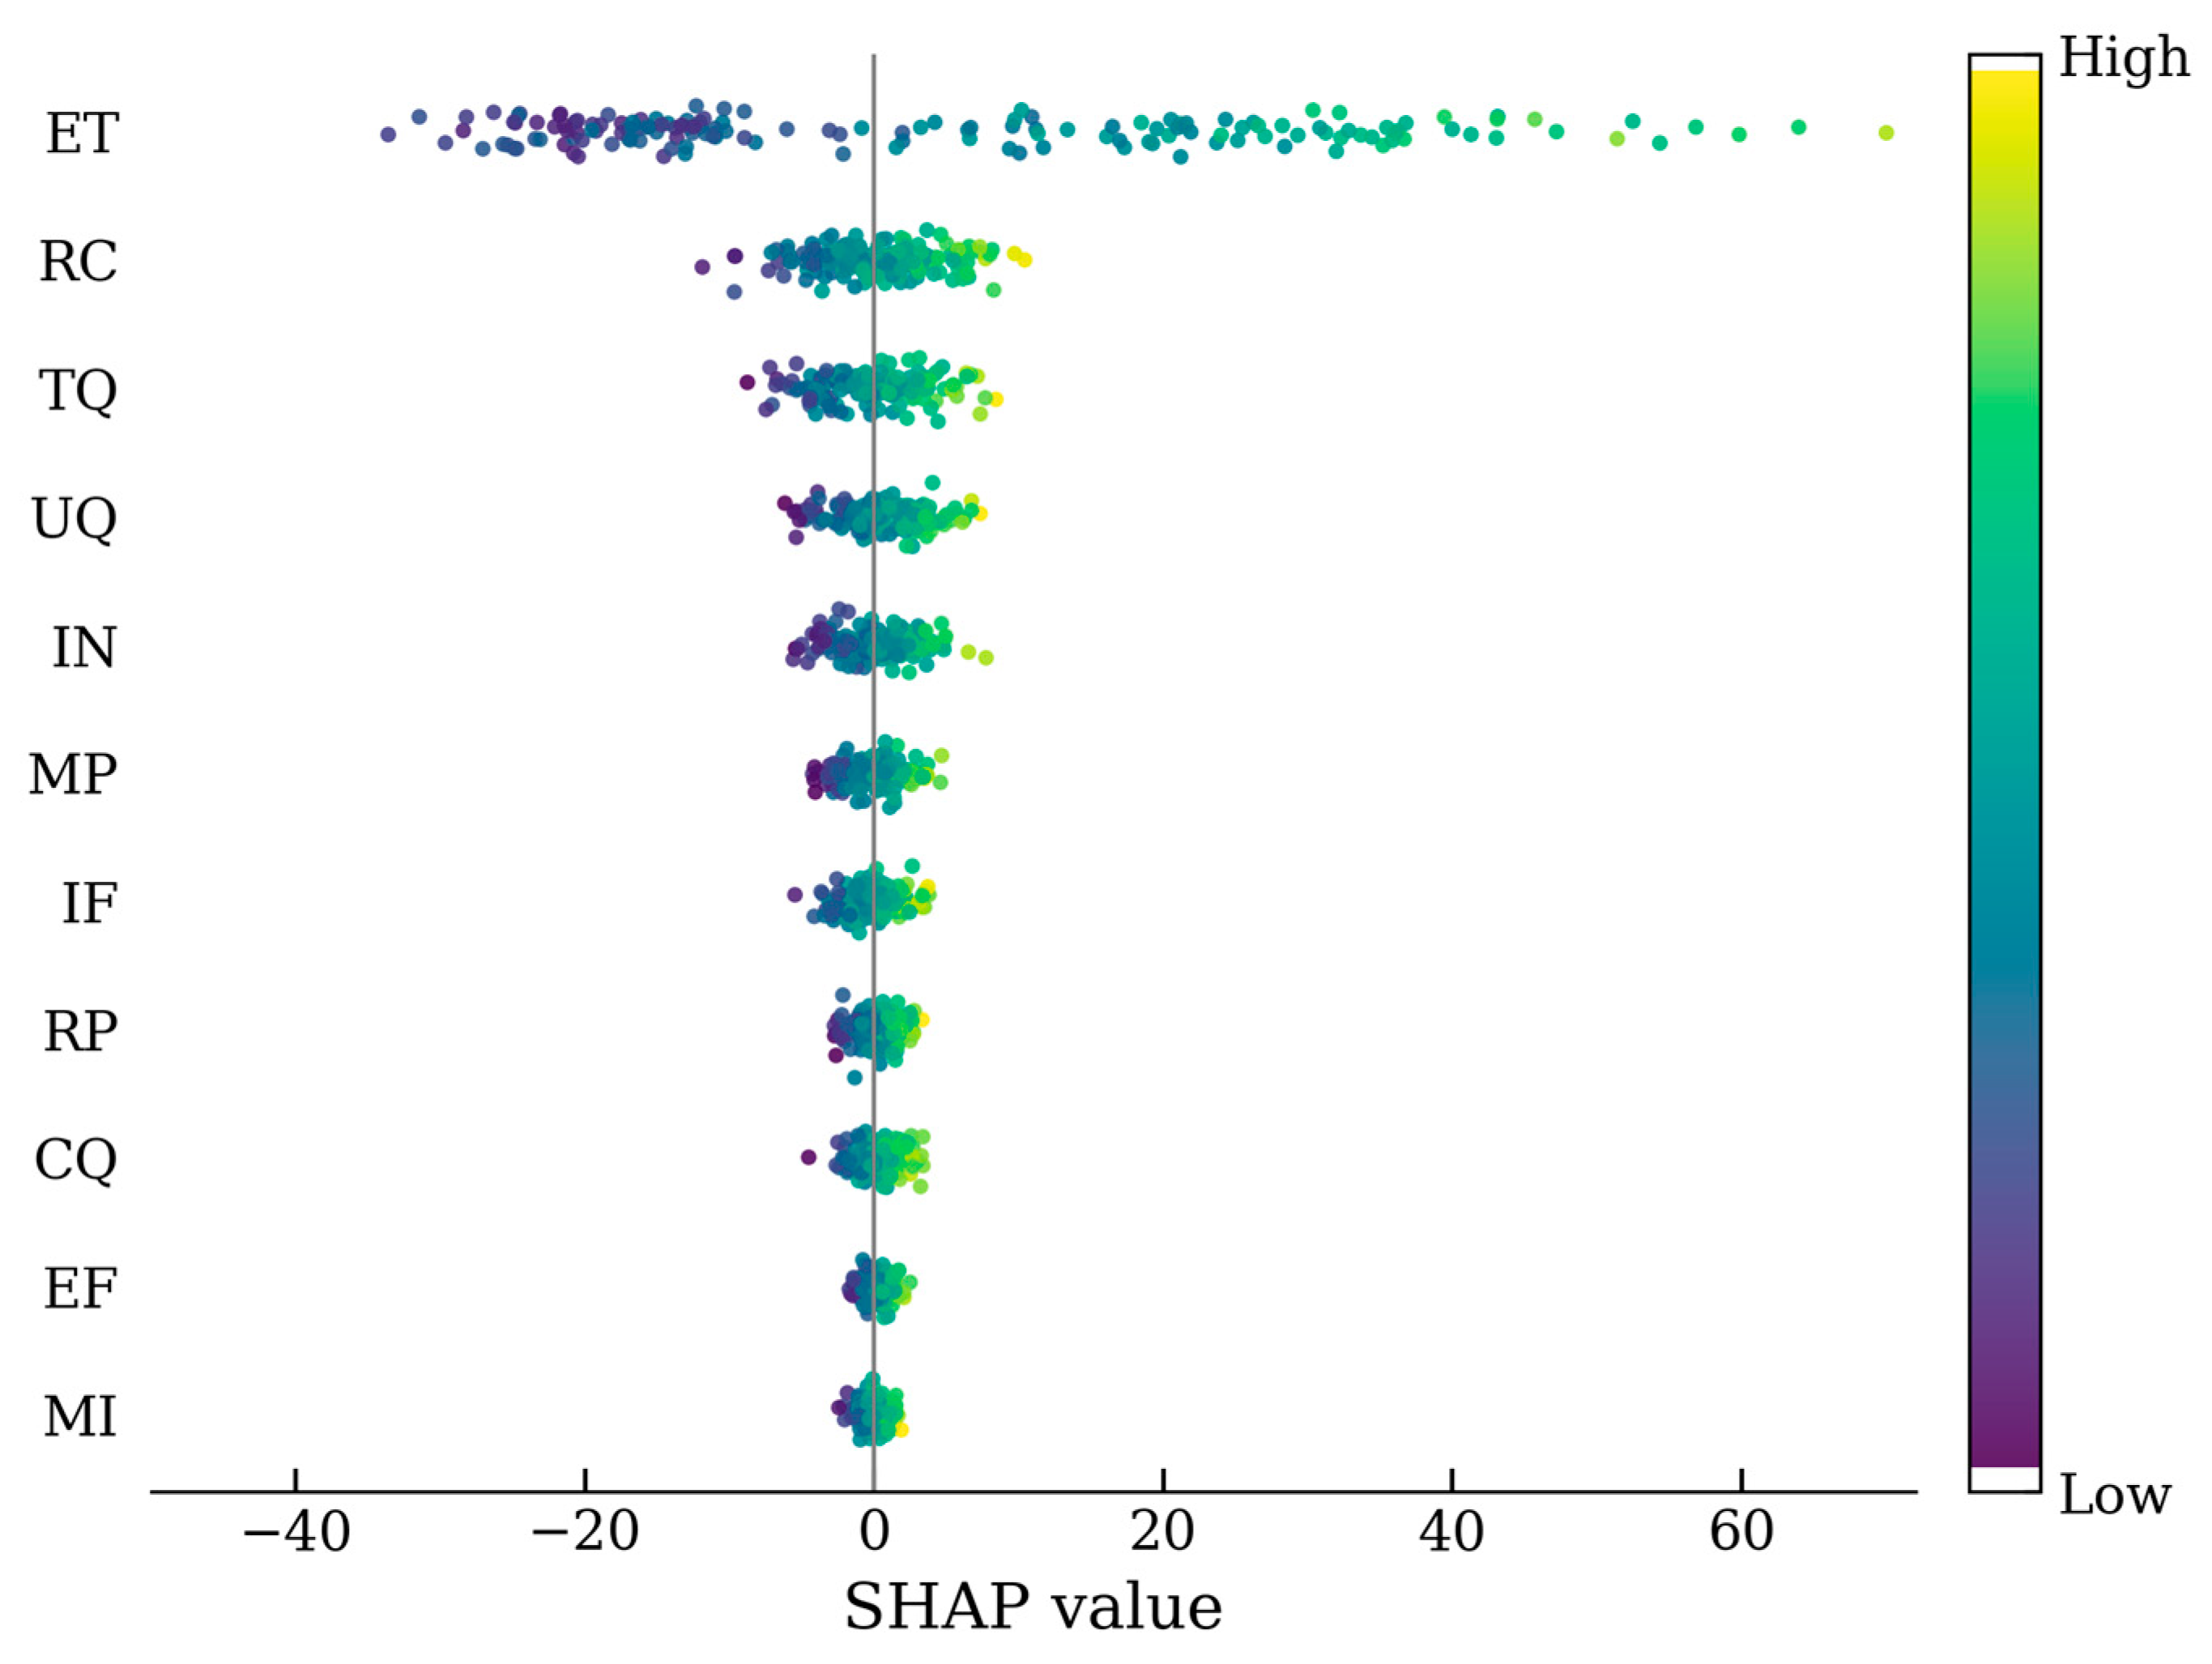
The SHapley Additive exPlanations (SHAP) feature importance results are presented in Figure 3. Notably, the feature importance ranking obtained from SHAP analysis is not entirely consistent with the PCC and SCC results. This discrepancy mainly arises from the different analytical mechanisms of these methods. PCC primarily evaluates linear relationships between variables, whereas SCC reflects monotonic relationships. However, transient NOx formation in diesel engines exhibits strong nonlinear coupling, threshold effects, and dynamic interactions among multiple operating parameters. As a result, some variables with weak linear correlations may still make substantial nonlinear contributions to NOx emissions.
In contrast, SHAP provides a nonlinear feature contribution analysis that can more effectively capture complex feature interactions and feature dependencies that traditional correlation analyses cannot fully identify. For example, ET exhibits relatively moderate correlation coefficients in PCC/SCC analysis, whereas its SHAP importance is the highest, indicating that temperature-related effects play a dominant nonlinear role in the transient NOx formation process.
The results indicate that ET, RC, TQ, UQ, IN, MP, IF, RP, and CQ have high nonlinear importance and strong physical relevance to transient NOx generation. Therefore, these parameters were selected as input parameters for the final model.
The engine operating parameters are summarized as follows:
X i = [ R C i , T Q i , I F i , C Q i , R P i , M P i , I N i , E T i , U Q i ] ,
Exported NOx:
y i = E N i ,

2.5. eXtreme Gradient Boosting Algorithm

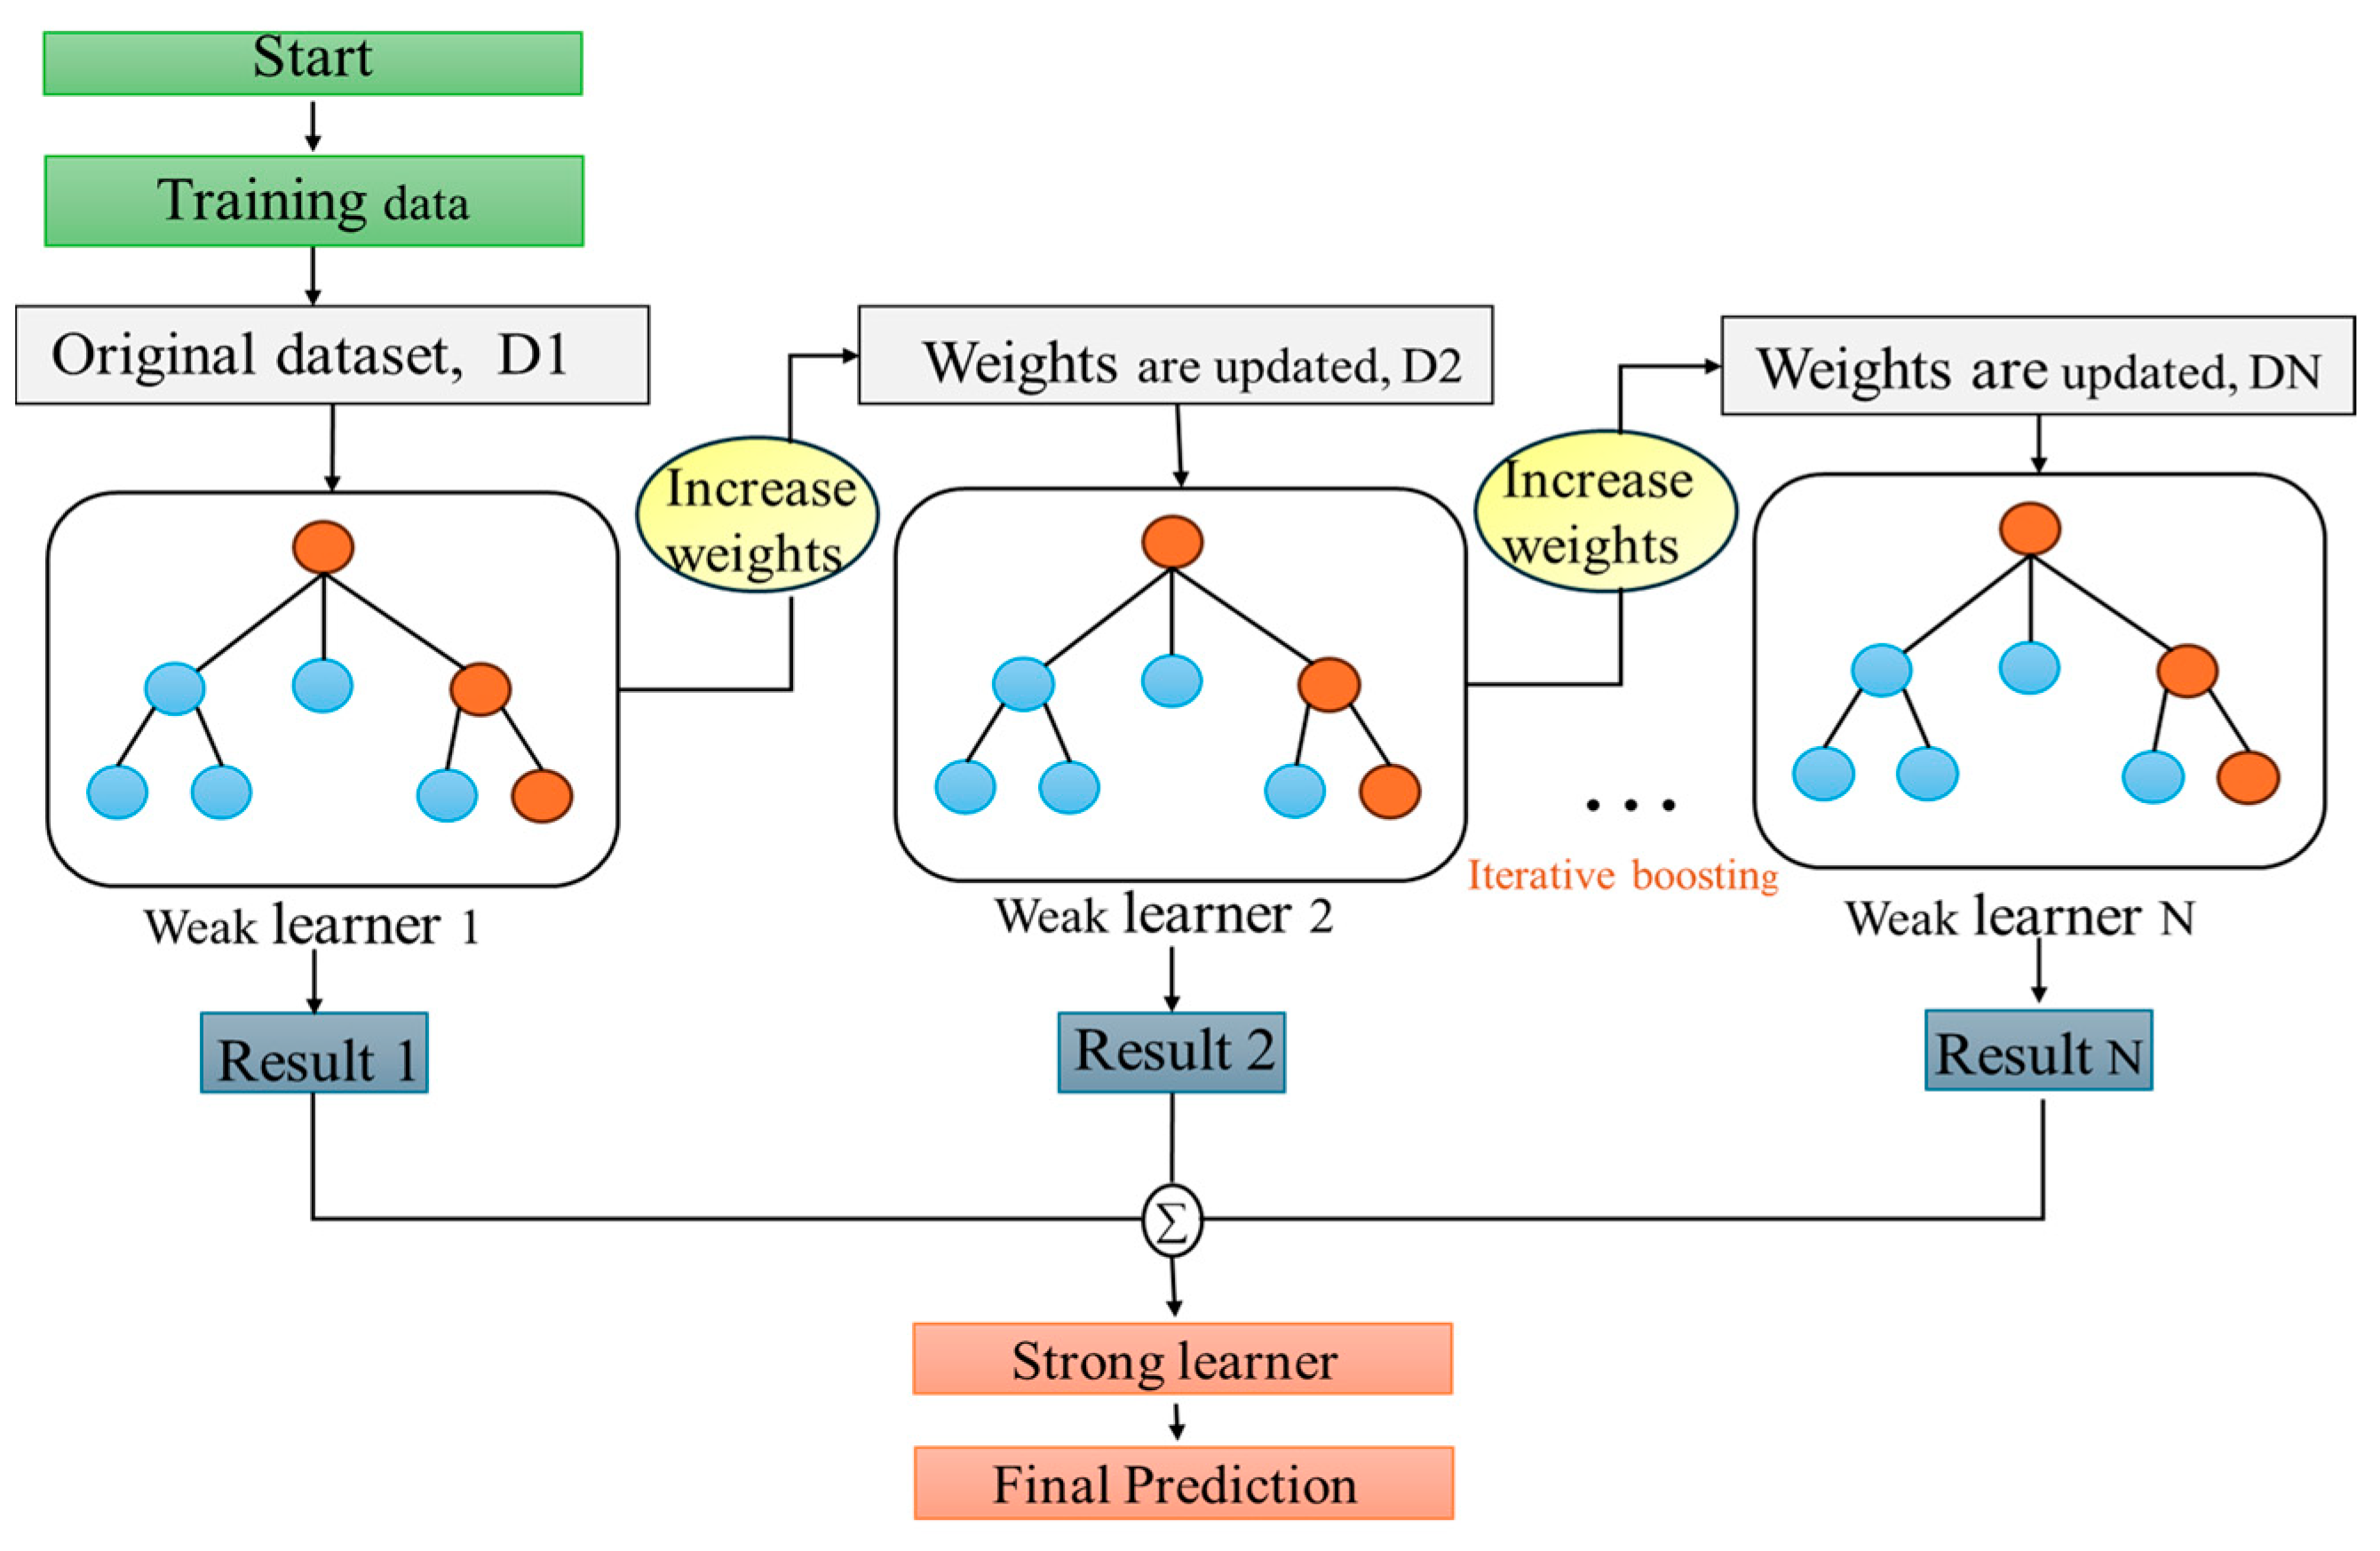
Chen et al. [35] proposed the XGBoost algorithm. XGBoost is an efficient tree-based ensemble learning algorithm developed within the gradient boosting framework [36,37]. The algorithm iteratively constructs multiple weak learners and combines their outputs through weighted aggregation to generate the final prediction. In the diagram, black nodes represent the omitted intermediate iterations, while blue and orange nodes represent different feature segmentation conditions used in constructing the decision tree, used only for visual differentiation. These colors do not represent specific variables or quantitative values. For classification tasks, the final category is determined from the aggregated outputs. For regression tasks, the predicted numerical value is directly obtained from the cumulative output. The workflow of the XGBoost algorithm is illustrated in Figure 4.
Let the training sample be D = { ( x i , y i ) } i = 1 n , where the input features are X and the target variable is Y. The joint distribution p ( X , Y ) describes the relationship between the input and the output. By constructing the prediction function of an additive model:
y ^ i = k = 1 K f k ( x i ) , f k F ,
The XGBoost algorithm iteratively fits residuals by minimizing an objective function composed of a loss term and a regularization term, thereby progressively improving prediction accuracy. The introduction of the regularization term effectively controls model complexity and enhances generalization performance while maintaining high predictive capability.
Within the gradient boosting framework, XGBoost utilizes second-order gradient information to accelerate model convergence and improve prediction accuracy. In addition, the algorithm can automatically capture feature interactions and model the nonlinear relationships between input variables and NOx emissions. Row and column sampling strategies are further employed to improve model robustness and reduce the risk of overfitting. These characteristics enable XGBoost to achieve accurate and robust NOx prediction under conditions involving high-dimensional features, complex nonlinear interactions, and measurement noise.

2.6. Particle Swarm Optimization Algorithm

Kennedy et al. [38] proposed the PSO algorithm. PSO is a classical swarm intelligence optimization algorithm characterized by a simple structure, a small number of parameters, ease of implementation, fast convergence, and strong global search capability [39,40]. Inspired by the foraging behavior of bird flocks, PSO performs optimization by simulating the cooperative search process of a swarm. In PSO, each candidate solution is represented as a particle in the search space. Each particle is characterized by two attributes, namely position and velocity, and continuously updates its state during the iterative process. During optimization, particles rely not only on their own historical best positions but also on the global best position identified by the swarm. This mechanism enables particles to share information and evolve collaboratively. Particles adjust their velocities to move toward both the personal and global optima, thereby achieving an effective balance between exploration and exploitation in the search process. Let the current position of a particle be x i and its velocity be v i ; the formulas for updating velocity and position are as follows:
v i k + 1 = w v i k + c 1 r 1 ( p b e s t i k x i k ) + c 2 r 2 ( g b e s t k x i k ) ,
x i k + 1 = x i k + v i k + 1 ,
where v i k represents the velocity of particle a at the kth iteration; x i k represents the position of the particle at the kth iteration; w represents the inertia weight; c 1 c 2 represents the learning factor (acceleration coefficient); r 1 r 2 represents a random number in the range [0, 1]; p b e s t i k represents the historical best position of the individual particle; and g b e s t i k represents the historical best position of the population.
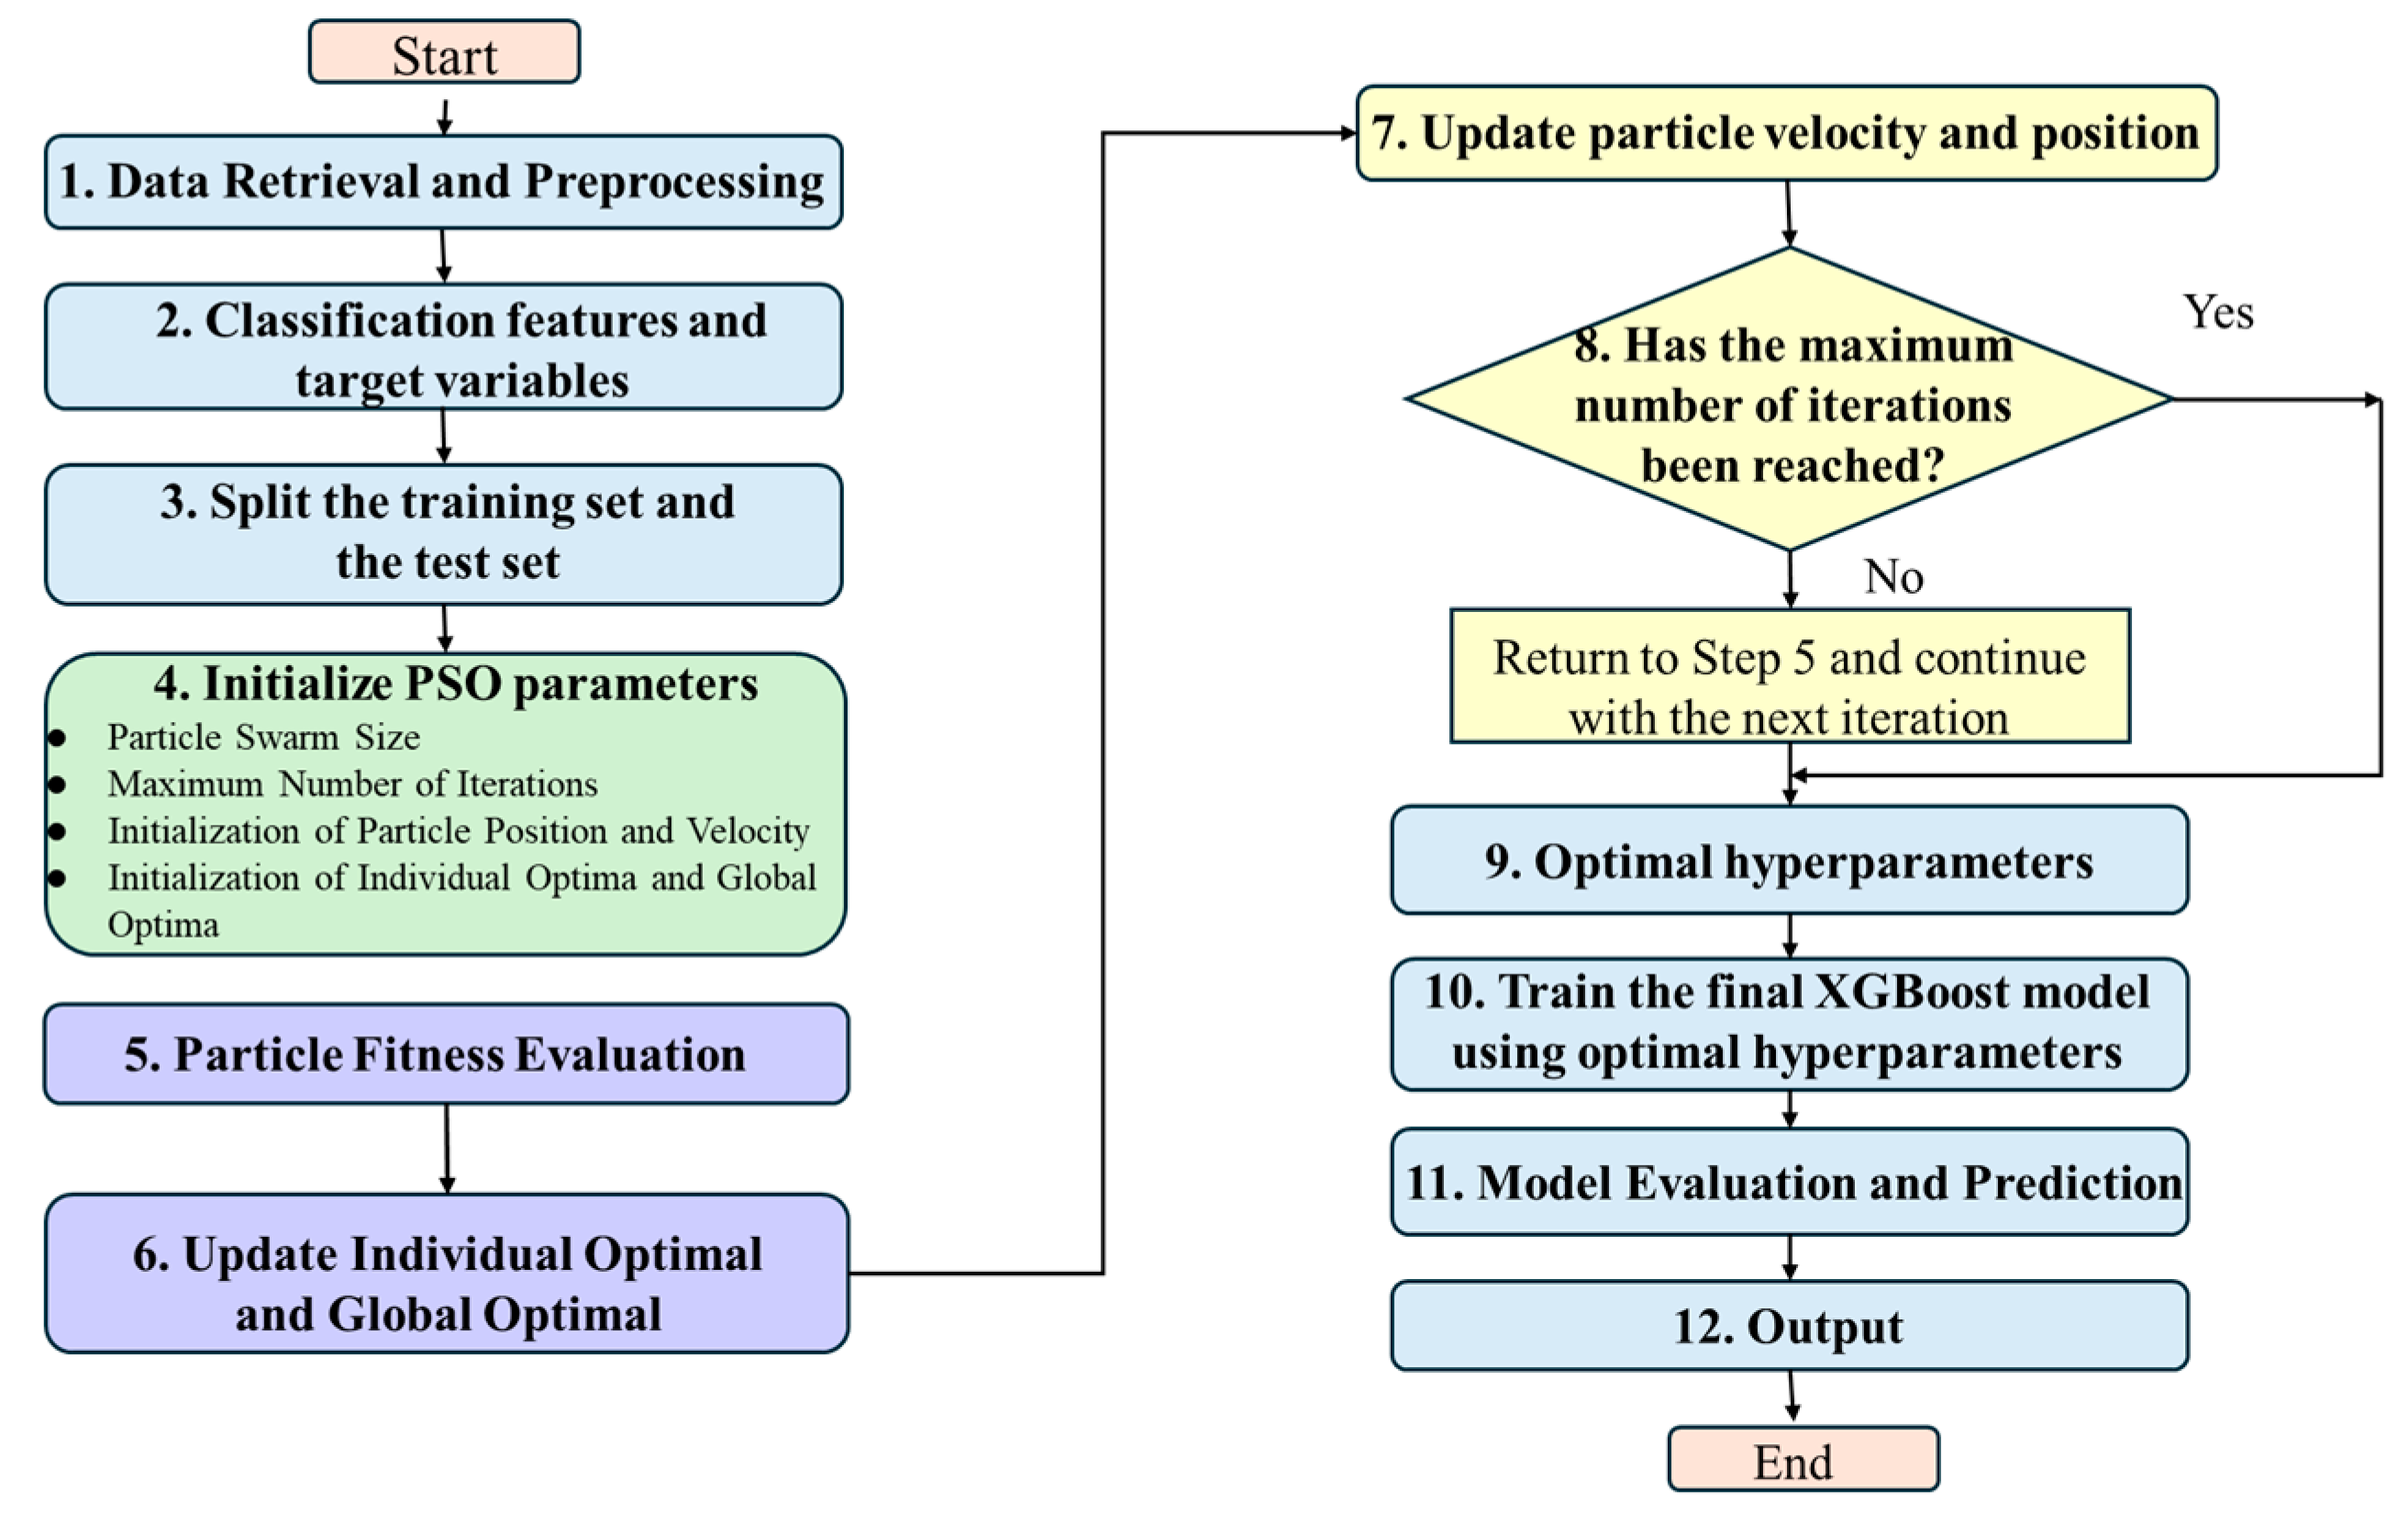
Figure 5 describes a flowchart illustrating the optimization of the XGBoost algorithm using the PSO algorithm. Different colors are used only for visual distinction and improved readability and do not carry any specific technical or algorithmic meaning. By integrating PSO with XGBoost, the proposed model can automatically identify optimal hyperparameter combinations. This approach avoids the limitations of manual parameter tuning and improves model robustness. In addition, PSO provides strong global optimization capability and fast convergence speed, enabling efficient exploration of the high-dimensional hyperparameter space of XGBoost. Compared with traditional methods, the PSO-XGBoost achieves higher prediction accuracy and better generalization performance with relatively low computational cost. Therefore, it is more suitable for transient NOx emission prediction under complex operating conditions.
This work employs PSO algorithm to optimize the key hyperparameters of XGBoost, thereby improving prediction performance. In PSO, each particle represents a combination of XGBoost hyperparameters, as listed in Table 2. Specifically, n_estimators denotes the number of boosting trees, max_depth denotes the maximum depth of each decision tree, and learning_rate controls the contribution of each tree during the boosting process. In addition, gamma represents the minimum loss reduction required for node splitting, subsample denotes the fraction of training samples randomly selected for each tree, and colsample_bytree denotes the fraction of input features randomly selected for tree construction. The parameters reg_alpha and reg_lambda correspond to the L1 and L2 regularization coefficients applied to leaf weights, respectively. The search ranges of the XGBoost hyperparameters were selected according to previous studies and practical experience in machine-learning-based emission prediction. The fitness function is defined as the RMSE obtained by performing 5-fold cross-validation on the training set.
The population size of PSO was set to 20, and the maximum number of iterations was set to 50. The inertia weight was set to 0.7, while the cognitive and social acceleration coefficients were both set to 1.5. The optimization process stopped when the maximum number of iterations was reached, or when the change in particle position or fitness value was smaller than 1 × 10⁻⁸. The detailed PSO parameters are summarized in Table 3.
The prediction model established by PSO-XGBoost is as follows:
y ^ i = F ( X i ; θ ) ,
θ is a combination of hyperparameters for XGBoost.
θ = [ n e s t , d , η , γ , s , c , α , λ ] ,
The objective function is:
min θ J ( θ ) = 1 K k = 1 K 1 n k i = 1 n k y i F ( X i ; θ ) 2 ,

2.7. Evaluation Metrics

Machine learning can be used to build a model of a complex system, but at the same time, choosing a suitable evaluation index is a key step in measuring the model’s performance reliably [41]. R2, MAE and RMSE are typical indicators of model performance in most applications of machine learning [42,43,44]. The three above indices will be used in the current study to evaluate all of them.
The calculation equation for R2 is as follows:
R 2 = i = 1 n y ^ i y i 2 i = 1 n y i y ¯ 2 ,
The computational equation for MAE is as follows:
M A E = 1 / n i = 1 n y ^ i y i ,
The formula for calculating RMSE is as follows:
R M S E = 1 / n å i = 1 n y i y ^ i 2 ,
Here, y ^ i represents the model’s predicted value, y i represents the true value, and n represents the sample size.

3. Results

Correlation and SHAP analyses indicate that diesel engine NOx emissions are governed by complex coupling effects among multiple operating parameters. Due to the strong nonlinear relationships among these factors, traditional linear modeling approaches are insufficient for accurately predicting NOx emissions. Historically, NOx emission analysis has primarily relied on extensive laboratory experiments. However, with the increasing complexity of modern diesel engine systems, such approaches have become both time-consuming and costly. Machine learning techniques provide an effective alternative by reducing experimental burden while improving prediction efficiency. Therefore, this section systematically evaluates the prediction performance of the proposed PSO-XGBoost model.

3.1. Experimental Results and Analysis

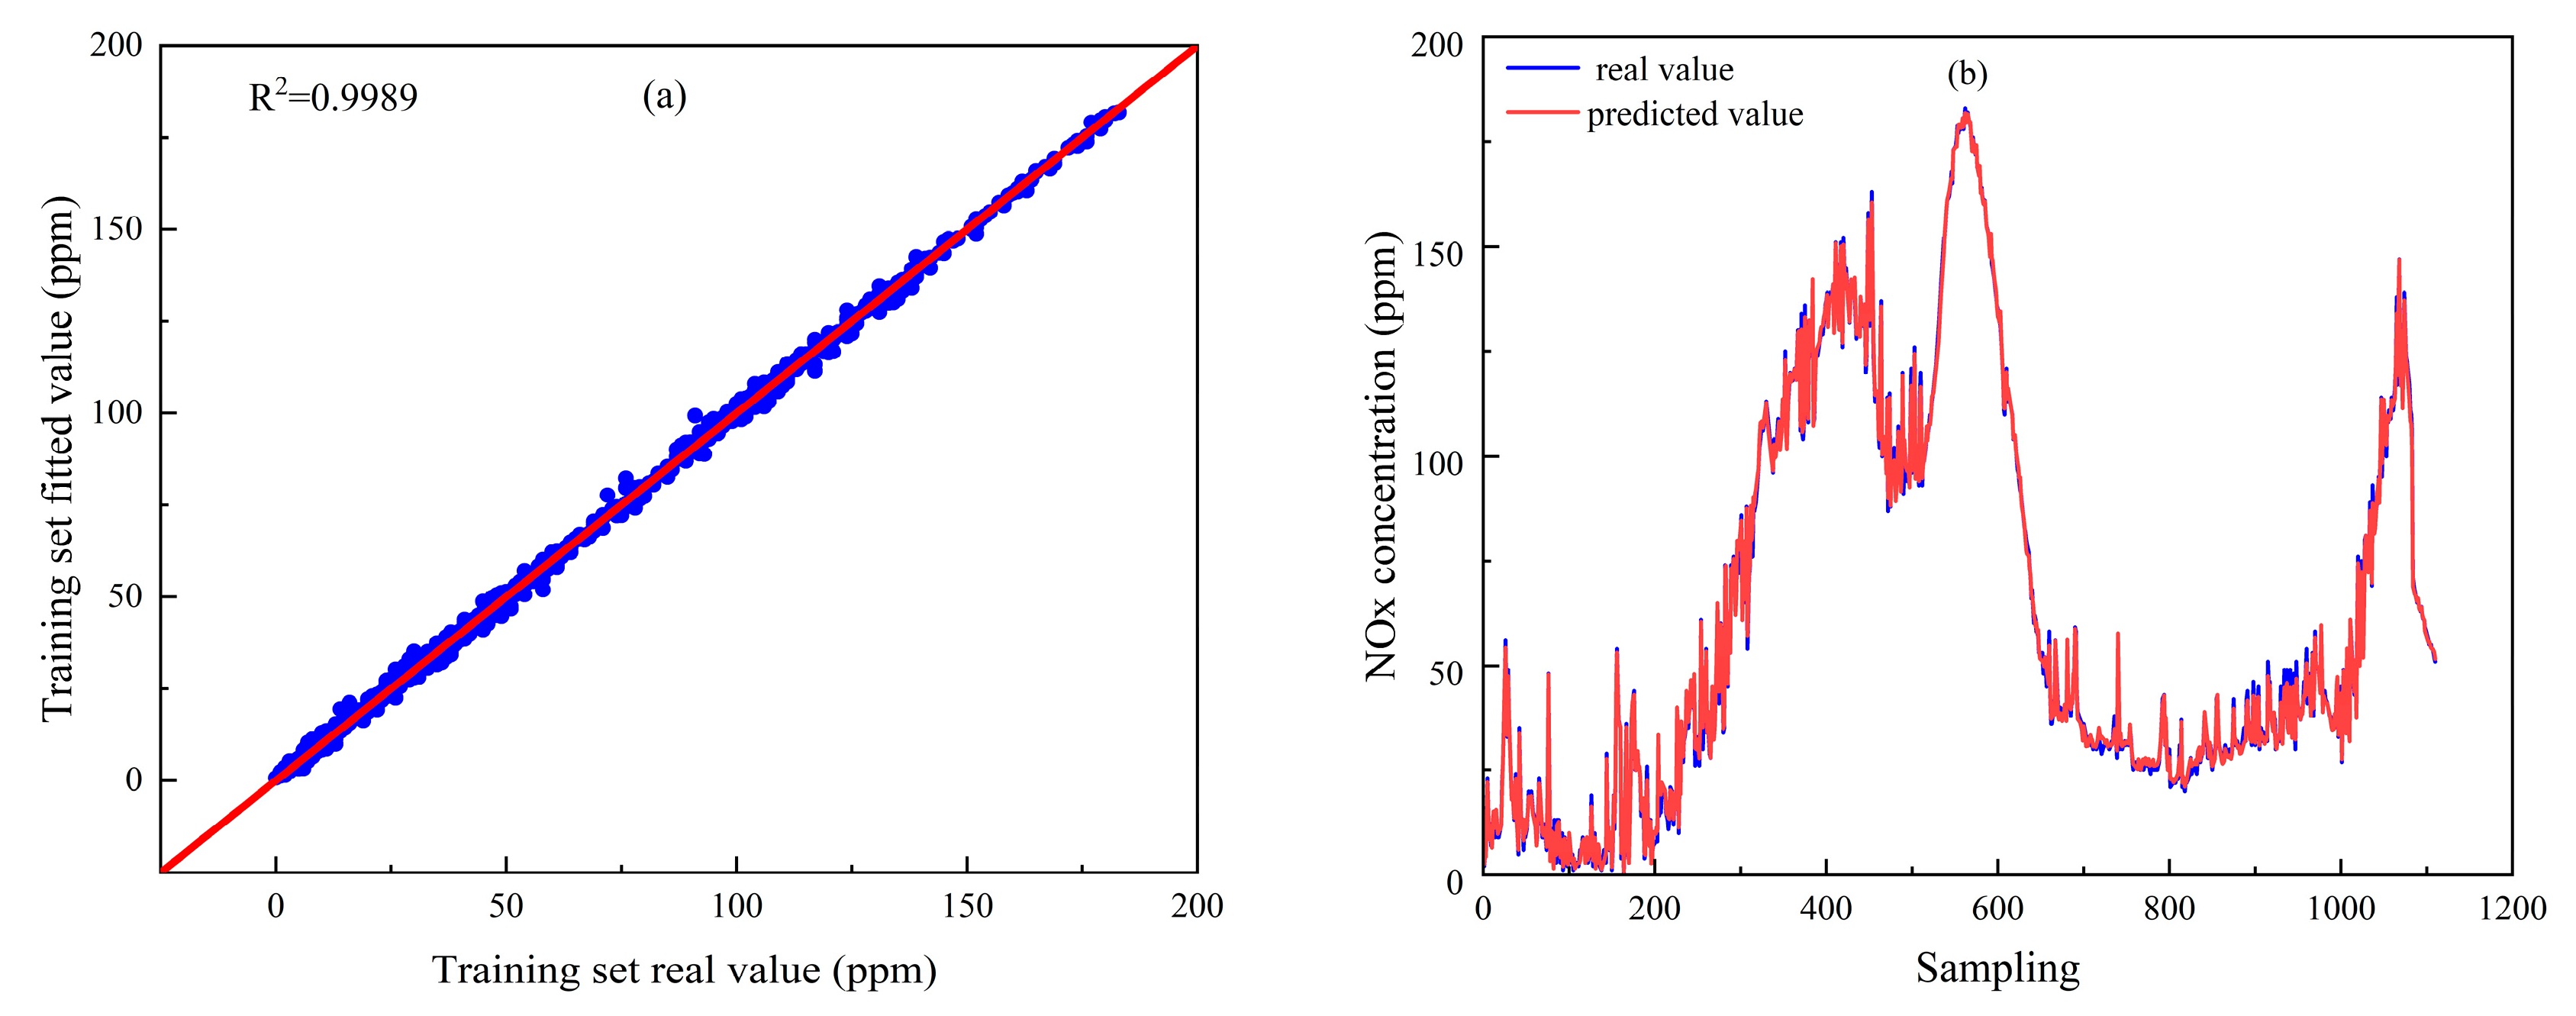
Figure 6 depicts the fitting results of the optimized PSO-XGBoost model on the training set. Figure 6a compares the actual values with the fitted values, where the blue circles represent the fitted values of the training dataset, and the red solid line represents the ideal consistency line. Most data points are distributed near the line y = x, indicating that the model has excellent fitting performance. The R2 value is close to 1, demonstrating that the model can effectively fit the training data. Figure 6b illustrates the variation in the fitted values with respect to the actual NOx concentration. The fitted values generally follow the same trend as the actual values, indicating good model stability. At high NOx levels, the model still captures the variations in the experimental data and reflects the nonlinear relationship between engine operating parameters and NOx emissions. Therefore, the close agreement between the fitted and observed values demonstrates that the optimized PSO-XGBoost model has strong fitting capability for the training dataset.
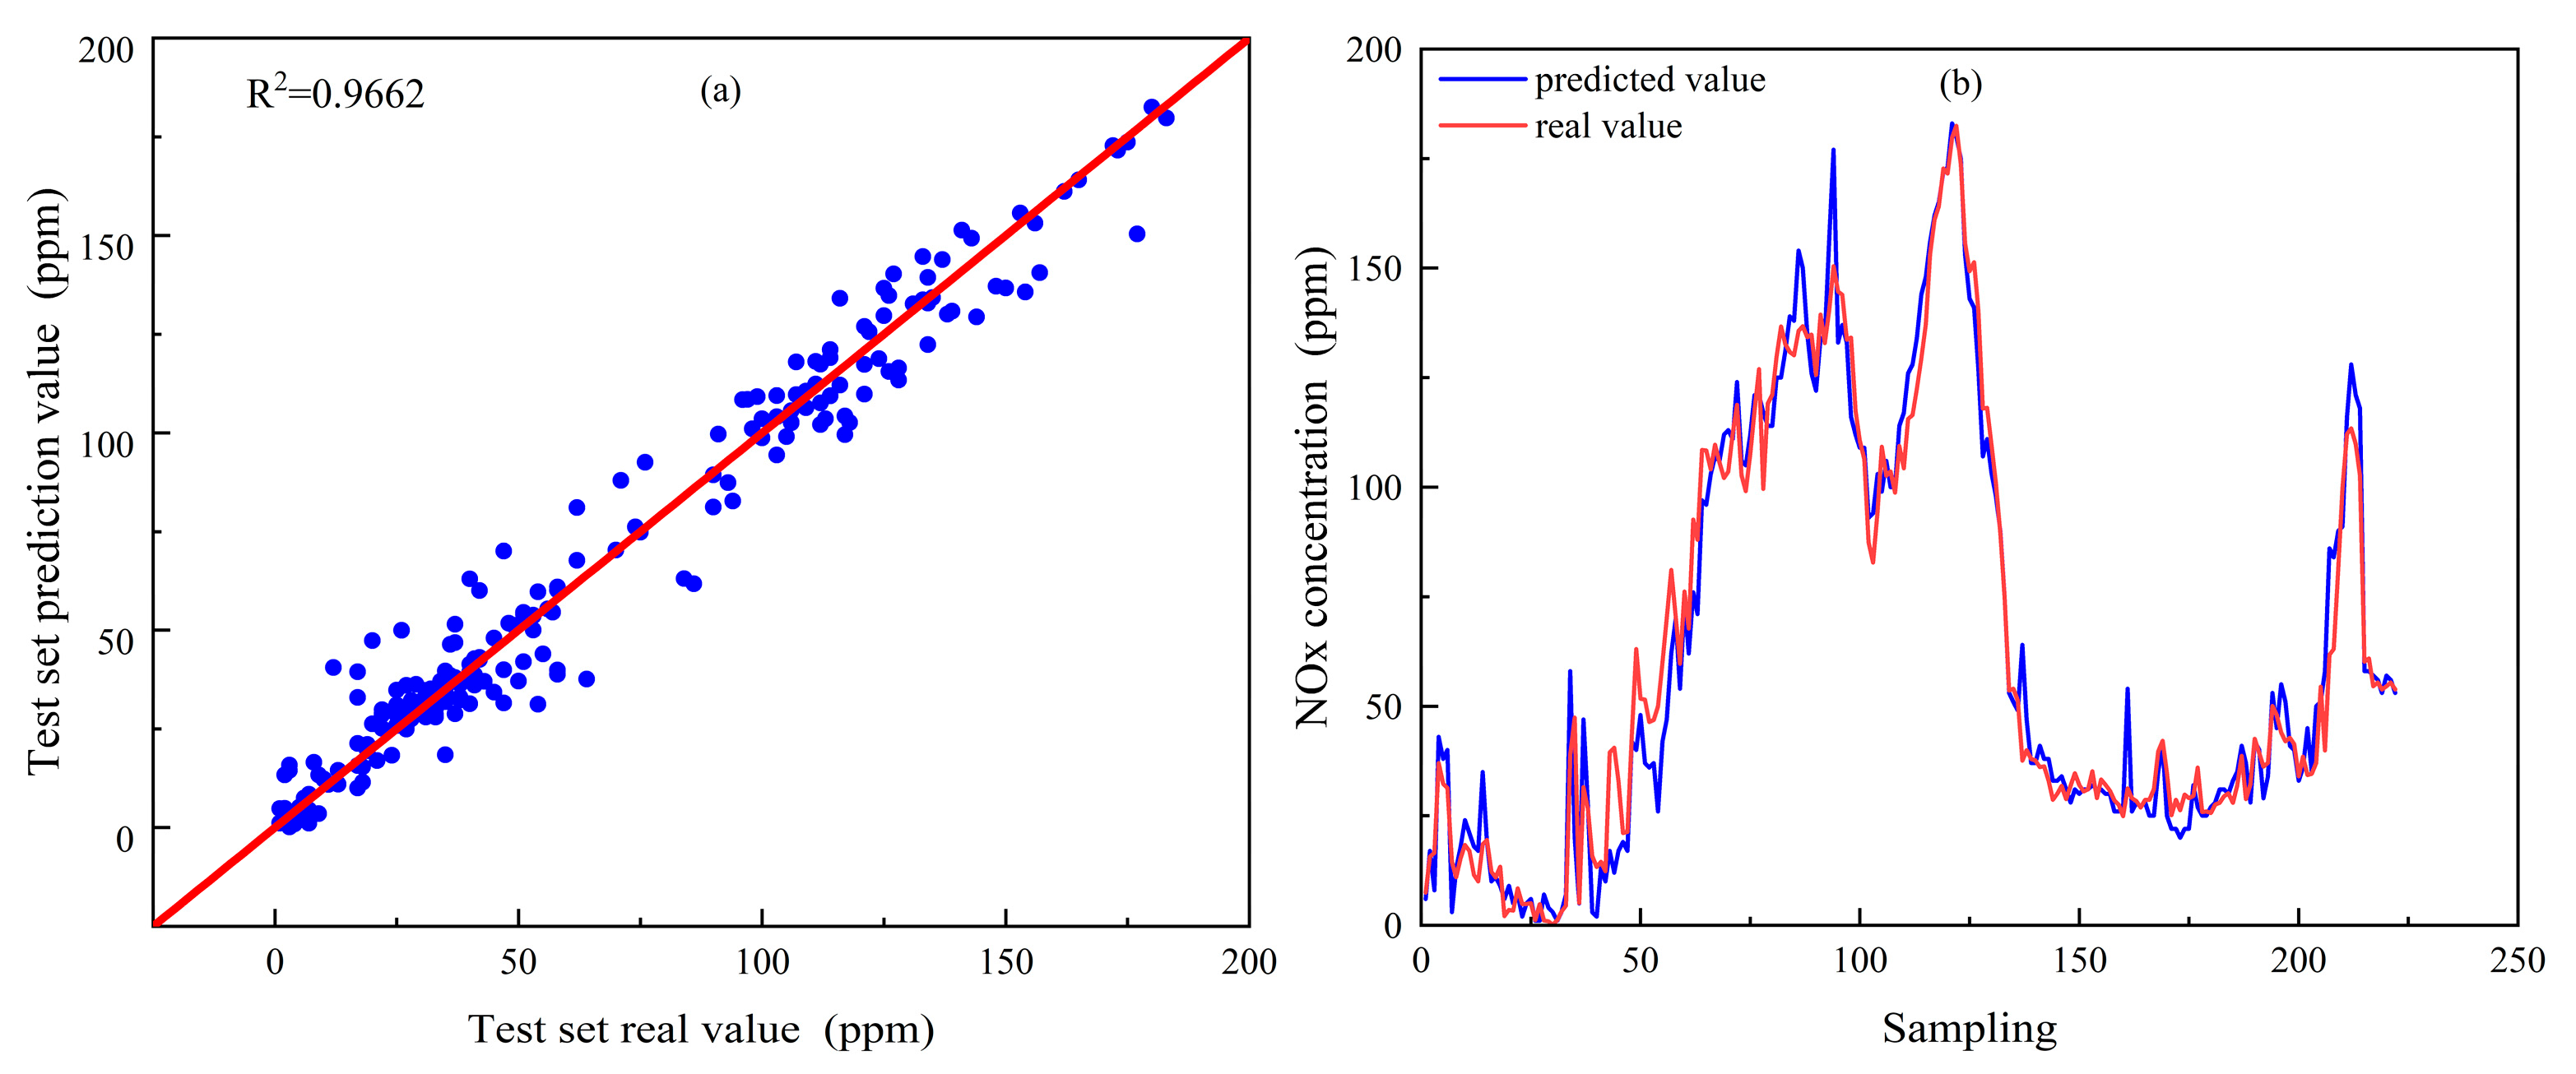
Figure 7 demonstrates the results of the PSO-XGBoost model on the test set. Figure 7a demonstrates a scatter plot of the predicted and actual values, where the blue circles represent the prediction values of the training dataset, and the red solid line represents the ideal consistency line. Most data points are distributed close to the y = x line, and the model achieves an R2 of 0.9662, indicating good predictive performance. A few outliers deviate from the y = x line, but the overall agreement remains strong. Figure 7b further illustrates the differences between the predicted and actual values. Although deviations appear in certain regions, the predicted values generally follow the same trend as the experimental data, indicating that the model successfully captures the underlying NOx emission patterns. Compared with the training set, the prediction error slightly increases on the test set, but the overall error remains low. These results demonstrate that the PSO-XGBoost model provides reliable NOx emission predictions.
Table 4 summarizes the performance metrics of the PSO-XGBoost model. The R2, MAE and RMSE values of the training set are 0.9989, 1.1577 ppm and 1.5746 ppm, respectively. The corresponding values for the test set are 0.9662, 6.3344 ppm, and 8.9682 ppm. Compared with the training set, the R2 value on the test set is reduced by 0.0323, and the MAE and RMSE increase by 5.1767 ppm and 7.3936 ppm, respectively. Despite the performance degradation on the test set, the model demonstrates strong generalization capability and robust predictive performance on unseen data.
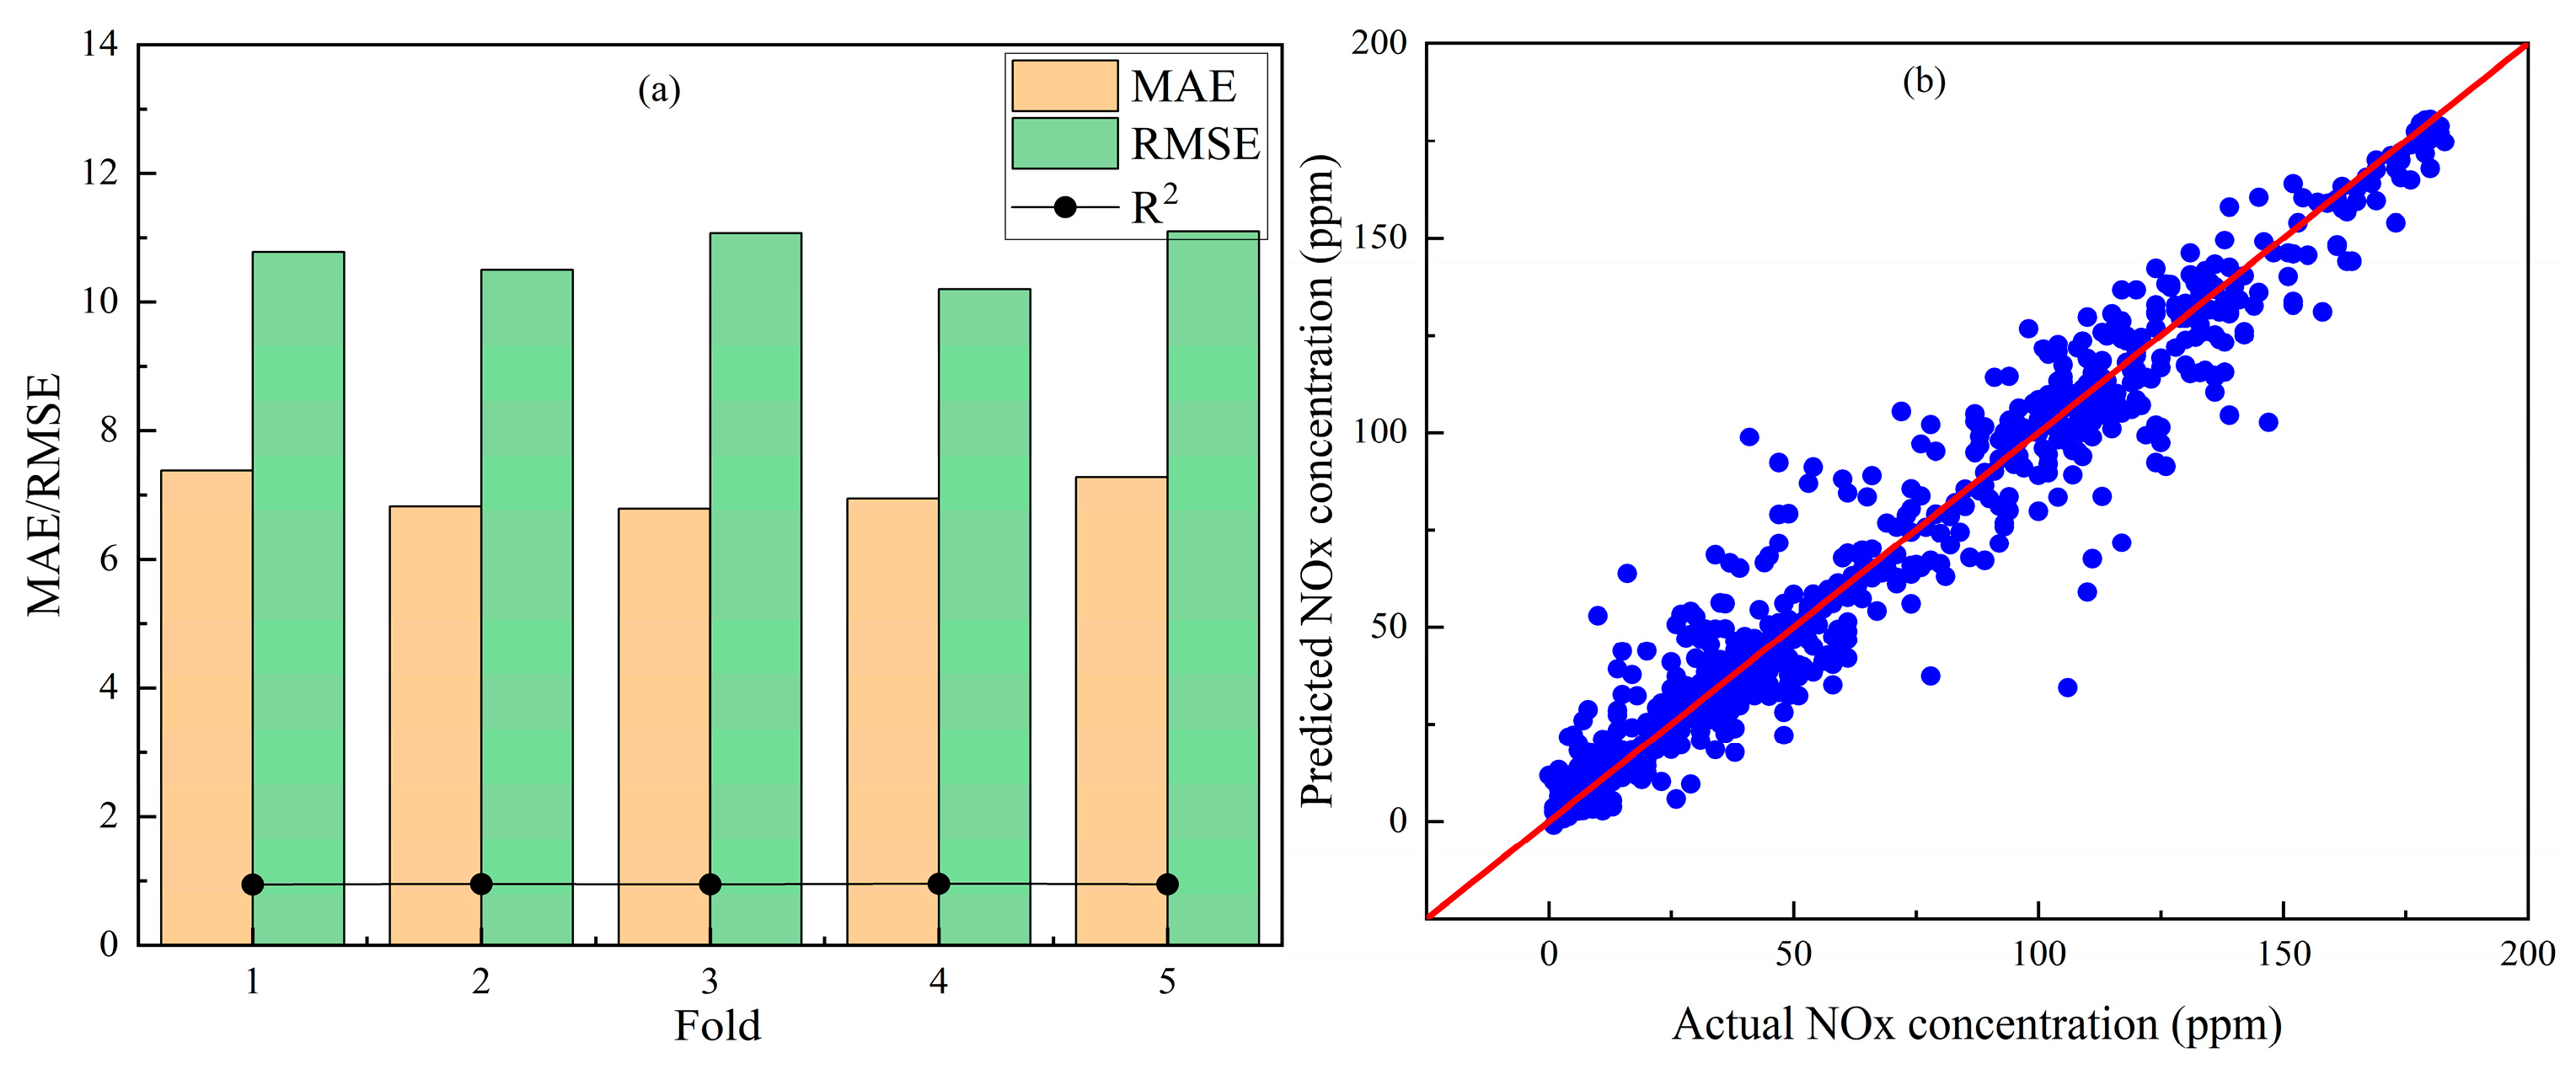
Five-fold cross-validation was conducted to further evaluate the robustness and generalization performance of the proposed model. Figure 8 presents the MAE, RMSE, and R2 values obtained for different validation folds. The variations among folds are small, indicating stable predictive performance of the PSO-XGBoost model. The average R2 obtained from the five folds was 0.949, while the corresponding MAE and RMSE values remained relatively stable. These results further confirm the robustness and generalization capability of the proposed model under transient operating conditions.
In Figure 8b, the blue circles represent the predicted sample points, while the red solid line represents the 1:1 reference line (y = x), indicating that the predicted value is completely consistent with the actual value. These results further validate the consistency, robustness, and generalization capability of the proposed model under transient operating conditions.

3.2. Comparison of Algorithm Performance

To evaluate the predictive performance of the proposed PSO-XGBoost model for NOx emissions from heavy-duty non-road diesel engines, six conventional machine learning models were selected for comparison, including backpropagation neural networks (BP), extreme learning machines (ELM), LightGBM, least squares support vector regression (LSSVR), random forests (RF), and the standard XGBoost model. All models used the same training and test sets for prediction. To ensure optimal performance of the comparison models, all hyperparameters were tuned within a reasonable range using a unified hyperparameter optimization strategy. The appropriate parameter combinations were determined based on the model performance during training. The existing models adhered to the theoretical principles of each algorithm and fully utilized their advantages. After model construction, training, and prediction were completed, these six models were compared with a model built using PSO-XGBoost.
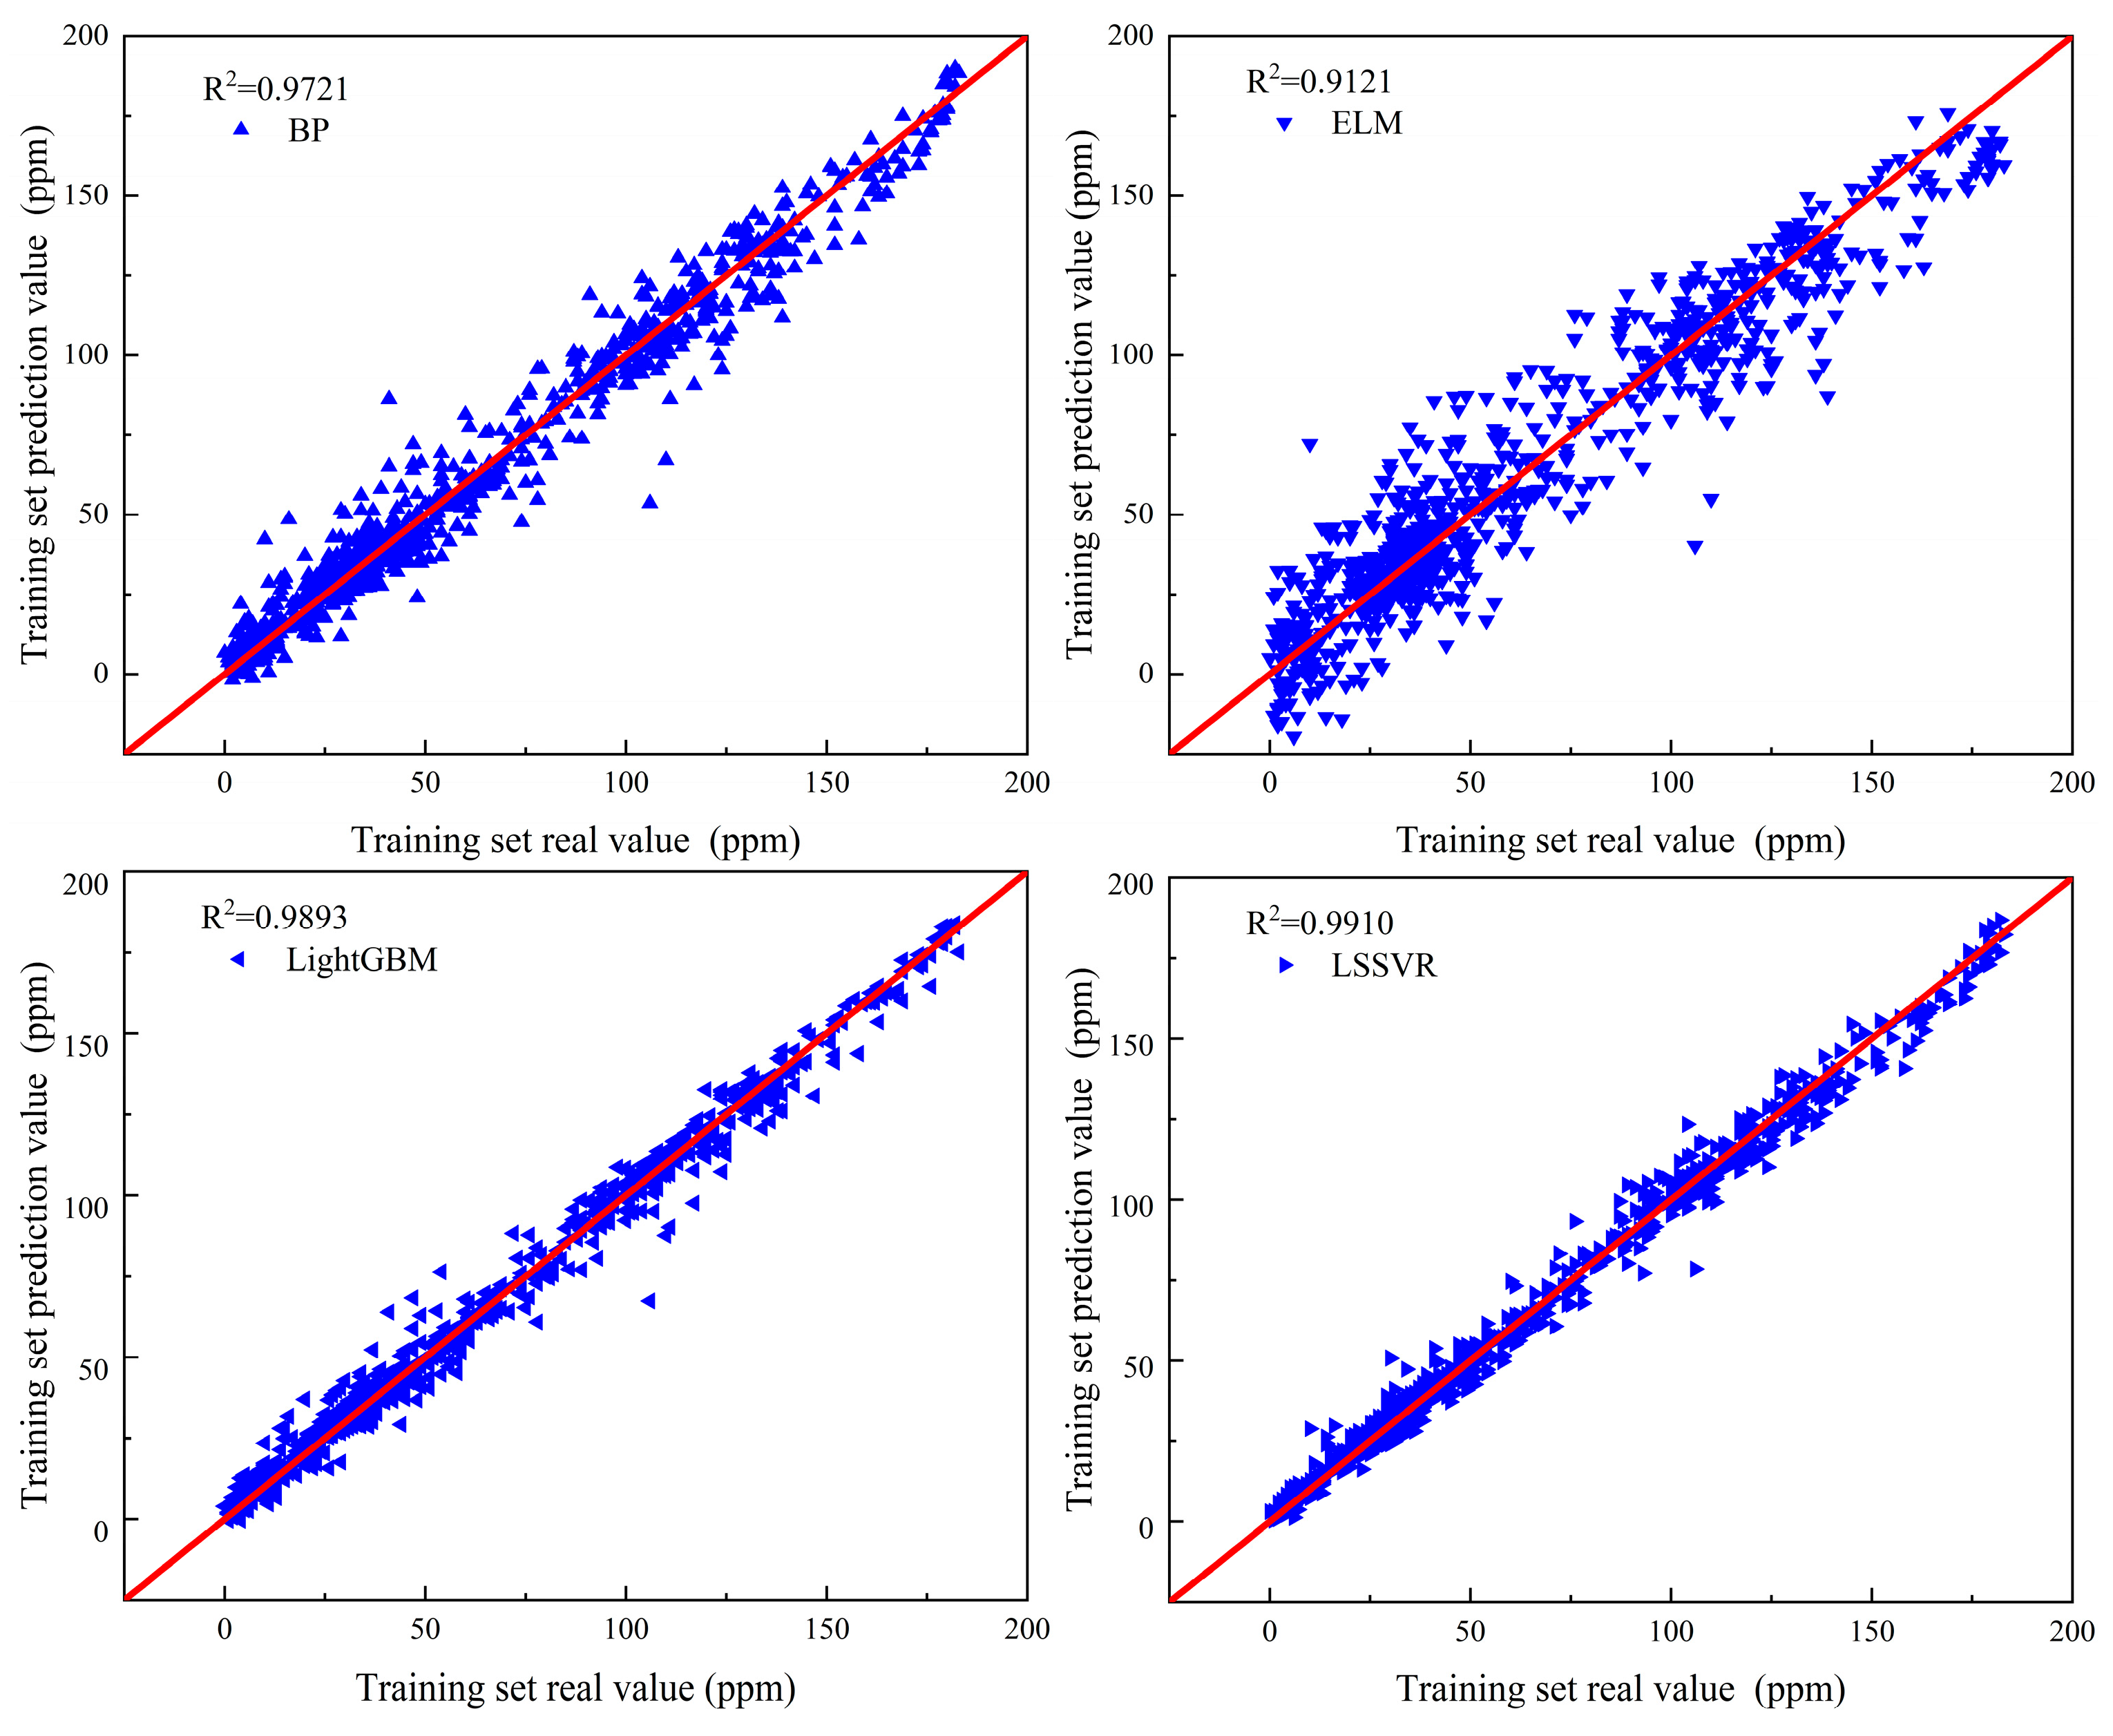
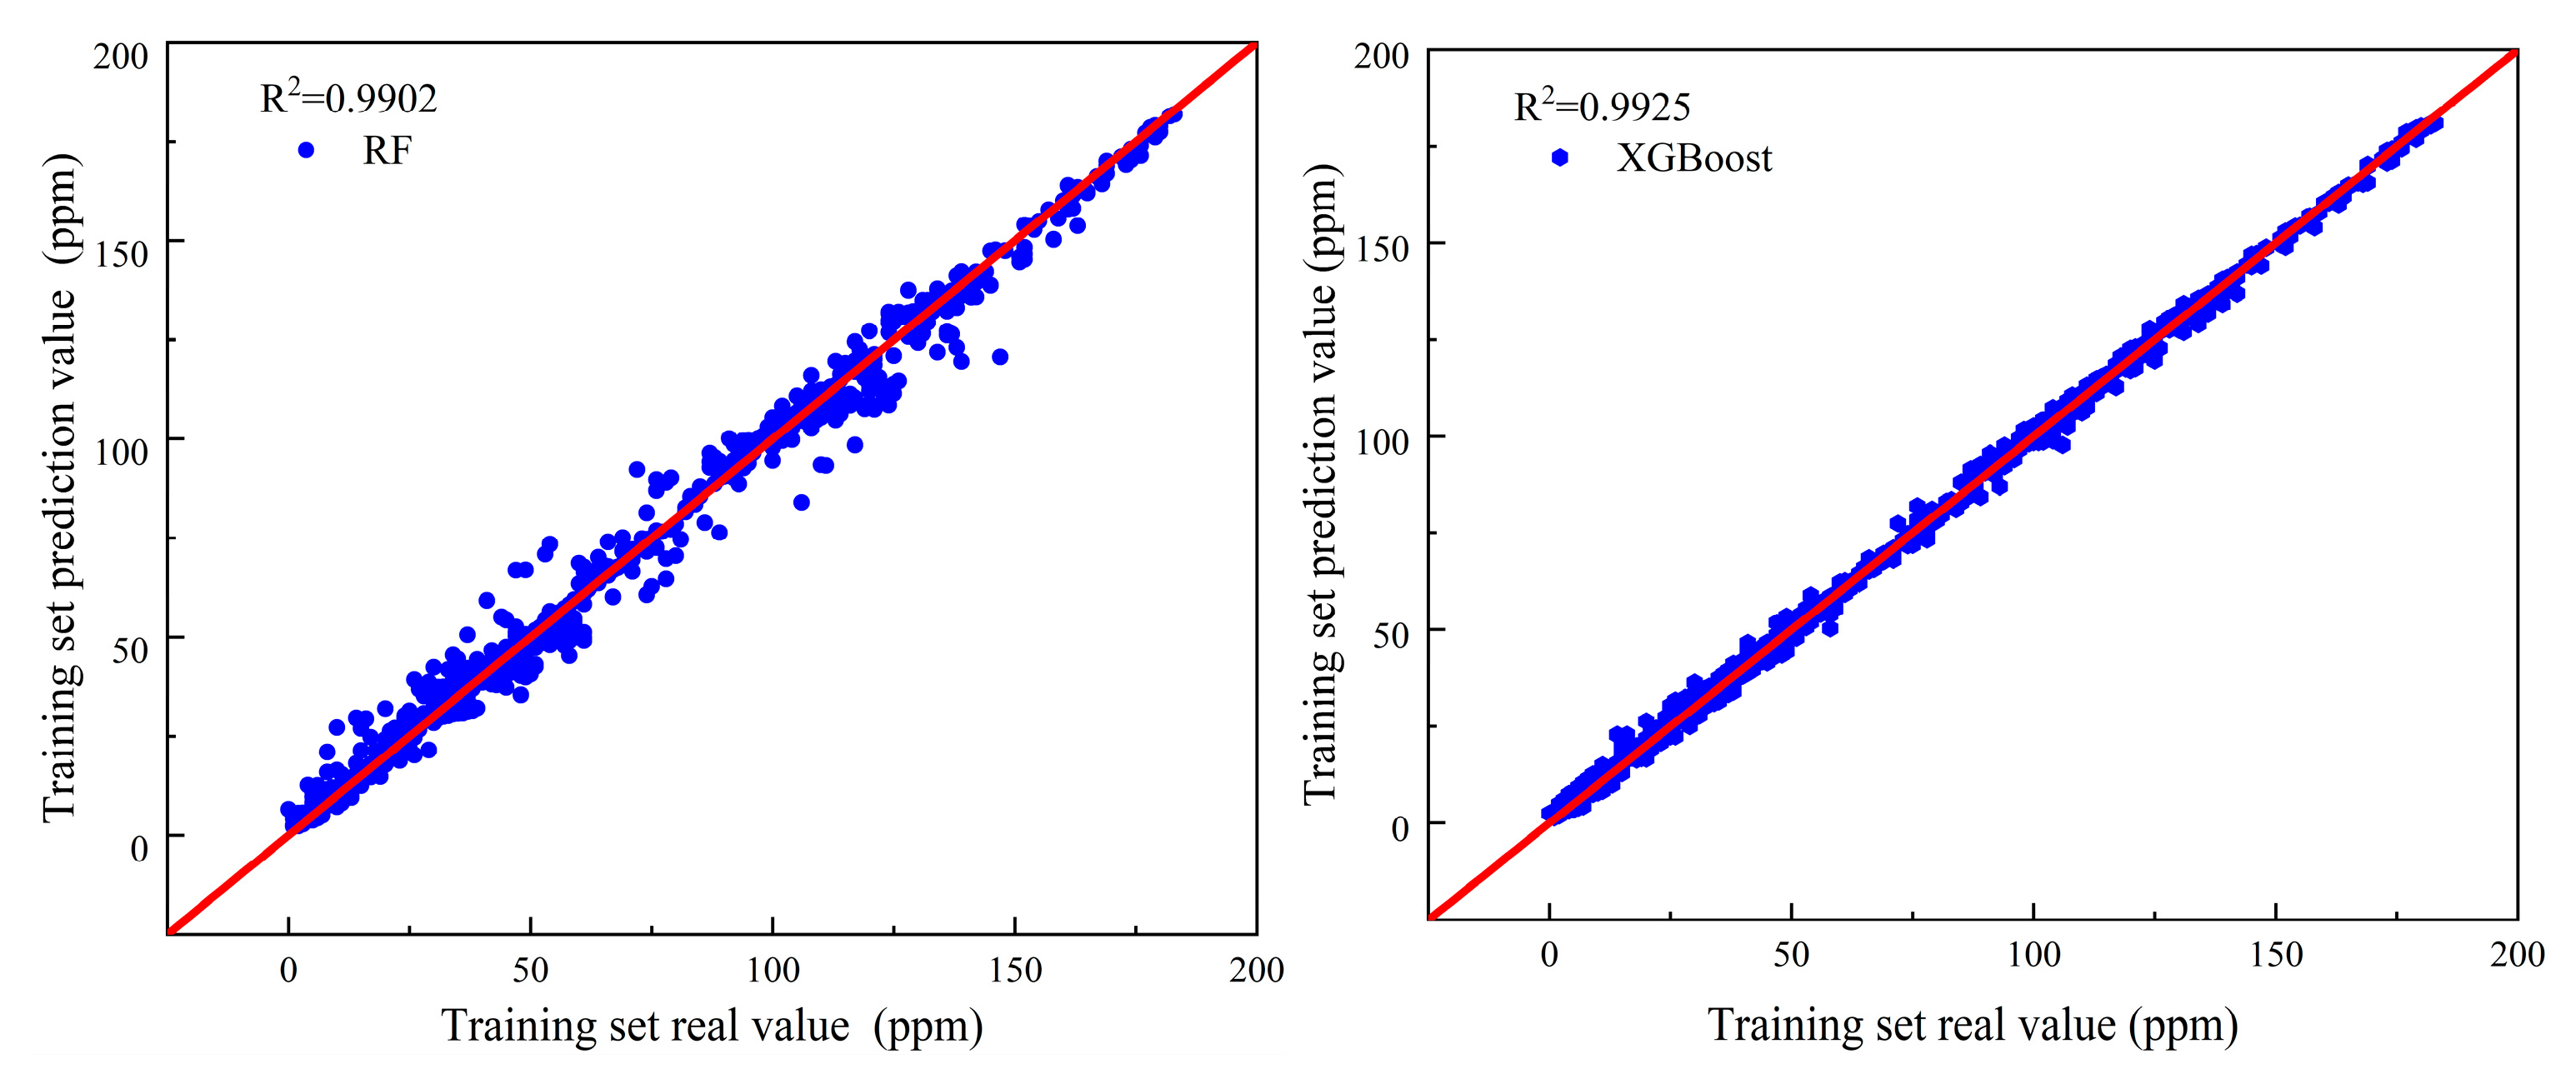
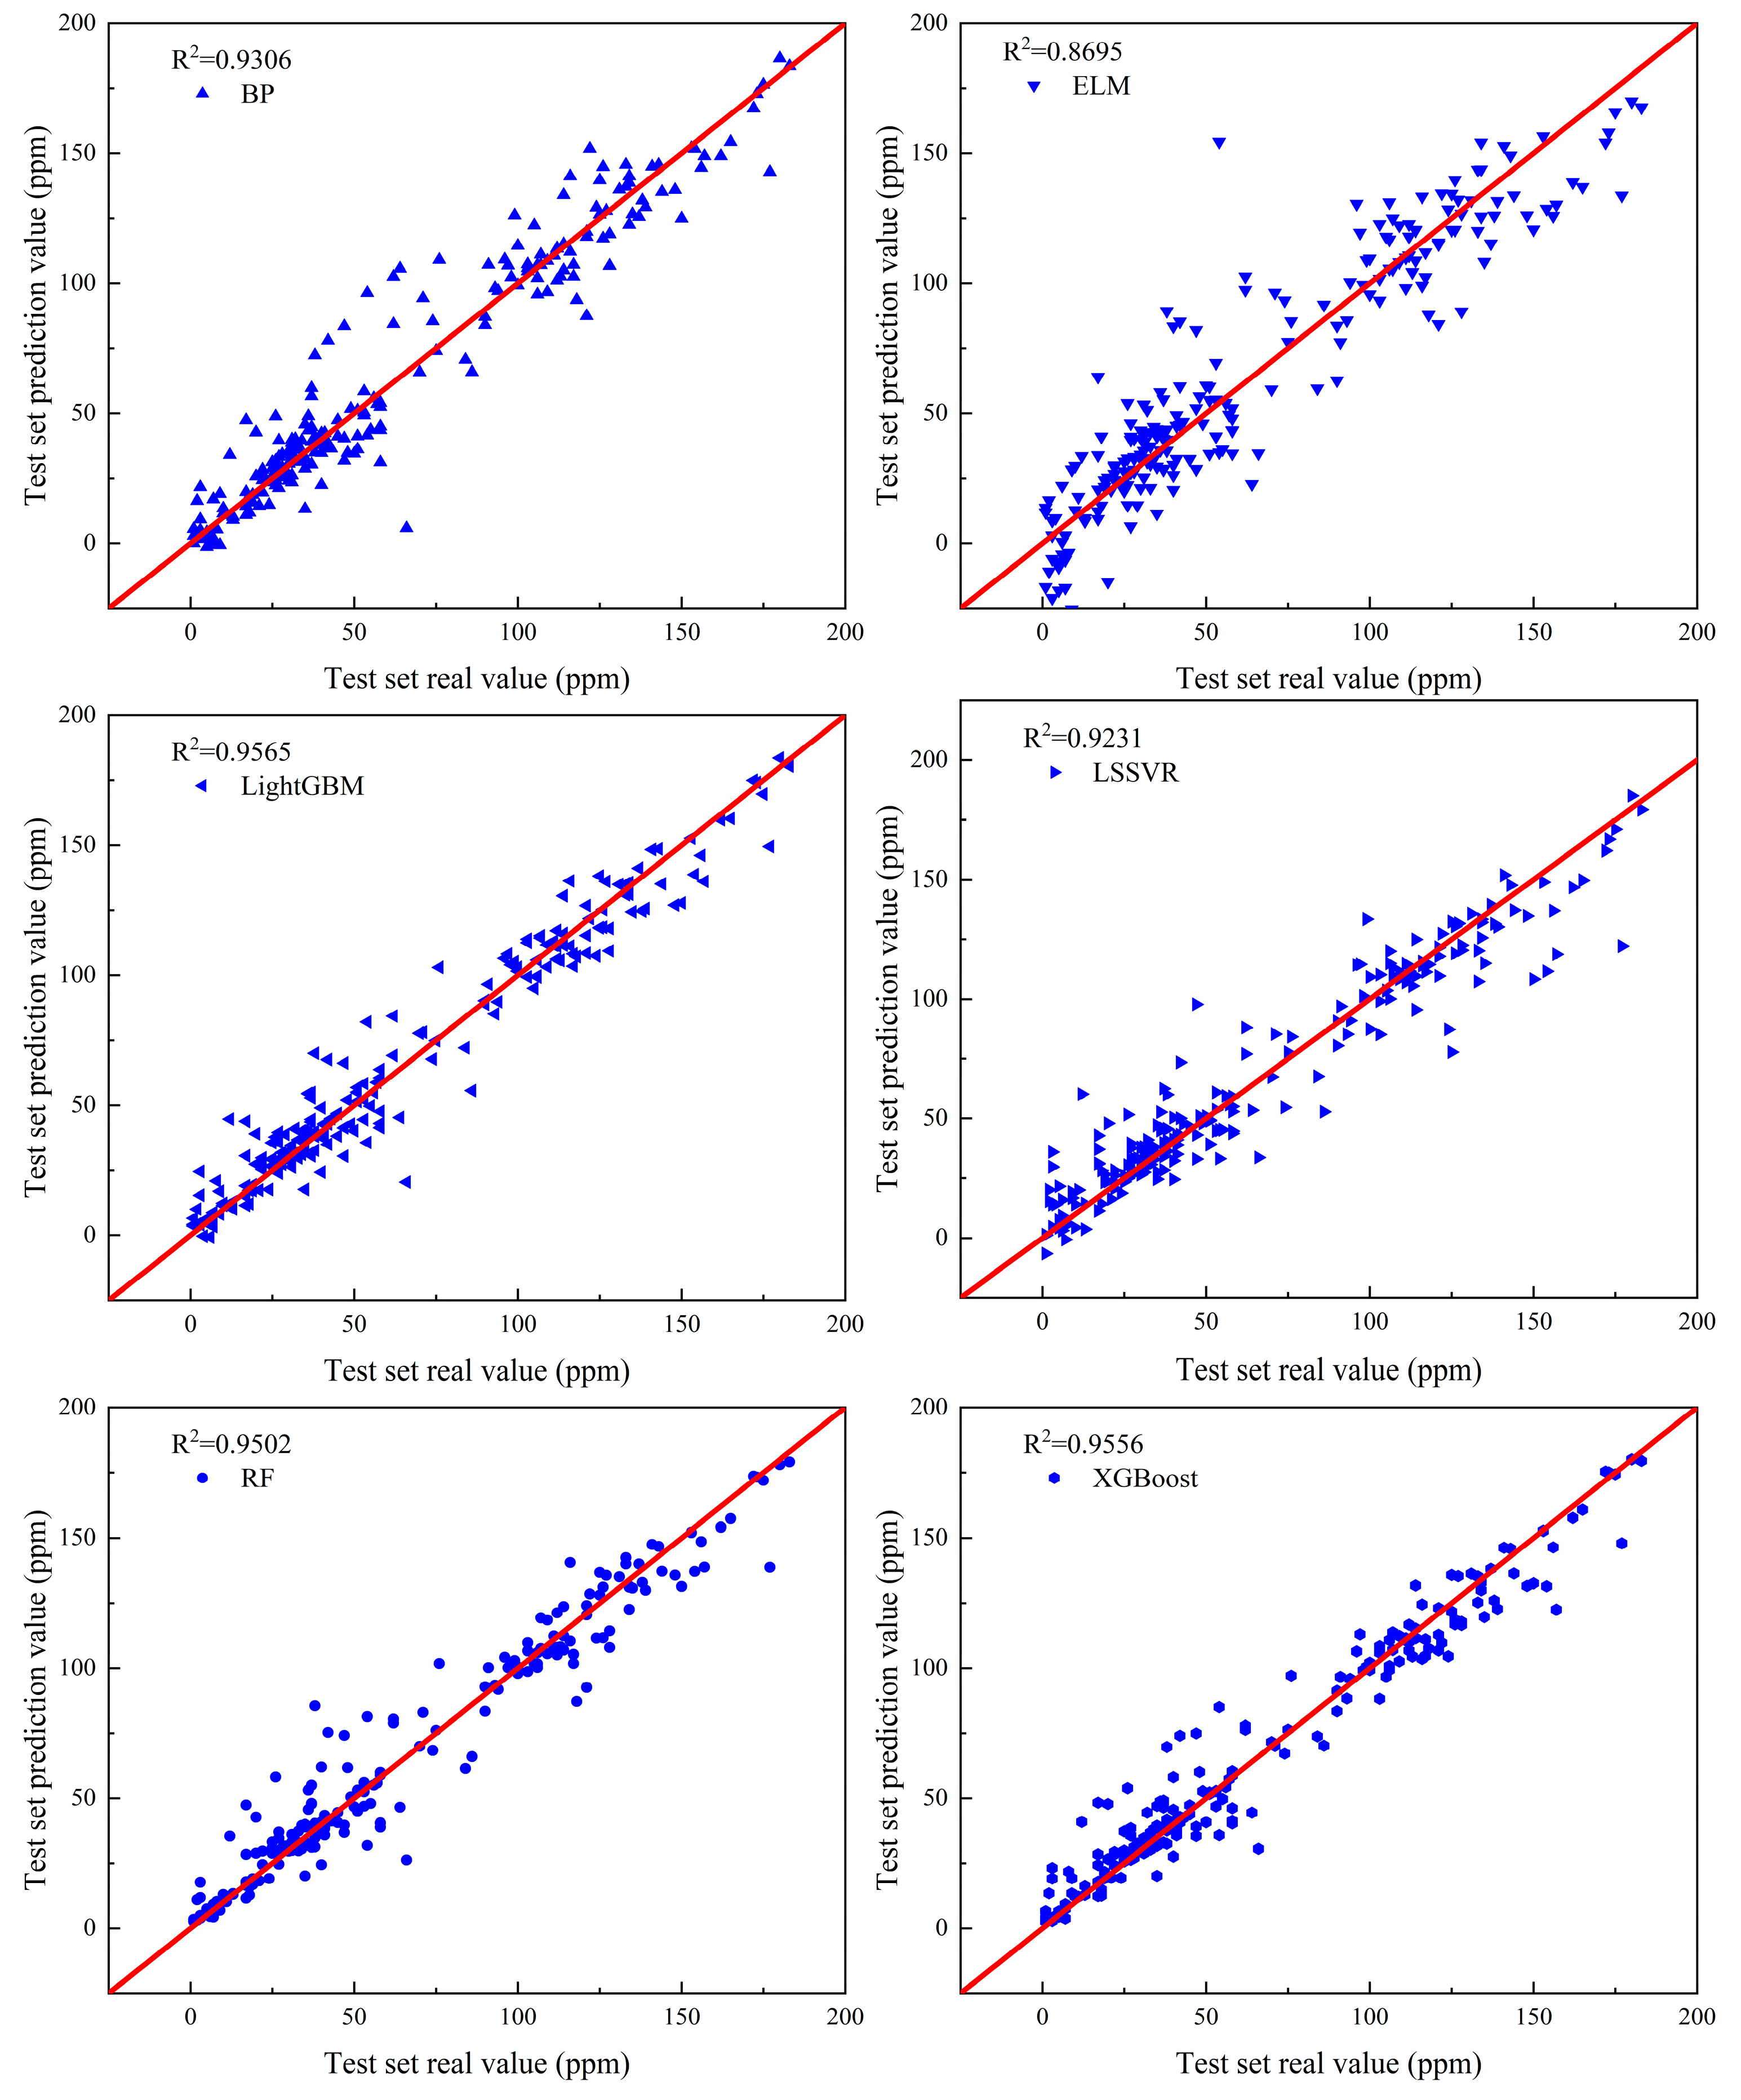
Figure 9 and Figure 10 are the regression analysis results of machine learning models for the training and test sets, respectively. In the figures, the blue graphs represent predicted sample points, while the red solid line represents the 1:1 reference line (y = x), indicating that the predicted values are completely consistent with the actual values. The RF and XGBoost models both exhibited good performance on the training and test sets. However, they perform worse than the PSO-XGBoost algorithm. This result indicates that the PSO algorithm effectively optimizes the hyperparameters of the XGBoost algorithm, significantly enhancing the accuracy of NOx emission predictions.
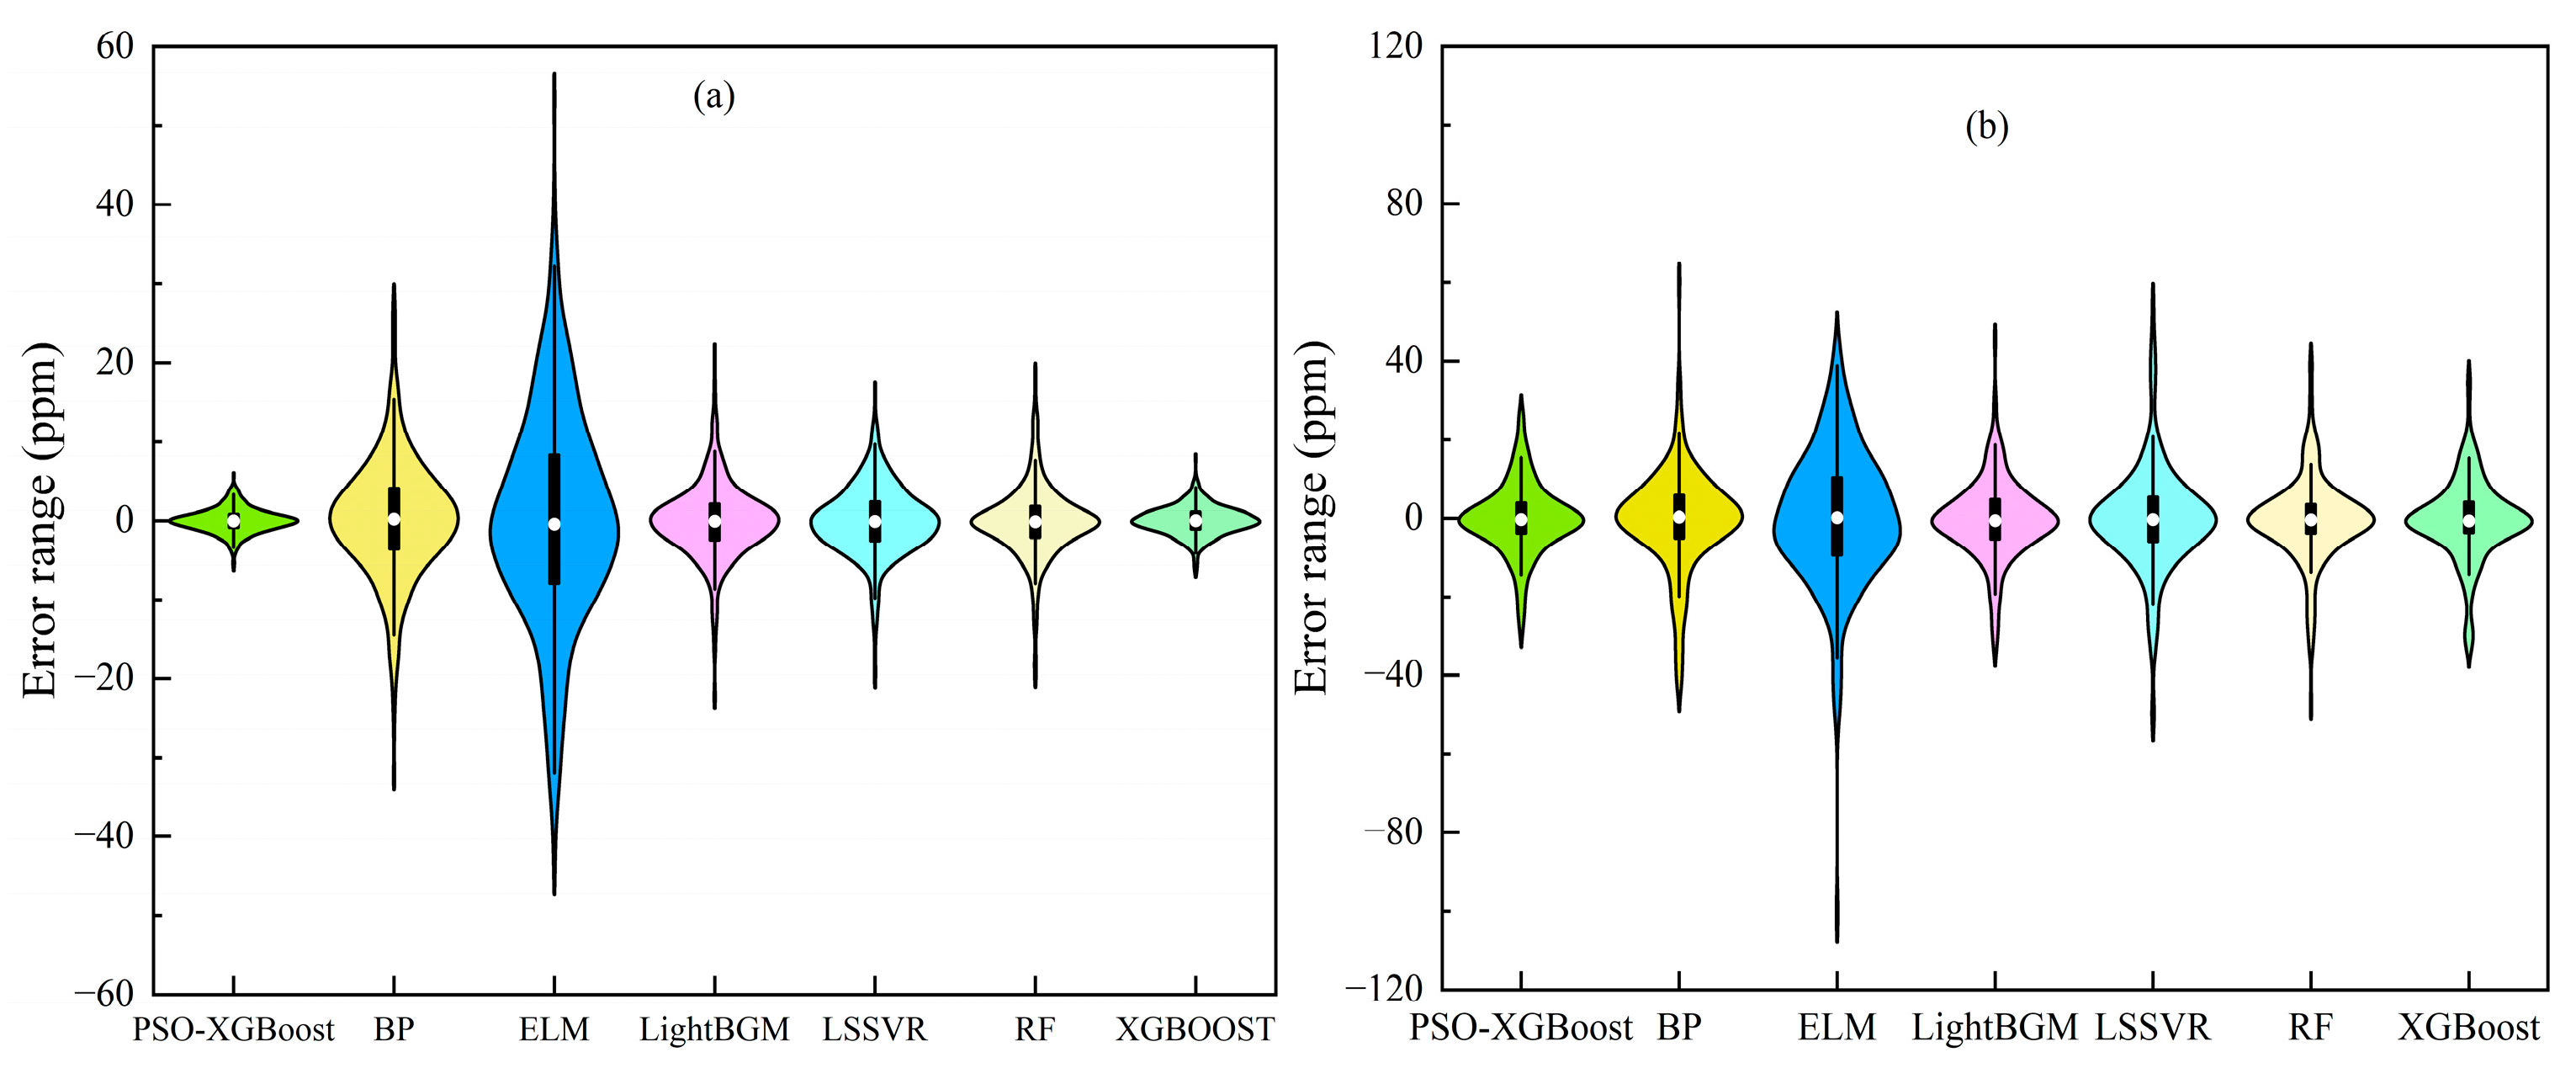
Figure 11 presents the violin plots of the prediction error distributions for the seven algorithms on the training and test sets. The PSO-XGBoost model exhibits a relatively narrow error range on both datasets, mainly within ±10 ppm to ±20 ppm, indicating good prediction stability. In contrast, the ELM model shows the widest error distribution, with several error values significantly larger than those of the other models. These results demonstrate that the PSO-XGBoost model achieves lower prediction error and higher stability than the conventional machine learning models.
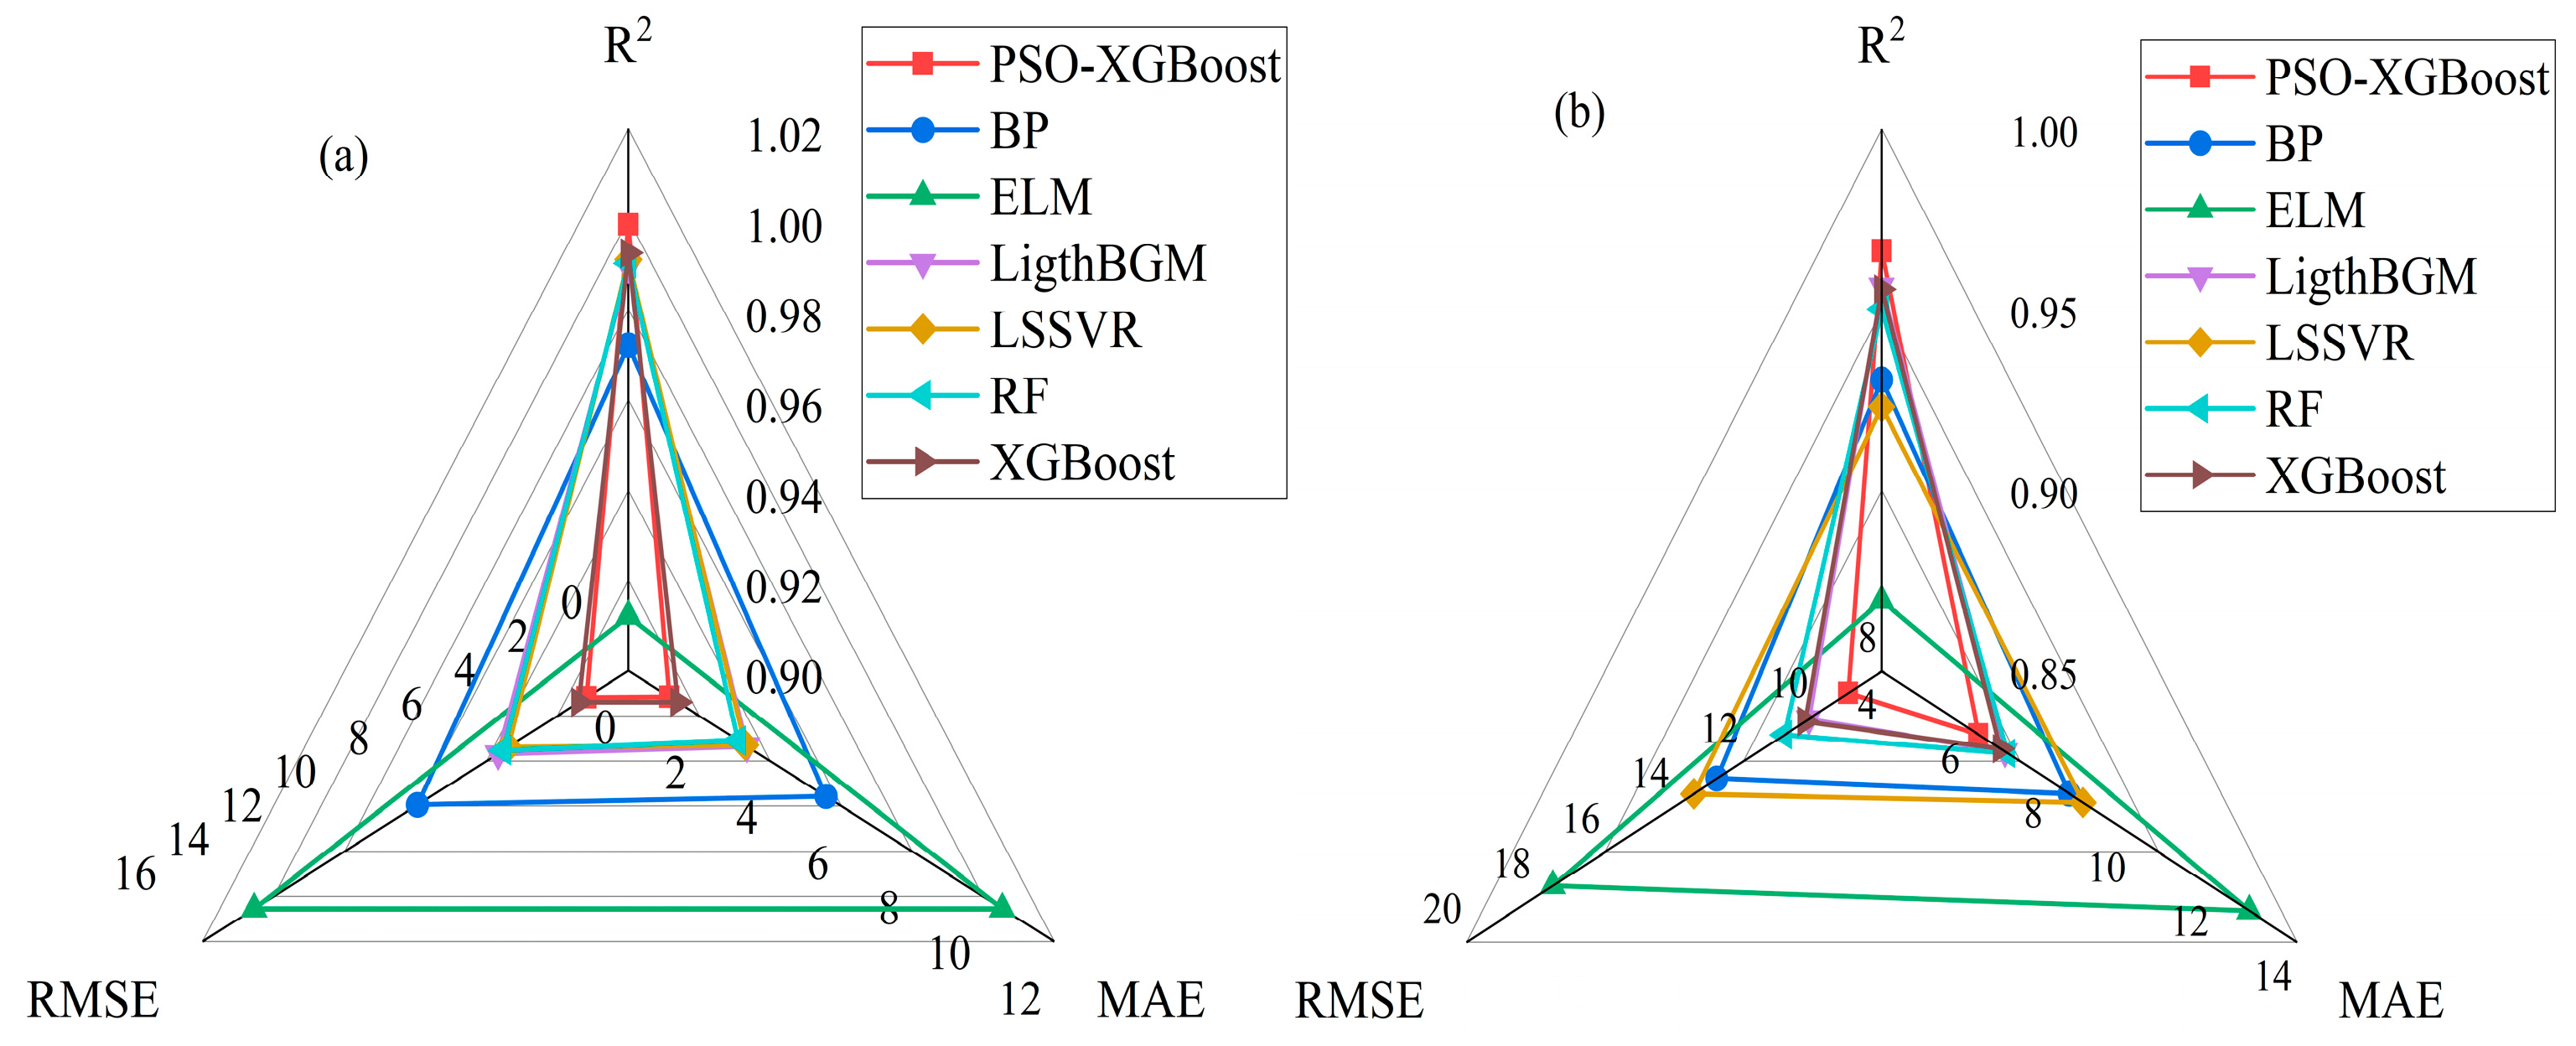
Figure 12 compares the R2 values, MAE, and RMSE of different algorithms in a radar chart format. The figure clearly demonstrates the superior performance of the PSO-XGBoost algorithm. Figure 12 shows that the PSO-XGBoost algorithm outperforms other algorithms and obtains the highest R2 value and demonstrates the lowest MAE and RMSE in terms of error. It exhibits the great robustness of the PSO-XGBoost algorithm and shows its superior performance in terms of prediction, accuracy and stability.

3.3. Model Reliability and Statistical Analysis

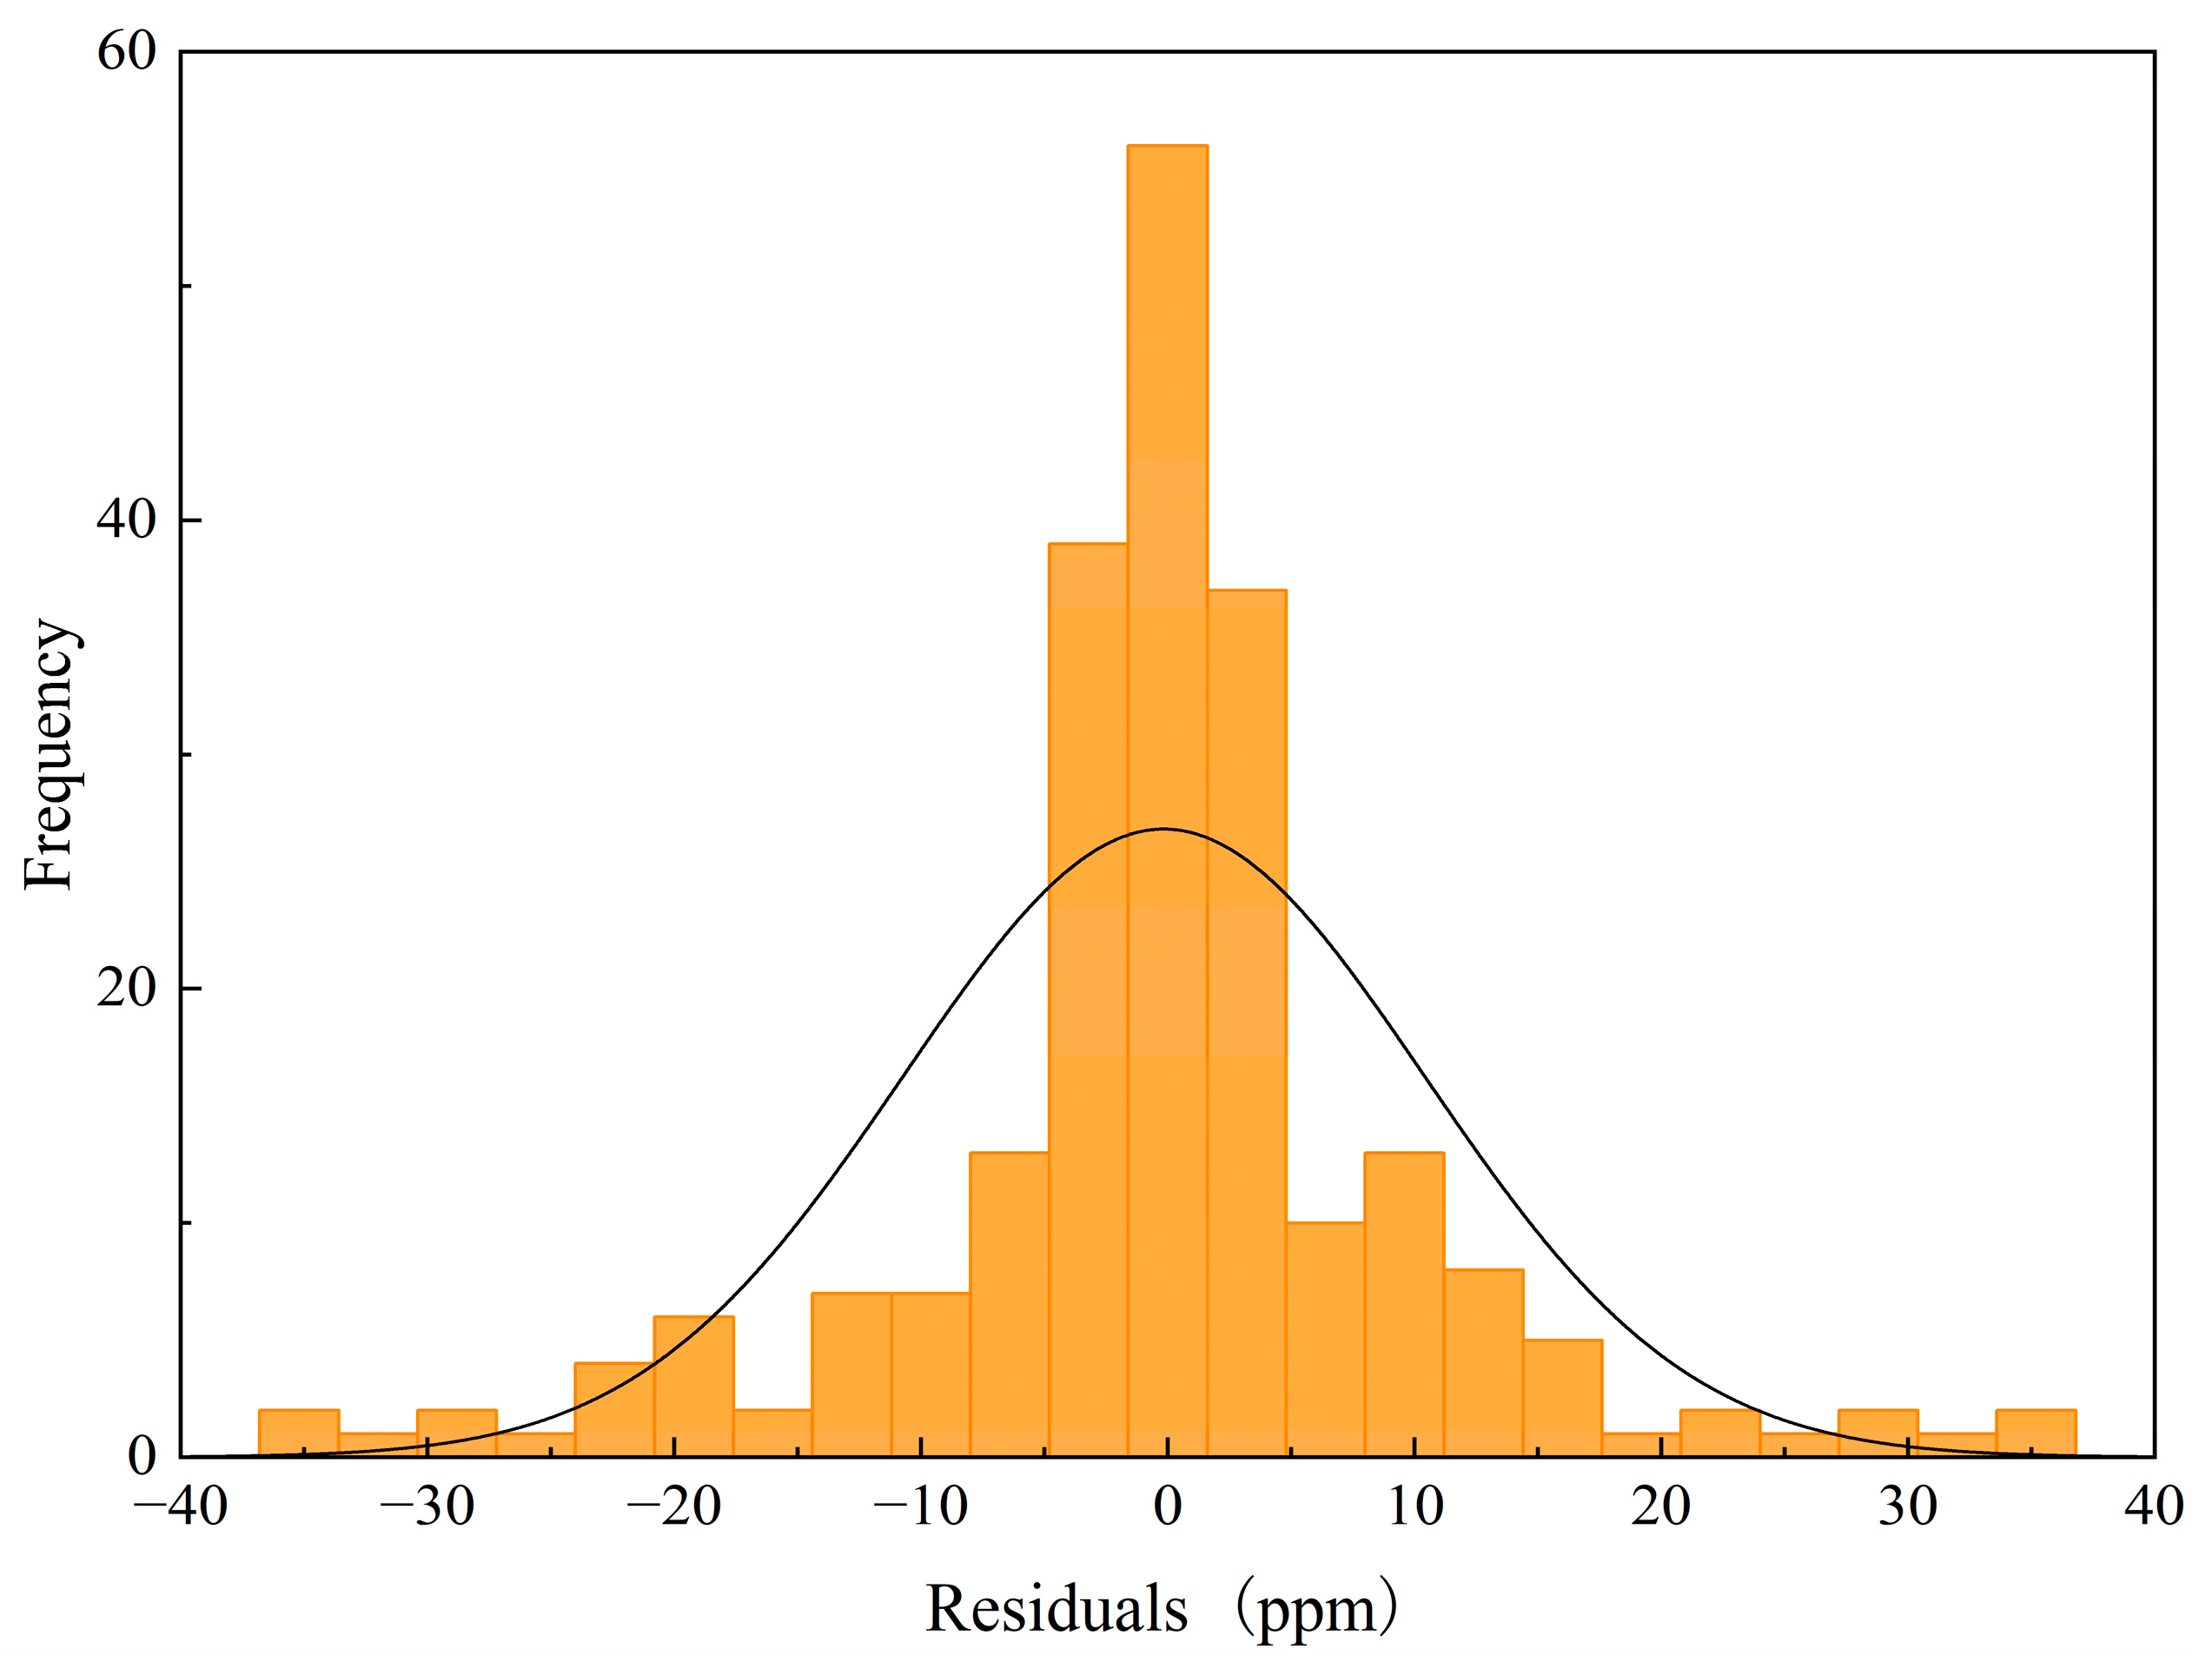
Figure 13 illustrates the residual distribution of the PSO-XGBoost model on the test set, where the black curve represents the fitted normal distribution of the prediction error. The residual histogram indicates that most residuals are concentrated near zero, suggesting that the model does not exhibit significant systematic overestimation or underestimation. The residual distribution is approximately bell-shaped, indicating that the prediction error is generally stable and randomly distributed. However, some residuals appear at both ends of the distribution, reflecting larger prediction biases under certain transient conditions.
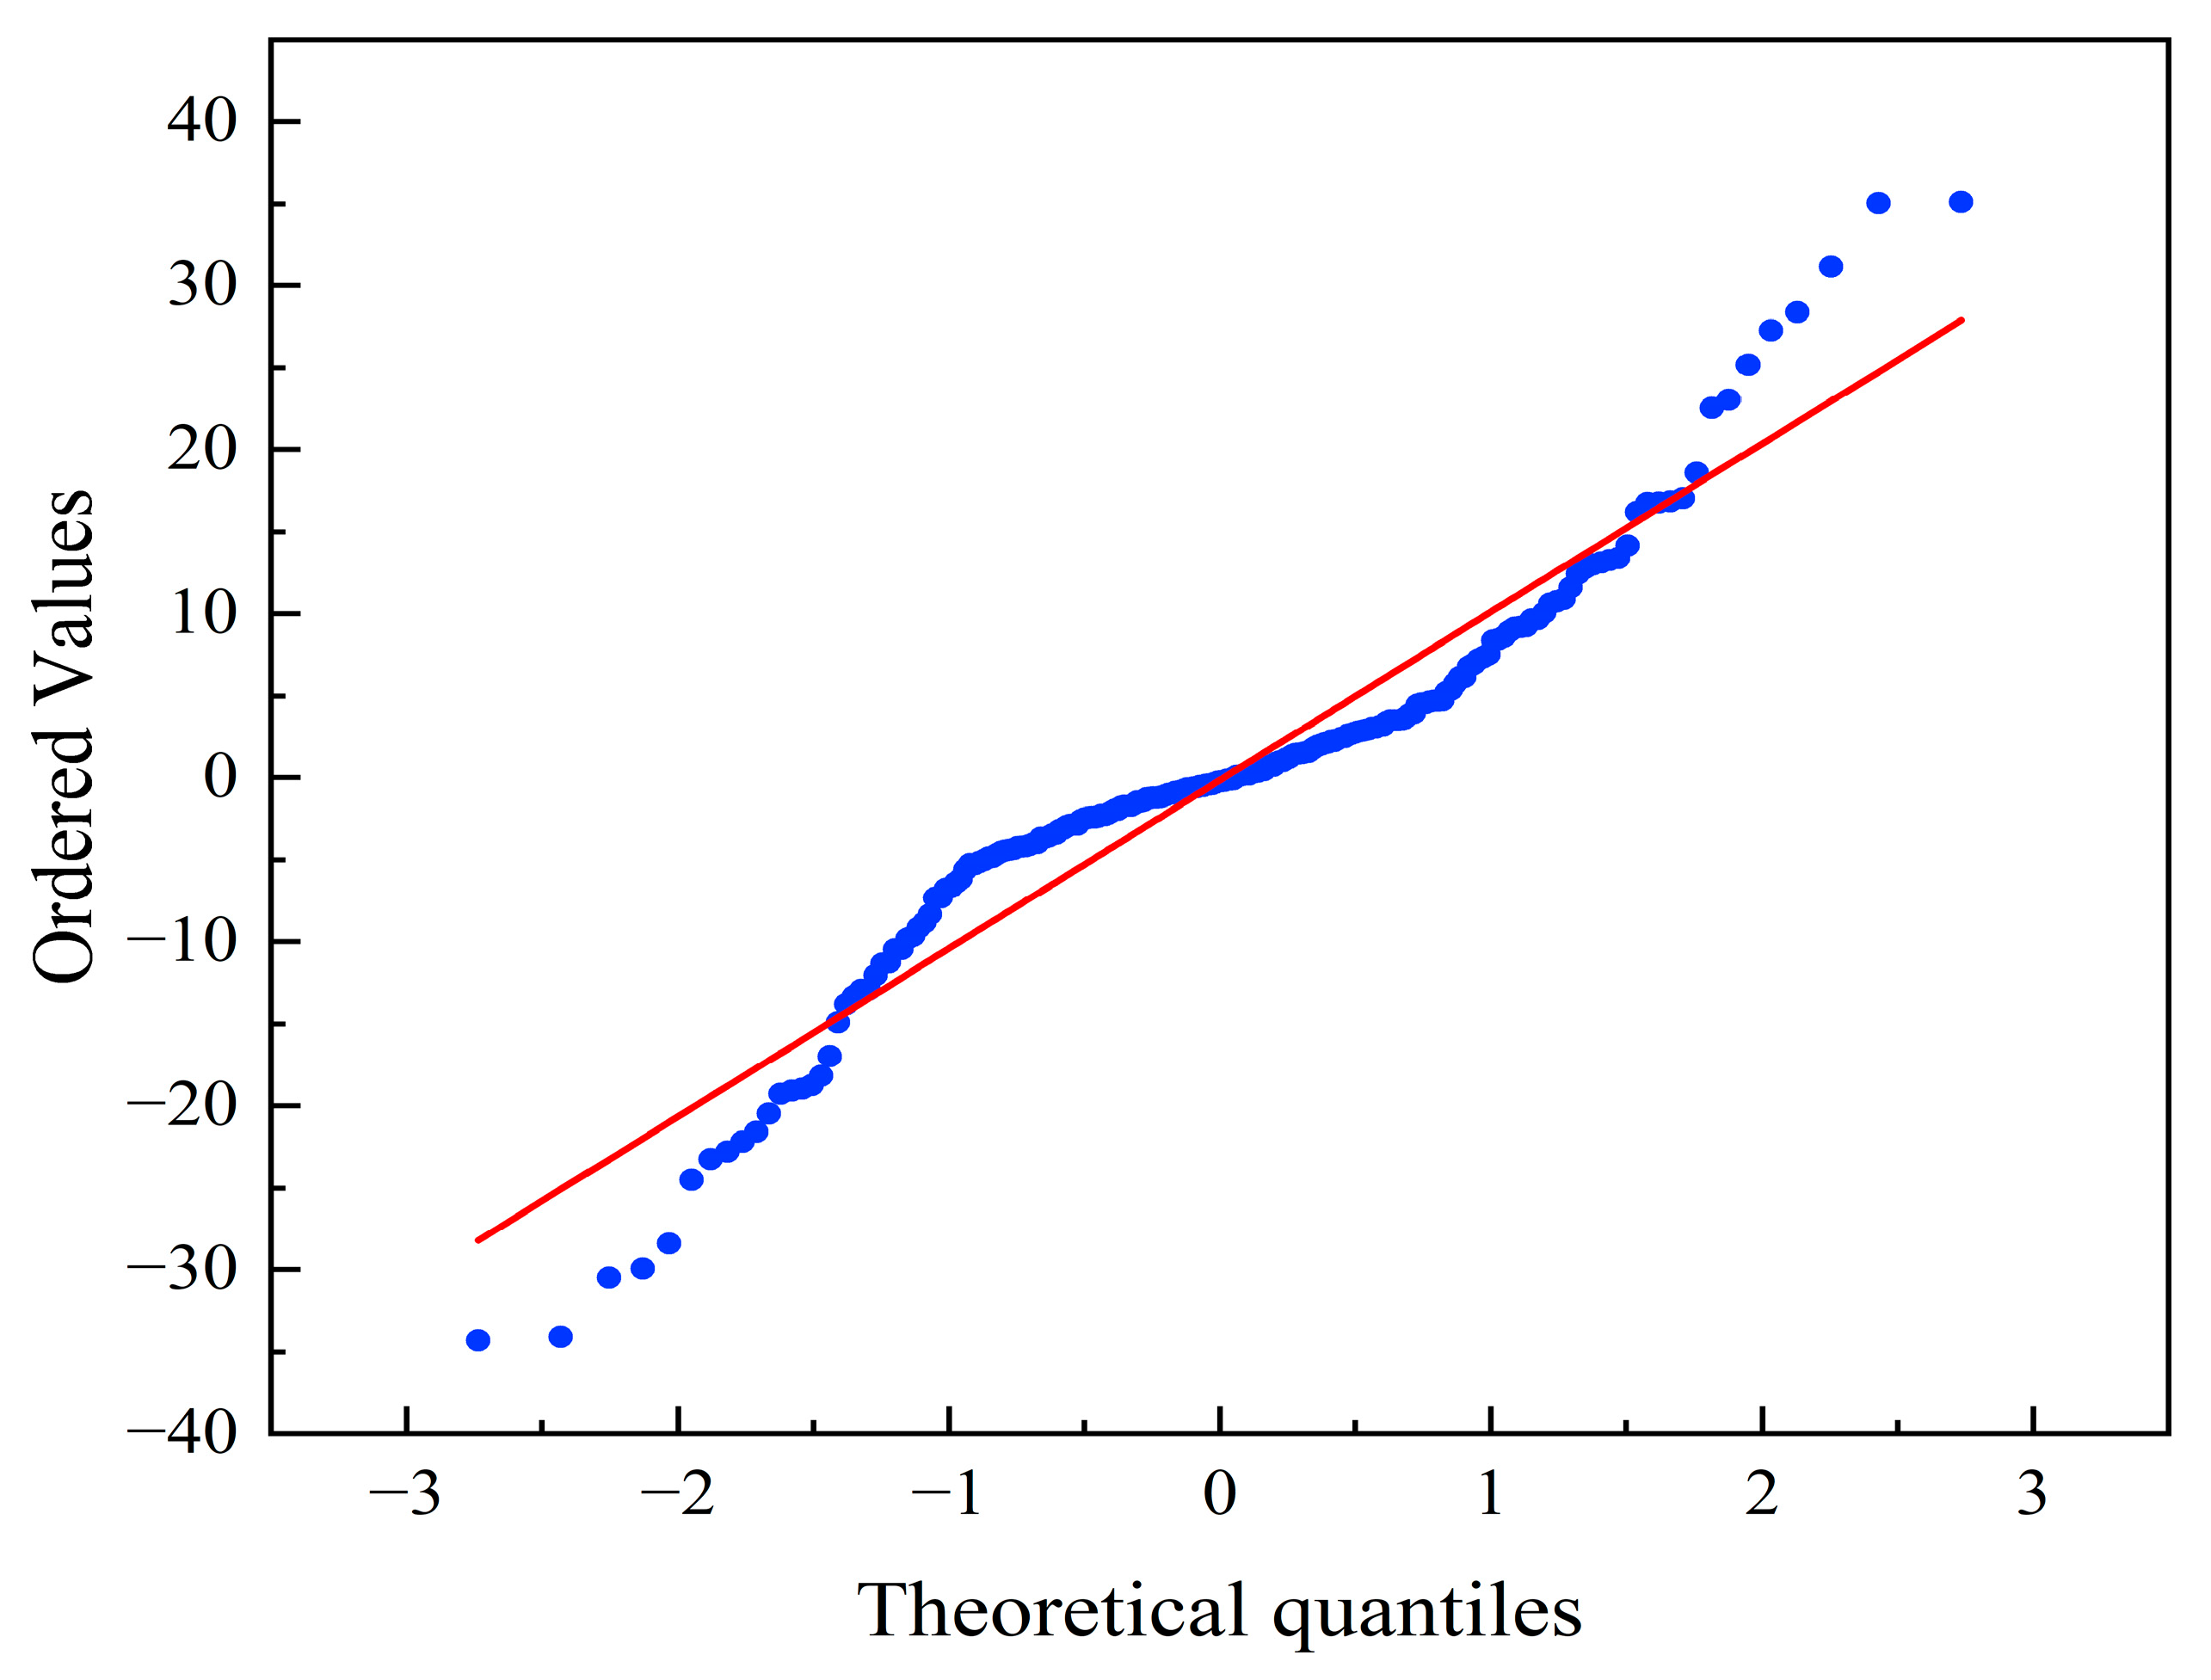
Figure 14 displays the residual Q-Q plot, where most data points in the central region are close to the theoretical normal reference line, while deviations exist at both ends. This indicates that the residuals approximately follow a normal distribution in the central region but exhibit a slight heavy-tailed characteristic at both ends. Overall, the residual analysis displays that the PSO-XGBoost model has good predictive stability and acceptable generalization ability for transient NOx emission prediction.
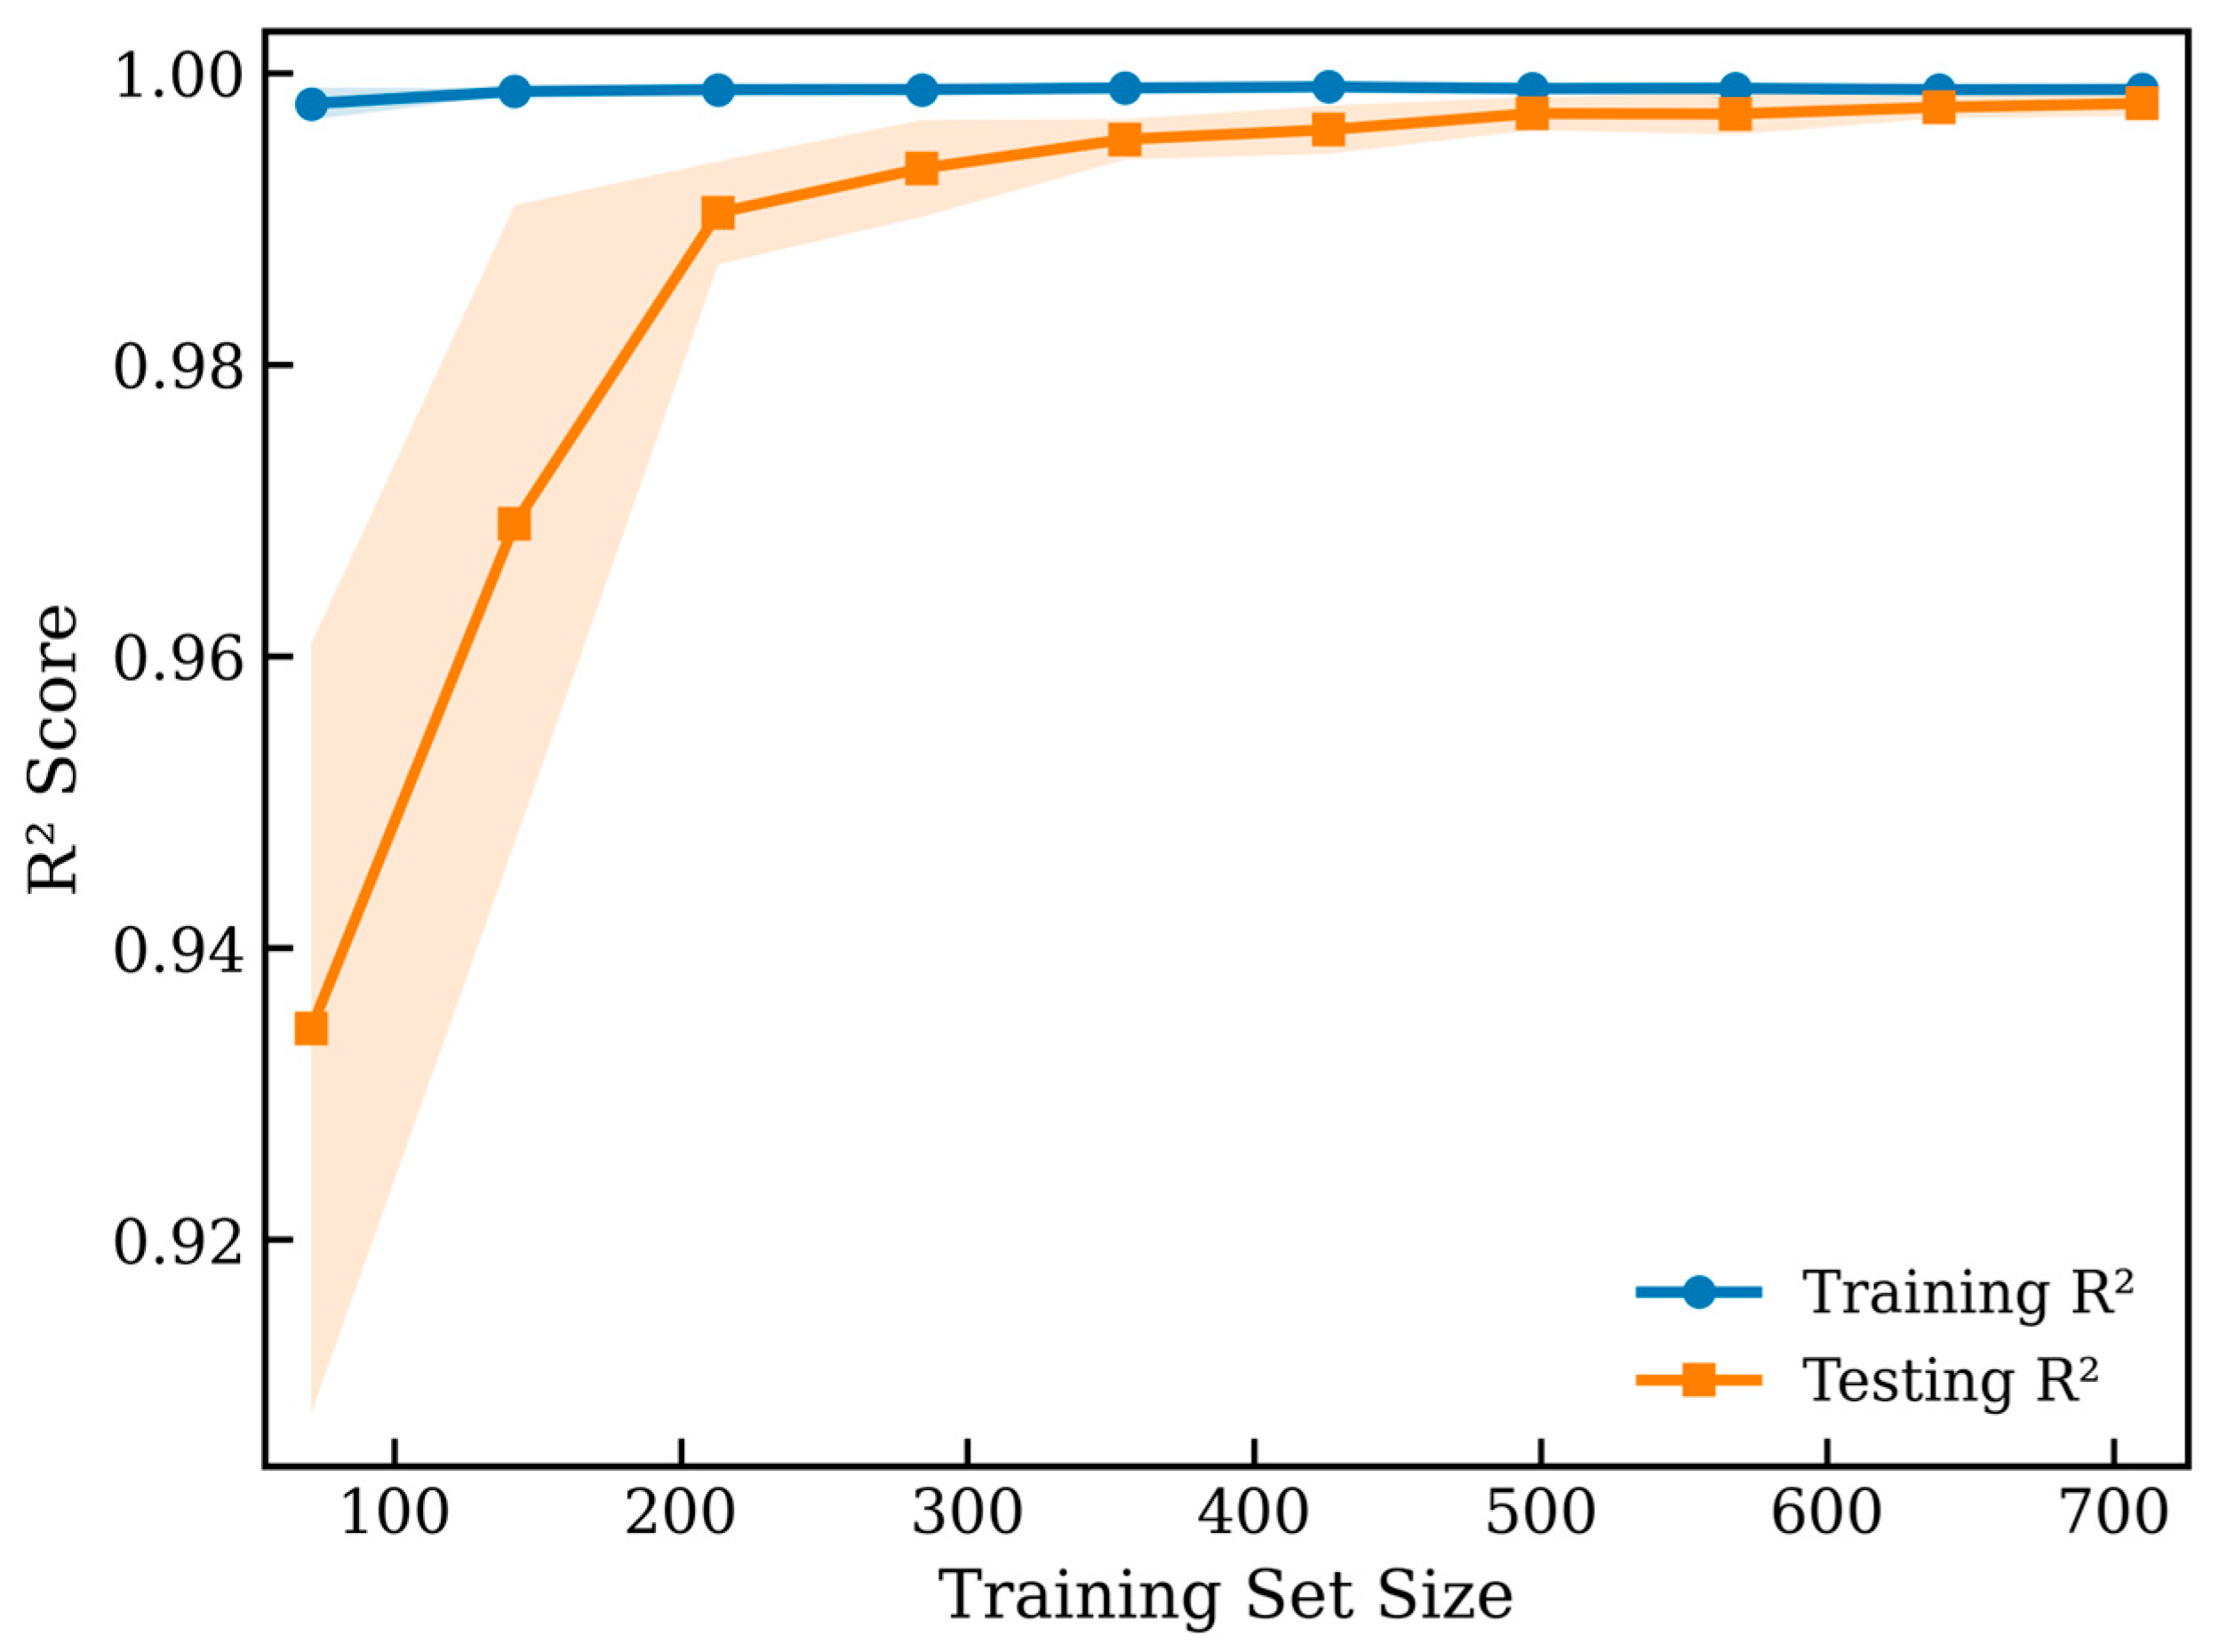
Figure 15 shows the learning curves of the PSO-XGBoost model on the training and testing sets. The blue circles represent the quantiles of the model residuals, and the red solid line represents the theoretical normal distribution reference line. The closer the sample points are to the reference line, the closer the residuals are to a normal distribution. The result indicates a small performance gap between the training and validation sets at smaller sample sizes, suggesting a slight overfitting tendency. However, the gap gradually decreases as the sample size increases, and both curves converge at high R2 values, demonstrating strong generalization ability.
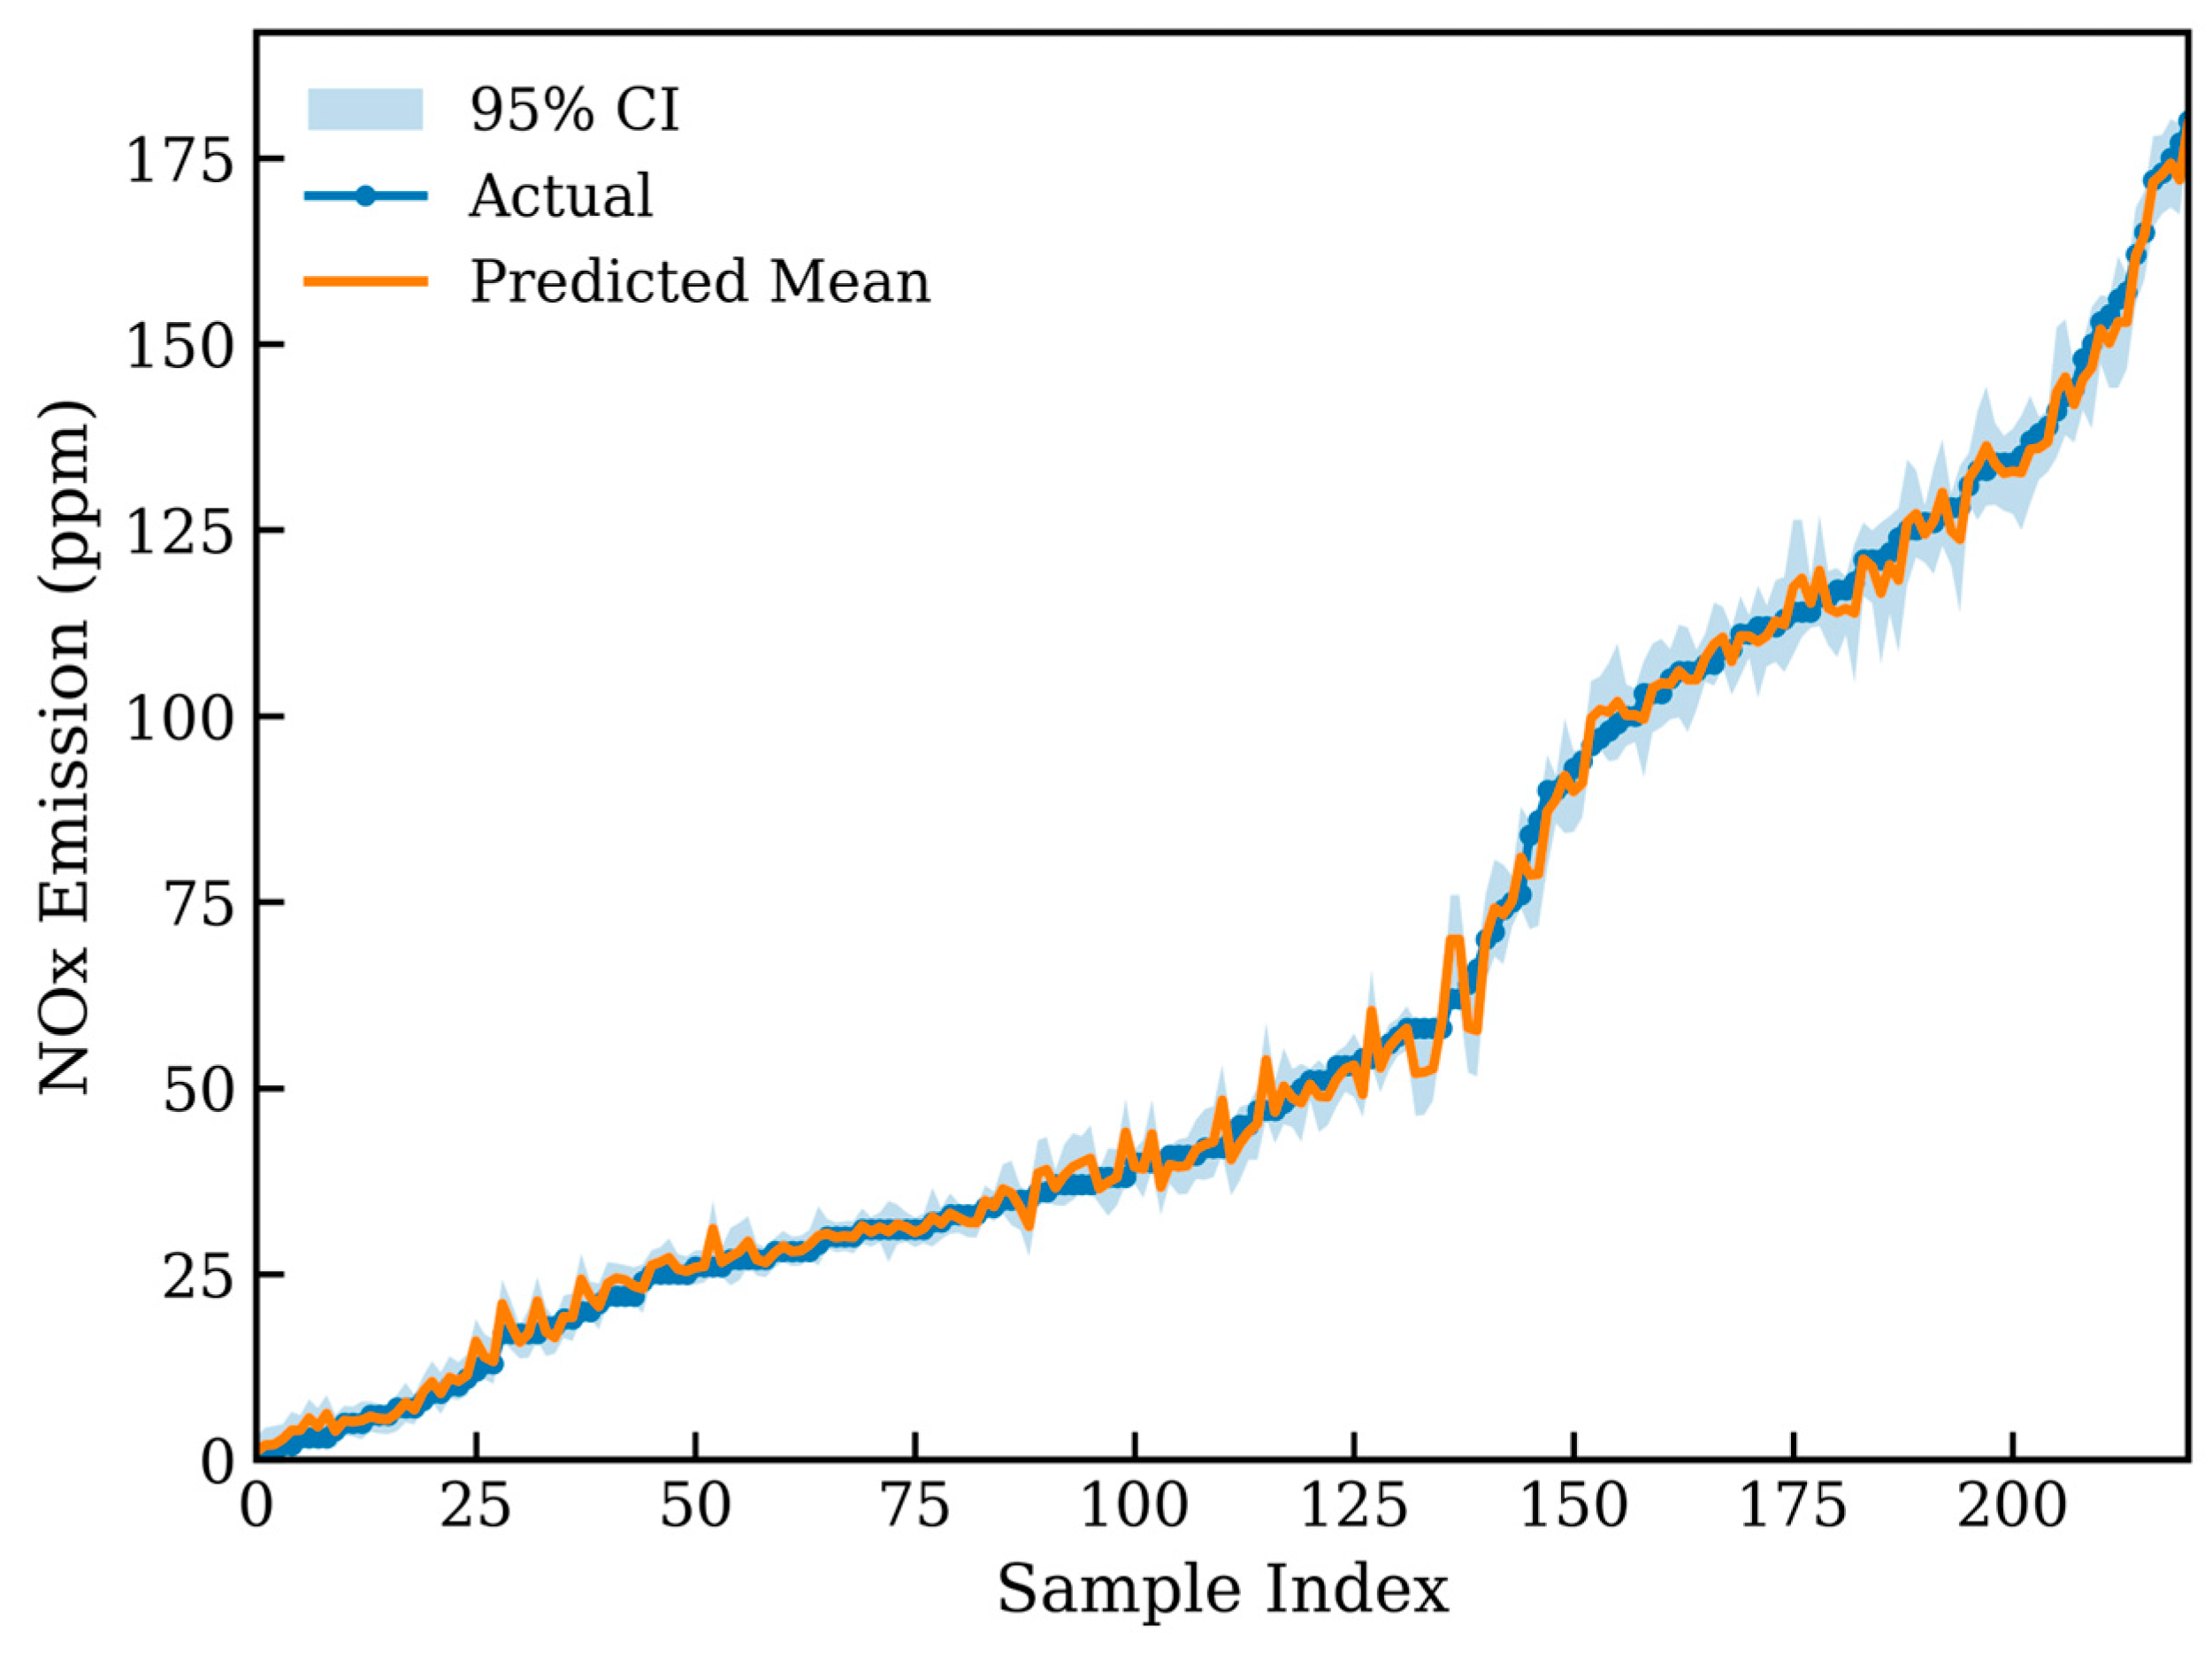
Figure 16 presents the uncertainty analysis. The predicted mean generally follows the variation trend of the actual NOx emissions, and most measured values are located within the 95% confidence interval. The confidence band remains relatively narrow over most samples, indicating low prediction uncertainty and good model stability. In regions with rapid NOx changes, the confidence interval becomes slightly wider, suggesting that prediction uncertainty increases under strongly transient conditions.

4. Conclusions

Emissions tests were conducted on a six-cylinder, 9 L diesel engine under the NRTC, and a comprehensive dataset of engine operating and emission parameters was obtained. Correlation analysis and SHAP analysis were then applied to identify key operating parameters strongly related to NOx emissions, which were used as input features for model development. Based on these features, a PSO-XGBoost machine learning model was developed to predict NOx emissions from heavy-duty non-road diesel engines. The main conclusions of this study are summarized as follows:
(1)
PCC, SCC, and SHAP analyses were used to evaluate the relationships between engine operating parameters and transient NOx emissions. The results indicate that NOx emissions are governed by multiple coupled factors rather than a single variable. Key input variables include exhaust temperature, engine speed, torque, urea injection quantity, inlet NOx concentration, and fuel-injection-related parameters.
(2)
The optimized PSO-XGBoost model achieved high prediction accuracy. On the training set, the R2, MAE, and RMSE values were 0.9989, 1.1577 ppm, and 1.5746 ppm, respectively, while the corresponding values on the test set were 0.9662, 6.3344 ppm, and 8.9682 ppm. Compared with BP, ELM, LightGBM, LSSVR, RF, and standard XGBoost, the proposed model achieved higher prediction accuracy and lower prediction error, demonstrating strong capability in capturing the nonlinear characteristics of transient NOx emissions.
(3)
Model reliability was further evaluated using five-fold cross-validation, residual analysis, learning curve analysis, and uncertainty analysis. The results indicate that the PSO-XGBoost model exhibits stable generalization performance, limited systematic bias, and acceptable prediction uncertainty under transient operating conditions. The developed model reduces reliance on conventional experimental methods and provides support for the development of emission control strategies for heavy-duty non-road diesel engines.

Author Contributions

Conceptualization, Z.Z.; methodology, Z.Z.; software, Z.Z.; validation, Z.Z.; formal analysis, Z.Z.; investigation, Z.Z.; resources, Z.Z.; data curation, Z.Z.; writing—original draft preparation, Z.Z.; writing—review and editing, Z.Z.; visualization, Z.Z.; supervision, P.W. and Z.T.; project administration, Z.Z.; funding acquisition, P.W. All authors have read and agreed to the published version of the manuscript.

Funding

Financial support of this paper was provided by the National Natural Science Foundation of China (52076104).

Institutional Review Board Statement

Not applicable.

Informed Consent Statement

Not applicable.

Data Availability Statement

The original contributions presented in this study are included in the article. Further inquiries can be directed to the corresponding author.

Conflicts of Interest

The authors declare no conflicts of interest.

References

  1. Li, M.; Zhang, Y.; Yang, J.; Liu, X.; Li, Z.; Zhang, Q. Investigation on the urea deposit formation and thermal decomposition characteristics in the SCR aftertreatment system of a diesel engine. J. Environ. Sci. 2021, 103, 157–171. [Google Scholar] [CrossRef]
  2. Li, R.; Yue, T.; Li, G.; Gao, J.; Tong, Y.; Cheng, S.; Li, G.; Hou, C.; Su, W. Global trends on NH3-SCR research for NOx control during 1994–2023: A bibliometric analysis. J. Energy Inst. 2024, 117, 101865. [Google Scholar] [CrossRef]
  3. Ali, S.; Ali, S.; Ismail, A.; Zahid, M.; Raziq, F.; Qiao, L. Cu-based metal oxide catalysts for NH3-SCR of NOx: From fundamentals to mechanistic insights. Coord. Chem. Rev. 2025, 536, 216676. [Google Scholar] [CrossRef]
  4. Manisalidis, I.; Stavropoulou, E.; Stavropoulos, A.; Bezirtzoglou, E. Environmental and health impacts of air pollution: A review. Front. Public Health 2020, 8, 14. [Google Scholar] [CrossRef]
  5. Wang, Z.; Feng, K. NOx emission prediction for heavy-duty diesel vehicles based on improved GWO-BP neural network. Energies 2024, 17, 336. [Google Scholar] [CrossRef]
  6. Hong, B.; Burghout, W. An Adaptive Estimation Approach for Integrating Real-World Operation Dynamics in Engine-Out NOx Emission Modeling of a Wheel Loader. Emiss. Control. Sci. Technol. 2024, 10, 93–109. [Google Scholar] [CrossRef]
  7. Sun, J.; Zhang, Z.; Liu, X.; Zheng, H. Reduced methane combustion mechanism and verification, validation, and accreditation (VV&A) in CFD for NO emission prediction. J. Therm. Sci. 2021, 30, 610–623. [Google Scholar]
  8. Hsieh, M.-F.; Wang, J. Design and experimental validation of an extended Kalman filter-based NOx concentration estimator in selective catalytic reduction system applications. Control. Eng. Pract. 2011, 19, 346–353. [Google Scholar] [CrossRef]
  9. Chou, C.C.; Chiang, C.J.; Su, Y.H.; Ku, Y.Y. Identification of cross-sensitivity of smart NOx sensors to ammonia in urea-selective catalyst reduction systems via fast Fourier transform. Sens. Mater. 2014, 26, 101–112. [Google Scholar]
  10. Liu, C.; Pei, Y.; Wu, C.; Zhang, F.; Qin, J. Novel insights into the NOx emissions characteristics in PEMS tests of a heavy-duty vehicle under different payloads. J. Environ. Manag. 2024, 348, 119400. [Google Scholar] [CrossRef]
  11. Okeleye, S.A.; Thiruvengadam, A.; Perhinschi, M.G.; Carder, D. Data-driven machine learning model of a Selective Catalytic Reduction on Filter (SCRF) in a heavy-duty diesel engine: A comparison of Artificial Neural Network with Tree-based algorithms. Energy 2024, 290, 130117. [Google Scholar] [CrossRef]
  12. Kim, K.; Lee, T.-H.; Kang, D.-H.; Kwon, H.-B.; Lee, S.-M.; Yoo, S.-J.; Hong, U.-S.; Kim, Y.-J. Ammonia cross-sensitivity elimination method of NOx sensor for UREA-SCR (Selective Catalytic Reduction) system. In Proceedings of the 20th International Conference on Solid-State Sensors, Actuators and Microsystems & Eurosensors XXXIII (Transducers & Eurosensors XXXIII); IEEE: New York, NY, USA, 2019; pp. 1246–1249. [Google Scholar]
  13. Zhang, H.; Wang, J. NOx sensor ammonia-cross-sensitivity factor estimation in diesel engine selective catalytic reduction systems. J. Dyn. Syst. Meas. Control 2015, 137, 061015. [Google Scholar] [CrossRef]
  14. Samosir, B.F.; Quach, N.Y.; Chul, O.K.; Lim, O. NOx emissions prediction in diesel engines: A deep neural network approach. Environ. Sci. Pollut. Res. 2024, 31, 713–722. [Google Scholar] [CrossRef]
  15. Karystinos, V.; Papalambrou, G. Deep long short-term memory neural networks as virtual sensors for marine diesel engine NOx prediction at transient conditions. Int. J. Engine Res. 2024, 25, 1024–1036. [Google Scholar] [CrossRef]
  16. Norouzi, A.; Shahpouri, S.; Gordon, D.; Shahbakhti, M.; Koch, C.R. Safe deep reinforcement learning in diesel engine emission control. Int. J. Engine Res. 2023, 237, 1440–1453. [Google Scholar] [CrossRef]
  17. Nguyen Khac, H.; Linh Nguyen, T. A review of applications of machine learning for emissions estimation in diesel engines. In The International Conference on Intelligent Systems & Networks; Springer: Berlin/Heidelberg, Germany, 2024; pp. 651–657. [Google Scholar]
  18. Khujamberdiev, R.; Cho, H.M. Artificial intelligence in automotives: ANNs’ impact on biodiesel engine performance and emissions. Energies 2025, 18, 438. [Google Scholar] [CrossRef]
  19. Khurana, S.; Saxena, S.; Jain, S.; Dixit, A. Predictive modeling of engine emissions using machine learning: A review. Mater. Today Proc. 2021, 38, 280–284. [Google Scholar] [CrossRef]
  20. Wang, G.; Awad, O.I.; Liu, S.; Shuai, S.; Wang, Z. NOx emissions prediction based on mutual information and back propagation neural network using correlation quantitative analysis. Energy 2020, 198, 117286. [Google Scholar] [CrossRef]
  21. Latinov, M.; Fiorini, N.; Vichi, G.; Innocenti, A.; Danti, P. A machine learning approach for engine model-based control on NOx emissions. SAE Tech. Pap. Series 2023. [Google Scholar] [CrossRef]
  22. Wang, J.; Zhang, Y.; Xiong, Q.; Ding, X. NOx prediction by cylinder pressure based on RBF neural network in diesel engine. In Proceedings of the 2010 International Conference on Measuring Technology and Mechatronics Automation; IEEE: New York, NY, USA, 2010; pp. 792–795. [Google Scholar]
  23. Wang, T.; Zhong, W.; Chen, X.; Zhou, G.; Shi, J.; Zhang, B. A mechanism-data hybrid-driven approach to reduce NOx emission and slagging for coal-fired boiler using POD reduced order modeling and XGBoost. Appl. Therm. Eng. 2025, 274, 126709. [Google Scholar] [CrossRef]
  24. Hoque, K.E.; Hossain, T.; Haque, A.M.; Miah, A.K.; Haque, A. NOx emission predictions in gas turbines through integrated data-driven machine learning approaches. J. Energy Resour. Technol. 2024, 146, 071201. [Google Scholar] [CrossRef]
  25. Zeng, W.; Fu, J.; Zhou, F.; Yu, J.; Liu, J.; Yuan, K. Prediction of transient NOx emission from a non-road diesel engine using a model combining Bayesian search and Population-based training. Atmos. Environ. 2024, 321, 120350. [Google Scholar] [CrossRef]
  26. Lee, J.; Kwon, S.; Kim, H.; Keel, J.; Yoon, T.; Lee, J. Machine learning applied to the NOx prediction of diesel vehicles under real driving cycle. Appl. Sci. 2021, 11, 3758. [Google Scholar] [CrossRef]
  27. Liu, B.; Fei, H.; Wang, L.; Li, X.; Yuan, Z.; Fan, L.; Wang, J. Kalman filter-based estimation method for degraded high-pressure common rail system. Energy 2025, 325, 136228. [Google Scholar] [CrossRef]
  28. Sharma, V.; Winkler, A.; Norouzi, A.; Guo, H.; Andert, J.; Gordon, D. Safe reinforcement learning-based control for hydrogen diesel dual-fuel engines. IFAC-PapersOnLine 2025, 59, 19–24. [Google Scholar] [CrossRef]
  29. Yadav, G.K.; Muvvala, P.; Reddy, R. Multi-criteria optimization of common rail direct injection engine parameters with isoamyl alcohol blends using Taguchi–grey relational analysis and artificial neural network. Therm. Sci. Eng. Prog. 2025, 63, 103719. [Google Scholar] [CrossRef]
  30. Akopov, A.S. A Hybrid Multi-Swarm Particle Swarm Optimization Algorithm for Solving Agent-Based Epidemiological Model. Cybern. Inf. Technol. 2025, 25, 59–77. [Google Scholar] [CrossRef]
  31. Zhang, X.; Chen, Y.; Cheng, L.; Tian, S.; Liu, L. PSO with segmented mutation for site selection in grid-connected photovoltaic power generation system. Appl. Energy 2025, 377, 124352. [Google Scholar] [CrossRef]
  32. Fu, C.; Cao, X.; Liang, L.; Su, T.; Guan, W.; Pan, M.; Zhang, Z.; Chen, H.; Zhou, X. Prediction of emission characteristics of diesel/n-hexanol/graphene oxide blended fuels based on fast outlier detection-sparrow search algorithm-bidirectional recurrent neural network. Process Saf. Environ. Prot. 2024, 187, 1076–1096. [Google Scholar] [CrossRef]
  33. Li, J.; Wan, T.; Huang, H.; Chen, G.; Liang, J.; Lei, B. Prediction and verification of performance and emission characteristics of diesel/natural gas dual-fuel engine based on intelligent algorithm. ACS Omega 2023, 8, 18212–18224. [Google Scholar] [CrossRef]
  34. Mukaka, M.M. A guide to appropriate use of correlation coefficient in medical research. Malawi Med. J. 2012, 24, 69–71. [Google Scholar]
  35. Chen, T.; Guestrin, C. XGBoost: A S1calable Tree Boosting System. In Proceedings of the 22nd ACM SIGKDD International Conference on Knowledge Discovery and Data Mining, San Francisco, CA, USA, 13–17 August 2016; pp. 785–794. [Google Scholar] [CrossRef]
  36. Ali, Z.A.; Abduljabbar, Z.H.; Tahir, H.A.; Sallow, A.B.; Almufti, S.M. eXtreme Gradient Boosting Algorithm with Machine Learning: A Review. Acad. J. Nawroz Univ. 2023, 12, 320–334. [Google Scholar] [CrossRef]
  37. Burnwal, Y.; Jaiswal, R.C. A Comprehensive Survey on Prediction Models and the Impact of XGBoost. Int. J. Res. Appl. Sci. Eng. Technol. 2023, 11, 1552–1556. [Google Scholar] [CrossRef]
  38. Kennedy, J.; Eberhart, R. Particle Swarm Optimization. In Proceedings of the IEEE International Conference on Neural Networks, Perth, Australia, 27 November–1 December 1995; pp. 1942–1948. [Google Scholar]
  39. Poli, R.; Kennedy, J.; Blackwell, T. Particle swarm optimization: An overview. Swarm Intell. 2007, 1, 35–37. [Google Scholar] [CrossRef]
  40. Freitas, D.; Lopes, L.G.; Morgado-Dias, F. Particle Swarm Optimisation: A Historical Review Up to the Current Developments. Entropy 2020, 22, 362. [Google Scholar] [CrossRef]
  41. Miller, C.; Portlock, T.; Nyaga, D.M.; O’sUllivan, J.M. A review of model evaluation metrics for machine learning in genetics and genomics. Front. Bioinform. 2024, 4, 1457619. [Google Scholar] [CrossRef] [PubMed]
  42. Ji, T.; Adhab, A.H.; Kanabar, B.; Yadav, A.; Prasad, K.V.; Kalia, R.; Mann, V.S.; Rana, P.K.; Mahdi, M.S.; Mansoor, A.S.; et al. Modeling density of carbon dioxide-saturated polyethylene glycol using machine learning techniques. J. Polym. Eng. 2025, 45, 660–673. [Google Scholar] [CrossRef]
  43. Li, W.; Li, W.; Busch, A.; Wang, L.; Anggara, F.; Yang, S. Machine learning algorithm to predict methane adsorption capacity of coal. Energy Fuels 2024, 38, 23422–23432. [Google Scholar] [CrossRef]
  44. Liu, L.; Zhuang, J.; Wang, Y.; Li, P.; Guo, D.; Cheng, X. WD-PSTALSTM: A data-driven hybrid model for prediction of diesel vehicle NOx emissions. Energy AI 2025, 21, 100578. [Google Scholar] [CrossRef]
Figure 1. Schematic Diagram of an Engine Test Stand.
Applsci 16 05632 g001
Figure 2. PCC and SCC Correlation Chart: (a) Pearson (b) Spearman.
Applsci 16 05632 g002
Figure 3. SHAP feature importance analysis.
Applsci 16 05632 g003
Figure 4. eXtreme Gradient Boosting Algorithm flow chart.
Applsci 16 05632 g004
Figure 5. PSO-XGBoost algorithm flowchart.
Applsci 16 05632 g005
Figure 6. Training set results: (a) Training set regression fitting. (b) Training set time series fitting.
Applsci 16 05632 g006
Figure 7. Test set results: (a) Test set regression prediction. (b) Test set time series prediction.
Applsci 16 05632 g007
Figure 8. Five-fold cross-validation: (a) Performance metrics under 5-fold cross-validation. (b) Regression prediction results of 5-fold cross-validation.
Applsci 16 05632 g008
Figure 9. Regression Analysis Chart of the Training Set for Different Algorithms.
Applsci 16 05632 g009aApplsci 16 05632 g009b
Figure 10. Regression Analysis Chart of the Test Set for Different Algorithms.
Applsci 16 05632 g010
Figure 11. Error Range: (a) Training set error range. (b) Test set error range.
Applsci 16 05632 g011
Figure 12. Comparison of evaluation indicators for various models: (a) Training set. (b) Test set.
Applsci 16 05632 g012
Figure 13. Residual Histogram.
Applsci 16 05632 g013
Figure 14. Q-Q plot of residuals for the PSO-XGBoost model.
Applsci 16 05632 g014
Figure 15. Learning curves of the PSO-XGBoost model.
Applsci 16 05632 g015
Figure 16. Uncertainty analysis of the PSO-XGBoost model.
Applsci 16 05632 g016
Table 1. Specifications of the test diesel engine.
ParametersSpecification
Engine modelYTN9 (China YTO Group Corporation Luoyang China)
Engine typeFour-stroke, water-cooled diesel engine
Number of cylinders6 cylinders, inline arrangement
Bore × stroke114 mm × 145 mm
Displacement8.9 L
Compression ratio17.5:1
Calibrated power236.9 kW
Rated power273.4 kW
Fuel injection systemBOSCH High-pressure common-rail direct injection
Exhaust aftertreatmentDOC + DPF + SCR
Table 2. XGBoost hyperparameter optimization ranges.
SymbolParameterSearch Boundary
n e s t n_estimators50–500
d max_depth2–15
n learning_rate0.01–0.30
γ gamma0–10
s subsample0.5–1.0
c colsample_bytree0.5–1.0
α reg_alpha0–10
λ reg_lambda0.1–20
Table 3. PSO parameter settings.
CategoryParameterValue/Range
PSOSwarm size20
Maximum iterations50
Inertia weight0.7
Acceleration coefficient1.5
Fitness function5-fold CV RMSE
Table 4. PSO-XGBoost evaluation parameter.
DATAR2MAERMSE
Training data set0.99891.15771.5746
Test data set0.96626.33448.9682
Disclaimer/Publisher’s Note: The statements, opinions and data contained in all publications are solely those of the individual author(s) and contributor(s) and not of MDPI and/or the editor(s). MDPI and/or the editor(s) disclaim responsibility for any injury to people or property resulting from any ideas, methods, instructions or products referred to in the content.