1. Introduction
Against the background of global climate change, the frequency and intensity of heavy rainfall events have generally increased, drawing growing attention to the risks of rainfall-induced landslides, debris flows, and mudflows [
1,
2]. In recent years, representative disasters in Zixing, Hunan Province, southeastern China, and Ridigou, Kangding, Sichuan Province, have shown that extreme rainfall can trigger clusters of shallow landslides or landslide–debris flow hazard chains, characterized by a chain-like evolution of landslide instability, material disintegration, and channelized transport [
3,
4,
5]. International studies have also shown that extreme rainfall and runoff concentration can promote rapid slope instability, gully erosion, sediment entrainment, and debris-flow-like movement in different mountainous environments. For example, rainfall-induced landslides and debris flows in the European Alps and the Andes indicate that runoff convergence, channel erosion, and water–sediment coupling play important roles in the initiation and amplification of slope instability [
6,
7,
8]. Similar overtopping- or runoff-driven erosion processes have also been reported in tailings-dam failures, where concentrated flow may trigger breach development and lead to the fluid-like release of saturated materials [
9,
10]. These studies suggest that, under extreme hydrological conditions, runoff concentration and gully-driven instability are common concerns for both natural slopes and engineered deposits. Compared with conventional landslides, flow-like landslide hazards are characterized by high mobility, long runout distances, strong impact forces, and wide affected areas, often posing serious threats to settlements, transportation corridors, hydraulic infrastructure, and valley-slope stability [
11,
12,
13]. When the sliding mass undergoes structural disintegration, particle dispersion, and soil–water mixed transport, its mobility and long-runout capacity are substantially enhanced, which may further induce channel erosion, local river blockage, and amplification of secondary hazards [
14,
15,
16]. Therefore, clarifying the transition of landslides from progressive deformation to structural disintegration and flow-like transport under water-flow action is essential for understanding the formation mechanisms of chain-type geological hazards in mountainous regions.
Water recharge is an important external factor that induces landslide instability. Previous studies have shown that rainfall intensity, cumulative rainfall, and rainfall duration can alter slope moisture conditions, pore water pressure, and stability [
17,
18,
19]. Water infiltration can reduce matric suction, increase pore water pressure, and decrease effective stress, thereby weakening shear strength and intensifying slope deformation [
20,
21,
22]. Physical model tests and numerical simulations have also revealed staged processes under rainfall conditions, including wetting-front migration, local softening, crack propagation, and progressive connection of the sliding surface [
23,
24,
25]. However, most existing studies have considered areal rainfall infiltration as the primary hydraulic boundary, while insufficient attention has been paid to the concentrated recharge formed by rainfall runoff accumulating behind landslides.
In actual mountainous landslides, rainfall-generated water does not always enter the slope through uniform infiltration. Controlled by rear-edge platforms, gully topography, local depressions, and fissure pathways, surface runoff and gully flow may converge behind the landslide and continuously act on the rear part of the slope along preferential flow paths [
26,
27,
28]. Compared with areal infiltration, concentrated rear runoff is characterized by localized recharge, well-defined flow paths, relatively high hydraulic gradients, and strong local scouring capacity [
29,
30,
31]. Previous studies have shown that infiltration and surface runoff exert different controls on slope instability and erosional failure, and that different hydraulic boundaries may lead to distinct failure modes [
32,
33,
34]. Meanwhile, topographic convergence and the spatial distribution of slope moisture can influence the initiation location and instability process of landslides [
35,
36]. Therefore, slope failure under concentrated rear-runoff conditions is not merely a rainfall-infiltration-induced instability process but a compound failure process governed by the combined effects of infiltration-induced softening, pore-pressure response, gully incision, and local disintegration.
The transformation of landslide movement and flow-like failure after instability have also attracted considerable attention. Previous studies have suggested that the transformation of landslides into debris flows or flow-like movements is commonly associated with material composition, disruption of the particle skeleton, soil–water mixing, channel erosion, and topographic confinement [
37,
38,
39]. Variations in pore water pressure and material entrainment along the runout path can further affect landslide mobility, runout distance, and depositional morphology [
40]. However, existing studies have mainly focused on post-failure velocity, displacement, runout distance, and depositional characteristics. A systematic understanding is still lacking regarding how concentrated runoff affects the internal hydraulic response, structural disintegration, and flow-like transformation process of slopes.
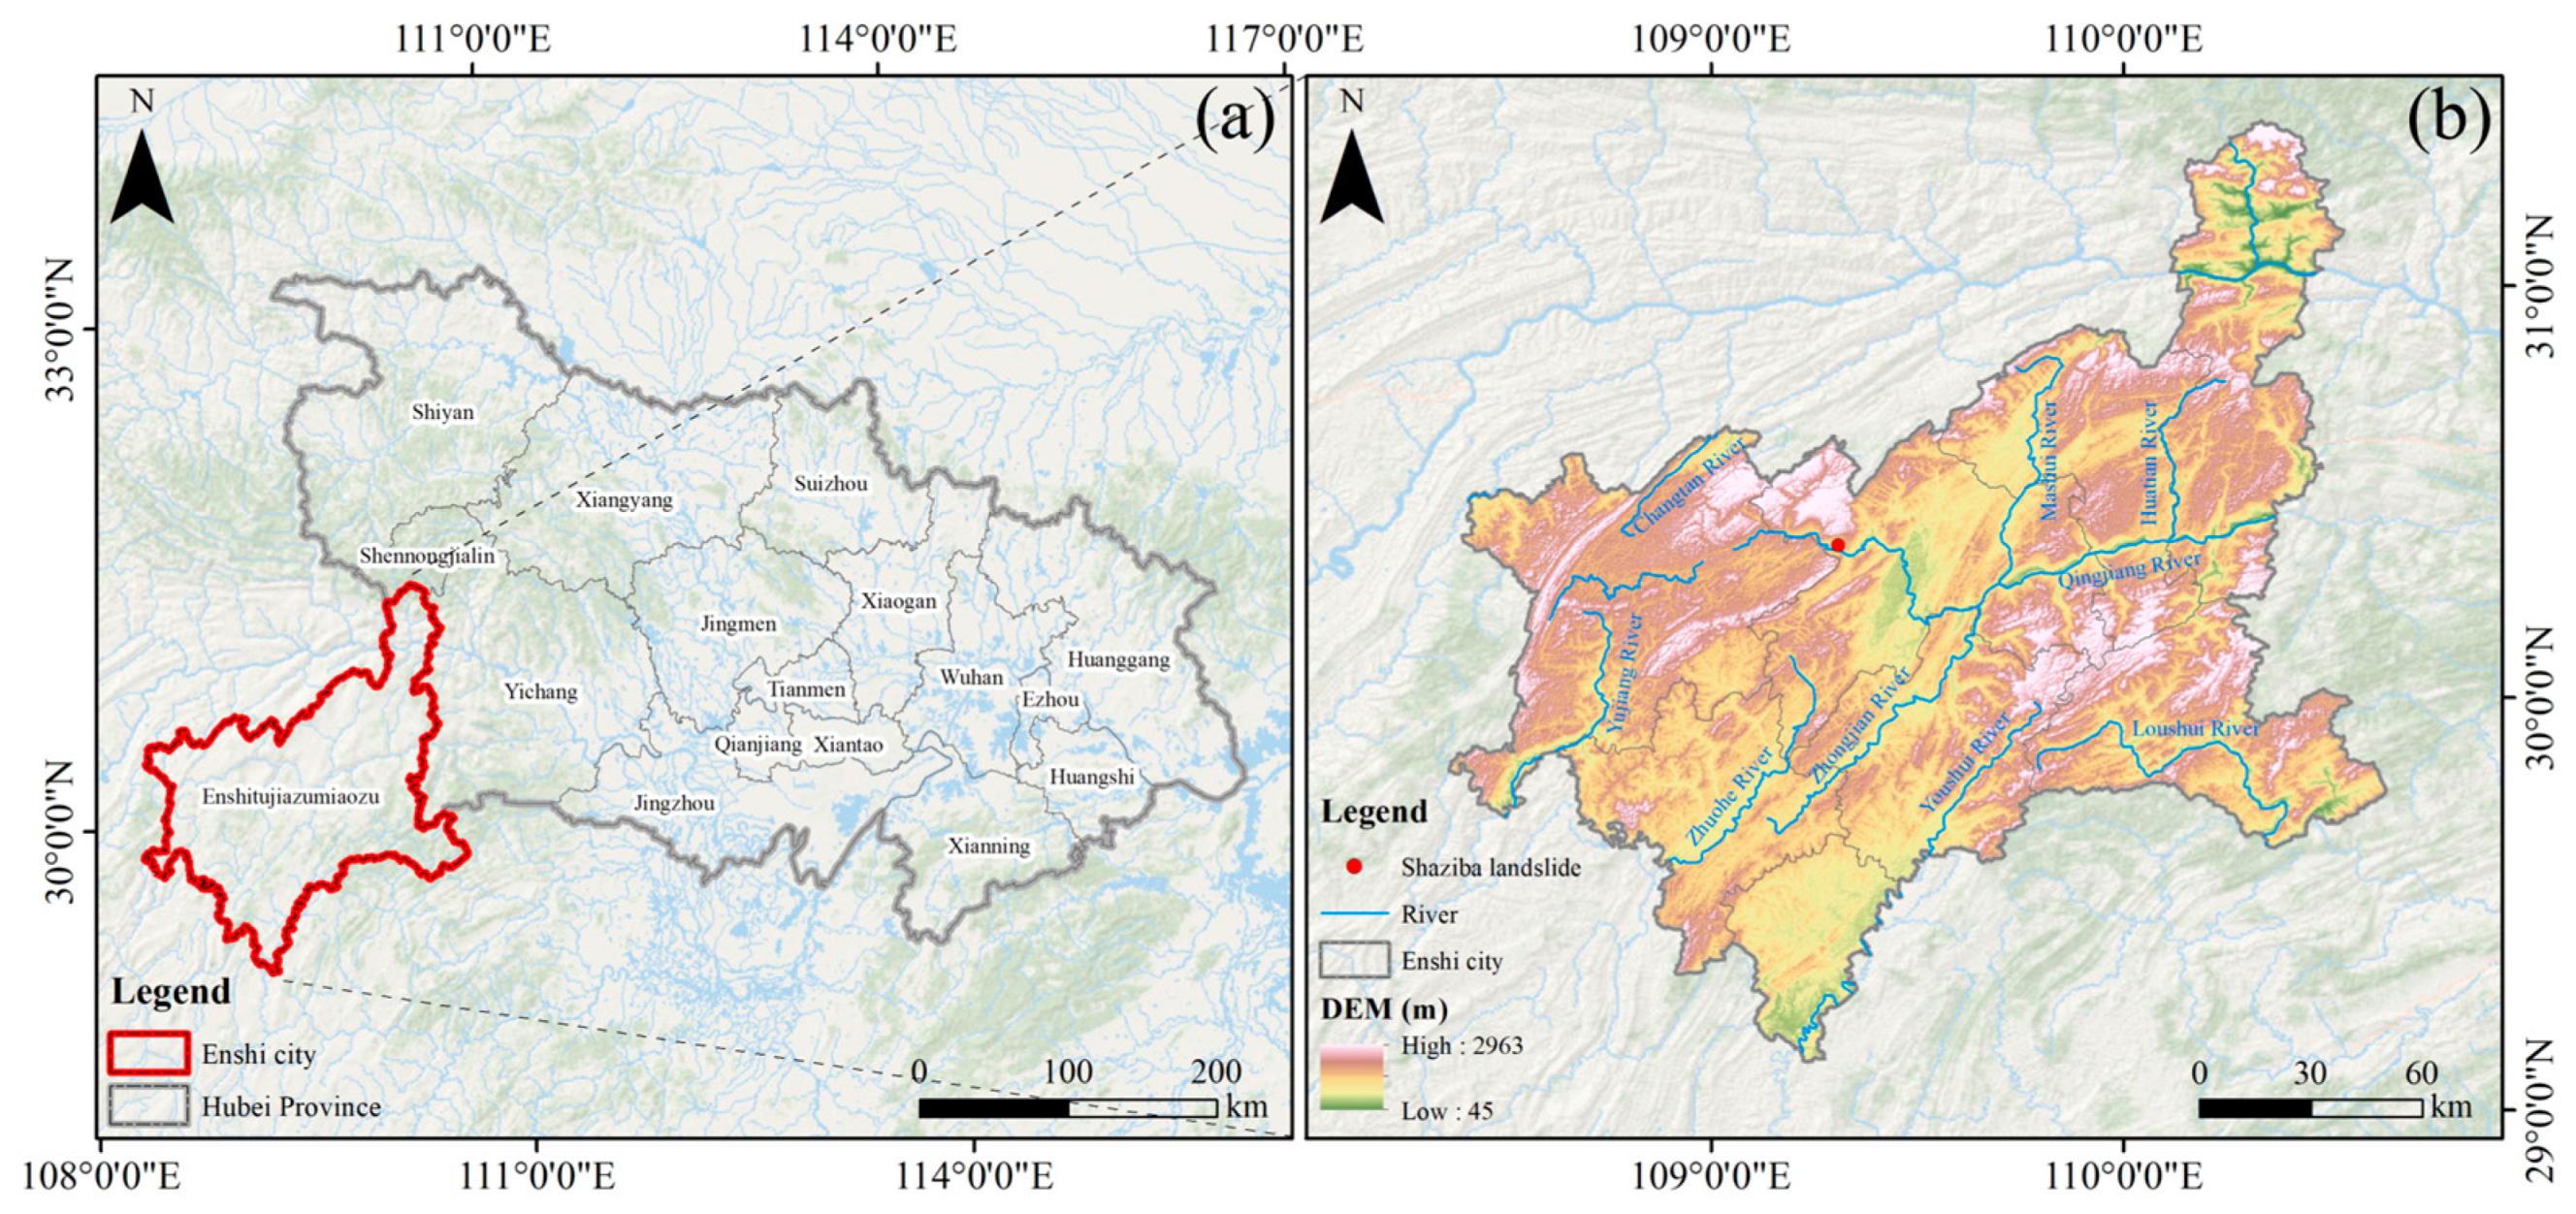
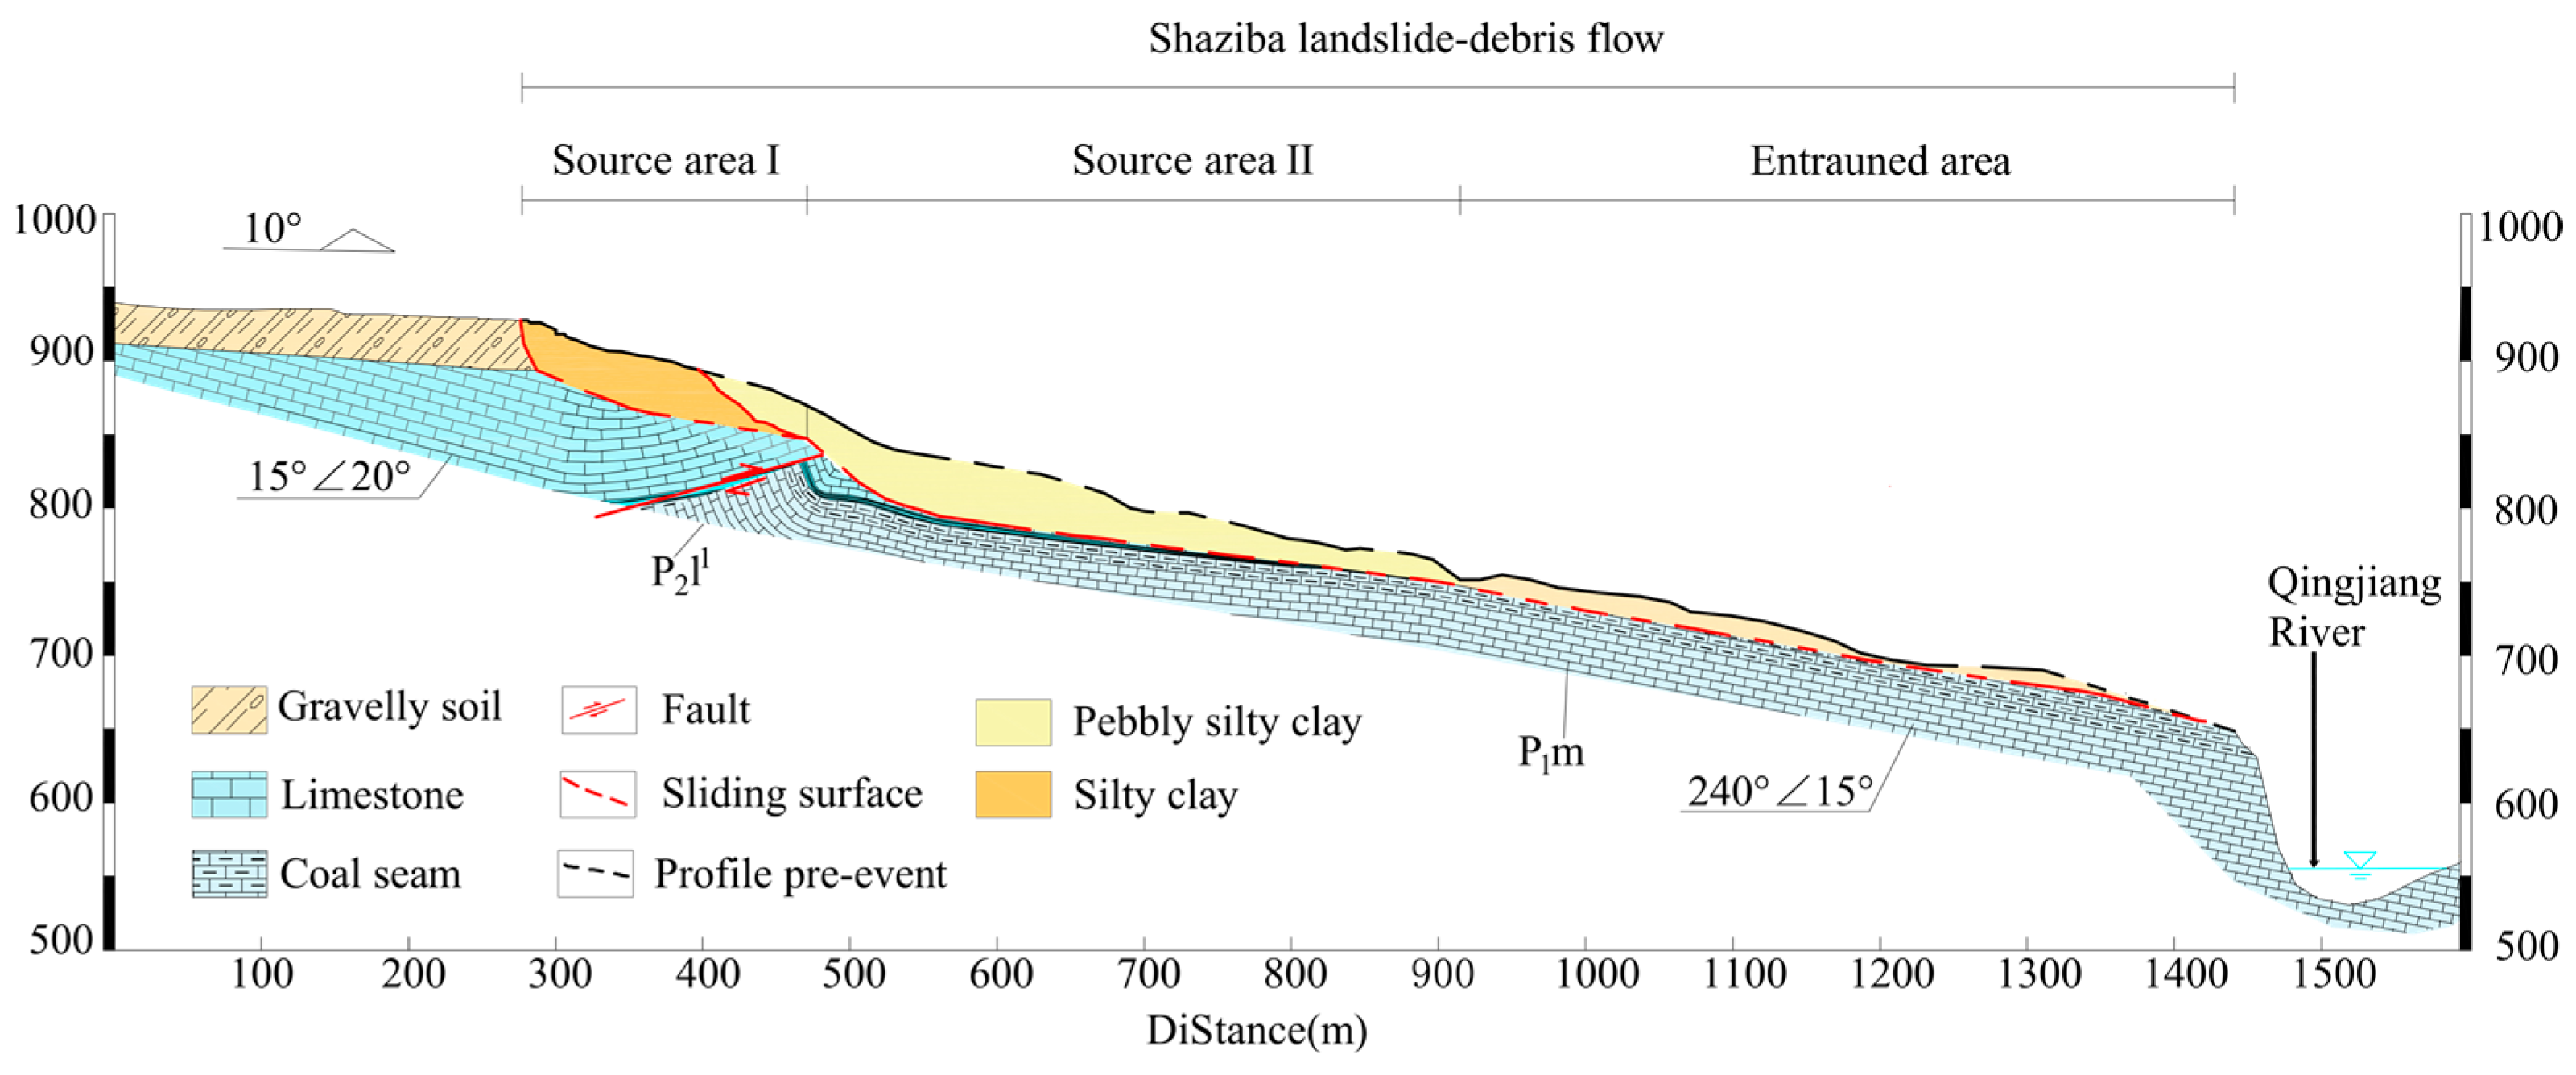
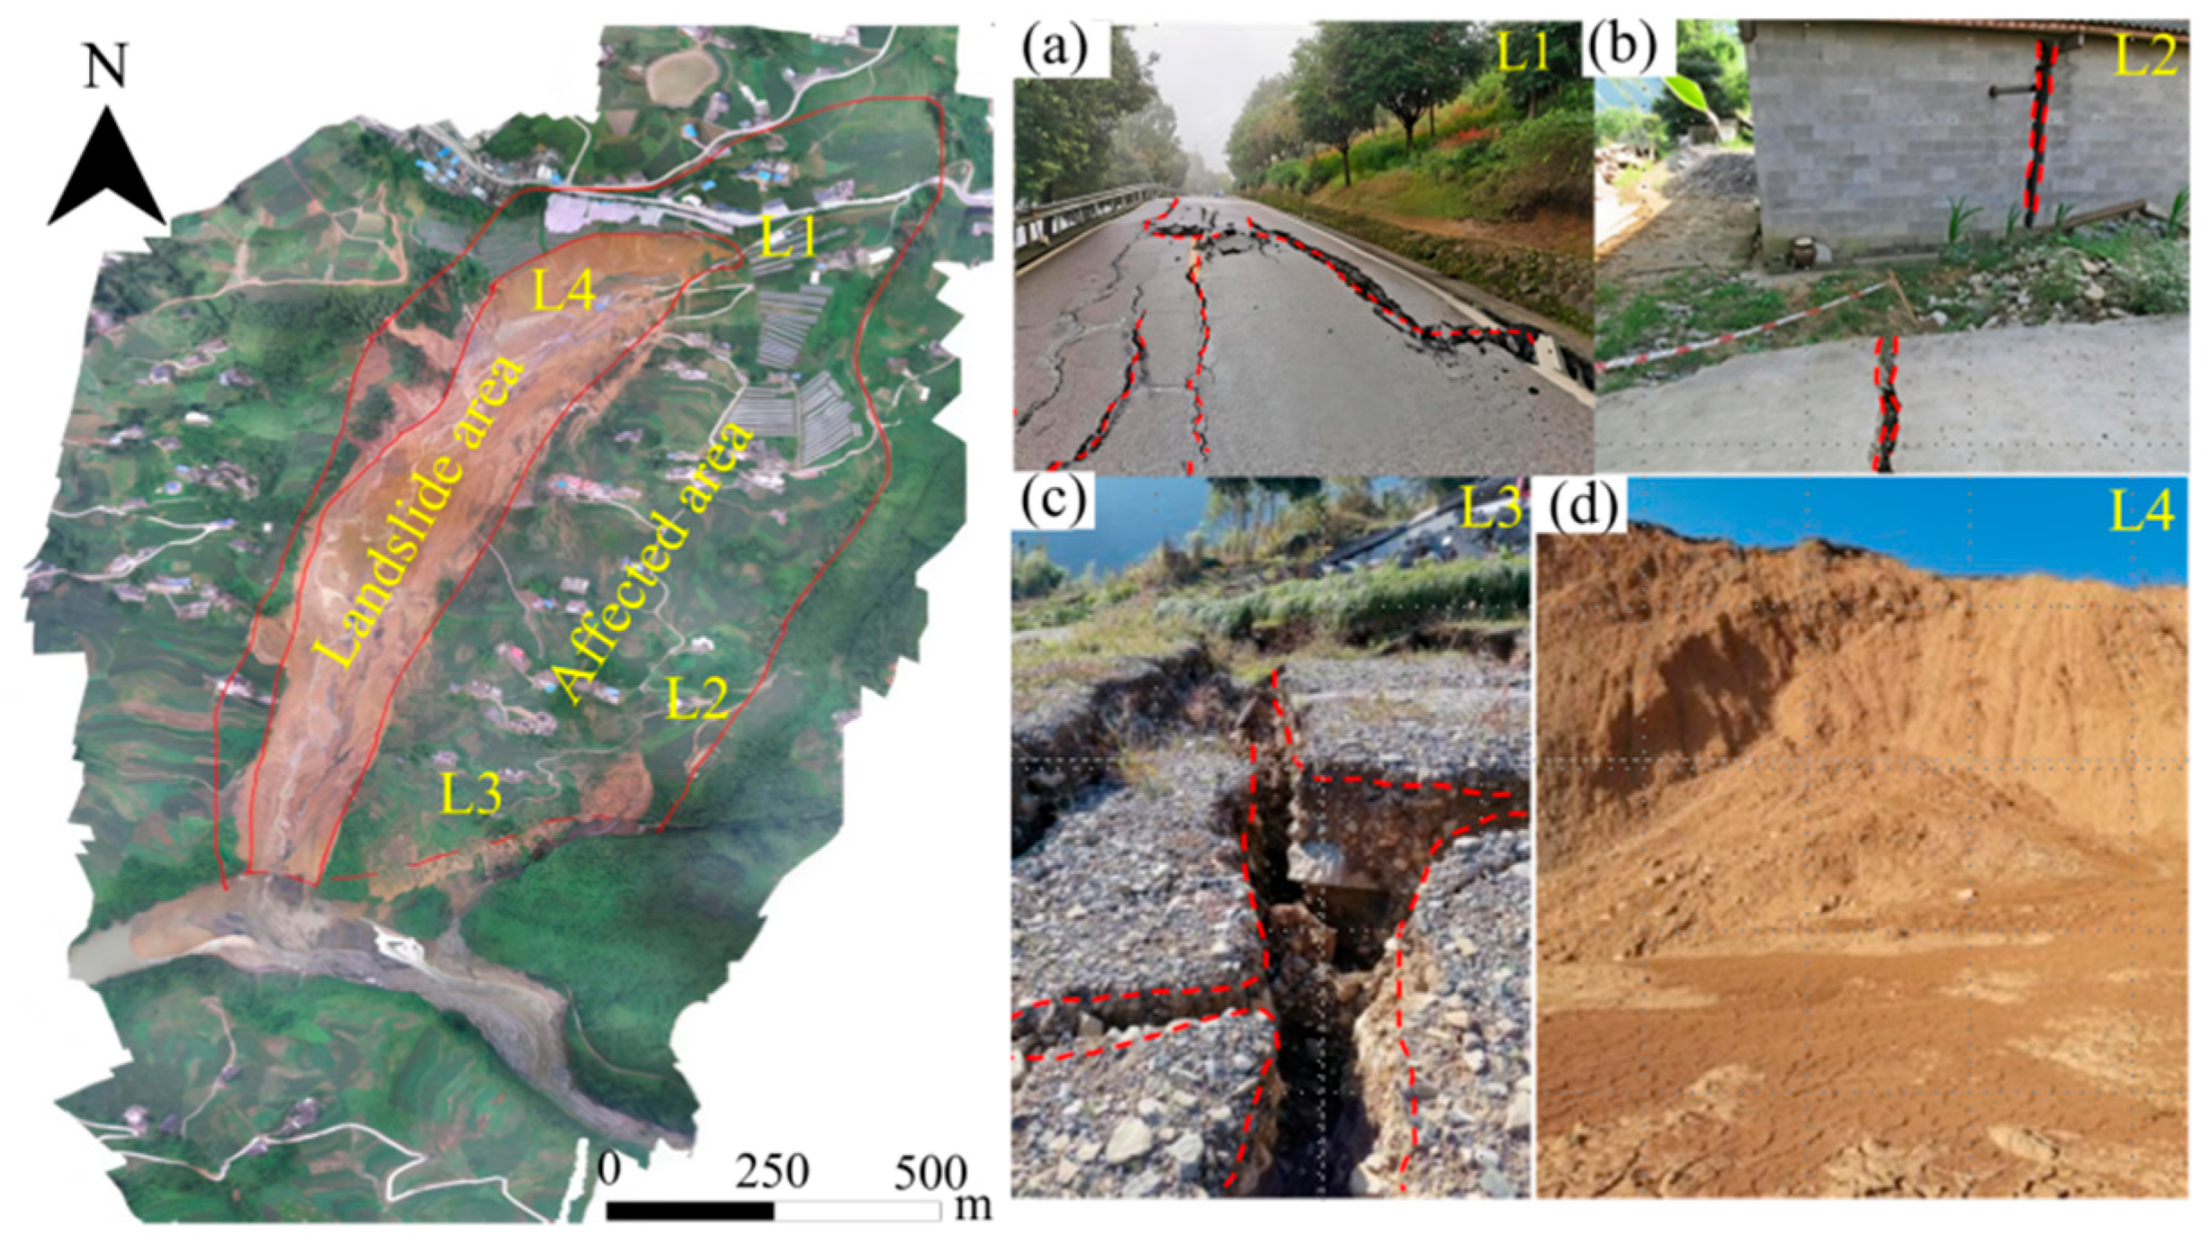
The Shaziba landslide is located on the valley slope of the Qingjiang River in Enshi, Hubei Province, China. Well-developed rear-edge platforms and gullies provide favourable conditions for the convergence and concentrated downslope discharge of surface runoff [
41]. This landslide exhibits distinct characteristics of a flow-like landslide hazard chain. After instability, the loose landslide materials further disintegrated under the combined effects of concentrated water flow and topographic confinement and were transported and deposited toward the slope toe and the Qingjiang River valley [
42,
43]. Accordingly, this study takes the Shaziba landslide as the engineering background and conducts two-dimensional flume model tests under concentrated rear-runoff conditions. Different runoff discharge conditions were designed, and variations in volumetric water content, pore water pressure, and earth pressure were monitored synchronously. Combined with observations of the macroscopic deformation process, the effects of rear-runoff intensity on moisture migration, pore water pressure evolution, earth-pressure adjustment, and gully development were analysed. The evolutionary mechanism by which the slope transforms from infiltration-induced softening and structural disintegration to flow-like transport was further explored, providing experimental evidence for the identification and prevention of landslide hazards controlled by rear runoff.
3. Materials and Methods
Based on the analysis of the engineering geological conditions and hazard evolution process of the Shaziba landslide, concentrated rear runoff is identified as an important hydraulic boundary controlling slope deformation development and structural disintegration. Owing to the large scale of the prototype landslide and its complex topographic boundaries, it is difficult to synchronously control and continuously monitor rear-runoff discharge, internal moisture migration, pore water pressure variation, and local stress adjustment in the field. Therefore, this study adopts a two-dimensional flume model test to conduct a generalized simulation of the deformation and failure process of the Shaziba landslide under rear-runoff conditions. The focus is placed on the effects of different runoff intensities on slope response time, gully development, local collapse, and flow-like transport characteristics.
3.1. Experimental Design and Model Generalization
A two-dimensional physical slope model was adopted in the model tests. Owing to limitations in experimental scale, 1-g conditions, and boundary effects, the model could not fully reproduce the three-dimensional boundary geometry and local microtopographic features of the Shaziba landslide. Therefore, the prototype landslide was generalized while retaining its main slope structure, slope-surface morphology, and rear-runoff boundary characteristics. The prototype length of Section II of the source area of the Shaziba landslide is approximately 1000 m. Scaling the entire section according to the similarity ratio would exceed the dimensions of the model box. Because this study focuses on the deformation and failure process of the slope under rear-runoff conditions rather than on overall stability evaluation, an approximately 600 m-long portion of Section II was selected as the main deformation study segment, considering the model-box dimensions and experimental layout. This segment includes the main sliding zone and the typical slope structure from the rear edge to the middle and front parts and can represent the responses of different slope sections under rear-runoff conditions [
46]. A geometric similarity ratio of 1:300 was adopted. The model box was 240 cm × 60 cm × 120 cm in length, width, and height, respectively, with an effective slope section of approximately 200 cm. A platform was retained at the rear edge of the model to simulate the runoff boundary. The slope angle was set to 20°, generally consistent with that of the S2 area. A deposition area was arranged outside the flume to observe toe deposition after disintegration of the sliding mass.
3.2. Similar Materials and Scaling Relationships
In flume model tests, the selection of similar materials directly affects the reliability and comparability of the experimental results. Owing to limitations in scale and experimental conditions, it is difficult for model materials to fully reproduce the prototype materials. Therefore, the prototype landslide materials are usually reasonably generalized while satisfying the main similarity relationships [
47,
48,
49].
The sliding bed mainly served as a supporting boundary and was not included in the similarity design. In this study, the similarity ratios of gravitational acceleration and density were set as λg = λρ = 1, and the geometric similarity ratio was λL = 300. The similarity ratios of dimensionless parameters were set as 1. Accordingly, the following similarity ratios were obtained: λc = 300, λφ = 1, λw = 1, and λμ = 1. The composition and parameters of the model materials were determined through proportioning tests, as listed in
Table 1. Considering that similar materials with extremely low cohesion (<0.08 kPa) are difficult to shape into a stable slope and maintain stability during testing, the cohesion of the model slope was appropriately increased while maintaining similarity in density and internal friction angle. Although this treatment introduced a certain degree of strength-similarity distortion, it was necessary to ensure the stability and operability of the model slope during testing [
50,
51,
52]. The relatively high cohesion of the model material may have delayed crack initiation, reduced the occurrence of local collapse, and affected the absolute timing of gully-wall collapse. Therefore, the experimental results of this study are mainly used to analyze the relative differences in slope response sequence, gully development, collapse timing, and failure-mode transition under the four test conditions. The material compositions and mixture proportions are listed in
Table 1.
3.3. Flume Model Preparation and Monitoring Layout
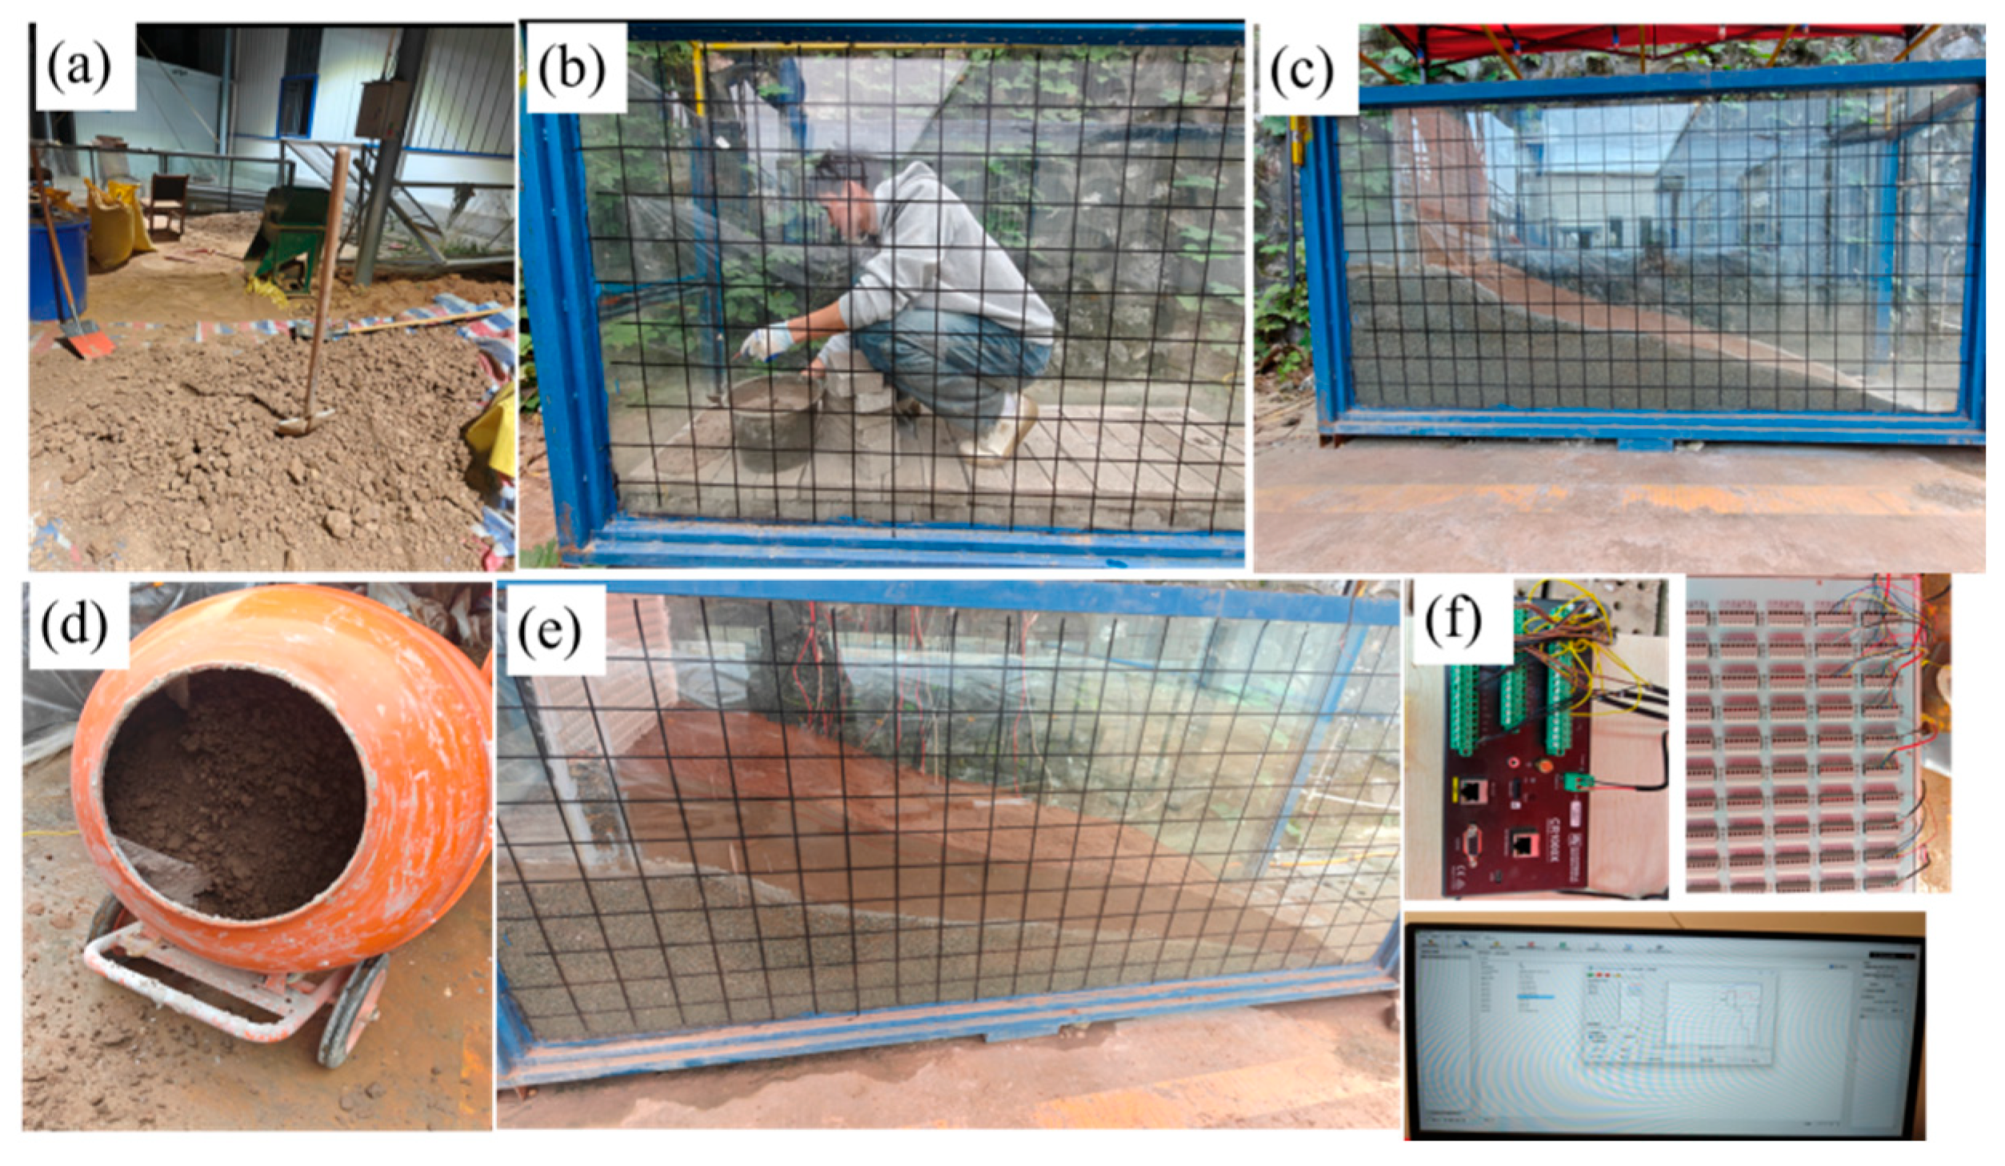
The flume model test system consisted of a model box and a data monitoring and acquisition system. The model preparation process is shown in
Figure 5. Based on the structural characteristics of the prototype landslide, the sliding bed was constructed using bricks and cement mortar (
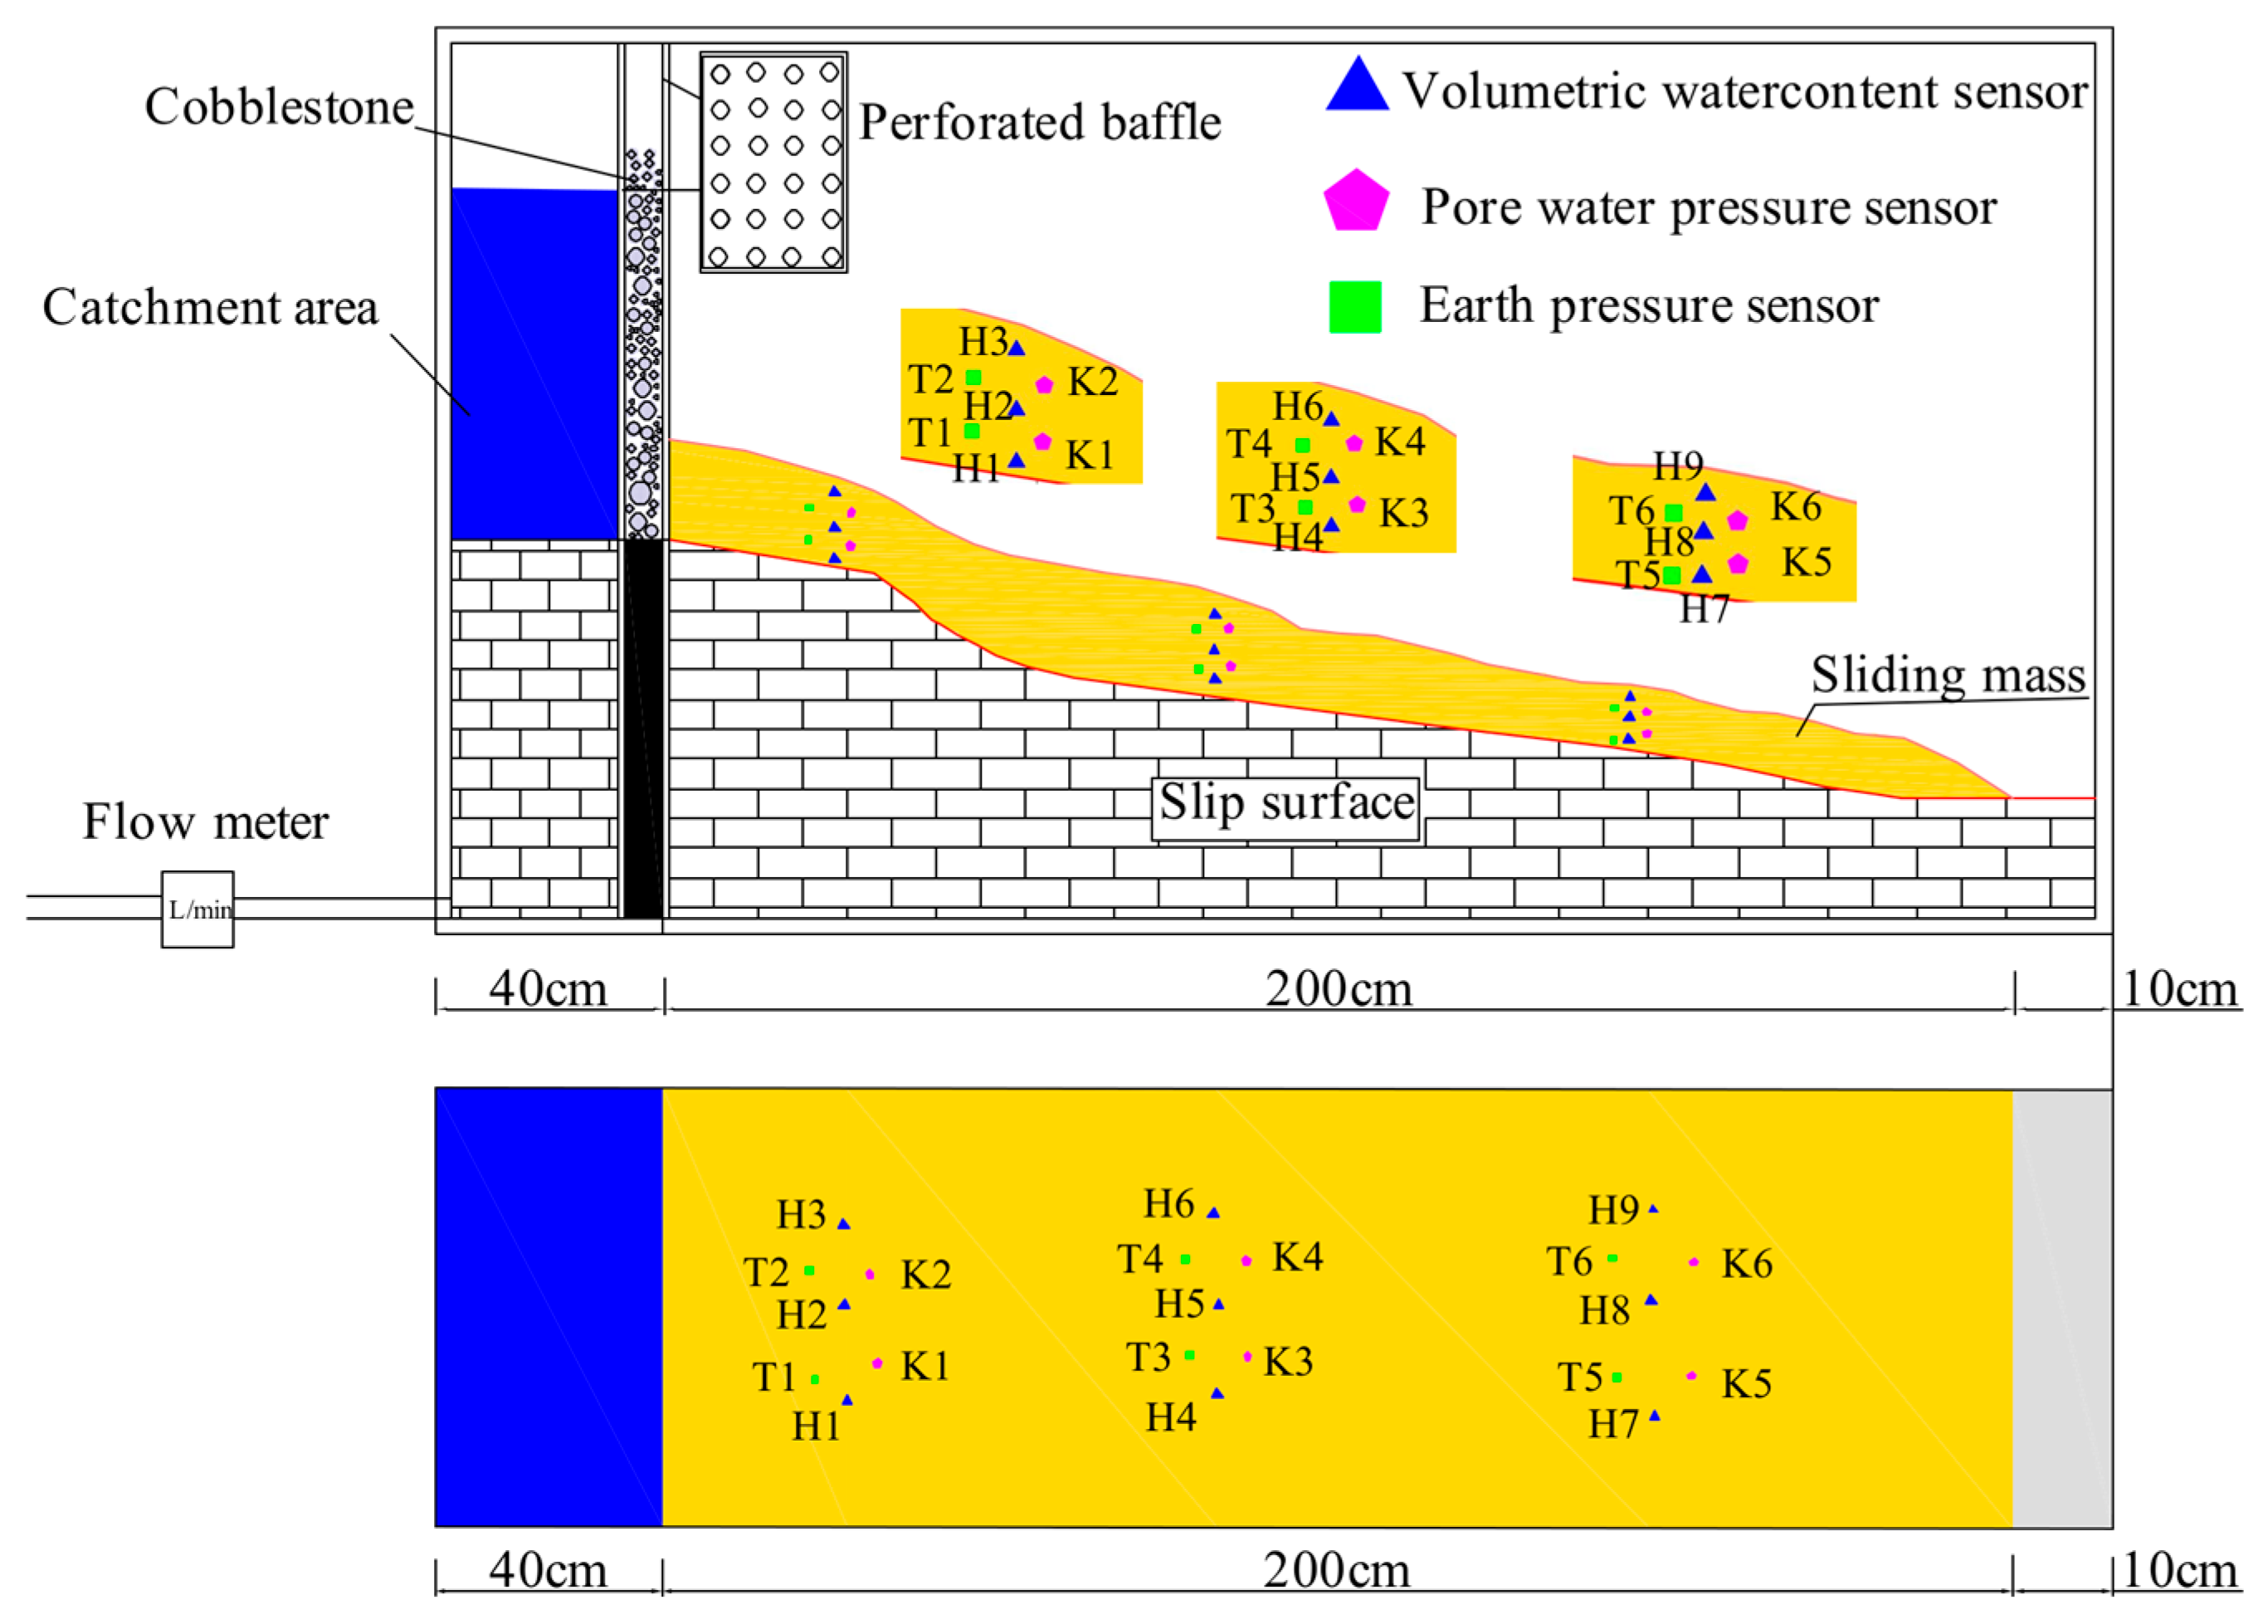
Figure 5b,c). A perforated acrylic plate and a pebble buffer layer were arranged at the rear edge to reduce erosion and stabilize the inflow conditions. The thickness of the sliding mass was controlled according to the profile characteristics and the geometric similarity relationship. After sieving and uniform mixing, the test soil was placed and compacted layer by layer to construct a model satisfying the designed slope geometry (
Figure 5a,d,e). After model formation, volumetric water content and pore water pressure sensors were installed and connected to the data acquisition system (
Figure 5f), completing the model construction. The DM-SA01 soil moisture sensors, DMKY pore-water pressure sensors, DMKY miniature earth pressure cells, and DM-YB1860 data acquisition system were manufactured by Nanjing Danmo Electronic Technology Co., Ltd. (Nanjing, China).
Three vertical monitoring profiles were arranged longitudinally from the rear edge to the front edge of the slope. Volumetric water content, pore water pressure, and earth pressure sensors were installed in each profile to synchronously monitor moisture migration, seepage evolution, and stress distribution within the slope. A total of nine volumetric water content sensors (H1–H9), six pore water pressure sensors (K1–K6), and six earth pressure sensors (T1–T6) were installed, as shown in
Figure 6.
Before testing, the volumetric water content, pore water pressure, and earth pressure sensors were checked to ensure stable data acquisition at all monitoring points. Rear-runoff inflow was controlled using a stable water-supply device, and different prescribed discharges were calibrated before testing using the graduated-cylinder timing method. Formal testing was started after the water supply became continuous and stable. During the tests, the macroscopic deformation process of the slope was recorded synchronously, while variations in volumetric water content, pore water pressure, and earth pressure were recorded by the data acquisition system at uniform time intervals.
3.4. Conversion of Concentrated Rear-Runoff Discharge and Test Condition Design
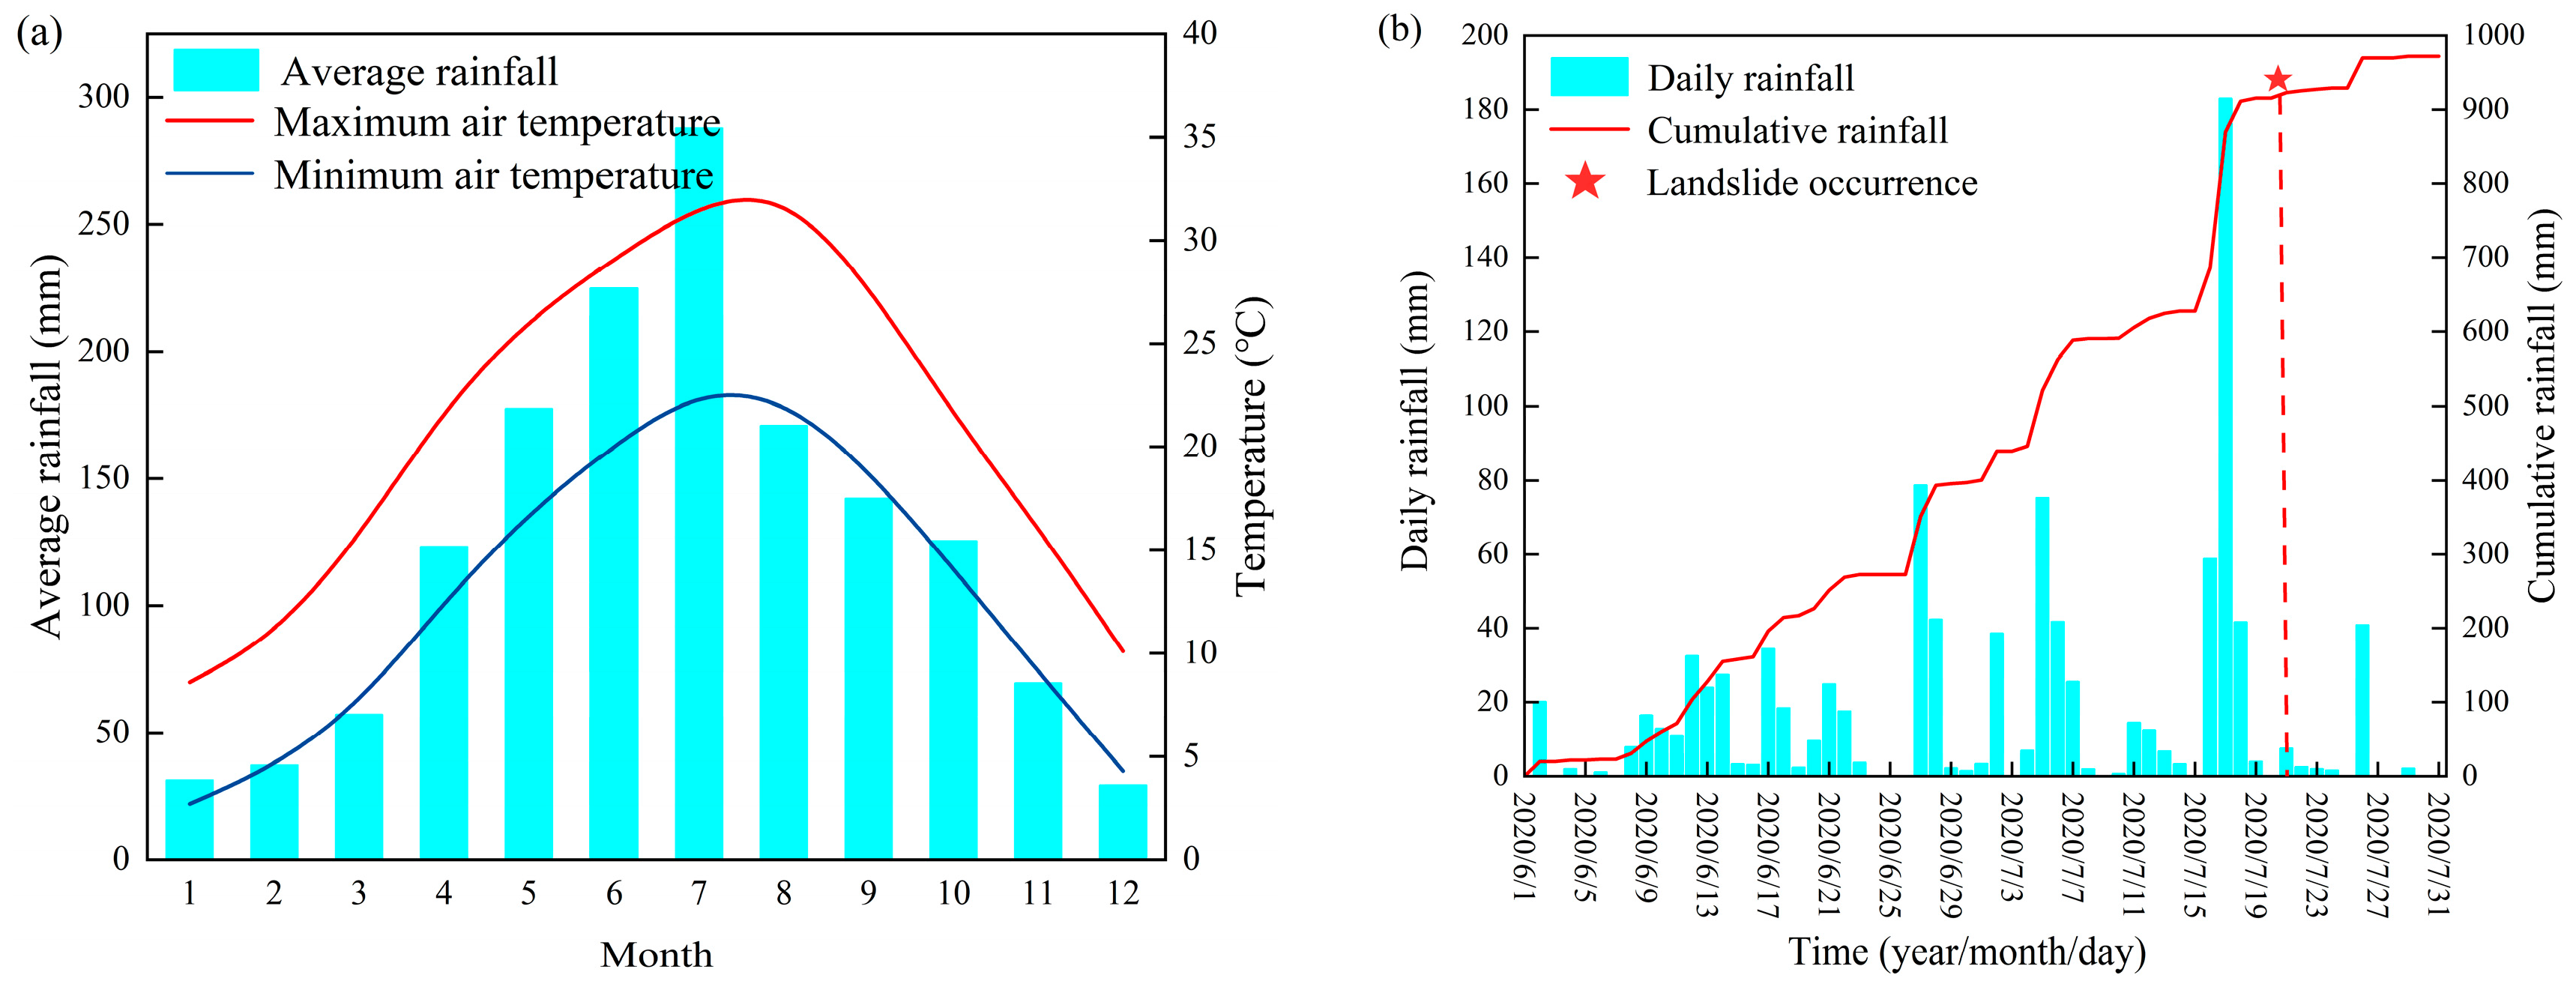
A relatively large catchment area was developed behind the rear edge of the Shaziba landslide. Under heavy rainfall conditions, slope runoff and gully flow tend to converge behind the landslide and discharge downslope in a concentrated manner, continuously acting on the rear part of the sliding mass. To investigate the effects of different concentrated rear-runoff intensities on the deformation and failure process of the slope, four representative cumulative rainfall amounts, namely 36.4, 78, 142, and 182 mm, were selected as the basis for runoff-intensity classification, considering the rainfall process preceding the Shaziba landslide and the 24 h rainfall classification standard.
The magnitude of rear-runoff is mainly controlled by rainfall amount, catchment area, and the surface runoff coefficient. The theoretical runoff volume generated in the rear catchment can be expressed as
where
Vp is the theoretical runoff volume generated in the rear catchment, m
3;
P is the rainfall amount, mm;
A is the rear catchment area, m
2; and
ψ is the runoff coefficient. According to the field topographic conditions and investigation report, the rear catchment area of the Shaziba landslide is approximately 9.1 km
2, and the runoff coefficient was set to 0.7.
Because the actual runoff concentration process is jointly affected by rainfall duration, surface infiltration, channel convergence, topographic confinement, and local blockage, the runoff volume of the prototype cannot be directly equated with the inflow discharge used in the model test. Therefore, the rear-edge inflow discharge of the model was determined using a similarity-based conversion method that links the prototype runoff volume, effective convergence duration, and model discharge. The average rear-runoff discharge of the prototype can be expressed as
where
Qp is the average rear-runoff discharge of the prototype, m
3/s; and
te is the effective convergence duration, s. Based on the rainfall process of the Shaziba landslide and the characteristics of concentrated rear runoff, the effective convergence duration was set as
te = 6 h in this study. This parameter was used mainly to convert the prototype runoff volume into an average runoff discharge and does not represent the duration of the model test.
The geometric similarity ratio adopted in this test was 1:300, namely
λL = 300. Under gravity-dominated flow conditions, the similarity ratio of water discharge can be expressed as
Thus, the rear-edge inflow discharge used in the model test is given by
where
Qm denotes the rear-edge inflow discharge of the model, mL/s.
The detailed test conditions are presented in
Table 2.
4. Test Results
4.1. Macroscopic Deformation and Failure Process
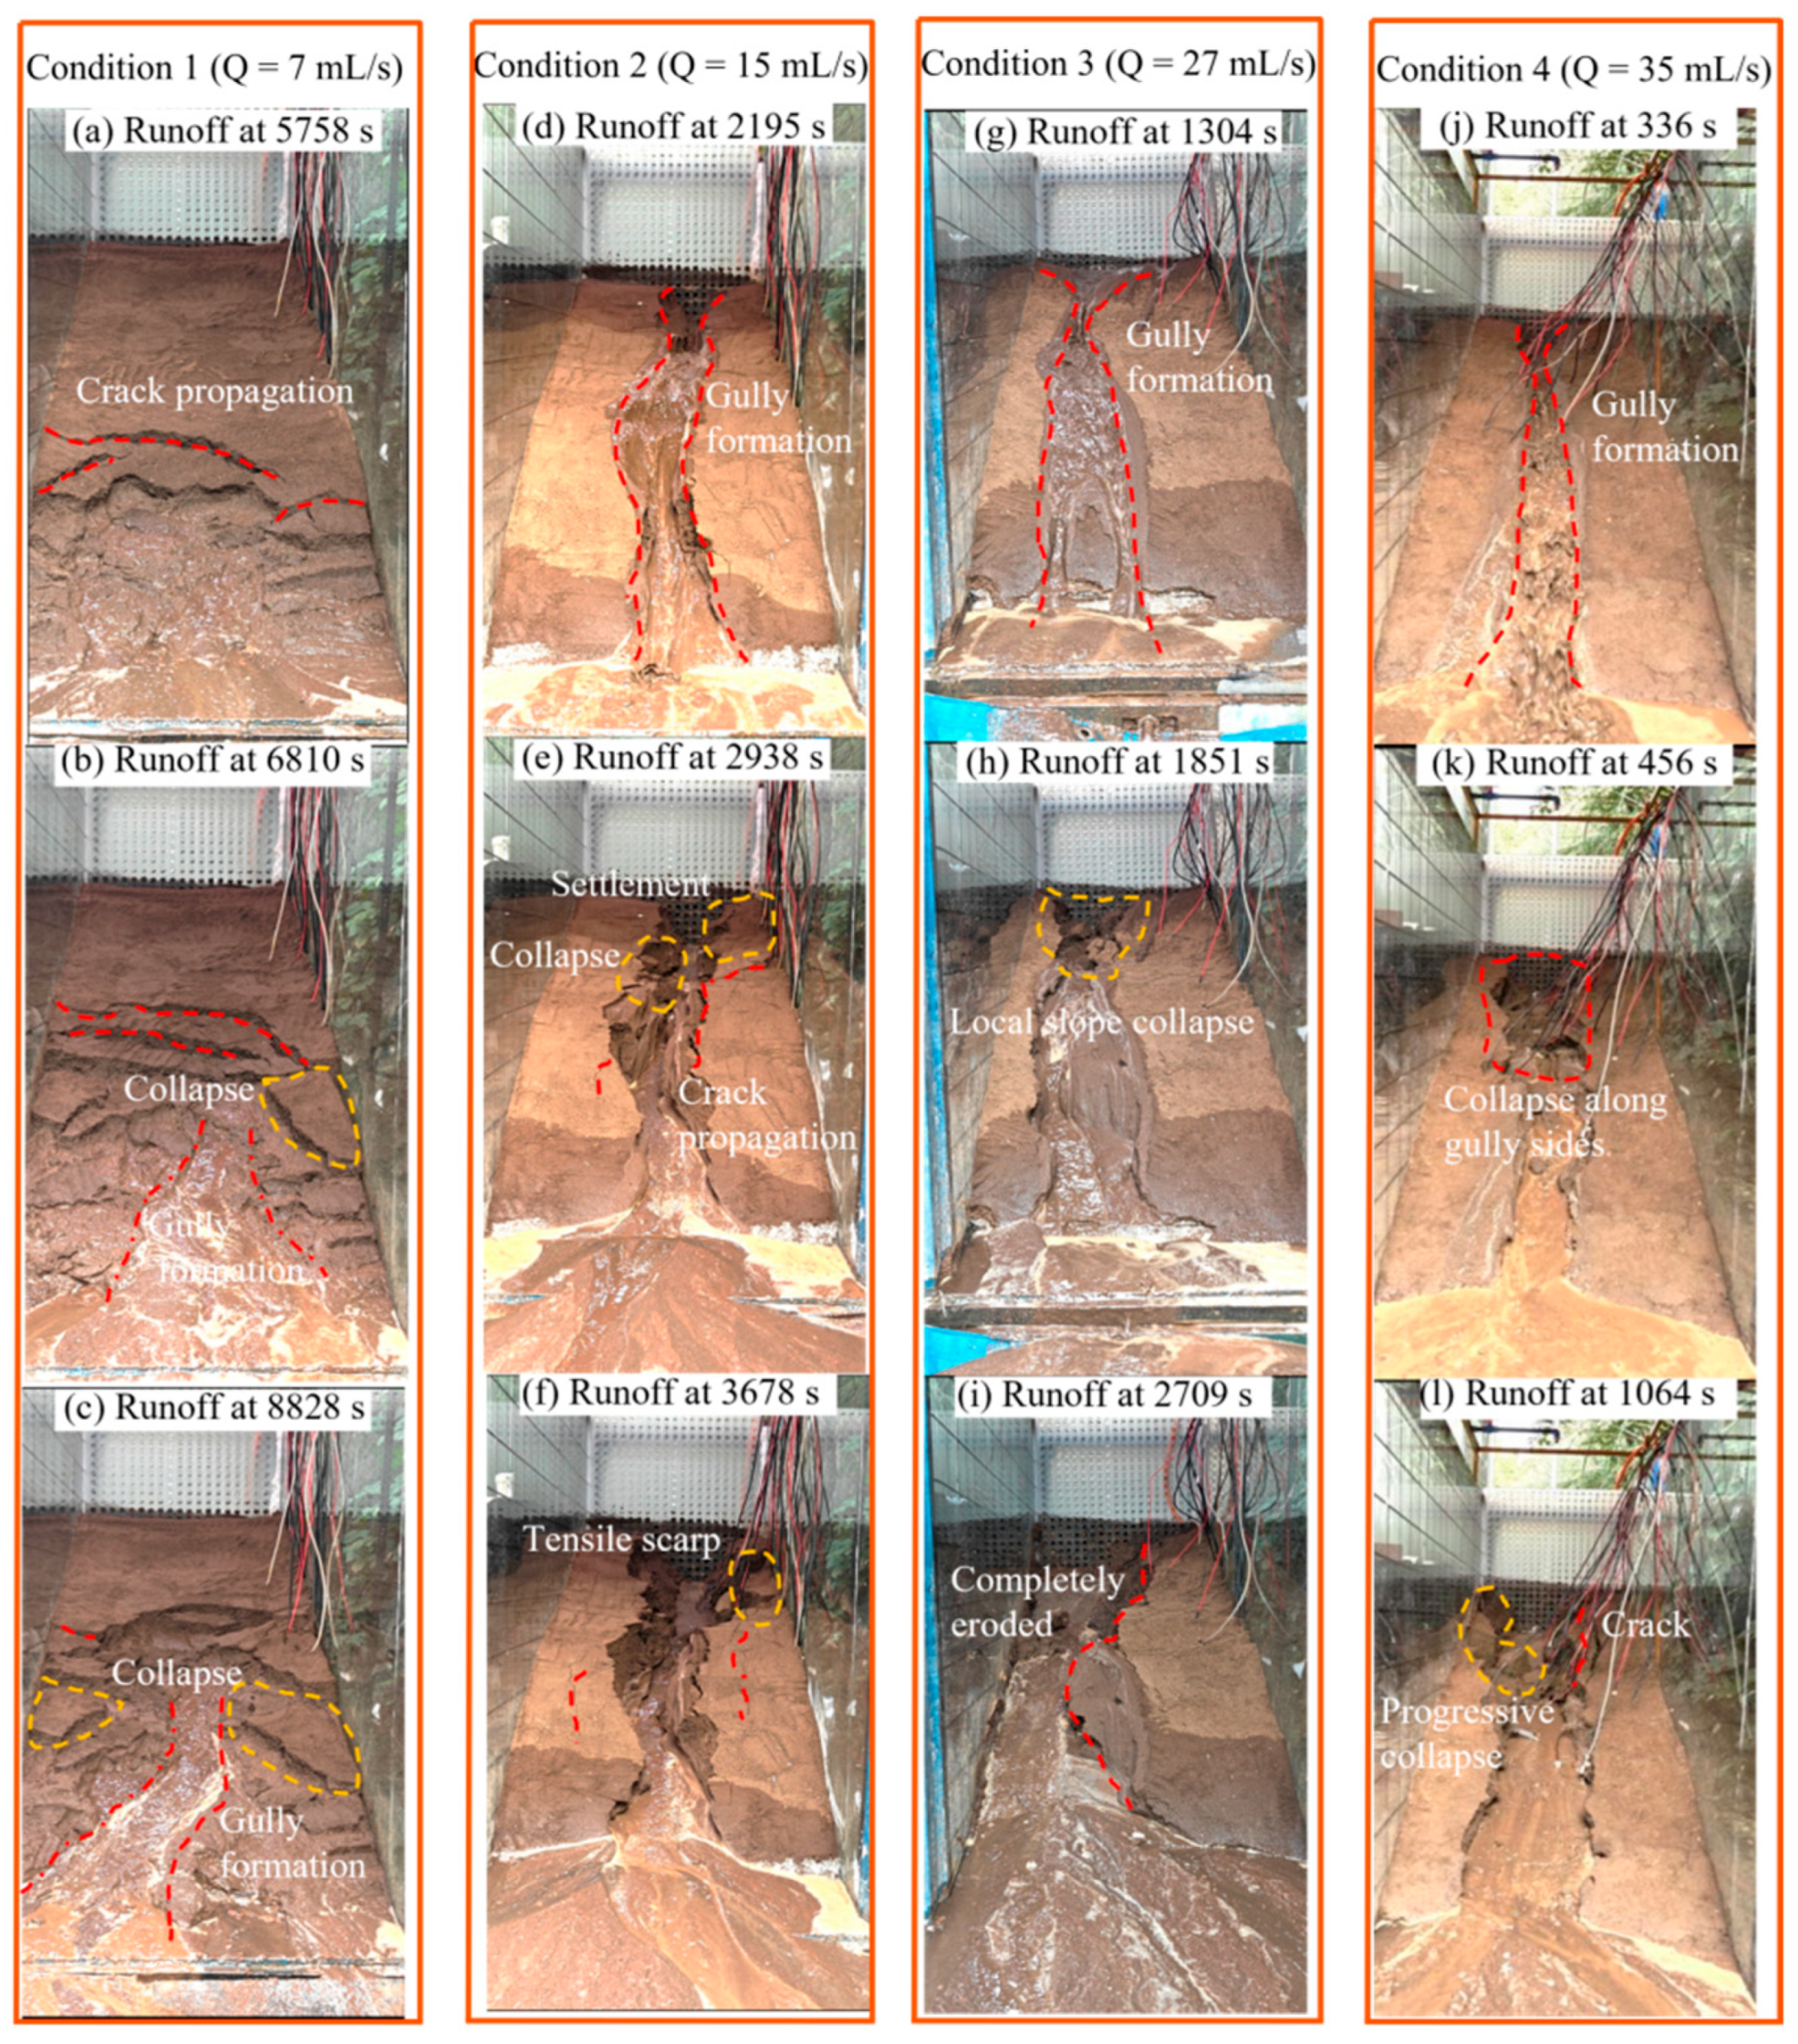
When the runoff discharge was 7 mL/s, slope deformation developed relatively slowly. Under continuous runoff supply, water gradually migrated into the slope, while the slope remained relatively intact as a whole. At approximately 5758 s, creep deformation first occurred at the slope toe. Subsequently, several cracks developed on the slope surface and extended across the transverse section, with lengths of approximately 40 cm, widths of 0.5–2.0 cm and local subsidence of approximately 1–5 cm. As runoff continued to act on the slope, deformation gradually propagated from the slope toe toward the rear edge. A shallow gully formed near the central axis and became the main drainage pathway for surface runoff. Under this condition, slope failure was mainly characterized by infiltration-induced softening, toe creep, and crack propagation, indicating a progressive deformation and failure mode.
At a runoff discharge of 15 mL/s, a distinct gully developed along the central axis of the slope after approximately 2195 s, with an average width of about 10 cm. The flow became concentrated within the gully, continuously incising the gully bed and laterally eroding the gully walls (
Figure 7d). Multiple tensile cracks developed on both sides of the gully, with lengths of approximately 8–60 cm and widths of 0.5–1.5 cm. After partial coalescence of the cracks on the right side, local instability occurred, and the collapsed material temporarily blocked the gully, forming a short-lived damming body. At the same time, settlement occurred at the rear edge, and fine-grained soil was transported by the flow toward the slope toe (
Figure 7e,f). As erosion continued, local collapse occurred on the right side of the slope along pre-existing cracks. The block on the right side of the rear edge subsided by approximately 4 cm as a whole, and a mud–water mixed deposit formed at the slope toe.
When the runoff discharge was 27 mL/s, a continuous gully rapidly formed along the central axis of the slope after approximately 1304 s of continuous runoff, and obvious surface runoff appeared in the middle and lower parts of the slope (
Figure 7g). Subsequently, local collapse at the rear edge temporarily blocked the gully. The obstructed flow was diverted and exerted strong lateral erosion on the left side of the middle and lower slope, with the gully incising downward by approximately 5–7 cm (
Figure 7h). Under continuous scouring, multiple collapses occurred along the left gully wall, and the collapsed materials were transported toward the slope toe by the runoff, leading to progressive disintegration of the slope structure. The right side of the slope remained relatively intact as a whole, although internal cracks were clearly developed (
Figure 7i). Under this condition, slope failure was dominated by gully incision and local collapse, accompanied by certain characteristics of soil–water mixed transport.
At a runoff discharge of 35 mL/s, a distinct gully rapidly formed along the central axis of the slope, and the runoff intensity within the gully increased markedly (
Figure 7j). After gully formation, the flow continuously incised the gully bed and laterally eroded the gully walls. At approximately 456 s, large-scale collapse occurred in the middle–rear part of the slope, and the collapsed material temporarily blocked the gully, forming a short-lived damming body (
Figure 7k). Subsequently, under continuous flow scouring, the blockage body was breached. Continuous collapse occurred on the left side of the slope, while a tensile crack approximately 50 cm long and 1.5 cm wide developed on the right side (
Figure 7l). Compared with the 15 and 27 mL/s conditions, the 35 mL/s condition was characterized by earlier gully formation, stronger downward incision, and more frequent collapse. Under this condition, the slope exhibited rapid disintegration and enhanced soil–water mixed transport under intense scouring.
Comparison of the four test conditions shows that, with increasing runoff discharge, the time required for gully formation shortened from 6810 to 336 s. The dominant failure process gradually shifted from infiltration-induced softening and progressive creep under low-runoff conditions to gully incision, block collapse, and soil–water mixed transport under moderate to high runoff conditions. At a runoff discharge of 7 mL/s, the slope retained relatively good overall integrity, and failure was mainly characterized by local crack propagation and toe creep. Under the 15 and 27 mL/s runoff conditions, axial gullies formed rapidly and continued to incise downward. Repeated gully-wall collapse and blockage–breach processes occurred, causing the sliding mass to gradually transform from a continuous structure into a mixture of blocks and fine-grained materials, thereby exhibiting pronounced soil–water mixed transport and flow-like transport characteristics. At a runoff discharge of 35 mL/s, the feedback process between gully-wall collapse and renewed scouring was most pronounced, representing a key process that accelerated structural disintegration and the development of flow-like transport characteristics.
4.2. Volumetric Water Content Variation Characteristics
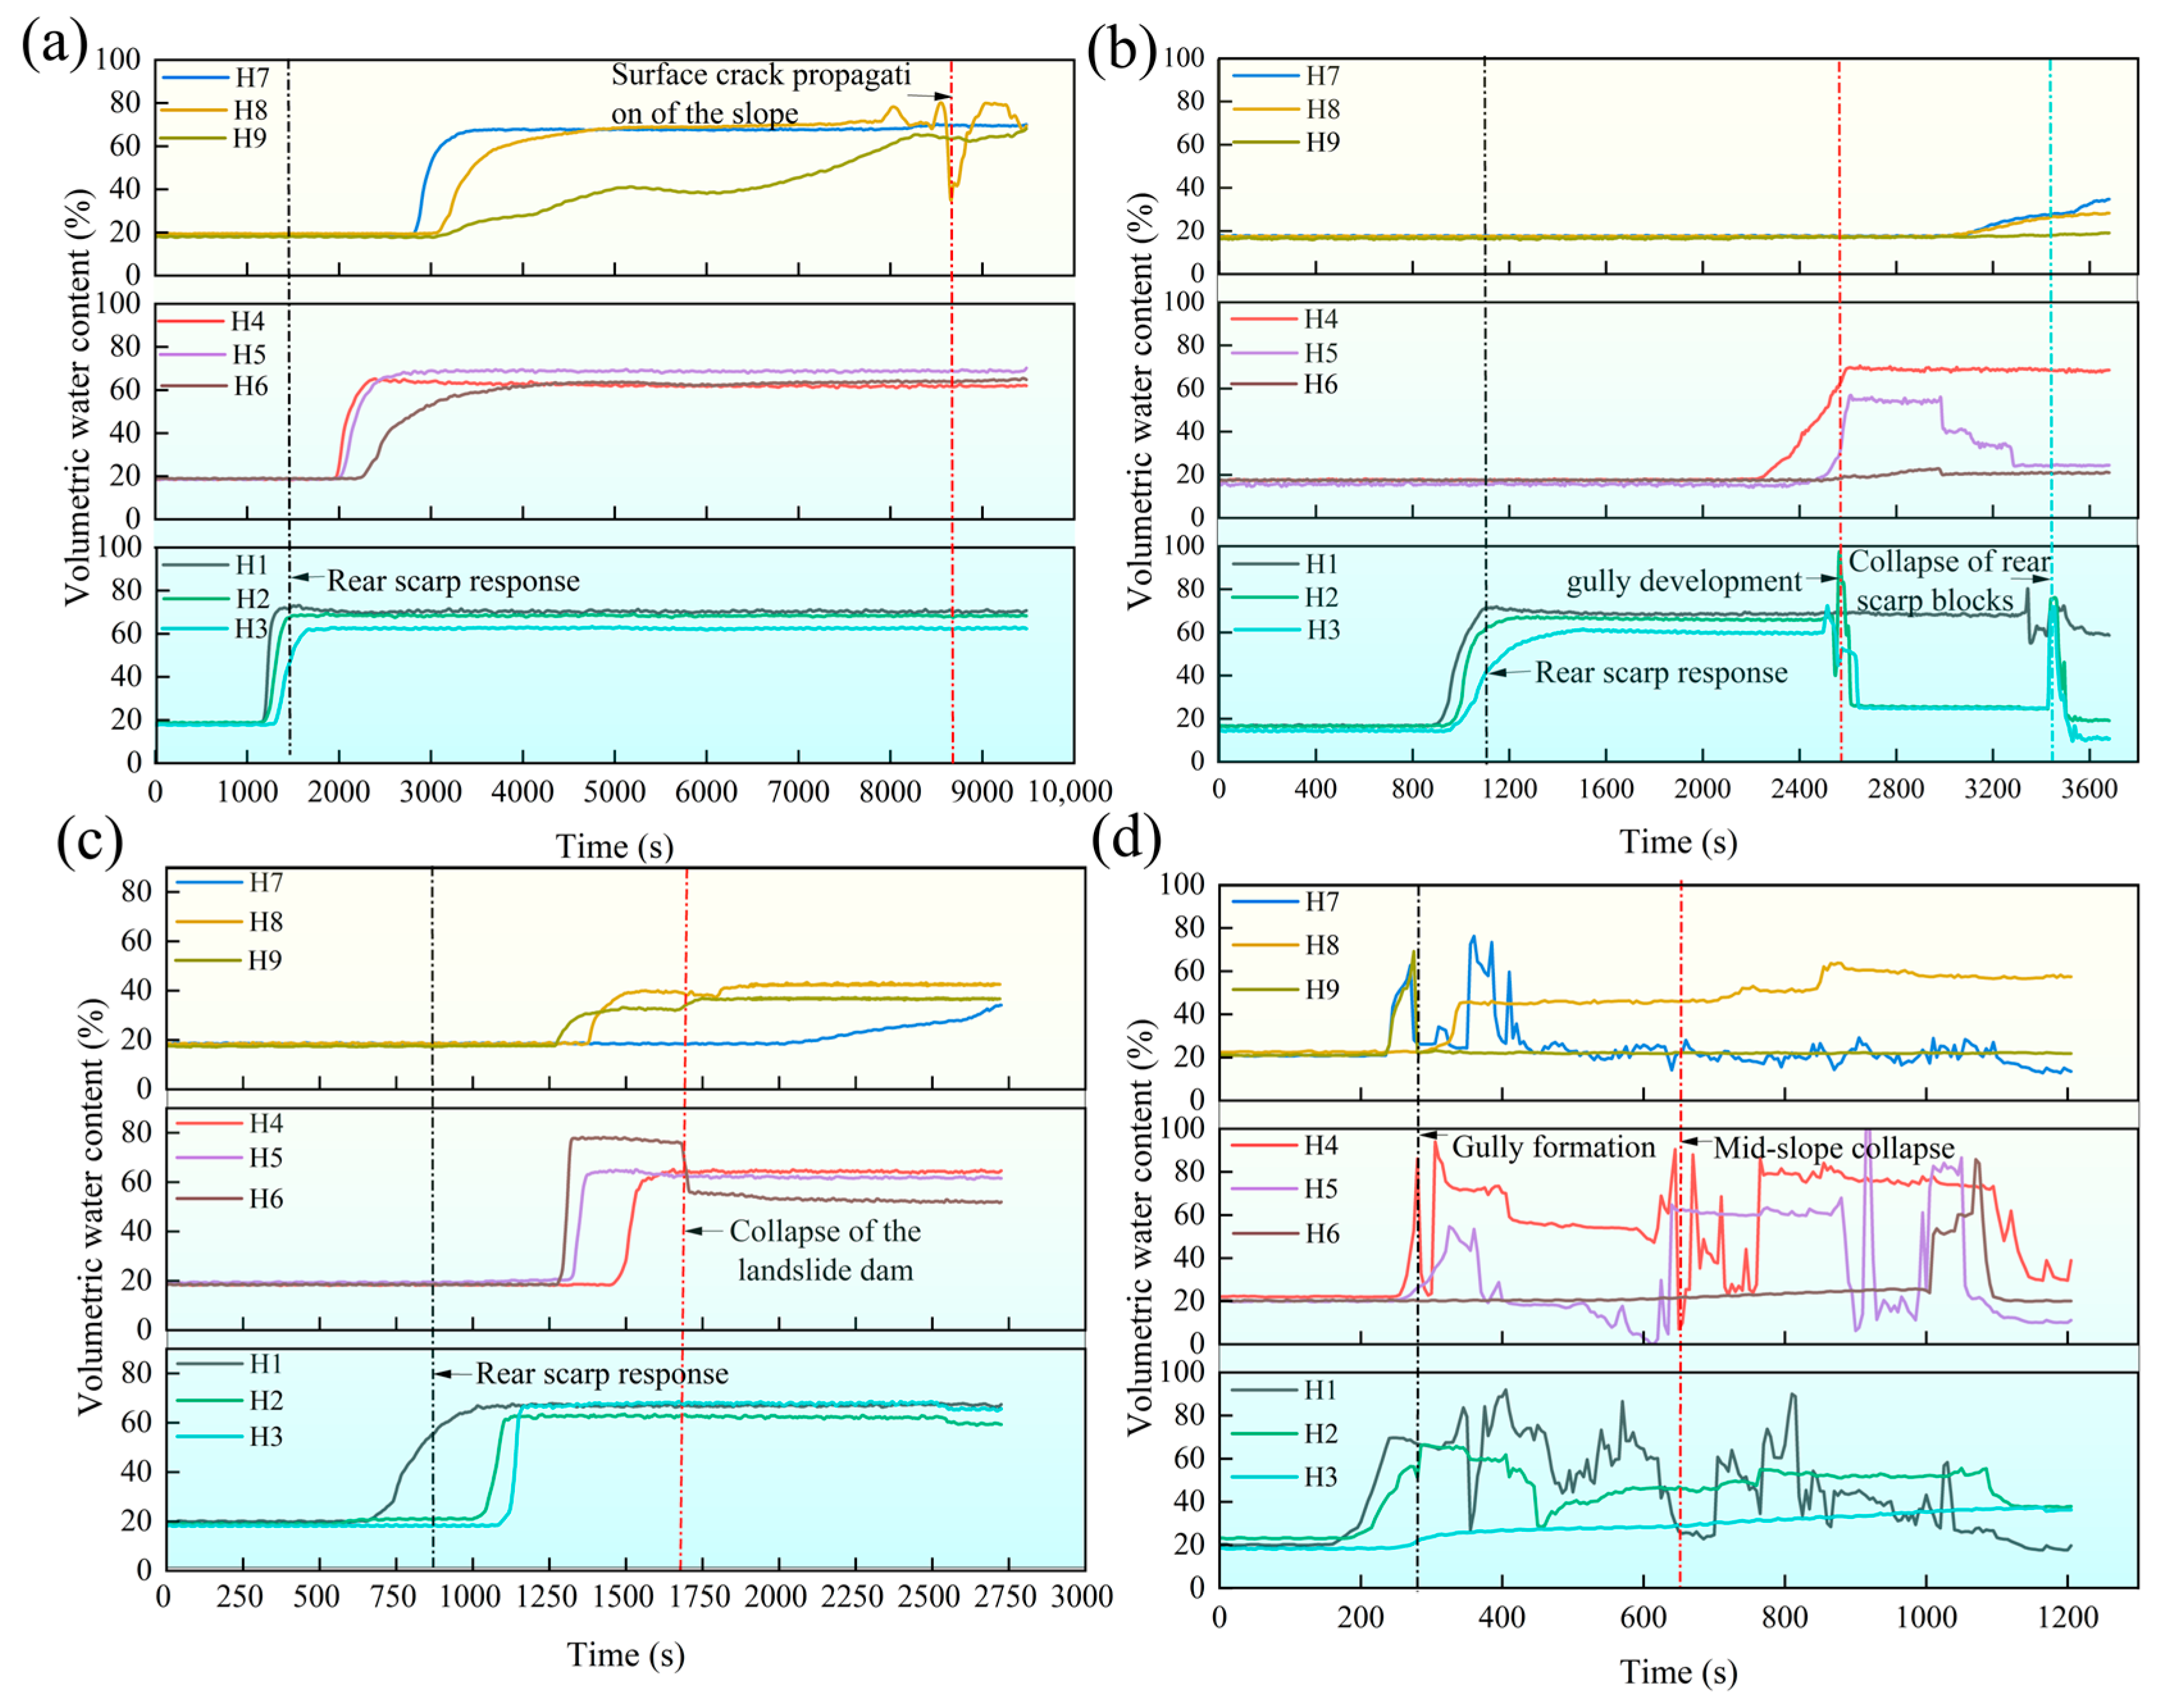
The tests were conducted under continuous rear-runoff supply, and the water-content sensors at the rear edge responded first (
Figure 8). At a runoff discharge of 7 mL/s (
Figure 8a), the water content at the rear-edge sensors H1–H3 rapidly increased to approximately 70% after about 1200 s. The middle and front monitoring points then responded successively, whereas the surface sensor H9 at the front edge increased more slowly. Except for H9, the water content at most monitoring points gradually stabilized at around 70%, indicating that water had continuously migrated into the slope and formed relatively stable seepage pathways. At approximately 8600 s, H8 showed pronounced fluctuations around 70%, briefly decreasing to about 40% before increasing to 80%, while H9 slowly rose to approximately 70%. These changes may be related to adjustments in seepage pathways caused by crack development and local settlement.
At a runoff discharge of 15 mL/s (
Figure 8b), the rear-edge sensors H1–H3 responded first after approximately 900 s of continuous runoff. At approximately 2600 s, the volumetric water content at the rear edge exhibited a fluctuating pattern of increase–decrease–re-increase–re-decrease, with an amplitude of approximately 53%. During the same period, the volumetric water content at the middle sensors H4 and H5 increased markedly, which may be related to gully expansion, local collapse, and temporary blockage–breach processes. After 3000 s, H5 showed a stepwise decrease, with an average reduction of approximately 24%, indicating that the seepage pathway in the middle part of the slope may have been affected by crack development and local deformation. During this period, H2 and H3 increased from approximately 24% to 74% and then decreased to about 20%, indicating that moisture migration at the rear edge was strongly disturbed by local collapse, scouring, and adjustment of drainage pathways.
At a runoff discharge of 27 mL/s (
Figure 8c), the deep rear-edge sensor H1 responded first after approximately 700 s of continuous runoff. Unlike the 7 and 15 mL/s conditions, H1 and H2 did not increase simultaneously; instead, they rose successively to approximately 70% with a time lag of about 250 s, indicating a certain degree of non-uniform moisture migration at the rear edge. After approximately 1300 s of continuous runoff, the middle and front monitoring points began to respond, with the surface sensors increasing earlier than the middle-depth and deep sensors. At this stage, a gully formed along the central axis of the slope (
Figure 7g). At approximately 1700 s, the volumetric water content at H6 decreased from 76% to 56%, representing a reduction of about 26%. This decrease was recorded shortly after gully formation and coincided with local deformation in the middle part of the slope. It may reflect enhanced local drainage and adjustment of seepage pathways caused by nearby collapse.
At a runoff discharge of 35 mL/s (
Figure 8d), the deep monitoring points at the rear edge responded first after approximately 170 s. Subsequently, the volumetric water content at the middle and front parts of the slope rapidly increased to approximately 70% within a short period and then quickly decreased to about 20%. This variation coincided with rapid gully formation and may reflect local adjustment of drainage pathways. Under high-runoff conditions, frequent gully incision, crack development, and local collapse caused pronounced fluctuations in the volumetric water content curves. At approximately 650 s, the volumetric water content at the middle monitoring points increased from about 70% to 90%, then decreased sharply to 7%, and subsequently rebounded to approximately 88%. This fluctuation may be related to local collapse, temporary blockage–breach processes, and disturbance of the material around the monitoring points.
Comparison of the four test conditions shows that, under low-runoff conditions (7 mL/s), the variation in volumetric water content was relatively gradual. The rear-edge and middle monitoring points increased progressively, and the slope was mainly characterized by infiltration-induced softening, creep deformation, and crack propagation. As the runoff discharge increased to 15 and 27 mL/s, surface runoff and gully erosion became stronger, and the response times of the surface monitoring points in the middle and front parts of the slope advanced. The volumetric water content curves exhibited abrupt increases, sharp decreases, and repeated fluctuations, suggesting that gully incision, local collapse, and adjustment of seepage pathways significantly affected the moisture distribution within the slope. Under high-runoff conditions (35 mL/s), the fluctuations in volumetric water content became more pronounced and corresponded to gully-wall collapse, temporary blockage–breach processes, and the outward transport of fine-grained materials. The slope gradually exhibited soil–water mixed transport and flow-like transport characteristics.
4.3. Variation Characteristics of Pore Water Pressure
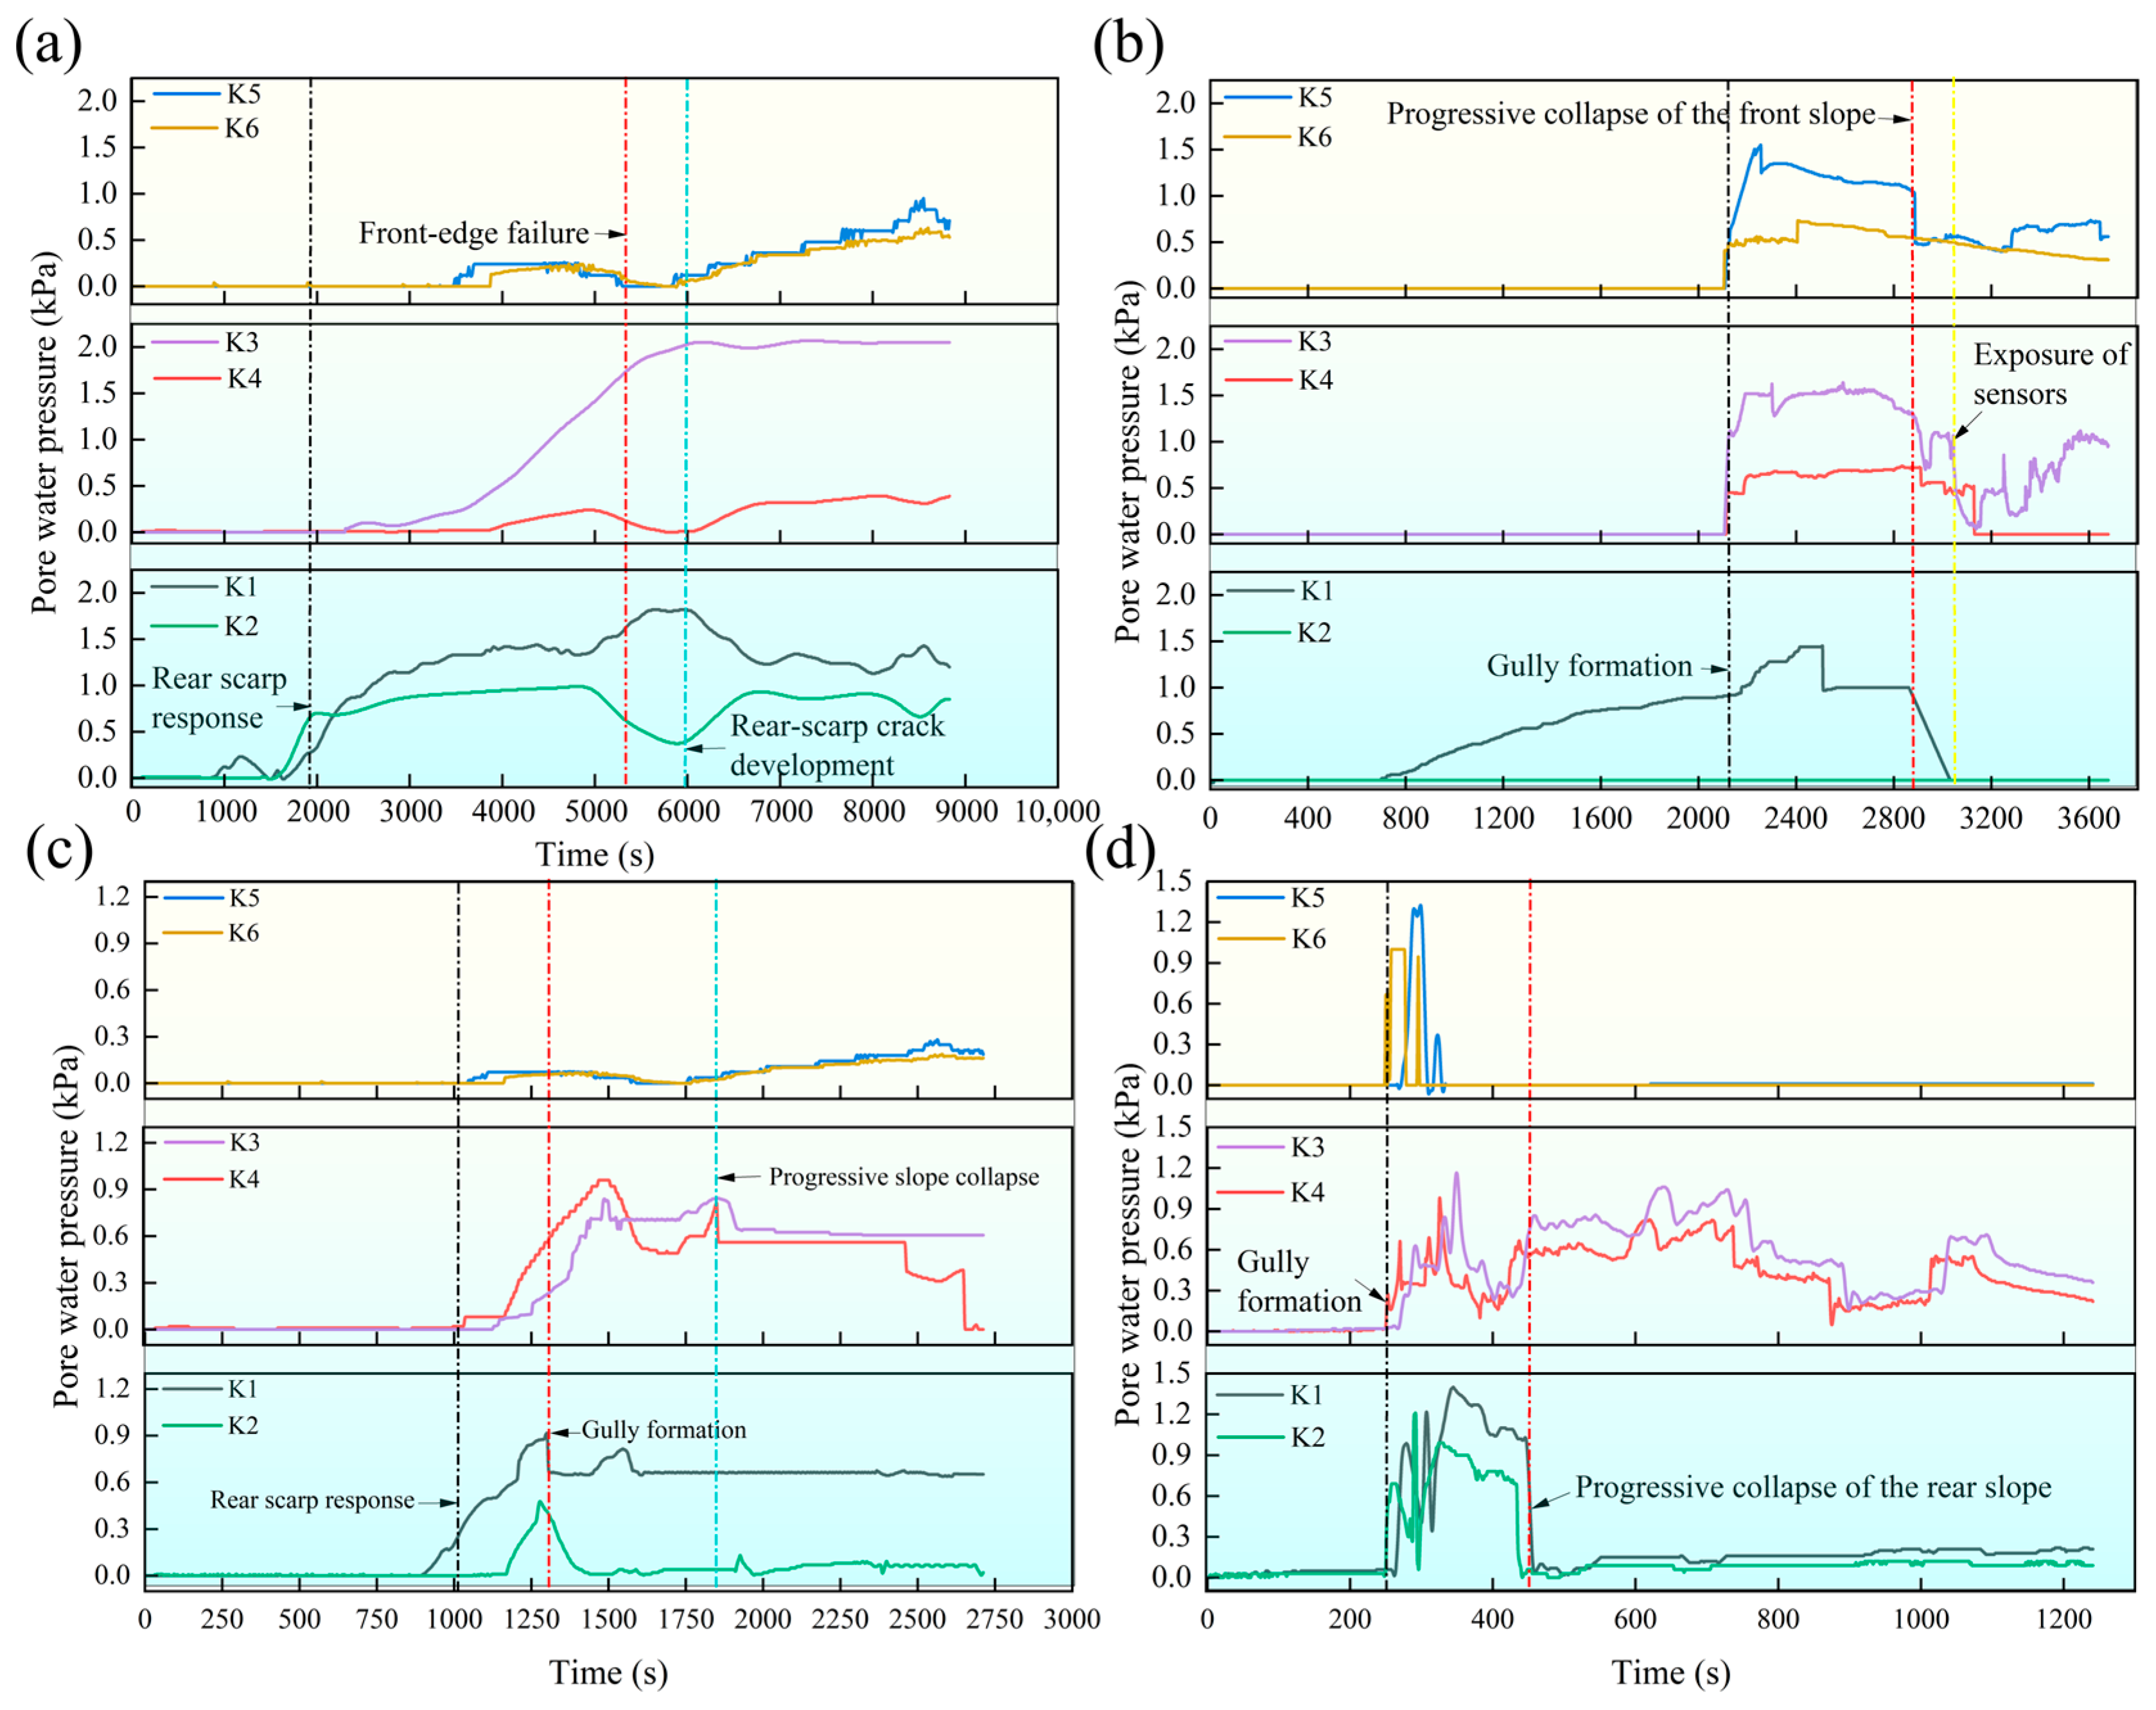
At a runoff discharge of 7 mL/s (
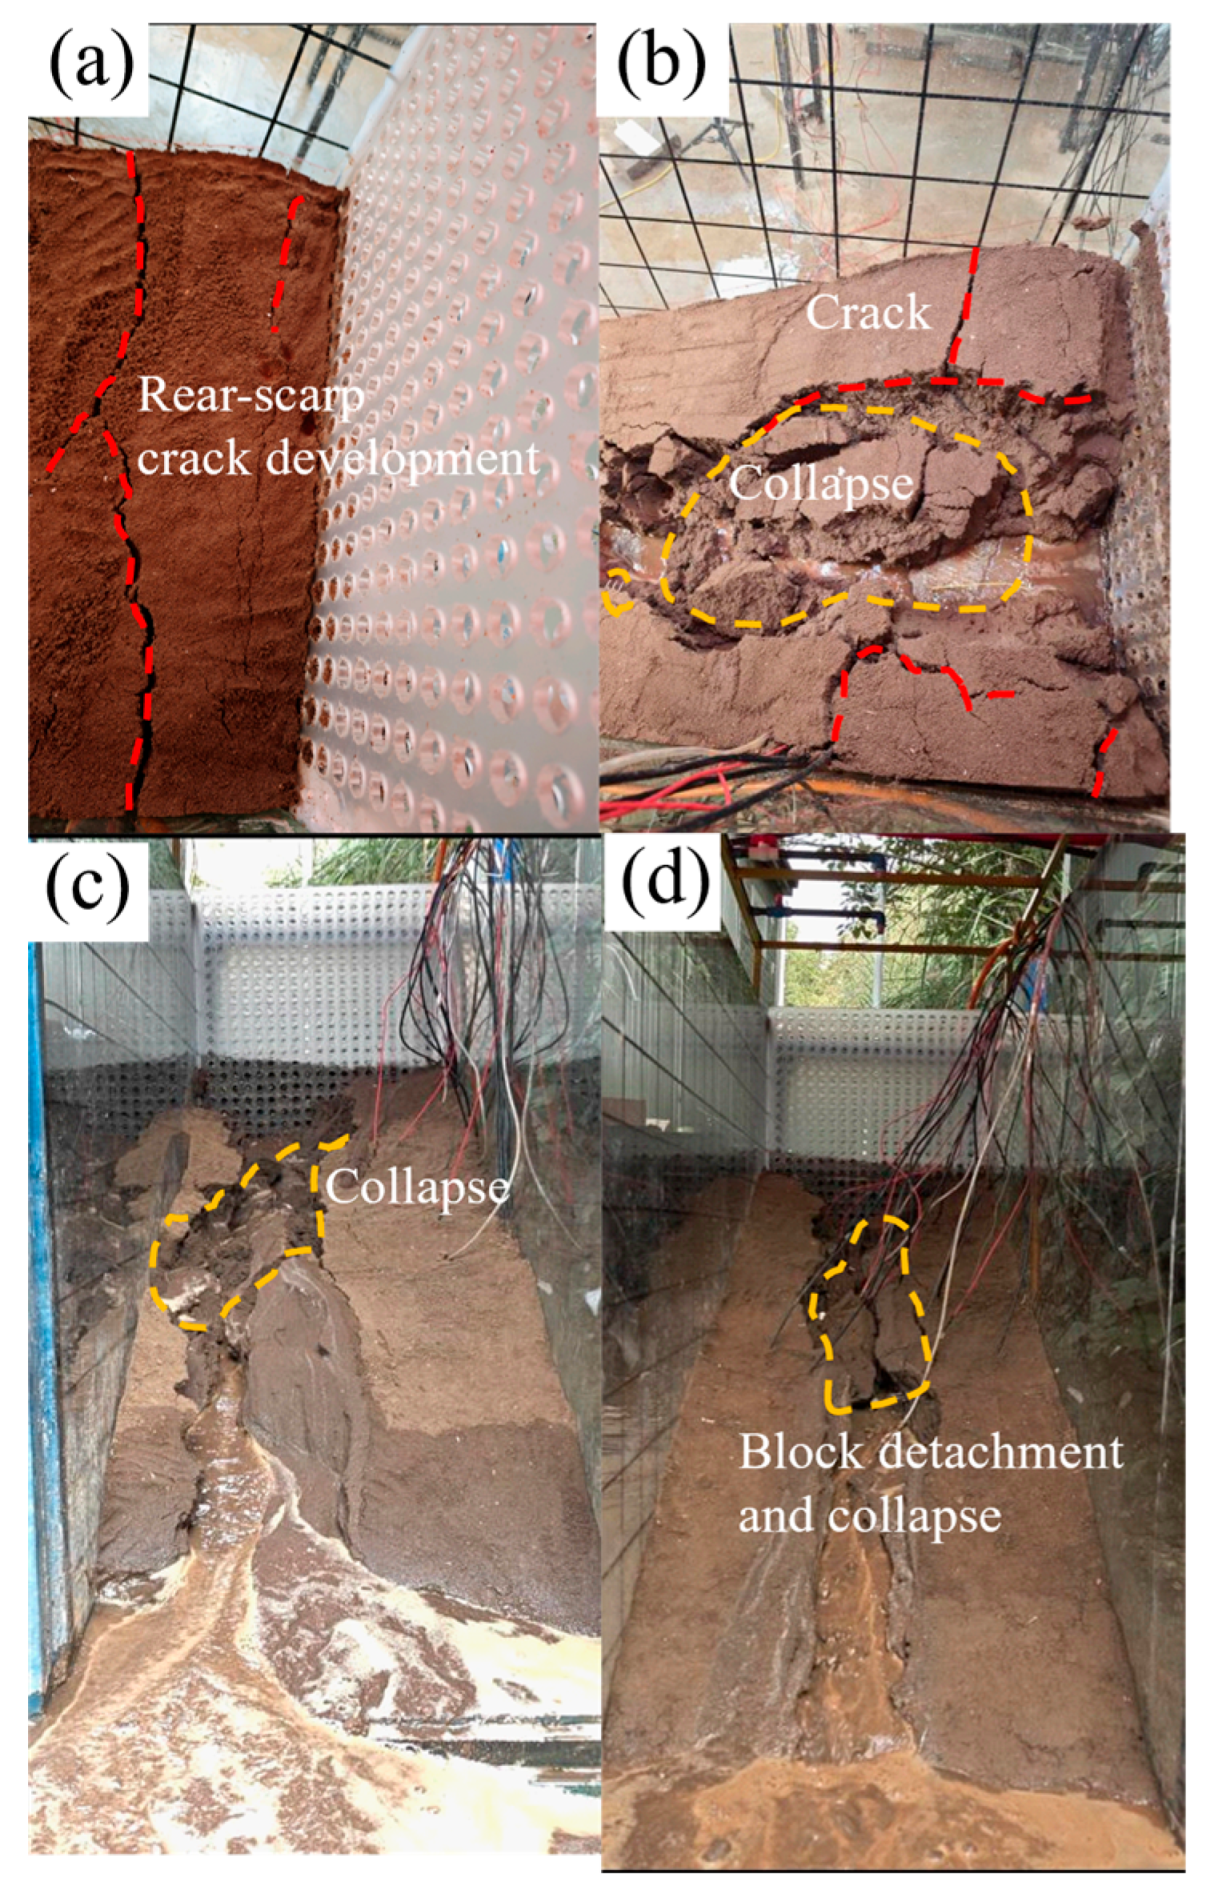
Figure 9a), the pore water pressure response was generally consistent with the variation in water content, with pressure increasing first at the rear edge and delayed responses occurring in the middle and front parts of the slope. At approximately 1500 s, K1 and K2 began to respond. K1 increased to 1.82 kPa and then decreased, whereas K2 decreased from 0.91 to 0.37 kPa, corresponding to a reduction of about 40%. This variation may be related to enhanced local drainage and pore-pressure redistribution caused by crack development at the rear edge (
Figure 10a). At approximately 5200 s, creep deformation occurred at the front edge, and K5 and K6 gradually increased after a short-term decrease. K3 reached 2.05 kPa at approximately 6000 s and then tended to stabilize, indicating gradual accumulation of pore water pressure in the middle part of the slope under continuous infiltration.
At a runoff discharge of 15 mL/s (
Figure 9b), the rear-edge sensor K1 began to respond after approximately 800 s. By approximately 2200 s, as the central gully formed and developed, pore water pressure at all monitoring points increased rapidly, with the deep sensors recording values about 1 kPa higher than those of the shallow sensors. At approximately 2860 s, continuous collapse occurred at the front edge, and K5 decreased markedly, with a reduction of approximately 58%. At approximately 3000 s, K1 and K4 approached zero, while K3 showed pronounced fluctuations. These changes may be related to failure of the middle–rear part of the slope, disturbance of the soil around the monitoring points, or local exposure of the sensors (
Figure 10b). No data were recorded for K2 because of sensor damage, and the sensor was replaced in the subsequent tests.
At a runoff discharge of 27 mL/s (
Figure 9c), after the rear edge responded, K1 gradually increased to 0.92 kPa, while K2 increased to 0.48 kPa. At approximately 1300 s, gully formation began, and the rear part of the slope was disturbed, causing K1 and K2 to decrease by approximately 29.3%. Subsequently, the monitoring points in the middle and front parts of the slope began to respond, with the shallow sensors showing changes earlier than the deep sensors. As gully erosion and local collapse developed (
Figure 10c), the shallow sensor K4 gradually decreased and eventually approached zero.
At a runoff discharge of 35 mL/s (
Figure 9d), the monitoring points at the rear, middle, and front parts of the slope all responded rapidly after approximately 240 s. Gully formation and local collapse caused pronounced fluctuations in the pore water pressure curves, and some monitoring points decreased rapidly to values close to zero (
Figure 10d). Some monitoring points decreased rapidly to values close to zero. This was a measured pore-pressure response. Based on the synchronized deformation images, this response may be related to gully incision, soil erosion, local disturbance around the monitoring points, or possible sensor exposure. Therefore, it should not be interpreted simply as continuous dissipation of pore water pressure within the intact slope. Overall, under high-runoff conditions, the pore water pressure response occurred much earlier. The early increase in pore water pressure promoted slope softening, whereas the later abrupt changes reflected disturbances to local hydraulic boundaries caused by gully incision and structural disintegration.
Comparison of the four test conditions shows that, under low-runoff conditions (7 mL/s), the variation in pore water pressure was relatively gradual. Pressure increase first occurred at the rear edge, whereas the middle and front parts of the slope showed delayed responses. Slope failure was mainly governed by infiltration recharge and pore-pressure accumulation. As the runoff discharge increased to 15 and 27 mL/s, the pore-pressure response time was markedly shortened. After gully formation, the pore water pressure curves showed abrupt increases, decreases, and fluctuations, suggesting possible adjustments in internal seepage pathways and local drainage conditions within the slope. Under high-runoff conditions (35 mL/s), pore-pressure fluctuations became more pronounced, and some monitoring points approached zero. This may be related to gully incision, local collapse, and disturbance of the material around the sensors, suggesting possible disturbance of local hydraulic boundaries of gully incision and structural disintegration on the hydraulic boundaries of the slope.
4.4. Variation Characteristics of Earth Pressure
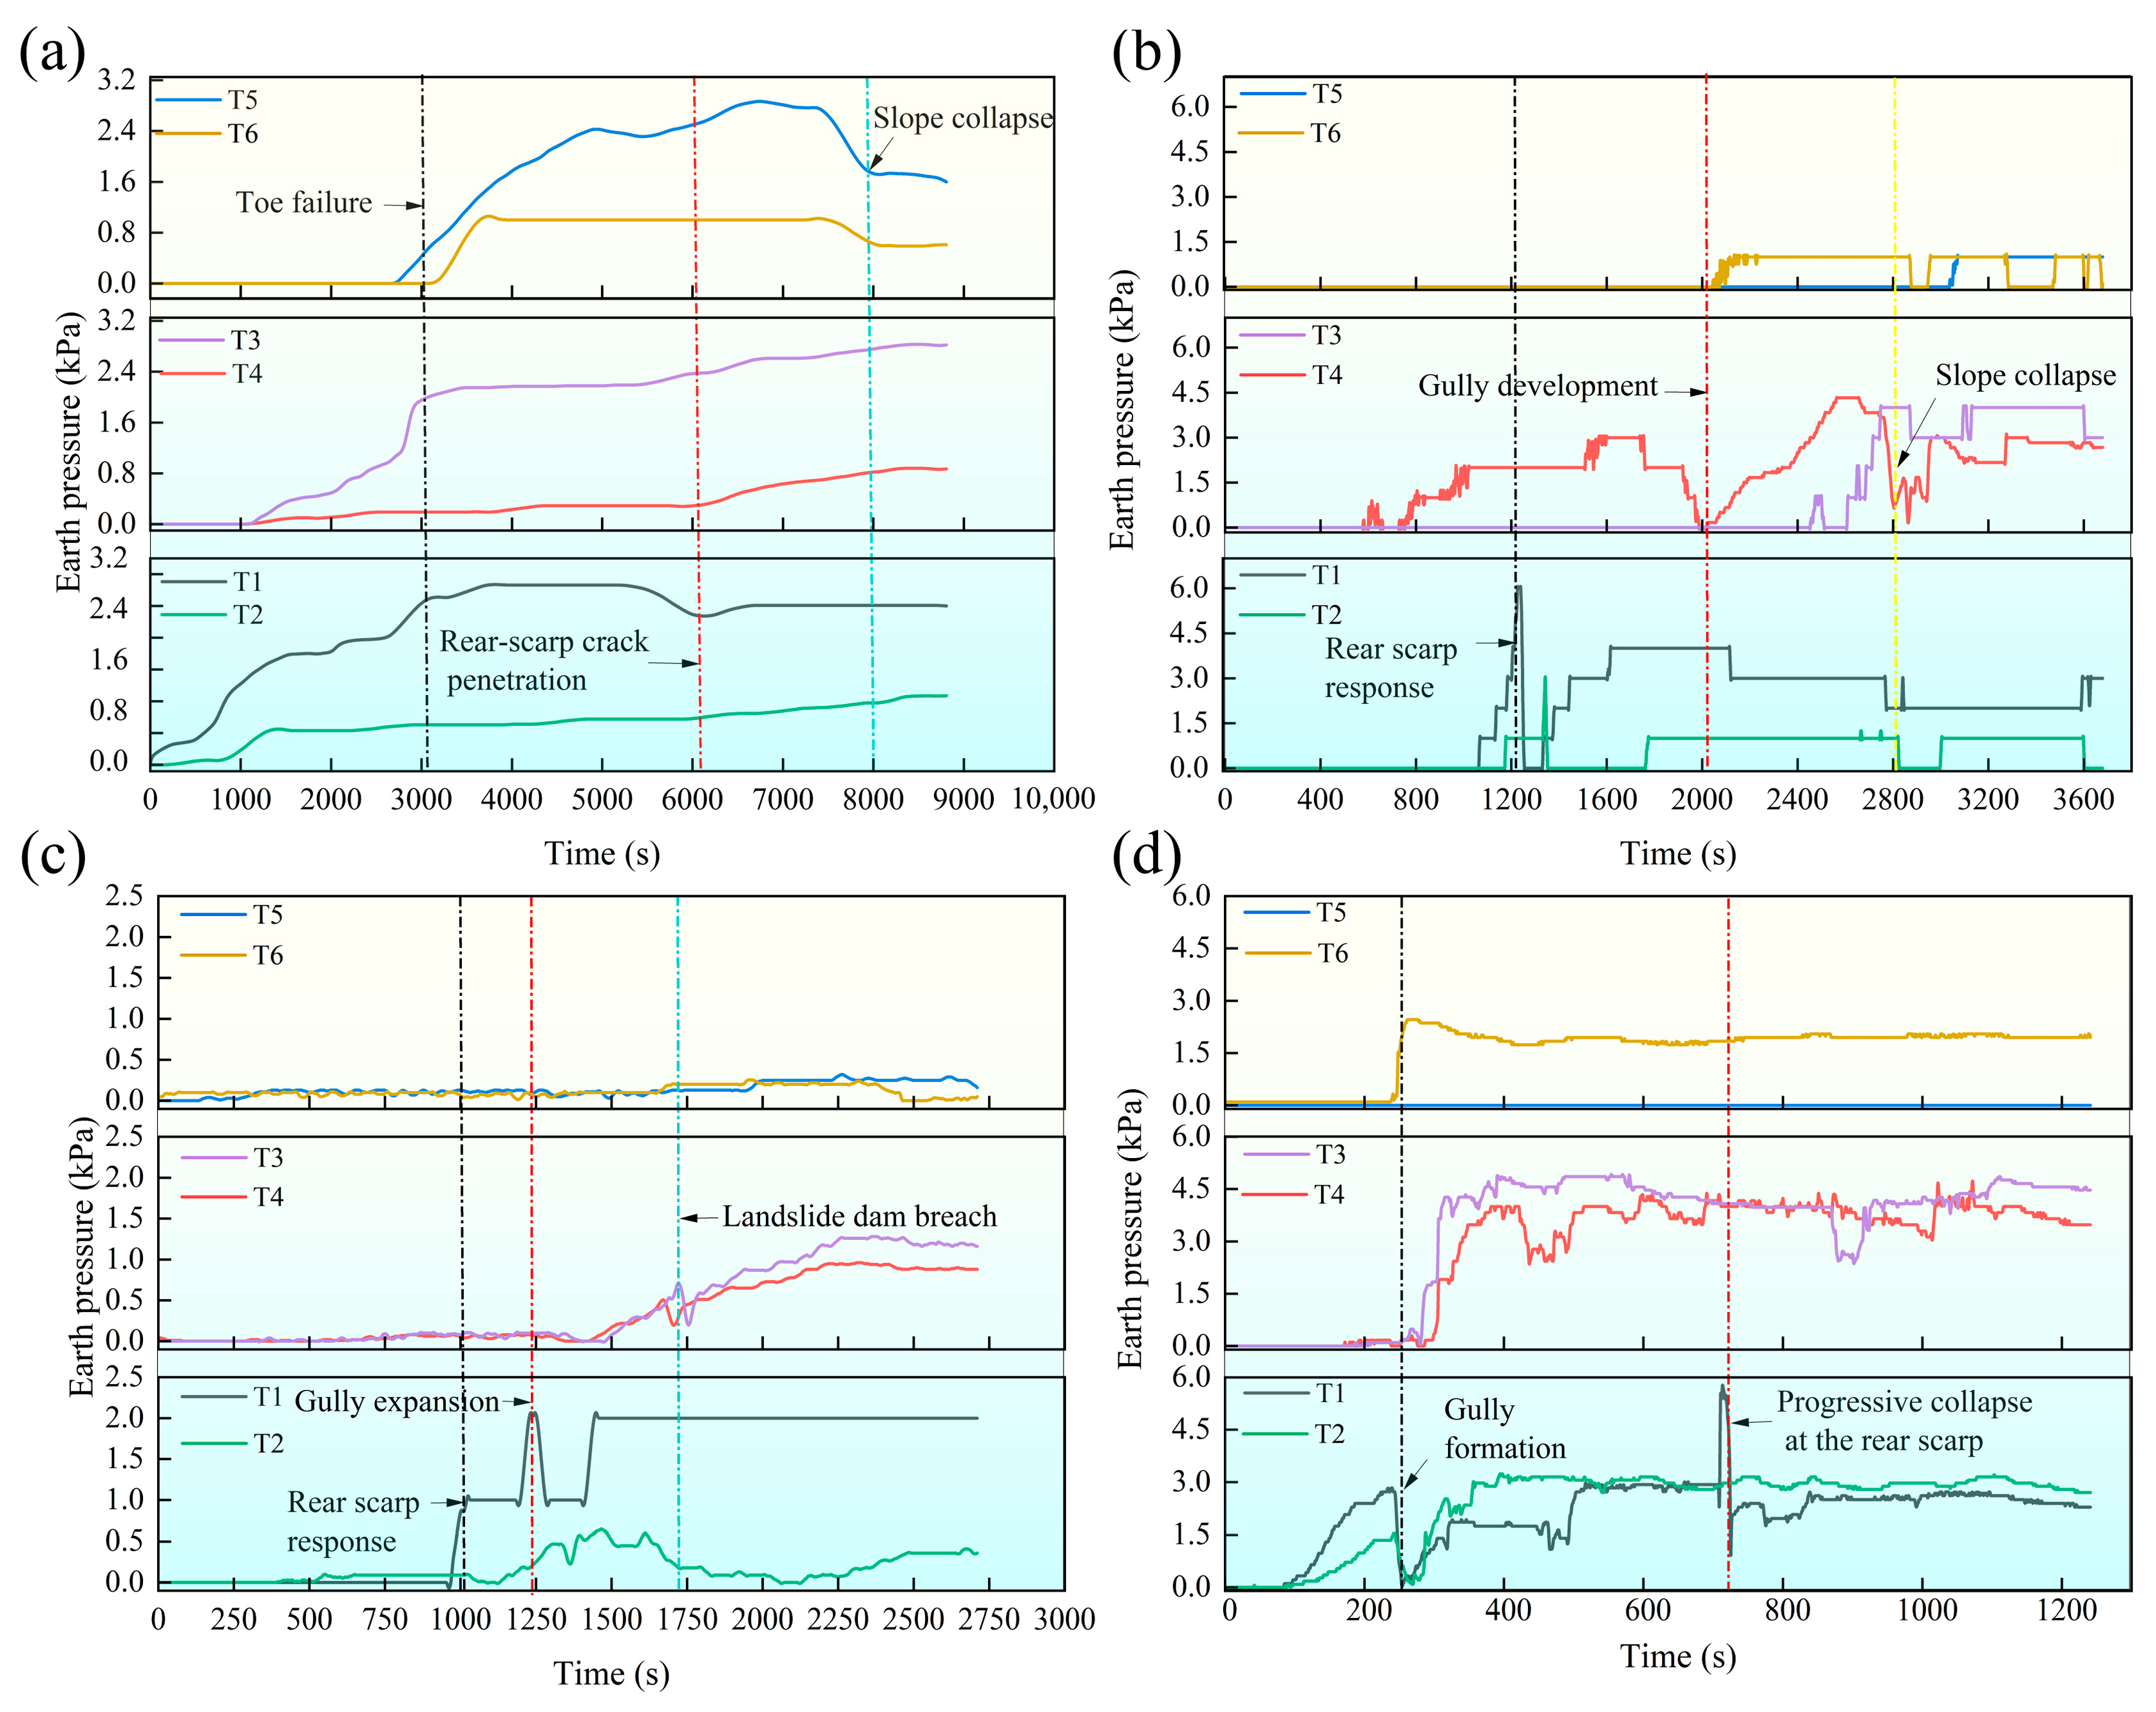
At a runoff discharge of 7 mL/s (
Figure 11a), the earth pressure at the rear edge responded first, with T1 reaching a peak value of 2.84 kPa, indicating that stress adjustment first occurred in the rear part of the slope. At approximately 3000 s, the earth pressure in the middle part increased from 2.15 to 2.83 kPa, while the front edge responded simultaneously, corresponding to the initial creep deformation at the slope toe. After approximately 6000 s, cracks developed at the rear edge. T1 decreased markedly, whereas T2 changed only slightly, suggesting that crack propagation affected monitoring points at different depths to different extents. At approximately 8000 s, failure at the front edge intensified, and the earth pressure decreased. Overall, the earth pressure at the deep monitoring points was approximately 1.65–1.77 times that at the shallow points, indicating that slope deformation under low-runoff conditions was dominated by infiltration-induced softening and progressive deformation.
At a runoff discharge of 15 mL/s (
Figure 11b), the earth pressure at the rear edge responded first after approximately 1000 s. The deep sensor T1 increased to 5.86 kPa, then rapidly decreased to a value close to zero, and subsequently recovered to approximately 4.0 kPa, indicating that the soil around the monitoring point may have undergone local unloading and reloading. At approximately 2000 s, a gully formed in the middle part of the slope. The earth pressure in this region decreased from 2.86 kPa to nearly zero and then recovered to approximately 4.34 kPa, while the shallow sensor T3 increased simultaneously. During this stage, the earth pressure fluctuated markedly, which may be related to gully incision, local collapse, and renewed scouring after the temporary blockage caused by collapsed materials.
At a runoff discharge of 27 mL/s (
Figure 11c), the earth pressure at the rear edge began to respond after approximately 960 s. T1 increased to 1.08 kPa and then tended to stabilize, indicating a gradual adjustment of the stress state at the rear edge. At approximately 1250 s, a gully developed in the middle part of the slope. T1 increased to 2.06 kPa, decreased to 1.04 kPa, and then rose again to approximately 2.0 kPa, reflecting local stress redistribution induced by gully formation. Subsequently, T3 and T4 in the middle part gradually increased. At approximately 1700 s, collapse occurred in the middle part of the slope; the collapsed material temporarily blocked the gully and was then eroded by subsequent flow, causing the earth pressure to fluctuate and increase overall.
At a runoff discharge of 35 mL/s (
Figure 11d), the earth pressure response occurred markedly earlier. At approximately 110 s, T1 and T2 at the rear edge increased to 2.72 and 1.44 kPa, respectively, indicating that the stress state of the rear soil began to adjust. At approximately 260 s, a central gully developed. Affected by gully incision and local unloading, T1 and T2 rapidly decreased to values close to zero and then increased again. Subsequently, T3 and T4 in the middle part increased to 4.00 and 4.95 kPa, respectively, while T6 at the front edge increased to 2.46 kPa, indicating stress redistribution in the middle and front parts of the slope. At approximately 720 s, T1 decreased from 5.76 to 0.22 kPa and then increased again. This change may be related to local collapse, burial by collapsed materials, or disturbance of the material around the monitoring point.
Comparison of the four test conditions shows that, as the runoff discharge increased, the earth pressure response occurred markedly earlier and the fluctuation amplitude gradually intensified. Under low-runoff conditions (7 mL/s), earth pressure varied relatively gradually, and slope failure was mainly governed by infiltration-induced softening and progressive creep. Under moderate-runoff conditions (15 and 27 mL/s), gully development became evident, and earth pressure exhibited fluctuating patterns of increase, decrease, and subsequent increase, reflecting stress adjustment induced by gully incision and local collapse. Under high-runoff conditions (35 mL/s), gullies developed rapidly and were accompanied by frequent collapses, resulting in more pronounced earth pressure fluctuations. Overall, increasing runoff promoted the transition of the slope from overall progressive deformation to local disintegration and flow-like transport.
4.5. Comparative Summary of Experimental Responses Under Different Runoff Discharges
The flume tests simulated the deformation and failure process of the slope under different rear-inflow conditions, and the hydro-mechanical responses of the slope were recorded using volumetric water content, pore water pressure, and earth pressure sensors. To compare the response differences among the different test conditions, the gully formation time, the time of the first evident collapse, and the initial response time of each monitoring point were extracted. The extracted response times are summarized in
Table 3.
As shown in
Table 3, the slope response time was markedly shortened with increasing rear-runoff discharge, and the time lag among the rear, middle, and front parts of the slope gradually decreased. Specifically, the initial response time of volumetric water content at the rear edge decreased from 1205 s in Condition 1 to 160 s in Condition 4. The corresponding response times of pore water pressure and earth pressure decreased from 1488 to 248 s and from 888 to 112 s, respectively. Meanwhile, the gully formation time shortened from 6810 to 336 s, and the time of the first evident collapse decreased from 5758 to 650 s. These results suggest that enhanced runoff systematically accelerated both the hydraulic response and the macroscopic failure process of the slope.
Under low-runoff conditions (7 mL/s), the monitored parameters generally responded sequentially from the rear edge to the middle and front parts of the slope (
Figure 8a,
Figure 9a and
Figure 11a). Macroscopically, the slope exhibited toe creep, crack propagation and local gully development (
Figure 7a–c), indicating that failure was mainly controlled by infiltration-induced softening. Under moderate-runoff conditions (15 and 27 mL/s), the responses in the middle and front parts occurred much earlier, and the monitoring curves showed stronger fluctuations (
Figure 8b,c,
Figure 9b,c and
Figure 11b,c). These variations corresponded to gully incision, local collapse and renewed scouring after temporary blockage by collapsed materials [
53,
54,
55] (
Figure 7e,f,h). Under high-runoff conditions (35 mL/s), the different parts of the slope responded almost simultaneously (
Figure 8d,
Figure 9d and
Figure 11d). A gully formed at 336 s, and evident collapse occurred at 650 s, corresponding to the rapid gully erosion and local disintegration shown in
Figure 7k,l. Overall, enhanced rear-runoff promoted the transition of the slope from infiltration-controlled progressive deformation to rapid disintegration governed by gully incision and hydrodynamic disturbance.
5. Discussion
5.1. Mechanism of Flow-like Landslide Failure Under Concentrated Rear-Runoff Conditions
Compared with previous physical model tests and numerical simulations that mainly focused on areal rainfall infiltration, wetting-front migration, local softening, crack propagation, and progressive sliding [
23,
24,
25], this study emphasizes a different hydraulic boundary condition, namely concentrated rear runoff. Previous studies have shown that rainfall infiltration and surface runoff exert different controls on slope instability and erosional failure, and that different hydraulic boundary conditions may lead to distinct failure modes [
32,
33,
34]. Under concentrated rear-runoff conditions, water recharge is not uniformly distributed over the slope surface but instead acts intensively on the rear edge of the slope and further develops into local infiltration, gully incision, gully-wall collapse, and soil–water mixed transport. Therefore, the results of this study extend the understanding of rainfall-induced landslide deformation from infiltration-dominated failure to a compound process jointly controlled by infiltration-induced softening, runoff erosion, local boundary reconstruction, and structural disintegration.
Previous field investigations of rainfall-induced landslides and landslide–debris flow hazard chains have shown that runoff convergence, channel erosion, material entrainment, and the remobilization of loose deposits can significantly affect the mobility, runout distance, and hazard amplification process of failed sliding masses [
40,
42,
43]. However, in field observations, it is usually difficult to control the hydraulic loading conditions and to continuously monitor the internal water content, pore water pressure, and stress adjustment of the slope during failure. Through controlled flume tests, this study provides process-based evidence showing that, with increasing rear-runoff discharge, the response times of volumetric water content, pore water pressure, and earth pressure became earlier, gully formation and local collapse accelerated, and the slope transformed from progressive deformation to gully-controlled structural disintegration and soil–water mixed transport.
The slope failure process under concentrated rear-runoff conditions results from the combined effects of changes in hydraulic boundaries, weakening of structural integrity, and transformation of material movement patterns. The rear-edge platform and gully topography of the Shaziba landslide are favourable for runoff convergence, while the loose sliding mass, weak slip zone, and free-face condition at the front edge provide the engineering geological basis for deformation propagation, structural disintegration, and material transport.
In recent years, studies on rainfall-induced landslides have emphasized that slope instability is closely associated with the coupled responses among moisture migration, pore water pressure evolution, stress redistribution, and deformation development [
27,
51]. During rainfall infiltration or runoff recharge, increases in water content and pore water pressure reduce matric suction and effective stress, thereby weakening the shear strength of slope materials and promoting the transition from progressive deformation to instability [
27,
28]. The experimental results of this study show that, as the rear-runoff discharge increased from 7 to 35 mL/s, the initial response times of water content, pore water pressure, and earth pressure at the rear edge were all markedly shortened. This indicates that concentrated rear runoff strengthened the hydro-mechanical coupling of the slope by accelerating moisture migration, pore-pressure response, and local stress adjustment.
In addition to infiltration-induced weakening, runoff-driven gully incision further links hydraulic erosion with mechanical instability. Concentrated flow can induce gully-bed incision, lateral erosion, toe undercutting, and subsequent collapse of gully banks or slope materials [
54,
55,
56]. This mechanism is consistent with the model test results of this study: as the runoff discharge increased, the gully formation time shortened from 6810 to 336 s, and under moderate- and high-runoff conditions, gully formation occurred earlier than the first evident collapse. Therefore, the gully acts not only as a drainage pathway, but also as an important mechanical boundary that promotes local unloading, crack propagation, gully-wall collapse, block fragmentation, and rescouring of collapsed deposits. These processes weaken the original particle skeleton, enhance the degree of soil–water mixing, and promote the transition of the slope from infiltration-induced softening to structural disintegration and flow-like transport [
37,
38,
39,
40,
57,
58,
59].
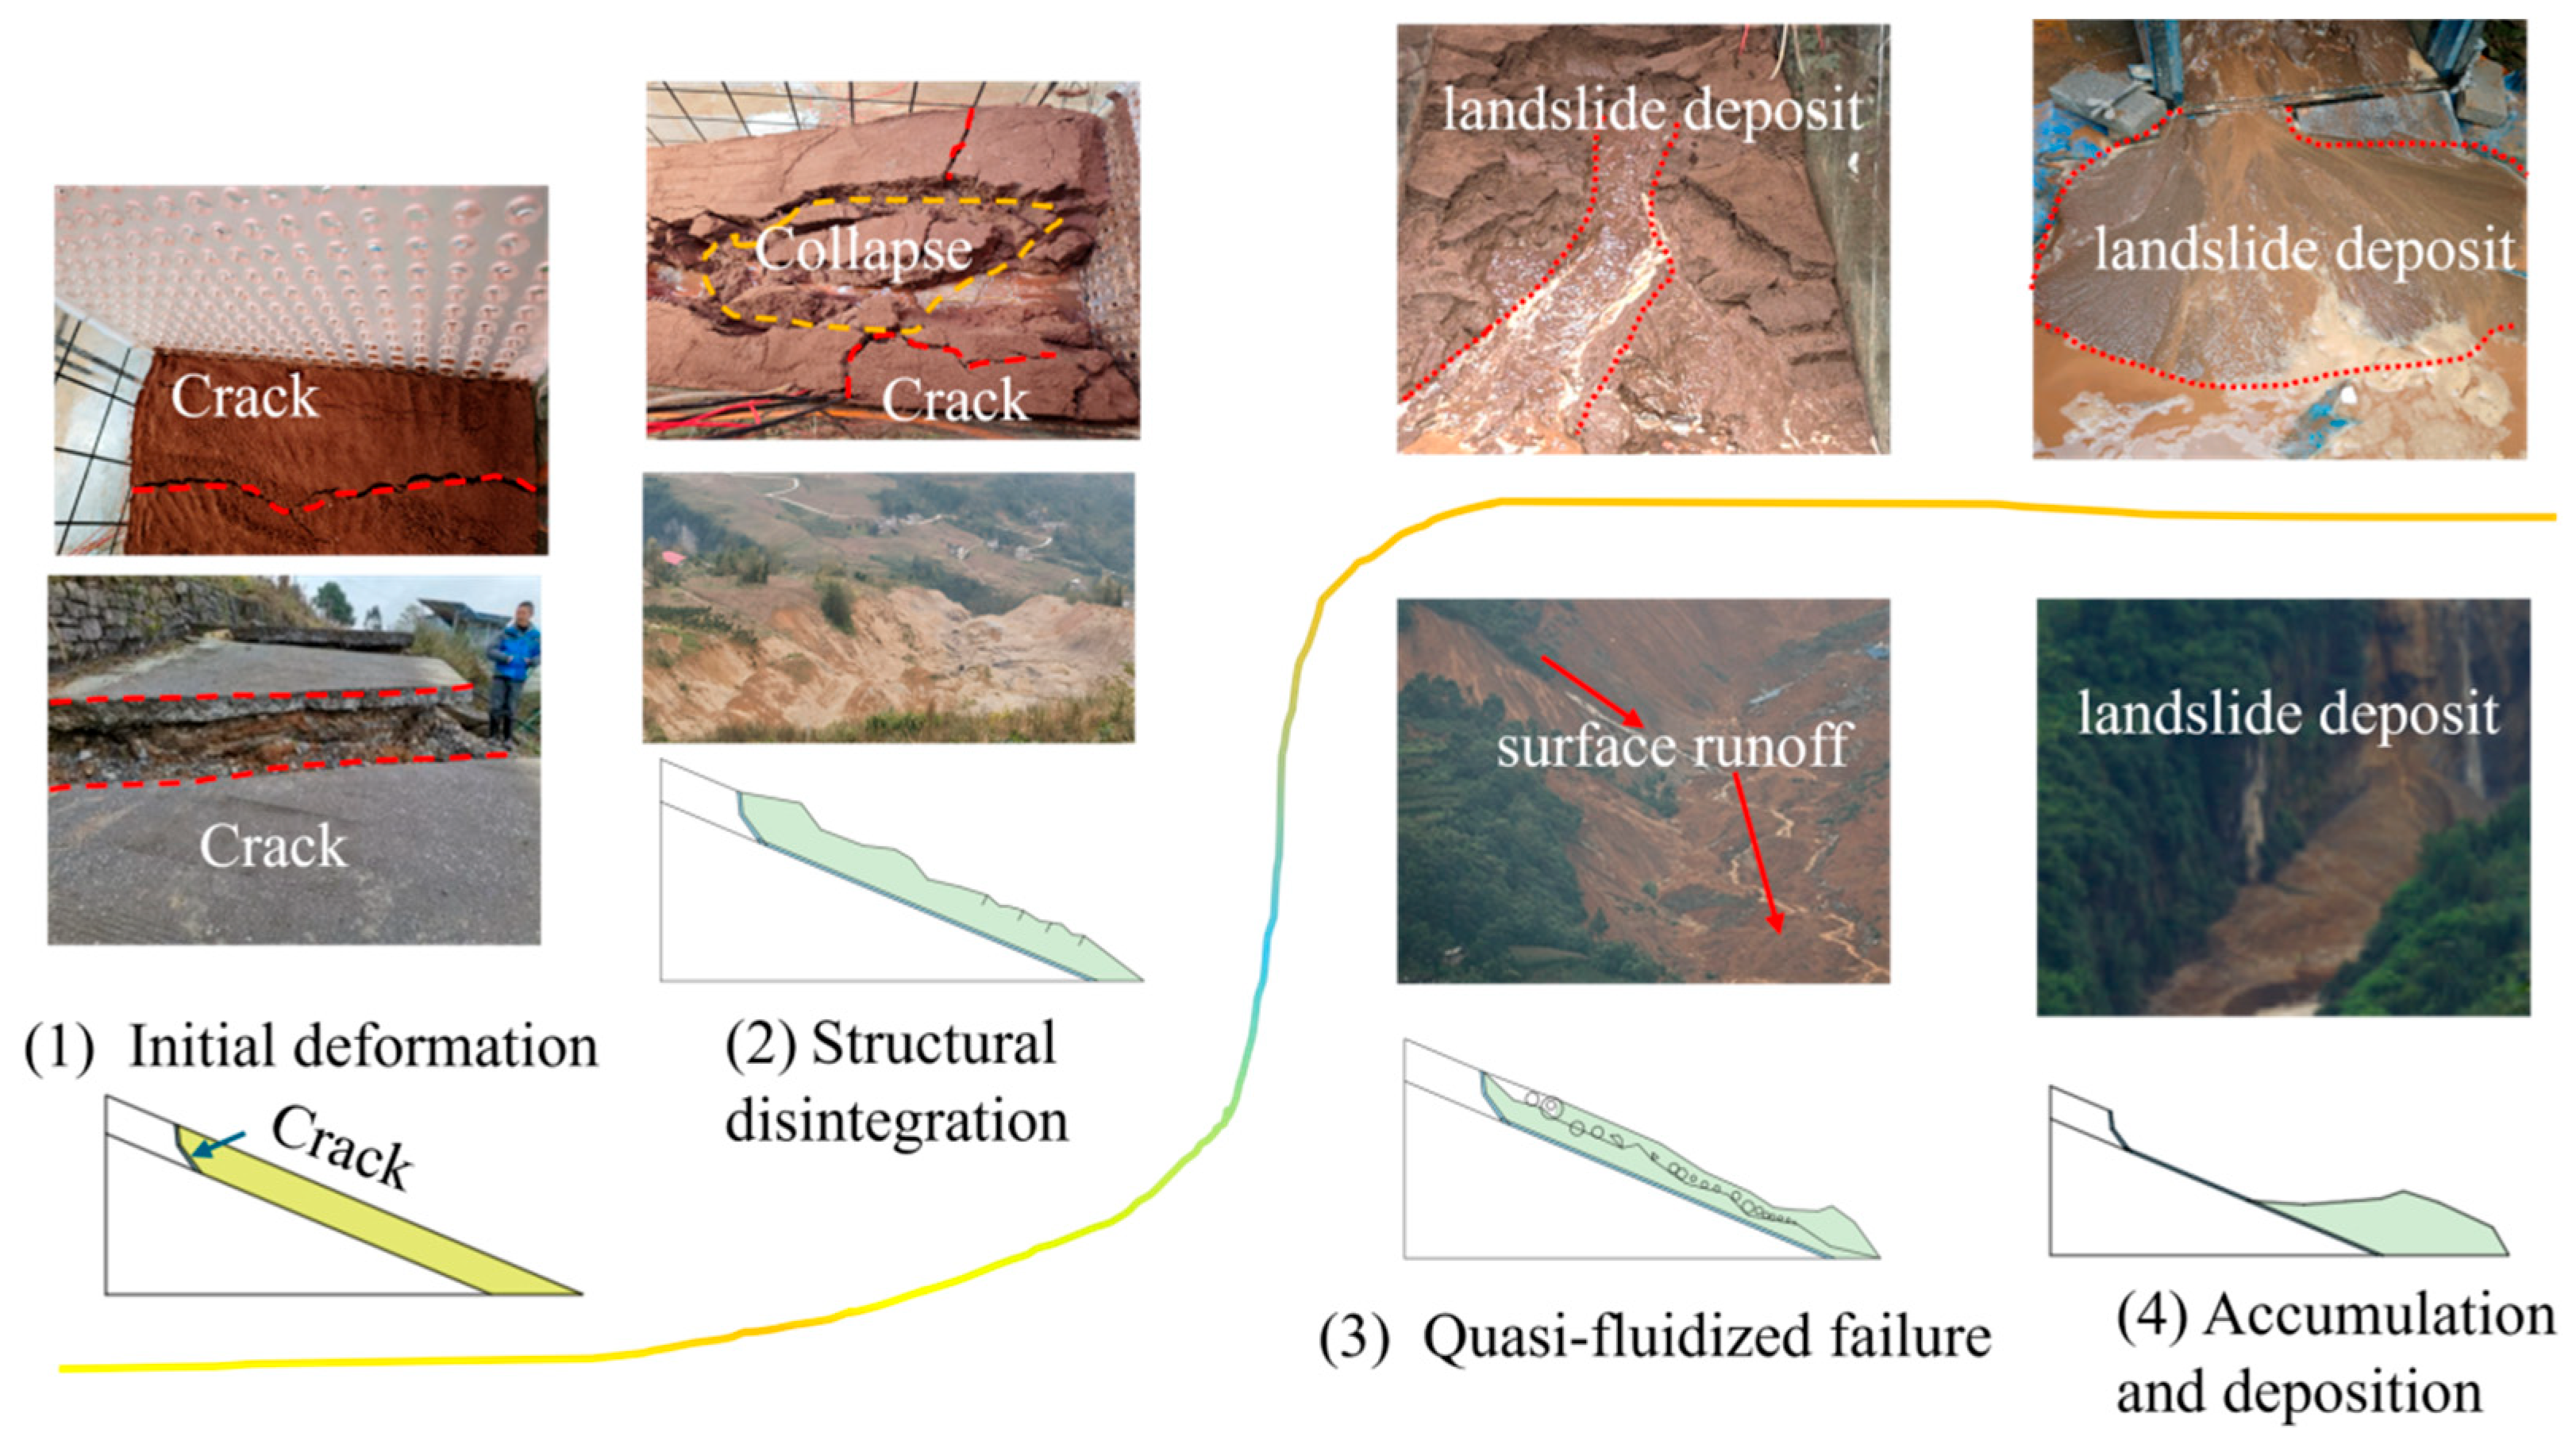
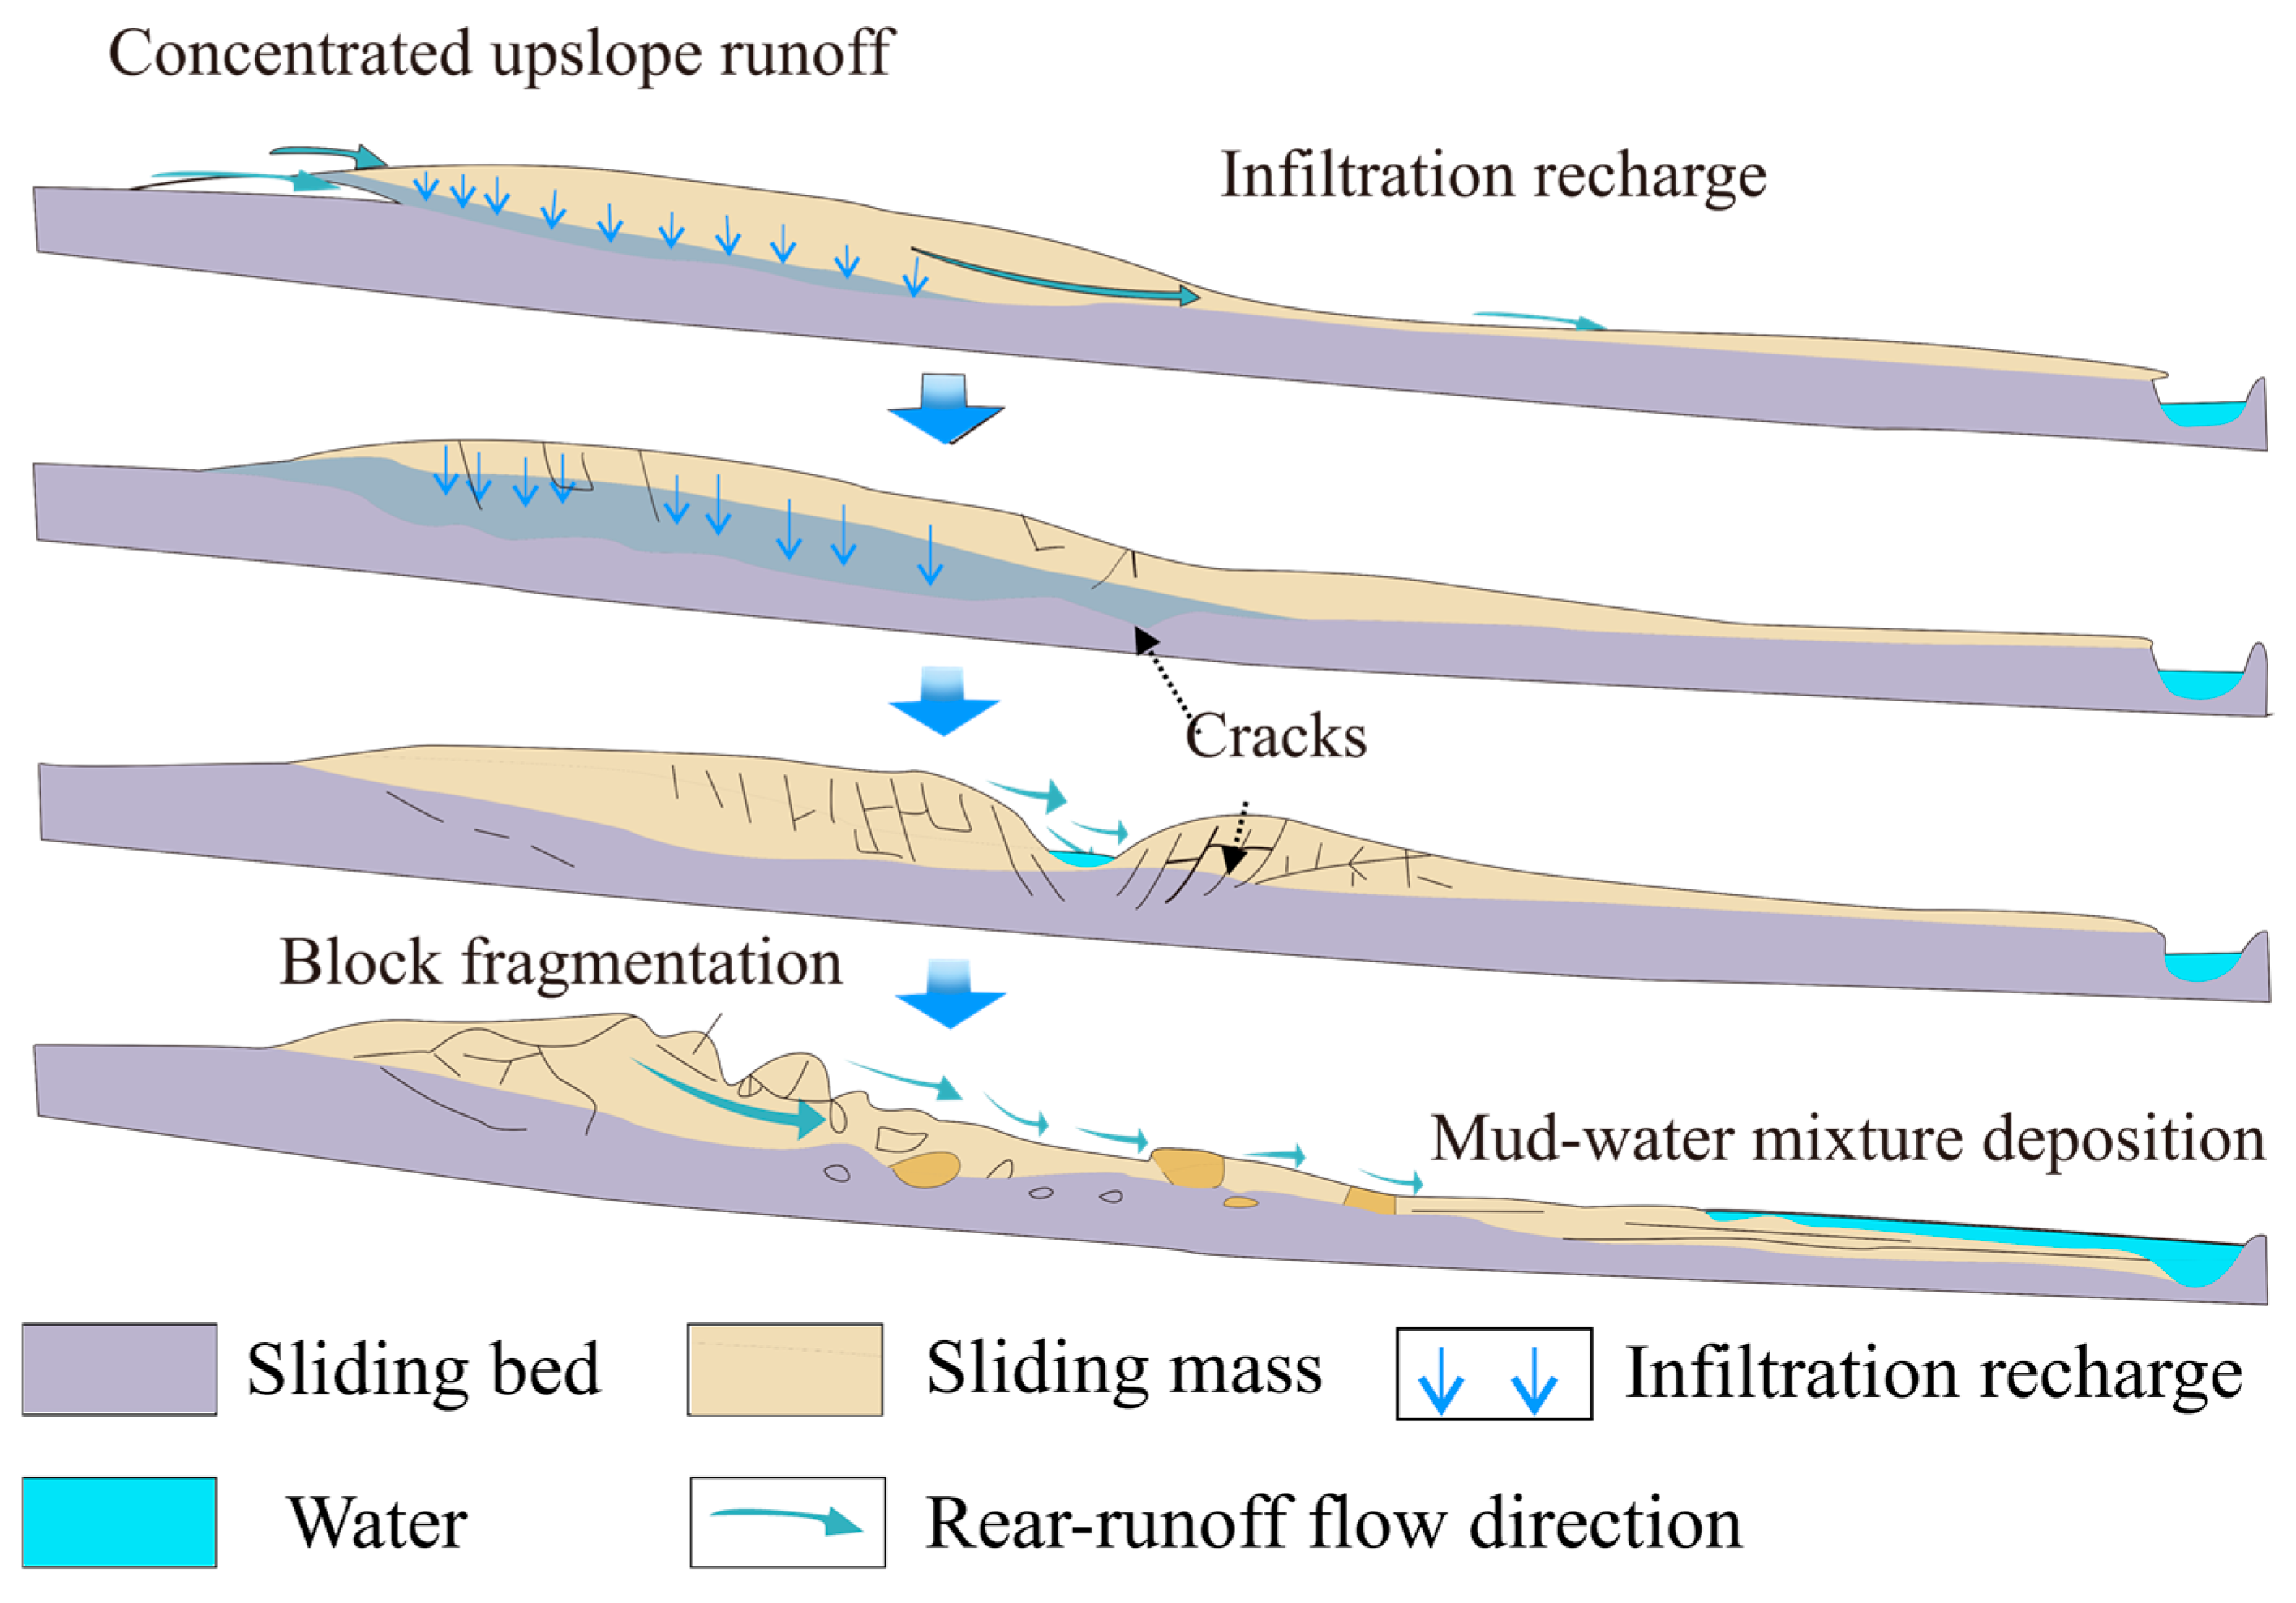
Based on field investigations and model test results, the slope failure process under concentrated rear-runoff conditions can be generalized into four stages: initial deformation, structural disintegration, flow-like transport, and toe deposition, as shown in
Figure 12 and
Figure 13. The initial deformation stage is mainly controlled by hydraulic weakening, during which rear runoff migrates into the slope through pores, cracks, and weak structural zones, causing an increase in water content, a pore water pressure response, and local stress adjustment. The structural disintegration stage reflects a transition in the dominant mechanism from infiltration-induced softening to gully incision. Gully incision and lateral erosion reorganize the drainage pathways, slope-surface boundaries, and local stress state, thereby promoting continuous gully-wall collapse, block fragmentation, and rescouring of collapsed materials. The flow-like transport and deposition stage is mainly characterized by soil–water mixed transport and deposition at the slope toe. At this stage, slope failure is no longer a simple overall sliding process, but a compound movement process jointly controlled by gravity, scouring forces, block disintegration, and the outward transport of fine-grained materials [
56,
57,
58,
59].
Therefore, the process chain by which concentrated rear runoff induces slope structural disintegration and the development of flow-like transport characteristics can be summarized as follows: rear-runoff recharge, hydraulic weakening of the slope, gully incision and boundary reconstruction, structural disintegration and fine-particle discharge, soil–water mixed transport, and toe deposition. This process reflects a transition in the dominant failure mechanism from infiltration-induced softening to gully-incision- and structural-disintegration-controlled failure.
5.2. Engineering Implications
Although this study is based on scaled flume model tests, the observed deformation and failure processes provide useful implications for the prevention, mitigation, and monitoring of landslides affected by concentrated rear runoff. The results show that concentrated rear runoff can accelerate wetting-front migration, pore water pressure response, gully incision, local collapse, and soil–water mixed transport. Therefore, for slopes with distinct rear catchment areas or runoff-convergence zones, engineering treatment should not focus solely on controlling rainfall infiltration, but should also emphasize the interception, diversion, and drainage of concentrated runoff at the rear edge of the slope.
From the perspective of drainage design, intercepting ditches, diversion channels, and slope-surface drainage systems should be arranged near the rear boundary of the slope or runoff-convergence zones to reduce the direct recharge of concentrated runoff into the landslide body. For areas prone to gully incision, local reinforcement or anti-scouring measures should also be considered, because gully development can alter local hydraulic boundaries and promote structural disintegration of the slope. In terms of monitoring and early warning, the results indicate that volumetric water content, pore water pressure, and surface deformation in the rear and middle parts of the slope should be jointly monitored. In particular, a rapid increase in water content or pore water pressure, accompanied by gully development or local collapse, can be used as an early warning signal of accelerated slope deformation.
5.3. Limitations and Future Work
Owing to limitations in model scale, 1-g conditions, and the preparation of similar materials, the physical model used in this study still involved certain similarity distortions, particularly in terms of strength, permeability, and deformation similarity, which could not fully satisfy the conditions of the prototype landslide. In addition, the conversion of rear-runoff discharge involved the selection of several parameters, including catchment area, runoff coefficient, effective convergence duration, and discharge similarity relationships. Therefore, this study focuses more on revealing the relative patterns of slope response sequence, gully development, and failure-mode transformation under different rear-runoff intensities, rather than directly determining the actual failure time or critical runoff threshold of the prototype landslide.
This study mainly analyzed the structural disintegration and flow-like transport characteristics of the slope under concentrated rear-runoff conditions based on macroscopic deformation observations and the responses of water content, pore water pressure, and earth pressure. Because kinematic and material-transport parameters, such as displacement fields, velocity fields, runout distance, and sediment concentration, were not obtained synchronously, the degree of flow-like transport was mainly identified in a process-based and qualitative manner. Nevertheless, the data obtained in this study, including model geometry, material parameters, rear-runoff boundary conditions, inflow discharges, and the time–history responses of water content, pore water pressure, and earth pressure, can provide a basis for the construction, calibration, and validation of subsequent hydro-mechanical coupled numerical models. In particular, the gully formation time, time of first evident collapse, deformation evolution sequence, and failure-mode transition process under different runoff discharges can serve as process-based validation benchmarks for coupled models based on the finite element method, material point method, or discrete element method. Future studies could combine repeated model tests, PIV/DIC image analysis, and hydro-mechanical coupled numerical simulations to further quantify slope displacement, flow velocity, gully expansion rate, and deposition extent, thereby improving the criteria for identifying the transition of slopes from progressive deformation to structural disintegration and flow-like transport induced by concentrated rear runoff.